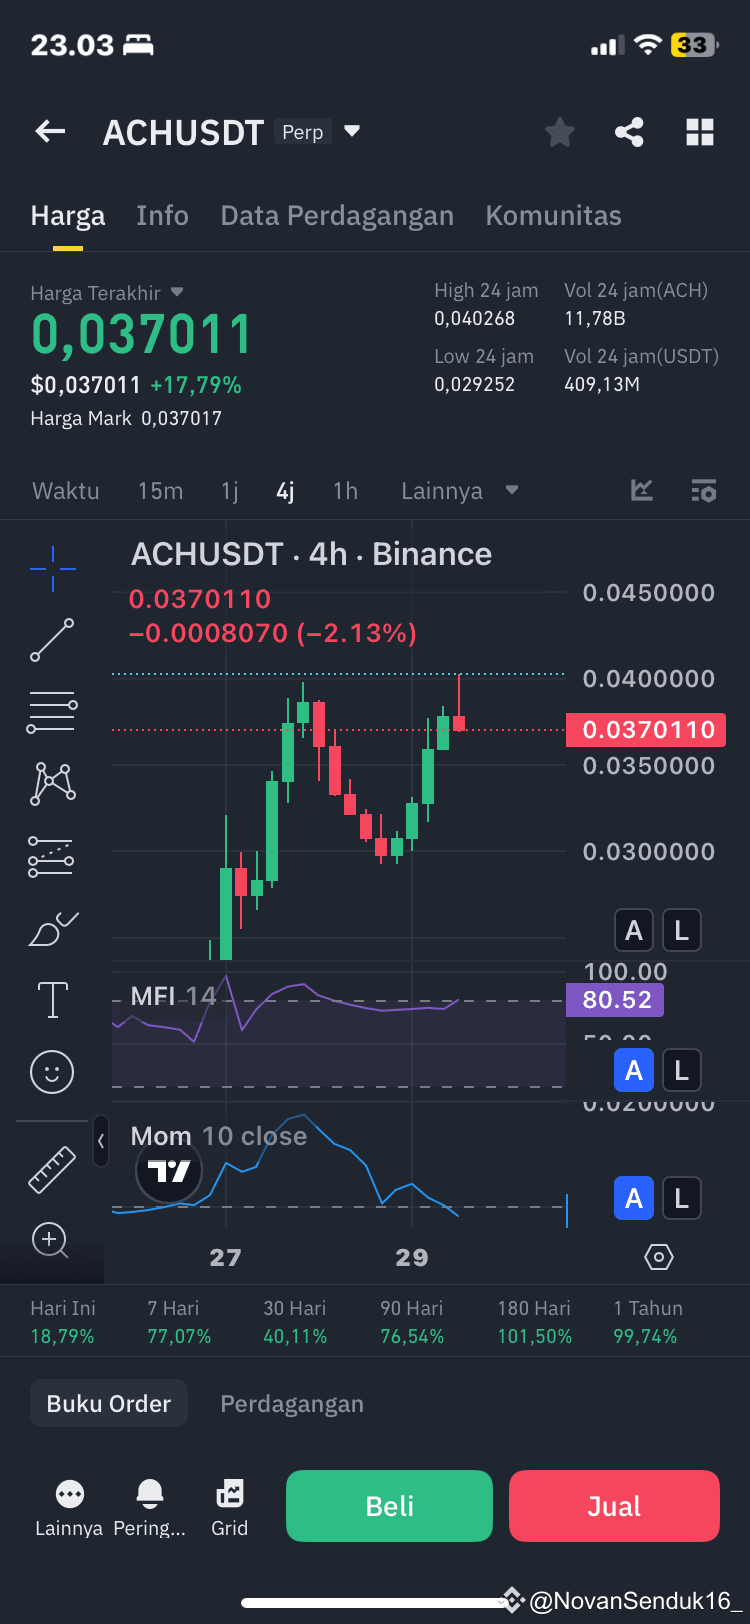
analyzed chart, here is a brief analysis:
1. Price Trend:
• The price experienced a previous decline with several large red candles.
• There was a rebound with several green candles, but it is still in the correction phase.
2. Volume and Long Position:
• There is an indication of opening a long position at a price of around 0.027510, and it has been closed at a higher level.
• This indicates buying interest at lower levels.
3. K-Means Clustering Indicator:
• Cluster 2 has the highest density (56%), indicating that this area is a frequently visited price zone.
• Cluster 3 (36.9%) is also quite significant, which can be dynamic support or resistance.
4. Stochastic / RSI Indicator (below the chart):
• There is a signal that the price has touched the previous oversold area and is starting to reverse direction.
• However, there is still potential for downward movement if there is no strong buying volume push.
Price Movement Prediction:
• Bullish Scenario: If the price can stay above the 0.037 area and break above, it is likely to head towards the next resistance around 0.038 - 0.040.
• Bearish Scenario: If selling pressure reappears, the price could drop to support around 0.032 or even back to 0.028.
#AHC #cryptouniverseofficial #BinanceAlphaAlert
$ACH
1. Price Trend:
• The price experienced a previous decline with several large red candles.
• There was a rebound with several green candles, but it is still in the correction phase.
2. Volume and Long Position:
• There is an indication of opening a long position at a price of around 0.027510, and it has been closed at a higher level.
• This indicates buying interest at lower levels.
3. K-Means Clustering Indicator:
• Cluster 2 has the highest density (56%), indicating that this area is a frequently visited price zone.
• Cluster 3 (36.9%) is also quite significant, which can be dynamic support or resistance.
4. Stochastic / RSI Indicator (below the chart):
• There is a signal that the price has touched the previous oversold area and is starting to reverse direction.
• However, there is still potential for downward movement if there is no strong buying volume push.
Price Movement Prediction:
• Bullish Scenario: If the price can stay above the 0.037 area and break above, it is likely to head towards the next resistance around 0.038 - 0.040.
• Bearish Scenario: If selling pressure reappears, the price could drop to support around 0.032 or even back to 0.028.
#AHC #cryptouniverseofficial #BinanceAlphaAlert
$ACH