

老K的比特币行情洞察
1.5k Posts

老K的比特币行情洞察
Report
Block User
推特:@V_Blockchain,油管:老K的比特币行情洞察。
前机构衍生品交易员.8年裸K实战.1万小时链上捕手
6年拆解300项目基本面
精准预判:
· 21年Filecoin崩盘,提前5个月预警.
· 24年AI赛道爆发
日更:1比特及山寨顶底 2机构大额订单流方向解密3变盘警报
订阅获《机构盘口手册 》
Open Trade
High-Frequency Trader
3.1 Years
22 Following
3.5K+ Followers
2.4K+ Liked
Posts
Portfolio
All
Quotes
Videos
Live
PINNED
·
--
[Critical truth warning] A former institutional vulture trader's crypto survival rules🚨I am Lao K, a user of naked K technology for 7 years, and I have witnessed how institutions cut leeks for 3 years. Now I will use the on-chain microscope to help you see through the dealer's cards:
⚠Do you remember the Filecoin battle royale of the century? I warned miners of a death spiral 153 days in advance, but the project team dumped the market and 98% of the mining industry was wiped out - the people who scolded me at that time now have two-meter-high grass on their graves!
💎Last November, when everyone was laughing at AI Coin as a bubble, my on-chain scanner captured unusual movements in the a16z wallet, leading subscribers to take advantage of 30 times the market value of AI16Z and other targets - many Twitter KOLs directly copied my analysis framework!
[Critical truth warning] A former institutional vulture trader's crypto survival rules
🚨I am Lao K, a user of naked K technology for 7 years, and I have witnessed how institutions cut leeks for 3 years. Now I will use the on-chain microscope to help you see through the dealer's cards:
⚠Do you remember the Filecoin battle royale of the century? I warned miners of a death spiral 153 days in advance, but the project team dumped the market and 98% of the mining industry was wiped out - the people who scolded me at that time now have two-meter-high grass on their graves!
💎Last November, when everyone was laughing at AI Coin as a bubble, my on-chain scanner captured unusual movements in the a16z wallet, leading subscribers to take advantage of 30 times the market value of AI16Z and other targets - many Twitter KOLs directly copied my analysis framework!
⚠Do you remember the Filecoin battle royale of the century? I warned miners of a death spiral 153 days in advance, but the project team dumped the market and 98% of the mining industry was wiped out - the people who scolded me at that time now have two-meter-high grass on their graves!
💎Last November, when everyone was laughing at AI Coin as a bubble, my on-chain scanner captured unusual movements in the a16z wallet, leading subscribers to take advantage of 30 times the market value of AI16Z and other targets - many Twitter KOLs directly copied my analysis framework!
3
2
11
584
·
--
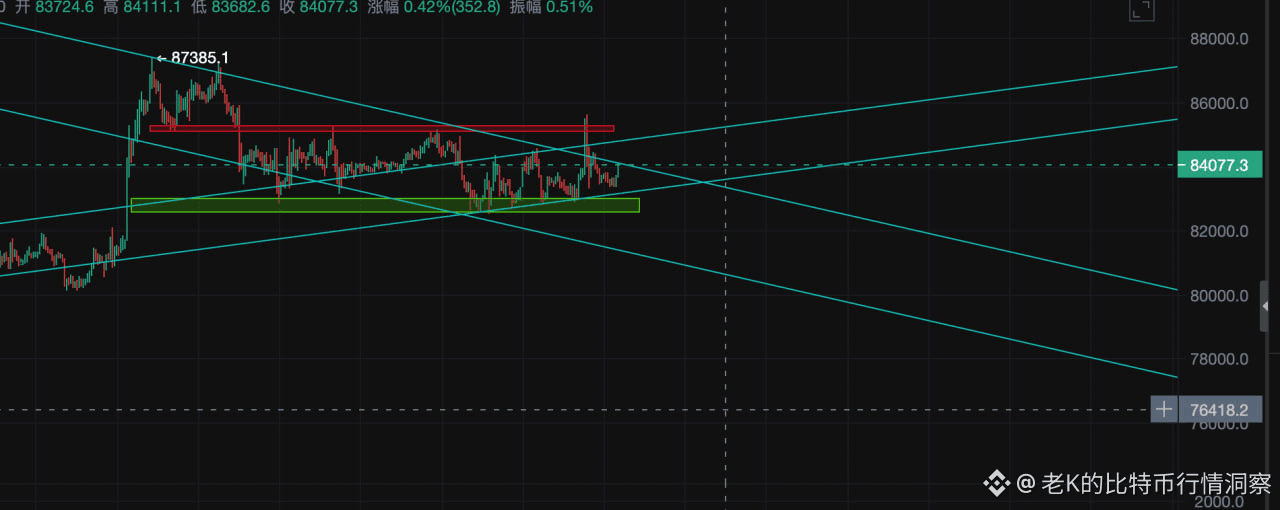
Bitcoin is very convoluted: it can’t push higher highs, and it can’t drop to lower lows. The sell side seems somewhat depleted, but it’s still difficult for the bulls to break through the flag. There’s been persistent selling pressure overhead. So it’s better to watch for now and only act when the trend becomes clear.
Bitcoin is very convoluted: it can’t push higher highs, and it can’t drop to lower lows. The sell side seems somewhat depleted, but it’s still difficult for the bulls to break through the flag. There’s been persistent selling pressure overhead. So it’s better to watch for now and only act when the trend becomes clear.
299
·
--
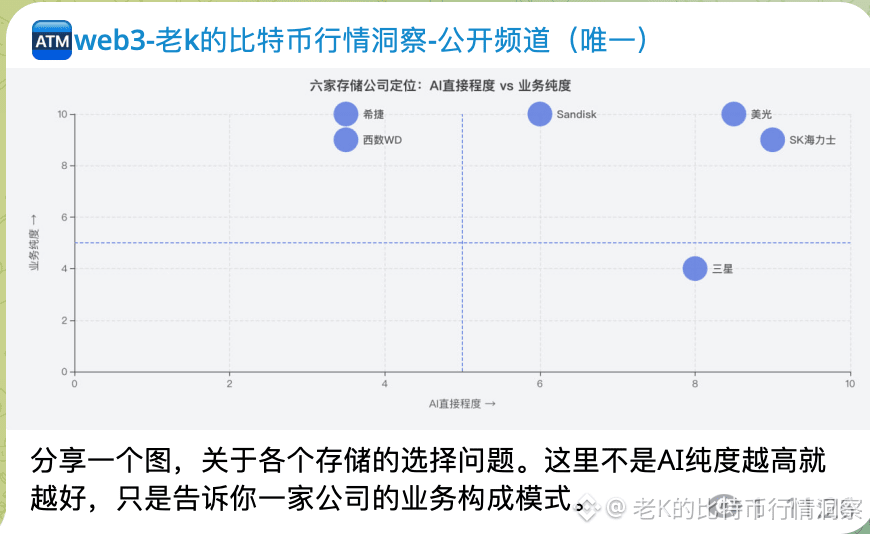
Share a chart about the issues of different storage tracks in the storage industry. This isn’t about saying that the higher the AI purity, the better—it’s just to show you how one company’s business is structured.#存储芯片
Share a chart about the issues of different storage tracks in the storage industry. This isn’t about saying that the higher the AI purity, the better—it’s just to show you how one company’s business is structured.#存储芯片
319
·
--

Article
On October 1st, PCE-positive news tricked retail investors into getting in—making things even harder for the bulls. Should Bitcoin break down or continue grinding? Why didn’t the positive news turn the market bullish? Micron’s earnings report was positive, but it rallied then fell—I have a perfect holding plan.A massive-volume cross star hides danger; Bitcoin bulls are in a tight spot
In the latest market view, Bitcoin’s daily chart printed a cross star with an extremely long upper wick, accompanied by a relatively rare very large trading volume. From the volume-price relationship, the bulls put in a tremendous effort to push the price higher, but failed to achieve a breakout result that matches that effort. This suggests that the sell pressure overhead is unusually heavy, and the bulls’ situation is becoming even more difficult.
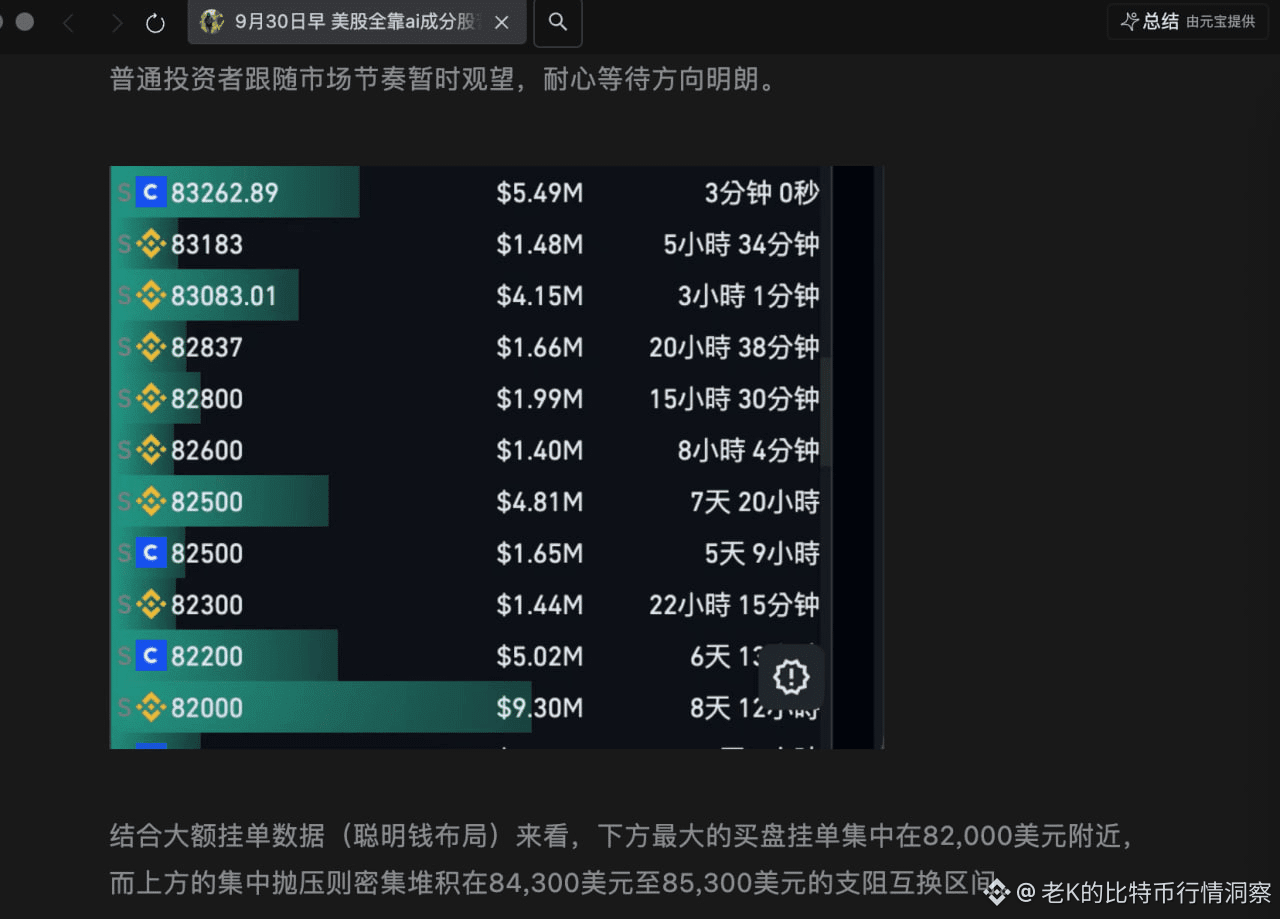
By examining the order book depth and liquidity distribution, it can be seen that a large number of buy orders are clustered around the $82,000 area below, creating some downward pull on the price; meanwhile, sell orders are densely distributed in the $84,300 to $85,300 range. For the bulls, if they want to start a new round of upward move, they must completely absorb the sell pressure in this zone and firmly hold above the $85,300 level.
On October 1st, PCE-positive news tricked retail investors into getting in—making things even harder for the bulls. Should Bitcoin break down or continue grinding? Why didn’t the positive news turn the market bullish? Micron’s earnings report was positive, but it rallied then fell—I have a perfect holding plan.
A massive-volume cross star hides danger; Bitcoin bulls are in a tight spot
In the latest market view, Bitcoin’s daily chart printed a cross star with an extremely long upper wick, accompanied by a relatively rare very large trading volume. From the volume-price relationship, the bulls put in a tremendous effort to push the price higher, but failed to achieve a breakout result that matches that effort. This suggests that the sell pressure overhead is unusually heavy, and the bulls’ situation is becoming even more difficult.
By examining the order book depth and liquidity distribution, it can be seen that a large number of buy orders are clustered around the $82,000 area below, creating some downward pull on the price; meanwhile, sell orders are densely distributed in the $84,300 to $85,300 range. For the bulls, if they want to start a new round of upward move, they must completely absorb the sell pressure in this zone and firmly hold above the $85,300 level.
In the latest market view, Bitcoin’s daily chart printed a cross star with an extremely long upper wick, accompanied by a relatively rare very large trading volume. From the volume-price relationship, the bulls put in a tremendous effort to push the price higher, but failed to achieve a breakout result that matches that effort. This suggests that the sell pressure overhead is unusually heavy, and the bulls’ situation is becoming even more difficult.
By examining the order book depth and liquidity distribution, it can be seen that a large number of buy orders are clustered around the $82,000 area below, creating some downward pull on the price; meanwhile, sell orders are densely distributed in the $84,300 to $85,300 range. For the bulls, if they want to start a new round of upward move, they must completely absorb the sell pressure in this zone and firmly hold above the $85,300 level.
308
·
--
October 1st, PCE good news lured retail investors into the market, but for bulls it’s even harder now. After Bitcoin breaks below, does it keep grinding? Why didn’t good news turn the market bullish? Micron’s earnings report was positive, yet it first spiked and then fell. I have a perfect holding plan. #美光业绩超预期并上调指引 #比特币升破85200美元
October 1st, PCE good news lured retail investors into the market, but for bulls it’s even harder now. After Bitcoin breaks below, does it keep grinding? Why didn’t good news turn the market bullish? Micron’s earnings report was positive, yet it first spiked and then fell. I have a perfect holding plan. #美光业绩超预期并上调指引 #比特币升破85200美元
218
·
--
Bearish
1. First, pull up the old accounts
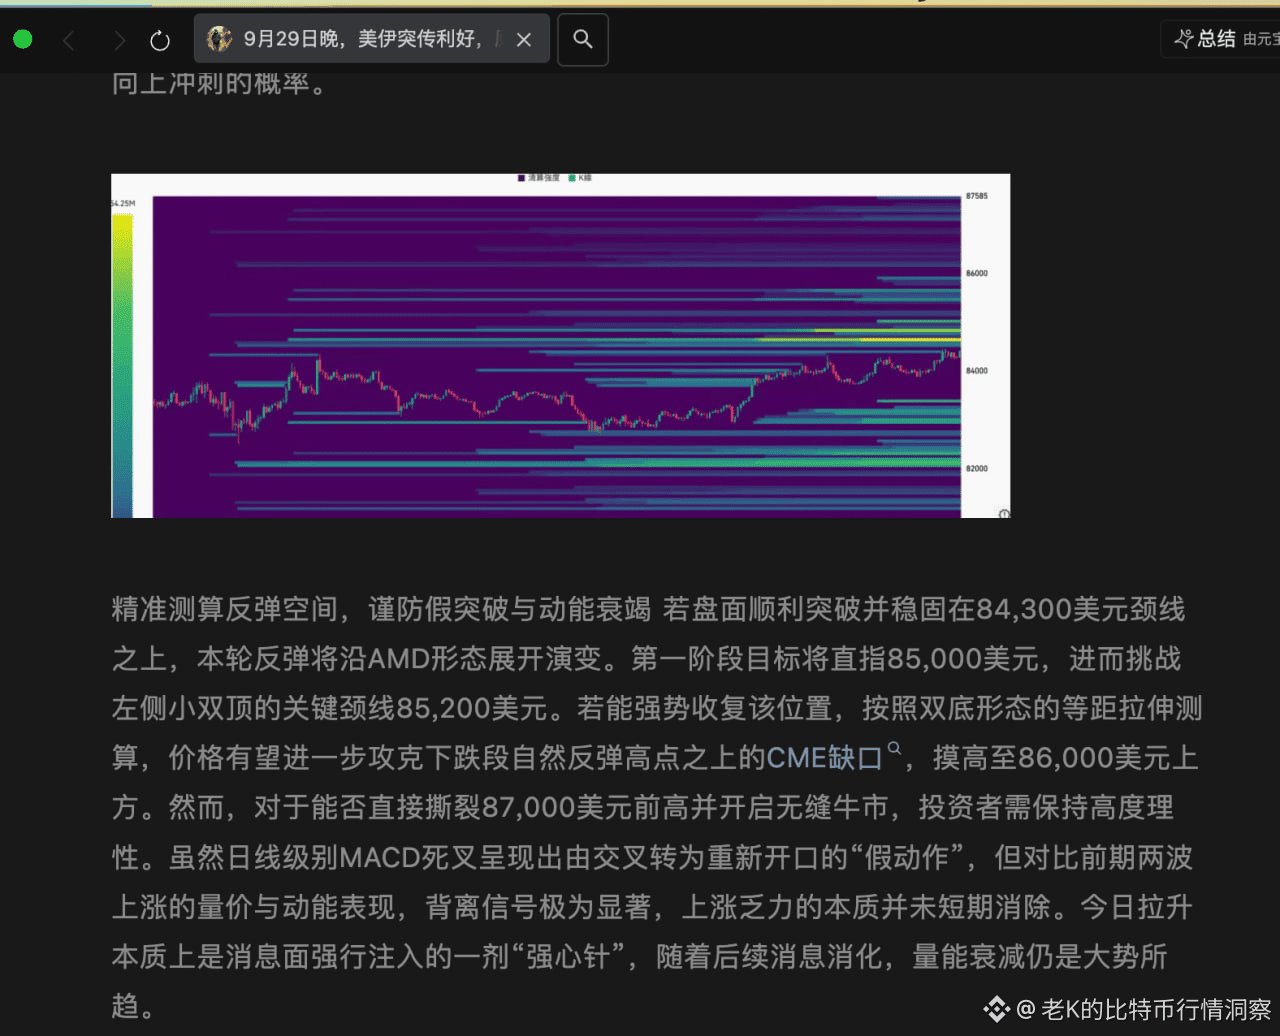
On the evening of September 29, I gave two numbers: first, when the market rebounds, look at 85,000; for a double-top neckline, 85,200. I reminded everyone about a potential false breakout and momentum exhaustion. In the morning of September 30, I went through the pending orders again: between 84,300 and 85,300 there were large sell orders stacked up; the real bid support below was lying at 82,000. Last night, the PCE came out. BTC moved from 84,300 to 85,200—touched about a hundred points up to 85,300—and then a long upper wick was used to smash it back down. These two judgments matched what the chart showed perfectly. So when I saw a large amount of spot sell orders appearing in the order book, I opened a short position with a small size. After the drop confirmed the trend, I found a natural rebound high point. Then at 84,700 I added more. I’ve already taken partial profit; the rest is just holding the position.
2. Why good news doesn’t seem to work
Two rounds of signals: one was the geopolitical positive from September 29, and the other was last night’s PCE. Each one was shorter-lived than the last. That stack of sell orders at 85,300 got cleared again, along with another batch of chase buyers. Right now, for BTC, good news can only buy you a long upper wick—it can’t bring real money.
3. Lock onto two key levels
82,800 is the short-term examination zone: if it holds sideways, then by moving sideways it digests the sell pressure; if it grinds back and wears through the buying support, it will pierce through. If it truly breaks, then the wall of bids at 82,000—the $9.3 million order that’s been hanging for 8 days—is the bulls’ real trump card. Friday’s Non-Farm Payrolls is the last variable.
4. Next, I’ll talk about three things
When to enter a short, when to add if 82,800 breaks, and what to do if it doesn’t grind through—video analysis today. $BTC
{future}(BTCUSDT)
1. First, pull up the old accounts
On the evening of September 29, I gave two numbers: first, when the market rebounds, look at 85,000; for a double-top neckline, 85,200. I reminded everyone about a potential false breakout and momentum exhaustion. In the morning of September 30, I went through the pending orders again: between 84,300 and 85,300 there were large sell orders stacked up; the real bid support below was lying at 82,000. Last night, the PCE came out. BTC moved from 84,300 to 85,200—touched about a hundred points up to 85,300—and then a long upper wick was used to smash it back down. These two judgments matched what the chart showed perfectly. So when I saw a large amount of spot sell orders appearing in the order book, I opened a short position with a small size. After the drop confirmed the trend, I found a natural rebound high point. Then at 84,700 I added more. I’ve already taken partial profit; the rest is just holding the position.
2. Why good news doesn’t seem to work
Two rounds of signals: one was the geopolitical positive from September 29, and the other was last night’s PCE. Each one was shorter-lived than the last. That stack of sell orders at 85,300 got cleared again, along with another batch of chase buyers. Right now, for BTC, good news can only buy you a long upper wick—it can’t bring real money.
3. Lock onto two key levels
82,800 is the short-term examination zone: if it holds sideways, then by moving sideways it digests the sell pressure; if it grinds back and wears through the buying support, it will pierce through. If it truly breaks, then the wall of bids at 82,000—the $9.3 million order that’s been hanging for 8 days—is the bulls’ real trump card. Friday’s Non-Farm Payrolls is the last variable.
4. Next, I’ll talk about three things
When to enter a short, when to add if 82,800 breaks, and what to do if it doesn’t grind through—video analysis today. $BTC
On the evening of September 29, I gave two numbers: first, when the market rebounds, look at 85,000; for a double-top neckline, 85,200. I reminded everyone about a potential false breakout and momentum exhaustion. In the morning of September 30, I went through the pending orders again: between 84,300 and 85,300 there were large sell orders stacked up; the real bid support below was lying at 82,000. Last night, the PCE came out. BTC moved from 84,300 to 85,200—touched about a hundred points up to 85,300—and then a long upper wick was used to smash it back down. These two judgments matched what the chart showed perfectly. So when I saw a large amount of spot sell orders appearing in the order book, I opened a short position with a small size. After the drop confirmed the trend, I found a natural rebound high point. Then at 84,700 I added more. I’ve already taken partial profit; the rest is just holding the position.
2. Why good news doesn’t seem to work
Two rounds of signals: one was the geopolitical positive from September 29, and the other was last night’s PCE. Each one was shorter-lived than the last. That stack of sell orders at 85,300 got cleared again, along with another batch of chase buyers. Right now, for BTC, good news can only buy you a long upper wick—it can’t bring real money.
3. Lock onto two key levels
82,800 is the short-term examination zone: if it holds sideways, then by moving sideways it digests the sell pressure; if it grinds back and wears through the buying support, it will pierce through. If it truly breaks, then the wall of bids at 82,000—the $9.3 million order that’s been hanging for 8 days—is the bulls’ real trump card. Friday’s Non-Farm Payrolls is the last variable.
4. Next, I’ll talk about three things
When to enter a short, when to add if 82,800 breaks, and what to do if it doesn’t grind through—video analysis today. $BTC

412
·
--

Article
If a Sudden Crash Happens, How to Set Up Early? A Full Breakdown of Bitcoin and High-Quality Altcoin Extreme Bottom-Fishing StrategiesOrder Book Volatility and Long-Short Games: The Real Signals Behind Multiple Attempts Around $82,800. In recent weeks, the crypto market has found itself stuck in a stalemate between bulls and bears amid a lack of major macro catalysts. Taking Bitcoin (BTC) as an example, the price has repeatedly found support below the daily level and has not managed to decisively break below the $82,800 threshold. On the smaller timeframe (the 1-hour chart), price has tested the $82,800 support level seven consecutive times. Although the strength of earlier rebounds has gradually weakened, after the most recent pullback there has been a relatively strong rebound “elasticity.” By examining order book data, it can be seen that during this latest down-move, the funding rate quickly turned negative. At the same time, the contract CVD (cumulative volume delta) dropped sharply as shorts entered the market and increased activity. However, in the spot market, the price did not carve out new lows despite the increase in aggressive sell pressure, instead showing a clear bullish divergence in spot CVD. This suggests that there are strong passive limit buy orders (resting bids) continuously absorbing active sell pressure; the capital chasing shorts effectively became the “fuel” driving the price rebound. That said, since there is currently no clear evidence of large spot aggressive buy orders or the main market-maker building a major position, and because the key structural resistance above at $84,300 has not yet been broken, it is still not possible to conclude that the smaller timeframe rebound has already triggered a larger-scale trend reversal to the upside. In the short term, the market remains in a range-bound consolidation pattern.
If a Sudden Crash Happens, How to Set Up Early? A Full Breakdown of Bitcoin and High-Quality Altcoin Extreme Bottom-Fishing Strategies
Order Book Volatility and Long-Short Games: The Real Signals Behind Multiple Attempts Around $82,800. In recent weeks, the crypto market has found itself stuck in a stalemate between bulls and bears amid a lack of major macro catalysts. Taking Bitcoin (BTC) as an example, the price has repeatedly found support below the daily level and has not managed to decisively break below the $82,800 threshold. On the smaller timeframe (the 1-hour chart), price has tested the $82,800 support level seven consecutive times. Although the strength of earlier rebounds has gradually weakened, after the most recent pullback there has been a relatively strong rebound “elasticity.” By examining order book data, it can be seen that during this latest down-move, the funding rate quickly turned negative. At the same time, the contract CVD (cumulative volume delta) dropped sharply as shorts entered the market and increased activity. However, in the spot market, the price did not carve out new lows despite the increase in aggressive sell pressure, instead showing a clear bullish divergence in spot CVD. This suggests that there are strong passive limit buy orders (resting bids) continuously absorbing active sell pressure; the capital chasing shorts effectively became the “fuel” driving the price rebound. That said, since there is currently no clear evidence of large spot aggressive buy orders or the main market-maker building a major position, and because the key structural resistance above at $84,300 has not yet been broken, it is still not possible to conclude that the smaller timeframe rebound has already triggered a larger-scale trend reversal to the upside. In the short term, the market remains in a range-bound consolidation pattern.
1
1.1k
·
--
If a major pullback happens, where to buy the dip? Based on support levels and the liquidation map, provide precise price levels and dip-buying position plans for BTC, ETH, SOL, UNI, NEAR, SUI, and XRP. #比特币暴跌 $BTC
If a major pullback happens, where to buy the dip? Based on support levels and the liquidation map, provide precise price levels and dip-buying position plans for BTC, ETH, SOL, UNI, NEAR, SUI, and XRP. #比特币暴跌 $BTC
368
·
--
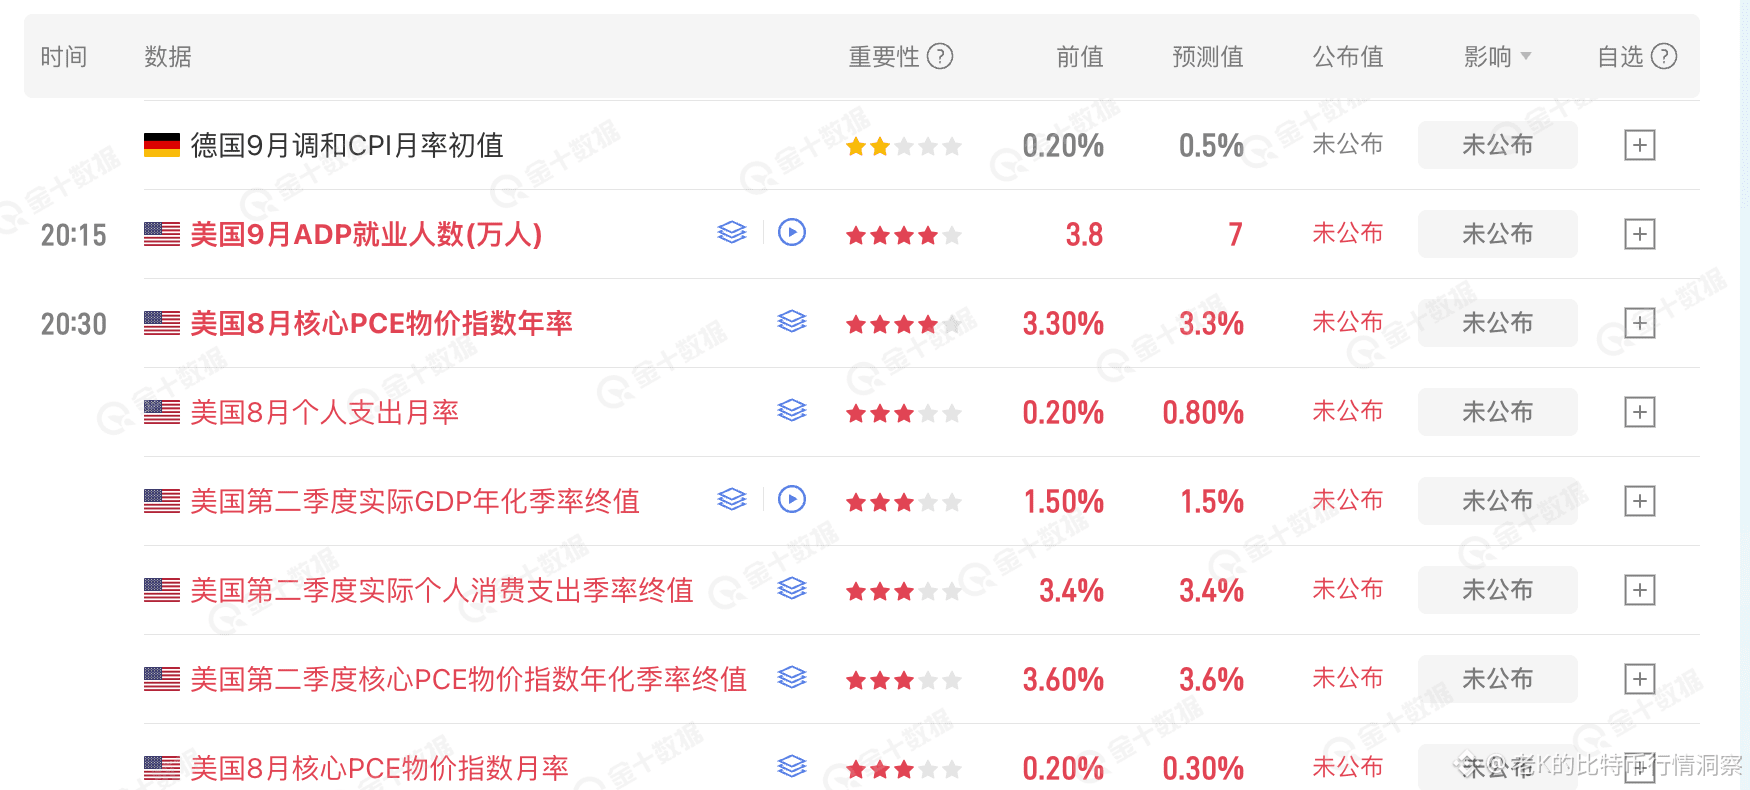
Core PCE is coming again. BTC has been grinding on a millstone, and tonight there’s a high probability of triggering one of two scenarios: either it breaks below 82,800, or it makes a fake breakdown by dipping slightly to insert a “needle.” In any case, it’s very likely to move downward for a wave—it's just a question of whether it will reclaim. In this kind of situation, shorting late probably won’t be in time; once the news drops, the price will react immediately. Entering a short at this price also isn’t very safe. If the news is good, even if it inserts a needle, it will likely be quickly pulled back. This price is also near the support level, so even if it dips, that’s the low point you’ll face. So when you encounter a situation like this, what would you do? #$BTC
Core PCE is coming again. BTC has been grinding on a millstone, and tonight there’s a high probability of triggering one of two scenarios: either it breaks below 82,800, or it makes a fake breakdown by dipping slightly to insert a “needle.” In any case, it’s very likely to move downward for a wave—it's just a question of whether it will reclaim. In this kind of situation, shorting late probably won’t be in time; once the news drops, the price will react immediately. Entering a short at this price also isn’t very safe. If the news is good, even if it inserts a needle, it will likely be quickly pulled back. This price is also near the support level, so even if it dips, that’s the low point you’ll face. So when you encounter a situation like this, what would you do? #$BTC
391
·
--
Bearish
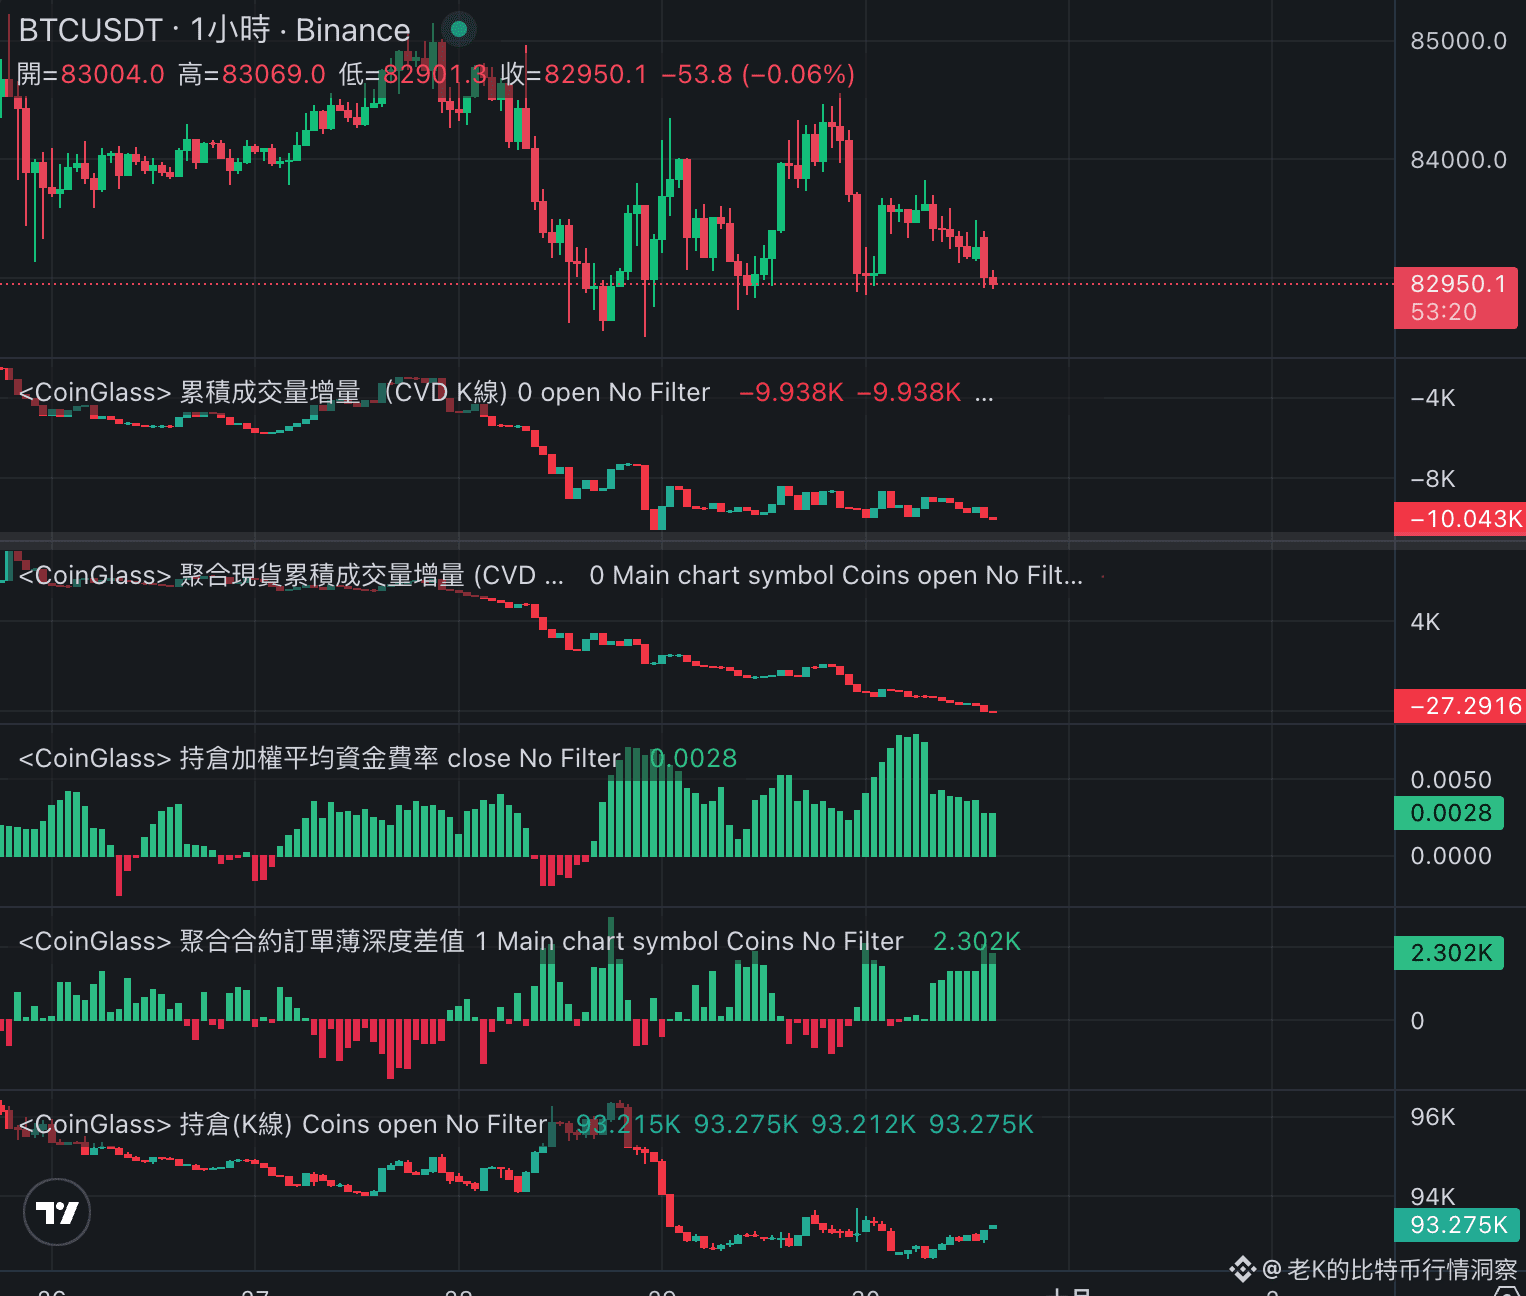
Testing again 82800! BTC at the smaller timeframe is mostly ranging, slightly weak. Around 82800 there is some support coming in, but we can’t confirm the downtrend has stopped yet. The spot CVD continues to fall, indicating the active sell pressure hasn’t stopped, but the price hasn’t dropped further—meaning there are passive orders being placed to pick it up. Open interest is only slightly increasing at a low level; the rebound looks more like a renewed tug-of-war between longs and shorts. The longs are trying to hold the boundary. Focus on 82800: if it holds and you reclaim 83100–83300, you can look for a pullback to 83500–83600. If the 15-minute timeframe has a decisive breakdown below 82800 and the rebound can’t get back above it, then it will most likely continue to test 82500–82600. #比特币跌破8.3万美元 $BTC
Testing again 82800! BTC at the smaller timeframe is mostly ranging, slightly weak. Around 82800 there is some support coming in, but we can’t confirm the downtrend has stopped yet. The spot CVD continues to fall, indicating the active sell pressure hasn’t stopped, but the price hasn’t dropped further—meaning there are passive orders being placed to pick it up. Open interest is only slightly increasing at a low level; the rebound looks more like a renewed tug-of-war between longs and shorts. The longs are trying to hold the boundary. Focus on 82800: if it holds and you reclaim 83100–83300, you can look for a pullback to 83500–83600. If the 15-minute timeframe has a decisive breakdown below 82800 and the rebound can’t get back above it, then it will most likely continue to test 82500–82600. #比特币跌破8.3万美元 $BTC
805
·
--
Partly True
US stocks are split and the U.S. Treasury trap
U.S. Treasury yields have gone on a rampage—these traditional giants like McDonald’s have been battered badly, and Nike is down 44% this year! Why hasn’t AI gotten truly huge yet, especially in the Nasdaq 100 (FANG+) segment? The essence is that its explosive growth rate is pushing through resistance; institutions are unwilling to miss their spot. But don’t forget: in the long run, high interest rates are the sword hanging over the heads of all risk assets. Even though Wall Street has recently come out saying that the 10-year Treasury yield would need to fall to 7% for the stock market to truly crash, as long as this AI fervor cools even slightly, the backlash afterward will be extremely violent. Right now, the market is waiting for Micron’s earnings report early tomorrow morning. On the other hand, if Micron’s earnings surge, and if Friday’s nonfarm payrolls employment data doesn’t come in well, then AI could still roar higher. Micron’s example shows there’s still plenty of room compared with the prior high of $1,200. What do you do in this dilemma? Look at how big capital is positioned: it’s risk versus opportunity—both are about strategically grasping the big cycle, and tactically avoiding near-term black swans. #美光财报 #非农就业数据 $MUB
{spot}(MUBUSDT)
US stocks are split and the U.S. Treasury trap
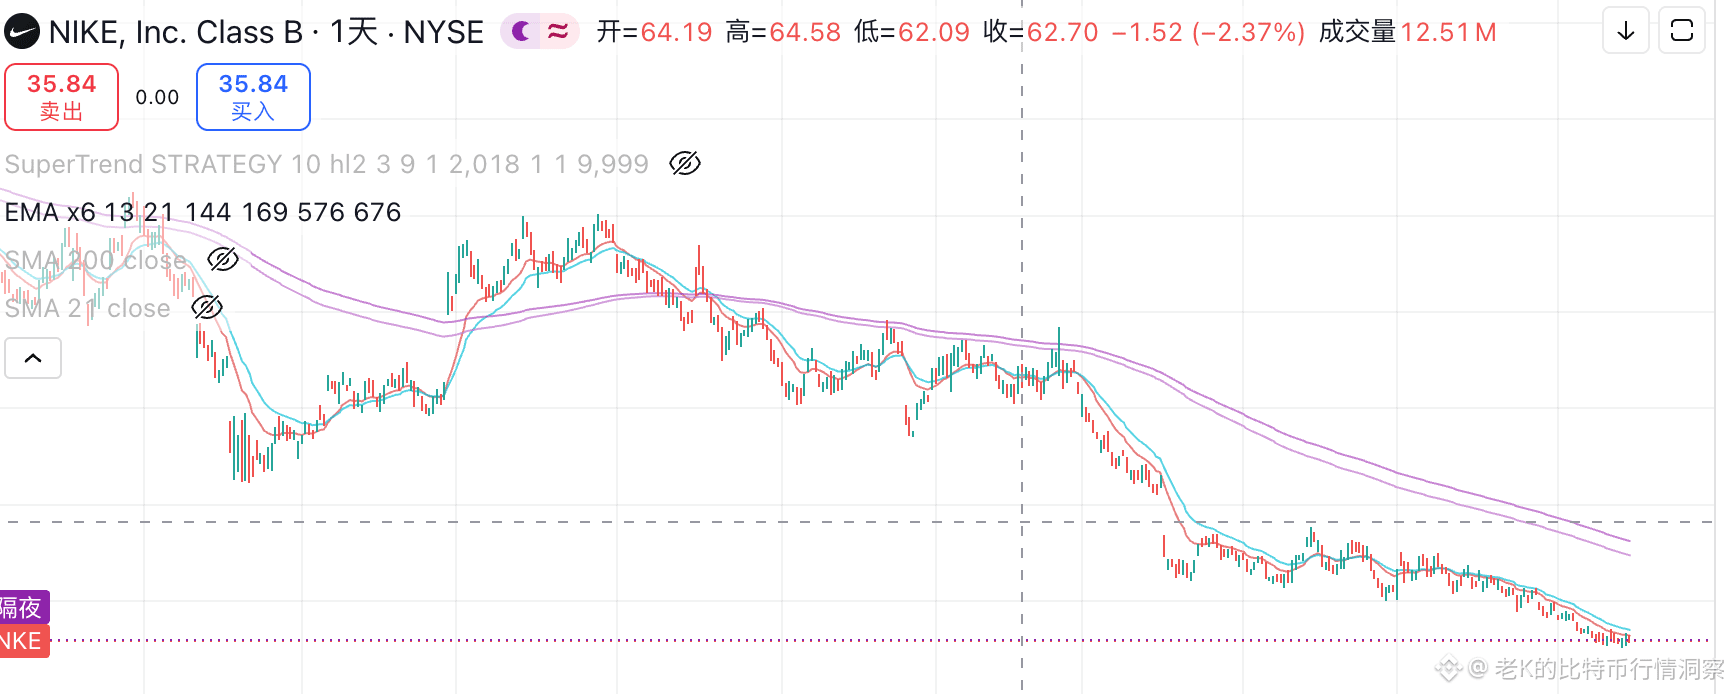
U.S. Treasury yields have gone on a rampage—these traditional giants like McDonald’s have been battered badly, and Nike is down 44% this year! Why hasn’t AI gotten truly huge yet, especially in the Nasdaq 100 (FANG+) segment? The essence is that its explosive growth rate is pushing through resistance; institutions are unwilling to miss their spot. But don’t forget: in the long run, high interest rates are the sword hanging over the heads of all risk assets. Even though Wall Street has recently come out saying that the 10-year Treasury yield would need to fall to 7% for the stock market to truly crash, as long as this AI fervor cools even slightly, the backlash afterward will be extremely violent. Right now, the market is waiting for Micron’s earnings report early tomorrow morning. On the other hand, if Micron’s earnings surge, and if Friday’s nonfarm payrolls employment data doesn’t come in well, then AI could still roar higher. Micron’s example shows there’s still plenty of room compared with the prior high of $1,200. What do you do in this dilemma? Look at how big capital is positioned: it’s risk versus opportunity—both are about strategically grasping the big cycle, and tactically avoiding near-term black swans. #美光财报 #非农就业数据 $MUB
U.S. Treasury yields have gone on a rampage—these traditional giants like McDonald’s have been battered badly, and Nike is down 44% this year! Why hasn’t AI gotten truly huge yet, especially in the Nasdaq 100 (FANG+) segment? The essence is that its explosive growth rate is pushing through resistance; institutions are unwilling to miss their spot. But don’t forget: in the long run, high interest rates are the sword hanging over the heads of all risk assets. Even though Wall Street has recently come out saying that the 10-year Treasury yield would need to fall to 7% for the stock market to truly crash, as long as this AI fervor cools even slightly, the backlash afterward will be extremely violent. Right now, the market is waiting for Micron’s earnings report early tomorrow morning. On the other hand, if Micron’s earnings surge, and if Friday’s nonfarm payrolls employment data doesn’t come in well, then AI could still roar higher. Micron’s example shows there’s still plenty of room compared with the prior high of $1,200. What do you do in this dilemma? Look at how big capital is positioned: it’s risk versus opportunity—both are about strategically grasping the big cycle, and tactically avoiding near-term black swans. #美光财报 #非农就业数据 $MUB
MUB-0.19%
NKEUS-0.50%
1.5k
·
--
Bearish
The macro gloom and the low volatility during a turning point have made the market so unnervingly quiet! This is exactly what it looks like right before a storm. Yesterday, oil prices fell back, but U.S. Treasury yields just wouldn’t drop, and on top of that, consumer confidence has plunged. This “economic slowdown + stubbornly high inflation” stagflation haze keeps hanging over our heads. Bitcoin grinding at the highs is extremely tormenting, but a divergence on the daily chart has already appeared. A market turning is very likely to happen within these few days. Have you got both hands ready? I’ve already exited all my futures positions; I’m firmly holding spot at a low price with a 40% allocation. Also, if there’s a rebound back to the high price, I plan to buy put options. $BTC
{spot}(BTCUSDT)
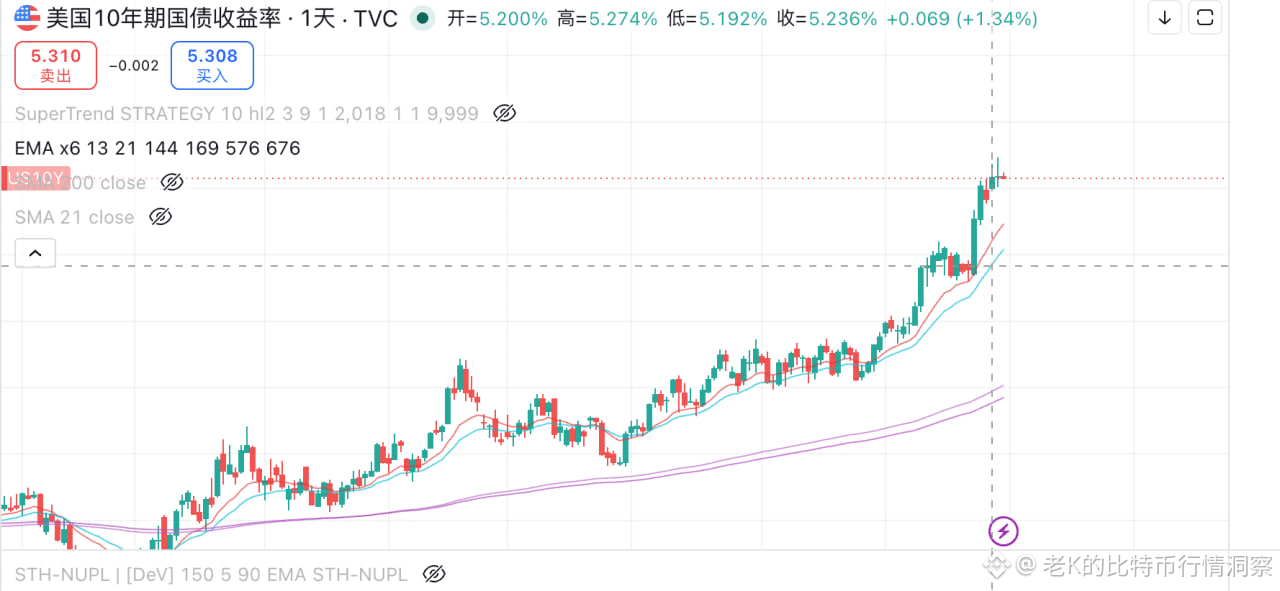
The macro gloom and the low volatility during a turning point have made the market so unnervingly quiet! This is exactly what it looks like right before a storm. Yesterday, oil prices fell back, but U.S. Treasury yields just wouldn’t drop, and on top of that, consumer confidence has plunged. This “economic slowdown + stubbornly high inflation” stagflation haze keeps hanging over our heads. Bitcoin grinding at the highs is extremely tormenting, but a divergence on the daily chart has already appeared. A market turning is very likely to happen within these few days. Have you got both hands ready? I’ve already exited all my futures positions; I’m firmly holding spot at a low price with a 40% allocation. Also, if there’s a rebound back to the high price, I plan to buy put options. $BTC
509
·
--
September 30 Early: US stocks are holding up solely on AI-related ingredient stocks! A US investment bank believes only a 7% rate will kill the valuation of duration-sensitive assets. JOLTS cools, but the consumer index weakens, raising concerns about stagflation. How long can Bitcoin at 82,800 still hold? Gold rebounds after an oversold dip—#美国8月职位空缺降至五个月低点
September 30 Early: US stocks are holding up solely on AI-related ingredient stocks! A US investment bank believes only a 7% rate will kill the valuation of duration-sensitive assets. JOLTS cools, but the consumer index weakens, raising concerns about stagflation. How long can Bitcoin at 82,800 still hold? Gold rebounds after an oversold dip—#美国8月职位空缺降至五个月低点
1
638
·
--
On the evening of September 29, a sudden positive development emerged between the US and Iran, causing crude oil to plunge. Will Bitcoin and the US stock market avoid disaster at the last moment? Is a Bitcoin double bottom about to form? Where will it go? After the final rebound, will it still fall? JOLTS job openings data will be released immediately! #美伊3小时会谈释放积极信号
On the evening of September 29, a sudden positive development emerged between the US and Iran, causing crude oil to plunge. Will Bitcoin and the US stock market avoid disaster at the last moment? Is a Bitcoin double bottom about to form? Where will it go? After the final rebound, will it still fall? JOLTS job openings data will be released immediately! #美伊3小时会谈释放积极信号
1
412
·
--
Partly True

Article
Late on September 29, news of a positive development unexpectedly hits on U.S.-Iran; crude oil plunges. Will Bitcoin and the U.S. stock market “swerve off the cliff”? Will a double bottom in Bitcoin be forming soon? Where will it go? After the final rebound, will it still fall? JOLTS job openings—being released now?Geopolitical news brings a thawing glimmer of hope; risk assets rebound in a “last-minute swerve off the cliff” style. As of the evening of September 29, Beijing time in the UTC+8 zone, after a slow downward drift earlier in the day, the crypto market has seen a dramatic surge rebound. As we accurately predicted in our earlier program: in the face of the upcoming midterm elections and approval ratings slipping to around 30%, the Trump administration has strong political motivations to cool down the U.S.-Iran conflict and clamp down on the elevated oil prices. On September 28, Trump confirmed at the White House that the U.S.-Iran indirect talks had been facilitated via Qatar, and he conveyed the “seven-day plan.” Although completely eliminating supply risks still requires the substantive confirmation of production and transportation along the supply chain, this flicker of peace instantly pushed oil prices lower, while also driving U.S. 2-year and 10-year Treasury yields to fall below the Vegas channel. The rapid release of macro risk-off sentiment has become the most important catalyst—like a “last-minute swerve off the cliff”—for Bitcoin and global risk assets to rebound strongly at key support levels.
Late on September 29, news of a positive development unexpectedly hits on U.S.-Iran; crude oil plunges. Will Bitcoin and the U.S. stock market “swerve off the cliff”? Will a double bottom in Bitcoin be forming soon? Where will it go? After the final rebound, will it still fall? JOLTS job openings—being released now?
Geopolitical news brings a thawing glimmer of hope; risk assets rebound in a “last-minute swerve off the cliff” style. As of the evening of September 29, Beijing time in the UTC+8 zone, after a slow downward drift earlier in the day, the crypto market has seen a dramatic surge rebound. As we accurately predicted in our earlier program: in the face of the upcoming midterm elections and approval ratings slipping to around 30%, the Trump administration has strong political motivations to cool down the U.S.-Iran conflict and clamp down on the elevated oil prices. On September 28, Trump confirmed at the White House that the U.S.-Iran indirect talks had been facilitated via Qatar, and he conveyed the “seven-day plan.” Although completely eliminating supply risks still requires the substantive confirmation of production and transportation along the supply chain, this flicker of peace instantly pushed oil prices lower, while also driving U.S. 2-year and 10-year Treasury yields to fall below the Vegas channel. The rapid release of macro risk-off sentiment has become the most important catalyst—like a “last-minute swerve off the cliff”—for Bitcoin and global risk assets to rebound strongly at key support levels.
1.5k
·
--
Early on September 29, be prepared for Bitcoin’s bigger drop! An 828,000 level is very likely not to hold. It’s still not ruled out that there may be one last surge, but it’s already a daily-chart-level bearish divergence. Even Nvidia’s share buyback news couldn’t offset the 10-year Treasury yields continuing to rise! #比特币跌破8万美元
Early on September 29, be prepared for Bitcoin’s bigger drop! An 828,000 level is very likely not to hold. It’s still not ruled out that there may be one last surge, but it’s already a daily-chart-level bearish divergence. Even Nvidia’s share buyback news couldn’t offset the 10-year Treasury yields continuing to rise! #比特币跌破8万美元
2
515
·
--
September 28 Bitcoin reaches the lifeline! Preview of major events in the week: JOLTS employment data, U.S. Treasury bond auctions, and Micron's earnings report deciding the AI bull-bear battle. #比特币跌破8.3万美元
September 28 Bitcoin reaches the lifeline! Preview of major events in the week: JOLTS employment data, U.S. Treasury bond auctions, and Micron's earnings report deciding the AI bull-bear battle. #比特币跌破8.3万美元
670
·
--
Bearish
Bitcoin shorts have surged. Of course, there is not yet any bullish divergence in the chart, but with shorts piled up this heavily, it depends on whether there will be a large buy order to support the market. Once it is propped up, the shorts will become a major fuel source. And if the bears win, then we may next see around 80,000.$BTC #比特币跌破8.3万美元
Bitcoin shorts have surged. Of course, there is not yet any bullish divergence in the chart, but with shorts piled up this heavily, it depends on whether there will be a large buy order to support the market. Once it is propped up, the shorts will become a major fuel source. And if the bears win, then we may next see around 80,000.$BTC #比特币跌破8.3万美元
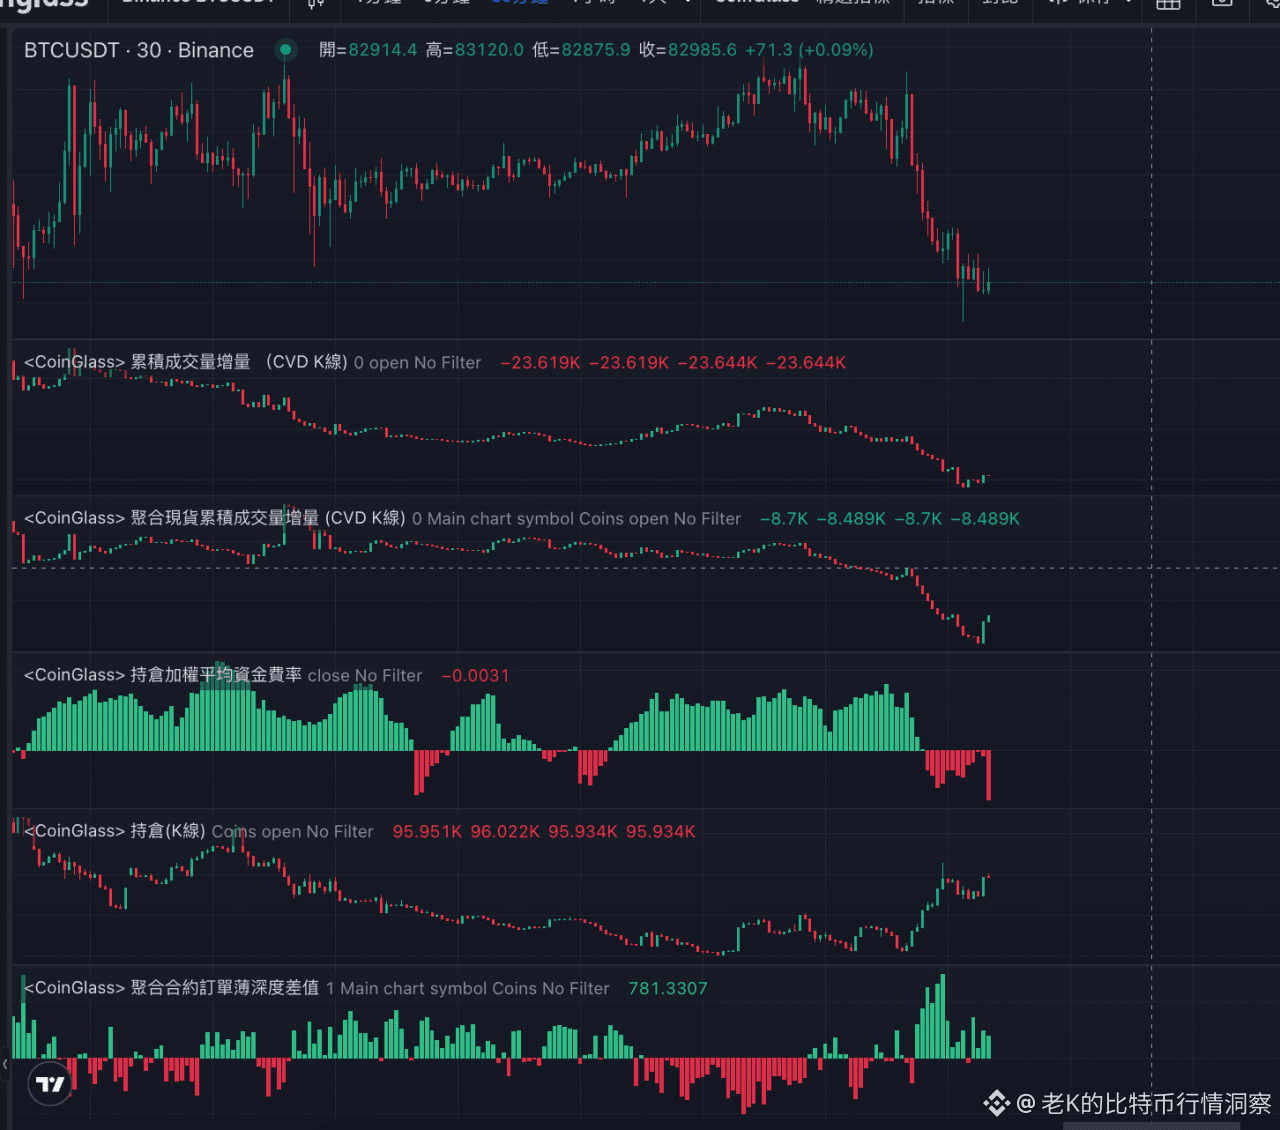
370
·
--
Bullish
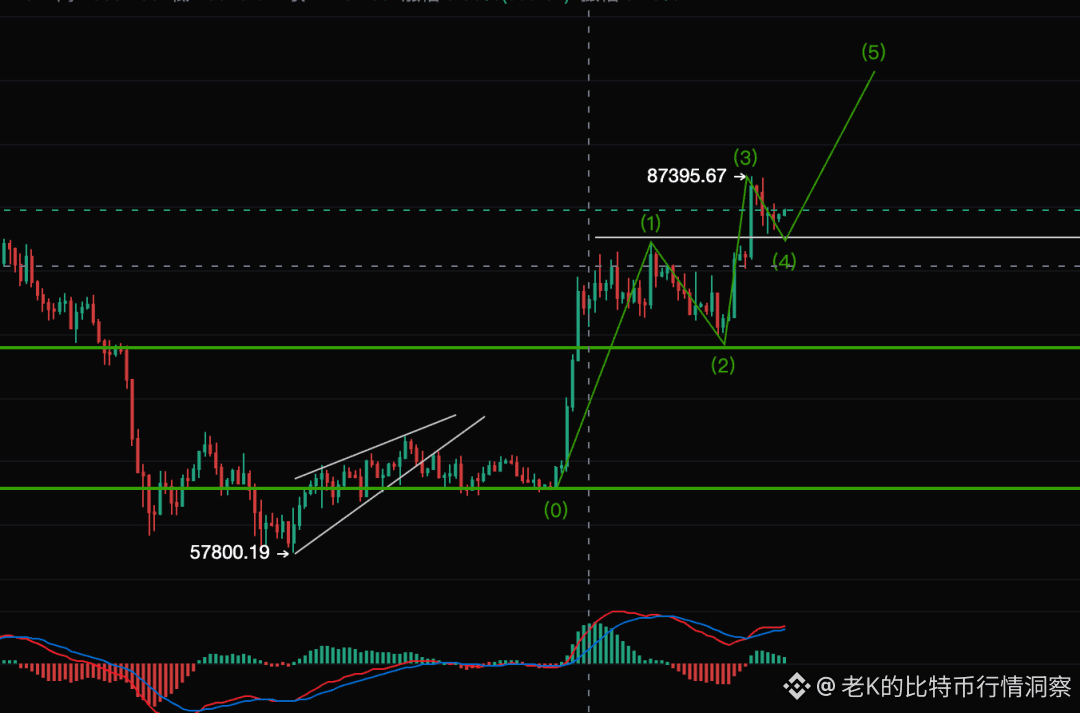
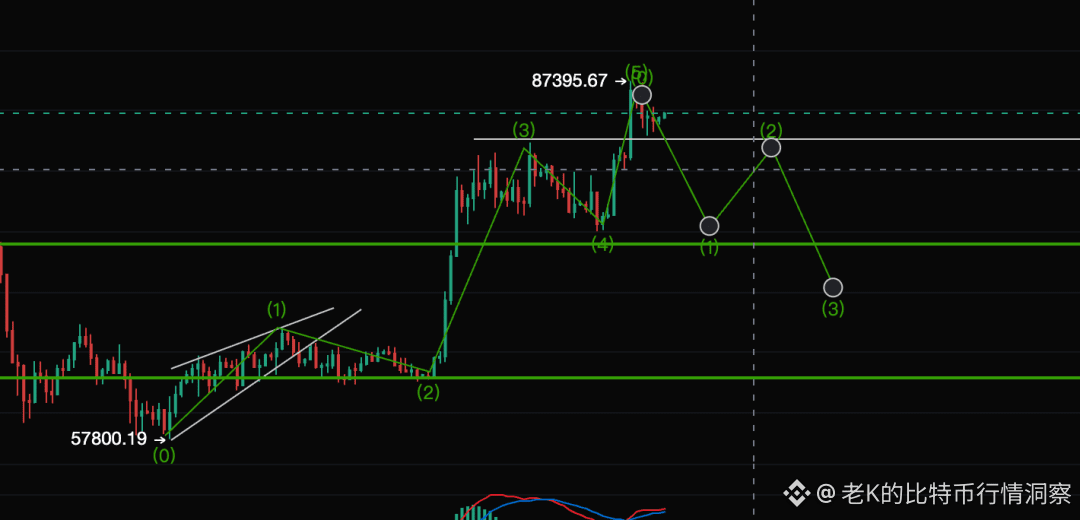
The market maker is actively nauseating the stop-loss hunt! Breaking down Bitcoin’s two major dead-ends in the trend—how ordinary people can fully cash in during a bull market? A thousand people, a thousand waves; guessing blindly by feel only gives the market fodder! The current chart is actually tightly locked by two hard-core mathematical logic lines:
Route 1 (progressive small waves): Hold 82,000, then start a small wave 5 aiming to break into the 95,000–96,000 zone.
Route 2 (guiding wedge): An ABC three-wave correction dips to $70,000 (which conveniently overlaps the strong support of the 200-day bull-bear boundary line).
The market maker is actively nauseating the stop-loss hunt! Breaking down Bitcoin’s two major dead-ends in the trend—how ordinary people can fully cash in during a bull market? A thousand people, a thousand waves; guessing blindly by feel only gives the market fodder! The current chart is actually tightly locked by two hard-core mathematical logic lines:
Route 1 (progressive small waves): Hold 82,000, then start a small wave 5 aiming to break into the 95,000–96,000 zone.
Route 2 (guiding wedge): An ABC three-wave correction dips to $70,000 (which conveniently overlaps the strong support of the 200-day bull-bear boundary line).
Route 1 (progressive small waves): Hold 82,000, then start a small wave 5 aiming to break into the 95,000–96,000 zone.
Route 2 (guiding wedge): An ABC three-wave correction dips to $70,000 (which conveniently overlaps the strong support of the 200-day bull-bear boundary line).
1
1.4k
·
--
Analyze Elliott Wave Theory: Has this bull market already peaked at least $150,000? Can Bitcoin still return to $70,000? Probability analysis of “picking up people in the reverse car.” Has phase one’s wave 5 already finished? If wave 5 has finished, to $70,000! If wave 5 hasn’t finished, to $100,000! #比特币大牛市的开端。这一切只是开始。⚡🚀 $BTC
Analyze Elliott Wave Theory: Has this bull market already peaked at least $150,000? Can Bitcoin still return to $70,000? Probability analysis of “picking up people in the reverse car.” Has phase one’s wave 5 already finished? If wave 5 has finished, to $70,000! If wave 5 hasn’t finished, to $100,000! #比特币大牛市的开端。这一切只是开始。⚡🚀 $BTC
1
303
Log in to explore more content
Join global crypto users on Binance Square
⚡️ Get latest and useful information about crypto.
💬 Trusted by the world’s largest crypto exchange.
👍 Discover real insights from verified creators.
Email / Phone number
Trending Topics
ADAGains10%Above$0.27
3,424 views
103 Discussing
$ADA is making a strong move today jumping over 10 percent to around 027 and breaking into a new 90 day high
Trading volume has also surged above 1 billion showing strong market activity
The move comes as $ADA continues its recovery from the June lows while its recent technical structure has turned more bullish
The 027 to 028 zone is now the key area to watch A sustained breakout could open the door toward higher resistance levels
But after such a sharp daily move volatility could remain high
#ADAGains10%Above$0.27 #crypto #ADA #Cardano #crypto #Write2Earn
AbdullahAbid_7
·0 Likes
·164 views
ETHUp70%InQ3ButLiquidityFalls
45,309 views
579 Discussing
EthStakingExitQueueHits2026High
16,734 views
481 Discussing