



Geopolitical news brings a thawing glimmer of hope; risk assets rebound in a “last-minute swerve off the cliff” style. As of the evening of September 29, Beijing time in the UTC+8 zone, after a slow downward drift earlier in the day, the crypto market has seen a dramatic surge rebound. As we accurately predicted in our earlier program: in the face of the upcoming midterm elections and approval ratings slipping to around 30%, the Trump administration has strong political motivations to cool down the U.S.-Iran conflict and clamp down on the elevated oil prices. On September 28, Trump confirmed at the White House that the U.S.-Iran indirect talks had been facilitated via Qatar, and he conveyed the “seven-day plan.” Although completely eliminating supply risks still requires the substantive confirmation of production and transportation along the supply chain, this flicker of peace instantly pushed oil prices lower, while also driving U.S. 2-year and 10-year Treasury yields to fall below the Vegas channel. The rapid release of macro risk-off sentiment has become the most important catalyst—like a “last-minute swerve off the cliff”—for Bitcoin and global risk assets to rebound strongly at key support levels.
Small-timeframe double-bottom structure begins to show: strong resonance between the order book and liquidation positioning. From the technical and microstructure perspectives, although the Bitcoin 4-hour MACD has already dipped deep into the sell zone below the 0 axis, this bottoming rebound is accompanied by clear follow-up buying and a release of energy. On a 5-minute chart with an even smaller timeframe, the price has already formed a clear potential “double bottom” pattern, with the key neckline around $84,300. Order-book data shows that while the CVD indicator is moving sideways slightly, the price continues to refresh recent local highs; this suggests that, under conditions where contract-buy orders are not overly pushing, spot buying (whether active market buys or limit orders) is providing solid support without any bearish divergence. In addition, the liquidation heatmap reveals a highly directional distribution of positioning: using $84,300 as the reference point, liquidation open interest extends upward $1,000 to the $85,300 range, where more than $200 million of short liquidation intensity is concentrated; meanwhile, on the downside down to $83,200, there is only about $40–50 million in liquidation scale. The densely packed liquidation positioning above is like a massive magnet, greatly increasing the probability of another upward push in the short term.
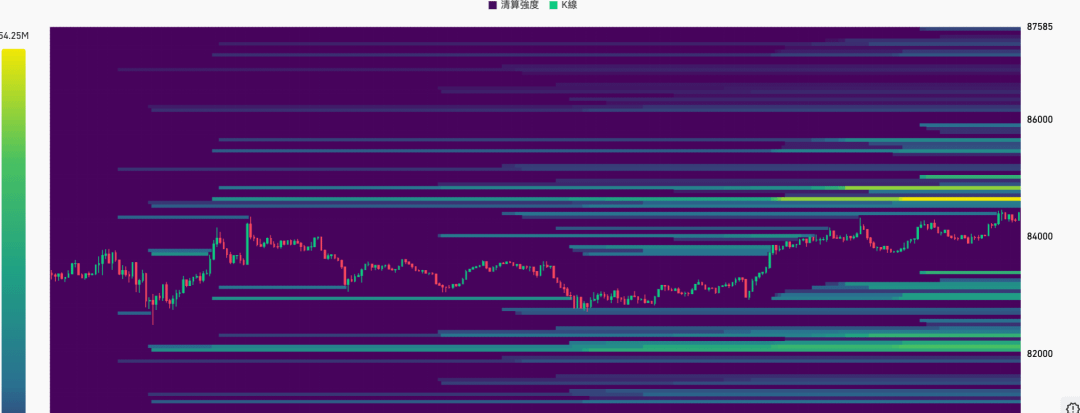
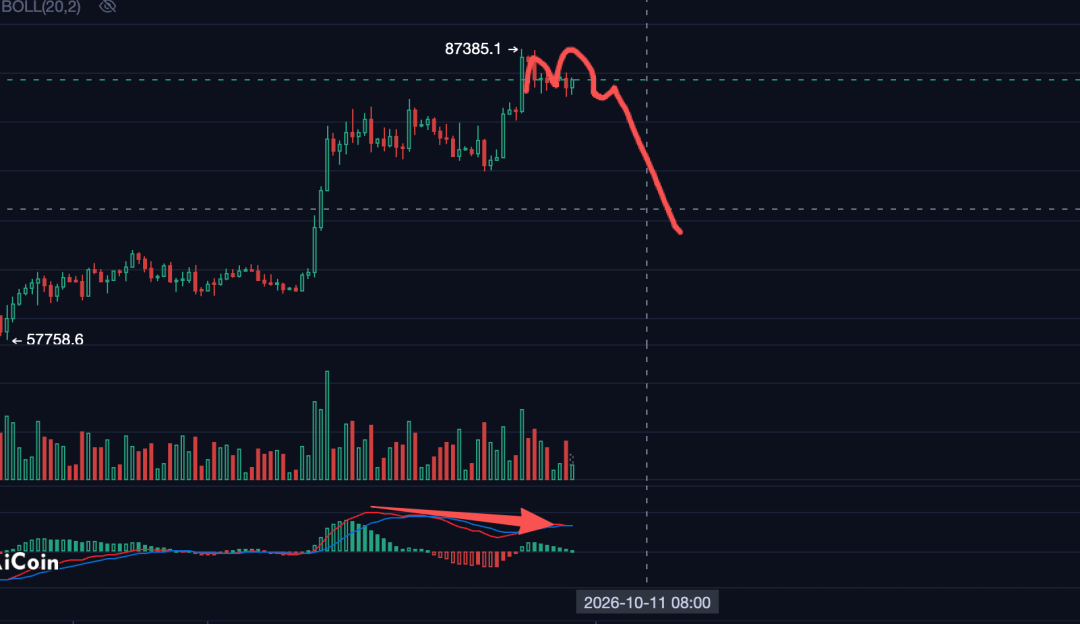
Precisely measure the rebound range—watch out for fake breakouts and momentum exhaustion. If the market successfully breaks through and stabilizes above the neckline at $84,300, this rebound will develop into the evolution dictated by the AMD pattern. The first-stage target will point directly to $85,000, then challenge the key neckline of the left-side minor double top at $85,200. If that level can be decisively reclaimed, based on the equal-distance projection from the double-bottom pattern, the price may further close the CME gap above the natural rebound high of the decline, potentially reaching above $86,000. However, whether investors can directly tear through the prior high at $87,000 and kick off a seamless bull run requires the highest level of rationality. While the daily MACD death cross shows a “false move” where it appears to switch from crossing to reopening, compared with the earlier two waves’ price-action, volume, and momentum performance, the divergence signal remains highly evident—the essence of the lack of strength in the rally has not been eliminated in the short term. Today’s surge is fundamentally like a “shot of adrenaline” forced into the market via news; as subsequent news gets digested, the trend of declining volume and energy remains the most likely outcome.
Wave structure and real-time risk control: major macro data hits tonight. In terms of wave structure, we still maintain the main logic: since the starting point of this round, the first major wave may already be finished, and the market is now in the eve of building a double top (M top) and initiating a 2nd-wave pullback. Once the price ultimately breaks below the key level of $82,800, the 2nd-wave pullback will be officially confirmed.

Public community early warning: VIPs precisely take profit—showcasing an institution’s perspective. The evolution of market conditions once again validates the value of our overall market judgment. While we reminded the public community this morning to guard against the risk of a sudden crash, we leveraged our extreme profit-to-loss ratio advantage to guide our VIP community to precisely position low-price long orders.
Before the 2:10 p.m. news flow fully gains momentum, we decisively alerted readers in advance to take profit on half the position to lock in victory. Then, as the positive developments regarding Iran and the U.S. were confirmed, we judged that the market has the potential to sprint toward $86,000—so we chose to continue holding the remaining portion steadily to expand our gains. The market is shrouded in uncertainty; looking at a single indicator alone often turns into “feeling for an elephant in the dark.”