
Up-to-date_Analysis
145 Posts

Up-to-date_Analysis
Report
Block User
0 Following
13 Followers
37 Liked
Posts
PINNED
Partly True
{future}(SNDKUSDT)
$BTC $SNDK
📊 BTC + SNDK — Latest Market Update
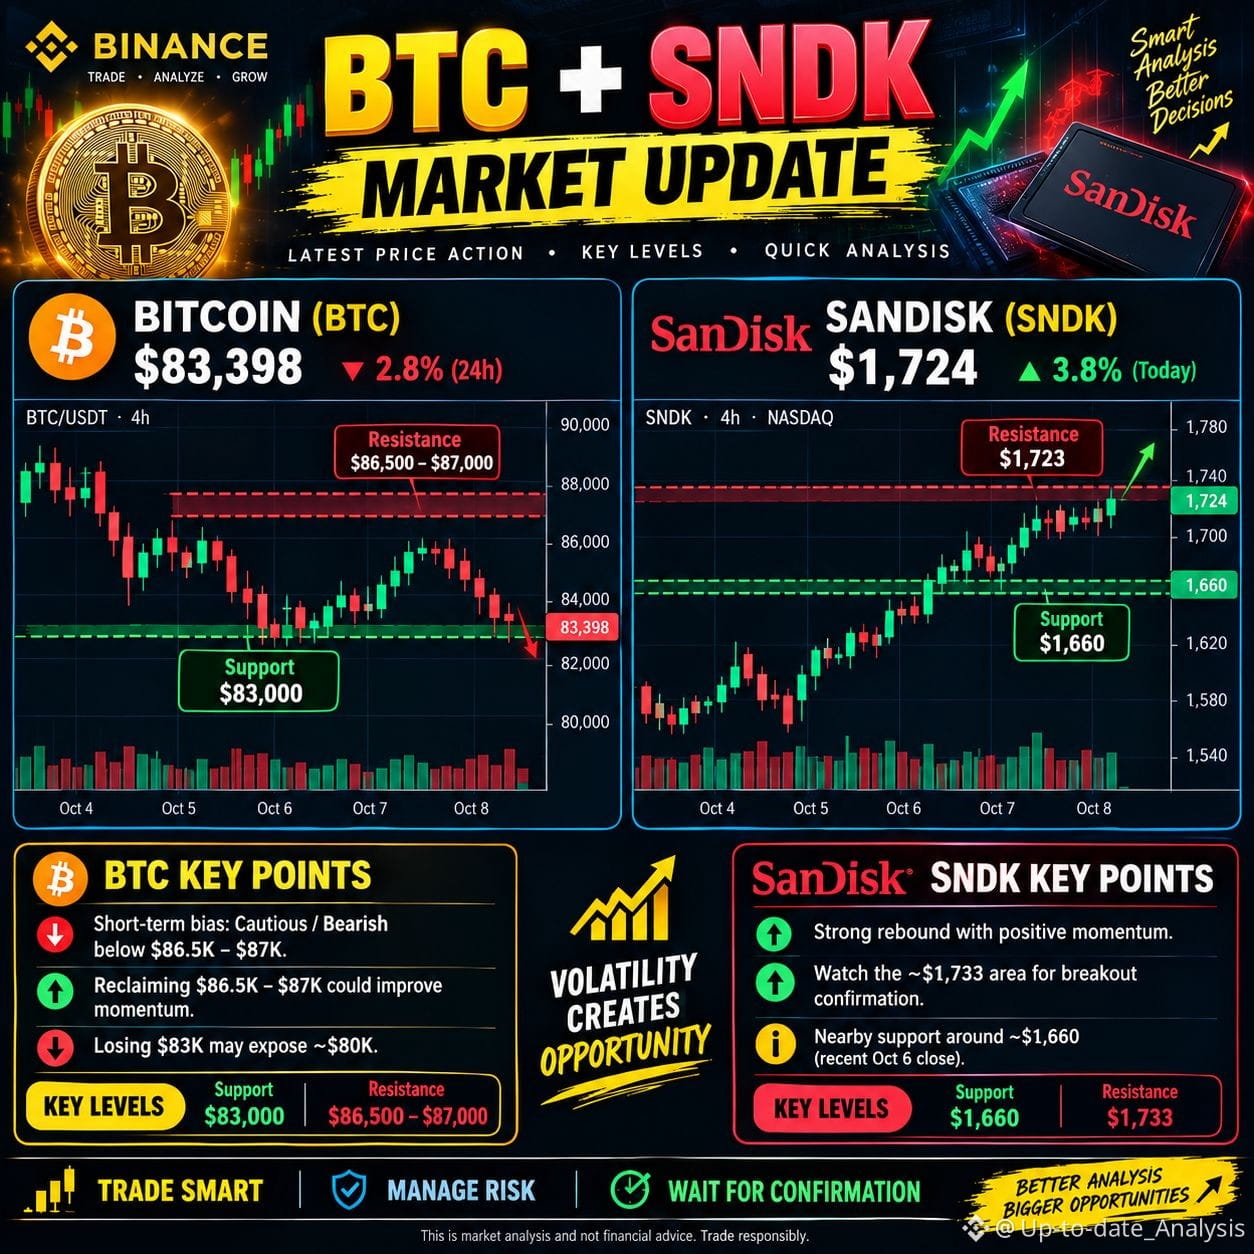
₿ Bitcoin (BTC): ~$83.3K, down ~2.8% today. BTC remains under pressure after failing to clear $86.5K–$87K. A hold above $83K is important; losing it could expose ~$80K. �
CoinDesk +1
💾 SanDisk (SNDK): ~$1,724, up ~3.8% on Oct. 7. Strong rebound and momentum; price is testing the $1,733 area. A confirmed breakout could signal further upside, while ~$1,660 is the key nearby support. �
stockanalysis.com +1
🔥 Outlook: BTC = cautious/volatile | SNDK = bullish momentum#FedMinutesFocusOnOctoberPause #BinanceLaunchesBinanceIntelligence #EvernorthDelaysNasdaqDebutToOct12 #BTC #SNDK
{spot}(BTCUSDT)
{stock_us}(SNDK.US)
$BTC $SNDK
📊 BTC + SNDK — Latest Market Update
₿ Bitcoin (BTC): ~$83.3K, down ~2.8% today. BTC remains under pressure after failing to clear $86.5K–$87K. A hold above $83K is important; losing it could expose ~$80K. �
CoinDesk +1
💾 SanDisk (SNDK): ~$1,724, up ~3.8% on Oct. 7. Strong rebound and momentum; price is testing the $1,733 area. A confirmed breakout could signal further upside, while ~$1,660 is the key nearby support. �
stockanalysis.com +1
🔥 Outlook: BTC = cautious/volatile | SNDK = bullish momentum#FedMinutesFocusOnOctoberPause #BinanceLaunchesBinanceIntelligence #EvernorthDelaysNasdaqDebutToOct12 #BTC #SNDK
📊 BTC + SNDK — Latest Market Update
₿ Bitcoin (BTC): ~$83.3K, down ~2.8% today. BTC remains under pressure after failing to clear $86.5K–$87K. A hold above $83K is important; losing it could expose ~$80K. �
CoinDesk +1
💾 SanDisk (SNDK): ~$1,724, up ~3.8% on Oct. 7. Strong rebound and momentum; price is testing the $1,733 area. A confirmed breakout could signal further upside, while ~$1,660 is the key nearby support. �
stockanalysis.com +1
🔥 Outlook: BTC = cautious/volatile | SNDK = bullish momentum#FedMinutesFocusOnOctoberPause #BinanceLaunchesBinanceIntelligence #EvernorthDelaysNasdaqDebutToOct12 #BTC #SNDK
1
1.9k
PINNED
$LYN
🔥 LYN/USDT — Latest Quick Analysis
LYN is under strong selling pressure. 📉
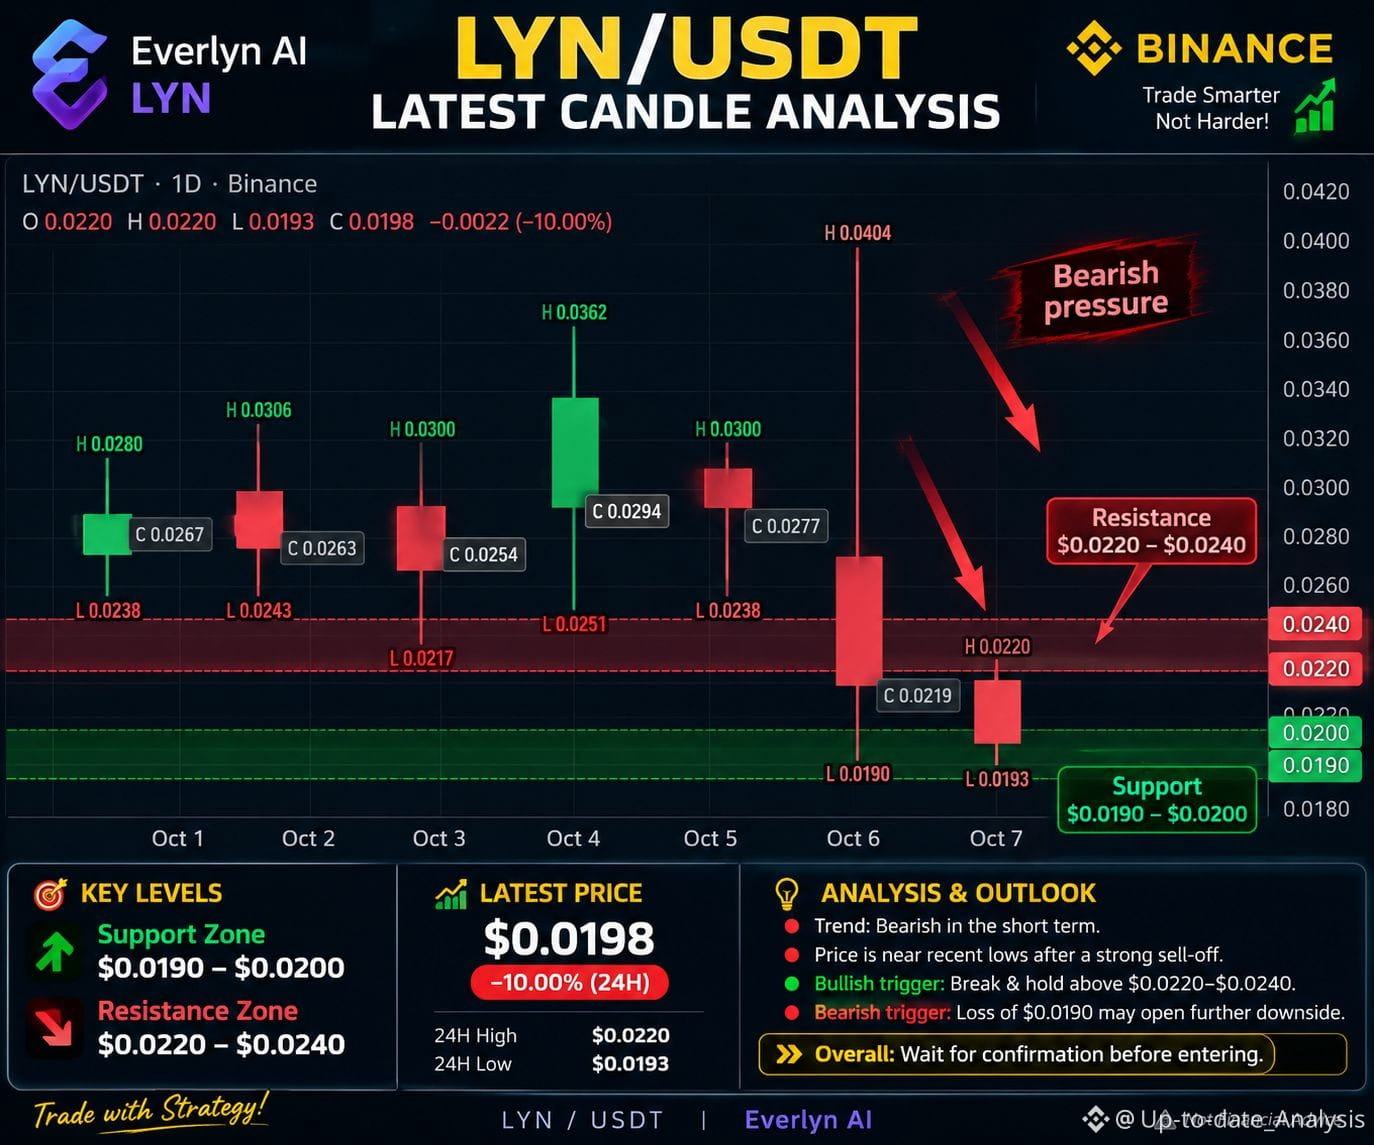
Current price is around $0.020 after a sharp decline; the Oct. 7 session closed near $0.0198, down about 9.6%.
🎯 Key levels
- 🟢 Support: $0.0190–$0.0200
- 🔴 Resistance: $0.0220–$0.0240
- 🚀 Break above $0.0240 could signal a short-term recovery.
- ⚠️ Loss of $0.0190 may open further downside.
Trend: 🔴 Bearish — wait for confirmation rather than chasing the move.
Current price: ≈ $0.0201
24H range: $0.0190–$0.0221
Outlook: LYN is sitting near its recent low after a sharp sell-off. A strong bullish candle with rising volume above $0.022–$0.024 would improve the recovery setup; otherwise, downside risk remains. #FedMinutesFocusOnOctoberPause #BinanceLaunchesBinanceIntelligence #WinklevossFilesSpotZcashETFApplication #LYN
{alpha}(560x302dfaf2cdbe51a18d97186a7384e87cf599877d)
$LYN
🔥 LYN/USDT — Latest Quick Analysis
LYN is under strong selling pressure. 📉
Current price is around $0.020 after a sharp decline; the Oct. 7 session closed near $0.0198, down about 9.6%.
🎯 Key levels
- 🟢 Support: $0.0190–$0.0200
- 🔴 Resistance: $0.0220–$0.0240
- 🚀 Break above $0.0240 could signal a short-term recovery.
- ⚠️ Loss of $0.0190 may open further downside.
Trend: 🔴 Bearish — wait for confirmation rather than chasing the move.
Current price: ≈ $0.0201
24H range: $0.0190–$0.0221
Outlook: LYN is sitting near its recent low after a sharp sell-off. A strong bullish candle with rising volume above $0.022–$0.024 would improve the recovery setup; otherwise, downside risk remains. #FedMinutesFocusOnOctoberPause #BinanceLaunchesBinanceIntelligence #WinklevossFilesSpotZcashETFApplication #LYN
🔥 LYN/USDT — Latest Quick Analysis
LYN is under strong selling pressure. 📉
Current price is around $0.020 after a sharp decline; the Oct. 7 session closed near $0.0198, down about 9.6%.
🎯 Key levels
- 🟢 Support: $0.0190–$0.0200
- 🔴 Resistance: $0.0220–$0.0240
- 🚀 Break above $0.0240 could signal a short-term recovery.
- ⚠️ Loss of $0.0190 may open further downside.
Trend: 🔴 Bearish — wait for confirmation rather than chasing the move.
Current price: ≈ $0.0201
24H range: $0.0190–$0.0221
Outlook: LYN is sitting near its recent low after a sharp sell-off. A strong bullish candle with rising volume above $0.022–$0.024 would improve the recovery setup; otherwise, downside risk remains. #FedMinutesFocusOnOctoberPause #BinanceLaunchesBinanceIntelligence #WinklevossFilesSpotZcashETFApplication #LYN
1
1.1k
$ZEC
{spot}(ZECUSDT)
🚀 ZEC (ZCASH) – LATEST MARKET ANALYSIS
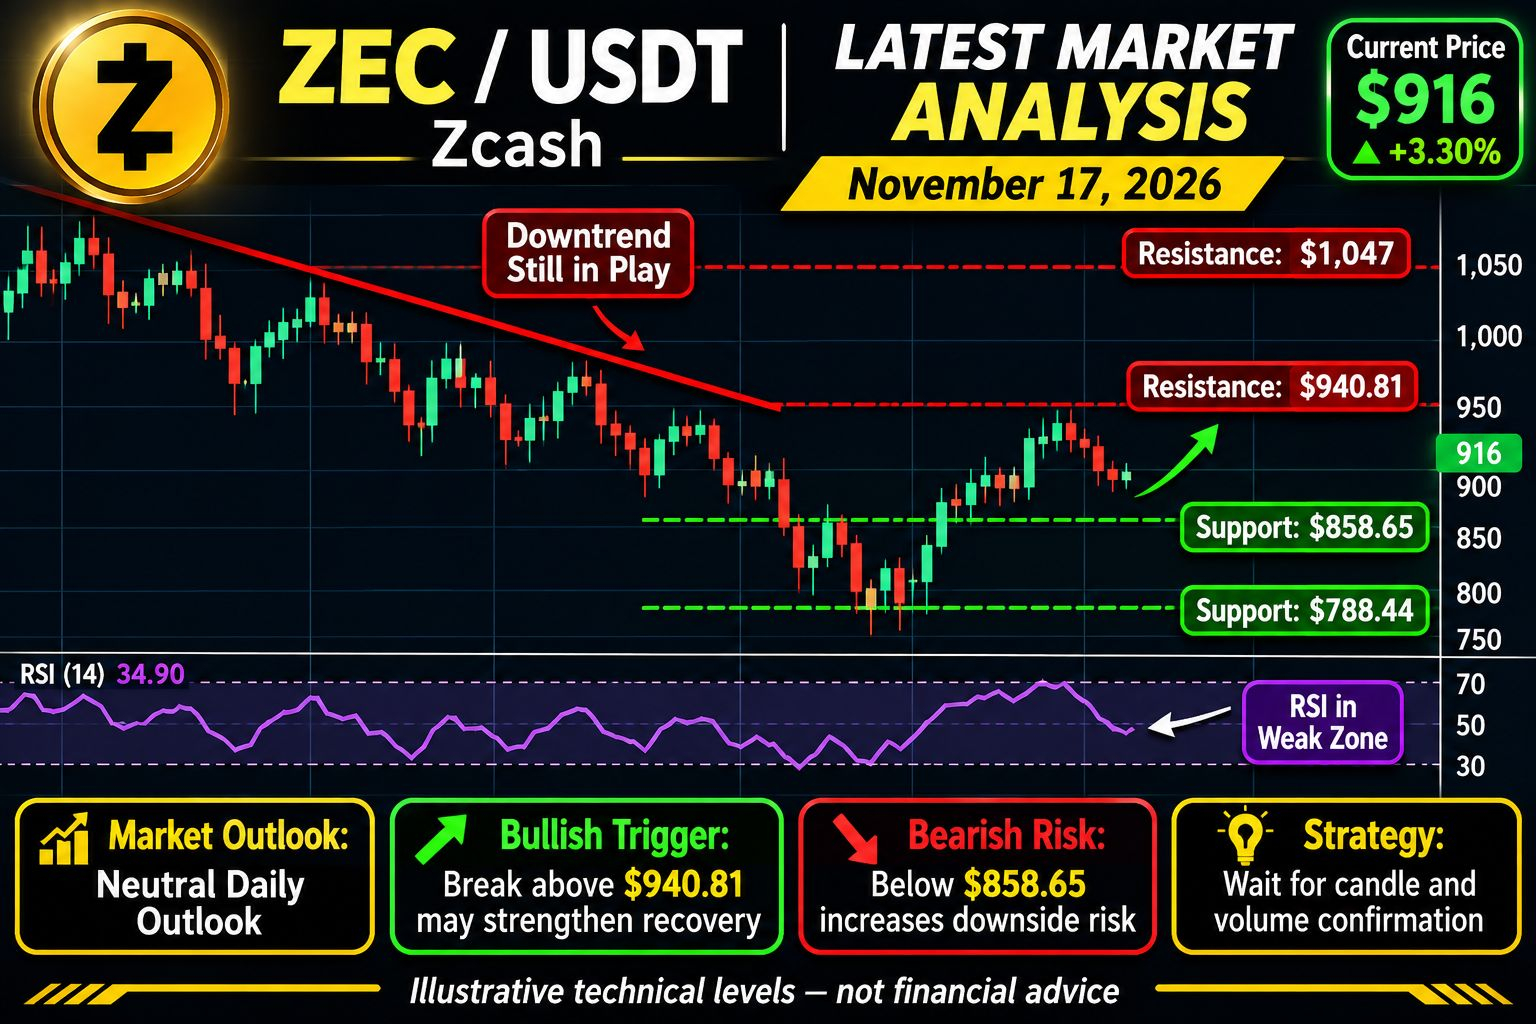
📊 Market Trend: Volatile, with bullish recovery potential.
📈 Bullish Scenario: A strong breakout above the recent resistance zone could trigger fresh buying momentum.
📉 Bearish Scenario: Losing the recent support zone may invite further selling pressure.
🔥 Market Outlook: ZEC remains an interesting cryptocurrency to watch. Traders should monitor volume, RSI, and key support/resistance levels for confirmation of the next major move.
🎯 Trading Strategy: Avoid chasing sudden pumps. Wait for a confirmed candle breakout and manage risk carefully.
#ZEC #Zcash #CryptoAnalysis #Altcoins #TradingSignals
$ZEC
🚀 ZEC (ZCASH) – LATEST MARKET ANALYSIS
📊 Market Trend: Volatile, with bullish recovery potential.
📈 Bullish Scenario: A strong breakout above the recent resistance zone could trigger fresh buying momentum.
📉 Bearish Scenario: Losing the recent support zone may invite further selling pressure.
🔥 Market Outlook: ZEC remains an interesting cryptocurrency to watch. Traders should monitor volume, RSI, and key support/resistance levels for confirmation of the next major move.
🎯 Trading Strategy: Avoid chasing sudden pumps. Wait for a confirmed candle breakout and manage risk carefully.
#ZEC #Zcash #CryptoAnalysis #Altcoins #TradingSignals
🚀 ZEC (ZCASH) – LATEST MARKET ANALYSIS
📊 Market Trend: Volatile, with bullish recovery potential.
📈 Bullish Scenario: A strong breakout above the recent resistance zone could trigger fresh buying momentum.
📉 Bearish Scenario: Losing the recent support zone may invite further selling pressure.
🔥 Market Outlook: ZEC remains an interesting cryptocurrency to watch. Traders should monitor volume, RSI, and key support/resistance levels for confirmation of the next major move.
🎯 Trading Strategy: Avoid chasing sudden pumps. Wait for a confirmed candle breakout and manage risk carefully.
#ZEC #Zcash #CryptoAnalysis #Altcoins #TradingSignals
139
$SNDK $SNDKB
{spot}(SNDKBUSDT)
{future}(SNDKUSDT)
🚀 SANDISK (SNDK) – LATEST STOCK MARKET ANALYSIS
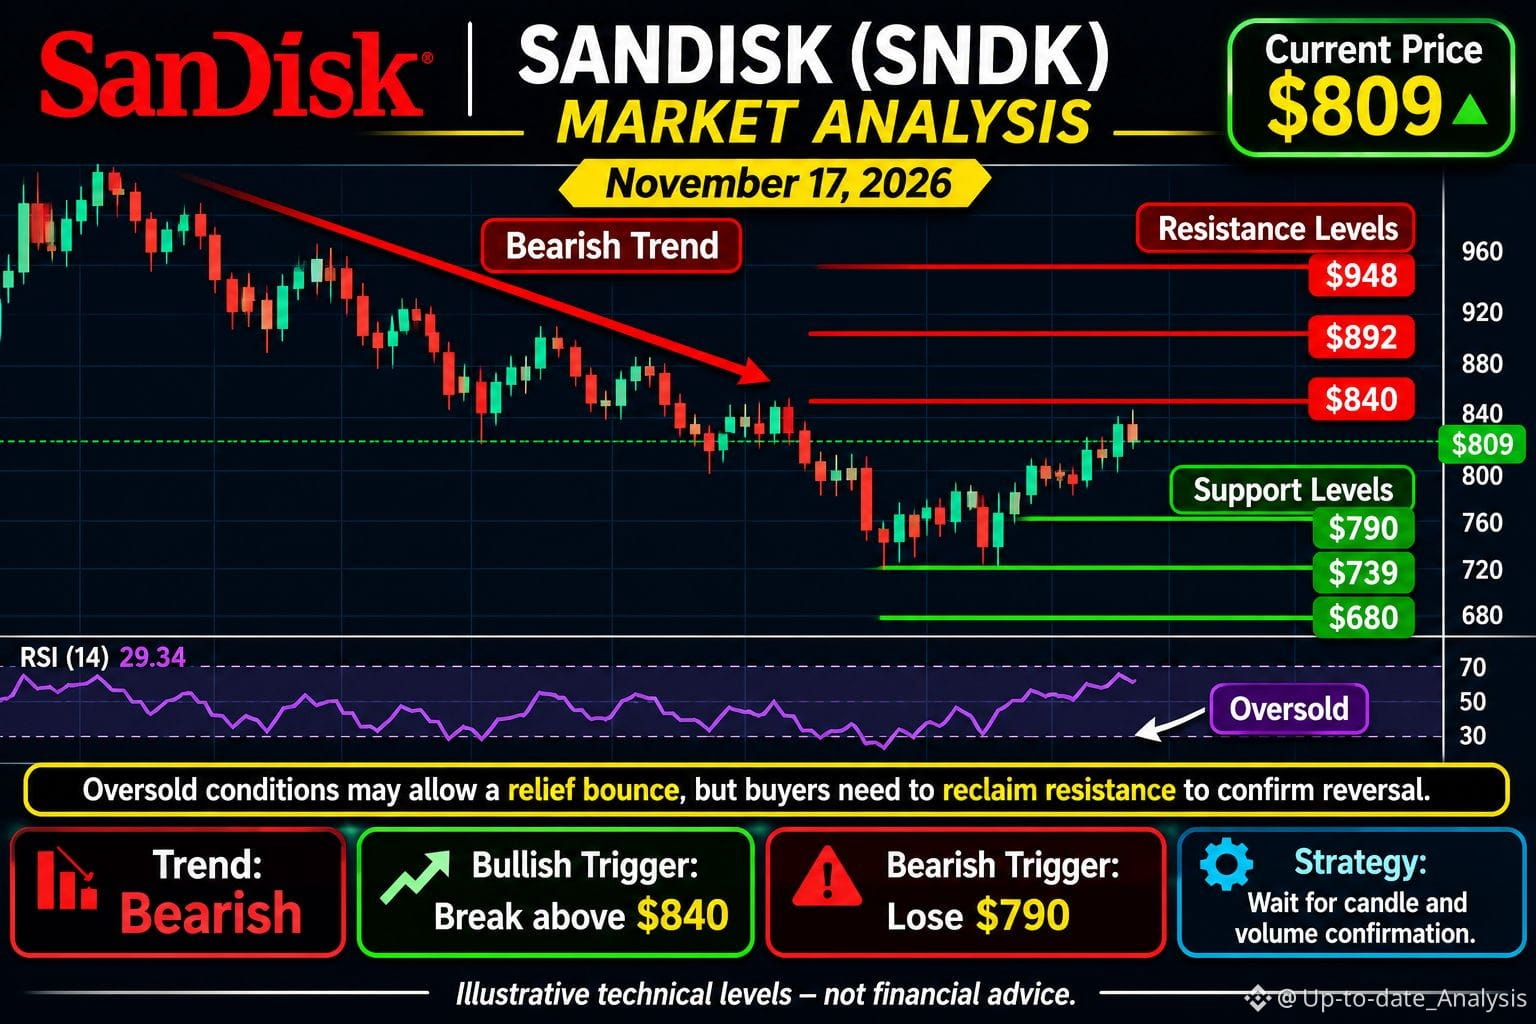
📊 Current Price: ~$809
🔴 Market Trend: Strong bearish pressure with oversold conditions.
📉 Support Levels: $790 – $739 – $680
📈 Resistance Levels: $840 – $892 – $948
🔥 Bullish Scenario: A strong breakout above $840 could trigger a recovery toward $892.
⚠️ Bearish Scenario: A breakdown below $790 may expose the next support near $739.
💡 Market Outlook: SNDK is experiencing heavy selling pressure, but oversold RSI conditions suggest a possible relief bounce. Buyers need to reclaim key resistance levels to confirm a trend reversal.
🎯 Strategy: Watch volume and candle confirmation before entering. Manage risk carefully.
#SNDK #SanDisk #StockMarket #AIStocks #TechnicalAnalysis
$SNDK $SNDKB
🚀 SANDISK (SNDK) – LATEST STOCK MARKET ANALYSIS
📊 Current Price: ~$809
🔴 Market Trend: Strong bearish pressure with oversold conditions.
📉 Support Levels: $790 – $739 – $680
📈 Resistance Levels: $840 – $892 – $948
🔥 Bullish Scenario: A strong breakout above $840 could trigger a recovery toward $892.
⚠️ Bearish Scenario: A breakdown below $790 may expose the next support near $739.
💡 Market Outlook: SNDK is experiencing heavy selling pressure, but oversold RSI conditions suggest a possible relief bounce. Buyers need to reclaim key resistance levels to confirm a trend reversal.
🎯 Strategy: Watch volume and candle confirmation before entering. Manage risk carefully.
#SNDK #SanDisk #StockMarket #AIStocks #TechnicalAnalysis
🚀 SANDISK (SNDK) – LATEST STOCK MARKET ANALYSIS
📊 Current Price: ~$809
🔴 Market Trend: Strong bearish pressure with oversold conditions.
📉 Support Levels: $790 – $739 – $680
📈 Resistance Levels: $840 – $892 – $948
🔥 Bullish Scenario: A strong breakout above $840 could trigger a recovery toward $892.
⚠️ Bearish Scenario: A breakdown below $790 may expose the next support near $739.
💡 Market Outlook: SNDK is experiencing heavy selling pressure, but oversold RSI conditions suggest a possible relief bounce. Buyers need to reclaim key resistance levels to confirm a trend reversal.
🎯 Strategy: Watch volume and candle confirmation before entering. Manage risk carefully.
#SNDK #SanDisk #StockMarket #AIStocks #TechnicalAnalysis
287
$LUNC
{spot}(LUNCUSDT)
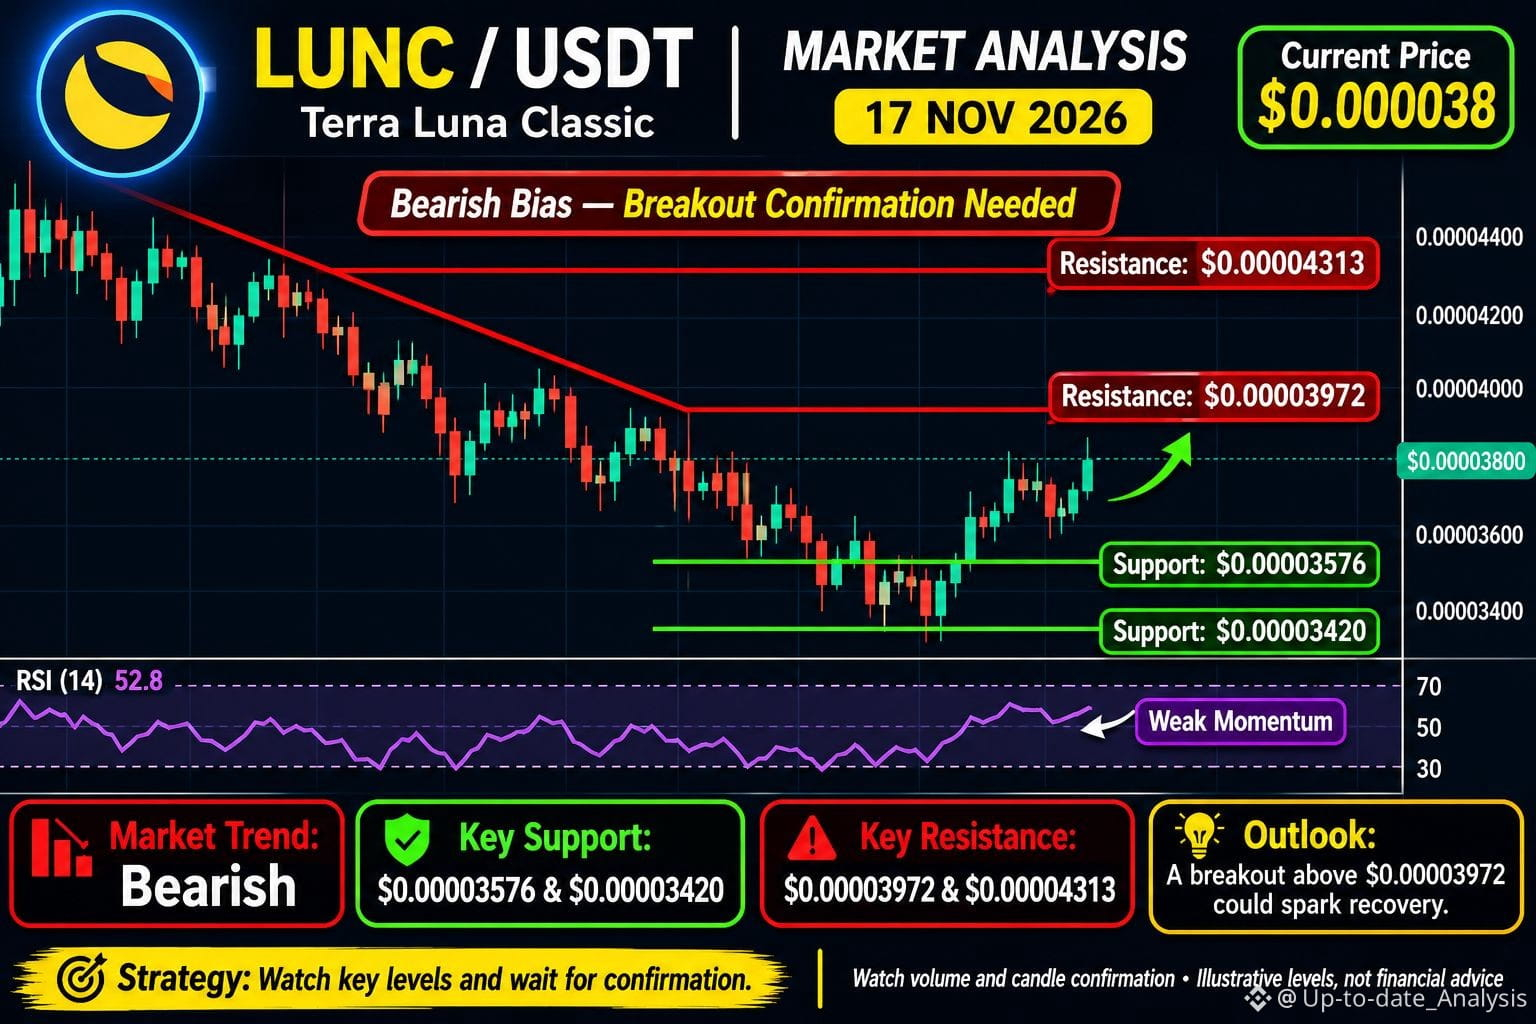
🚀 LUNC (TERRA CLASSIC) – LATEST MARKET ANALYSIS
📊 Current Price: ~$0.000038
🔴 Market Trend: Bearish, with a possible short-term recovery.
📉 Support Levels: $0.00003576 – $0.00003420
📈 Resistance Levels: $0.00003972 – $0.00004313
🔥 Bullish Signal: A strong breakout above $0.00003972 could open the door toward $0.00004313.
⚠️ Bearish Signal: A breakdown below $0.00003576 may trigger further downside.
💡 Market Outlook: LUNC is showing weak momentum, while short-term buying interest may create a recovery opportunity. Bulls need a confirmed breakout to reverse the bearish trend.
🎯 Strategy: Watch volume, support and resistance before entering.
#LUNC #TerraClassic #CryptoAnalysis #Altcoins #TradingSignals
$LUNC
🚀 LUNC (TERRA CLASSIC) – LATEST MARKET ANALYSIS
📊 Current Price: ~$0.000038
🔴 Market Trend: Bearish, with a possible short-term recovery.
📉 Support Levels: $0.00003576 – $0.00003420
📈 Resistance Levels: $0.00003972 – $0.00004313
🔥 Bullish Signal: A strong breakout above $0.00003972 could open the door toward $0.00004313.
⚠️ Bearish Signal: A breakdown below $0.00003576 may trigger further downside.
💡 Market Outlook: LUNC is showing weak momentum, while short-term buying interest may create a recovery opportunity. Bulls need a confirmed breakout to reverse the bearish trend.
🎯 Strategy: Watch volume, support and resistance before entering.
#LUNC #TerraClassic #CryptoAnalysis #Altcoins #TradingSignals
🚀 LUNC (TERRA CLASSIC) – LATEST MARKET ANALYSIS
📊 Current Price: ~$0.000038
🔴 Market Trend: Bearish, with a possible short-term recovery.
📉 Support Levels: $0.00003576 – $0.00003420
📈 Resistance Levels: $0.00003972 – $0.00004313
🔥 Bullish Signal: A strong breakout above $0.00003972 could open the door toward $0.00004313.
⚠️ Bearish Signal: A breakdown below $0.00003576 may trigger further downside.
💡 Market Outlook: LUNC is showing weak momentum, while short-term buying interest may create a recovery opportunity. Bulls need a confirmed breakout to reverse the bearish trend.
🎯 Strategy: Watch volume, support and resistance before entering.
#LUNC #TerraClassic #CryptoAnalysis #Altcoins #TradingSignals
2
94
$SXT
{spot}(SXTUSDT)
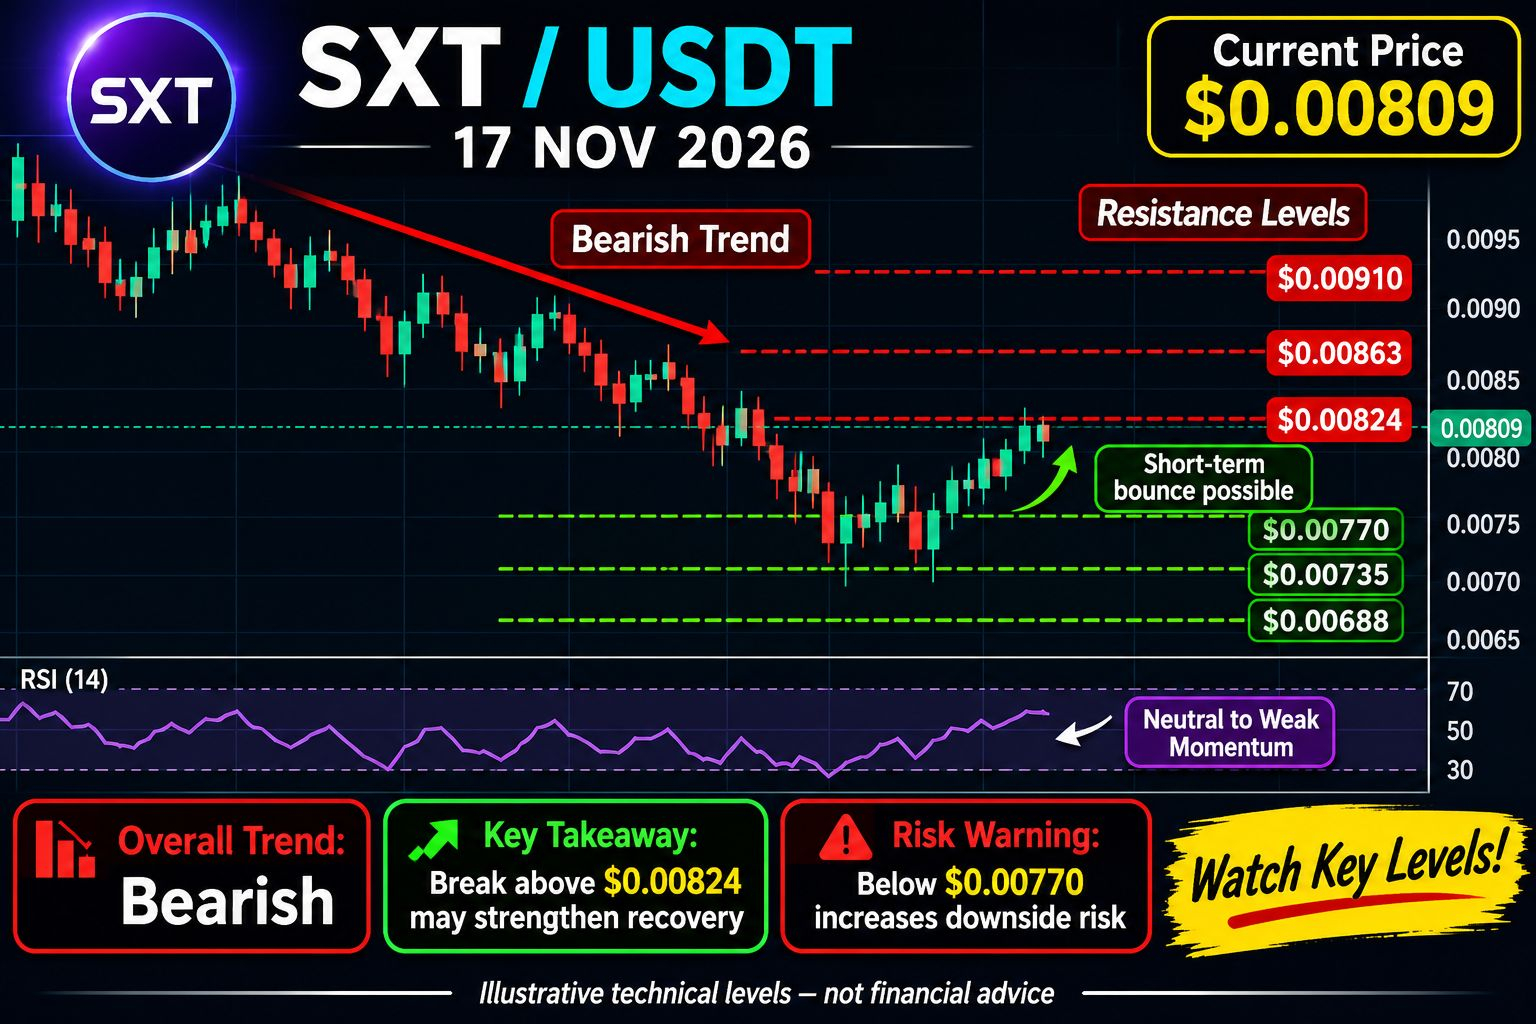
🚀 SXT (SPACE AND TIME) – LATEST MARKET ANALYSIS
📊 Current Price: ~$0.00809
🔴 Market Trend: Bearish, with signs of short-term stabilization.
📉 Support Levels: $0.00770 – $0.00735 – $0.00688
📈 Resistance Levels: $0.00824 – $0.00863 – $0.00910
🔥 Bullish Signal: A strong breakout above $0.00824 could trigger further recovery toward $0.00863.
⚠️ Bearish Signal: A breakdown below $0.00770 may lead to further downside.
💡 Market Outlook: SXT is showing early signs of a possible short-term bounce, but the overall trend remains bearish. Watch trading volume and candle confirmation for a stronger reversal signal.
🎯 Strategy: Watch key levels and manage risk carefully.
#SXT #SpaceAndTime #CryptoAnalysis #Altcoins #TradingSignals
$SXT
🚀 SXT (SPACE AND TIME) – LATEST MARKET ANALYSIS
📊 Current Price: ~$0.00809
🔴 Market Trend: Bearish, with signs of short-term stabilization.
📉 Support Levels: $0.00770 – $0.00735 – $0.00688
📈 Resistance Levels: $0.00824 – $0.00863 – $0.00910
🔥 Bullish Signal: A strong breakout above $0.00824 could trigger further recovery toward $0.00863.
⚠️ Bearish Signal: A breakdown below $0.00770 may lead to further downside.
💡 Market Outlook: SXT is showing early signs of a possible short-term bounce, but the overall trend remains bearish. Watch trading volume and candle confirmation for a stronger reversal signal.
🎯 Strategy: Watch key levels and manage risk carefully.
#SXT #SpaceAndTime #CryptoAnalysis #Altcoins #TradingSignals
🚀 SXT (SPACE AND TIME) – LATEST MARKET ANALYSIS
📊 Current Price: ~$0.00809
🔴 Market Trend: Bearish, with signs of short-term stabilization.
📉 Support Levels: $0.00770 – $0.00735 – $0.00688
📈 Resistance Levels: $0.00824 – $0.00863 – $0.00910
🔥 Bullish Signal: A strong breakout above $0.00824 could trigger further recovery toward $0.00863.
⚠️ Bearish Signal: A breakdown below $0.00770 may lead to further downside.
💡 Market Outlook: SXT is showing early signs of a possible short-term bounce, but the overall trend remains bearish. Watch trading volume and candle confirmation for a stronger reversal signal.
🎯 Strategy: Watch key levels and manage risk carefully.
#SXT #SpaceAndTime #CryptoAnalysis #Altcoins #TradingSignals
109
$NVDA $NVDAB
{spot}(NVDABUSDT)
{future}(NVDAUSDT)
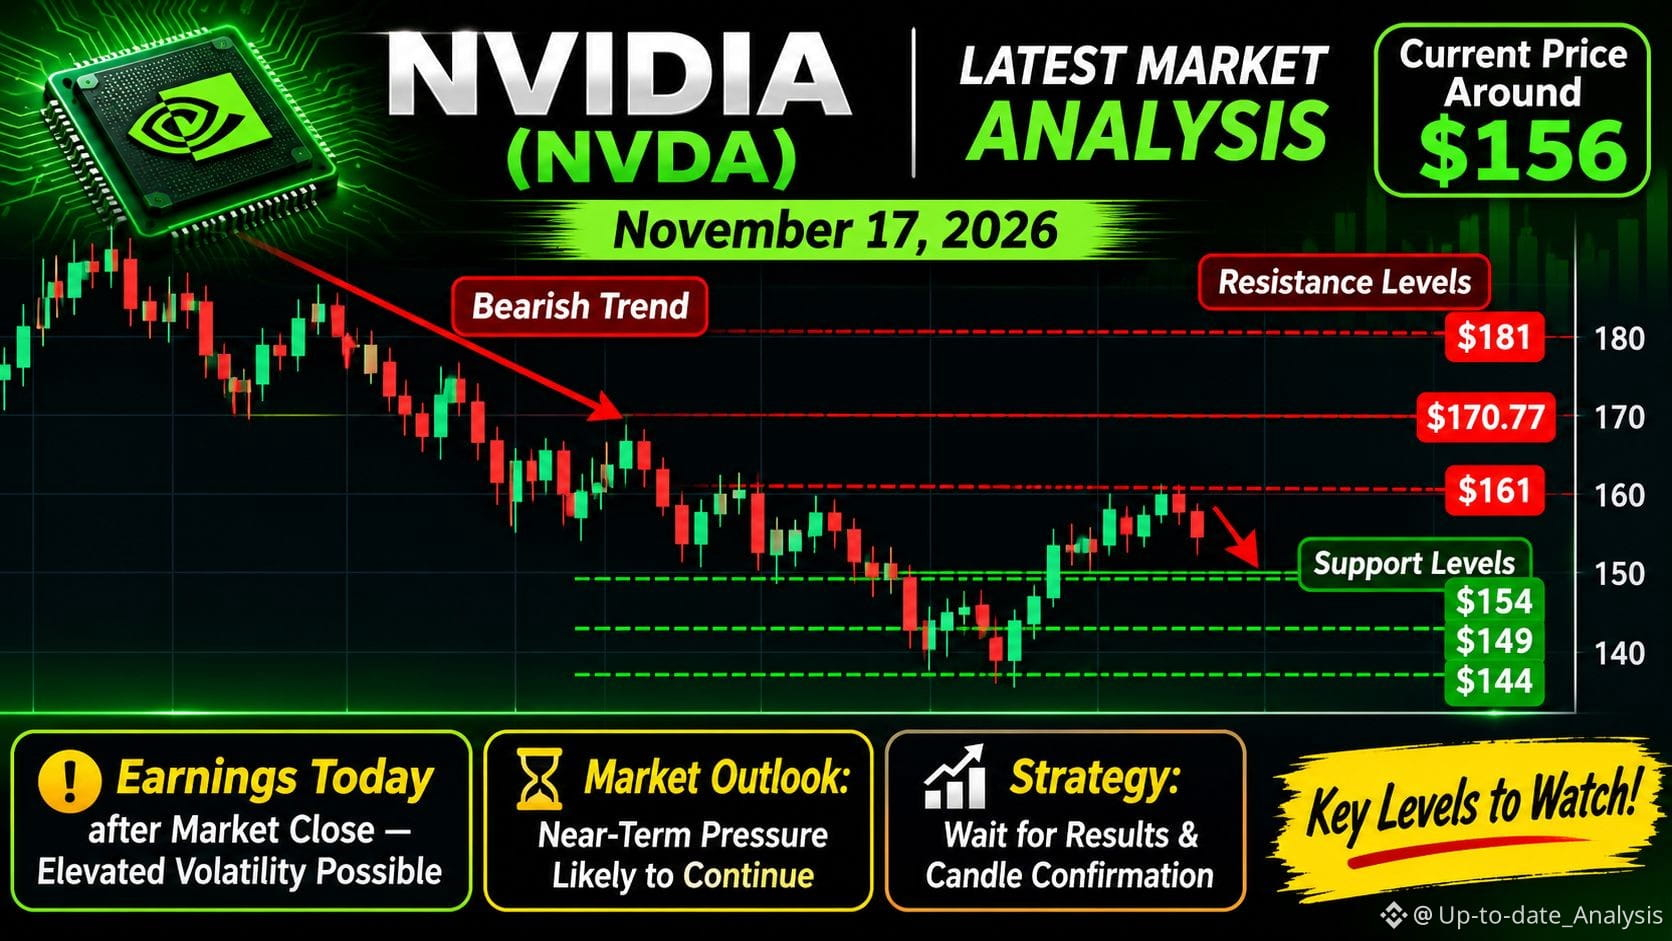
🚀 NVIDIA (NVDA) – LATEST MARKET ANALYSIS
📊 Current Price: Around $156
🔴 Market Trend: Bearish pressure ahead of earnings.
📉 Support Levels: $154 – $149 – $144
📈 Resistance Levels: $161 – $170 – $181
🔥 Bullish Scenario: A strong breakout above $170 could open the door to further recovery.
⚠️ Bearish Scenario: A breakdown below $154 may trigger additional selling pressure.
💡 Market Outlook: NVIDIA is facing increased volatility ahead of its quarterly earnings report. Investors are watching AI demand, future guidance, and leadership uncertainty. A sharp move in either direction is possible after earnings.
🎯 Strategy: Wait for earnings results and candle confirmation before taking a position. Manage risk carefully.
#NVIDIA #NVDA #StockMarket #AIStocks #TechnicalAnalysis
$NVDA $NVDAB
🚀 NVIDIA (NVDA) – LATEST MARKET ANALYSIS
📊 Current Price: Around $156
🔴 Market Trend: Bearish pressure ahead of earnings.
📉 Support Levels: $154 – $149 – $144
📈 Resistance Levels: $161 – $170 – $181
🔥 Bullish Scenario: A strong breakout above $170 could open the door to further recovery.
⚠️ Bearish Scenario: A breakdown below $154 may trigger additional selling pressure.
💡 Market Outlook: NVIDIA is facing increased volatility ahead of its quarterly earnings report. Investors are watching AI demand, future guidance, and leadership uncertainty. A sharp move in either direction is possible after earnings.
🎯 Strategy: Wait for earnings results and candle confirmation before taking a position. Manage risk carefully.
#NVIDIA #NVDA #StockMarket #AIStocks #TechnicalAnalysis
🚀 NVIDIA (NVDA) – LATEST MARKET ANALYSIS
📊 Current Price: Around $156
🔴 Market Trend: Bearish pressure ahead of earnings.
📉 Support Levels: $154 – $149 – $144
📈 Resistance Levels: $161 – $170 – $181
🔥 Bullish Scenario: A strong breakout above $170 could open the door to further recovery.
⚠️ Bearish Scenario: A breakdown below $154 may trigger additional selling pressure.
💡 Market Outlook: NVIDIA is facing increased volatility ahead of its quarterly earnings report. Investors are watching AI demand, future guidance, and leadership uncertainty. A sharp move in either direction is possible after earnings.
🎯 Strategy: Wait for earnings results and candle confirmation before taking a position. Manage risk carefully.
#NVIDIA #NVDA #StockMarket #AIStocks #TechnicalAnalysis
195
$TRUMP
{spot}(TRUMPUSDT)
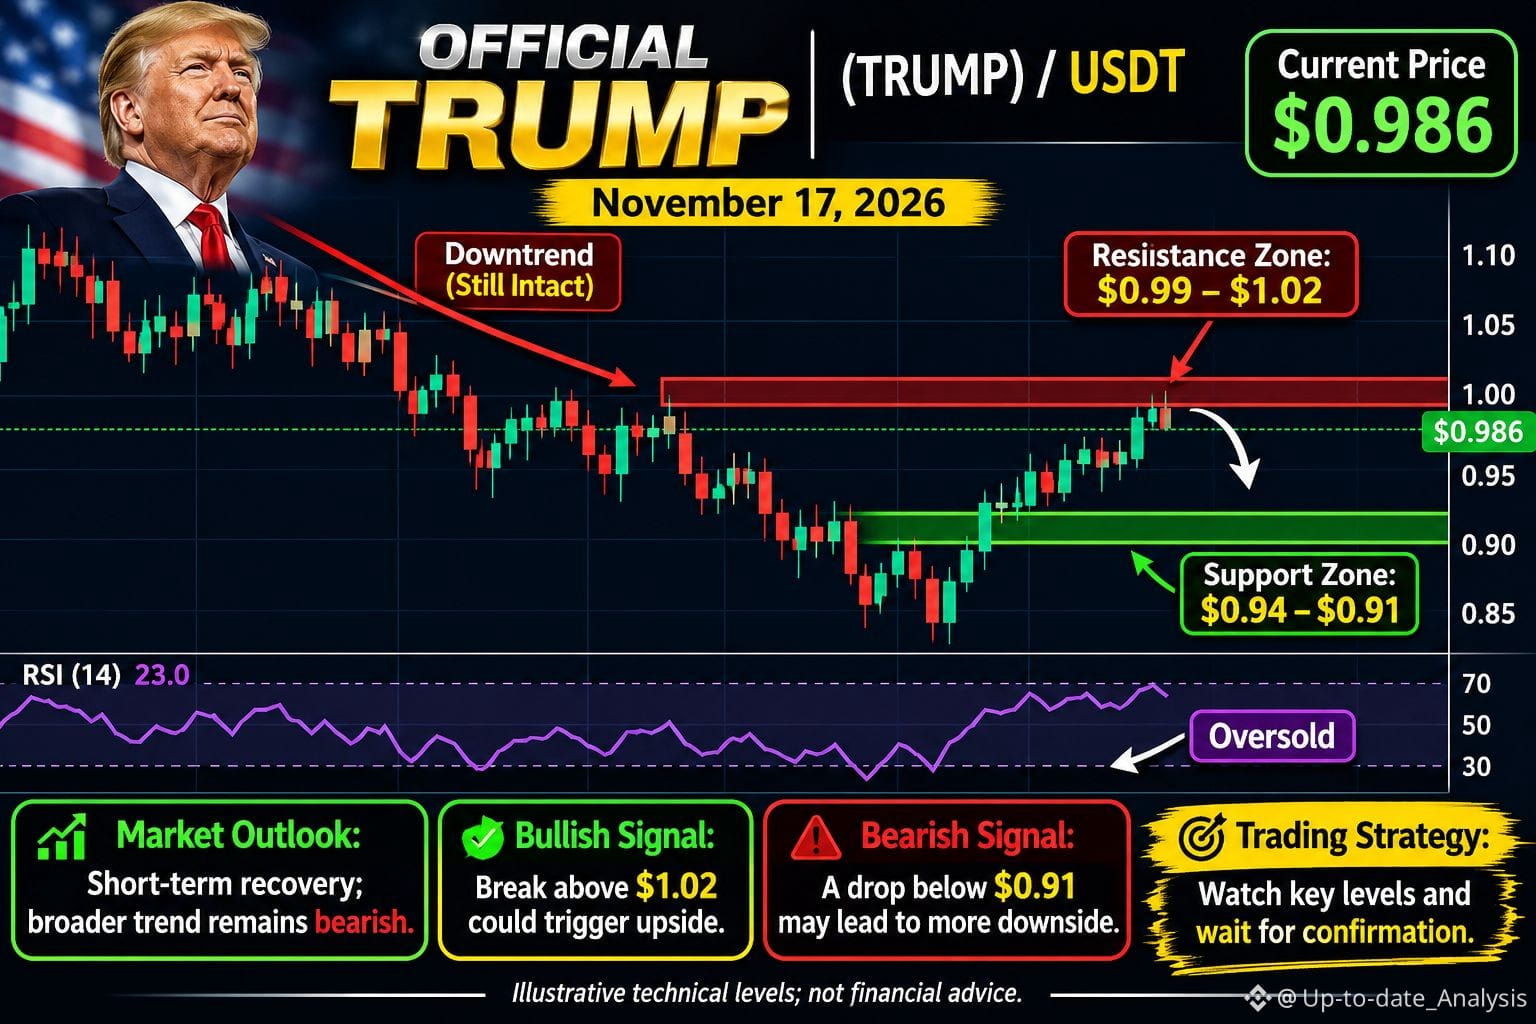
🚀 OFFICIAL TRUMP (TRUMP) – LATEST MARKET ANALYSIS
📊 Current Price: ~$0.986
🟢 24H Change: +6.59%
📈 Resistance: $0.99 – $1.02
📉 Support: $0.94 – $0.91
🔥 Bullish Scenario: A strong breakout above $1.00 could trigger further recovery toward $1.02.
⚠️ Bearish Scenario: Losing $0.94 may bring renewed selling pressure toward $0.91.
💡 Market Outlook: TRUMP is showing a short-term recovery, but the broader trend remains bearish. Oversold RSI suggests a possible relief bounce. Watch volume and candle confirmation before entering.
🎯 Strategy: Trade carefully and use proper risk management.
#TRUMP #CryptoAnalysis #trading #Altcoins #MarketUpdate
$TRUMP
🚀 OFFICIAL TRUMP (TRUMP) – LATEST MARKET ANALYSIS
📊 Current Price: ~$0.986
🟢 24H Change: +6.59%
📈 Resistance: $0.99 – $1.02
📉 Support: $0.94 – $0.91
🔥 Bullish Scenario: A strong breakout above $1.00 could trigger further recovery toward $1.02.
⚠️ Bearish Scenario: Losing $0.94 may bring renewed selling pressure toward $0.91.
💡 Market Outlook: TRUMP is showing a short-term recovery, but the broader trend remains bearish. Oversold RSI suggests a possible relief bounce. Watch volume and candle confirmation before entering.
🎯 Strategy: Trade carefully and use proper risk management.
#TRUMP #CryptoAnalysis #trading #Altcoins #MarketUpdate
🚀 OFFICIAL TRUMP (TRUMP) – LATEST MARKET ANALYSIS
📊 Current Price: ~$0.986
🟢 24H Change: +6.59%
📈 Resistance: $0.99 – $1.02
📉 Support: $0.94 – $0.91
🔥 Bullish Scenario: A strong breakout above $1.00 could trigger further recovery toward $1.02.
⚠️ Bearish Scenario: Losing $0.94 may bring renewed selling pressure toward $0.91.
💡 Market Outlook: TRUMP is showing a short-term recovery, but the broader trend remains bearish. Oversold RSI suggests a possible relief bounce. Watch volume and candle confirmation before entering.
🎯 Strategy: Trade carefully and use proper risk management.
#TRUMP #CryptoAnalysis #trading #Altcoins #MarketUpdate
153
$XRP
{spot}(XRPUSDT)
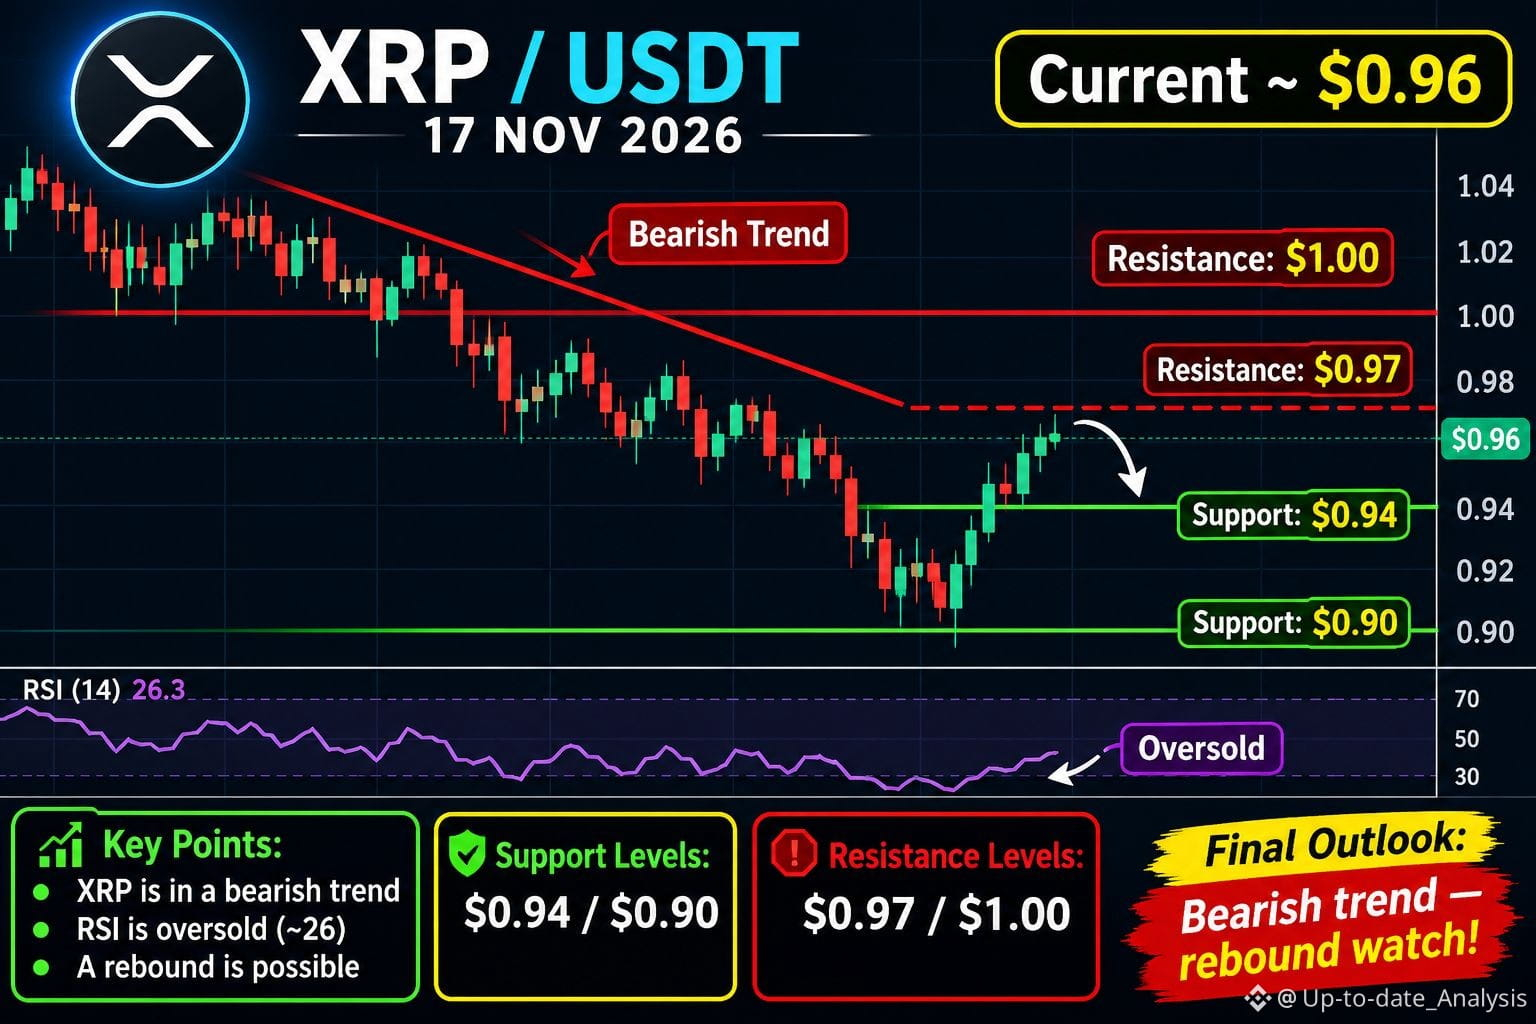
🚀 XRP (RIPPLE) – LATEST MARKET ANALYSIS
📊 Current Price: ~$0.96
🔴 Market Trend: Bearish, with a possible short-term recovery.
📉 Support Levels: $0.94 – $0.92 – $0.90
📈 Resistance Levels: $0.97 – $0.99 – $1.00
🔥 Bullish Signal: A strong breakout above $1.00 could trigger upward momentum.
⚠️ Bearish Signal: A breakdown below $0.92 may lead to further downside.
💡 Market Outlook: XRP is showing oversold conditions, creating potential for a relief bounce. However, buyers need to reclaim key resistance levels before a bullish reversal can be confirmed.
🎯 Strategy: Watch key support and resistance zones. Wait for candle confirmation before entering.
#XRP #Ripple #CryptoAnalysis #TradingSignals #altcoins
$XRP
🚀 XRP (RIPPLE) – LATEST MARKET ANALYSIS
📊 Current Price: ~$0.96
🔴 Market Trend: Bearish, with a possible short-term recovery.
📉 Support Levels: $0.94 – $0.92 – $0.90
📈 Resistance Levels: $0.97 – $0.99 – $1.00
🔥 Bullish Signal: A strong breakout above $1.00 could trigger upward momentum.
⚠️ Bearish Signal: A breakdown below $0.92 may lead to further downside.
💡 Market Outlook: XRP is showing oversold conditions, creating potential for a relief bounce. However, buyers need to reclaim key resistance levels before a bullish reversal can be confirmed.
🎯 Strategy: Watch key support and resistance zones. Wait for candle confirmation before entering.
#XRP #Ripple #CryptoAnalysis #TradingSignals #altcoins
🚀 XRP (RIPPLE) – LATEST MARKET ANALYSIS
📊 Current Price: ~$0.96
🔴 Market Trend: Bearish, with a possible short-term recovery.
📉 Support Levels: $0.94 – $0.92 – $0.90
📈 Resistance Levels: $0.97 – $0.99 – $1.00
🔥 Bullish Signal: A strong breakout above $1.00 could trigger upward momentum.
⚠️ Bearish Signal: A breakdown below $0.92 may lead to further downside.
💡 Market Outlook: XRP is showing oversold conditions, creating potential for a relief bounce. However, buyers need to reclaim key resistance levels before a bullish reversal can be confirmed.
🎯 Strategy: Watch key support and resistance zones. Wait for candle confirmation before entering.
#XRP #Ripple #CryptoAnalysis #TradingSignals #altcoins
81
$ZEC
{spot}(ZECUSDT)
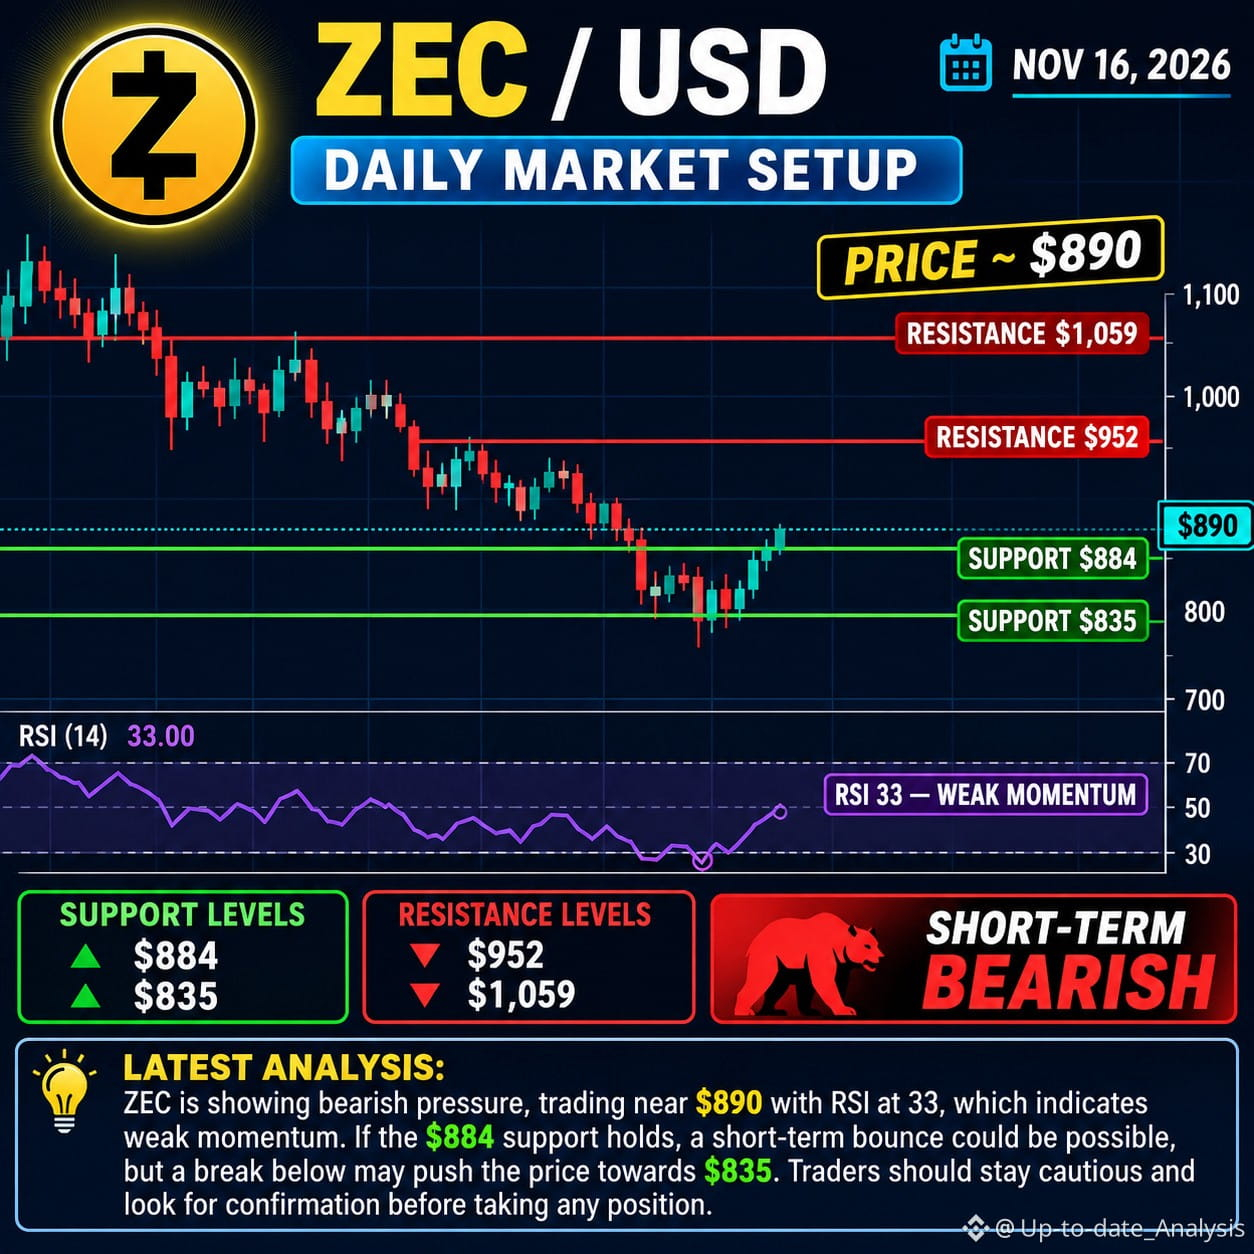
📊 ZCASH (ZEC) – LATEST MARKET ANALYSIS
ZEC is currently facing bearish pressure, trading around $890. Sellers remain in control in the short term, while RSI near 33 indicates weak momentum and a possible relief bounce.
🔹 Current Price: ~$890
🟢 Support: $884 / $835
🔴 Resistance: $952 / $1,059
📈 Bullish Scenario: A strong breakout above $952 could open the door toward $1,059.
📉 Bearish Scenario: A breakdown below $884 may trigger further downside toward $835.
🎯 Market Outlook: Short-term bearish, but oversold conditions could attract buyers. Watch key support and resistance levels before entering a trade.
⚠️ Trade carefully and always use proper risk management
#ZeusInCrypto #zec #ZECUSDT #AnthropicIPOTestsInvestorAppetiteForAI #HuangReportedlyConsidersReturnToNvidia
$ZEC
📊 ZCASH (ZEC) – LATEST MARKET ANALYSIS
ZEC is currently facing bearish pressure, trading around $890. Sellers remain in control in the short term, while RSI near 33 indicates weak momentum and a possible relief bounce.
🔹 Current Price: ~$890
🟢 Support: $884 / $835
🔴 Resistance: $952 / $1,059
📈 Bullish Scenario: A strong breakout above $952 could open the door toward $1,059.
📉 Bearish Scenario: A breakdown below $884 may trigger further downside toward $835.
🎯 Market Outlook: Short-term bearish, but oversold conditions could attract buyers. Watch key support and resistance levels before entering a trade.
⚠️ Trade carefully and always use proper risk management
#ZeusInCrypto #zec #ZECUSDT #AnthropicIPOTestsInvestorAppetiteForAI #HuangReportedlyConsidersReturnToNvidia
📊 ZCASH (ZEC) – LATEST MARKET ANALYSIS
ZEC is currently facing bearish pressure, trading around $890. Sellers remain in control in the short term, while RSI near 33 indicates weak momentum and a possible relief bounce.
🔹 Current Price: ~$890
🟢 Support: $884 / $835
🔴 Resistance: $952 / $1,059
📈 Bullish Scenario: A strong breakout above $952 could open the door toward $1,059.
📉 Bearish Scenario: A breakdown below $884 may trigger further downside toward $835.
🎯 Market Outlook: Short-term bearish, but oversold conditions could attract buyers. Watch key support and resistance levels before entering a trade.
⚠️ Trade carefully and always use proper risk management
#ZeusInCrypto #zec #ZECUSDT #AnthropicIPOTestsInvestorAppetiteForAI #HuangReportedlyConsidersReturnToNvidia
1
245
$JCT
{future}(JCTUSDT)
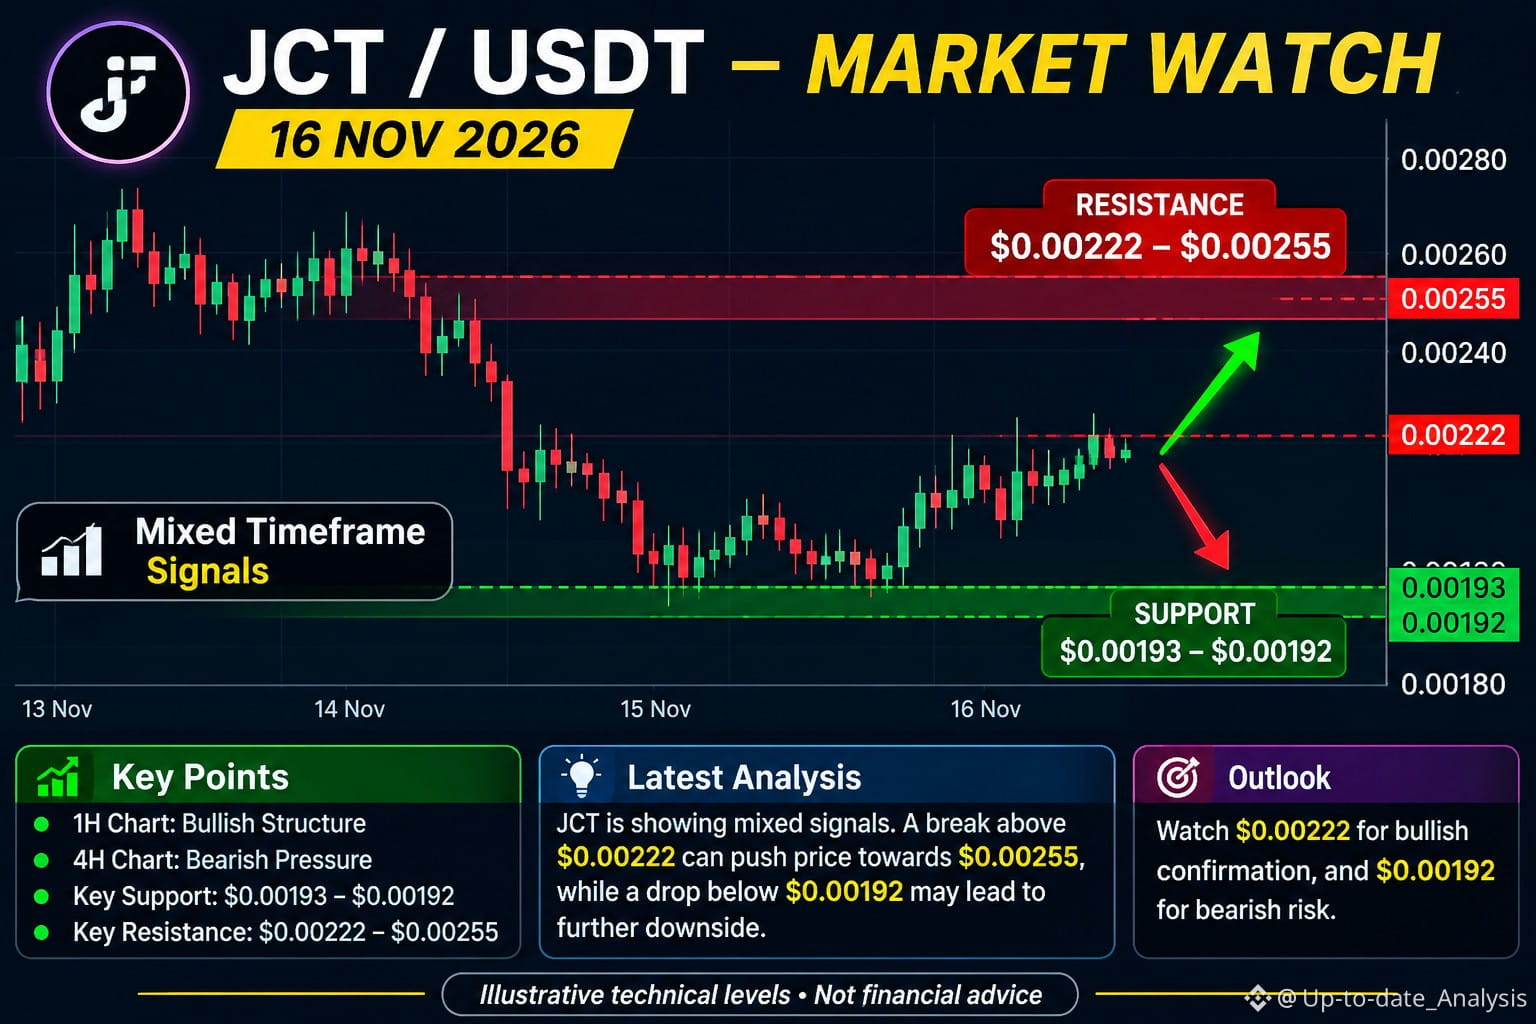
📊 JUNCTION (JCT) – LATEST MARKET ANALYSIS
JCT is showing signs of a short-term recovery after recent selling pressure. The 1-hour trend is bullish, while the 4-hour chart remains bearish, indicating mixed market sentiment.
🔹 Support: $0.00193 – $0.00192
🔹 Resistance: $0.00222 – $0.00255
🔹 Bullish Scenario: A strong breakout above $0.00255 could strengthen buying momentum.
🔹 Bearish Scenario: Losing $0.00192 may trigger another downside move.
Market Outlook: Cautiously bullish in the short term, but confirmation through volume and a resistance breakout is important.
⚡ Watch the key levels and manage risk carefully.
#JCT #CryptoAnalysis #TechnicalAnalysis #altcoins #AnthropicIPOTestsInvestorAppetiteForAI
$JCT
📊 JUNCTION (JCT) – LATEST MARKET ANALYSIS
JCT is showing signs of a short-term recovery after recent selling pressure. The 1-hour trend is bullish, while the 4-hour chart remains bearish, indicating mixed market sentiment.
🔹 Support: $0.00193 – $0.00192
🔹 Resistance: $0.00222 – $0.00255
🔹 Bullish Scenario: A strong breakout above $0.00255 could strengthen buying momentum.
🔹 Bearish Scenario: Losing $0.00192 may trigger another downside move.
Market Outlook: Cautiously bullish in the short term, but confirmation through volume and a resistance breakout is important.
⚡ Watch the key levels and manage risk carefully.
#JCT #CryptoAnalysis #TechnicalAnalysis #altcoins #AnthropicIPOTestsInvestorAppetiteForAI
📊 JUNCTION (JCT) – LATEST MARKET ANALYSIS
JCT is showing signs of a short-term recovery after recent selling pressure. The 1-hour trend is bullish, while the 4-hour chart remains bearish, indicating mixed market sentiment.
🔹 Support: $0.00193 – $0.00192
🔹 Resistance: $0.00222 – $0.00255
🔹 Bullish Scenario: A strong breakout above $0.00255 could strengthen buying momentum.
🔹 Bearish Scenario: Losing $0.00192 may trigger another downside move.
Market Outlook: Cautiously bullish in the short term, but confirmation through volume and a resistance breakout is important.
⚡ Watch the key levels and manage risk carefully.
#JCT #CryptoAnalysis #TechnicalAnalysis #altcoins #AnthropicIPOTestsInvestorAppetiteForAI
1
662
$INIT
{spot}(INITUSDT)
🚨🔥 INIT EXPLODES HIGHER — CAN THE BULLISH MOMENTUM LAST?
📊 $INIT (Initia) has experienced a sharp rally, attracting attention across the crypto market. However, recent security incidents have increased uncertainty and volatility.
🟢 Bullish Signal: Sustained buying volume and a confirmed breakout could extend the recovery.
🔴 Bearish Risk: Further security concerns or profit-taking could trigger a sharp correction.
👀 Key Focus: Watch recovery strength, trading volume, and official security updates.
💬 Can INIT recover its momentum, or are bears preparing another move?
#INIT #Initia #CryptoAnalysis #Altcoins #BinanceSquare
$INIT
🚨🔥 INIT EXPLODES HIGHER — CAN THE BULLISH MOMENTUM LAST?
📊 $INIT (Initia) has experienced a sharp rally, attracting attention across the crypto market. However, recent security incidents have increased uncertainty and volatility.
🟢 Bullish Signal: Sustained buying volume and a confirmed breakout could extend the recovery.
🔴 Bearish Risk: Further security concerns or profit-taking could trigger a sharp correction.
👀 Key Focus: Watch recovery strength, trading volume, and official security updates.
💬 Can INIT recover its momentum, or are bears preparing another move?
#INIT #Initia #CryptoAnalysis #Altcoins #BinanceSquare
🚨🔥 INIT EXPLODES HIGHER — CAN THE BULLISH MOMENTUM LAST?
📊 $INIT (Initia) has experienced a sharp rally, attracting attention across the crypto market. However, recent security incidents have increased uncertainty and volatility.
🟢 Bullish Signal: Sustained buying volume and a confirmed breakout could extend the recovery.
🔴 Bearish Risk: Further security concerns or profit-taking could trigger a sharp correction.
👀 Key Focus: Watch recovery strength, trading volume, and official security updates.
💬 Can INIT recover its momentum, or are bears preparing another move?
#INIT #Initia #CryptoAnalysis #Altcoins #BinanceSquare

494
$BNB
{spot}(BNBUSDT)
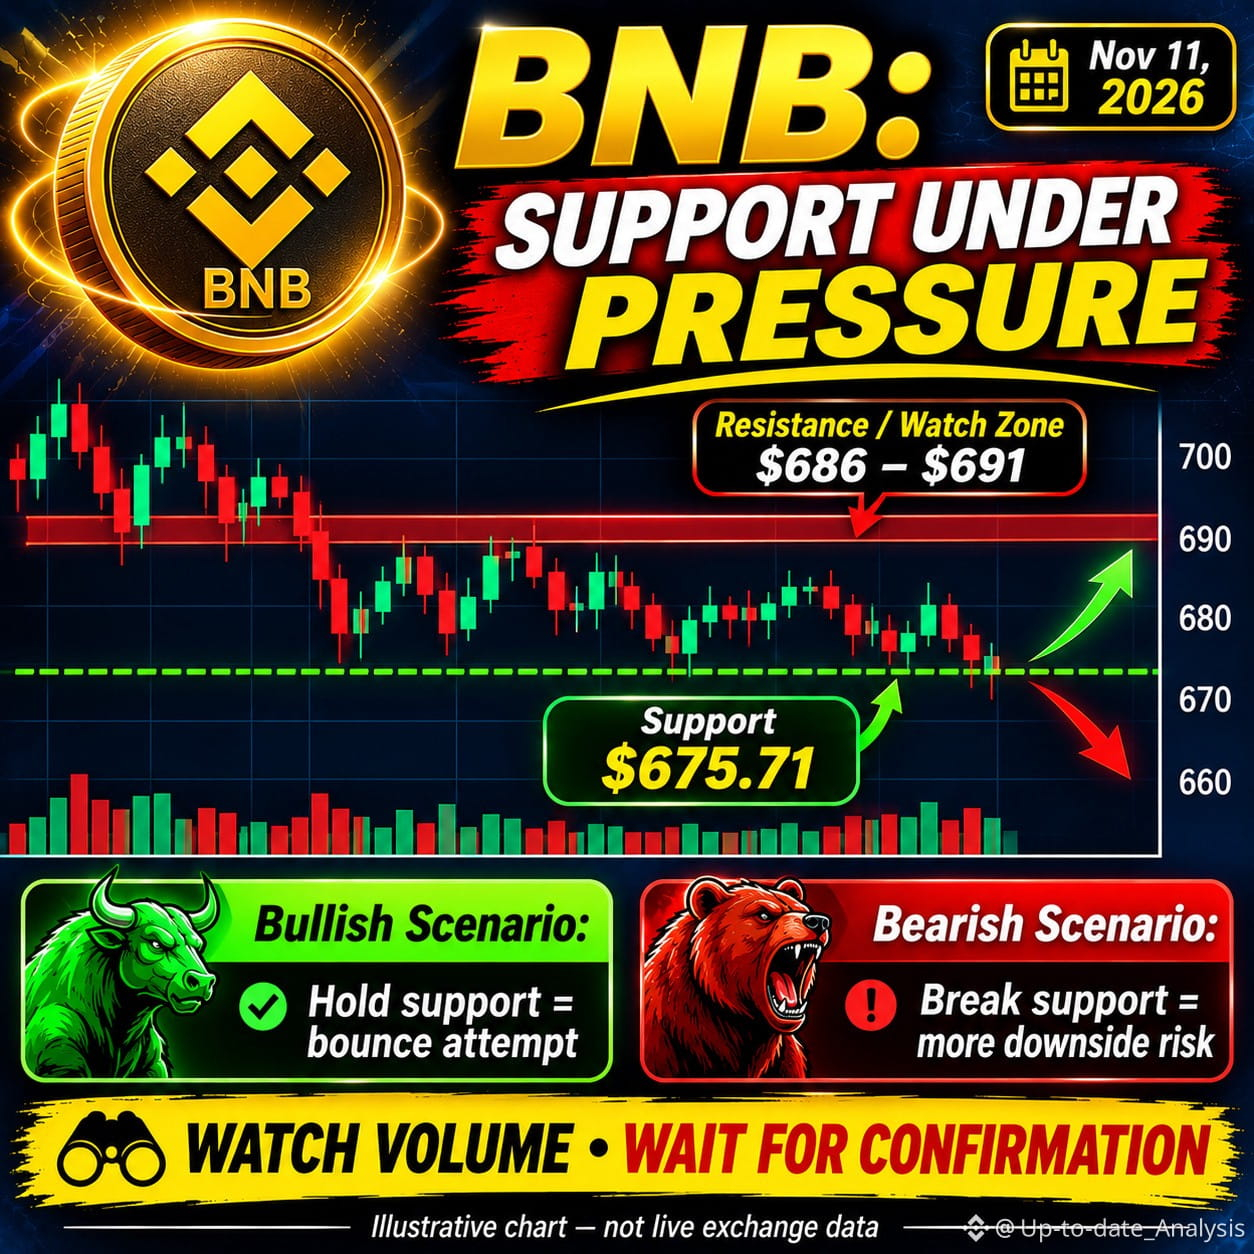
🚨🔥 BNB AT A CRITICAL LEVEL — IS A NEW RALLY COMING?
💎 $BNB is attracting traders' attention as the market watches for a fresh breakout. The next move depends on buying pressure, trading volume, and whether bulls can defend support.
🟢 Bullish Signal: A confirmed breakout with strong volume could fuel further upside.
🔴 Bearish Signal: Losing key support may trigger another wave of selling.
📊 Key Focus: Watch resistance, support, and volume confirmation before entering.
🔥 THE BIG QUESTION: Can BNB lead the next crypto rally?
💬 Bullish or bearish? Share your prediction! 👇
#BNB #BinanceCoin #CryptoAnalysis #Altcoins #BinanceSquare
$BNB
🚨🔥 BNB AT A CRITICAL LEVEL — IS A NEW RALLY COMING?
💎 $BNB is attracting traders' attention as the market watches for a fresh breakout. The next move depends on buying pressure, trading volume, and whether bulls can defend support.
🟢 Bullish Signal: A confirmed breakout with strong volume could fuel further upside.
🔴 Bearish Signal: Losing key support may trigger another wave of selling.
📊 Key Focus: Watch resistance, support, and volume confirmation before entering.
🔥 THE BIG QUESTION: Can BNB lead the next crypto rally?
💬 Bullish or bearish? Share your prediction! 👇
#BNB #BinanceCoin #CryptoAnalysis #Altcoins #BinanceSquare
🚨🔥 BNB AT A CRITICAL LEVEL — IS A NEW RALLY COMING?
💎 $BNB is attracting traders' attention as the market watches for a fresh breakout. The next move depends on buying pressure, trading volume, and whether bulls can defend support.
🟢 Bullish Signal: A confirmed breakout with strong volume could fuel further upside.
🔴 Bearish Signal: Losing key support may trigger another wave of selling.
📊 Key Focus: Watch resistance, support, and volume confirmation before entering.
🔥 THE BIG QUESTION: Can BNB lead the next crypto rally?
💬 Bullish or bearish? Share your prediction! 👇
#BNB #BinanceCoin #CryptoAnalysis #Altcoins #BinanceSquare
23
Verified
$SNDK
{future}(SNDKUSDT)
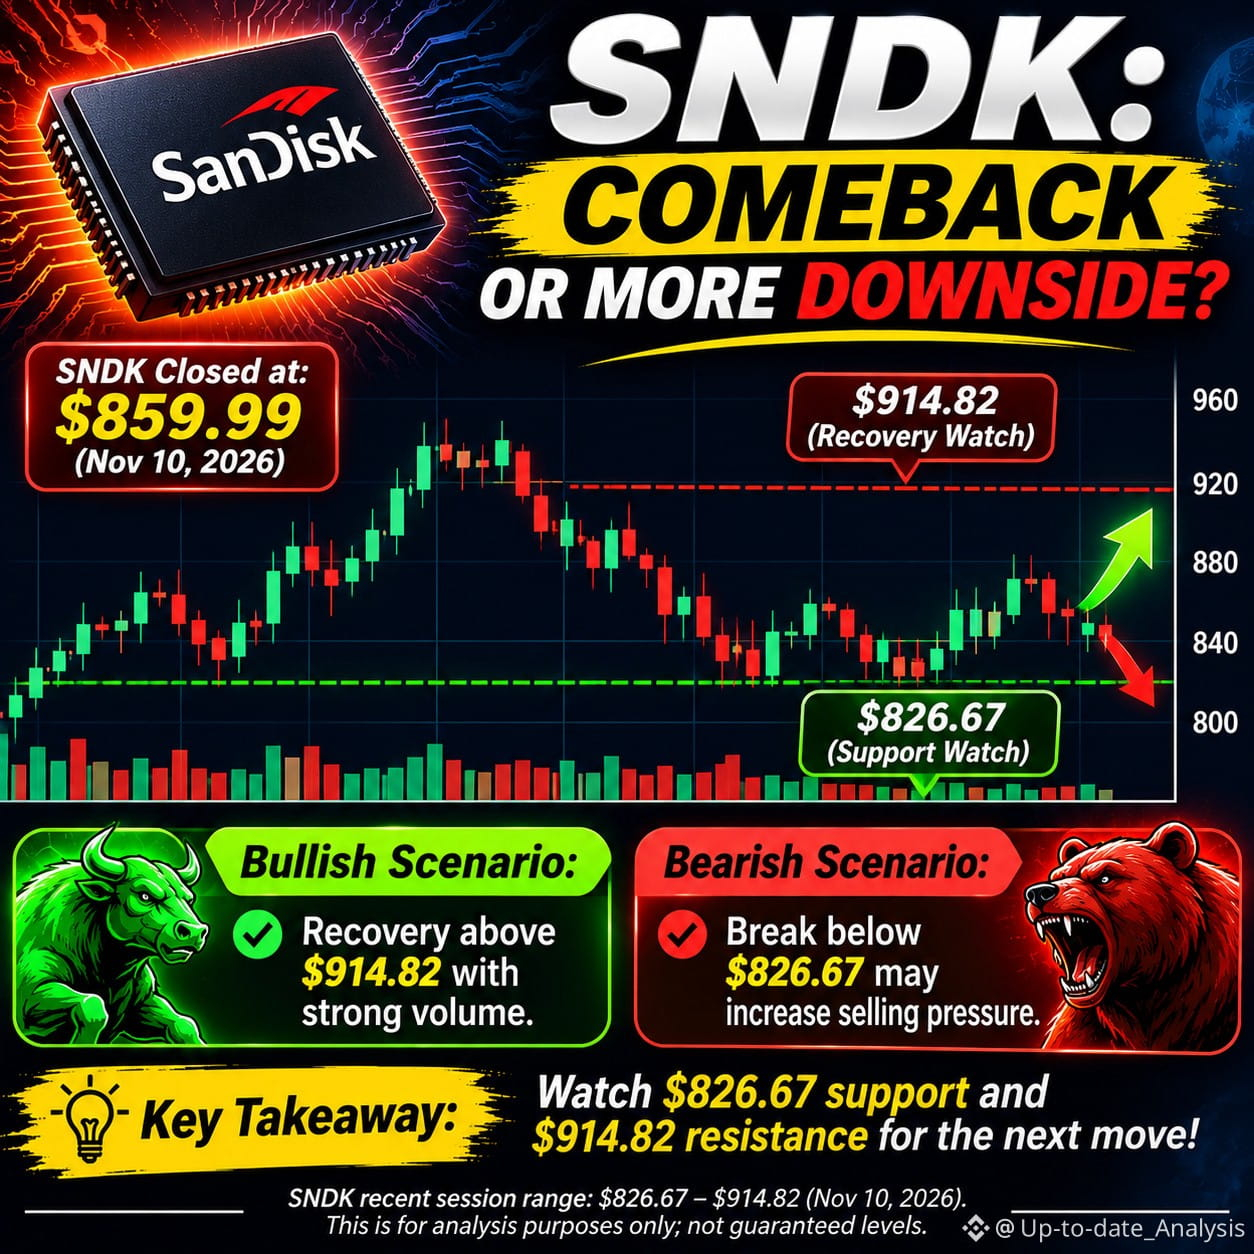
🚨🔥 SNDK: BIG OPPORTUNITY OR WARNING SIGN?
📊 $SNDK (SanDisk) is facing a critical technical battle after recent heavy selling. The stock closed near $859.99 on November 10, with traders watching for signs of recovery.
🟢 Bullish Signal: A recovery above $914.82 with strong volume could improve momentum.
🔴 Bearish Signal: A break below $826.67 could bring further selling pressure.
👀 What to Watch: Buying volume, support defense, and a confirmed trend reversal.
💬 Is SNDK ready for a comeback, or is more downside coming?
#SNDK #SanDisk #StockMarket #TechStocks #MarketAnalysis
$SNDK
🚨🔥 SNDK: BIG OPPORTUNITY OR WARNING SIGN?
📊 $SNDK (SanDisk) is facing a critical technical battle after recent heavy selling. The stock closed near $859.99 on November 10, with traders watching for signs of recovery.
🟢 Bullish Signal: A recovery above $914.82 with strong volume could improve momentum.
🔴 Bearish Signal: A break below $826.67 could bring further selling pressure.
👀 What to Watch: Buying volume, support defense, and a confirmed trend reversal.
💬 Is SNDK ready for a comeback, or is more downside coming?
#SNDK #SanDisk #StockMarket #TechStocks #MarketAnalysis
🚨🔥 SNDK: BIG OPPORTUNITY OR WARNING SIGN?
📊 $SNDK (SanDisk) is facing a critical technical battle after recent heavy selling. The stock closed near $859.99 on November 10, with traders watching for signs of recovery.
🟢 Bullish Signal: A recovery above $914.82 with strong volume could improve momentum.
🔴 Bearish Signal: A break below $826.67 could bring further selling pressure.
👀 What to Watch: Buying volume, support defense, and a confirmed trend reversal.
💬 Is SNDK ready for a comeback, or is more downside coming?
#SNDK #SanDisk #StockMarket #TechStocks #MarketAnalysis
859
$AGT
{future}(AGTUSDT)
🚨 AGT IS MAKING A STRONG MOVE — CAN BULLS KEEP THE MOMENTUM?
📊 $AGT is attracting attention after a sharp 24-hour rally. Traders are watching whether buyers can sustain the momentum or whether profit-taking will trigger a pullback.
🟢 Bullish Signal: Continued buying volume and higher highs could support further upside.
🔴 Bearish Signal: Losing momentum may bring short-term selling pressure.
👀 Key Focus: Watch volume, support and confirmation before entering a trade.
💬 Is AGT preparing for another rally or a healthy correction? What's your prediction?
#AGT #AlayaAI #CryptoAnalysis #altcoins #BinanceSquare
$AGT
🚨 AGT IS MAKING A STRONG MOVE — CAN BULLS KEEP THE MOMENTUM?
📊 $AGT is attracting attention after a sharp 24-hour rally. Traders are watching whether buyers can sustain the momentum or whether profit-taking will trigger a pullback.
🟢 Bullish Signal: Continued buying volume and higher highs could support further upside.
🔴 Bearish Signal: Losing momentum may bring short-term selling pressure.
👀 Key Focus: Watch volume, support and confirmation before entering a trade.
💬 Is AGT preparing for another rally or a healthy correction? What's your prediction?
#AGT #AlayaAI #CryptoAnalysis #altcoins #BinanceSquare
🚨 AGT IS MAKING A STRONG MOVE — CAN BULLS KEEP THE MOMENTUM?
📊 $AGT is attracting attention after a sharp 24-hour rally. Traders are watching whether buyers can sustain the momentum or whether profit-taking will trigger a pullback.
🟢 Bullish Signal: Continued buying volume and higher highs could support further upside.
🔴 Bearish Signal: Losing momentum may bring short-term selling pressure.
👀 Key Focus: Watch volume, support and confirmation before entering a trade.
💬 Is AGT preparing for another rally or a healthy correction? What's your prediction?
#AGT #AlayaAI #CryptoAnalysis #altcoins #BinanceSquare

262
$BTC
{spot}(BTCUSDT)
🚨🔥 BITCOIN AT A CRITICAL TURNING POINT — BREAKOUT OR MORE DOWNSIDE?
₿ $BTC is trading near $73,600 as selling pressure keeps the market on edge.
🔴 Bearish Scenario: A breakdown below $72,689 could expose BTC to further downside.
🟢 Bullish Scenario: Reclaiming $74,000–$75,100 with strong volume could support a recovery.
📊 Key Levels:
- Support: $72,689
- Resistance: $74,000–$75,100
🔥 THE BIG QUESTION: Are Bitcoin bulls preparing a comeback, or will bears push prices lower?
Drop your prediction below! 👇
#Bitcoin #BTC #CryptoAnalysis #BitcoinNews #BinanceSquare
$BTC
🚨🔥 BITCOIN AT A CRITICAL TURNING POINT — BREAKOUT OR MORE DOWNSIDE?
₿ $BTC is trading near $73,600 as selling pressure keeps the market on edge.
🔴 Bearish Scenario: A breakdown below $72,689 could expose BTC to further downside.
🟢 Bullish Scenario: Reclaiming $74,000–$75,100 with strong volume could support a recovery.
📊 Key Levels:
- Support: $72,689
- Resistance: $74,000–$75,100
🔥 THE BIG QUESTION: Are Bitcoin bulls preparing a comeback, or will bears push prices lower?
Drop your prediction below! 👇
#Bitcoin #BTC #CryptoAnalysis #BitcoinNews #BinanceSquare
🚨🔥 BITCOIN AT A CRITICAL TURNING POINT — BREAKOUT OR MORE DOWNSIDE?
₿ $BTC is trading near $73,600 as selling pressure keeps the market on edge.
🔴 Bearish Scenario: A breakdown below $72,689 could expose BTC to further downside.
🟢 Bullish Scenario: Reclaiming $74,000–$75,100 with strong volume could support a recovery.
📊 Key Levels:
- Support: $72,689
- Resistance: $74,000–$75,100
🔥 THE BIG QUESTION: Are Bitcoin bulls preparing a comeback, or will bears push prices lower?
Drop your prediction below! 👇
#Bitcoin #BTC #CryptoAnalysis #BitcoinNews #BinanceSquare

62
$ANTHROPIC
{future}(ANTHROPICUSDT)
🚀 ANTHROPIC (ANT): THE AI IPO EVERYONE IS WATCHING! 📊
Anthropic, the company behind Claude AI, is preparing for a major Nasdaq debut under ticker $ANT.
🔥 Bullish Factors:
- Growing demand for advanced AI technology.
- Strong interest from major technology investors.
- Proposed IPO price range: $70–$78 per share.
⚠️ Key Risk: A high valuation and massive AI infrastructure costs could create volatility.
📈 What’s Next? Investors are watching the expected November 19 listing.
💬 Will $ANT become one of the biggest AI market stories of 2026? Share your prediction!
#Anthropic #ClaudeAI #ArtificialIntelligence #IPO #ANT
$ANTHROPIC
🚀 ANTHROPIC (ANT): THE AI IPO EVERYONE IS WATCHING! 📊
Anthropic, the company behind Claude AI, is preparing for a major Nasdaq debut under ticker $ANT.
🔥 Bullish Factors:
- Growing demand for advanced AI technology.
- Strong interest from major technology investors.
- Proposed IPO price range: $70–$78 per share.
⚠️ Key Risk: A high valuation and massive AI infrastructure costs could create volatility.
📈 What’s Next? Investors are watching the expected November 19 listing.
💬 Will $ANT become one of the biggest AI market stories of 2026? Share your prediction!
#Anthropic #ClaudeAI #ArtificialIntelligence #IPO #ANT
🚀 ANTHROPIC (ANT): THE AI IPO EVERYONE IS WATCHING! 📊
Anthropic, the company behind Claude AI, is preparing for a major Nasdaq debut under ticker $ANT.
🔥 Bullish Factors:
- Growing demand for advanced AI technology.
- Strong interest from major technology investors.
- Proposed IPO price range: $70–$78 per share.
⚠️ Key Risk: A high valuation and massive AI infrastructure costs could create volatility.
📈 What’s Next? Investors are watching the expected November 19 listing.
💬 Will $ANT become one of the biggest AI market stories of 2026? Share your prediction!
#Anthropic #ClaudeAI #ArtificialIntelligence #IPO #ANT

137
$XRP
{spot}(XRPUSDT)
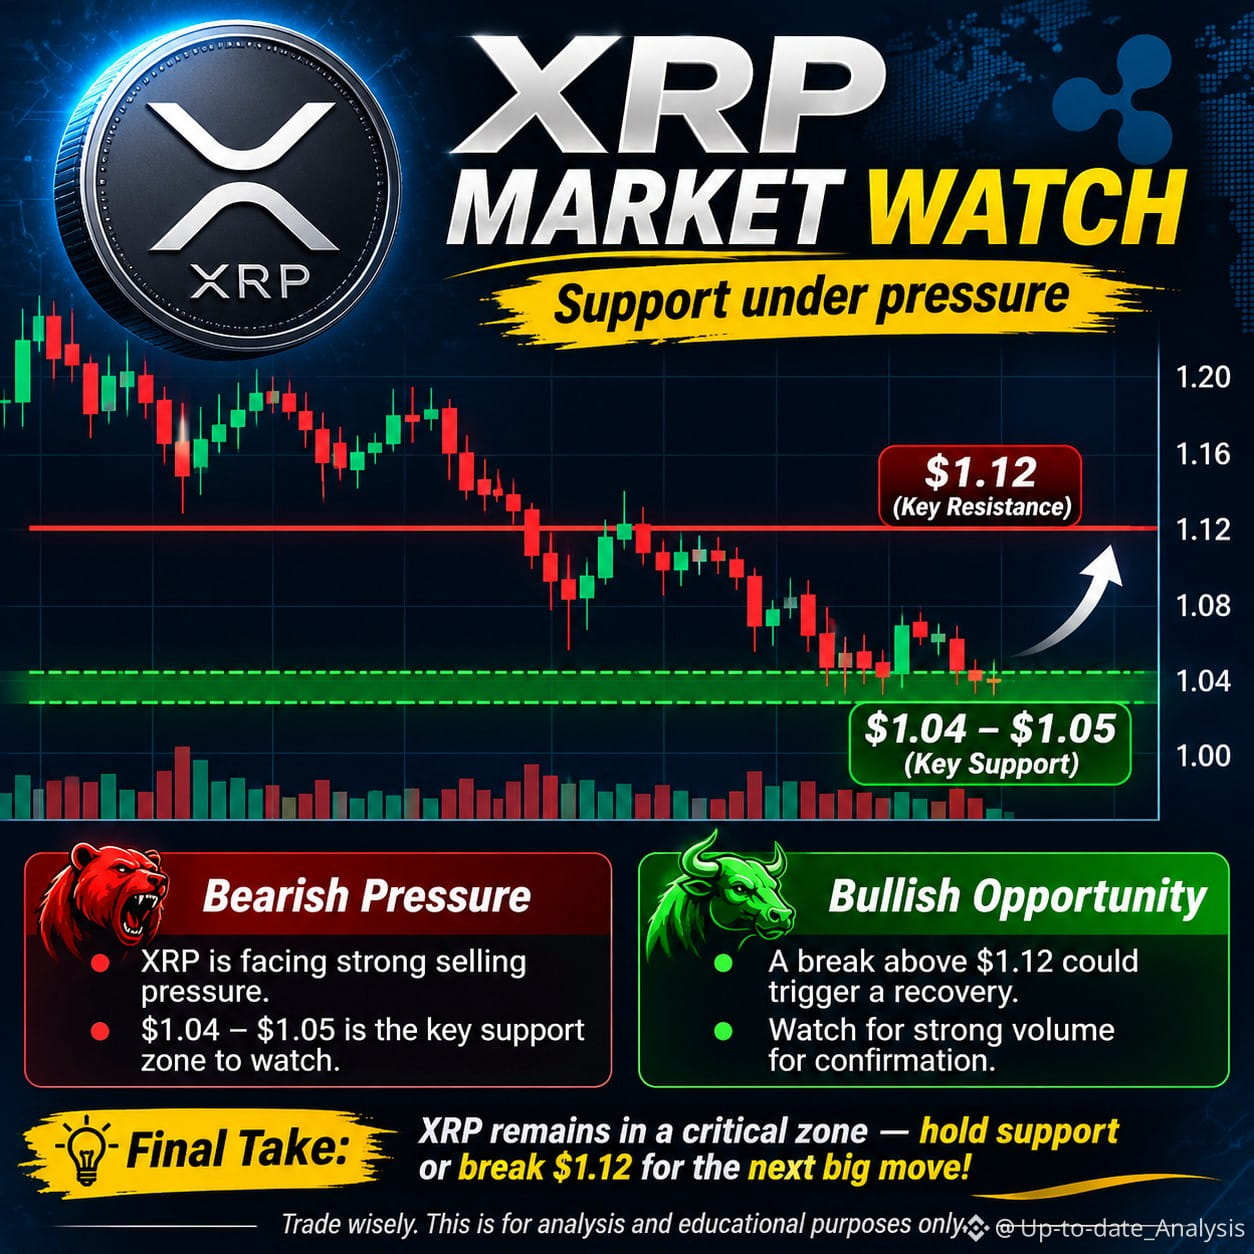
🚨 XRP: CAN BUYERS STOP THE SELL-OFF? 📉
$XRP is facing strong selling pressure, with traders watching the critical $1.04–$1.05 support zone.
🔴 Bearish Signal: A breakdown below support could open the door to further downside.
🟢 Bullish Signal: A strong recovery above $1.12 with rising volume could signal a potential rebound.
📊 Key Levels to Watch:
- Support: $1.04–$1.05
- Resistance: $1.12
🔥 The Big Question: Will XRP bulls defend support or will sellers take control?
Share your thoughts below! 👇
#XRP #Ripple #CryptoAnalysis #BinanceSquare #altcoins
$XRP
🚨 XRP: CAN BUYERS STOP THE SELL-OFF? 📉
$XRP is facing strong selling pressure, with traders watching the critical $1.04–$1.05 support zone.
🔴 Bearish Signal: A breakdown below support could open the door to further downside.
🟢 Bullish Signal: A strong recovery above $1.12 with rising volume could signal a potential rebound.
📊 Key Levels to Watch:
- Support: $1.04–$1.05
- Resistance: $1.12
🔥 The Big Question: Will XRP bulls defend support or will sellers take control?
Share your thoughts below! 👇
#XRP #Ripple #CryptoAnalysis #BinanceSquare #altcoins
🚨 XRP: CAN BUYERS STOP THE SELL-OFF? 📉
$XRP is facing strong selling pressure, with traders watching the critical $1.04–$1.05 support zone.
🔴 Bearish Signal: A breakdown below support could open the door to further downside.
🟢 Bullish Signal: A strong recovery above $1.12 with rising volume could signal a potential rebound.
📊 Key Levels to Watch:
- Support: $1.04–$1.05
- Resistance: $1.12
🔥 The Big Question: Will XRP bulls defend support or will sellers take control?
Share your thoughts below! 👇
#XRP #Ripple #CryptoAnalysis #BinanceSquare #altcoins
155
$ARIA
{future}(ARIAUSDT)
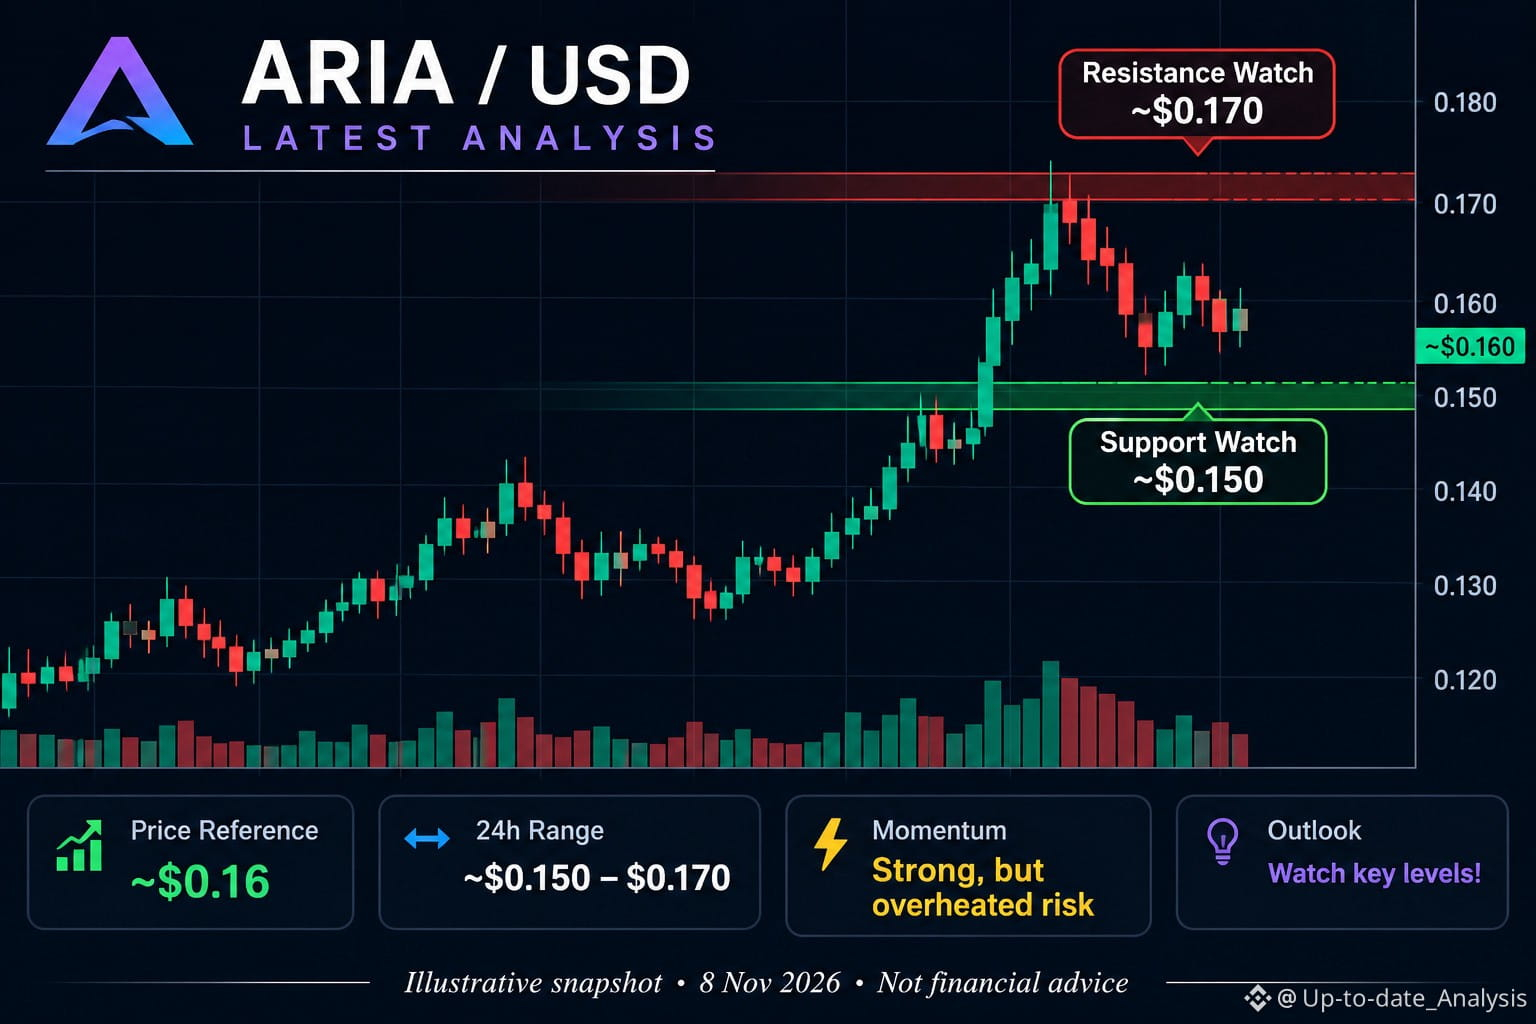
🚀 ARIA (ARIAAI) – LATEST CRYPTO ANALYSIS 🚀
📊 Current Price: $0.1566
🟢 Market Trend: Bullish Momentum
ARIA is maintaining strong upward momentum after an impressive rally. Buyers are defending key support, but increased volatility and profit-taking could lead to a short-term pullback.
🎯 Resistance: $0.1699
🟢 Support: $0.1503
📉 Major Support: $0.1441
Bullish Scenario: A breakout above $0.1699 could open the way toward $0.1800.
Bearish Scenario: A drop below $0.1503 may trigger a correction toward $0.1441.
⚡ Final Outlook: ARIA remains bullish, but confirmation above resistance is important before expecting another major move.
#ARIA #CryptoAnalysis #altcoins #TradingSignals #TechnicalAnalysis
$ARIA
🚀 ARIA (ARIAAI) – LATEST CRYPTO ANALYSIS 🚀
📊 Current Price: $0.1566
🟢 Market Trend: Bullish Momentum
ARIA is maintaining strong upward momentum after an impressive rally. Buyers are defending key support, but increased volatility and profit-taking could lead to a short-term pullback.
🎯 Resistance: $0.1699
🟢 Support: $0.1503
📉 Major Support: $0.1441
Bullish Scenario: A breakout above $0.1699 could open the way toward $0.1800.
Bearish Scenario: A drop below $0.1503 may trigger a correction toward $0.1441.
⚡ Final Outlook: ARIA remains bullish, but confirmation above resistance is important before expecting another major move.
#ARIA #CryptoAnalysis #altcoins #TradingSignals #TechnicalAnalysis
🚀 ARIA (ARIAAI) – LATEST CRYPTO ANALYSIS 🚀
📊 Current Price: $0.1566
🟢 Market Trend: Bullish Momentum
ARIA is maintaining strong upward momentum after an impressive rally. Buyers are defending key support, but increased volatility and profit-taking could lead to a short-term pullback.
🎯 Resistance: $0.1699
🟢 Support: $0.1503
📉 Major Support: $0.1441
Bullish Scenario: A breakout above $0.1699 could open the way toward $0.1800.
Bearish Scenario: A drop below $0.1503 may trigger a correction toward $0.1441.
⚡ Final Outlook: ARIA remains bullish, but confirmation above resistance is important before expecting another major move.
#ARIA #CryptoAnalysis #altcoins #TradingSignals #TechnicalAnalysis
542
$SNDK
{future}(SNDKUSDT)
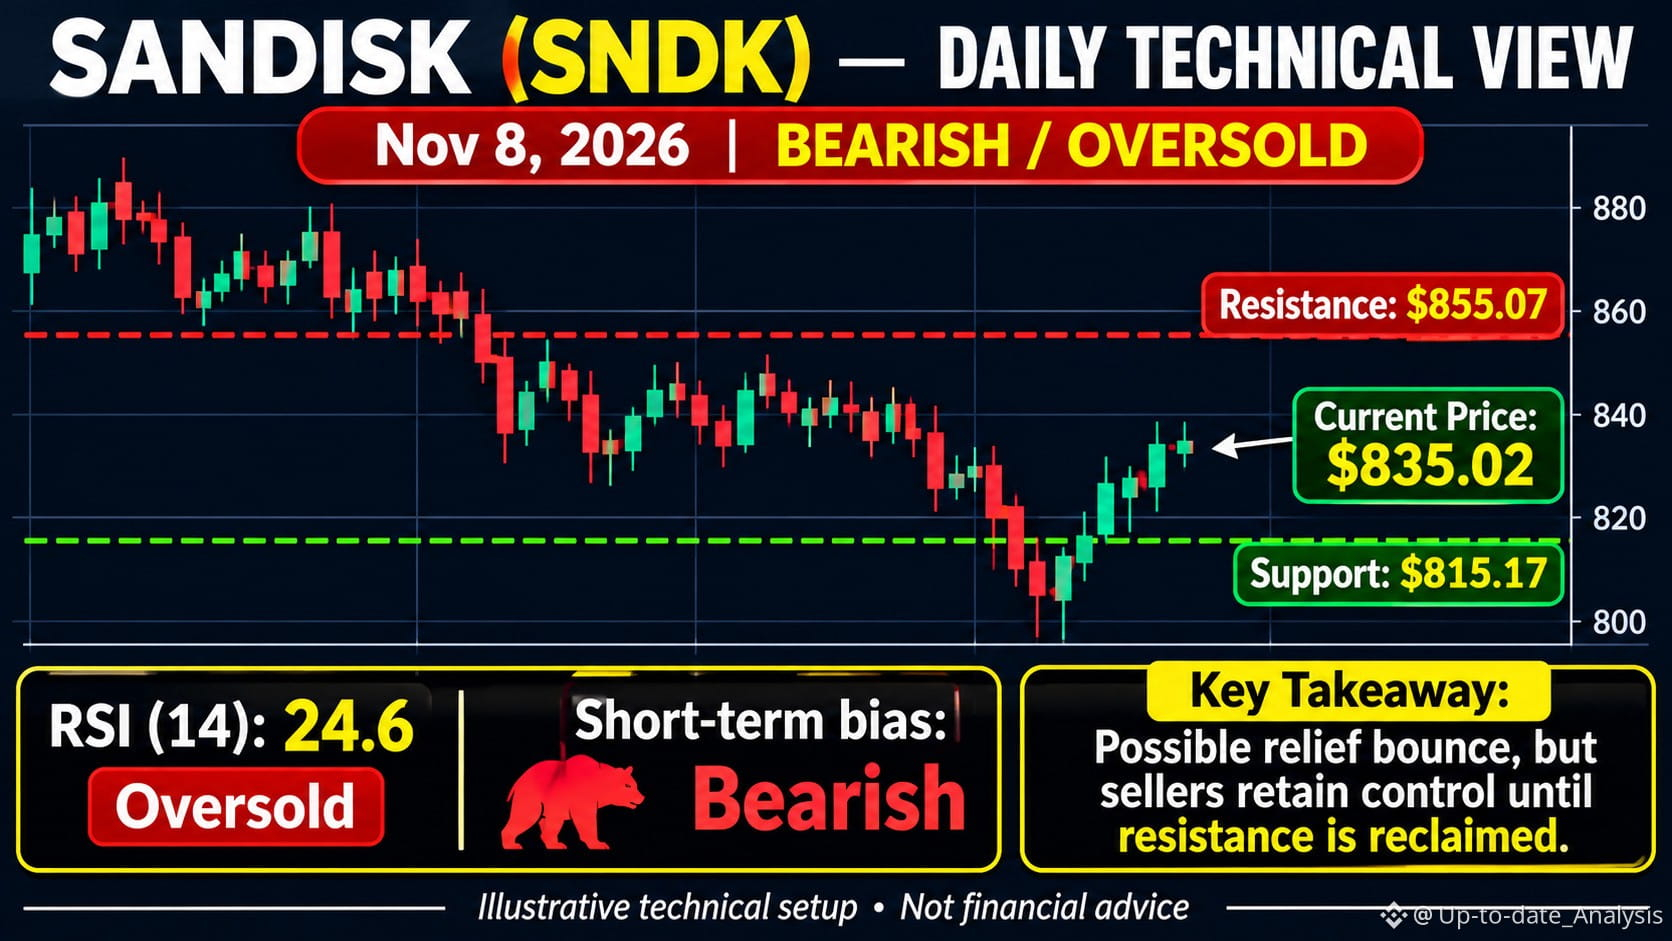
🚀 SANDISK (NASDAQ: SNDK) – LATEST MARKET ANALYSIS 🚀
📊 Current Indicative Price: $835.02
📉 Technical Outlook: Bearish
SNDK is showing high volatility after a sharp market sell-off, with a short-term recovery attempt. RSI near 24.6 indicates oversold conditions, suggesting a possible relief bounce, but sellers still have the technical advantage.
🔴 Resistance: $855.07
🟢 Support: $815.17
Bullish Scenario: A breakout above $855.07 could support a recovery.
Bearish Scenario: A breakdown below $815.17 may trigger further downside.
⚡ Final Verdict: Watch for confirmation around key levels. A sustained breakout is needed to strengthen the bullish outlook.
#SNDK #SanDisk #CPITestsDecemberRateOutlook #TechnicalAnalysis #trading
$SNDK
🚀 SANDISK (NASDAQ: SNDK) – LATEST MARKET ANALYSIS 🚀
📊 Current Indicative Price: $835.02
📉 Technical Outlook: Bearish
SNDK is showing high volatility after a sharp market sell-off, with a short-term recovery attempt. RSI near 24.6 indicates oversold conditions, suggesting a possible relief bounce, but sellers still have the technical advantage.
🔴 Resistance: $855.07
🟢 Support: $815.17
Bullish Scenario: A breakout above $855.07 could support a recovery.
Bearish Scenario: A breakdown below $815.17 may trigger further downside.
⚡ Final Verdict: Watch for confirmation around key levels. A sustained breakout is needed to strengthen the bullish outlook.
#SNDK #SanDisk #CPITestsDecemberRateOutlook #TechnicalAnalysis #trading
🚀 SANDISK (NASDAQ: SNDK) – LATEST MARKET ANALYSIS 🚀
📊 Current Indicative Price: $835.02
📉 Technical Outlook: Bearish
SNDK is showing high volatility after a sharp market sell-off, with a short-term recovery attempt. RSI near 24.6 indicates oversold conditions, suggesting a possible relief bounce, but sellers still have the technical advantage.
🔴 Resistance: $855.07
🟢 Support: $815.17
Bullish Scenario: A breakout above $855.07 could support a recovery.
Bearish Scenario: A breakdown below $815.17 may trigger further downside.
⚡ Final Verdict: Watch for confirmation around key levels. A sustained breakout is needed to strengthen the bullish outlook.
#SNDK #SanDisk #CPITestsDecemberRateOutlook #TechnicalAnalysis #trading
423
Log in to explore more content
Join global crypto users on Binance Square
⚡️ Get latest and useful information about crypto.
💬 Trusted by the world’s largest crypto exchange.
👍 Discover real insights from verified creators.
Email / Phone number
Trending Topics
MoreHikesExpectedIsBTCUnderPressure
360 views
25 Discussing
FOMC Minutes | Fed Minutes Show Almost All Officials Expect More Rate Hikes, With Some Open to a Larger December Move
Binance News
·8 Likes
·7k views
NvidiaBeatsEstimatesWith$130BQ4Outlook
63,267 views
287 Discussing
AnthropicIPOPriceCouldExceed$80
63,963 views
241 Discussing