

Morpheus07
50 Posts
Morpheus07
Report
Block User
Occasional Trader
8.8 Years
5 Following
16 Followers
44 Liked
Posts
·
--
Before deciding where I’m putting my money this month, I measured 400 days of daily 24-coin candles. Two passed my filter.
$NEAR: +146% in 30 days and +132% in 90 days, and even so it’s still 16% below the month’s peak. The FDV matches the market cap—meaning there’s no new token flood entering—and Bitwise’s ETF added three days of inflows. In 70% of the months from the last 400 days, it touched +15% within 30 days.
$LINK: +70% in 90 days, RSI at 60, and open interest rising 4.5% over the week. In 61% of the months it reached +10%, with the least pain along the way between the two.
Both are in a pullback within an uptrend—that’s the entry point I’m looking for. Staggered entry, two targets, stop set before buying.
Tap on $NEAR aqui in the text and check the current price.
Which of the two would you look at first?
Before deciding where I’m putting my money this month, I measured 400 days of daily 24-coin candles. Two passed my filter.
$NEAR : +146% in 30 days and +132% in 90 days, and even so it’s still 16% below the month’s peak. The FDV matches the market cap—meaning there’s no new token flood entering—and Bitwise’s ETF added three days of inflows. In 70% of the months from the last 400 days, it touched +15% within 30 days.
$LINK : +70% in 90 days, RSI at 60, and open interest rising 4.5% over the week. In 61% of the months it reached +10%, with the least pain along the way between the two.
Both are in a pullback within an uptrend—that’s the entry point I’m looking for. Staggered entry, two targets, stop set before buying.
Tap on $NEAR aqui in the text and check the current price.
Which of the two would you look at first?
$NEAR : +146% in 30 days and +132% in 90 days, and even so it’s still 16% below the month’s peak. The FDV matches the market cap—meaning there’s no new token flood entering—and Bitwise’s ETF added three days of inflows. In 70% of the months from the last 400 days, it touched +15% within 30 days.
$LINK : +70% in 90 days, RSI at 60, and open interest rising 4.5% over the week. In 61% of the months it reached +10%, with the least pain along the way between the two.
Both are in a pullback within an uptrend—that’s the entry point I’m looking for. Staggered entry, two targets, stop set before buying.
Tap on $NEAR aqui in the text and check the current price.
Which of the two would you look at first?
534
·
--
Spot and Futures do different things. With Spot, you buy the coin and it belongs to you. With Futures, you bet on the price movement, with leverage; and leverage increases both your gains and your losses by the same amount.
Look at the size of the move: the measured volatility of $BTC is 41.7% per year, and SOL is 63.3%. The price moves a lot. With leverage, an oscillation like that can wipe out your position before the price returns.
Most of the newcomers who got hurt didn’t get hurt by buying—they got hurt by leverage. If you’re just starting out, stick to Spot: the coin sits in your account, you can track the move and learn without the risk of losing everything at once.
Tap $BTC here in the text and check the chart. Have you already entered into leverage, or do you only buy on Spot?
Spot and Futures do different things. With Spot, you buy the coin and it belongs to you. With Futures, you bet on the price movement, with leverage; and leverage increases both your gains and your losses by the same amount.
Look at the size of the move: the measured volatility of $BTC is 41.7% per year, and SOL is 63.3%. The price moves a lot. With leverage, an oscillation like that can wipe out your position before the price returns.
Most of the newcomers who got hurt didn’t get hurt by buying—they got hurt by leverage. If you’re just starting out, stick to Spot: the coin sits in your account, you can track the move and learn without the risk of losing everything at once.
Tap $BTC here in the text and check the chart. Have you already entered into leverage, or do you only buy on Spot?
Look at the size of the move: the measured volatility of $BTC is 41.7% per year, and SOL is 63.3%. The price moves a lot. With leverage, an oscillation like that can wipe out your position before the price returns.
Most of the newcomers who got hurt didn’t get hurt by buying—they got hurt by leverage. If you’re just starting out, stick to Spot: the coin sits in your account, you can track the move and learn without the risk of losing everything at once.
Tap $BTC here in the text and check the chart. Have you already entered into leverage, or do you only buy on Spot?

51
·
--
The biggest thief for those just starting out isn’t the market drop—it’s the lack of basic attention. The recovery phrase, the seed, is the key to your house: it’s never typed on a website, form, app, or chat, even if the page looks identical to the official one. If someone asks you to install an app to “unlock” your account, turn it off. It’s a scam.
No one from Binance contacts you via direct message to ask for data, passwords, or installation. A link with a name similar to the official site is a trap. And a promise of fixed returns is the oldest scam there is: when they promise guaranteed profit, you are the product.
Trading outside the app, privately, removes all protection. If the other party disappears, there’s no one to turn to. That’s how most newcomers lose money—more than from a falling market.
Tap $BTC here in the text and see how the official app shows everything inside, without any external link. Have you fallen for a scam or almost fallen for one?
The biggest thief for those just starting out isn’t the market drop—it’s the lack of basic attention. The recovery phrase, the seed, is the key to your house: it’s never typed on a website, form, app, or chat, even if the page looks identical to the official one. If someone asks you to install an app to “unlock” your account, turn it off. It’s a scam.
No one from Binance contacts you via direct message to ask for data, passwords, or installation. A link with a name similar to the official site is a trap. And a promise of fixed returns is the oldest scam there is: when they promise guaranteed profit, you are the product.
Trading outside the app, privately, removes all protection. If the other party disappears, there’s no one to turn to. That’s how most newcomers lose money—more than from a falling market.
Tap $BTC here in the text and see how the official app shows everything inside, without any external link. Have you fallen for a scam or almost fallen for one?
No one from Binance contacts you via direct message to ask for data, passwords, or installation. A link with a name similar to the official site is a trap. And a promise of fixed returns is the oldest scam there is: when they promise guaranteed profit, you are the product.
Trading outside the app, privately, removes all protection. If the other party disappears, there’s no one to turn to. That’s how most newcomers lose money—more than from a falling market.
Tap $BTC here in the text and see how the official app shows everything inside, without any external link. Have you fallen for a scam or almost fallen for one?

1
615
·
--
A chart isn’t a crystal ball—it’s a probability map. To read it without getting lost, I look at two numbers: the 200-day average, which shows the direction, and the RSI, which shows whether the move is stretched.
In $BTC o the price is 18.9% above the long average, which says the uptrend is still in play. But being above it also warns that the coin has already risen a lot. That’s where the RSI comes in—today it’s 76.9. When it goes above 70, the move is stretched. That doesn’t mean it will fall tomorrow, and nobody knows that. It just means that anyone entering now pays a high entry price.
The common mistake is looking only at today’s price and thinking it tells the future. The chart shows what has already happened. The long average filters out the day-to-day noise and reveals the structure. If the price were below it, the trend would be down, and a high RSI would just be a bounce.
With the price above and the RSI elevated, what I do is either wait for a pullback or enter with less. Patience is worth more than rushing at times like this.
Tap $BTC aqui in the text and look at the chart. Do you usually look at the long average before deciding, or do you only look at today’s price?
A chart isn’t a crystal ball—it’s a probability map. To read it without getting lost, I look at two numbers: the 200-day average, which shows the direction, and the RSI, which shows whether the move is stretched.
In $BTC o the price is 18.9% above the long average, which says the uptrend is still in play. But being above it also warns that the coin has already risen a lot. That’s where the RSI comes in—today it’s 76.9. When it goes above 70, the move is stretched. That doesn’t mean it will fall tomorrow, and nobody knows that. It just means that anyone entering now pays a high entry price.
The common mistake is looking only at today’s price and thinking it tells the future. The chart shows what has already happened. The long average filters out the day-to-day noise and reveals the structure. If the price were below it, the trend would be down, and a high RSI would just be a bounce.
With the price above and the RSI elevated, what I do is either wait for a pullback or enter with less. Patience is worth more than rushing at times like this.
Tap $BTC aqui in the text and look at the chart. Do you usually look at the long average before deciding, or do you only look at today’s price?
In $BTC o the price is 18.9% above the long average, which says the uptrend is still in play. But being above it also warns that the coin has already risen a lot. That’s where the RSI comes in—today it’s 76.9. When it goes above 70, the move is stretched. That doesn’t mean it will fall tomorrow, and nobody knows that. It just means that anyone entering now pays a high entry price.
The common mistake is looking only at today’s price and thinking it tells the future. The chart shows what has already happened. The long average filters out the day-to-day noise and reveals the structure. If the price were below it, the trend would be down, and a high RSI would just be a bounce.
With the price above and the RSI elevated, what I do is either wait for a pullback or enter with less. Patience is worth more than rushing at times like this.
Tap $BTC aqui in the text and look at the chart. Do you usually look at the long average before deciding, or do you only look at today’s price?
2
2.4k
·
--
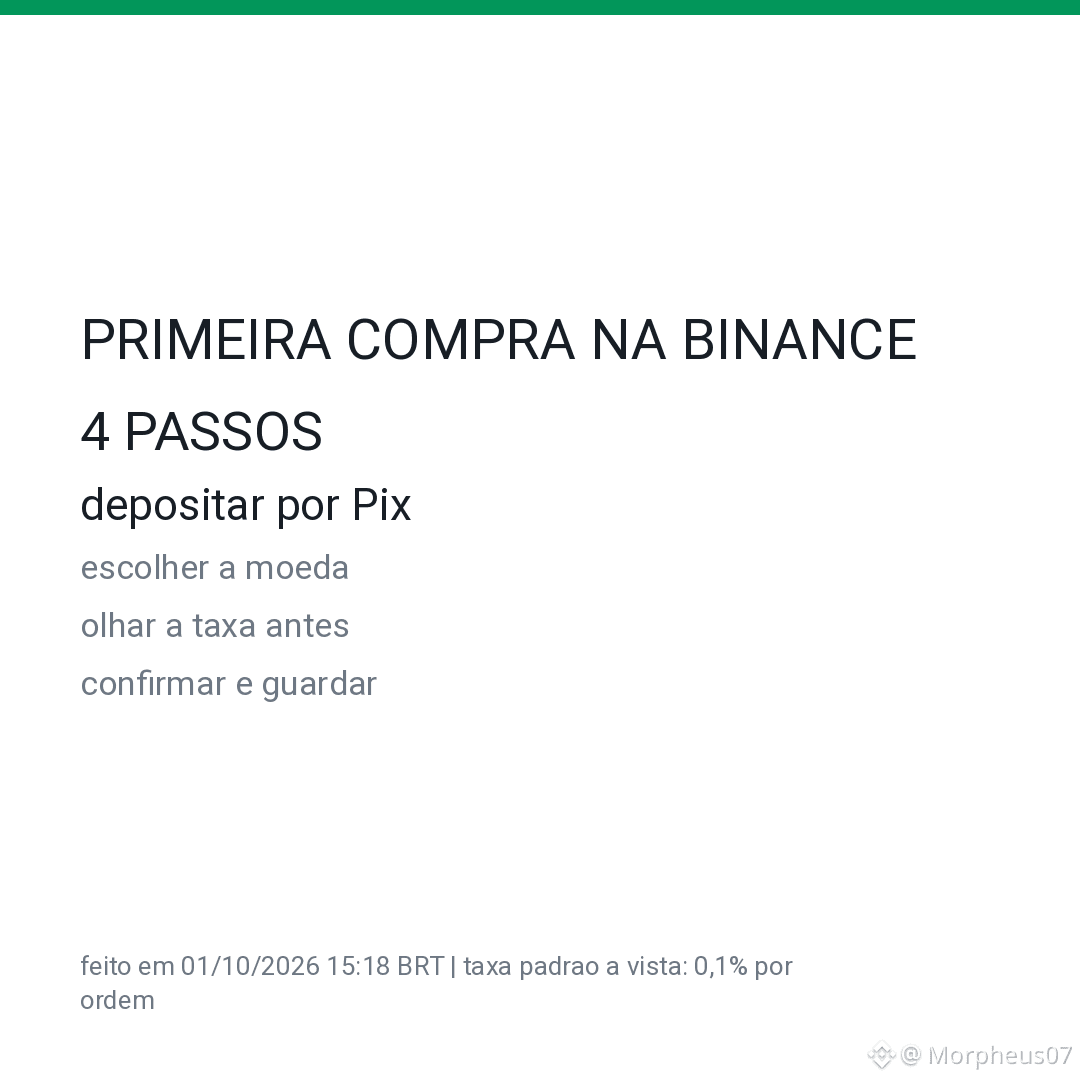
Making the first purchase on Binance is simpler than it seems once you understand the step-by-step. First, create your account and verify your identity to unlock the tools. Then, make a Pix transfer to add balance in reais to the exchange quickly.
With the balance in hand, search for the desired pair, such as bitcoin, knowing that you can buy fractions of it without needing a lot of money. The secret is to start small—with a 100-reais purchase just to test the path and lose the fear. In this transaction, the standard 0.1% fee deducts R$ 0.10 from a R$ 100 purchase, and the value is shown separately on the screen before you confirm.
Looking at every detail on the screen avoids unpleasant surprises and trains your eye for the market. Now tell me—tap <c-1/>$BTC </c-1/> in the text and look at the chart. What has stopped you until today from taking that first step?
Making the first purchase on Binance is simpler than it seems once you understand the step-by-step. First, create your account and verify your identity to unlock the tools. Then, make a Pix transfer to add balance in reais to the exchange quickly.
With the balance in hand, search for the desired pair, such as bitcoin, knowing that you can buy fractions of it without needing a lot of money. The secret is to start small—with a 100-reais purchase just to test the path and lose the fear. In this transaction, the standard 0.1% fee deducts R$ 0.10 from a R$ 100 purchase, and the value is shown separately on the screen before you confirm.
Looking at every detail on the screen avoids unpleasant surprises and trains your eye for the market. Now tell me—tap <c-1/>$BTC </c-1/> in the text and look at the chart. What has stopped you until today from taking that first step?
With the balance in hand, search for the desired pair, such as bitcoin, knowing that you can buy fractions of it without needing a lot of money. The secret is to start small—with a 100-reais purchase just to test the path and lose the fear. In this transaction, the standard 0.1% fee deducts R$ 0.10 from a R$ 100 purchase, and the value is shown separately on the screen before you confirm.
Looking at every detail on the screen avoids unpleasant surprises and trains your eye for the market. Now tell me—tap <c-1/>$BTC </c-1/> in the text and look at the chart. What has stopped you until today from taking that first step?
408
·
--
Here they call me Morpheus, so let me offer you the two pills. The choice is yours, and both have consequences.
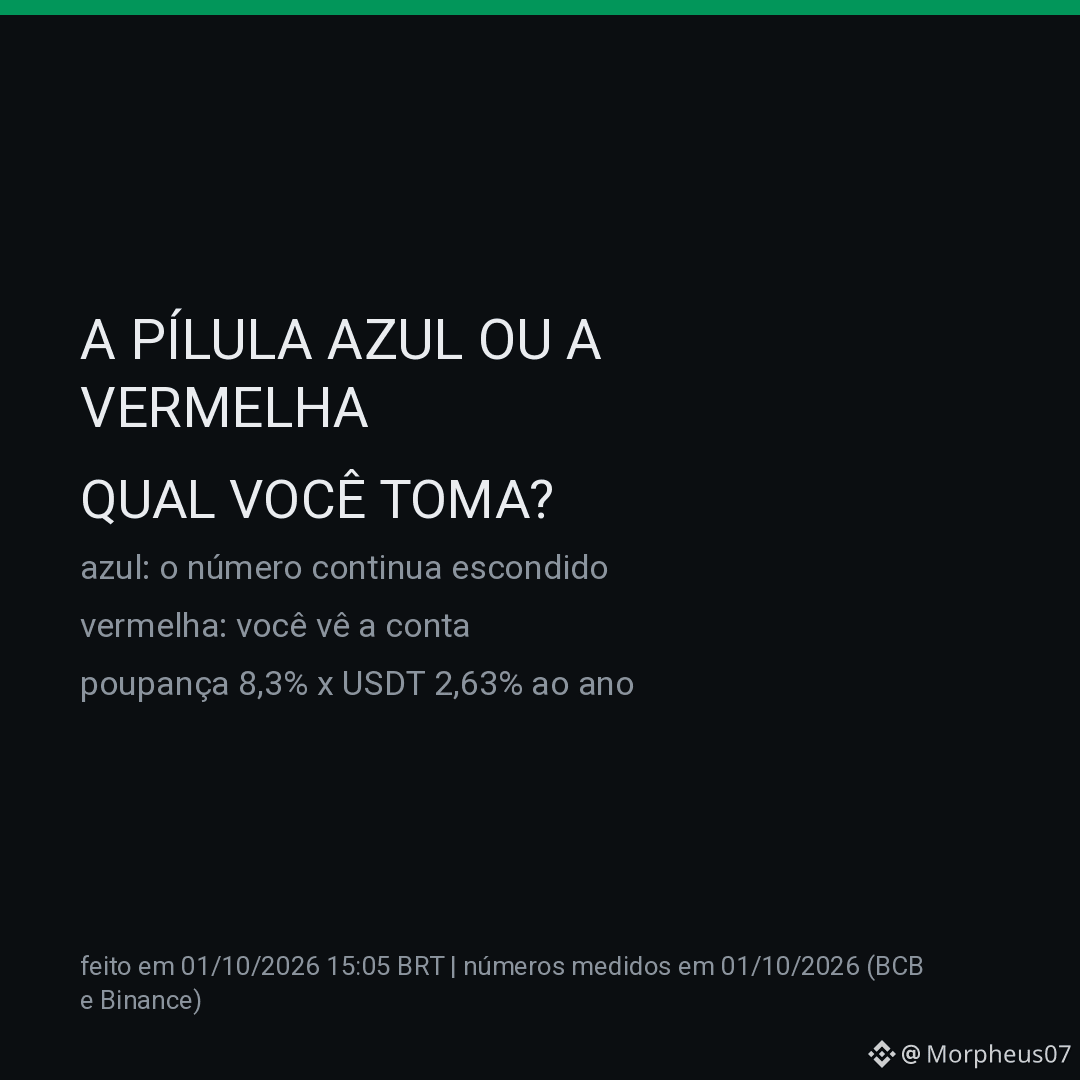
Blue pill: you continue as you are, without looking at the number. Savings yields 8.3% per year today because of the Selic at 13.75%, and over the next few months it may shrink: below 8.5%, the rule becomes 70% of the Selic. You lose nothing now—you’ll just find out later from the statement.
Red pill: you look at the bill with your own eyes. I measured it today: savings 8.3% per year, USDT in Earn 2.63%, IPCA at 4.22%, dollar at R$ 5.2079, and the $BTC a still 33% below the all-time high. With the number in hand, the decision is yours, not the one who sold you the idea.
Neither one promises to win. One keeps you in the dark, the other hands you the bill.
Write A or V down here below, no decoration. I want to see the scoreboard of who’s on each pill today.
And if it’s the red one: tap on the $BTC ahere in the text and see where the price is now; it’s the same number I looked at.
Here they call me Morpheus, so let me offer you the two pills. The choice is yours, and both have consequences.
Blue pill: you continue as you are, without looking at the number. Savings yields 8.3% per year today because of the Selic at 13.75%, and over the next few months it may shrink: below 8.5%, the rule becomes 70% of the Selic. You lose nothing now—you’ll just find out later from the statement.
Red pill: you look at the bill with your own eyes. I measured it today: savings 8.3% per year, USDT in Earn 2.63%, IPCA at 4.22%, dollar at R$ 5.2079, and the $BTC a still 33% below the all-time high. With the number in hand, the decision is yours, not the one who sold you the idea.
Neither one promises to win. One keeps you in the dark, the other hands you the bill.
Write A or V down here below, no decoration. I want to see the scoreboard of who’s on each pill today.
And if it’s the red one: tap on the $BTC ahere in the text and see where the price is now; it’s the same number I looked at.
Blue pill: you continue as you are, without looking at the number. Savings yields 8.3% per year today because of the Selic at 13.75%, and over the next few months it may shrink: below 8.5%, the rule becomes 70% of the Selic. You lose nothing now—you’ll just find out later from the statement.
Red pill: you look at the bill with your own eyes. I measured it today: savings 8.3% per year, USDT in Earn 2.63%, IPCA at 4.22%, dollar at R$ 5.2079, and the $BTC a still 33% below the all-time high. With the number in hand, the decision is yours, not the one who sold you the idea.
Neither one promises to win. One keeps you in the dark, the other hands you the bill.
Write A or V down here below, no decoration. I want to see the scoreboard of who’s on each pill today.
And if it’s the red one: tap on the $BTC ahere in the text and see where the price is now; it’s the same number I looked at.

9
·
--
Hey, my friend. I’ll show you how I think before I press the buy button, using what I see on the screen today.
First, the tide. I look at the long-term average, over 200 days. At $BTC , the price is US$ 84,849.87 and the average is US$ 71,359.87—almost 19% above it. That means an uptrend. Buying against the long-term average is like rowing against the current.
Next, the RSI, which measures how stretched the move is. Today, $BTC is at 76.9 and $ETH is at 76.7. This doesn’t mean it’s going to fall, and I don’t know what comes next. It just means that anyone entering now is entering expensively. What I do at this moment: I wait for a pullback to the average, or I enter with less.
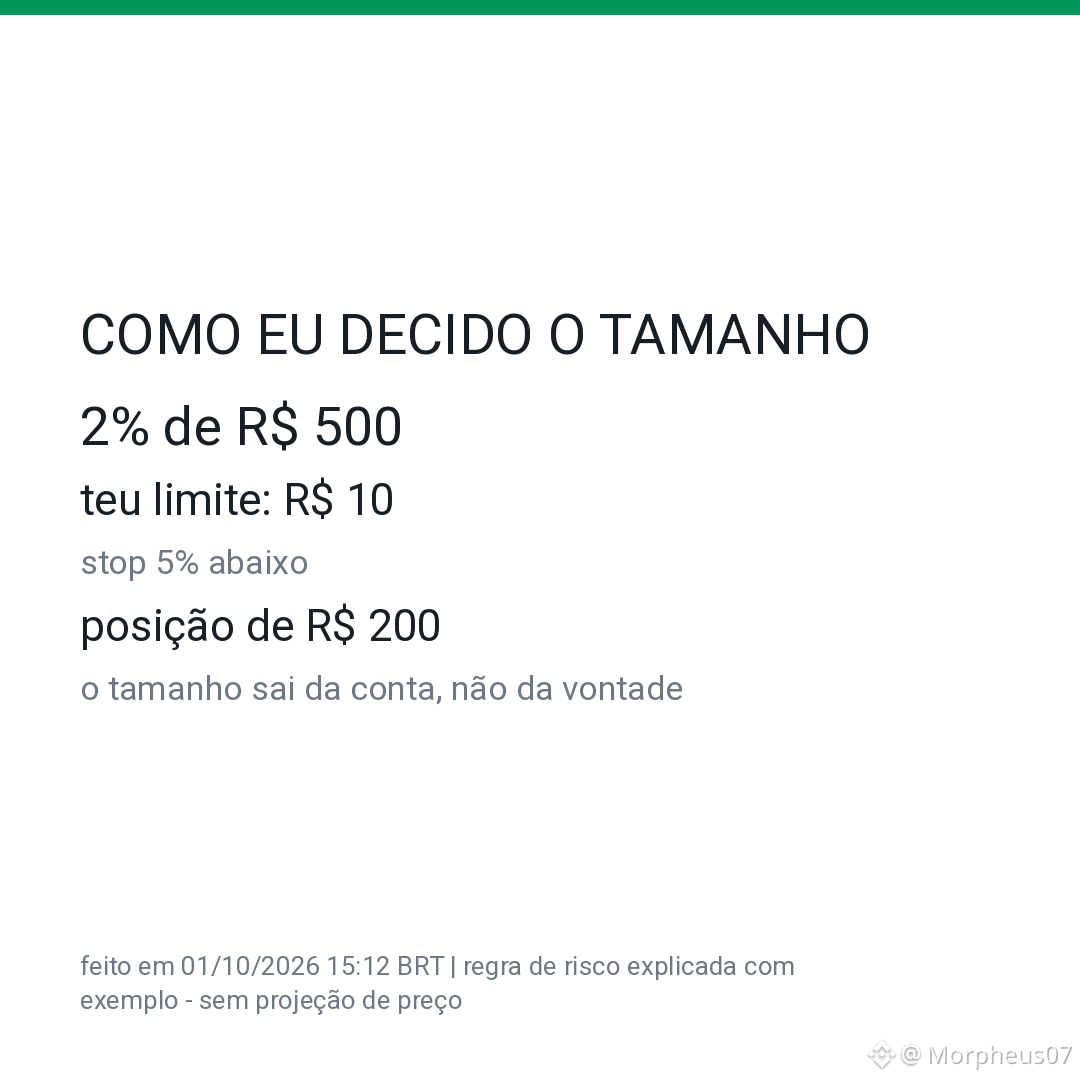
Now the math that almost everyone skips: position sizing. Suppose you set aside R$ 500 and you’re willing to lose at most 2% of it. Your limit is R$ 10 in this trade. If your stop-loss is 5% below the entry price, the position can’t exceed R$ 200, because 5% of R$ 200 is exactly your R$ 10. The sizing comes from this calculation, not from the desire to be right.
And the exit is defined before you enter. Write down on paper where you sell if it drops and where you sell if it rises. After it’s open, the brain lies.
There’s a number almost nobody looks at: funding. In BTC it’s at +9.2% per year, which shows the leveraged crowd paying a high price to stay long. When this gets too hot, the one who ends up paying the bill is whoever is currently long.
Tap on $BTC here in the text and look at the chart—it’s the same number I look at before deciding.
Which of these four parts do you still not do: the average, the RSI, the position sizing, or the exit?
Hey, my friend. I’ll show you how I think before I press the buy button, using what I see on the screen today.
First, the tide. I look at the long-term average, over 200 days. At $BTC , the price is US$ 84,849.87 and the average is US$ 71,359.87—almost 19% above it. That means an uptrend. Buying against the long-term average is like rowing against the current.
Next, the RSI, which measures how stretched the move is. Today, $BTC is at 76.9 and $ETH is at 76.7. This doesn’t mean it’s going to fall, and I don’t know what comes next. It just means that anyone entering now is entering expensively. What I do at this moment: I wait for a pullback to the average, or I enter with less.
Now the math that almost everyone skips: position sizing. Suppose you set aside R$ 500 and you’re willing to lose at most 2% of it. Your limit is R$ 10 in this trade. If your stop-loss is 5% below the entry price, the position can’t exceed R$ 200, because 5% of R$ 200 is exactly your R$ 10. The sizing comes from this calculation, not from the desire to be right.
And the exit is defined before you enter. Write down on paper where you sell if it drops and where you sell if it rises. After it’s open, the brain lies.
There’s a number almost nobody looks at: funding. In BTC it’s at +9.2% per year, which shows the leveraged crowd paying a high price to stay long. When this gets too hot, the one who ends up paying the bill is whoever is currently long.
Tap on $BTC here in the text and look at the chart—it’s the same number I look at before deciding.
Which of these four parts do you still not do: the average, the RSI, the position sizing, or the exit?
First, the tide. I look at the long-term average, over 200 days. At $BTC , the price is US$ 84,849.87 and the average is US$ 71,359.87—almost 19% above it. That means an uptrend. Buying against the long-term average is like rowing against the current.
Next, the RSI, which measures how stretched the move is. Today, $BTC is at 76.9 and $ETH is at 76.7. This doesn’t mean it’s going to fall, and I don’t know what comes next. It just means that anyone entering now is entering expensively. What I do at this moment: I wait for a pullback to the average, or I enter with less.
Now the math that almost everyone skips: position sizing. Suppose you set aside R$ 500 and you’re willing to lose at most 2% of it. Your limit is R$ 10 in this trade. If your stop-loss is 5% below the entry price, the position can’t exceed R$ 200, because 5% of R$ 200 is exactly your R$ 10. The sizing comes from this calculation, not from the desire to be right.
And the exit is defined before you enter. Write down on paper where you sell if it drops and where you sell if it rises. After it’s open, the brain lies.
There’s a number almost nobody looks at: funding. In BTC it’s at +9.2% per year, which shows the leveraged crowd paying a high price to stay long. When this gets too hot, the one who ends up paying the bill is whoever is currently long.
Tap on $BTC here in the text and look at the chart—it’s the same number I look at before deciding.
Which of these four parts do you still not do: the average, the RSI, the position sizing, or the exit?
34
·
--
Here they call me Morpheus, so let me offer you the two pills.
The blue pill is to continue without looking at the number. The savings account is paying 8.3% per year thanks to the Selic at 13.75%, and that may change in the coming months: below 8.5%, the product rule turns into something else, and it starts paying 70% of the Selic. If you don’t look, you find out from the statement—always too late.
The red pill is to look at the bill on your own. That’s what I did today: savings at 8.3% per year, USDT in Earn at 2.63%, IPCA at 4.22%, the dollar at R$ 5.2079, and the $BTC is still 33% below its all-time high. With those numbers in hand, the decision is yours—not the person who sold you the idea.
Neither pill promises you’ll profit. One leaves you in the dark, and the other hands you the bill.
If you choose the red one, start here: tap on $BTC and see where the price is now—it’s the same number I looked at.
Which one did you take?
Here they call me Morpheus, so let me offer you the two pills.
The blue pill is to continue without looking at the number. The savings account is paying 8.3% per year thanks to the Selic at 13.75%, and that may change in the coming months: below 8.5%, the product rule turns into something else, and it starts paying 70% of the Selic. If you don’t look, you find out from the statement—always too late.
The red pill is to look at the bill on your own. That’s what I did today: savings at 8.3% per year, USDT in Earn at 2.63%, IPCA at 4.22%, the dollar at R$ 5.2079, and the $BTC is still 33% below its all-time high. With those numbers in hand, the decision is yours—not the person who sold you the idea.
Neither pill promises you’ll profit. One leaves you in the dark, and the other hands you the bill.
If you choose the red one, start here: tap on $BTC and see where the price is now—it’s the same number I looked at.
Which one did you take?
The blue pill is to continue without looking at the number. The savings account is paying 8.3% per year thanks to the Selic at 13.75%, and that may change in the coming months: below 8.5%, the product rule turns into something else, and it starts paying 70% of the Selic. If you don’t look, you find out from the statement—always too late.
The red pill is to look at the bill on your own. That’s what I did today: savings at 8.3% per year, USDT in Earn at 2.63%, IPCA at 4.22%, the dollar at R$ 5.2079, and the $BTC is still 33% below its all-time high. With those numbers in hand, the decision is yours—not the person who sold you the idea.
Neither pill promises you’ll profit. One leaves you in the dark, and the other hands you the bill.
If you choose the red one, start here: tap on $BTC and see where the price is now—it’s the same number I looked at.
Which one did you take?
187
·
--
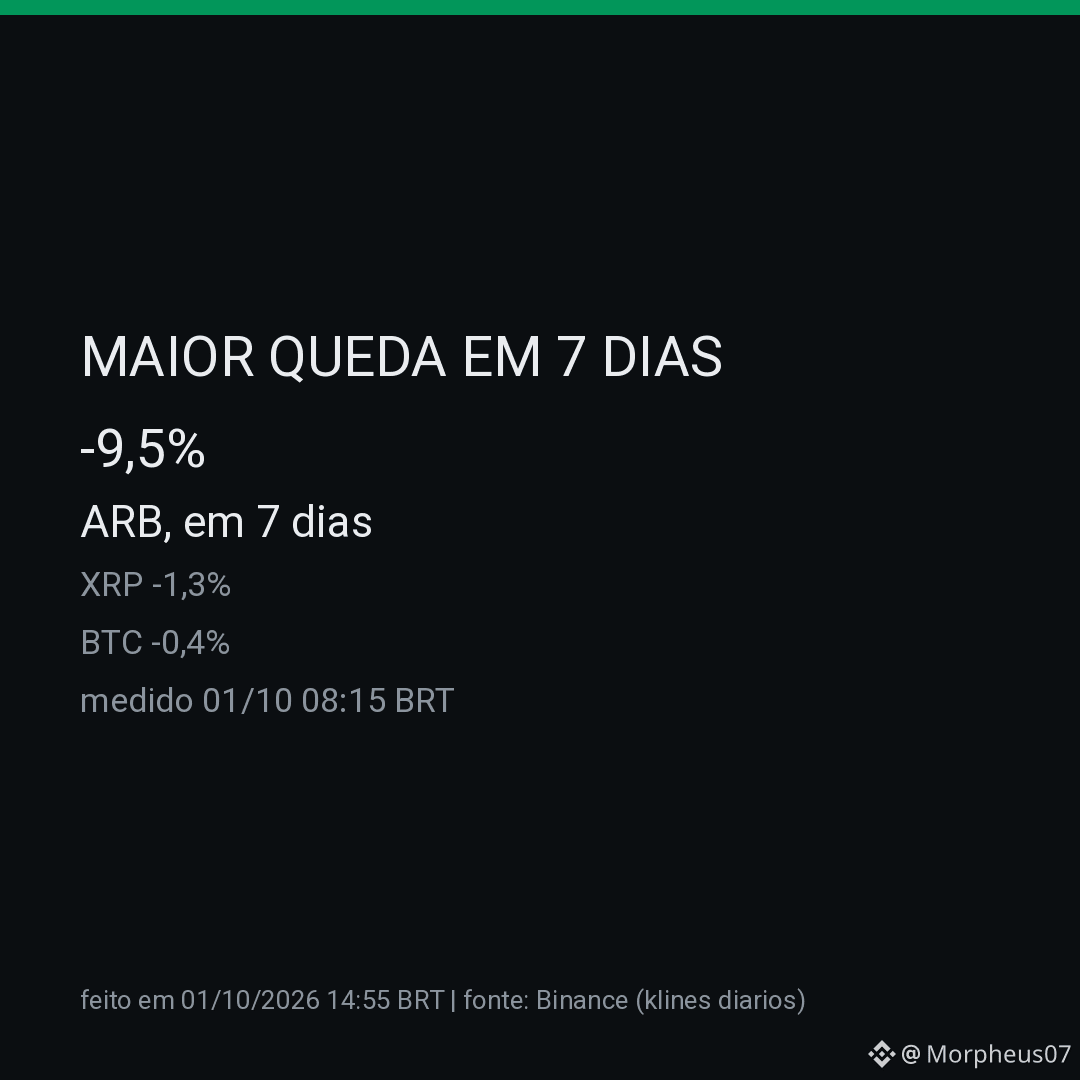
Not everything is roses. Measured on 01/10, at 08:15 BRT, $ARB fell 9.5% in 7 days, the biggest drop on the list.
$XRP fell 1.3% and $BTC fell 0.4%. ETH stayed sideways.
A 7-day drop isn’t the end of the world, but it shows the market choosing. ARB is still up 134.8% in 30 days, so this dip is a breather.
Tap $ARB in the text and see the chart—there you can tell if the drop has stopped.
Not everything is roses. Measured on 01/10, at 08:15 BRT, $ARB fell 9.5% in 7 days, the biggest drop on the list.
$XRP fell 1.3% and $BTC fell 0.4%. ETH stayed sideways.
A 7-day drop isn’t the end of the world, but it shows the market choosing. ARB is still up 134.8% in 30 days, so this dip is a breather.
Tap $ARB in the text and see the chart—there you can tell if the drop has stopped.
$XRP fell 1.3% and $BTC fell 0.4%. ETH stayed sideways.
A 7-day drop isn’t the end of the world, but it shows the market choosing. ARB is still up 134.8% in 30 days, so this dip is a breather.
Tap $ARB in the text and see the chart—there you can tell if the drop has stopped.
673
·
--
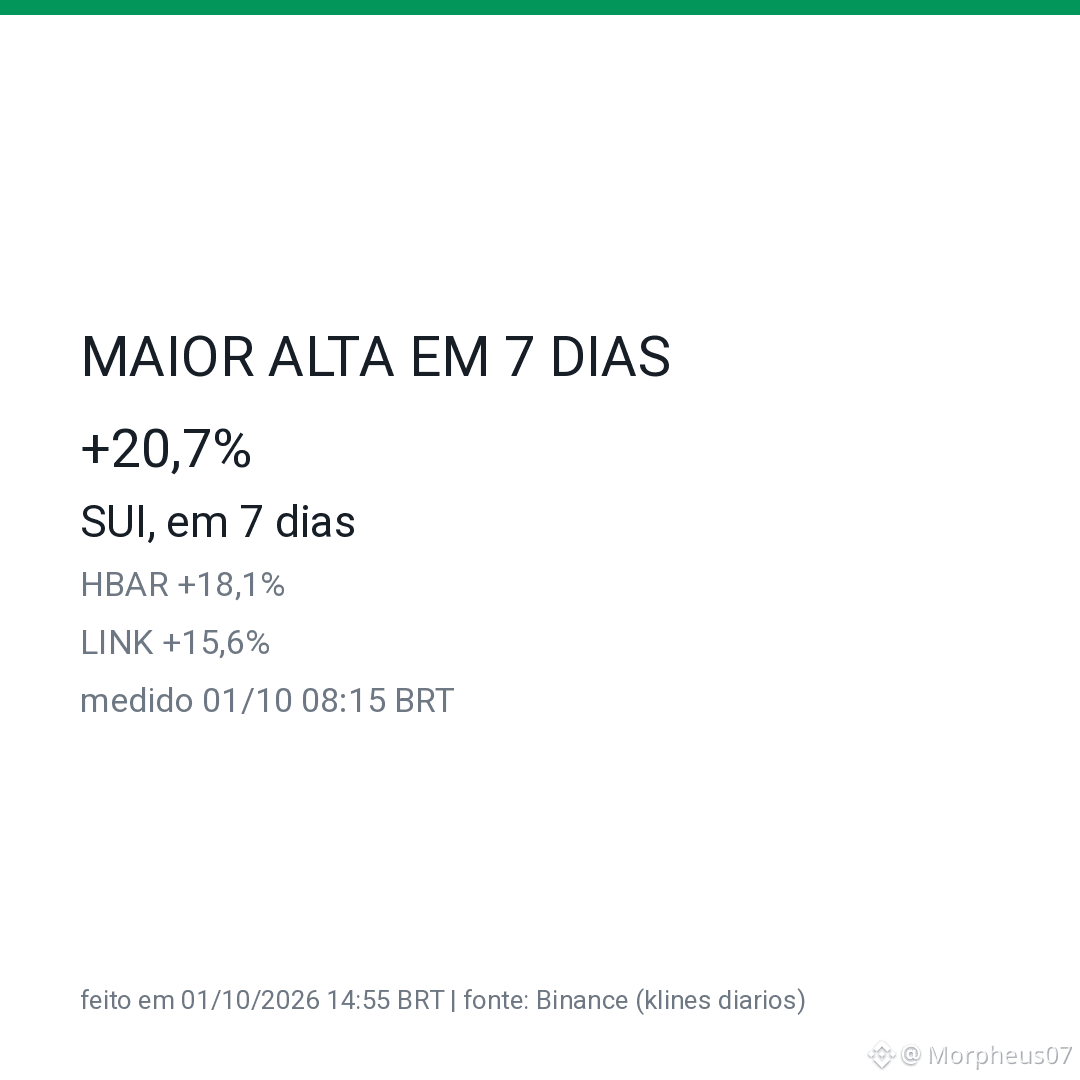
The week was good for some coins. Measured on 01/10, at 08:15 BRT, $SUI rose 20.7% in 7 days and topped the list.
$HBAR rose 18.1% and $LINK rose 15.6%. NEAR and LTC are behind, with less than half of that.
A rise over 7 days doesn’t mean it will keep going up, and I don’t know what comes next week. SUI is at US$1.19 and HBAR is at US$0.107.
Tap on $SUI in the text and look at the weekly chart—it’s the same number I looked at.
The week was good for some coins. Measured on 01/10, at 08:15 BRT, $SUI rose 20.7% in 7 days and topped the list.
$HBAR rose 18.1% and $LINK rose 15.6%. NEAR and LTC are behind, with less than half of that.
A rise over 7 days doesn’t mean it will keep going up, and I don’t know what comes next week. SUI is at US$1.19 and HBAR is at US$0.107.
Tap on $SUI in the text and look at the weekly chart—it’s the same number I looked at.
$HBAR rose 18.1% and $LINK rose 15.6%. NEAR and LTC are behind, with less than half of that.
A rise over 7 days doesn’t mean it will keep going up, and I don’t know what comes next week. SUI is at US$1.19 and HBAR is at US$0.107.
Tap on $SUI in the text and look at the weekly chart—it’s the same number I looked at.
1
1.1k
·
--
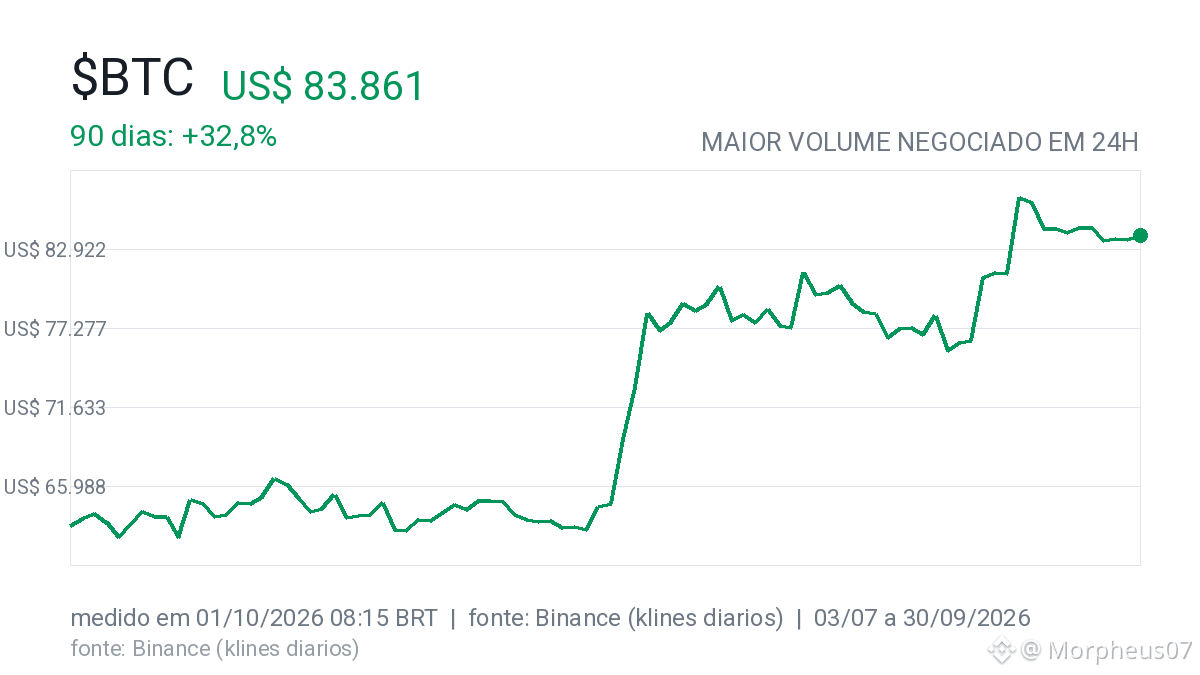
I looked at who negotiated the most in the last 24 hours (measured on 01/10 at 08:15 BRT). The $BTC led with US$ 34.34 billion.
Next comes the $ETH with US$ 14.13 billion and the $SOL with US$ 3.94 billion. XRP and NEAR follow behind, with less than a third of that.
That’s where the liquidity is. High volume means movement that happens without shocks, and falling volume means a more idle market.
Tap on the $BTC in the text and check today’s volume—it’s the same number I used.
I looked at who negotiated the most in the last 24 hours (measured on 01/10 at 08:15 BRT). The $BTC led with US$ 34.34 billion.
Next comes the $ETH with US$ 14.13 billion and the $SOL with US$ 3.94 billion. XRP and NEAR follow behind, with less than a third of that.
That’s where the liquidity is. High volume means movement that happens without shocks, and falling volume means a more idle market.
Tap on the $BTC in the text and check today’s volume—it’s the same number I used.
Next comes the $ETH with US$ 14.13 billion and the $SOL with US$ 3.94 billion. XRP and NEAR follow behind, with less than a third of that.
That’s where the liquidity is. High volume means movement that happens without shocks, and falling volume means a more idle market.
Tap on the $BTC in the text and check today’s volume—it’s the same number I used.
55
·
--
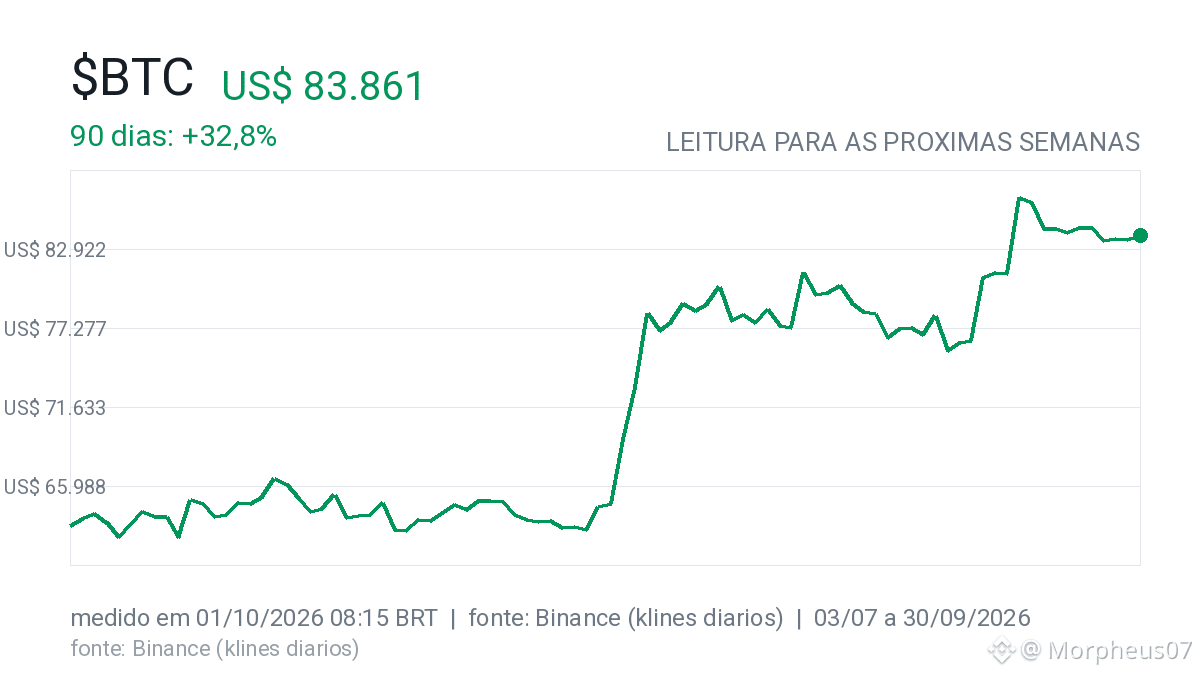
In my reading, $BTC e $ETH are moving above average. Measured on 01/10 at 08:15 BRT, BTC rose 7.0% over 30 days and 36.9% over 90 days. ETH rose 8.7% over 30 days and 58.1% over 90 days.
But the all-time high is still far away: -33.2% for BTC and -45.7% for ETH.
What would undo this reading? Losing the long-term average (SMA200) with volume, or the funding turning negative as open interest falls.
I didn’t check the unlock calendar because the API started charging. Without a number, I don’t write.
Hit $BTC here in the text and look at the long-term average with your own eyes—that’s where I look first.
In my reading, $BTC e $ETH are moving above average. Measured on 01/10 at 08:15 BRT, BTC rose 7.0% over 30 days and 36.9% over 90 days. ETH rose 8.7% over 30 days and 58.1% over 90 days.
But the all-time high is still far away: -33.2% for BTC and -45.7% for ETH.
What would undo this reading? Losing the long-term average (SMA200) with volume, or the funding turning negative as open interest falls.
I didn’t check the unlock calendar because the API started charging. Without a number, I don’t write.
Hit $BTC here in the text and look at the long-term average with your own eyes—that’s where I look first.
But the all-time high is still far away: -33.2% for BTC and -45.7% for ETH.
What would undo this reading? Losing the long-term average (SMA200) with volume, or the funding turning negative as open interest falls.
I didn’t check the unlock calendar because the API started charging. Without a number, I don’t write.
Hit $BTC here in the text and look at the long-term average with your own eyes—that’s where I look first.
90
·
--
Sunday I closed the store register at 6pm and went to check the market. It didn’t close. Crypto trades every day, and that’s what confuses beginners.
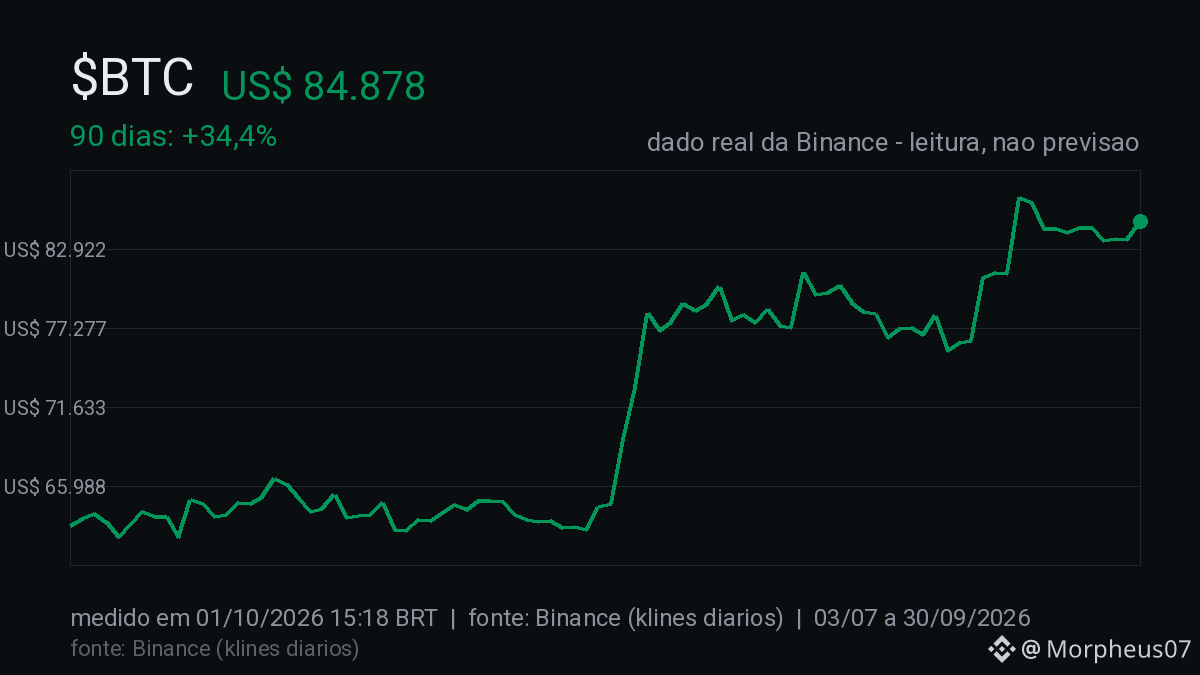
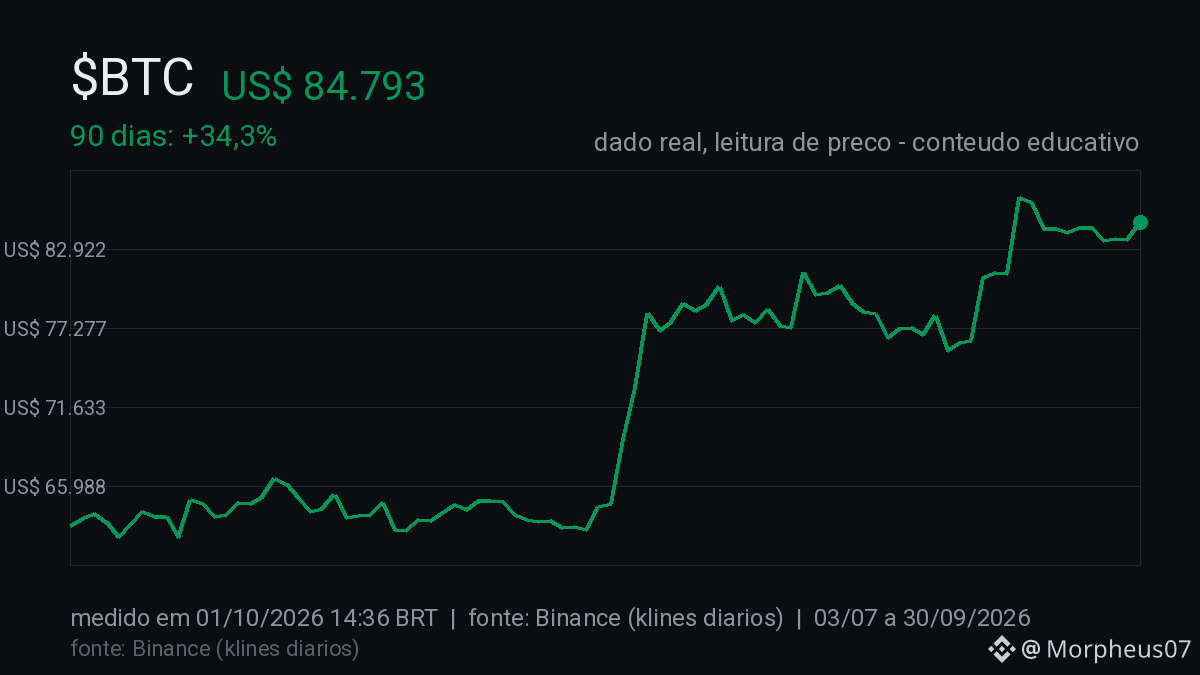
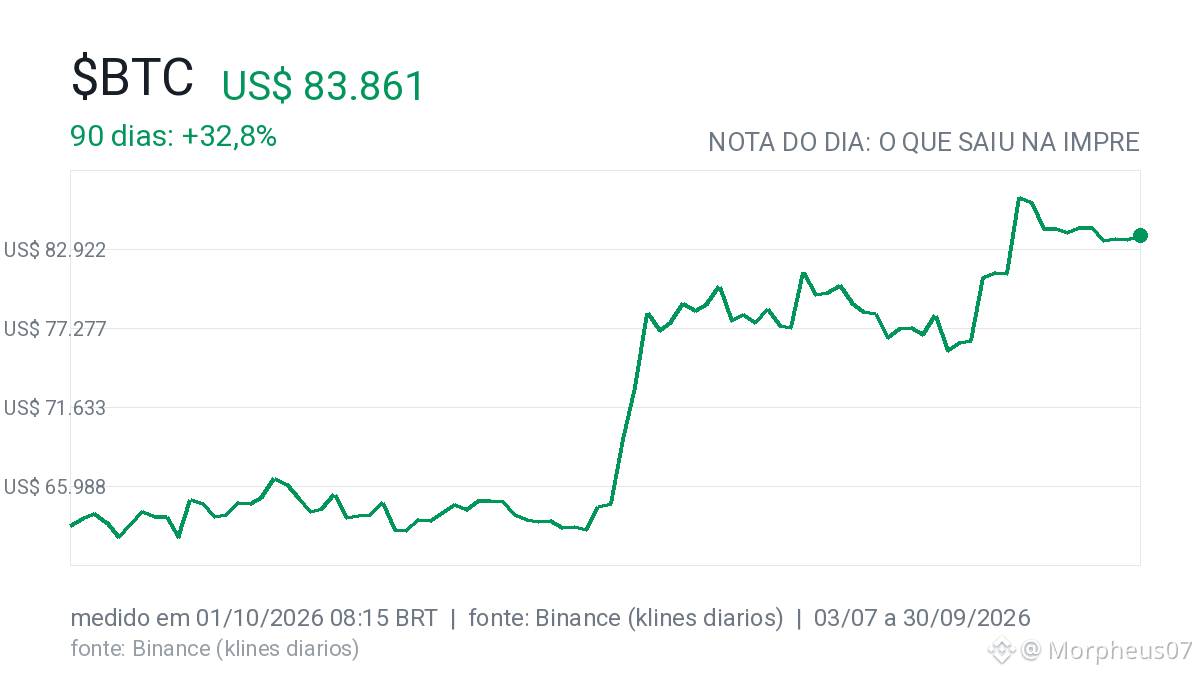
The simplest reading there is—one that I use—is this: before looking at any coin, look at the size of the move over the last 90 days. The $BTC went up 34% in that period. That doesn’t mean it will keep going up, and whoever says it will is just guessing.
What I do with that number is nothing. It only tells me whether the market is hotter than last month. The decision starts on another account: how much I’m willing to lose.
Tap the $BTC here in the text and verify it with your own eyes—it’s the same number I looked at.
Sunday I closed the store register at 6pm and went to check the market. It didn’t close. Crypto trades every day, and that’s what confuses beginners.
The simplest reading there is—one that I use—is this: before looking at any coin, look at the size of the move over the last 90 days. The $BTC went up 34% in that period. That doesn’t mean it will keep going up, and whoever says it will is just guessing.
What I do with that number is nothing. It only tells me whether the market is hotter than last month. The decision starts on another account: how much I’m willing to lose.
Tap the $BTC here in the text and verify it with your own eyes—it’s the same number I looked at.
The simplest reading there is—one that I use—is this: before looking at any coin, look at the size of the move over the last 90 days. The $BTC went up 34% in that period. That doesn’t mean it will keep going up, and whoever says it will is just guessing.
What I do with that number is nothing. It only tells me whether the market is hotter than last month. The decision starts on another account: how much I’m willing to lose.
Tap the $BTC here in the text and verify it with your own eyes—it’s the same number I looked at.
1
329
·
--
I sell coconut water in three stores, I’m the general manager, and I also invest in crypto and research this whole market every day. I’m going to talk about the part nobody tells beginners.
You don’t need a lot of money—the mistake is thinking you do. You can take the first step with what’s left over from a day of sales. And at the beginning, the most important thing isn’t choosing the coin: it’s understanding the fee. On a small purchase, the fee weighs much more than it seems, and that’s what makes people give up in the first month thinking the market isn’t any good.
The calculation I make before any purchase: I look at the fee and write down how much I’m willing to lose. Two lines on paper, before clicking $BTC or whatever.
Crypto doesn’t close on Sunday. My store closes. That’s why I like it.
What was your biggest doubt in your first purchase?
I sell coconut water in three stores, I’m the general manager, and I also invest in crypto and research this whole market every day. I’m going to talk about the part nobody tells beginners.
You don’t need a lot of money—the mistake is thinking you do. You can take the first step with what’s left over from a day of sales. And at the beginning, the most important thing isn’t choosing the coin: it’s understanding the fee. On a small purchase, the fee weighs much more than it seems, and that’s what makes people give up in the first month thinking the market isn’t any good.
The calculation I make before any purchase: I look at the fee and write down how much I’m willing to lose. Two lines on paper, before clicking $BTC or whatever.
Crypto doesn’t close on Sunday. My store closes. That’s why I like it.
What was your biggest doubt in your first purchase?
You don’t need a lot of money—the mistake is thinking you do. You can take the first step with what’s left over from a day of sales. And at the beginning, the most important thing isn’t choosing the coin: it’s understanding the fee. On a small purchase, the fee weighs much more than it seems, and that’s what makes people give up in the first month thinking the market isn’t any good.
The calculation I make before any purchase: I look at the fee and write down how much I’m willing to lose. Two lines on paper, before clicking $BTC or whatever.
Crypto doesn’t close on Sunday. My store closes. That’s why I like it.
What was your biggest doubt in your first purchase?
1
10
5.2k
·
--
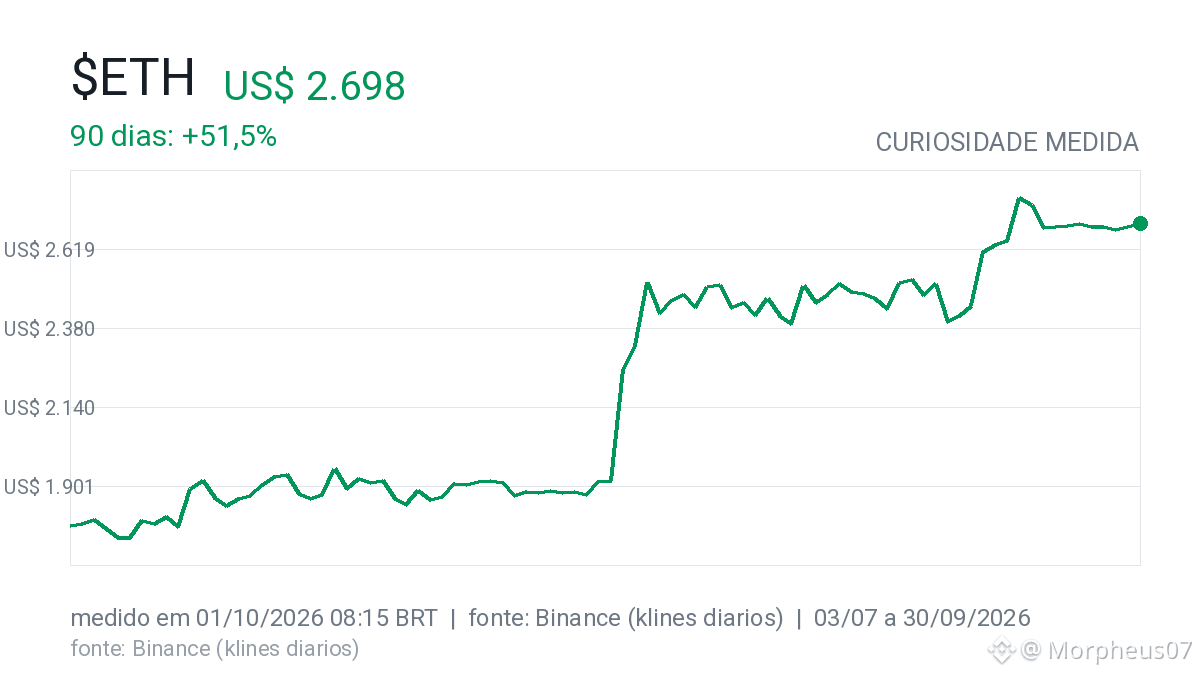
A number that almost nobody publishes, but that I measured today (01/10 08:15 BRT) using DefiLlama: the concentration of TVL (Total Value Locked) in $ETH is US$ 53.38 billion.
This represents 56.21% of the total of the entire DeFi ecosystem. In other words, more than half of the money locked in decentralized protocols is on Ethereum.
This isn’t a price news item; it’s an adoption metric. It shows that, despite other networks existing, Ethereum is still the center of money in DeFi.
It’s a dry fact, but an important one for understanding where the flow is. Did you know that more than half of TVL is in ETH?
A number that almost nobody publishes, but that I measured today (01/10 08:15 BRT) using DefiLlama: the concentration of TVL (Total Value Locked) in $ETH is US$ 53.38 billion.
This represents 56.21% of the total of the entire DeFi ecosystem. In other words, more than half of the money locked in decentralized protocols is on Ethereum.
This isn’t a price news item; it’s an adoption metric. It shows that, despite other networks existing, Ethereum is still the center of money in DeFi.
It’s a dry fact, but an important one for understanding where the flow is. Did you know that more than half of TVL is in ETH?
This represents 56.21% of the total of the entire DeFi ecosystem. In other words, more than half of the money locked in decentralized protocols is on Ethereum.
This isn’t a price news item; it’s an adoption metric. It shows that, despite other networks existing, Ethereum is still the center of money in DeFi.
It’s a dry fact, but an important one for understanding where the flow is. Did you know that more than half of TVL is in ETH?
255
·
--
I wanted to show what changed in the market portrait since yesterday. But honestly, it doesn’t work.
Measured at 01/10 08:15 BRT, there are still not two complete portraits in the database to make this day-by-day comparison. The comparison only starts to be valid when the second day of data comes in.
Today, that comparison doesn’t exist. I’m not going to make up numbers to fill the space.
As soon as we have the second day, I’ll post the exact difference. For now, it’s just a matter of waiting for the system to mature.
Would you like to see this daily comparison?
I wanted to show what changed in the market portrait since yesterday. But honestly, it doesn’t work.
Measured at 01/10 08:15 BRT, there are still not two complete portraits in the database to make this day-by-day comparison. The comparison only starts to be valid when the second day of data comes in.
Today, that comparison doesn’t exist. I’m not going to make up numbers to fill the space.
As soon as we have the second day, I’ll post the exact difference. For now, it’s just a matter of waiting for the system to mature.
Would you like to see this daily comparison?
Measured at 01/10 08:15 BRT, there are still not two complete portraits in the database to make this day-by-day comparison. The comparison only starts to be valid when the second day of data comes in.
Today, that comparison doesn’t exist. I’m not going to make up numbers to fill the space.
As soon as we have the second day, I’ll post the exact difference. For now, it’s just a matter of waiting for the system to mature.
Would you like to see this daily comparison?
58
·
--
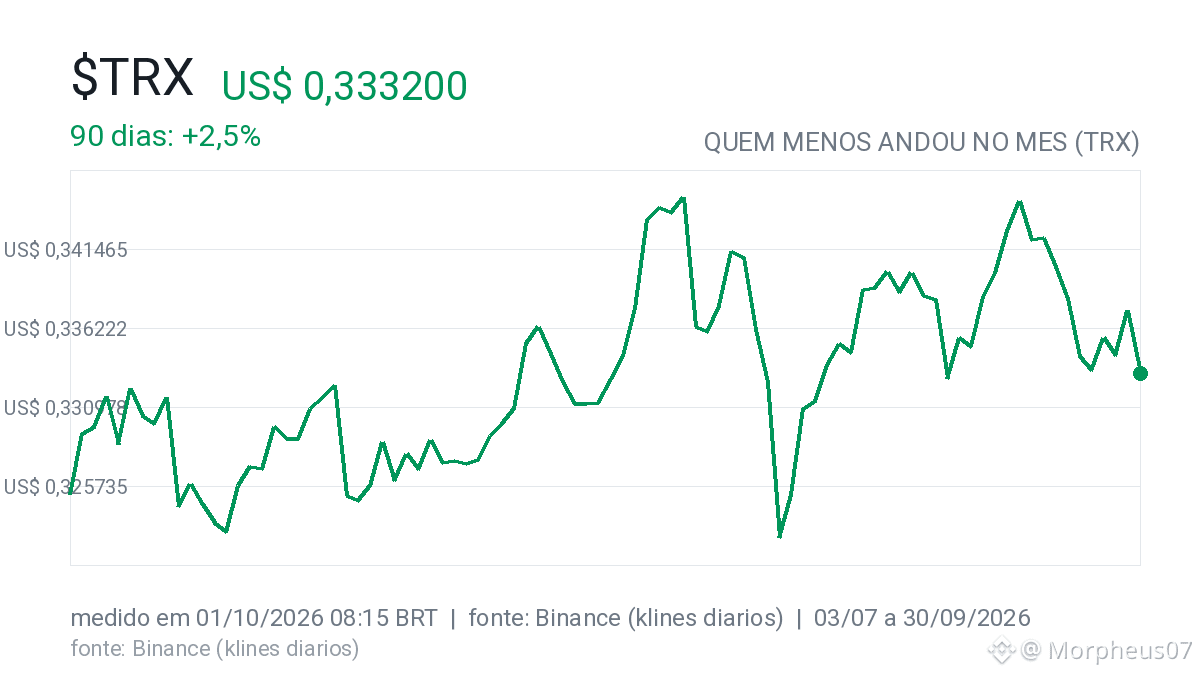
While everyone else rose during the month, the $TRX was the one that moved the least. Measured at 01/10 08:15 BRT, the change was only +1.7% over 30 days.
The price is US$ 0.3380. In 7 days, it fell 0.5%. It is 21.6% below the all-time high.
Falling behind isn’t a sign that it’s "cheap" or that it’s going to explode. It’s just what the numbers show. The 24h volume was US$ 384 million.
Sometimes, the currency that doesn’t move is the one waiting for something. Or maybe it’s just staying put. In my view, it’s better not to bet on "reversal" just because it rose a little.
Do you prefer the ones that jump a lot or the ones that move slowly?
While everyone else rose during the month, the $TRX was the one that moved the least. Measured at 01/10 08:15 BRT, the change was only +1.7% over 30 days.
The price is US$ 0.3380. In 7 days, it fell 0.5%. It is 21.6% below the all-time high.
Falling behind isn’t a sign that it’s "cheap" or that it’s going to explode. It’s just what the numbers show. The 24h volume was US$ 384 million.
Sometimes, the currency that doesn’t move is the one waiting for something. Or maybe it’s just staying put. In my view, it’s better not to bet on "reversal" just because it rose a little.
Do you prefer the ones that jump a lot or the ones that move slowly?
The price is US$ 0.3380. In 7 days, it fell 0.5%. It is 21.6% below the all-time high.
Falling behind isn’t a sign that it’s "cheap" or that it’s going to explode. It’s just what the numbers show. The 24h volume was US$ 384 million.
Sometimes, the currency that doesn’t move is the one waiting for something. Or maybe it’s just staying put. In my view, it’s better not to bet on "reversal" just because it rose a little.
Do you prefer the ones that jump a lot or the ones that move slowly?
134
·
--
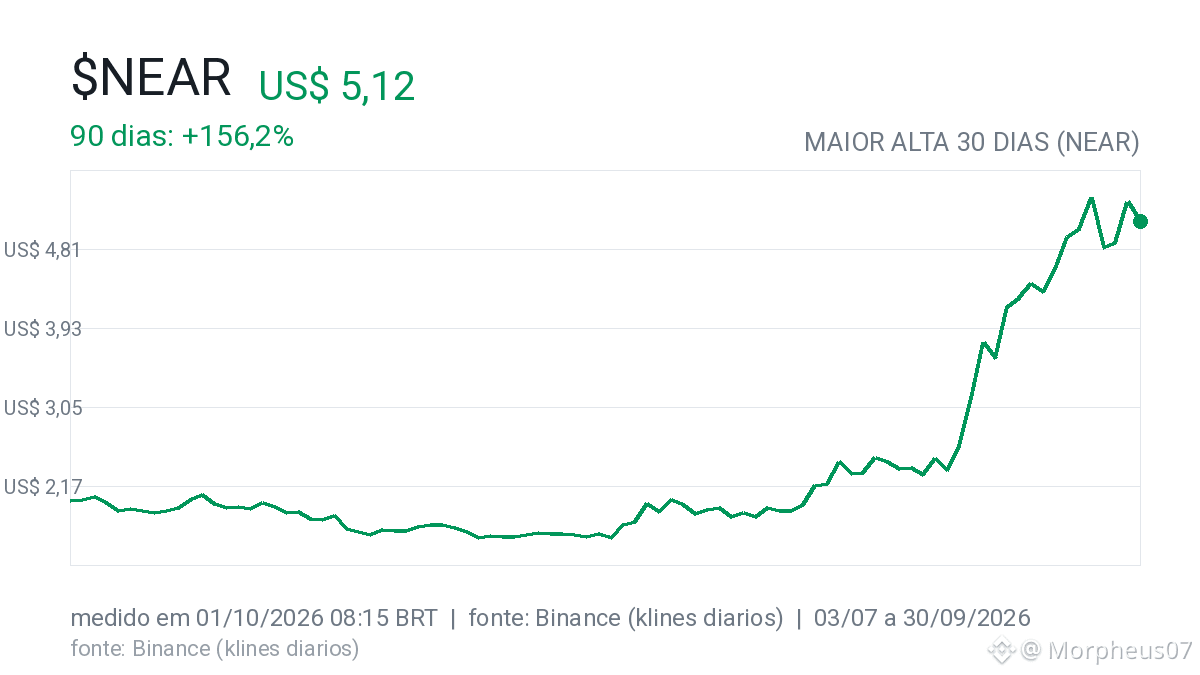
When I look at the list of big coins, <c-1/> $NEAR stands out. Measured at 01/10 08:15 BRT, it rose 180.4% over the last 30 days.
That means that someone who had $100 a month ago now has $280. But be careful: a past increase is not a guarantee of future gains. The current price is $5.41.
The 24h volume was $1.49 billion, which shows that a lot of people are trading. But it’s still 73.5% below its all-time high.
It’s an impressive number, but it’s not a buy recommendation. It’s just what happened. Do you follow NEAR or did you miss this run?
When I look at the list of big coins, <c-1/> $NEAR stands out. Measured at 01/10 08:15 BRT, it rose 180.4% over the last 30 days.
That means that someone who had $100 a month ago now has $280. But be careful: a past increase is not a guarantee of future gains. The current price is $5.41.
The 24h volume was $1.49 billion, which shows that a lot of people are trading. But it’s still 73.5% below its all-time high.
It’s an impressive number, but it’s not a buy recommendation. It’s just what happened. Do you follow NEAR or did you miss this run?
That means that someone who had $100 a month ago now has $280. But be careful: a past increase is not a guarantee of future gains. The current price is $5.41.
The 24h volume was $1.49 billion, which shows that a lot of people are trading. But it’s still 73.5% below its all-time high.
It’s an impressive number, but it’s not a buy recommendation. It’s just what happened. Do you follow NEAR or did you miss this run?
4
3k
·
--
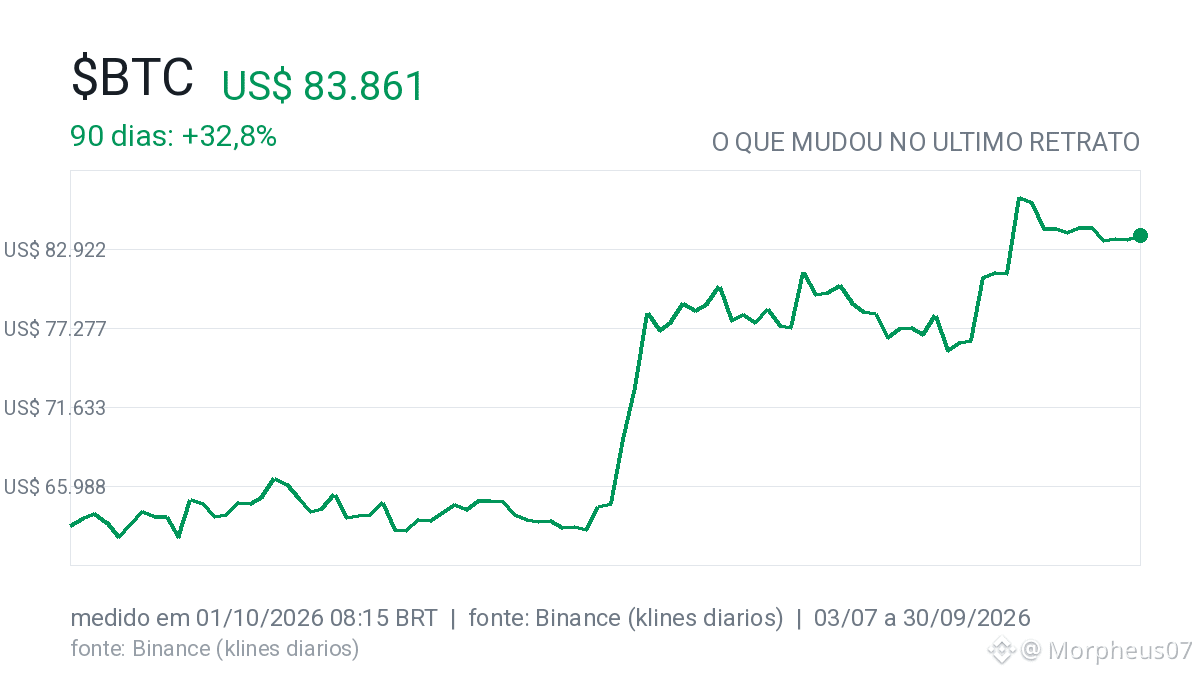
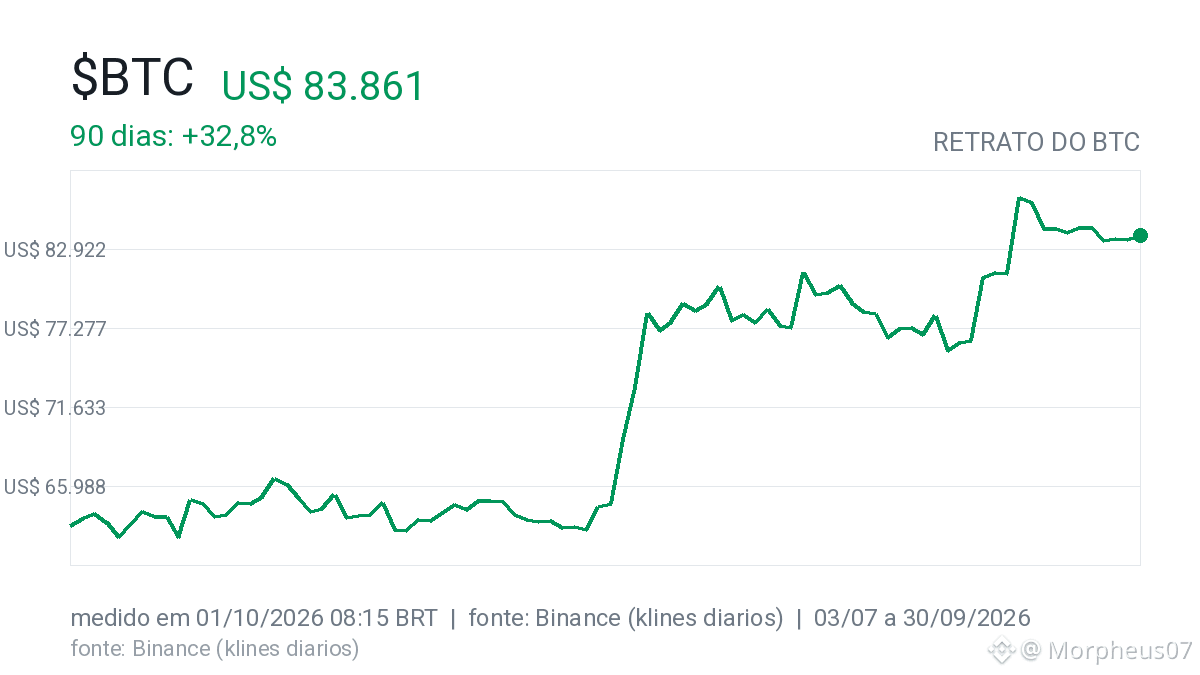
Many people look at the price and think that the $BTC is "dead" because it hasn’t risen much. But I measured the numbers from yesterday (01/10 08:15 BRT) and the story is different.
The price is at US$ 84.236. In 30 days, it rose 7.0%. In 90 days, it rose 36.9%. That’s movement. What catches my attention is the distance from the all-time high: we are 33.2% below the peak of US$ 126.080.
Anyone who bought at the top is still at a loss. Anyone who bought 3 months ago is in profit. CoinDesk (01/10 07:38 BRT) reported that it’s trading in the US$ 82k–85k range.
This isn’t a sign that it will go up tomorrow. It’s just a snapshot of where we are. Are you looking at the peak or the average?
Many people look at the price and think that the $BTC is "dead" because it hasn’t risen much. But I measured the numbers from yesterday (01/10 08:15 BRT) and the story is different.
The price is at US$ 84.236. In 30 days, it rose 7.0%. In 90 days, it rose 36.9%. That’s movement. What catches my attention is the distance from the all-time high: we are 33.2% below the peak of US$ 126.080.
Anyone who bought at the top is still at a loss. Anyone who bought 3 months ago is in profit. CoinDesk (01/10 07:38 BRT) reported that it’s trading in the US$ 82k–85k range.
This isn’t a sign that it will go up tomorrow. It’s just a snapshot of where we are. Are you looking at the peak or the average?
The price is at US$ 84.236. In 30 days, it rose 7.0%. In 90 days, it rose 36.9%. That’s movement. What catches my attention is the distance from the all-time high: we are 33.2% below the peak of US$ 126.080.
Anyone who bought at the top is still at a loss. Anyone who bought 3 months ago is in profit. CoinDesk (01/10 07:38 BRT) reported that it’s trading in the US$ 82k–85k range.
This isn’t a sign that it will go up tomorrow. It’s just a snapshot of where we are. Are you looking at the peak or the average?
551
·
--
Today I woke up and went to see what made the main headlines. No explosion, but there’s something interesting about the traditional market and crypto.
CoinDesk (01/10 07:38 BRT) reported that $BTC started the new quarter in the range of US$82,000 to US$85,000. Cointelegraph (01/10 07:30 BRT) said it’s stuck below US$86,000 due to changes in how inflation is being read (PCE).
It was also reported that Binance is under scrutiny in Europe (Cointelegraph, 01/10 07:07 BRT) and that Ripple is focusing on Brazil for tokenization (CryptoSlate, 01/10 07:00 BRT).
That’s all that came out. Coincidence with the price? Maybe. Cause? You can’t claim that from a headline alone. And you, did you read any of these?
Today I woke up and went to see what made the main headlines. No explosion, but there’s something interesting about the traditional market and crypto.
CoinDesk (01/10 07:38 BRT) reported that $BTC started the new quarter in the range of US$82,000 to US$85,000. Cointelegraph (01/10 07:30 BRT) said it’s stuck below US$86,000 due to changes in how inflation is being read (PCE).
It was also reported that Binance is under scrutiny in Europe (Cointelegraph, 01/10 07:07 BRT) and that Ripple is focusing on Brazil for tokenization (CryptoSlate, 01/10 07:00 BRT).
That’s all that came out. Coincidence with the price? Maybe. Cause? You can’t claim that from a headline alone. And you, did you read any of these?
CoinDesk (01/10 07:38 BRT) reported that $BTC started the new quarter in the range of US$82,000 to US$85,000. Cointelegraph (01/10 07:30 BRT) said it’s stuck below US$86,000 due to changes in how inflation is being read (PCE).
It was also reported that Binance is under scrutiny in Europe (Cointelegraph, 01/10 07:07 BRT) and that Ripple is focusing on Brazil for tokenization (CryptoSlate, 01/10 07:00 BRT).
That’s all that came out. Coincidence with the price? Maybe. Cause? You can’t claim that from a headline alone. And you, did you read any of these?
85
Log in to explore more content
Join global crypto users on Binance Square
⚡️ Get latest and useful information about crypto.
💬 Trusted by the world’s largest crypto exchange.
👍 Discover real insights from verified creators.
Email / Phone number
Trending Topics
BitcoinParesGainsAfterRallyTo$86.5K
415 views
29 Discussing
$BTC sitting right on the knife edge at $86k. Bulls stacked 1,436 BTC defending that level, bears loaded 1,008 BTC as a wall at $86.5k. This is pure liquidation fuel—whoever loses this fight is getting absolutely nuked.
Short-term scalp territory. If bulls punch through $86.5k with volume, we're probably running to $88k fast. If bears hold and push down, $84k is the next stop and longs get flushed.
Watch the tape closely. One side's about to get destroyed, and the move will be violent either way.
AI Market Brief
·4 Likes
·4.5k views
CerebrasSinksNearly20%OnReportNvidiaToPowerOpenAI
3,106 views
85 Discussing
SECProposesCryptoCustodyRules
24,654 views
241 Discussing