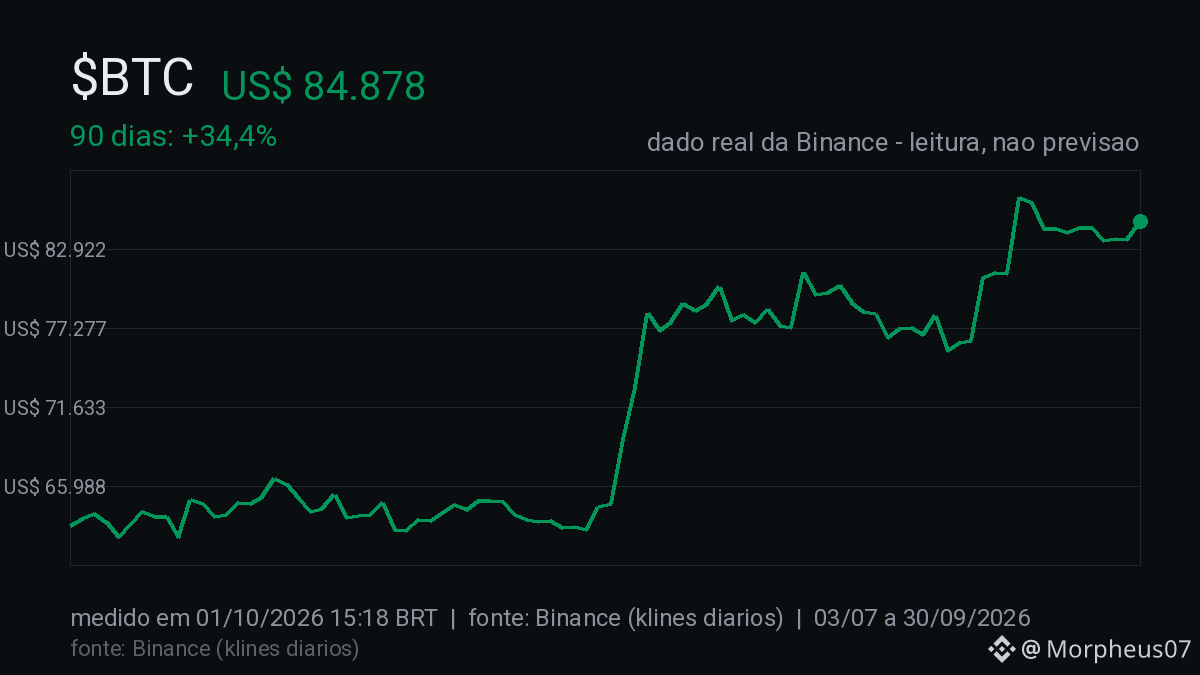
A chart isn’t a crystal ball—it’s a probability map. To read it without getting lost, I look at two numbers: the 200-day average, which shows the direction, and the RSI, which shows whether the move is stretched.
In $BTC o the price is 18.9% above the long average, which says the uptrend is still in play. But being above it also warns that the coin has already risen a lot. That’s where the RSI comes in—today it’s 76.9. When it goes above 70, the move is stretched. That doesn’t mean it will fall tomorrow, and nobody knows that. It just means that anyone entering now pays a high entry price.
The common mistake is looking only at today’s price and thinking it tells the future. The chart shows what has already happened. The long average filters out the day-to-day noise and reveals the structure. If the price were below it, the trend would be down, and a high RSI would just be a bounce.
With the price above and the RSI elevated, what I do is either wait for a pullback or enter with less. Patience is worth more than rushing at times like this.
Tap $BTC aqui in the text and look at the chart. Do you usually look at the long average before deciding, or do you only look at today’s price?
In $BTC o the price is 18.9% above the long average, which says the uptrend is still in play. But being above it also warns that the coin has already risen a lot. That’s where the RSI comes in—today it’s 76.9. When it goes above 70, the move is stretched. That doesn’t mean it will fall tomorrow, and nobody knows that. It just means that anyone entering now pays a high entry price.
The common mistake is looking only at today’s price and thinking it tells the future. The chart shows what has already happened. The long average filters out the day-to-day noise and reveals the structure. If the price were below it, the trend would be down, and a high RSI would just be a bounce.
With the price above and the RSI elevated, what I do is either wait for a pullback or enter with less. Patience is worth more than rushing at times like this.
Tap $BTC aqui in the text and look at the chart. Do you usually look at the long average before deciding, or do you only look at today’s price?