

khalid١١
29 Posts

khalid١١
Report
Block User
صانع محتوى تعليمي|متداول و أبسط التداول والبلوكتشين من Binance Academy|التعلم قبل التداول هو طريق النجاة
Open Trade
Occasional Trader
3 Years
1 Following
13 Followers
31 Liked
Posts
Portfolio
·
--
See translation
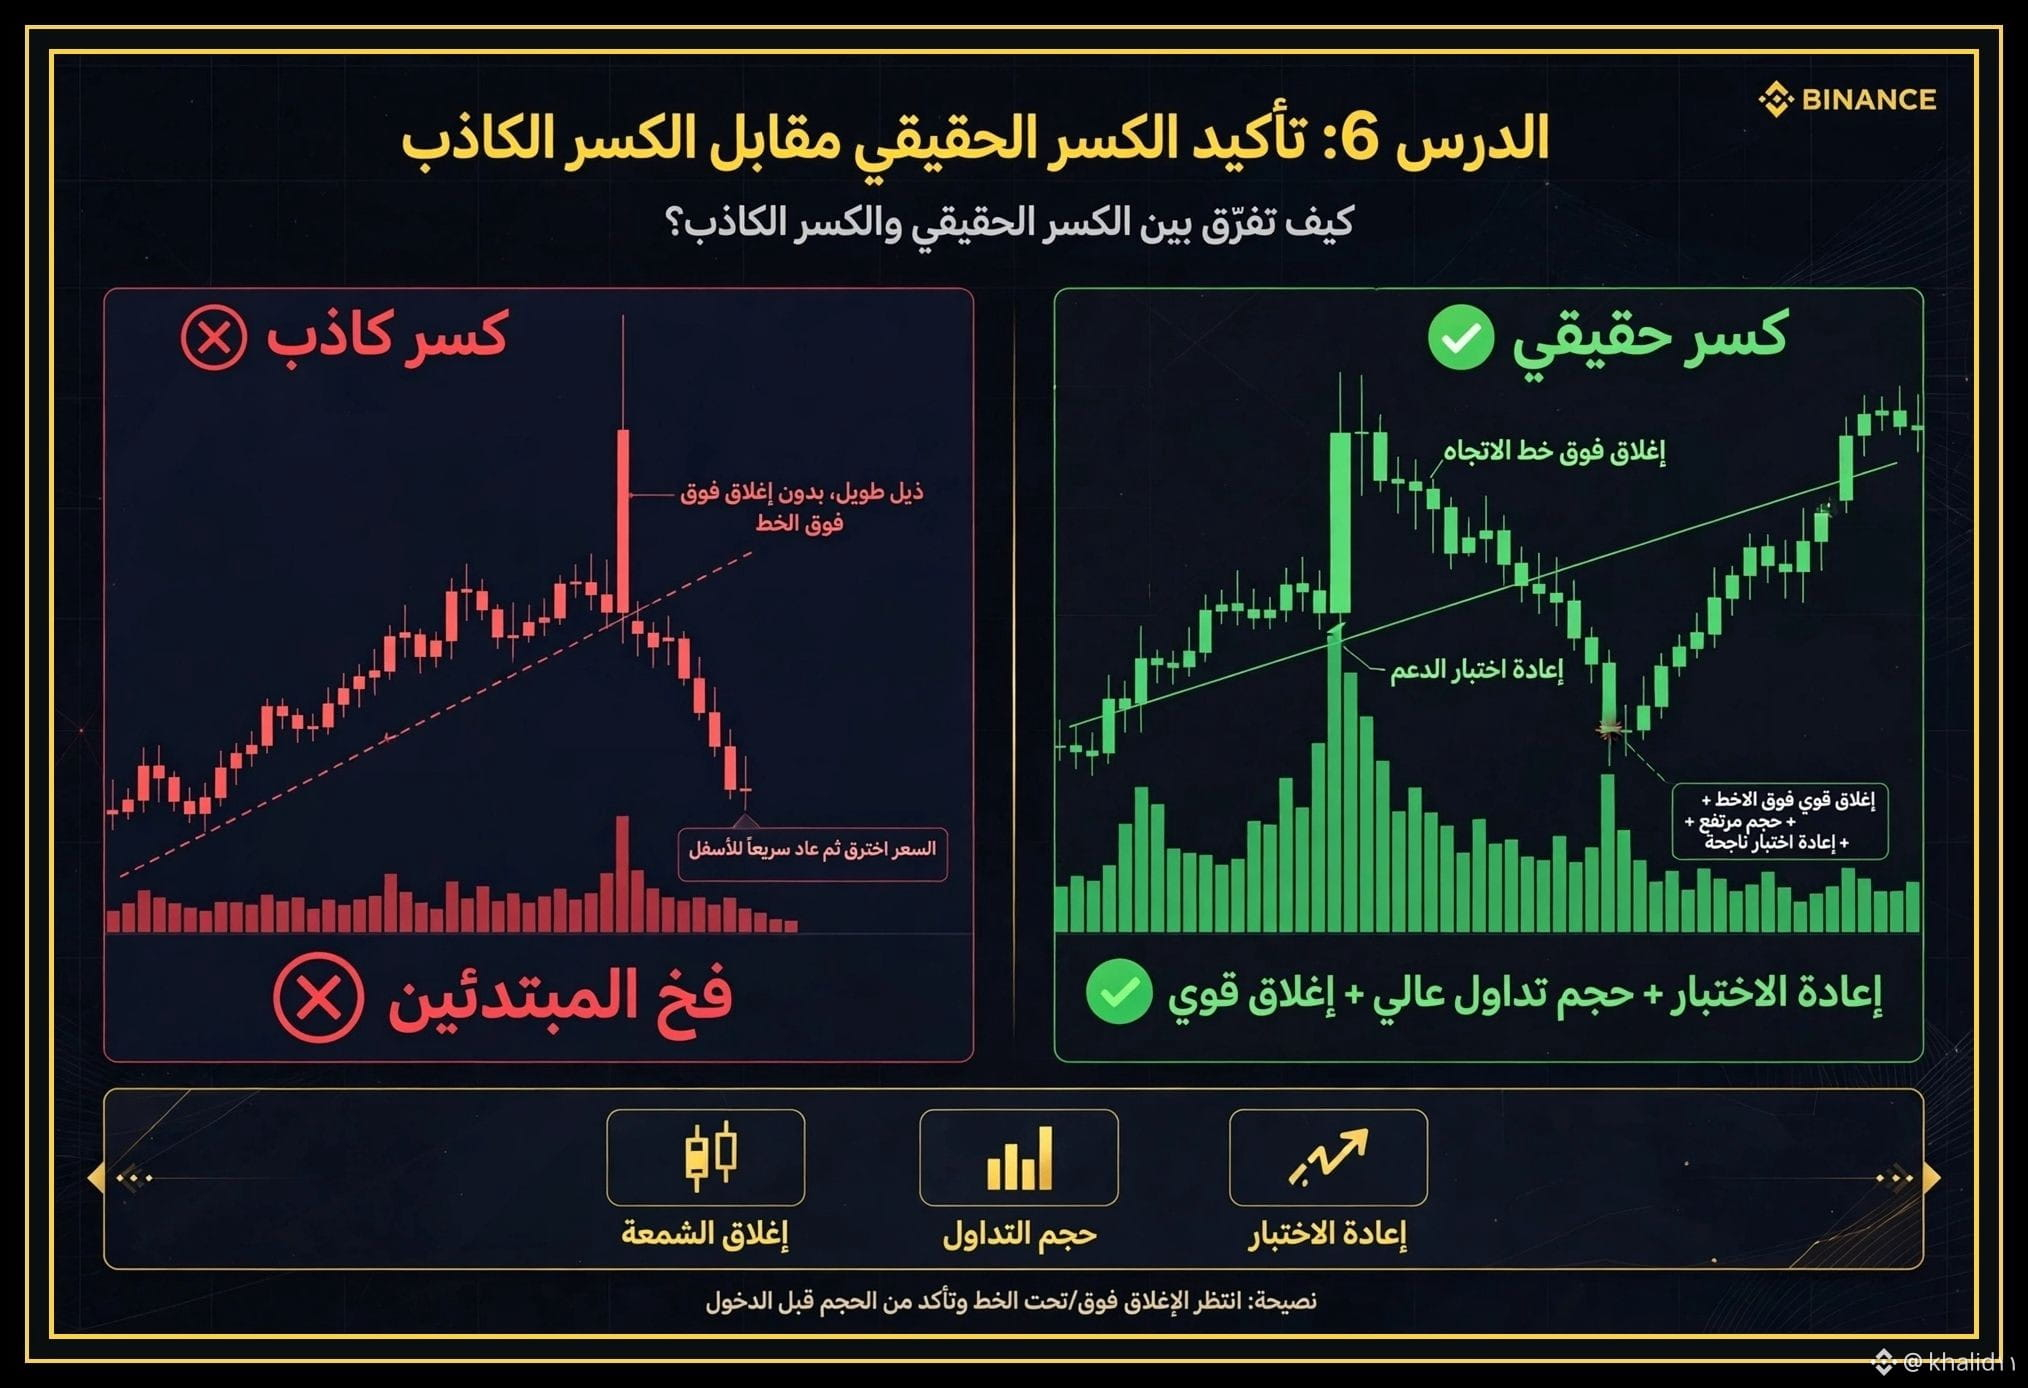
📚 الدرس السادس: كيف تتأكد من الكسر الحقيقي وتتجنب فخ الكسر الكاذب؟
سلسلة تعليم التداول من الصفر - للمبتدئين
في الدرس الخامس تعلمنا الفرق بين الكسر الكاذب والحقيقي.
اليوم سأعطيك 3 قواعد ذهبية للتأكد قبل دخول أي صفقة بعد الكسر:
1️⃣ إغلاق الشمعة، وليس اللمسة:
لا تدخل بمجرد أن يلمس السعر خط الترند. انتظر إغلاق شمعة كاملة (4 ساعات أو يومي) فوق الخط. اللمسة خدعة، والإغلاق هو التأكيد.
2️⃣ حجم التداول هو الشاهد:
الكسر الحقيقي يرافقه انفجار في حجم التداول (Volume). أما الكسر الكاذب فيحدث بحجم ضعيف، كأن السوق يهمس وليس يصرخ.
3️⃣ إعادة الاختبار (Retest):
أقوى الكسور تعود لاختبار المستوى المكسور كدعم جديد. إذا عاد السعر واحترم المستوى، فهذه إشارة دخول آمنة بنسبة 80%.
⚠️ الخلاصة: لا تكن من المتسرعين الذين يدخلون عند أول كسر. المحترف ينتظر التأكيد، والمبتدئ يدفع ثمن العجلة.
هل وقعت من قبل في فخ الكسر الكاذب؟ شاركني تجربتك في التعليقات.
#تعليم_التداول #التحليل_الفني #التداول_للمبتدئين #Binance_Academy #Khalid_Crypto
#Crypto_Education
1
22
·
--
See translation
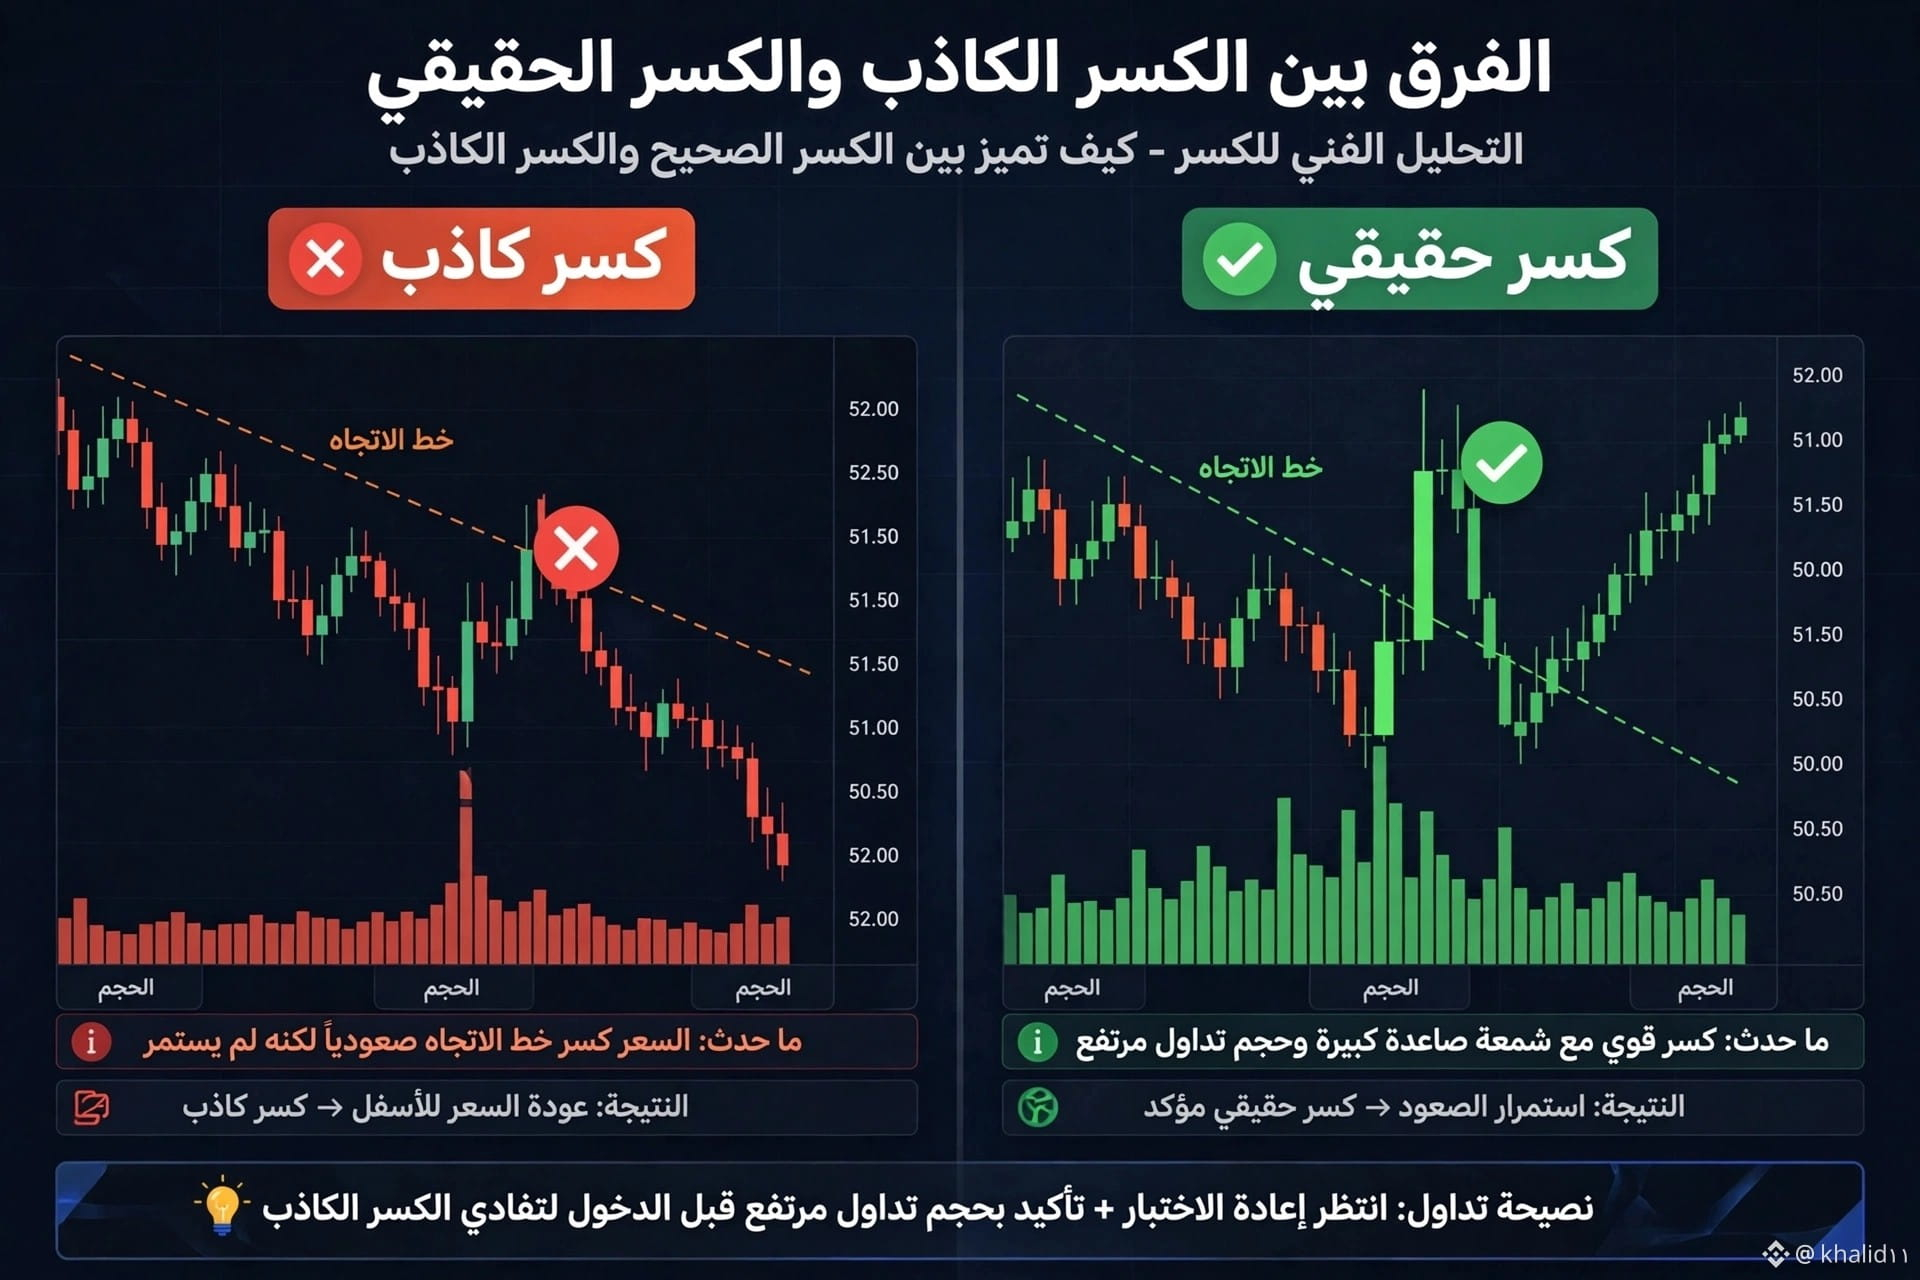
📚 الدرس الخامس: الفرق بين الكسر الحقيقي والكسر الكاذب
سلسلة تعليم التداول من الصفر - للمبتدئين
أكبر فخ يقع فيه المبتدئون: يرون السعر يكسر الترند، يدخلون مباشرة، ثم يعود السعر ويضرب وقف الخسارة! هذا هو الكسر الكاذب.
كيف تميز بينهما؟ إليك القاعدة الذهبية التي أنقذتني لسنوات:
✅ علامات الكسر الحقيقي:
1. شمعة كبيرة وقوية تغلق خارج الترند، وليس مجرد ذيل.
2. حجم تداول مرتفع جداً وقت الكسر - هذا يعني أن كبار المتداولين دخلوا.
3. إعادة اختبار: بعد الكسر، يعود السعر ليلمس الترند مرة أخرى ثم ينطلق.
❌ علامات الكسر الكاذب:
1. شمعة صغيرة أو بذيل طويل فقط كسرت الترند.
2. حجم تداول ضعيف - لا يوجد دعم من السوق.
3. السعر يعود بسرعة داخل الترند في نفس الشمعة أو التي تليها.
💡 قاعدتي الذهبية:
لا تدخل أبداً لحظة الكسر! انتظر دائماً إعادة الاختبار + شمعة تأكيد بحجم تداول مرتفع. هذه القاعدة وحدها ستوفر عليك 70% من الخسائر.
سؤال مهم: هل وقعتم من قبل في فخ الكسر الكاذب؟ وكيف تعاملتم معه؟ شاركوني تجاربكم في التعليقات 👇
#تداول #تعليم_التداول #التحليل_الفني #الكسر_الكاذب #BinanceSquare #BinanceAcademy #فوركس #كريبتو #نصائح_تداول $
1
79
·
--
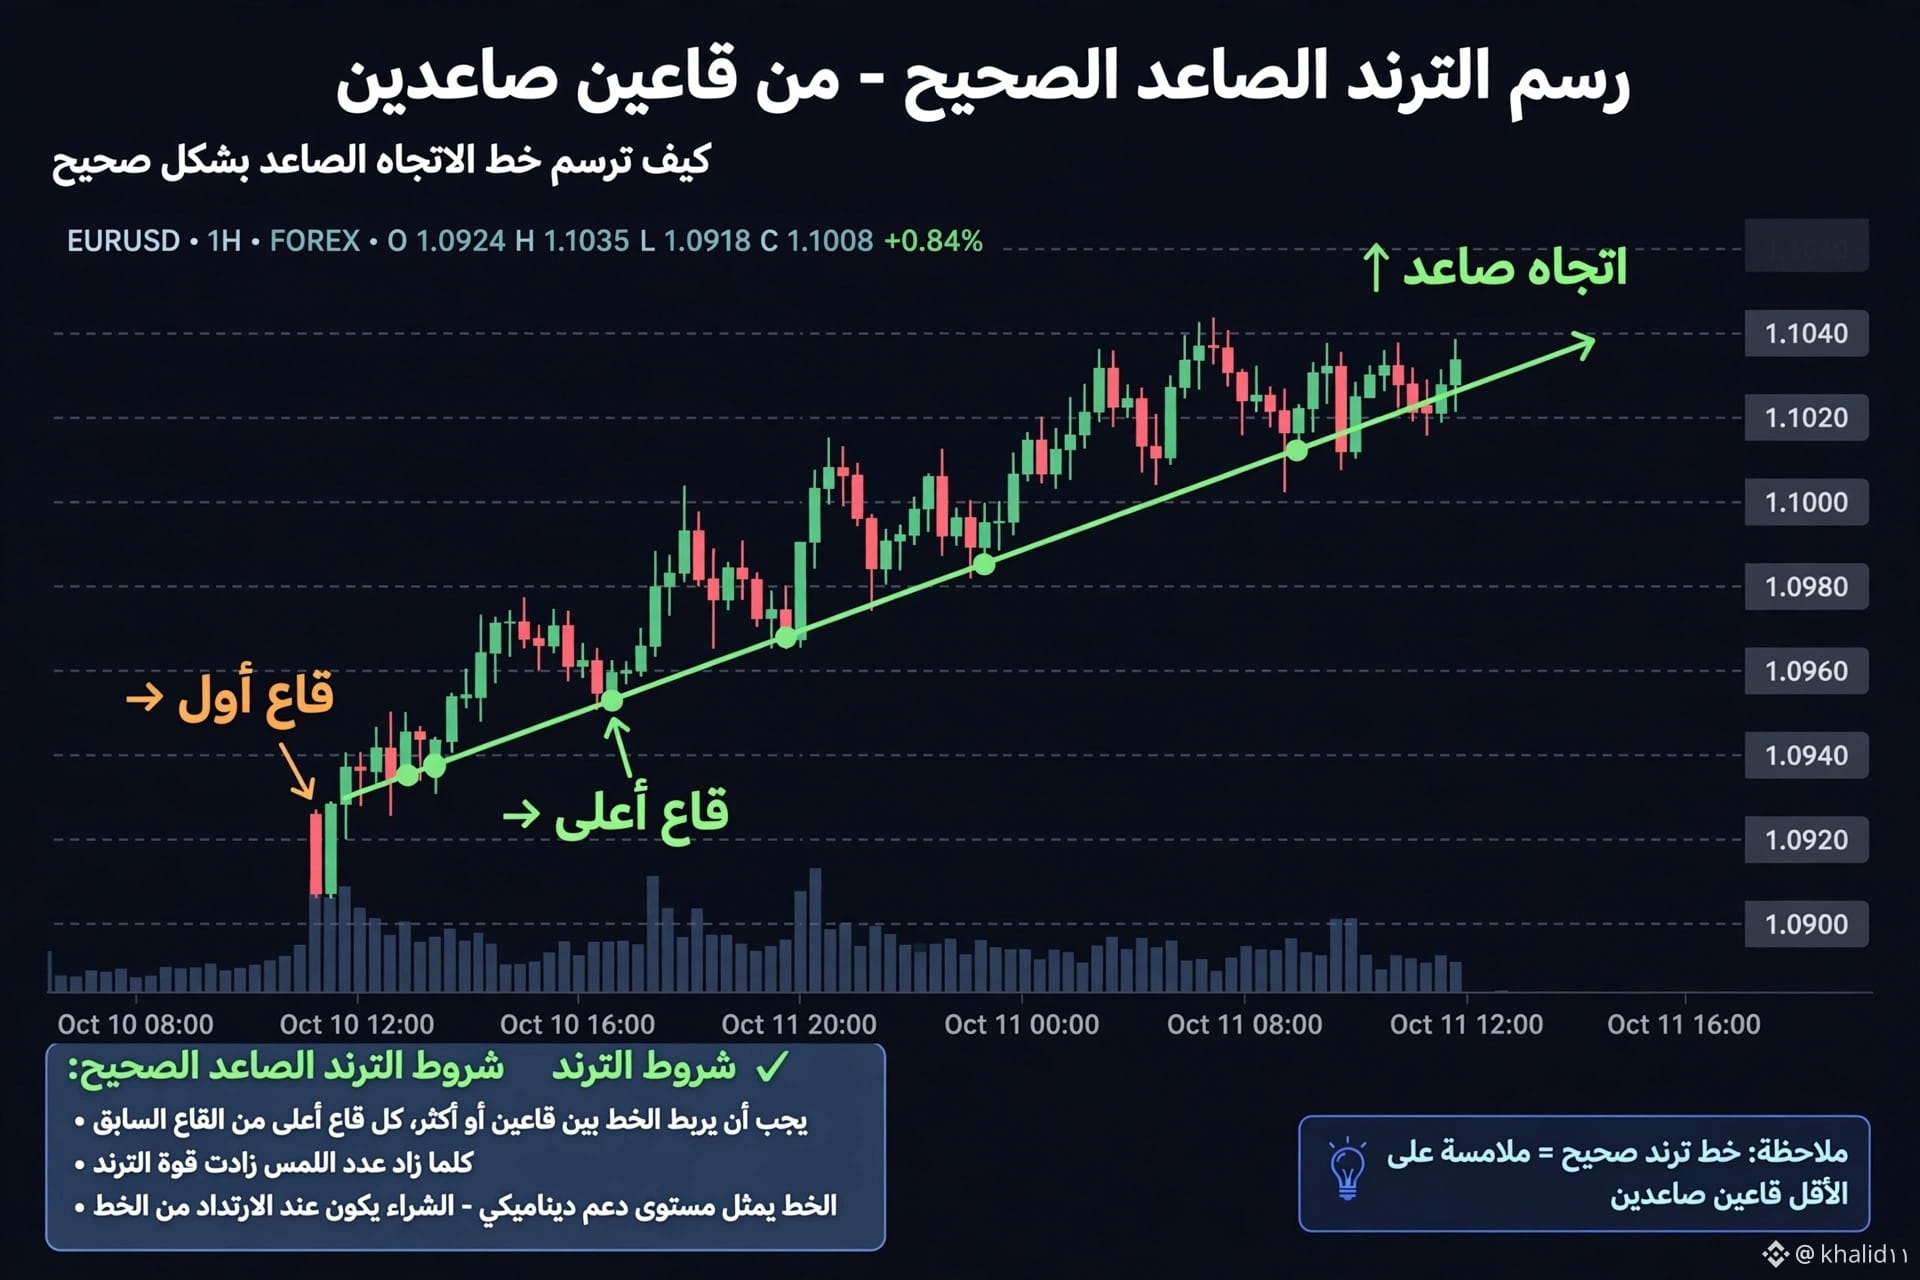
📚 Lesson Four: How to Draw an Uptrend Line Correctly?
Trading Education Series from Scratch - For Beginners
90% of beginner traders make the same mistake when drawing a trendline: they connect any two lows, ending up with dozens of random lines on the chart!
The correct method I’ve been using for 6 years:
✅ Conditions for a valid uptrend:
1. The line should connect two or more lows, with each low higher than the previous one.
2. The more times the price touches the line, the stronger the trend.
3. Draw the line across the candlestick bodies, not just the wicks.
4. The line represents a dynamic support level—buying opportunities arise when the price bounces off it.
❌ Common mistake:
Drawing the trendline on a short time frame (1 minute) and then trading based on it. The right approach is to draw the trendline on the 4-hour chart and enter your trade on the 15-minute chart.
💡 Important note:
A trendline break with a strong candle + high trading volume = a strong signal of a trend reversal. This is called a Break of Structure, which we covered in Lesson Three.
Question for you: Do you draw trendlines using the wicks or the candlestick bodies? Share your method in the comments 👇
#Trading #TradingEducation #TechnicalAnalysis #Trendline #BinanceSquare #BinanceAcademy #Forex #كريبتو
1
42
·
--
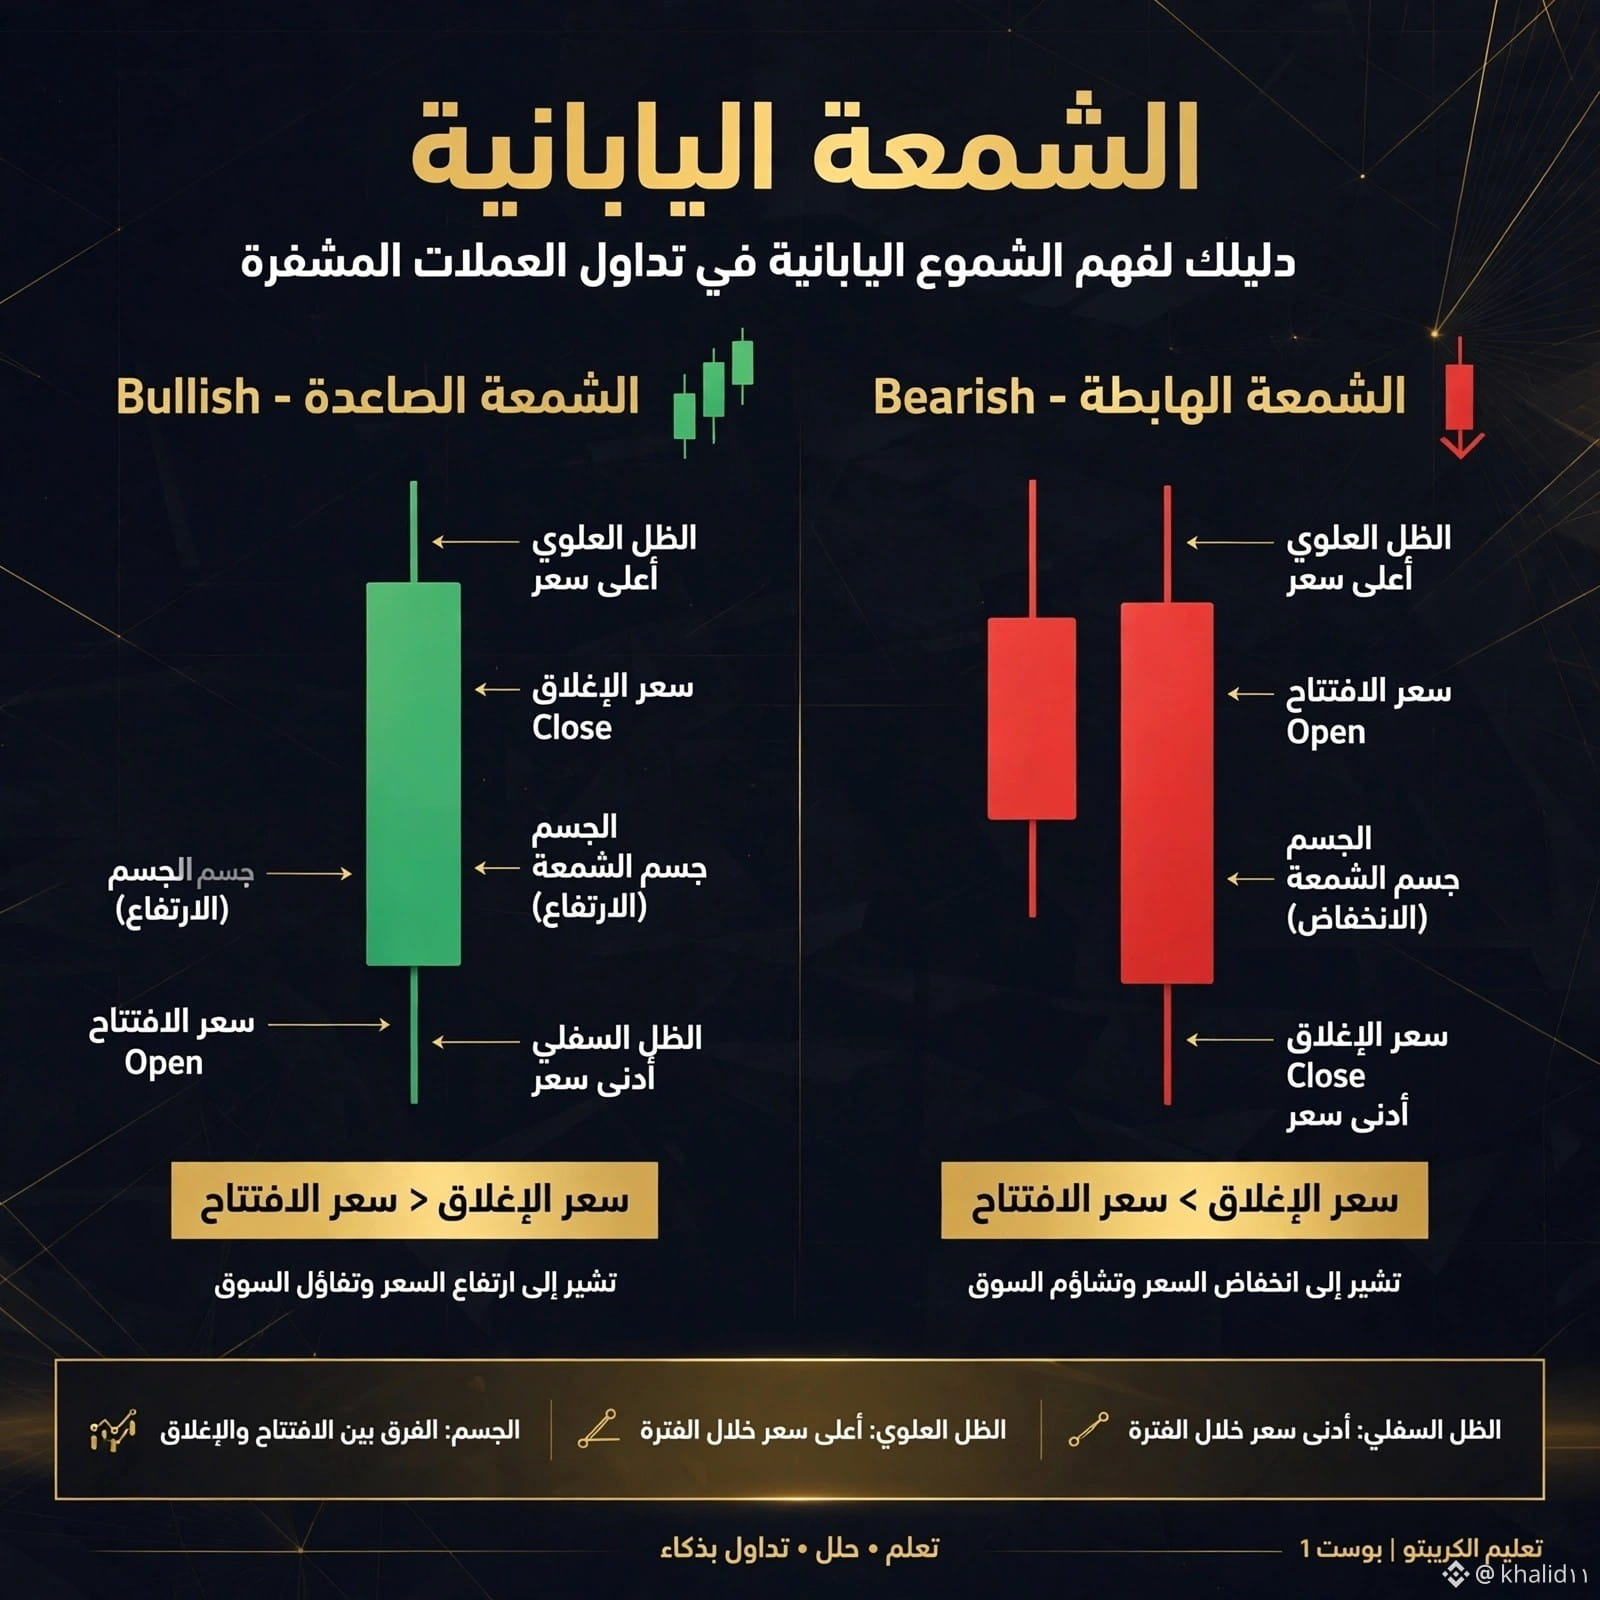
Do you know what a Japanese candlestick is? 🕯️
It’s the foundation of reading any trading chart!
🟢 Green candle (Bullish): Closing price > opening price = buyers are in control
🔴 Red candle (Bearish): Closing price < opening price = sellers are in control
Upper wick = highest price
Lower wick = lowest price
Body = difference between the opening and closing prices
Learning to read candlesticks = the first step to surviving in the market.
Follow me—I’ll explain a new concept from Binance Academy in simple terms every day.
#BTC #Trading #TechnicalAnalysis #BinanceAcademy #تعلم_الكريبتو
1
41
·
--
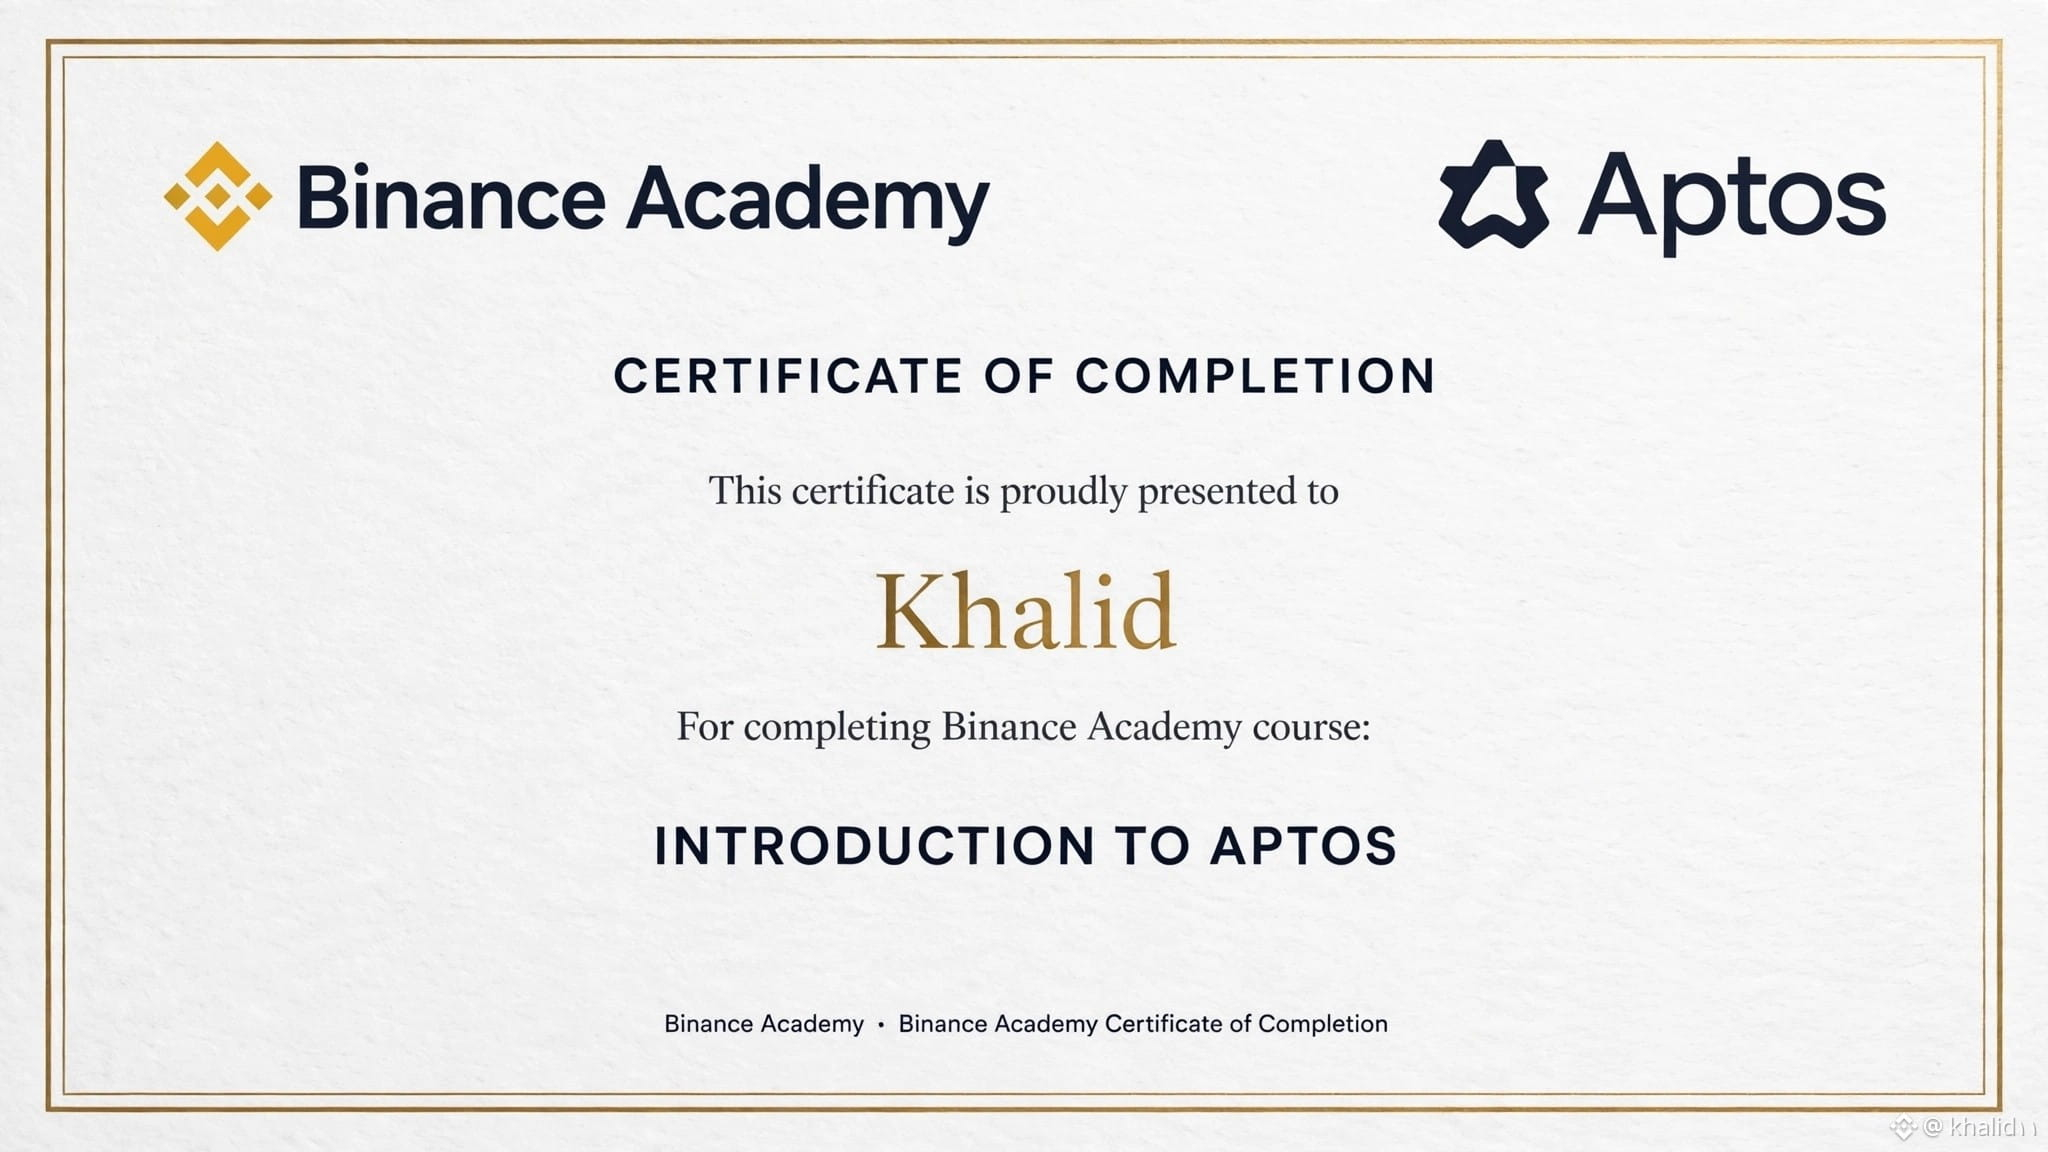
🎓 The learning journey continues
I completed the Introduction to Aptos course from Binance Academy.
I’m sharing this not to show off, but to reaffirm a principle I believe in:
A successful trader is a lifelong learner.
With every course I take, I simplify what I learn for you in our educational series.
#BinanceAcademy #ContinuousLearning #مصداقية
2
358
·
--
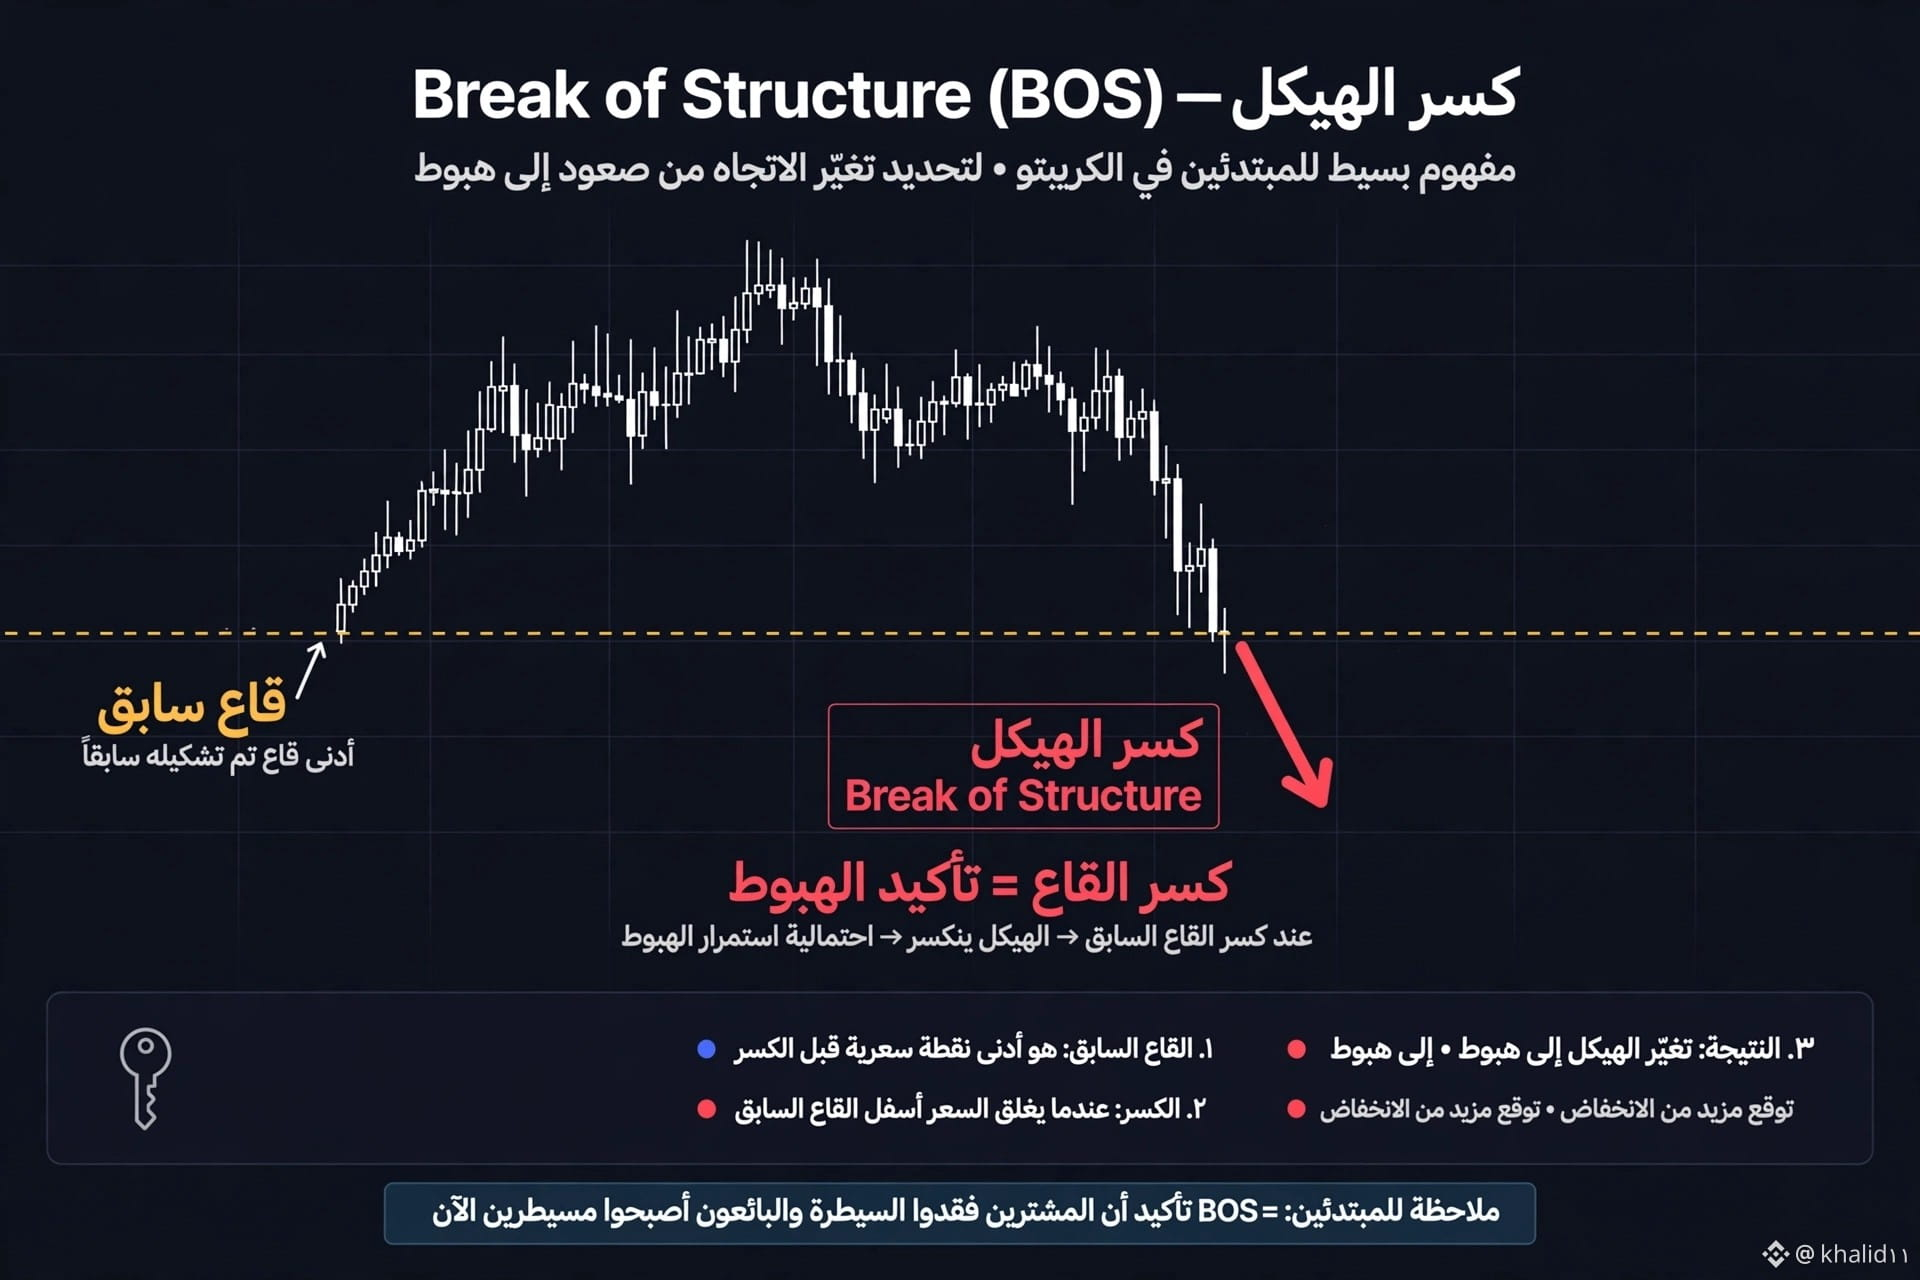
📚 Lesson 3: Break of Structure (BOS) — The most important signal confirming a downtrend
Many people ask: How can I be sure the downtrend will continue?
The answer is: BOS
What is a break of structure, simply put?
Imagine the price was rising, then formed a low.
When the price comes back and breaks below that low, it means buyers have lost control.
In the image:
1️⃣ Previous low: The last point the price reached before rising
2️⃣ The break: The price closes a candle below the previous low
3️⃣ The result: The structure has changed from bullish to bearish
This is the moment when it becomes clear that sellers are now in control.
The golden rule:
Don’t look to sell aggressively until a clear break of structure has occurred.
Tomorrow, in Lesson 4, I’ll explain: Why isn’t every high considered resistance? (The mistake 90% of beginners make)
Was the explanation clear? Leave the word "Clear" in the comments.
#TradingEducation #TechnicalAnalysis #PriceAction #BOS #BreakOfStructure #تداول
1
88
·
--
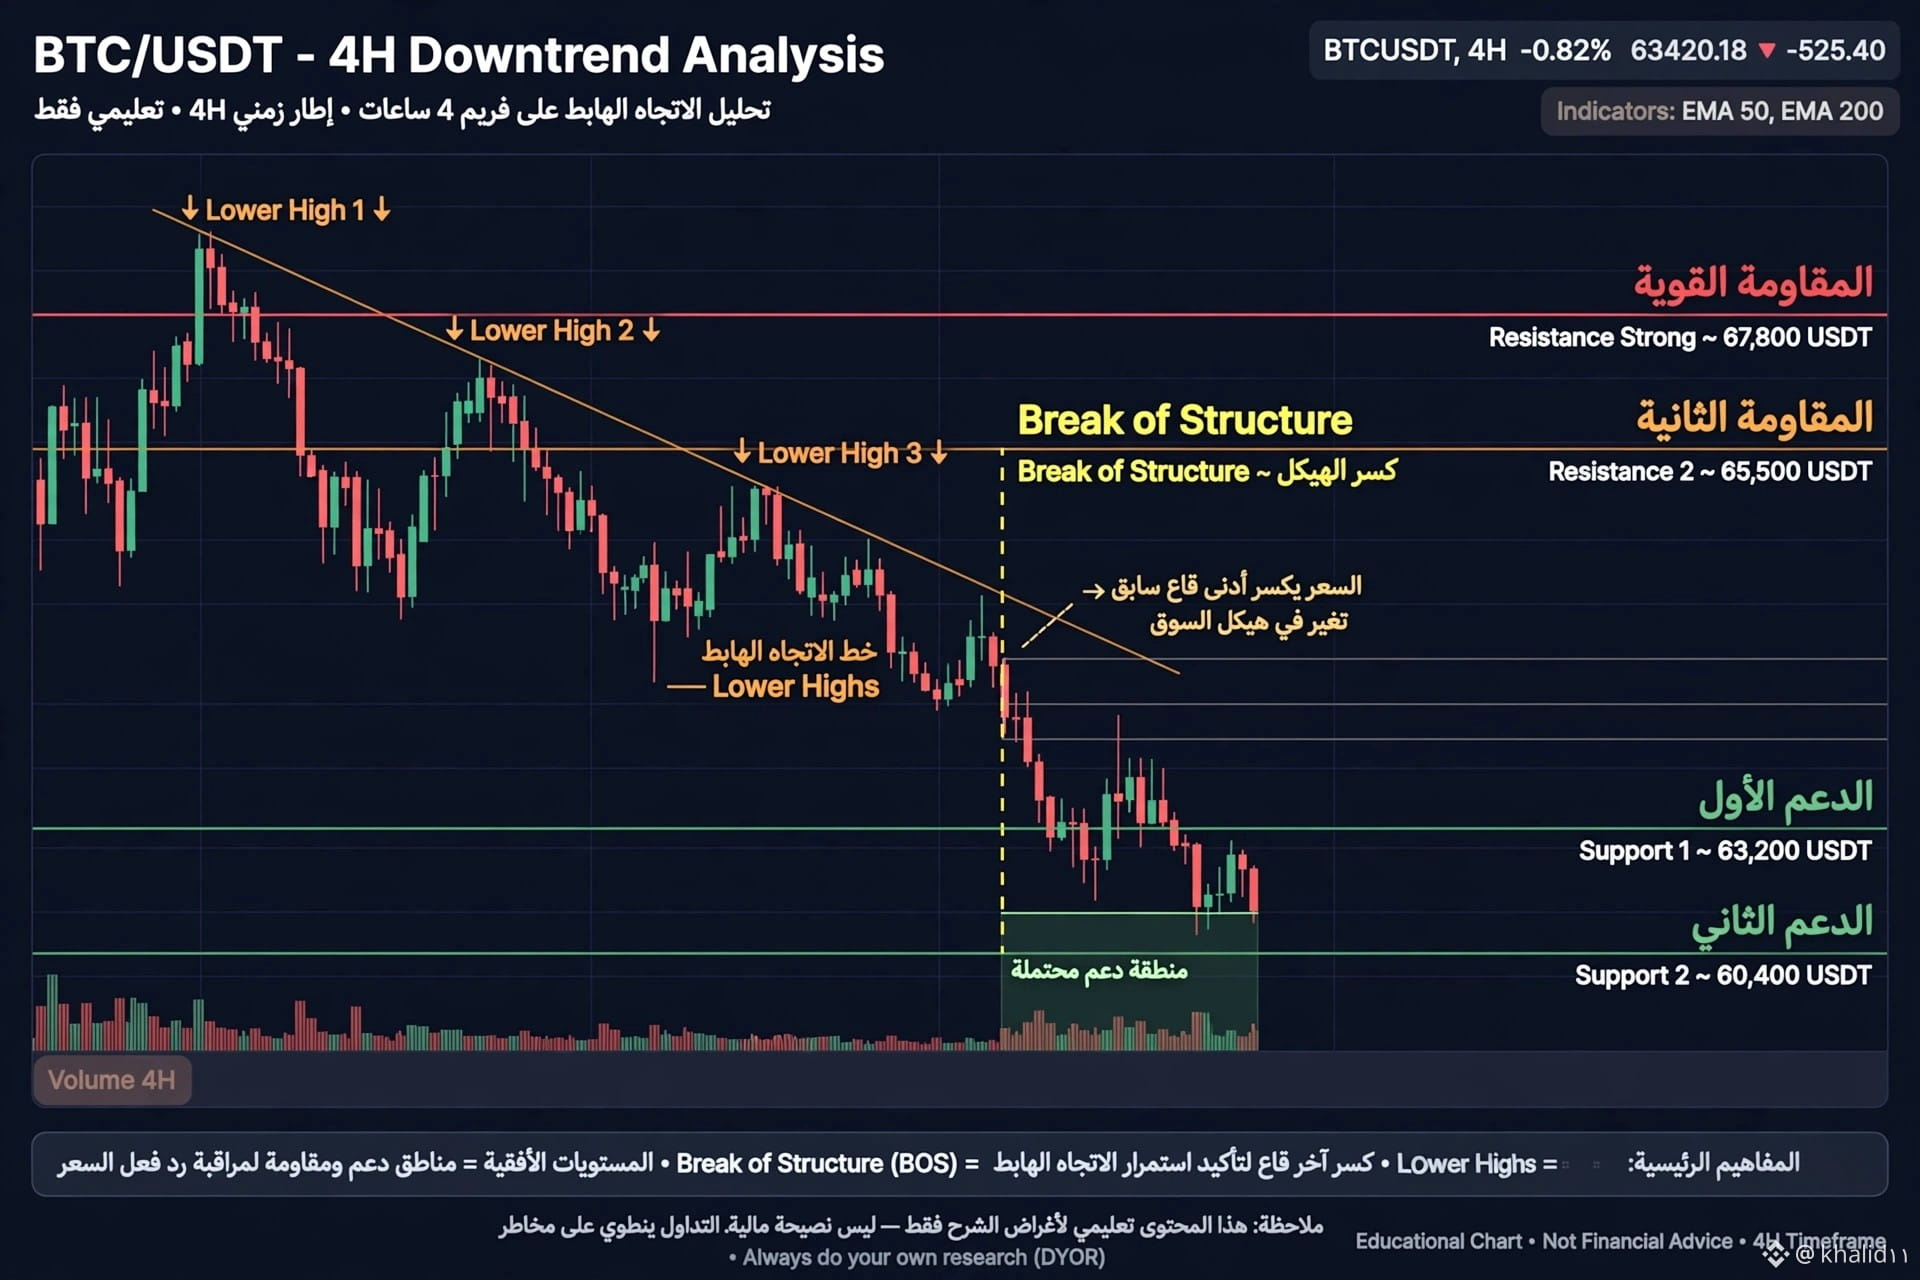
🔥 How do I identify a downtrend without indicators? (My method after 6 years of experience)
90% of traders lose because they see any high and call it resistance!
I use 3 simple rules, without overcomplicating things:
1️⃣ Lower Highs = each new high is lower than the previous one
2️⃣ Break of Structure (BOS) = price breaks the latest low to confirm the downtrend is still continuing
3️⃣ Horizontal levels = support and resistance zones for watching the price reaction
Here's a real example on the 4-hour chart:
🔴 Strong resistance: ~ $67,800
🟠 Second resistance: ~ $65,500
🟢 First support: ~ $63,200
🟢 Second support: ~ $60,400
My golden rule:
In a downtrend, look only for selling opportunities. Don't look to buy until a clear bullish structure break appears.
If you found this useful, leave me a 🔥 in the comments. If you'd like, I'll explain the exact entry in the next post.
#BTC #BNB #TradingStrategy #PriceAction #CryptoEducation #Trading_Education
1
77
·
--
🔥 How do I spot a downtrend without indicators? (My method after 6 years)
90% of traders lose money because they see any high and call it resistance.
I use just one rule:
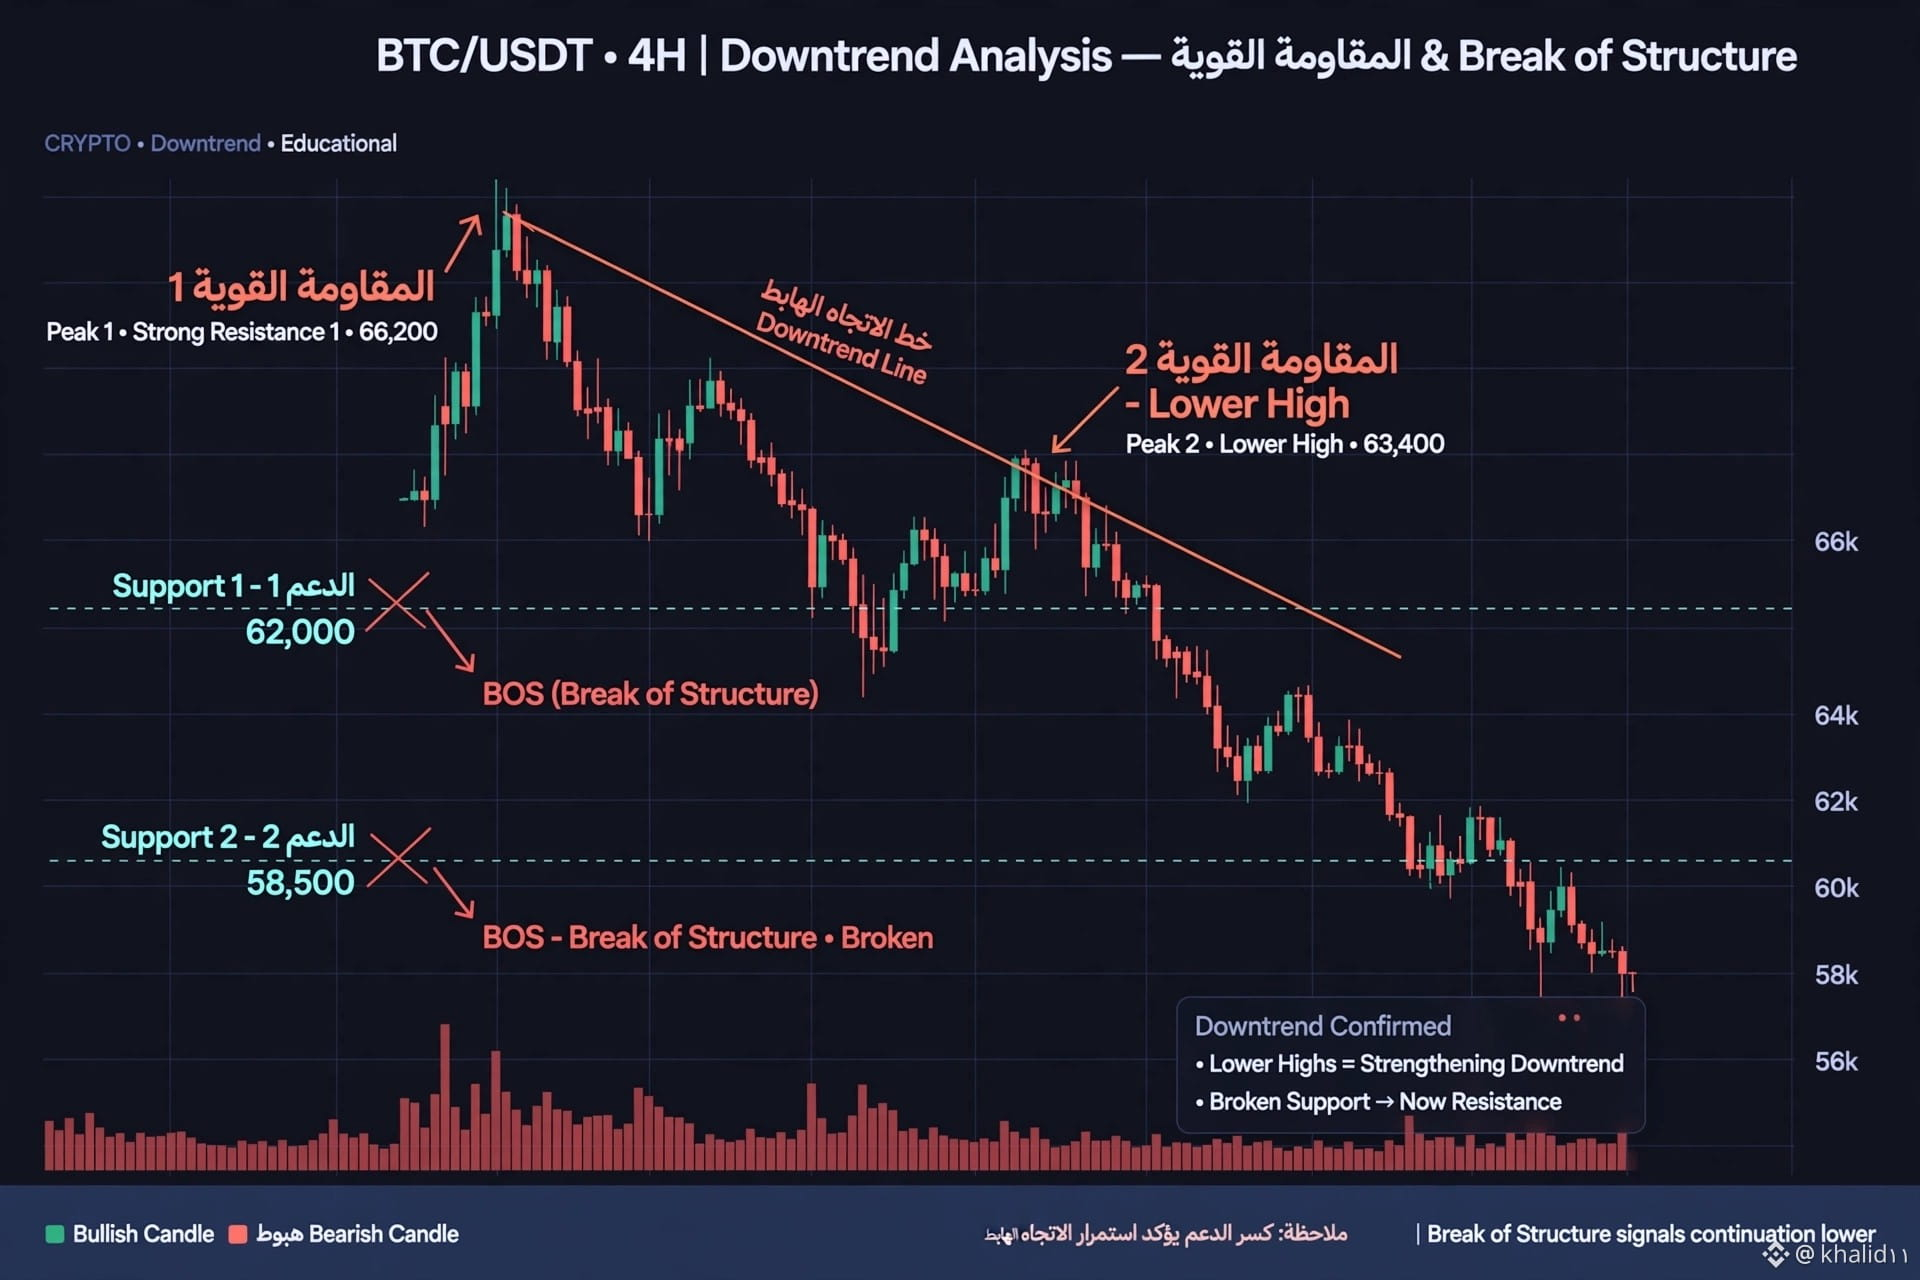
Strong resistance = a high that broke support, and that support had previously broken resistance.
High 1: Strong resistance because it broke support that had broken old resistance.
High 2: Also strong resistance, and it’s lower than High 1.
If you find two highs with these characteristics, and the second is lower than the first, that confirms a downtrend.
Where do I sell?
I don’t sell right at resistance. I wait for the price to return to it, switch to the 5-minute timeframe, look for the most recent minor low to break, then enter a short trade on the 15-minute timeframe.
This is what helped me become profitable after years of losses.
$BTC $BNB #Bitcoin #TechnicalAnalysis #SMC #BOS #Trading #BinanceSquare #CryptoTrading
1
127
·
--
Bearish
See translation
🚀 BTC فوق 81K + BNB يقود السوق اليوم!
Bitcoin راجع فوق $81,400 اليوم قبل قرار الفيدرالي، بزيادة +2.27% 🚀
والنجم الحقيقي هو BNB! اليوم 28 أكتوبر تم تفعيل Jenner Hard Fork على شبكة BNB Testnet، وفيه Payment Lane جديد + تقنية CAS20 للعملات المستقرة. BNB وصل $760 بصعود +2.98% وهو العملة الوحيدة الخضراء في التوب 10 خلال آخر 7 أيام!
السوق كامل أخضر، و BNB هو الأقوى!
شنو توقعاتكم؟ واش BNB غادي يكسر $800 هذا الأسبوع؟ واش BTC غادي يوصل $82.5K الليلة؟
#BTC #BNB_Market_Update
1
1
106
·
--
🚀 BTC above 81K today + BNB is the strongest!
BTC is bouncing back strongly after the Fed decision, and BNB is up +2.22% today after activating a new Jenner Hard Fork with Payment Lane!
I’m optimistic—will BTC break 82.5K tonight?
#BTC #BNB #Crypto
$BTC $BNB
{future}(BNBUSDT)
🚀 BTC above 81K today + BNB is the strongest!
BTC is bouncing back strongly after the Fed decision, and BNB is up +2.22% today after activating a new Jenner Hard Fork with Payment Lane!
I’m optimistic—will BTC break 82.5K tonight?
#BTC #BNB #Crypto
$BTC $BNB
BTC is bouncing back strongly after the Fed decision, and BNB is up +2.22% today after activating a new Jenner Hard Fork with Payment Lane!
I’m optimistic—will BTC break 82.5K tonight?
#BTC #BNB #Crypto
$BTC $BNB
1
89
·
--
#FOMCWatch I expected an interest rate cut, but the Fed is going to hold rates at 3.75%-4%, according to the latest news!
This means BTC$ could stay below $80K for a while, but BNB$ is strong and could reach $2,000 in the medium term, according to an AI analysis from Binance Academy! 📊
What are your predictions after tomorrow’s decision? 👇
This means BTC$ could stay below $80K for a while, but BNB$ is strong and could reach $2,000 in the medium term, according to an AI analysis from Binance Academy! 📊
What are your predictions after tomorrow’s decision? 👇
1
2
·
--
🚨 Will BNB break the $2,000 barrier after the Fed’s decision? #FOMCWatch
I noticed at Binance Academy that whenever the Fed cuts interest rates, cryptocurrencies like BNB surge! 📈
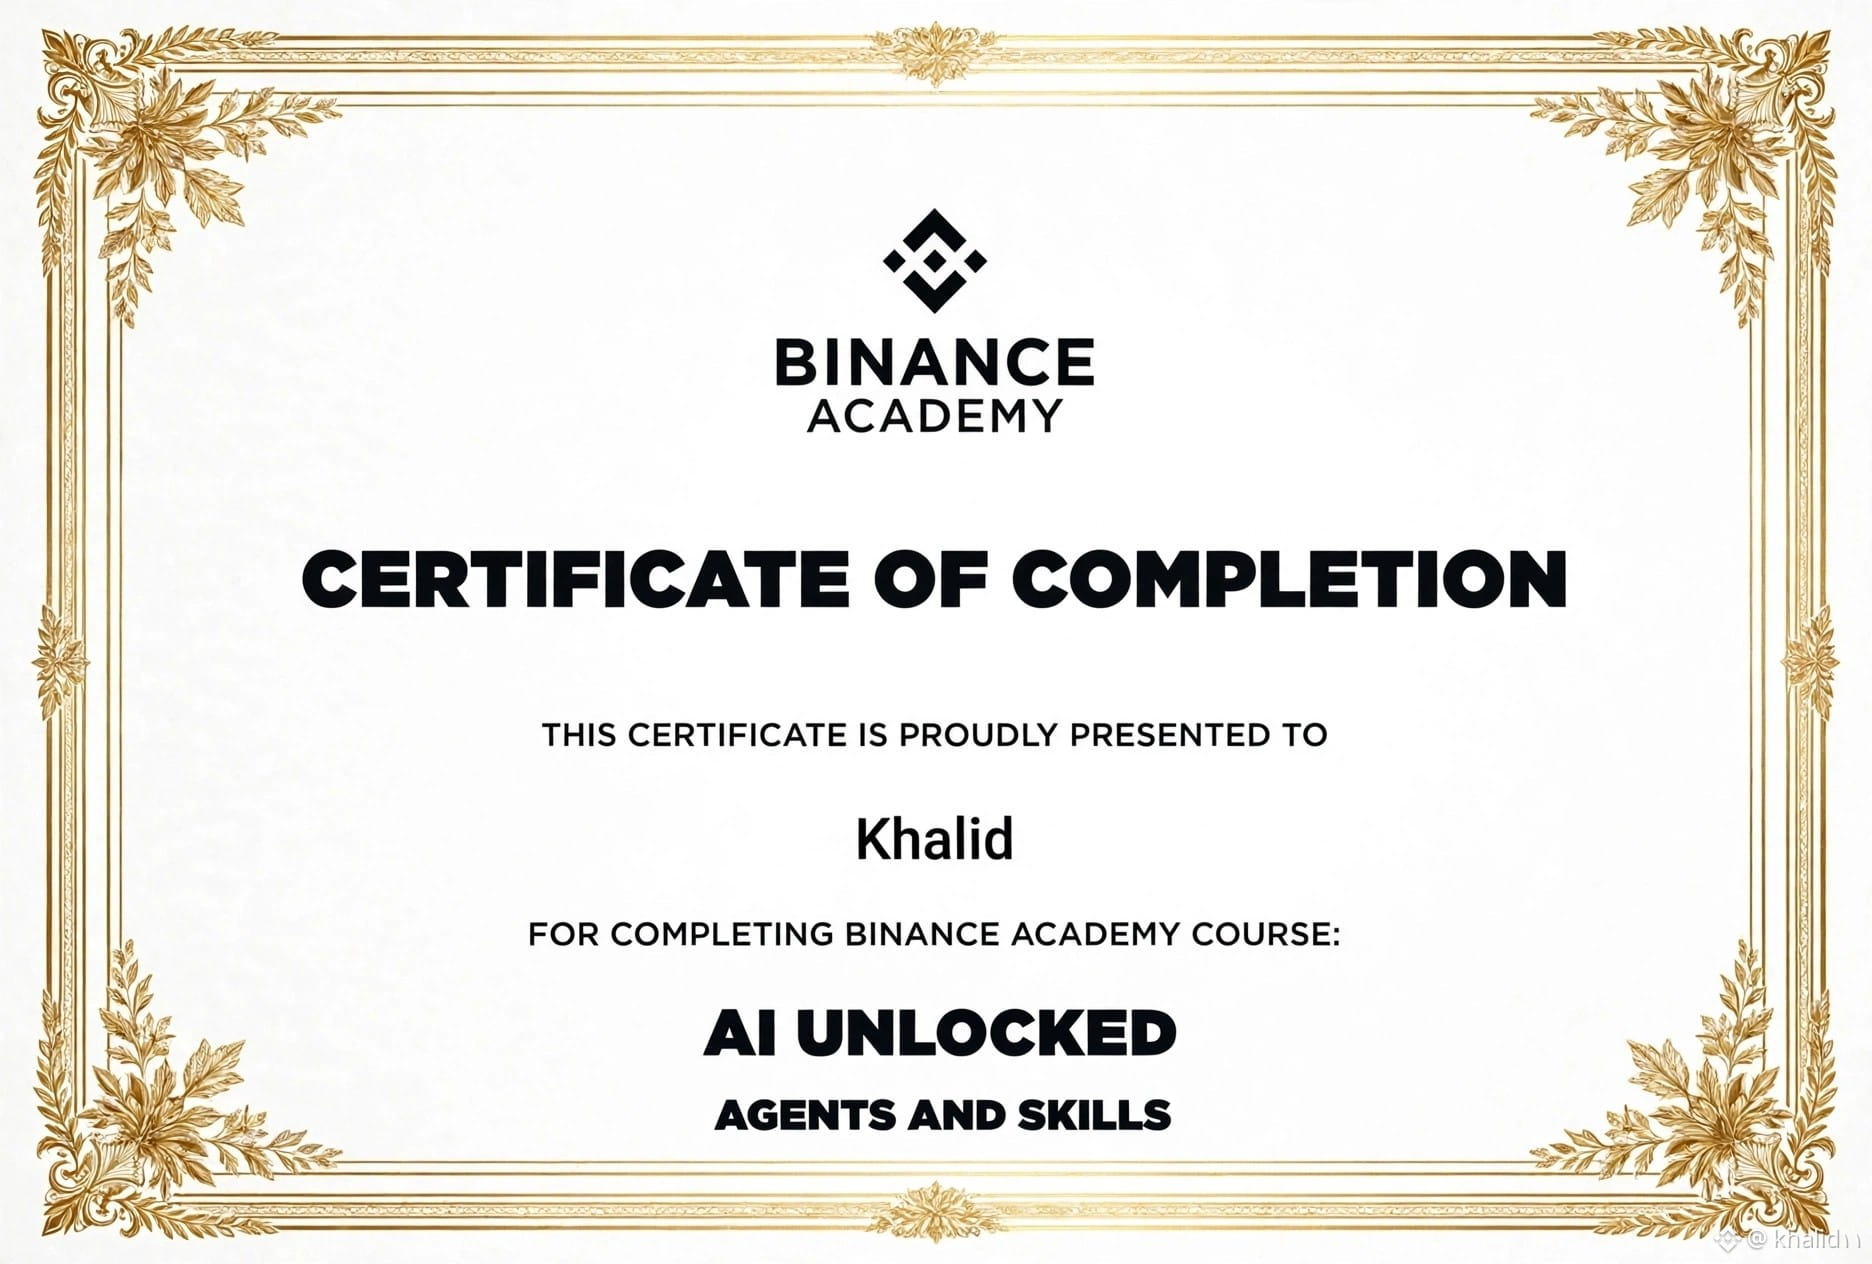
I earned the AI UNLOCKED: AGENTS AND SKILLS certificate from Binance Academy and learned how AI can analyze the market.
My prediction: If the Fed cuts interest rates this week, BTC$ will climb back above $80K, and BNB$ will follow!
What do you think? 🤔
#FOMCWatch #BitcoinSlipsBelow80KAgain #BNB #BinanceAcademy #AI
1
57
·
--
$BTC is holding strong and $BNB is quietly building...
Who do you think will surprise us more this week? 👇
The king $BTC or the ecosystem’s engine $BNB?
#BNB #BTC #Binance
$BTC is holding strong and $BNB is quietly building...
Who do you think will surprise us more this week? 👇
The king $BTC or the ecosystem’s engine $BNB?
#BNB #BTC #Binance
Who do you think will surprise us more this week? 👇
The king $BTC or the ecosystem’s engine $BNB?
#BNB #BTC #Binance
1
42
·
--
🚀 I completed the second level on Binance Academy!
I used to think $BNB was just a trading coin, but after studying the Beginner Track, I learned 3 amazing things:
1️⃣ $BNB is burned every 3 months (BNB Auto-Burn) — meaning the supply decreases and the price goes up!
2️⃣ You can use it to pay gas fees on BNB Chain at a lower cost
3️⃣ The more Binance AI Pro is used, the greater the demand for $BNB
In my opinion, this is why $BNB could reach $2000 in 2026! 🔥
What do you think? Is $BNB the best investment right now, or is $BTC still king? 👇
#BNB #BTC #BinanceAcademy #CryptoMorocco #BinanceSquare
1
59
·
--
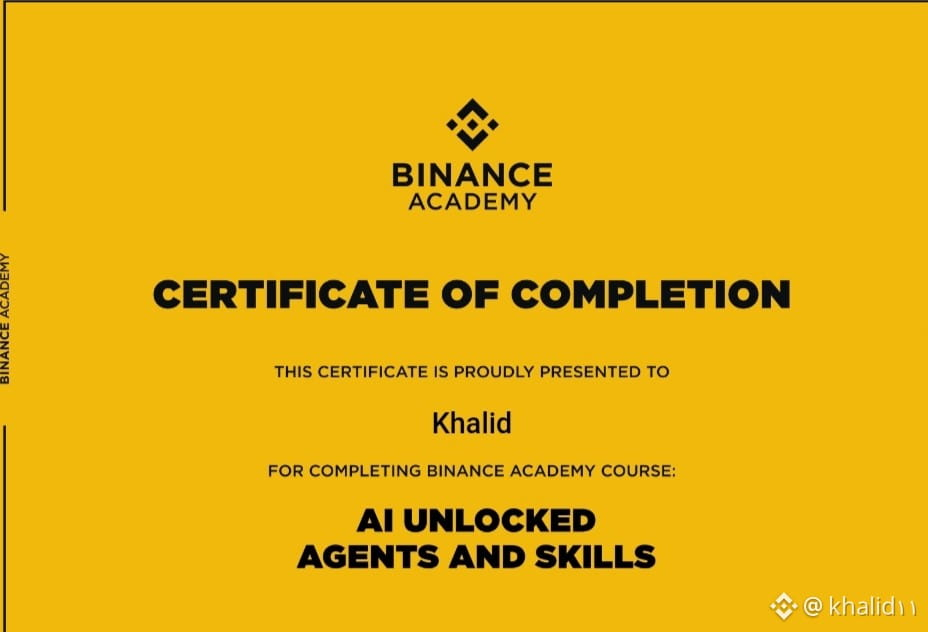
🎓 Praise be to God! I got the AI UNLOCKED: AGENTS AND SKILLS certificate from Binance Academy! 🚀
An accredited certificate in my name, Khalid, from Binance!
Artificial intelligence + $BNB = the future! AI is going to change everything in the crypto world.
A free and very useful course, I recommend anyone interested in Web3 to complete it!
#BNB #AI #BinanceAcademy #BinanceSquare #Crypto
An accredited certificate in my name, Khalid, from Binance!
Artificial intelligence + $BNB = the future! AI is going to change everything in the crypto world.
A free and very useful course, I recommend anyone interested in Web3 to complete it!
#BNB #AI #BinanceAcademy #BinanceSquare #Crypto
1
65
·
--
🚀 Will $BNB break 2000$ soon? My analysis after the launch of Binance AI Pro
I noticed that Binance has started integrating smart tools for market analysis into Pro.
In my opinion, this will be a game changer for small-scale traders, because AI will help with:
1. Quickly analyzing coins like $BNB and $BTC
2. Reducing fear and greed in trading
3. Providing clearer entry and exit signals
I'm optimistic about $BNB in the medium term, especially given the strength of the Binance ecosystem.
What do you think? Will AI help you with trading?
#BNB #BTC #BinanceAI #Crypto
2
1
82
·
--
🚀 Where is $BTC headed after AI is integrated into trading?
I’ve noticed that Binance has started integrating smart tools for market analysis. This will change the game for small traders.
In my opinion, coins like $BNB and $ETH will benefit the most. I’m closely watching the AI sector take off.
What’s your strategy? Are you using AI tools in your analysis?
#BTC #BNB #AI #Crypto #BinanceSquare
1
109
Log in to explore more content
Join global crypto users on Binance Square
⚡️ Get latest and useful information about crypto.
💬 Trusted by the world’s largest crypto exchange.
👍 Discover real insights from verified creators.
Email / Phone number
Trending Topics
BinanceSAFUFundTransferCompleted7499BTC
18,433 views
515 Discussing
Binance Says SAFU Fund Transfer Completed, Covering 7,499 BTC
Binance News
·20 Likes
·7k views
BinanceRecovery90% of stolen assets
76,912 views
138 Discussing
YiHe:ProofOfReserves:10TokensAt100%Backing
98,336 views
594 Discussing