
PolinaK13
44 Posts

PolinaK13
Report
Block User
10 Following
29 Followers
44 Liked
Posts
All
Quotes
·
--
Not every opportunity in the market is a trade. Why?
On the chart, you may see a situation that looks very attractive:
price moves strongly → there’s potential to make money → you want to enter a position.
But the opportunity itself does not mean the trade is worth opening.
For example, you expect a stock move of 5%, but achieving that would require opening a position that is too large.
Or the potential profit looks attractive, but the possible loss if something goes wrong is much bigger.
Another scenario: you see a good level to enter, but liquidity is low, so executing a large position may happen at a less favorable price.
So before placing a trade, it’s worth looking not only at:
“How much can I make?”
but also at:
how much I can lose;
what position size is needed;
how liquid the market is;
whether this trade matches my risk level.
Sometimes the best decision is to see the opportunity, but not turn it into a position.
Because an opportunity on the chart is not yet a ready-to-go trade.
#Trading #RiskManagement
Not every opportunity in the market is a trade. Why?
On the chart, you may see a situation that looks very attractive:
price moves strongly → there’s potential to make money → you want to enter a position.
But the opportunity itself does not mean the trade is worth opening.
For example, you expect a stock move of 5%, but achieving that would require opening a position that is too large.
Or the potential profit looks attractive, but the possible loss if something goes wrong is much bigger.
Another scenario: you see a good level to enter, but liquidity is low, so executing a large position may happen at a less favorable price.
So before placing a trade, it’s worth looking not only at:
“How much can I make?”
but also at:
how much I can lose;
what position size is needed;
how liquid the market is;
whether this trade matches my risk level.
Sometimes the best decision is to see the opportunity, but not turn it into a position.
Because an opportunity on the chart is not yet a ready-to-go trade.
#Trading #RiskManagement
On the chart, you may see a situation that looks very attractive:
price moves strongly → there’s potential to make money → you want to enter a position.
But the opportunity itself does not mean the trade is worth opening.
For example, you expect a stock move of 5%, but achieving that would require opening a position that is too large.
Or the potential profit looks attractive, but the possible loss if something goes wrong is much bigger.
Another scenario: you see a good level to enter, but liquidity is low, so executing a large position may happen at a less favorable price.
So before placing a trade, it’s worth looking not only at:
“How much can I make?”
but also at:
how much I can lose;
what position size is needed;
how liquid the market is;
whether this trade matches my risk level.
Sometimes the best decision is to see the opportunity, but not turn it into a position.
Because an opportunity on the chart is not yet a ready-to-go trade.
#Trading #RiskManagement

166
·
--
The position is small. Why can the risk still be large?
At first glance:
“I opened a position of only $100. That’s not much.”
But the position size alone does not show the real risk.
Let’s imagine two accounts:
$100 position on a $10,000 account
→ that’s only 1% of the capital.
$100 position on a $200 account
→ that’s already 50% of the capital.
Same position—but completely different impact on the account.
There’s another nuance—leverage.
A $100 position can be opened using $20 of your own capital and leverage. Then even a relatively small price move will have a much larger impact specifically on the margin used.
So the question:
“How big is my position?”
is not always enough.
It’s more important to look at:
the position size relative to your total capital;
leverage level;
how much you can lose when the price moves against you;
the conditions of the instrument itself.
A small dollar position doesn’t always mean a small risk for your account.
Risk needs to be assessed relative to capital, not just by looking at the position number.
#Trading #RiskManagement
The position is small. Why can the risk still be large?
At first glance:
“I opened a position of only $100. That’s not much.”
But the position size alone does not show the real risk.
Let’s imagine two accounts:
$100 position on a $10,000 account
→ that’s only 1% of the capital.
$100 position on a $200 account
→ that’s already 50% of the capital.
Same position—but completely different impact on the account.
There’s another nuance—leverage.
A $100 position can be opened using $20 of your own capital and leverage. Then even a relatively small price move will have a much larger impact specifically on the margin used.
So the question:
“How big is my position?”
is not always enough.
It’s more important to look at:
the position size relative to your total capital;
leverage level;
how much you can lose when the price moves against you;
the conditions of the instrument itself.
A small dollar position doesn’t always mean a small risk for your account.
Risk needs to be assessed relative to capital, not just by looking at the position number.
#Trading #RiskManagement
At first glance:
“I opened a position of only $100. That’s not much.”
But the position size alone does not show the real risk.
Let’s imagine two accounts:
$100 position on a $10,000 account
→ that’s only 1% of the capital.
$100 position on a $200 account
→ that’s already 50% of the capital.
Same position—but completely different impact on the account.
There’s another nuance—leverage.
A $100 position can be opened using $20 of your own capital and leverage. Then even a relatively small price move will have a much larger impact specifically on the margin used.
So the question:
“How big is my position?”
is not always enough.
It’s more important to look at:
the position size relative to your total capital;
leverage level;
how much you can lose when the price moves against you;
the conditions of the instrument itself.
A small dollar position doesn’t always mean a small risk for your account.
Risk needs to be assessed relative to capital, not just by looking at the position number.
#Trading #RiskManagement

359
·
--
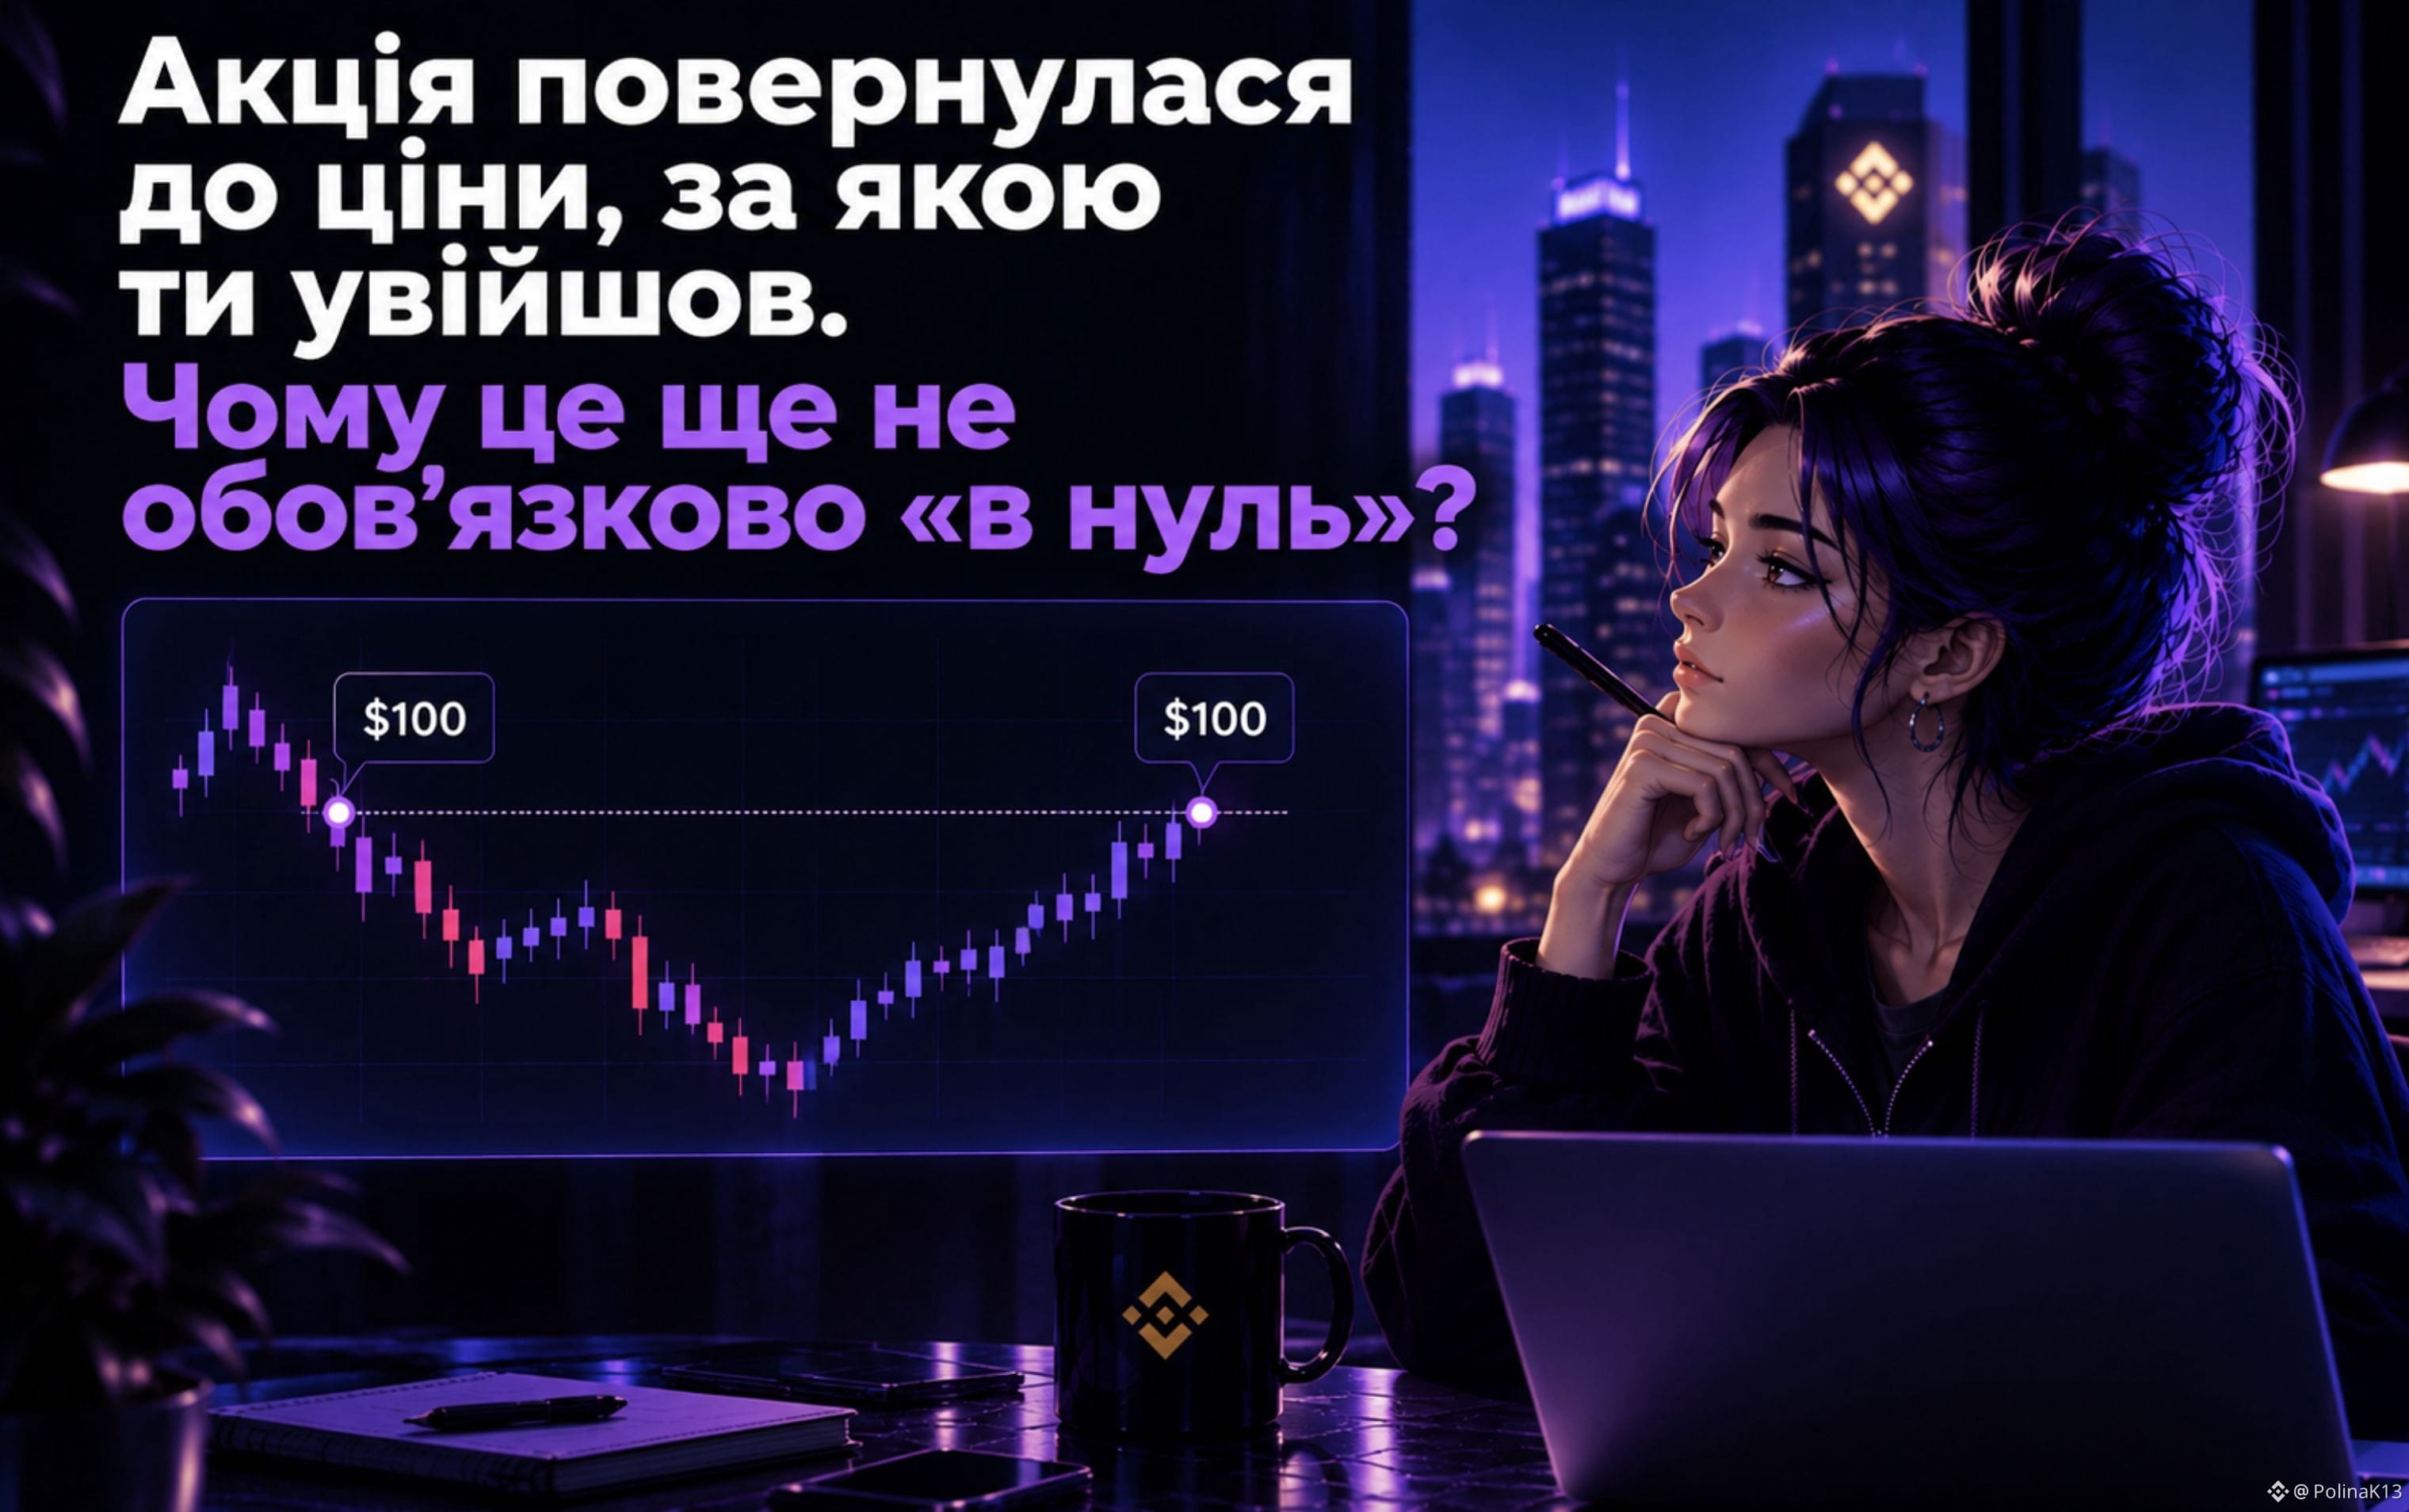
The promotion has returned to the price you entered at. Why it still doesn’t necessarily mean “back to zero”?
Let’s imagine:
You opened a position when the asset was $100.
First it fell to $95, and then it returned to $100.
It seems:
“Price returned → I’m back to zero.”
But not quite.
The outcome of a trade can be affected by costs associated with the position.
For example:
a commission for opening and closing;
funding if it’s perpetual;
the difference between the price you see on the chart and the actual execution price.
So even if the underlying asset returns to your entry price, the actual result of the position can remain negative.
And this is where an important distinction comes in:
The price returned to the entry point ≠ the trade automatically closes at zero.
The chart shows price movement.
And your real P&L also depends on what instrument you’re trading and what costs were incurred during the trade.
So looking only at:
“I entered at $100, and now it’s $100 again”
—isn’t enough.
Sometimes the price is back to zero, but your position is not yet.
#Trading #RiskManagement
The promotion has returned to the price you entered at. Why it still doesn’t necessarily mean “back to zero”?
Let’s imagine:
You opened a position when the asset was $100.
First it fell to $95, and then it returned to $100.
It seems:
“Price returned → I’m back to zero.”
But not quite.
The outcome of a trade can be affected by costs associated with the position.
For example:
a commission for opening and closing;
funding if it’s perpetual;
the difference between the price you see on the chart and the actual execution price.
So even if the underlying asset returns to your entry price, the actual result of the position can remain negative.
And this is where an important distinction comes in:
The price returned to the entry point ≠ the trade automatically closes at zero.
The chart shows price movement.
And your real P&L also depends on what instrument you’re trading and what costs were incurred during the trade.
So looking only at:
“I entered at $100, and now it’s $100 again”
—isn’t enough.
Sometimes the price is back to zero, but your position is not yet.
#Trading #RiskManagement
Let’s imagine:
You opened a position when the asset was $100.
First it fell to $95, and then it returned to $100.
It seems:
“Price returned → I’m back to zero.”
But not quite.
The outcome of a trade can be affected by costs associated with the position.
For example:
a commission for opening and closing;
funding if it’s perpetual;
the difference between the price you see on the chart and the actual execution price.
So even if the underlying asset returns to your entry price, the actual result of the position can remain negative.
And this is where an important distinction comes in:
The price returned to the entry point ≠ the trade automatically closes at zero.
The chart shows price movement.
And your real P&L also depends on what instrument you’re trading and what costs were incurred during the trade.
So looking only at:
“I entered at $100, and now it’s $100 again”
—isn’t enough.
Sometimes the price is back to zero, but your position is not yet.
#Trading #RiskManagement
106
·
--
You made money on the first trade. Why can the second one change everything?
Let’s imagine:
You opened a trade for $1,000 and made $100.
Now you have $1,100 in your account.
It seems logical:
“Since it worked once, you can repeat it.”
And this is often where the main thing changes—risk size.
After a profitable trade, a trader may increase the position, use more leverage, or simply start taking bigger risks.
For example:
1st trade: +$100
2nd trade: −$200
In the end:
+$100 − $200 = −$100
That means one losing trade doesn’t just take away the profit from the first one—it turns the entire result negative.
So the problem isn’t that the second trade is necessarily going to be unsuccessful.
The problem happens when, after a win, your risk level changes.
A profitable trade doesn’t make the next trade safer.
The market doesn’t know you just made money.
That’s why after a plus, it’s important to assess the next position the same way as the first:
what will the loss be if I’m wrong this time?
#Trading #RiskManagement
You made money on the first trade. Why can the second one change everything?
Let’s imagine:
You opened a trade for $1,000 and made $100.
Now you have $1,100 in your account.
It seems logical:
“Since it worked once, you can repeat it.”
And this is often where the main thing changes—risk size.
After a profitable trade, a trader may increase the position, use more leverage, or simply start taking bigger risks.
For example:
1st trade: +$100
2nd trade: −$200
In the end:
+$100 − $200 = −$100
That means one losing trade doesn’t just take away the profit from the first one—it turns the entire result negative.
So the problem isn’t that the second trade is necessarily going to be unsuccessful.
The problem happens when, after a win, your risk level changes.
A profitable trade doesn’t make the next trade safer.
The market doesn’t know you just made money.
That’s why after a plus, it’s important to assess the next position the same way as the first:
what will the loss be if I’m wrong this time?
#Trading #RiskManagement
Let’s imagine:
You opened a trade for $1,000 and made $100.
Now you have $1,100 in your account.
It seems logical:
“Since it worked once, you can repeat it.”
And this is often where the main thing changes—risk size.
After a profitable trade, a trader may increase the position, use more leverage, or simply start taking bigger risks.
For example:
1st trade: +$100
2nd trade: −$200
In the end:
+$100 − $200 = −$100
That means one losing trade doesn’t just take away the profit from the first one—it turns the entire result negative.
So the problem isn’t that the second trade is necessarily going to be unsuccessful.
The problem happens when, after a win, your risk level changes.
A profitable trade doesn’t make the next trade safer.
The market doesn’t know you just made money.
That’s why after a plus, it’s important to assess the next position the same way as the first:
what will the loss be if I’m wrong this time?
#Trading #RiskManagement

3
1.7k
·
--
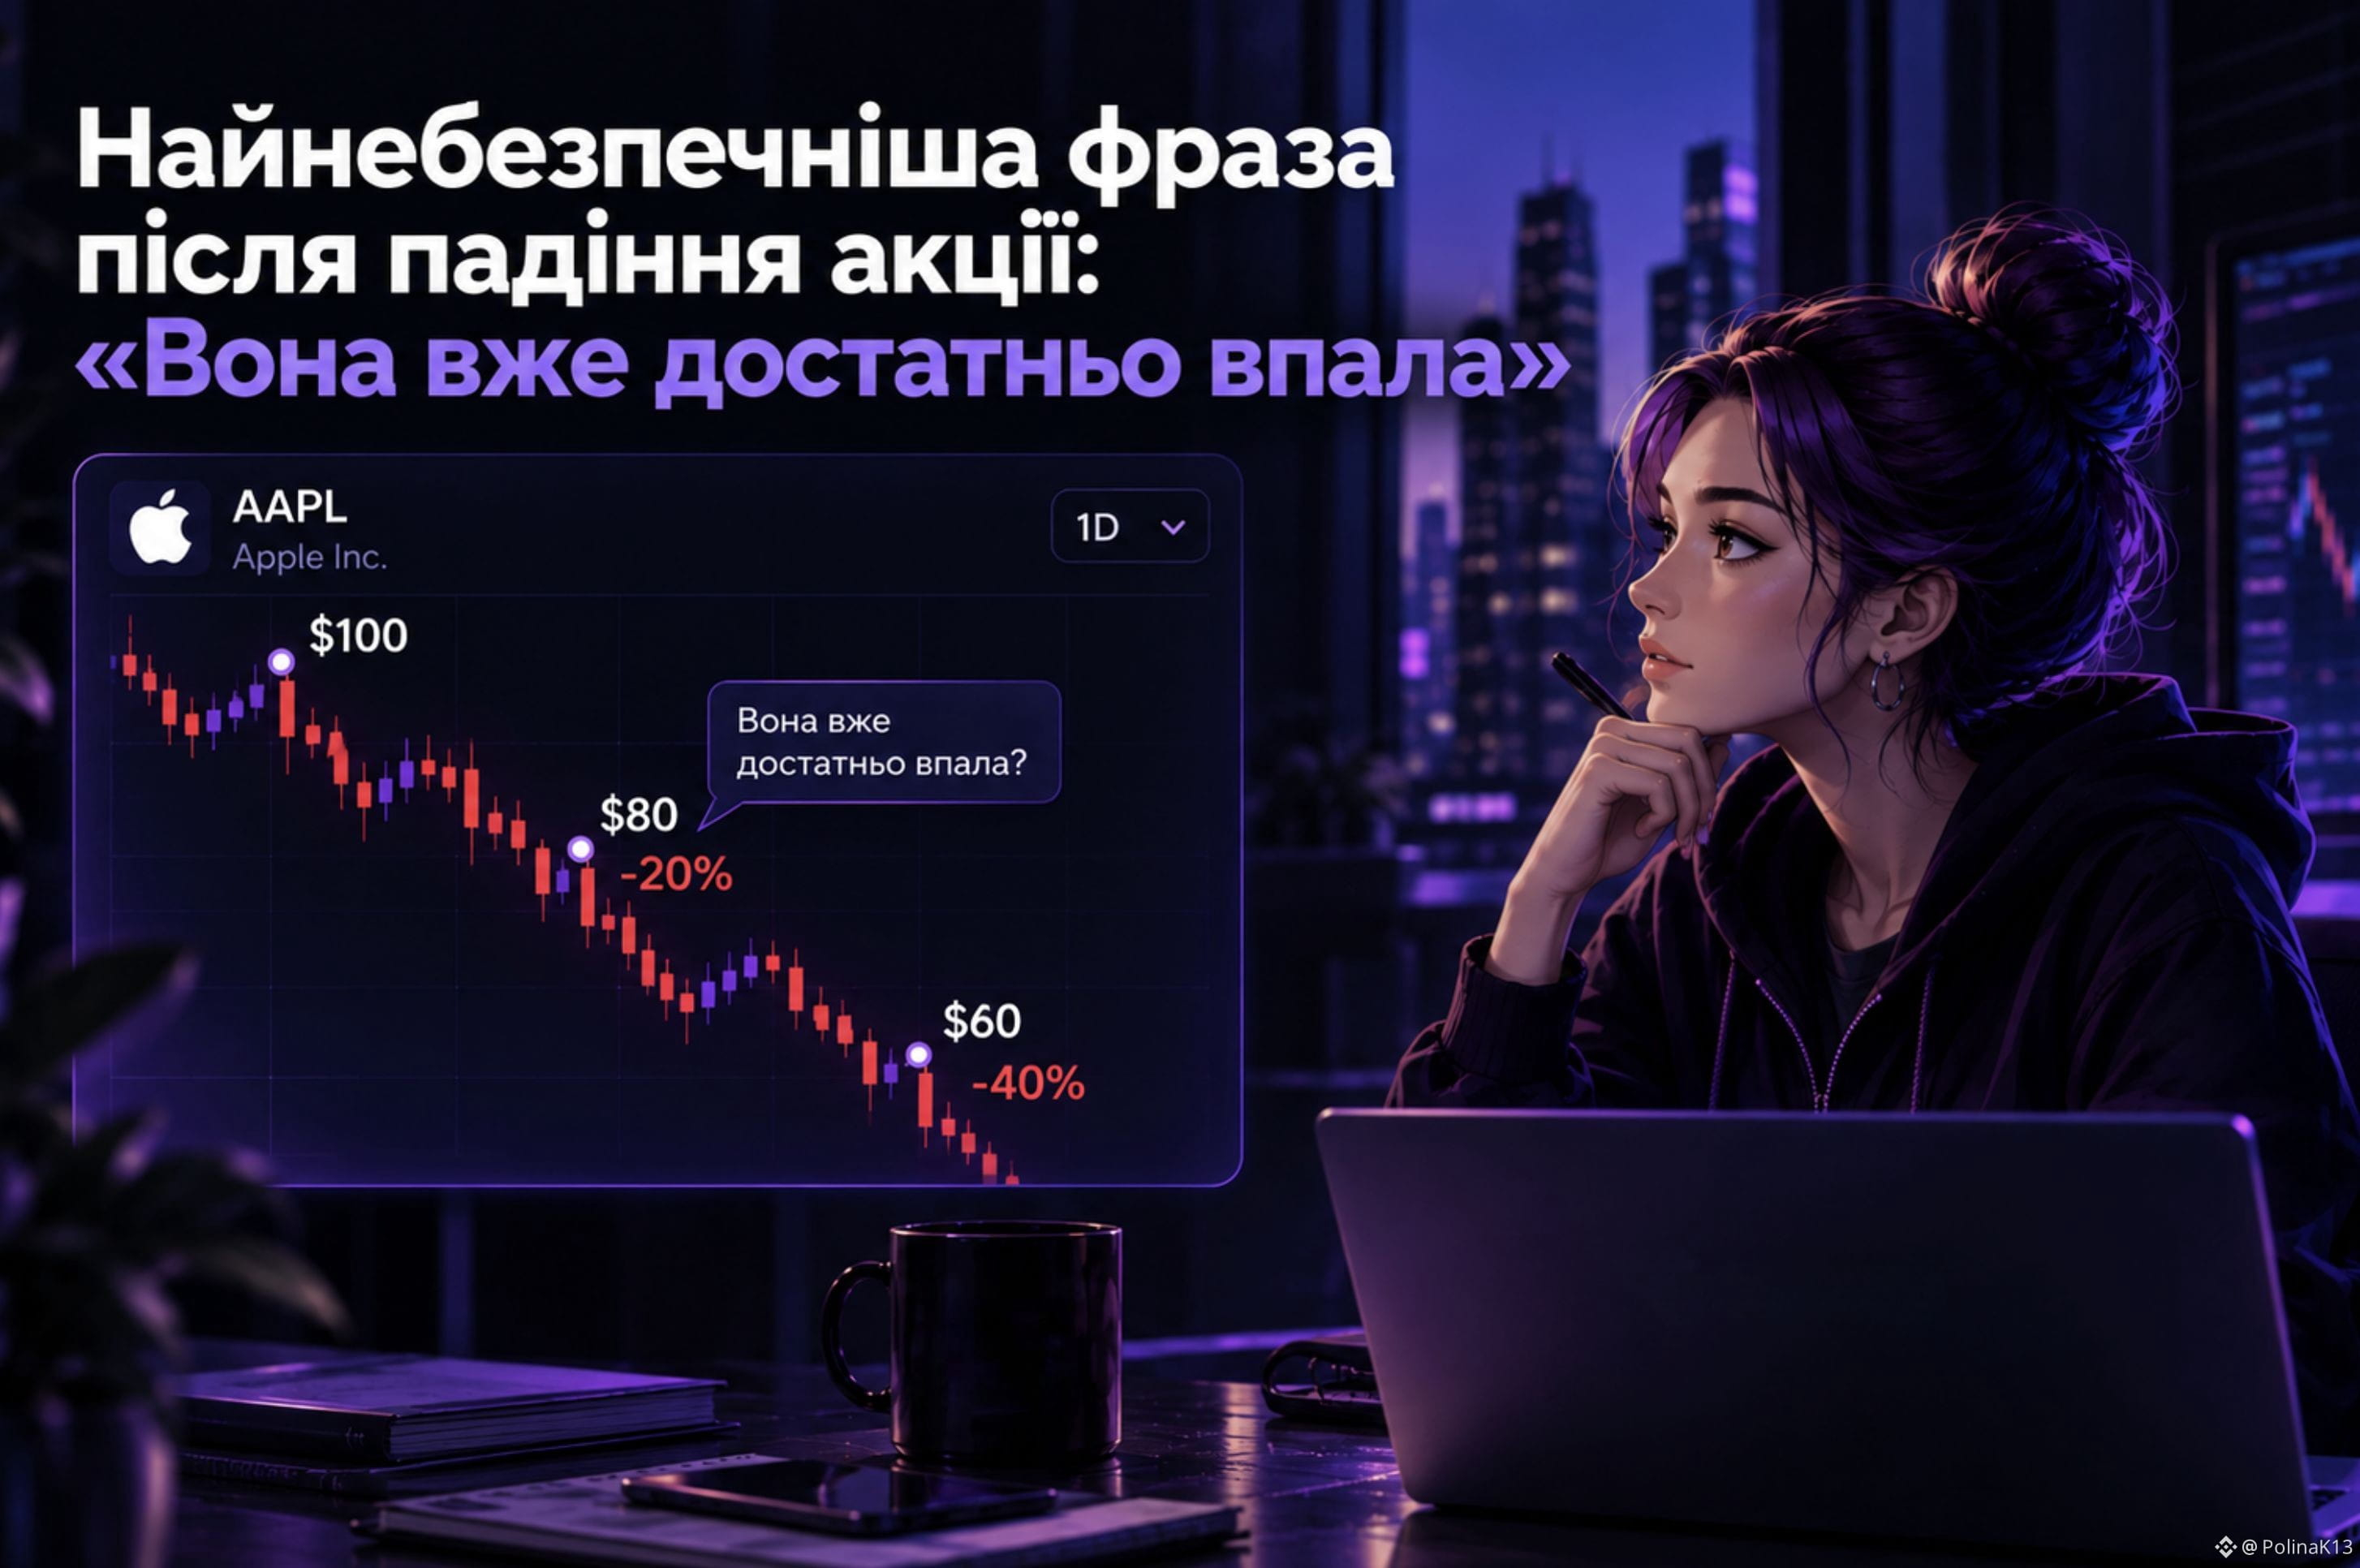
The most dangerous phrase after a stock drops: “It has already dropped enough”
The stock is down 20%.
First thought:
“Where else can it possibly fall?”
But the market doesn’t know where “low enough” is for you.
The stock could drop another 10%, 20%, or even 50%.
For example:
$100 → $80 → $60
At $80, it may seem like the stock is already cheap.
But after it falls to $60, a question arises:
why did $80 ever seem like the bottom?
So instead of:
❌ “How much has it already fallen?”
it’s better to ask:
✅ “Why is it falling?”
Have the company’s prospects changed?
Is this a market reaction?
Are there reasons to expect a rebound?
A drop by itself doesn’t make an asset cheap.
And in TradFi Perpetual, this is even more important: the ability to open a short position doesn’t mean that any drop automatically becomes an opportunity to profit.
“It's already dropped enough” isn’t analysis.
It’s only the assumption that things will get better next.
#TradFi
The most dangerous phrase after a stock drops: “It has already dropped enough”
The stock is down 20%.
First thought:
“Where else can it possibly fall?”
But the market doesn’t know where “low enough” is for you.
The stock could drop another 10%, 20%, or even 50%.
For example:
$100 → $80 → $60
At $80, it may seem like the stock is already cheap.
But after it falls to $60, a question arises:
why did $80 ever seem like the bottom?
So instead of:
❌ “How much has it already fallen?”
it’s better to ask:
✅ “Why is it falling?”
Have the company’s prospects changed?
Is this a market reaction?
Are there reasons to expect a rebound?
A drop by itself doesn’t make an asset cheap.
And in TradFi Perpetual, this is even more important: the ability to open a short position doesn’t mean that any drop automatically becomes an opportunity to profit.
“It's already dropped enough” isn’t analysis.
It’s only the assumption that things will get better next.
#TradFi
The stock is down 20%.
First thought:
“Where else can it possibly fall?”
But the market doesn’t know where “low enough” is for you.
The stock could drop another 10%, 20%, or even 50%.
For example:
$100 → $80 → $60
At $80, it may seem like the stock is already cheap.
But after it falls to $60, a question arises:
why did $80 ever seem like the bottom?
So instead of:
❌ “How much has it already fallen?”
it’s better to ask:
✅ “Why is it falling?”
Have the company’s prospects changed?
Is this a market reaction?
Are there reasons to expect a rebound?
A drop by itself doesn’t make an asset cheap.
And in TradFi Perpetual, this is even more important: the ability to open a short position doesn’t mean that any drop automatically becomes an opportunity to profit.
“It's already dropped enough” isn’t analysis.
It’s only the assumption that things will get better next.
#TradFi
615
·
--
Can you hedge a stock using a TradFi Perpetual without selling the stock itself?
Let’s imagine this: I have a stock worth $10,000, but I’m expecting a short-term decline.
I don’t want to sell it because I plan to stay in the position longer.
Then the idea comes up: open a short TradFi Perpetual on the same underlying.
If the stock price falls, its value decreases, and the short position potentially profits.
At first glance, everything seems simple:
stock → long
perpetual → short
But there’s an important nuance here.
A TradFi Perpetual is a derivative, not the stock itself. It does not confer ownership of the underlying asset.
So the short is not an exact replica of my stock position.
The outcome can be affected by funding, fees, the position size, and the difference between the contract price and the stock price.
For example, if the stock drops by 5%, that doesn’t mean a short TradFi Perpetual will automatically deliver exactly a 5% profit.
That’s why hedging is not just taking the opposite position.
You need to look at how closely the derivative tracks the underlying’s move and how much it costs to maintain the hedge itself.
For me, this is an interesting example of how a TradFi Perpetual can be viewed not only as a tool for speculation.
In certain situations, it may help temporarily reduce the risk of an already existing position without selling the asset itself.
#TradFi
Can you hedge a stock using a TradFi Perpetual without selling the stock itself?
Let’s imagine this: I have a stock worth $10,000, but I’m expecting a short-term decline.
I don’t want to sell it because I plan to stay in the position longer.
Then the idea comes up: open a short TradFi Perpetual on the same underlying.
If the stock price falls, its value decreases, and the short position potentially profits.
At first glance, everything seems simple:
stock → long
perpetual → short
But there’s an important nuance here.
A TradFi Perpetual is a derivative, not the stock itself. It does not confer ownership of the underlying asset.
So the short is not an exact replica of my stock position.
The outcome can be affected by funding, fees, the position size, and the difference between the contract price and the stock price.
For example, if the stock drops by 5%, that doesn’t mean a short TradFi Perpetual will automatically deliver exactly a 5% profit.
That’s why hedging is not just taking the opposite position.
You need to look at how closely the derivative tracks the underlying’s move and how much it costs to maintain the hedge itself.
For me, this is an interesting example of how a TradFi Perpetual can be viewed not only as a tool for speculation.
In certain situations, it may help temporarily reduce the risk of an already existing position without selling the asset itself.
#TradFi
Let’s imagine this: I have a stock worth $10,000, but I’m expecting a short-term decline.
I don’t want to sell it because I plan to stay in the position longer.
Then the idea comes up: open a short TradFi Perpetual on the same underlying.
If the stock price falls, its value decreases, and the short position potentially profits.
At first glance, everything seems simple:
stock → long
perpetual → short
But there’s an important nuance here.
A TradFi Perpetual is a derivative, not the stock itself. It does not confer ownership of the underlying asset.
So the short is not an exact replica of my stock position.
The outcome can be affected by funding, fees, the position size, and the difference between the contract price and the stock price.
For example, if the stock drops by 5%, that doesn’t mean a short TradFi Perpetual will automatically deliver exactly a 5% profit.
That’s why hedging is not just taking the opposite position.
You need to look at how closely the derivative tracks the underlying’s move and how much it costs to maintain the hedge itself.
For me, this is an interesting example of how a TradFi Perpetual can be viewed not only as a tool for speculation.
In certain situations, it may help temporarily reduce the risk of an already existing position without selling the asset itself.
#TradFi

194
·
--
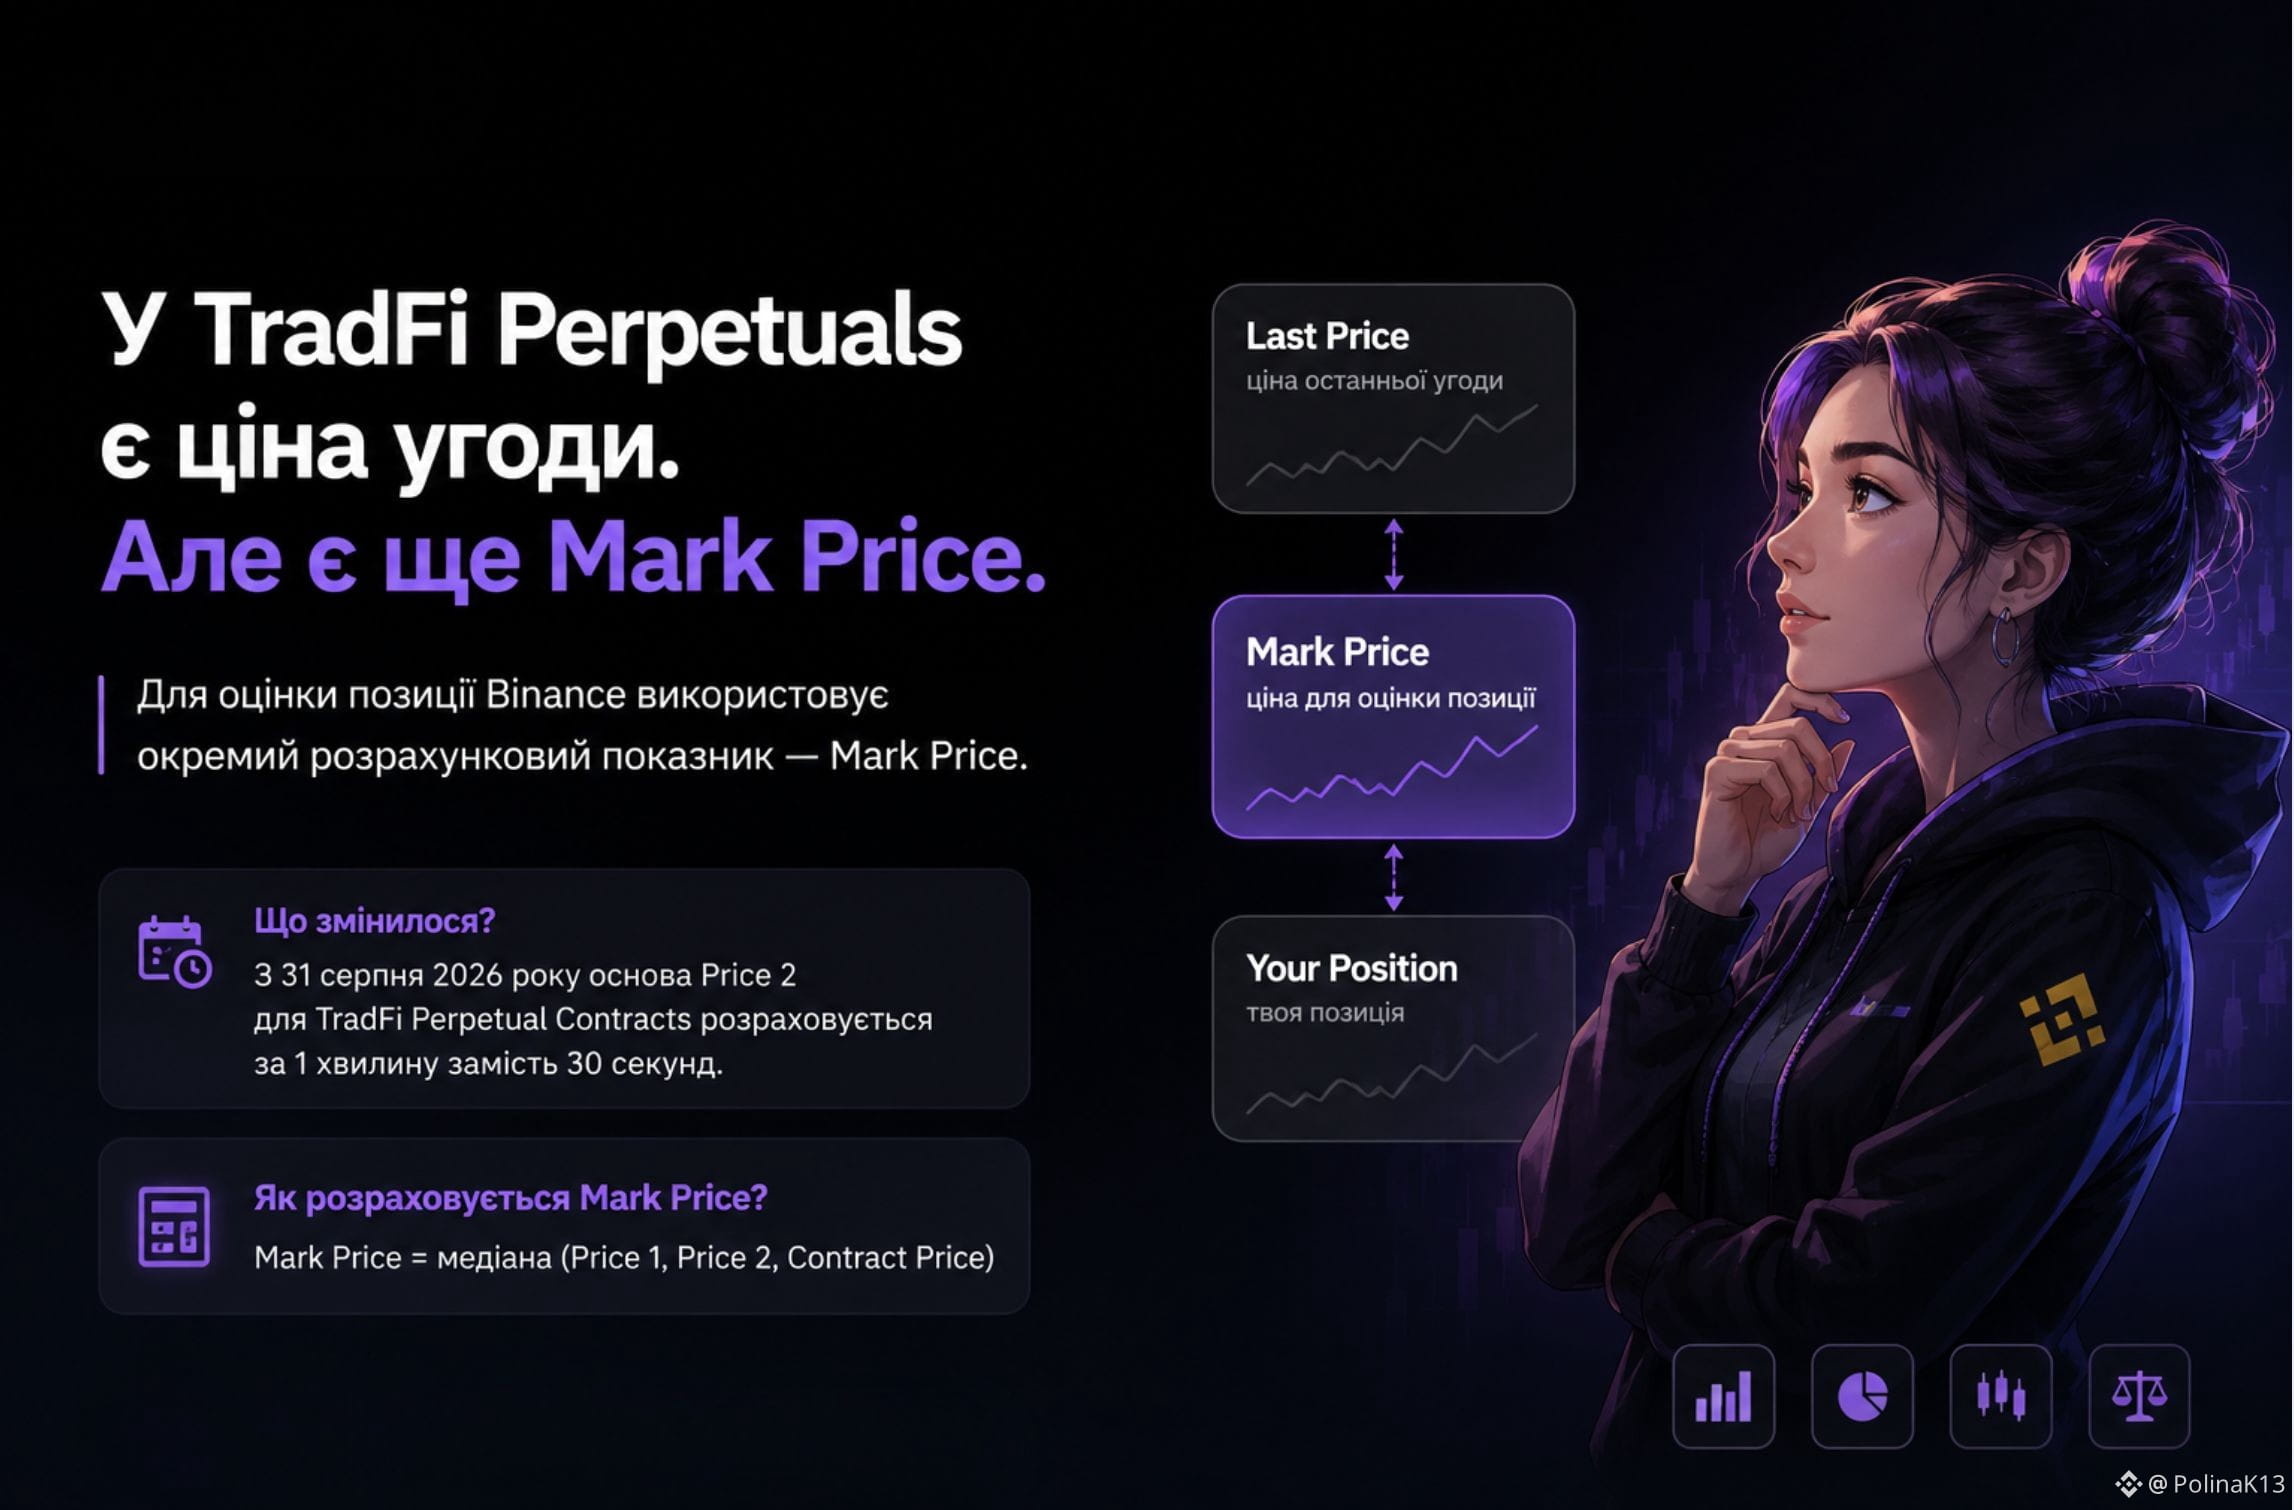
In TradFi Perpetuals, there is an deal price. But for calculating the Mark Price, Binance uses not only it.
At first glance, it seems logical: if the contract is trading at a certain price, that’s the price the exchange should use.
But for perpetual contracts, the mechanics are more complex.
Binance calculates Mark Price using the median of three values: Price 1, Price 2, and Contract Price.
And Price 2 has recently changed.
As of August 31, 2026, for TradFi Perpetual Contracts, Binance changed the basis for its calculation: instead of a 30-second Moving Average, it uses an average over 1 minute.
At the same time, the Mark Price itself continues to be calculated as the median of Price 1, Price 2, and Contract Price.
Why is this interesting?
Because even a small change in the calculation methodology highlights an important point:
the price you see as the last trade and the Mark Price are different values.
Mark Price is a separate calculated metric, not just a copy of the last trade.
So when working with TradFi Perpetuals, it’s not enough to look only at the chart.
You need to understand exactly how the price produced by the contract’s mechanics is formed.
And I particularly like this moment in TradFi on Binance: behind the familiar stock ticker name is an entirely different market infrastructure.
Here, it’s important not only what the asset price is, but also how the exchange calculates it.
#TradFi
In TradFi Perpetuals, there is an deal price. But for calculating the Mark Price, Binance uses not only it.
At first glance, it seems logical: if the contract is trading at a certain price, that’s the price the exchange should use.
But for perpetual contracts, the mechanics are more complex.
Binance calculates Mark Price using the median of three values: Price 1, Price 2, and Contract Price.
And Price 2 has recently changed.
As of August 31, 2026, for TradFi Perpetual Contracts, Binance changed the basis for its calculation: instead of a 30-second Moving Average, it uses an average over 1 minute.
At the same time, the Mark Price itself continues to be calculated as the median of Price 1, Price 2, and Contract Price.
Why is this interesting?
Because even a small change in the calculation methodology highlights an important point:
the price you see as the last trade and the Mark Price are different values.
Mark Price is a separate calculated metric, not just a copy of the last trade.
So when working with TradFi Perpetuals, it’s not enough to look only at the chart.
You need to understand exactly how the price produced by the contract’s mechanics is formed.
And I particularly like this moment in TradFi on Binance: behind the familiar stock ticker name is an entirely different market infrastructure.
Here, it’s important not only what the asset price is, but also how the exchange calculates it.
#TradFi
At first glance, it seems logical: if the contract is trading at a certain price, that’s the price the exchange should use.
But for perpetual contracts, the mechanics are more complex.
Binance calculates Mark Price using the median of three values: Price 1, Price 2, and Contract Price.
And Price 2 has recently changed.
As of August 31, 2026, for TradFi Perpetual Contracts, Binance changed the basis for its calculation: instead of a 30-second Moving Average, it uses an average over 1 minute.
At the same time, the Mark Price itself continues to be calculated as the median of Price 1, Price 2, and Contract Price.
Why is this interesting?
Because even a small change in the calculation methodology highlights an important point:
the price you see as the last trade and the Mark Price are different values.
Mark Price is a separate calculated metric, not just a copy of the last trade.
So when working with TradFi Perpetuals, it’s not enough to look only at the chart.
You need to understand exactly how the price produced by the contract’s mechanics is formed.
And I particularly like this moment in TradFi on Binance: behind the familiar stock ticker name is an entirely different market infrastructure.
Here, it’s important not only what the asset price is, but also how the exchange calculates it.
#TradFi
112
·
--
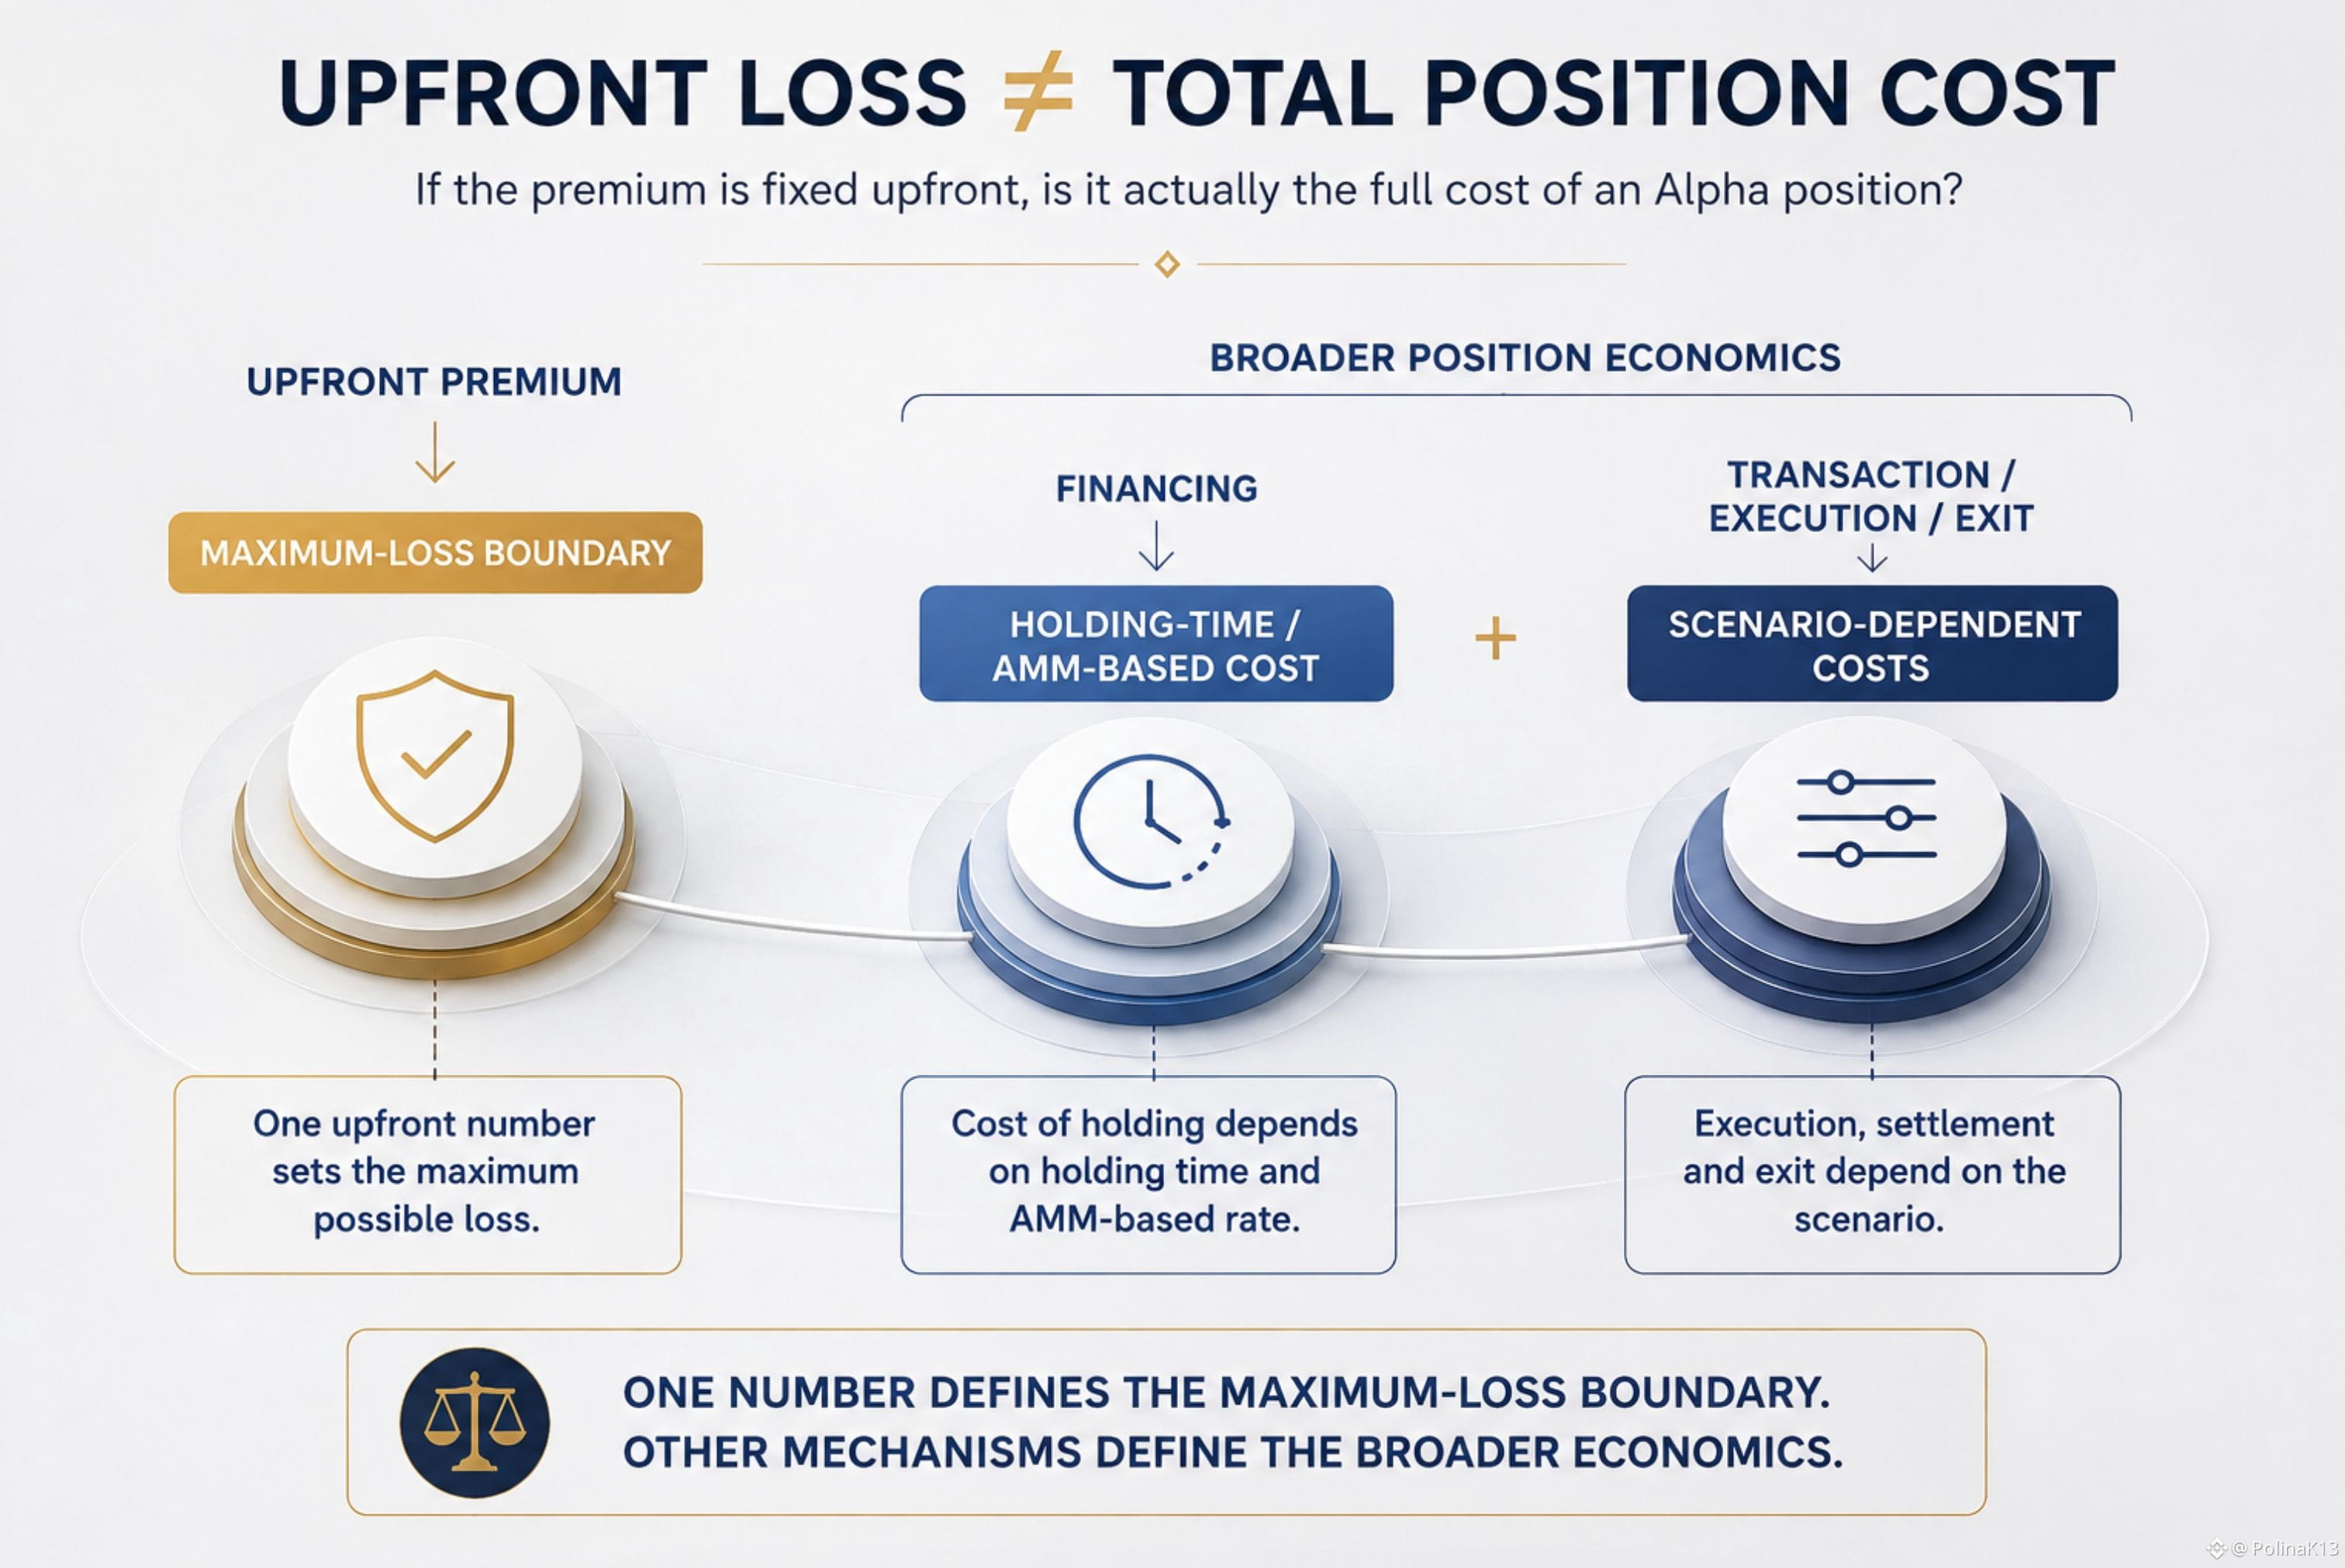
If the premium is fixed upfront, is it actually the full cost of an Alpha position?
It’s easy to treat the upfront premium as the cost of the position.
After all, TermMax defines Max Cost as the upfront premium — and as the maximum possible loss of the Alpha position.
But that answers one question:
How large can the position’s loss be?
It doesn’t necessarily answer another:
What are the broader economics of holding or executing the position?
TermMax separately documents option financing.
That financing is calculated using the option’s notional value, the AMM rate and the time the position is held. The AMM-based annual rate can also adjust dynamically.
And financing isn’t the only separate mechanism. TermMax also documents transaction, execution and exit-related costs that can apply depending on the scenario.
The important distinction is not:
premium + fees = a bigger maximum loss.
That would contradict what Max Cost is designed to represent.
The distinction is:
maximum-loss boundary
vs.
broader economic cost structure
So knowing the maximum loss upfront does not mean every economic cost associated with holding or executing the position is fixed upfront.
The useful distinction isn't cheap vs. expensive.
It’s understanding what the upfront number actually tells you — and what it doesn't.
UPFRONT LOSS ≠ TOTAL POSITION COST
#termmax @termmax
If the premium is fixed upfront, is it actually the full cost of an Alpha position?
It’s easy to treat the upfront premium as the cost of the position.
After all, TermMax defines Max Cost as the upfront premium — and as the maximum possible loss of the Alpha position.
But that answers one question:
How large can the position’s loss be?
It doesn’t necessarily answer another:
What are the broader economics of holding or executing the position?
TermMax separately documents option financing.
That financing is calculated using the option’s notional value, the AMM rate and the time the position is held. The AMM-based annual rate can also adjust dynamically.
And financing isn’t the only separate mechanism. TermMax also documents transaction, execution and exit-related costs that can apply depending on the scenario.
The important distinction is not:
premium + fees = a bigger maximum loss.
That would contradict what Max Cost is designed to represent.
The distinction is:
maximum-loss boundary
vs.
broader economic cost structure
So knowing the maximum loss upfront does not mean every economic cost associated with holding or executing the position is fixed upfront.
The useful distinction isn't cheap vs. expensive.
It’s understanding what the upfront number actually tells you — and what it doesn't.
UPFRONT LOSS ≠ TOTAL POSITION COST
#termmax @TermMax
It’s easy to treat the upfront premium as the cost of the position.
After all, TermMax defines Max Cost as the upfront premium — and as the maximum possible loss of the Alpha position.
But that answers one question:
How large can the position’s loss be?
It doesn’t necessarily answer another:
What are the broader economics of holding or executing the position?
TermMax separately documents option financing.
That financing is calculated using the option’s notional value, the AMM rate and the time the position is held. The AMM-based annual rate can also adjust dynamically.
And financing isn’t the only separate mechanism. TermMax also documents transaction, execution and exit-related costs that can apply depending on the scenario.
The important distinction is not:
premium + fees = a bigger maximum loss.
That would contradict what Max Cost is designed to represent.
The distinction is:
maximum-loss boundary
vs.
broader economic cost structure
So knowing the maximum loss upfront does not mean every economic cost associated with holding or executing the position is fixed upfront.
The useful distinction isn't cheap vs. expensive.
It’s understanding what the upfront number actually tells you — and what it doesn't.
UPFRONT LOSS ≠ TOTAL POSITION COST
#termmax @TermMax
82
·
--
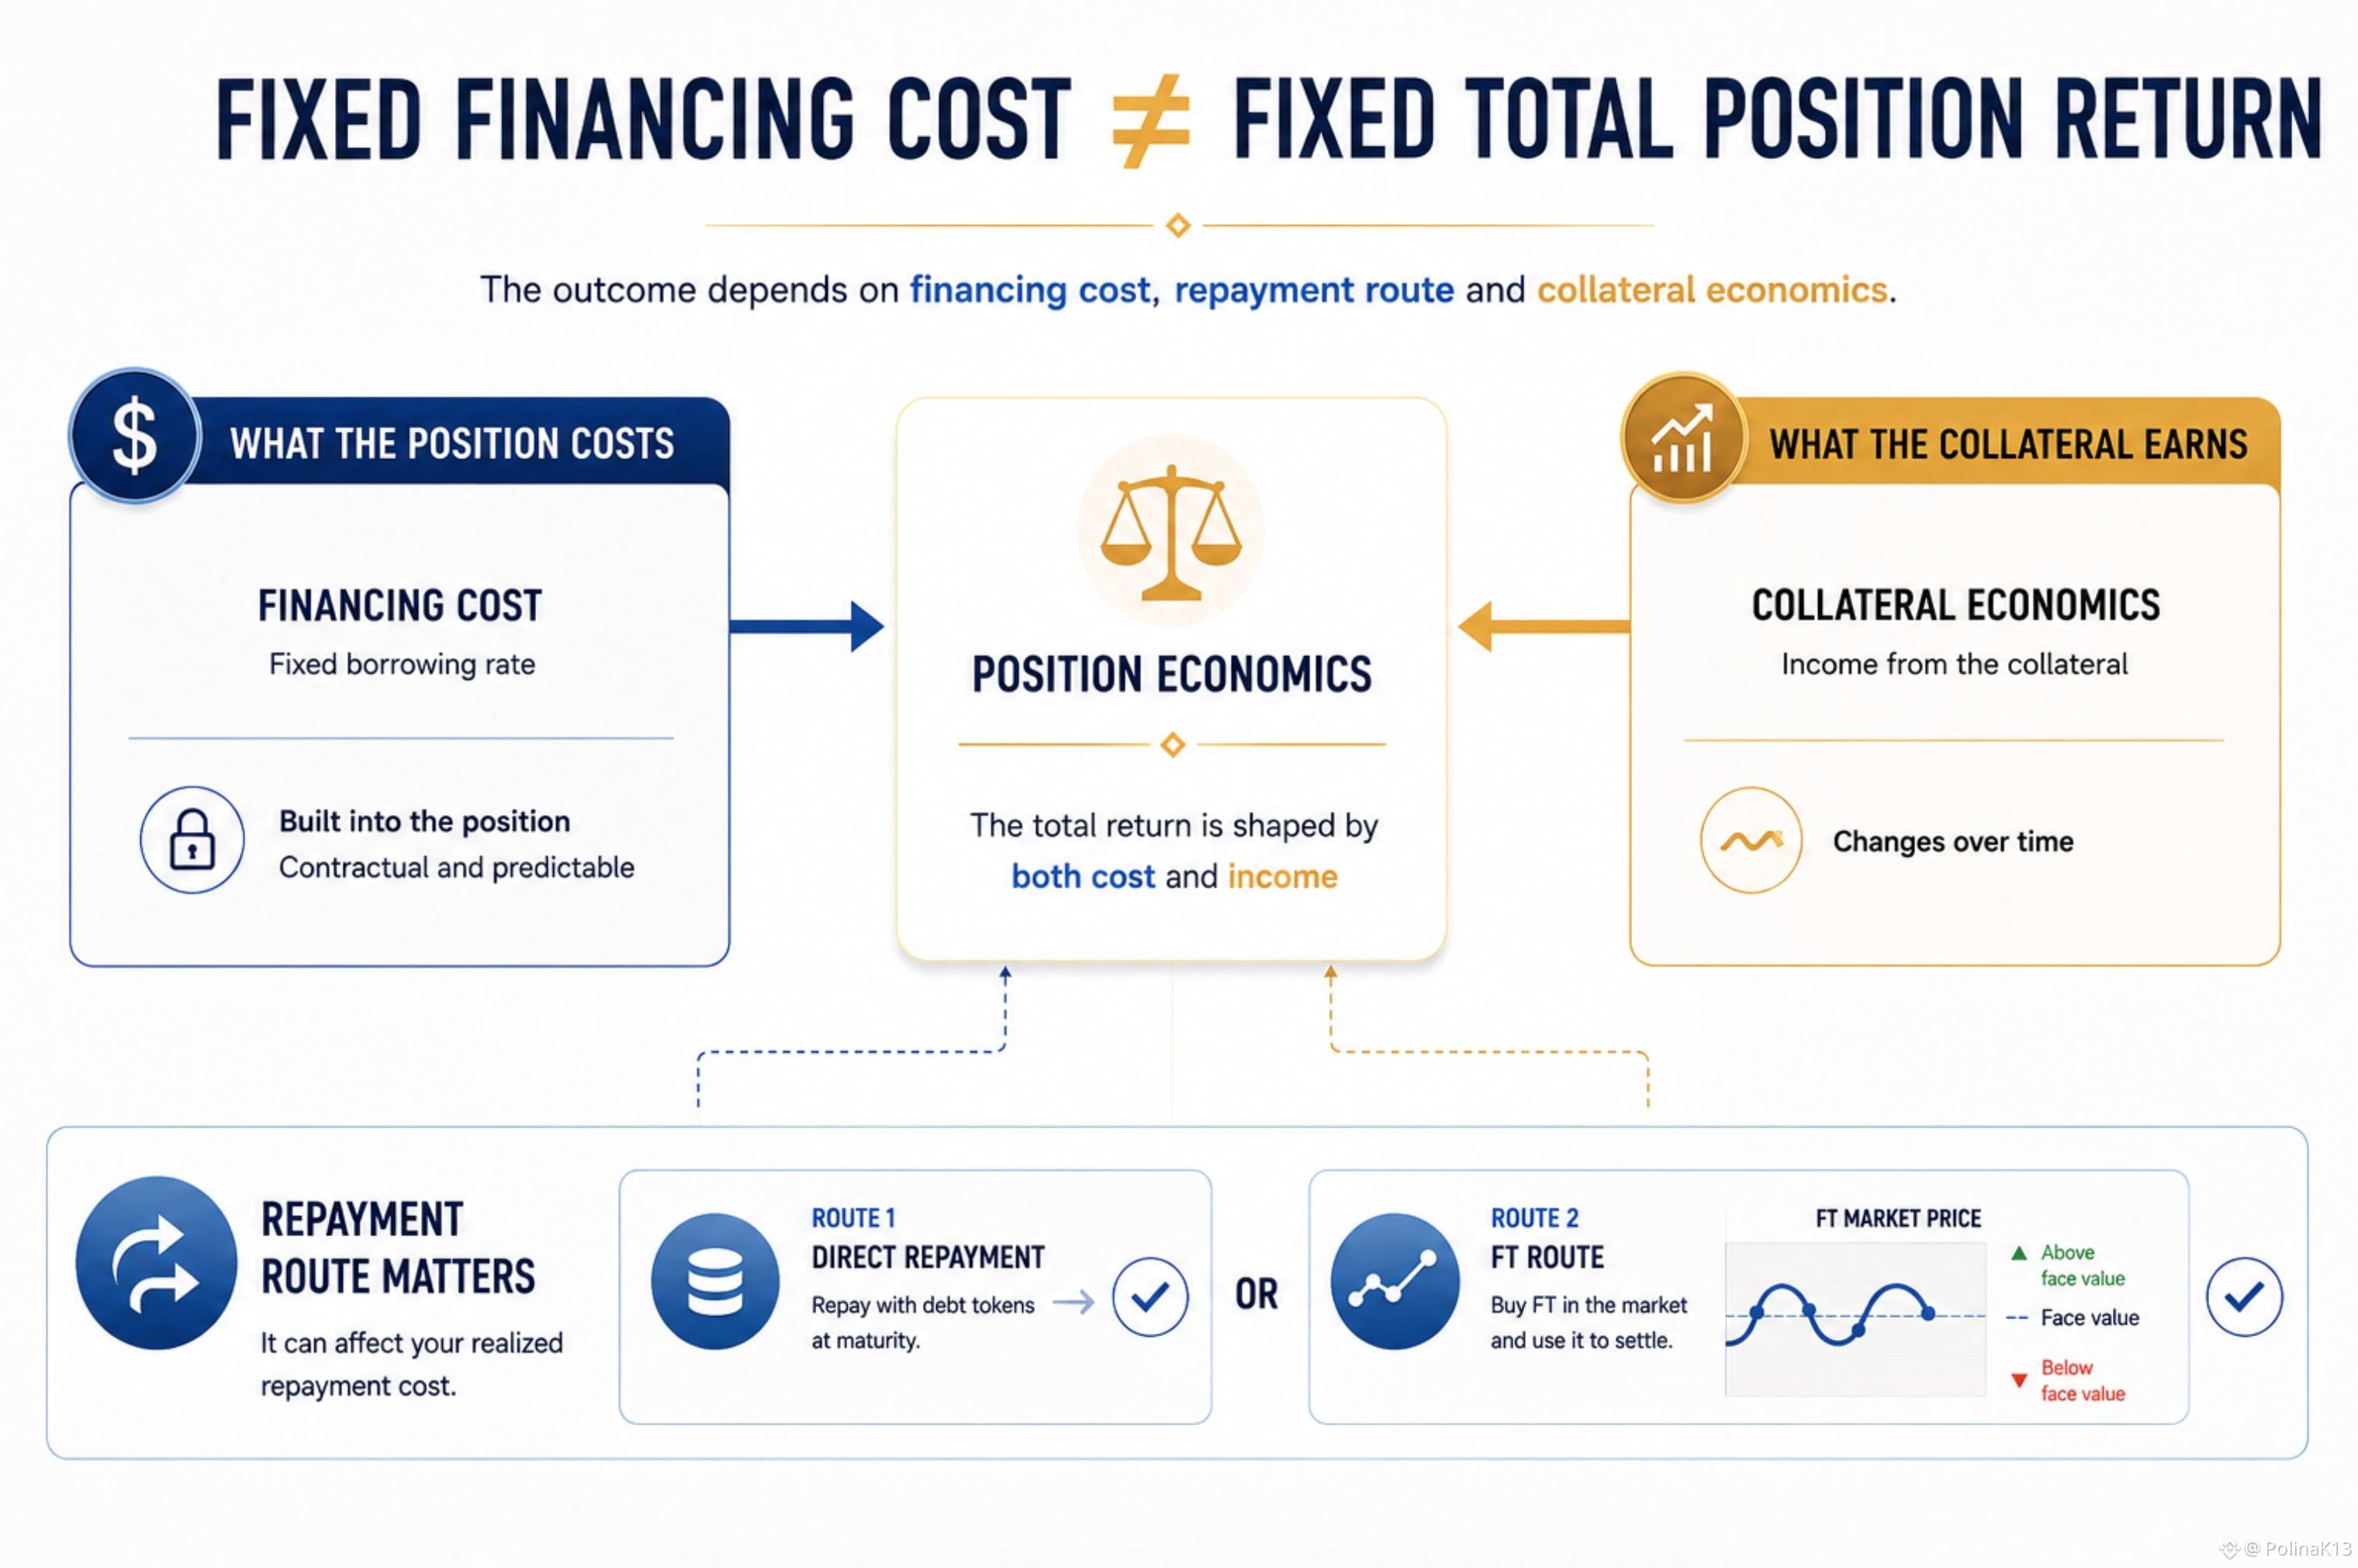
A leveraged position can look cheaper or more expensive than expected for a reason that is easy to miss.
In TermMax, the borrowing rate is fixed when the position is formed.
But the important part is what that means for the position’s value.
TermMax finalizes the borrowing cost upfront. The future interest obligation is therefore already reflected in the GT’s value, rather than simply accumulating over time like interest in a conventional floating-rate money market.
That changes how I would read a leveraged position.
The right question is not only:
“What is the borrowing rate?”
It is also:
“How much of the financing cost is already embedded in the position I’m looking at?”
There is one more layer.
Before maturity, the borrower can either repay directly with debt tokens or use the corresponding FT to settle the debt.
If that FT is available at a sufficient discount, the FT route can potentially reduce the realized repayment cost.
So the contractual financing obligation is fixed.
But the economics of settling that obligation can still depend on the repayment route.
And on the other side of the position, the collateral may have its own income profile.
That means I would evaluate leverage through two separate questions:
What does the financing cost?
and
What does the collateral earn?
The fixed rate gives certainty on the first.
It does not, by itself, tell you the economic return of the whole position.
For me, that is the more useful way to read a leveraged TermMax position: separate the financing obligation from the economics generated by the collateral.
#termmax @termmax
A leveraged position can look cheaper or more expensive than expected for a reason that is easy to miss.
In TermMax, the borrowing rate is fixed when the position is formed.
But the important part is what that means for the position’s value.
TermMax finalizes the borrowing cost upfront. The future interest obligation is therefore already reflected in the GT’s value, rather than simply accumulating over time like interest in a conventional floating-rate money market.
That changes how I would read a leveraged position.
The right question is not only:
“What is the borrowing rate?”
It is also:
“How much of the financing cost is already embedded in the position I’m looking at?”
There is one more layer.
Before maturity, the borrower can either repay directly with debt tokens or use the corresponding FT to settle the debt.
If that FT is available at a sufficient discount, the FT route can potentially reduce the realized repayment cost.
So the contractual financing obligation is fixed.
But the economics of settling that obligation can still depend on the repayment route.
And on the other side of the position, the collateral may have its own income profile.
That means I would evaluate leverage through two separate questions:
What does the financing cost?
and
What does the collateral earn?
The fixed rate gives certainty on the first.
It does not, by itself, tell you the economic return of the whole position.
For me, that is the more useful way to read a leveraged TermMax position: separate the financing obligation from the economics generated by the collateral.
#termmax @TermMax
In TermMax, the borrowing rate is fixed when the position is formed.
But the important part is what that means for the position’s value.
TermMax finalizes the borrowing cost upfront. The future interest obligation is therefore already reflected in the GT’s value, rather than simply accumulating over time like interest in a conventional floating-rate money market.
That changes how I would read a leveraged position.
The right question is not only:
“What is the borrowing rate?”
It is also:
“How much of the financing cost is already embedded in the position I’m looking at?”
There is one more layer.
Before maturity, the borrower can either repay directly with debt tokens or use the corresponding FT to settle the debt.
If that FT is available at a sufficient discount, the FT route can potentially reduce the realized repayment cost.
So the contractual financing obligation is fixed.
But the economics of settling that obligation can still depend on the repayment route.
And on the other side of the position, the collateral may have its own income profile.
That means I would evaluate leverage through two separate questions:
What does the financing cost?
and
What does the collateral earn?
The fixed rate gives certainty on the first.
It does not, by itself, tell you the economic return of the whole position.
For me, that is the more useful way to read a leveraged TermMax position: separate the financing obligation from the economics generated by the collateral.
#termmax @TermMax
78
·
--
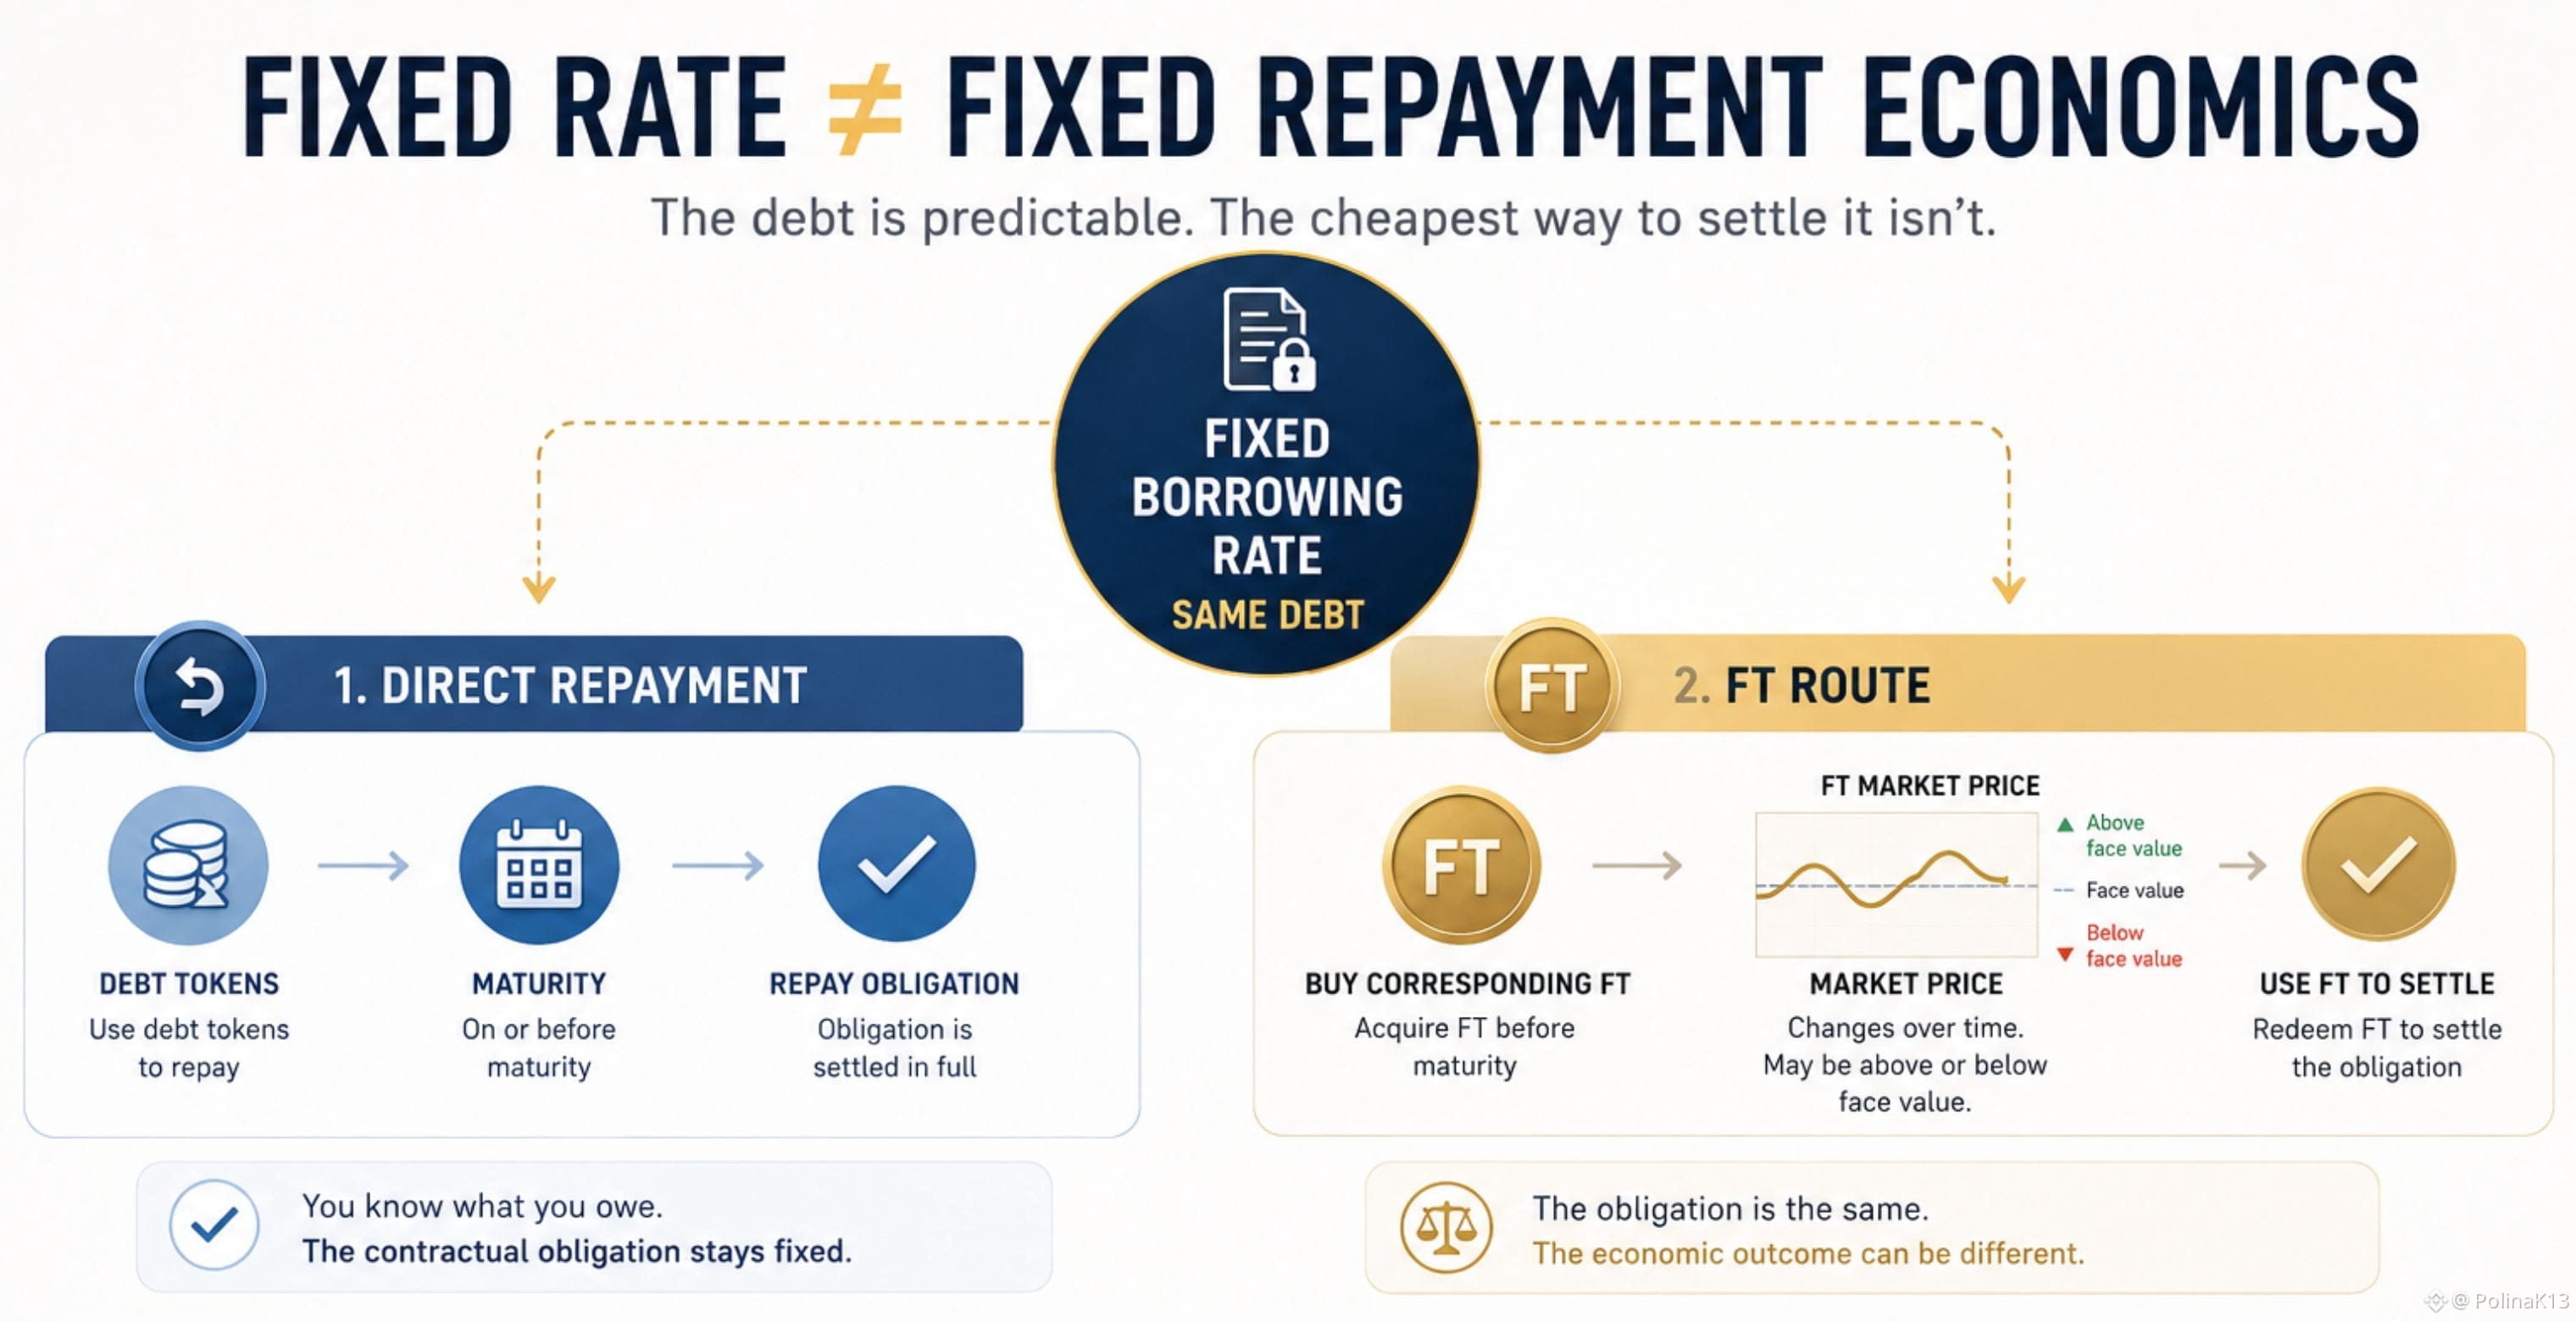
A fixed borrowing rate can make the debt predictable. The interesting question is whether the cheapest way to settle it stays predictable too.
In TermMax, a borrower has two repayment routes:
→ repay the debt directly with debt tokens
→ or buy the corresponding FT before maturity and use it to settle the debt.
That second route is where the economics get more interesting.
Before maturity, an FT can trade below its face value. And the relationship between the current market rate and the borrower's locked rate can affect whether that discount exists and how attractive the FT route becomes.
If market rates move above the rate the borrower originally locked, TermMax's documentation notes that the corresponding FT may be available at a discount, potentially making settlement cheaper.
But “potentially” matters.
The debt obligation itself hasn't changed. And a discount doesn't automatically mean the borrower saves money. The FT still has to be available at a sufficient discount for that repayment route to be economically preferable.
So fixed-rate borrowing gives you certainty about the rate.
It doesn't necessarily give you certainty about which way of settling that same obligation will be cheapest.
That distinction makes the repayment economics more interesting than the fixed rate alone.
#termmax @termmax
A fixed borrowing rate can make the debt predictable. The interesting question is whether the cheapest way to settle it stays predictable too.
In TermMax, a borrower has two repayment routes:
→ repay the debt directly with debt tokens
→ or buy the corresponding FT before maturity and use it to settle the debt.
That second route is where the economics get more interesting.
Before maturity, an FT can trade below its face value. And the relationship between the current market rate and the borrower's locked rate can affect whether that discount exists and how attractive the FT route becomes.
If market rates move above the rate the borrower originally locked, TermMax's documentation notes that the corresponding FT may be available at a discount, potentially making settlement cheaper.
But “potentially” matters.
The debt obligation itself hasn't changed. And a discount doesn't automatically mean the borrower saves money. The FT still has to be available at a sufficient discount for that repayment route to be economically preferable.
So fixed-rate borrowing gives you certainty about the rate.
It doesn't necessarily give you certainty about which way of settling that same obligation will be cheapest.
That distinction makes the repayment economics more interesting than the fixed rate alone.
#termmax @TermMax
In TermMax, a borrower has two repayment routes:
→ repay the debt directly with debt tokens
→ or buy the corresponding FT before maturity and use it to settle the debt.
That second route is where the economics get more interesting.
Before maturity, an FT can trade below its face value. And the relationship between the current market rate and the borrower's locked rate can affect whether that discount exists and how attractive the FT route becomes.
If market rates move above the rate the borrower originally locked, TermMax's documentation notes that the corresponding FT may be available at a discount, potentially making settlement cheaper.
But “potentially” matters.
The debt obligation itself hasn't changed. And a discount doesn't automatically mean the borrower saves money. The FT still has to be available at a sufficient discount for that repayment route to be economically preferable.
So fixed-rate borrowing gives you certainty about the rate.
It doesn't necessarily give you certainty about which way of settling that same obligation will be cheapest.
That distinction makes the repayment economics more interesting than the fixed rate alone.
#termmax @TermMax
83
·
--
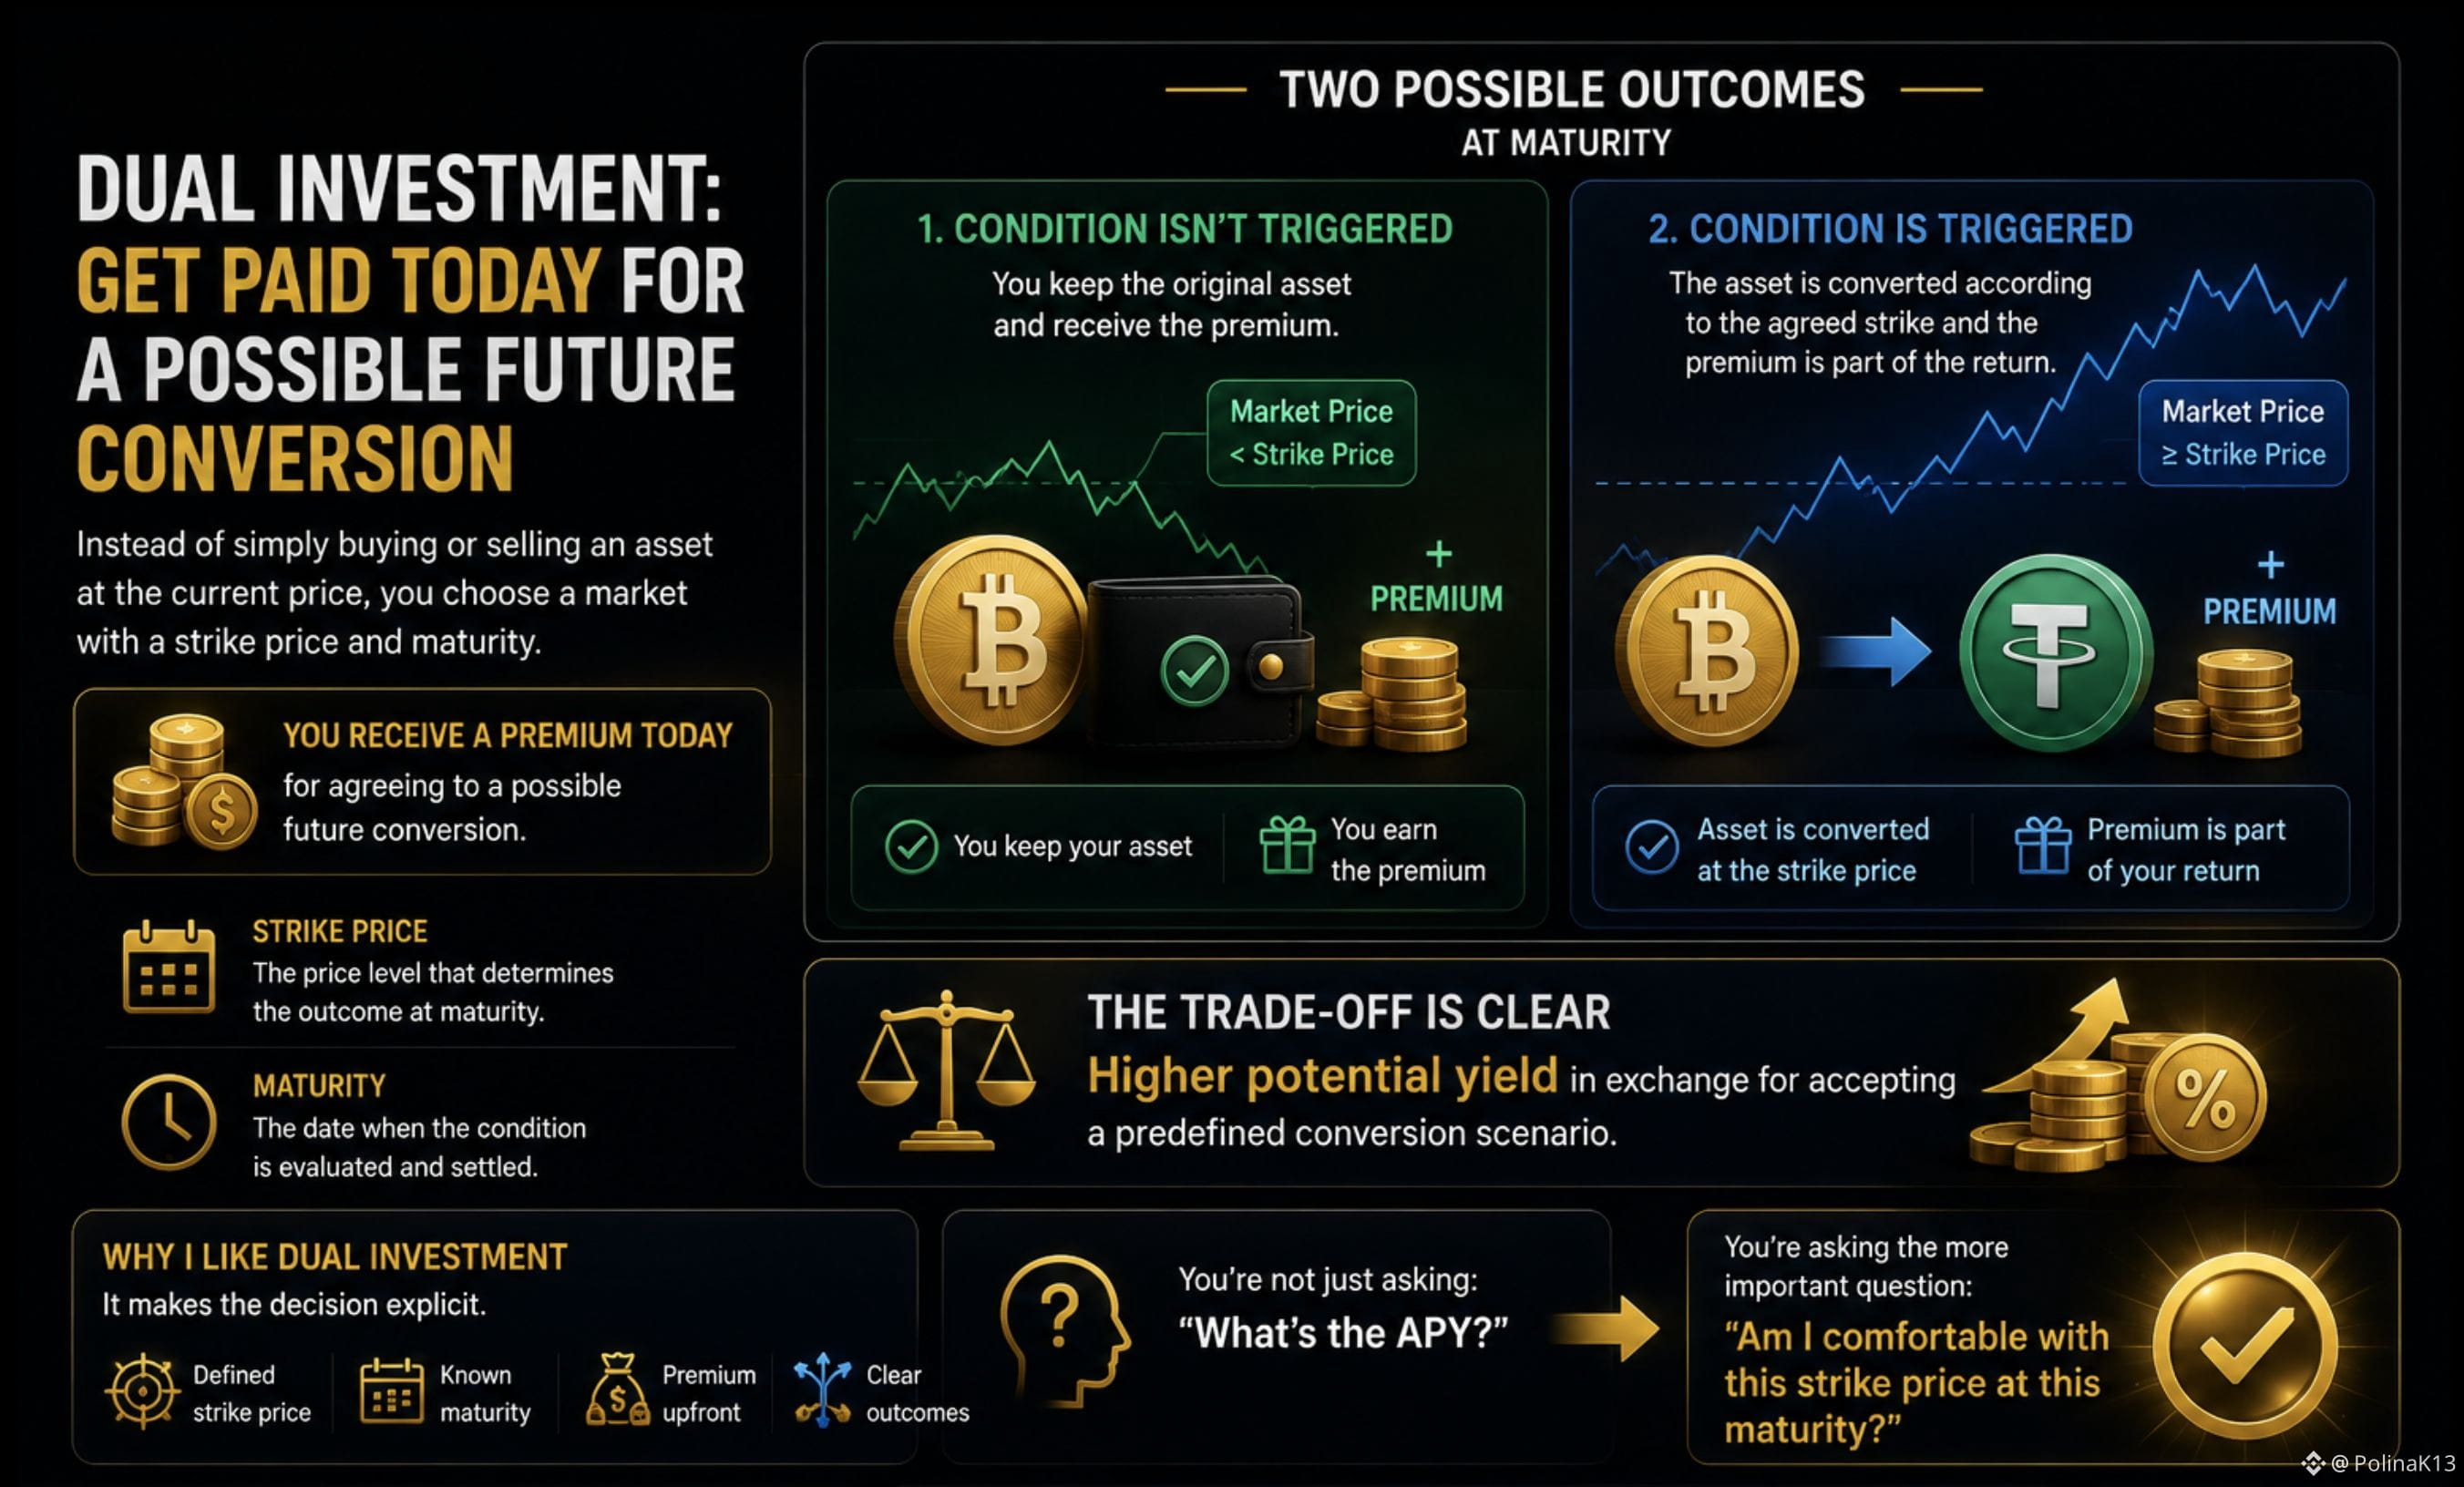
What if you could get paid today for agreeing to a possible future conversion?
That's the basic idea behind Dual Investment.
Instead of simply buying or selling an asset at the current price, you choose a market with a strike price and maturity.
Then there are two possible outcomes.
If the condition isn't triggered:
→ you keep the original asset
→ and receive the premium
If the condition is triggered:
→ the asset is converted according to the agreed strike
→ and the premium is part of the return.
So the trade-off is pretty clear:
higher potential yield in exchange for accepting a predefined conversion scenario.
I like this structure because it makes the decision explicit.
You're not just asking:
“What's the APY?”
You're asking:
“Am I comfortable with this strike price at this maturity?”
That is a much more useful question.
#termmax @termmax
What if you could get paid today for agreeing to a possible future conversion?
That's the basic idea behind Dual Investment.
Instead of simply buying or selling an asset at the current price, you choose a market with a strike price and maturity.
Then there are two possible outcomes.
If the condition isn't triggered:
→ you keep the original asset
→ and receive the premium
If the condition is triggered:
→ the asset is converted according to the agreed strike
→ and the premium is part of the return.
So the trade-off is pretty clear:
higher potential yield in exchange for accepting a predefined conversion scenario.
I like this structure because it makes the decision explicit.
You're not just asking:
“What's the APY?”
You're asking:
“Am I comfortable with this strike price at this maturity?”
That is a much more useful question.
#termmax @TermMax
That's the basic idea behind Dual Investment.
Instead of simply buying or selling an asset at the current price, you choose a market with a strike price and maturity.
Then there are two possible outcomes.
If the condition isn't triggered:
→ you keep the original asset
→ and receive the premium
If the condition is triggered:
→ the asset is converted according to the agreed strike
→ and the premium is part of the return.
So the trade-off is pretty clear:
higher potential yield in exchange for accepting a predefined conversion scenario.
I like this structure because it makes the decision explicit.
You're not just asking:
“What's the APY?”
You're asking:
“Am I comfortable with this strike price at this maturity?”
That is a much more useful question.
#termmax @TermMax
56
·
--
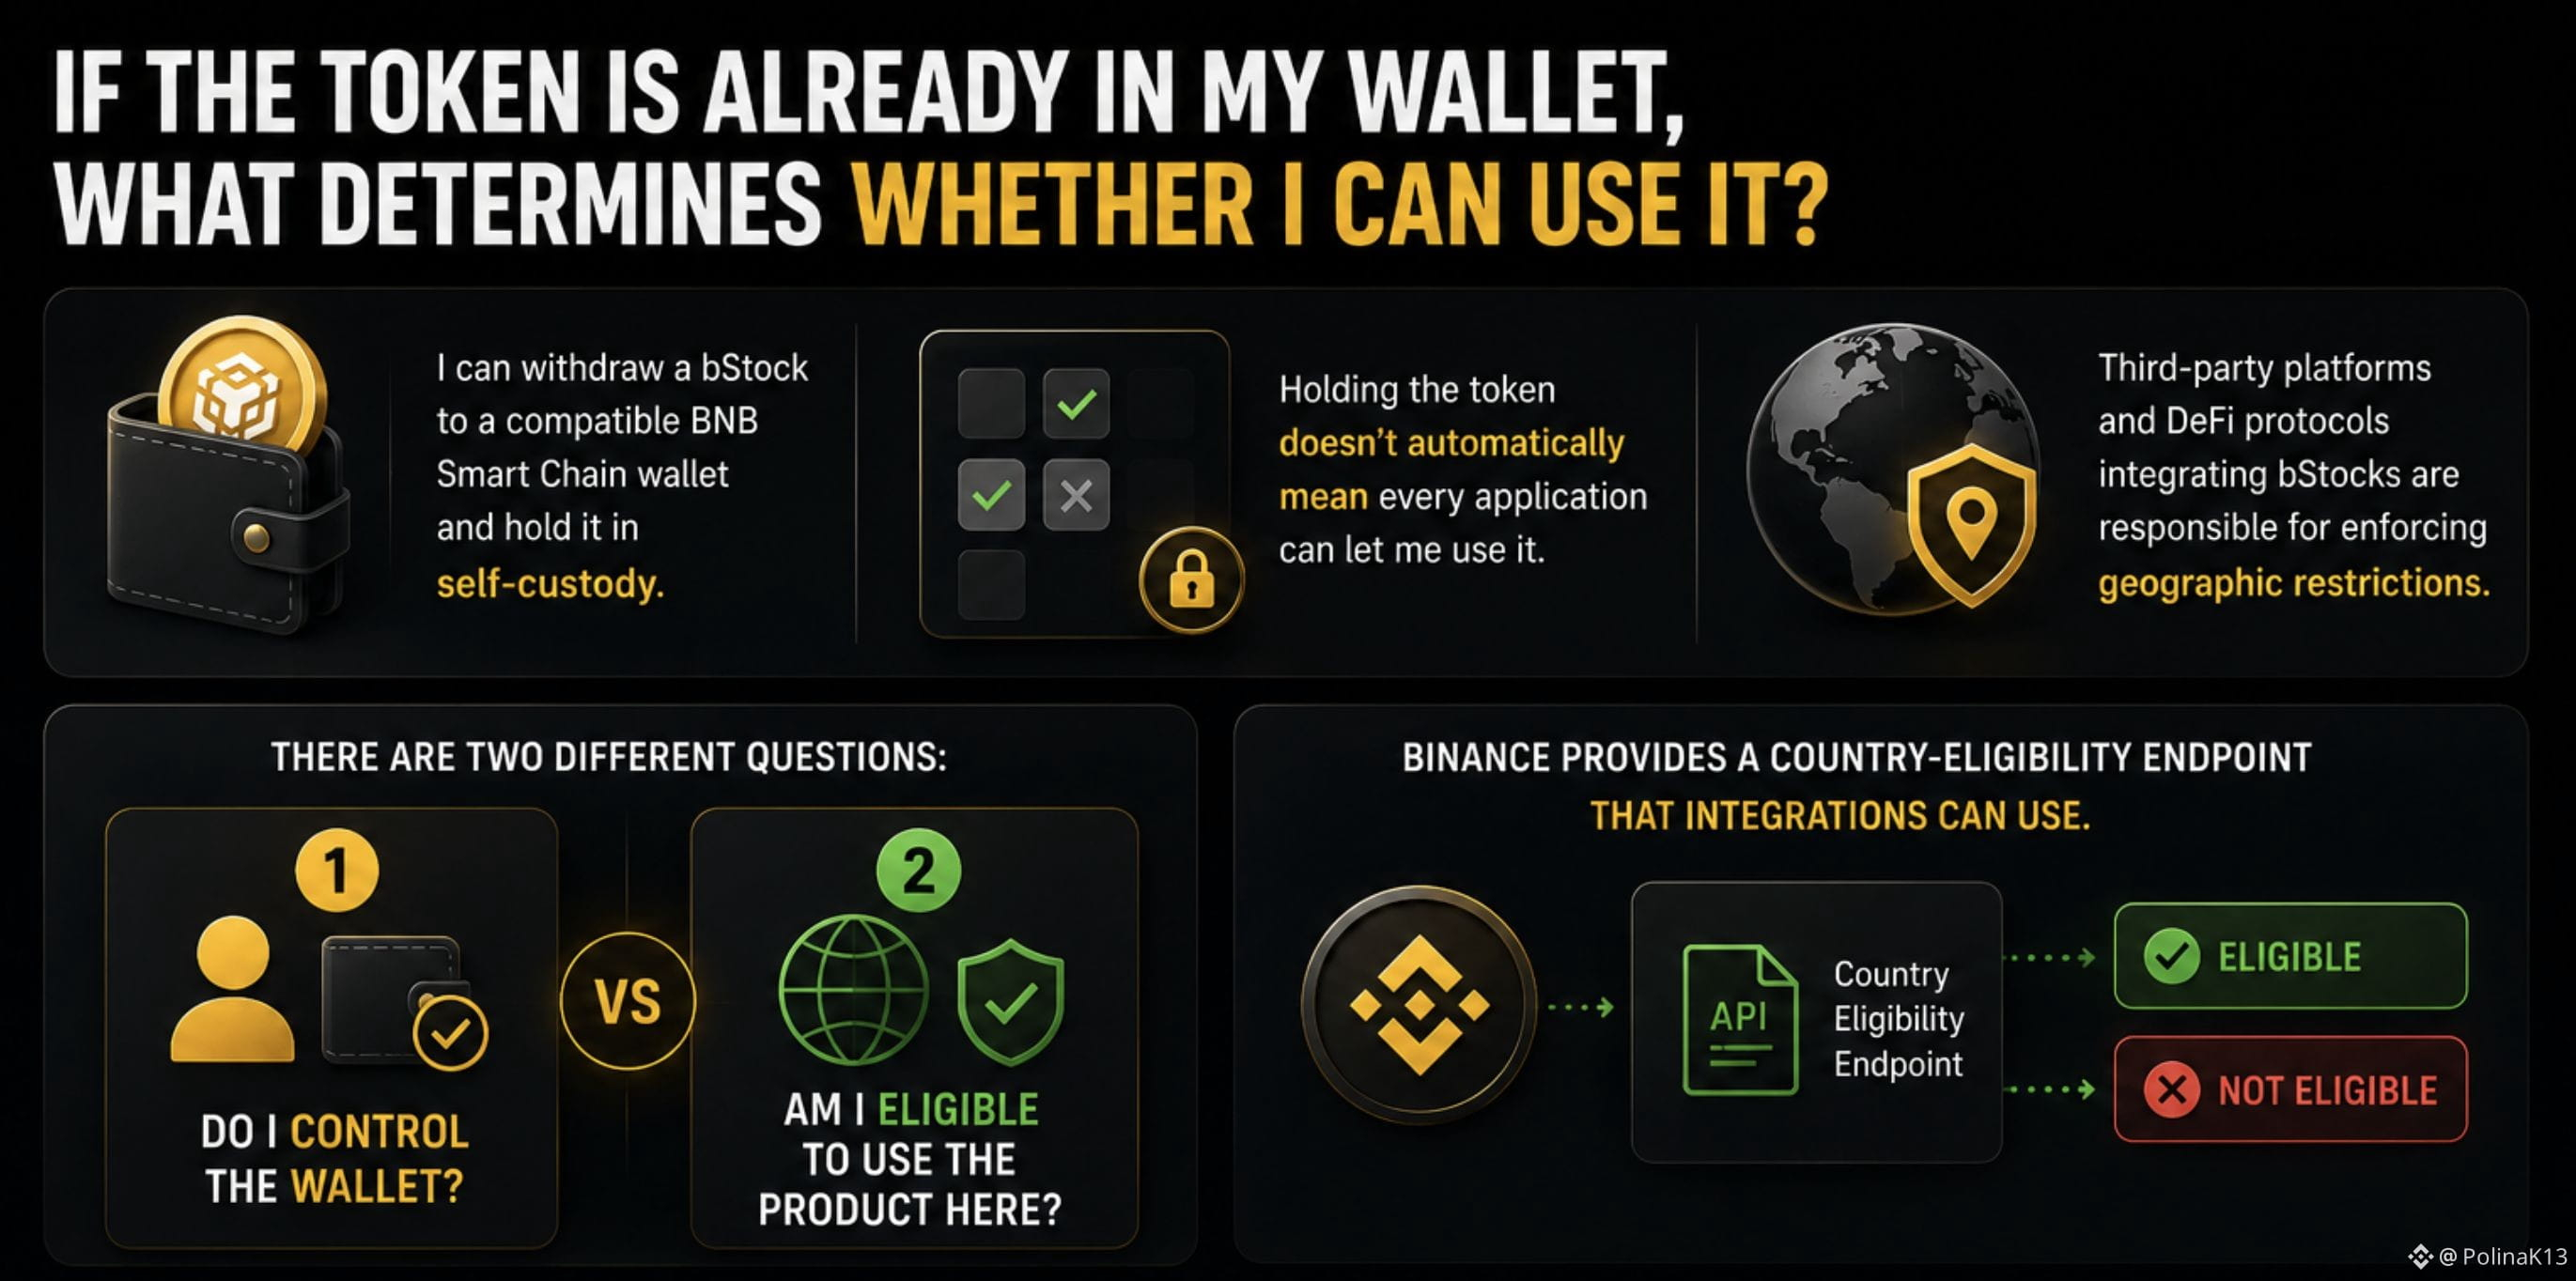
If the token is already in my wallet, what determines whether I can use it?
I used to think that once an asset was in my wallet, the main question was simply whether I controlled it.
But bStocks made me separate two things.
I can withdraw a bStock to a compatible BNB Smart Chain wallet and hold it in self-custody.
But holding the token doesn't automatically mean every application can let me use it.
Third-party platforms and DeFi protocols integrating bStocks are responsible for enforcing geographic restrictions.
Binance also provides a country-eligibility endpoint that integrations can use to check whether a user is eligible in a particular jurisdiction.
So there are two different questions:
Do I control the wallet?
and
Am I eligible to use the product here?
That's the distinction I find interesting.
Self-custody changes where I hold the asset.
It doesn't automatically change where the product can be used.
So instead of asking only:
“Is the token in my wallet?”
I'd also ask:
“What determines whether I can actually use it?”
For me:
Wallet control ≠ product eligibility.
#bstockscis @BinanceCIS
If the token is already in my wallet, what determines whether I can use it?
I used to think that once an asset was in my wallet, the main question was simply whether I controlled it.
But bStocks made me separate two things.
I can withdraw a bStock to a compatible BNB Smart Chain wallet and hold it in self-custody.
But holding the token doesn't automatically mean every application can let me use it.
Third-party platforms and DeFi protocols integrating bStocks are responsible for enforcing geographic restrictions.
Binance also provides a country-eligibility endpoint that integrations can use to check whether a user is eligible in a particular jurisdiction.
So there are two different questions:
Do I control the wallet?
and
Am I eligible to use the product here?
That's the distinction I find interesting.
Self-custody changes where I hold the asset.
It doesn't automatically change where the product can be used.
So instead of asking only:
“Is the token in my wallet?”
I'd also ask:
“What determines whether I can actually use it?”
For me:
Wallet control ≠ product eligibility.
#bstockscis @BinanceCIS
I used to think that once an asset was in my wallet, the main question was simply whether I controlled it.
But bStocks made me separate two things.
I can withdraw a bStock to a compatible BNB Smart Chain wallet and hold it in self-custody.
But holding the token doesn't automatically mean every application can let me use it.
Third-party platforms and DeFi protocols integrating bStocks are responsible for enforcing geographic restrictions.
Binance also provides a country-eligibility endpoint that integrations can use to check whether a user is eligible in a particular jurisdiction.
So there are two different questions:
Do I control the wallet?
and
Am I eligible to use the product here?
That's the distinction I find interesting.
Self-custody changes where I hold the asset.
It doesn't automatically change where the product can be used.
So instead of asking only:
“Is the token in my wallet?”
I'd also ask:
“What determines whether I can actually use it?”
For me:
Wallet control ≠ product eligibility.
#bstockscis @BinanceCIS
2
1
73
·
--
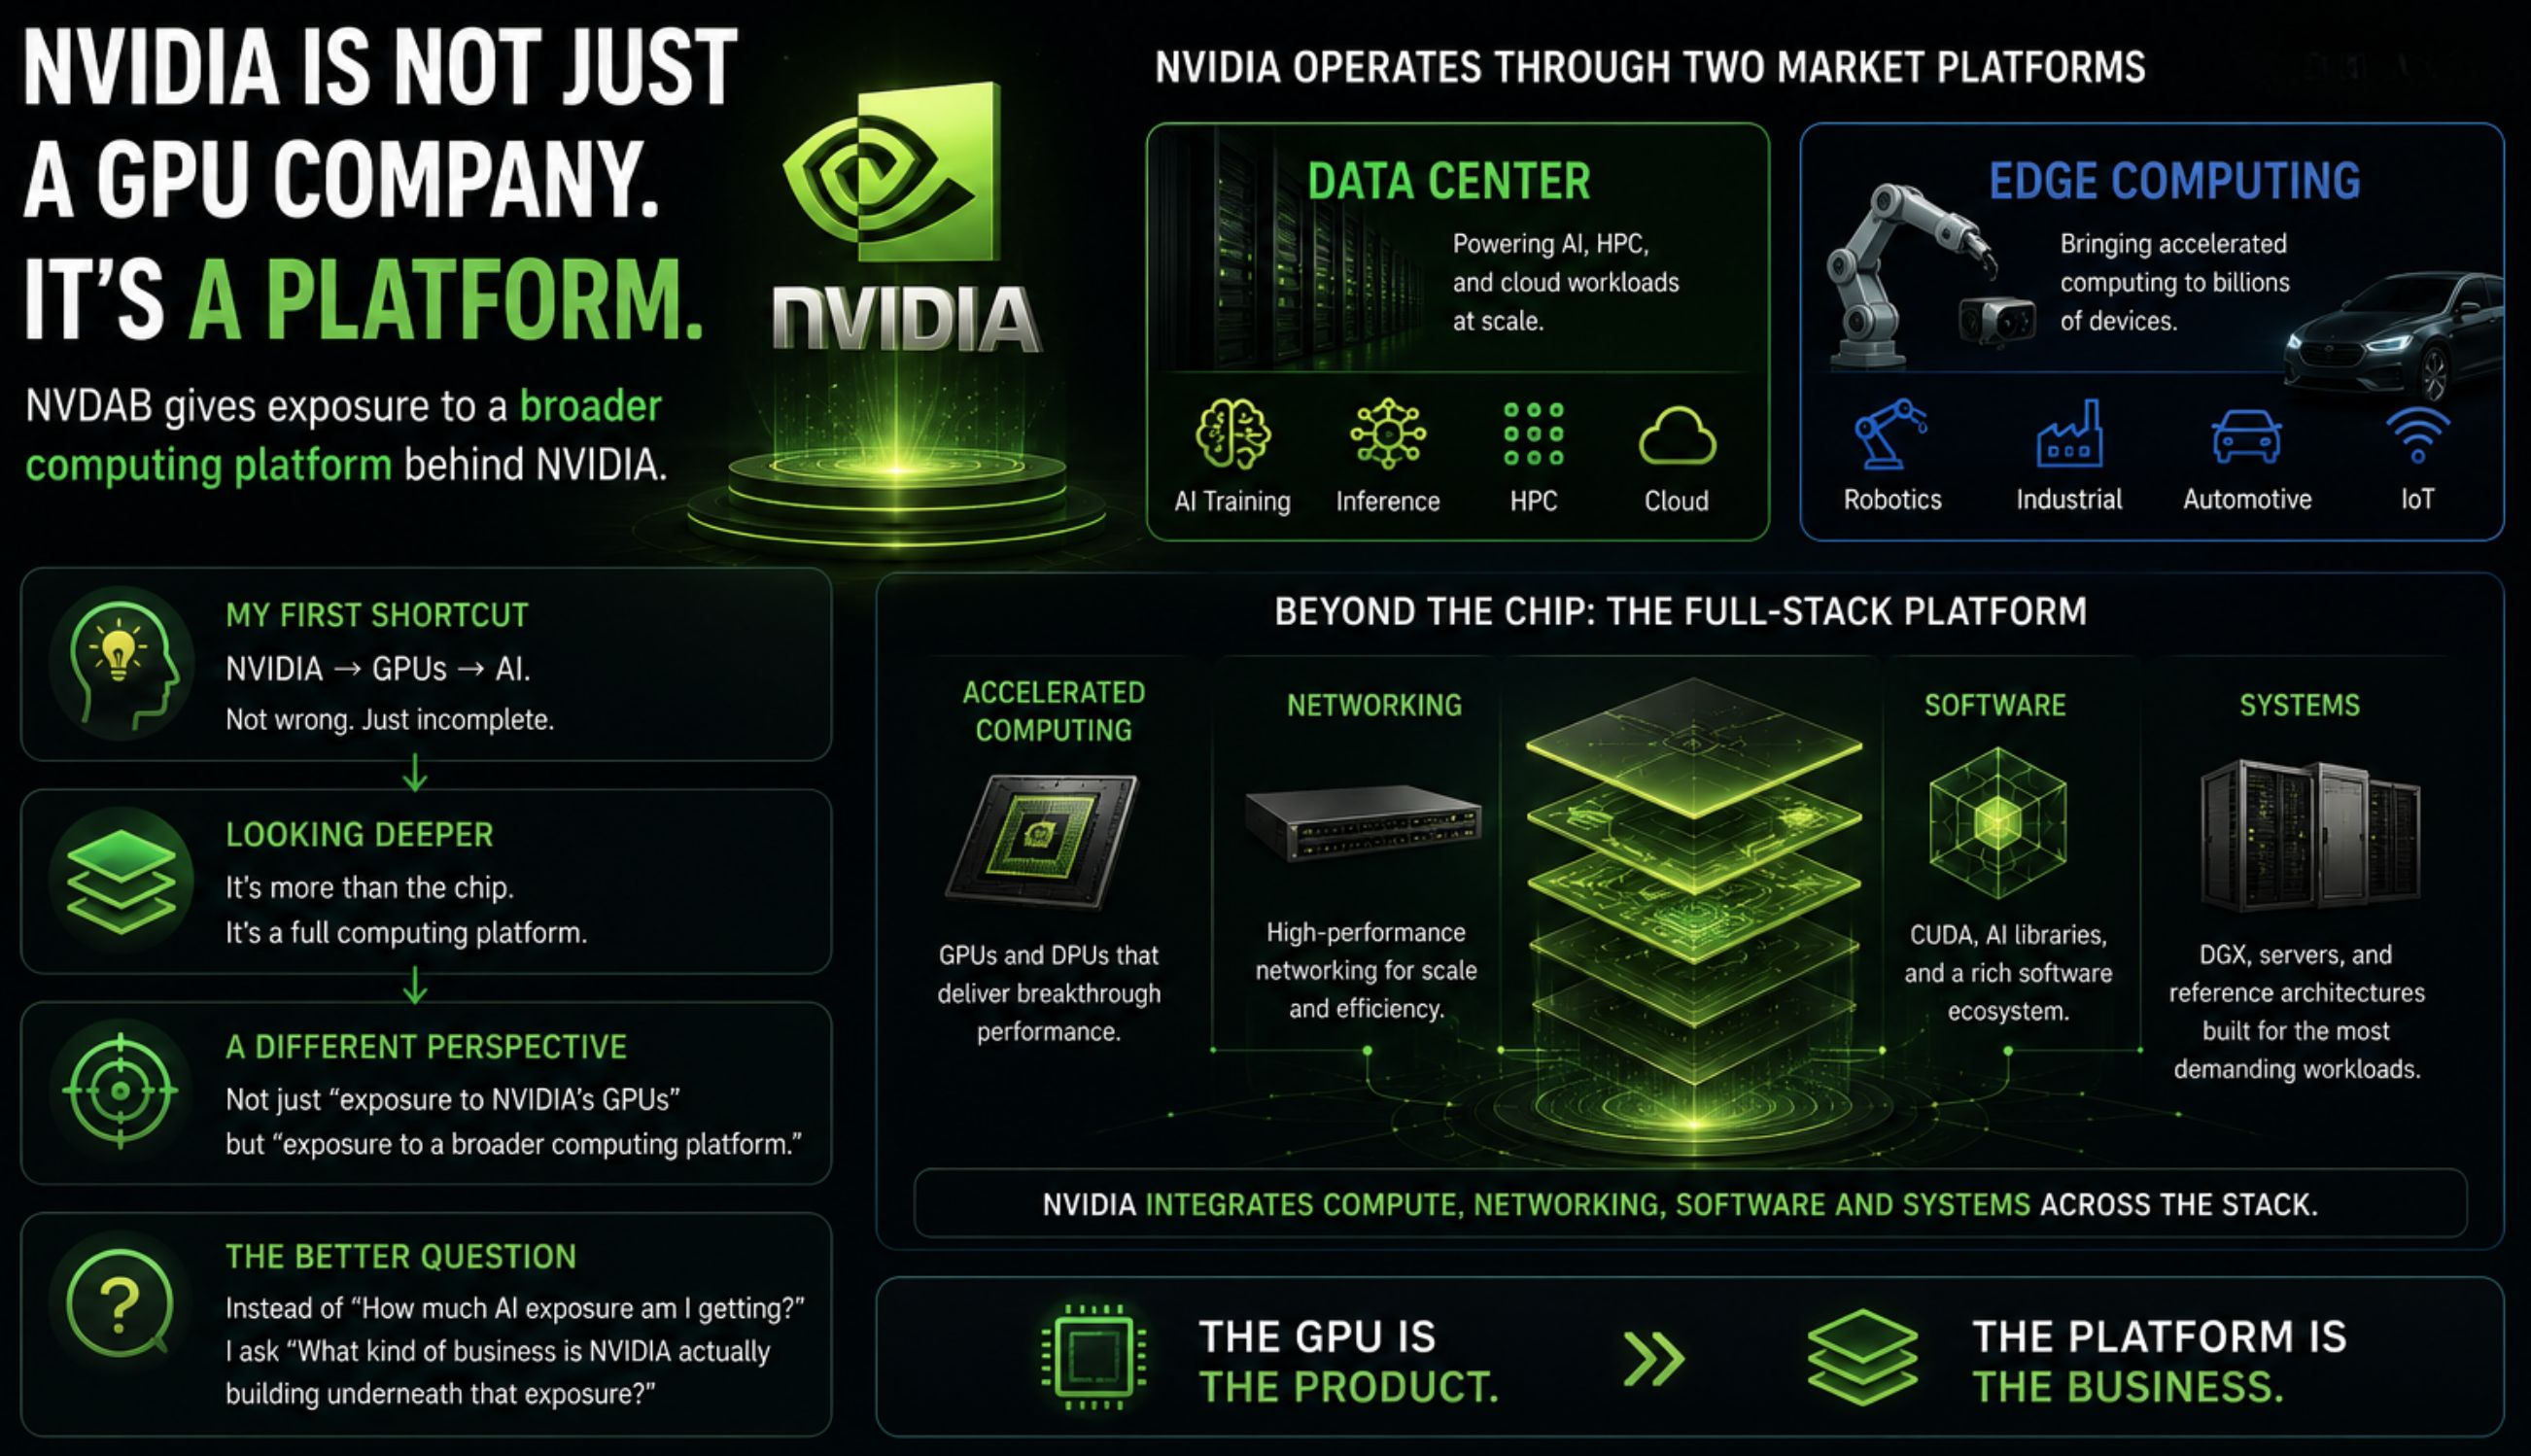
NVIDIA looks like a GPU company. But the business underneath is a platform.
When I first looked at NVDAB, my mental shortcut was simple:
NVIDIA → GPUs → AI.
That shortcut isn't wrong.
It just leaves out a layer I find more interesting.
NVIDIA now describes its business through two market platforms:
Data Center
and
Edge Computing.
And the platform goes beyond the chip itself.
NVIDIA combines accelerated computing, networking, software and systems across the stack.
So I started looking at NVDAB differently.
Not simply as:
“exposure to NVIDIA's GPUs”
but as:
“exposure to a broader computing platform.”
That changes the question for me.
Instead of asking:
“How much AI exposure am I getting?”
I'd ask:
“What kind of business is NVIDIA actually building underneath that exposure?”
For me:
The GPU is the product.
The platform is the business.
#bstockscis @BinanceCIS
NVIDIA looks like a GPU company. But the business underneath is a platform.
When I first looked at NVDAB, my mental shortcut was simple:
NVIDIA → GPUs → AI.
That shortcut isn't wrong.
It just leaves out a layer I find more interesting.
NVIDIA now describes its business through two market platforms:
Data Center
and
Edge Computing.
And the platform goes beyond the chip itself.
NVIDIA combines accelerated computing, networking, software and systems across the stack.
So I started looking at NVDAB differently.
Not simply as:
“exposure to NVIDIA's GPUs”
but as:
“exposure to a broader computing platform.”
That changes the question for me.
Instead of asking:
“How much AI exposure am I getting?”
I'd ask:
“What kind of business is NVIDIA actually building underneath that exposure?”
For me:
The GPU is the product.
The platform is the business.
#bstockscis @BinanceCIS
When I first looked at NVDAB, my mental shortcut was simple:
NVIDIA → GPUs → AI.
That shortcut isn't wrong.
It just leaves out a layer I find more interesting.
NVIDIA now describes its business through two market platforms:
Data Center
and
Edge Computing.
And the platform goes beyond the chip itself.
NVIDIA combines accelerated computing, networking, software and systems across the stack.
So I started looking at NVDAB differently.
Not simply as:
“exposure to NVIDIA's GPUs”
but as:
“exposure to a broader computing platform.”
That changes the question for me.
Instead of asking:
“How much AI exposure am I getting?”
I'd ask:
“What kind of business is NVIDIA actually building underneath that exposure?”
For me:
The GPU is the product.
The platform is the business.
#bstockscis @BinanceCIS
52
·
--
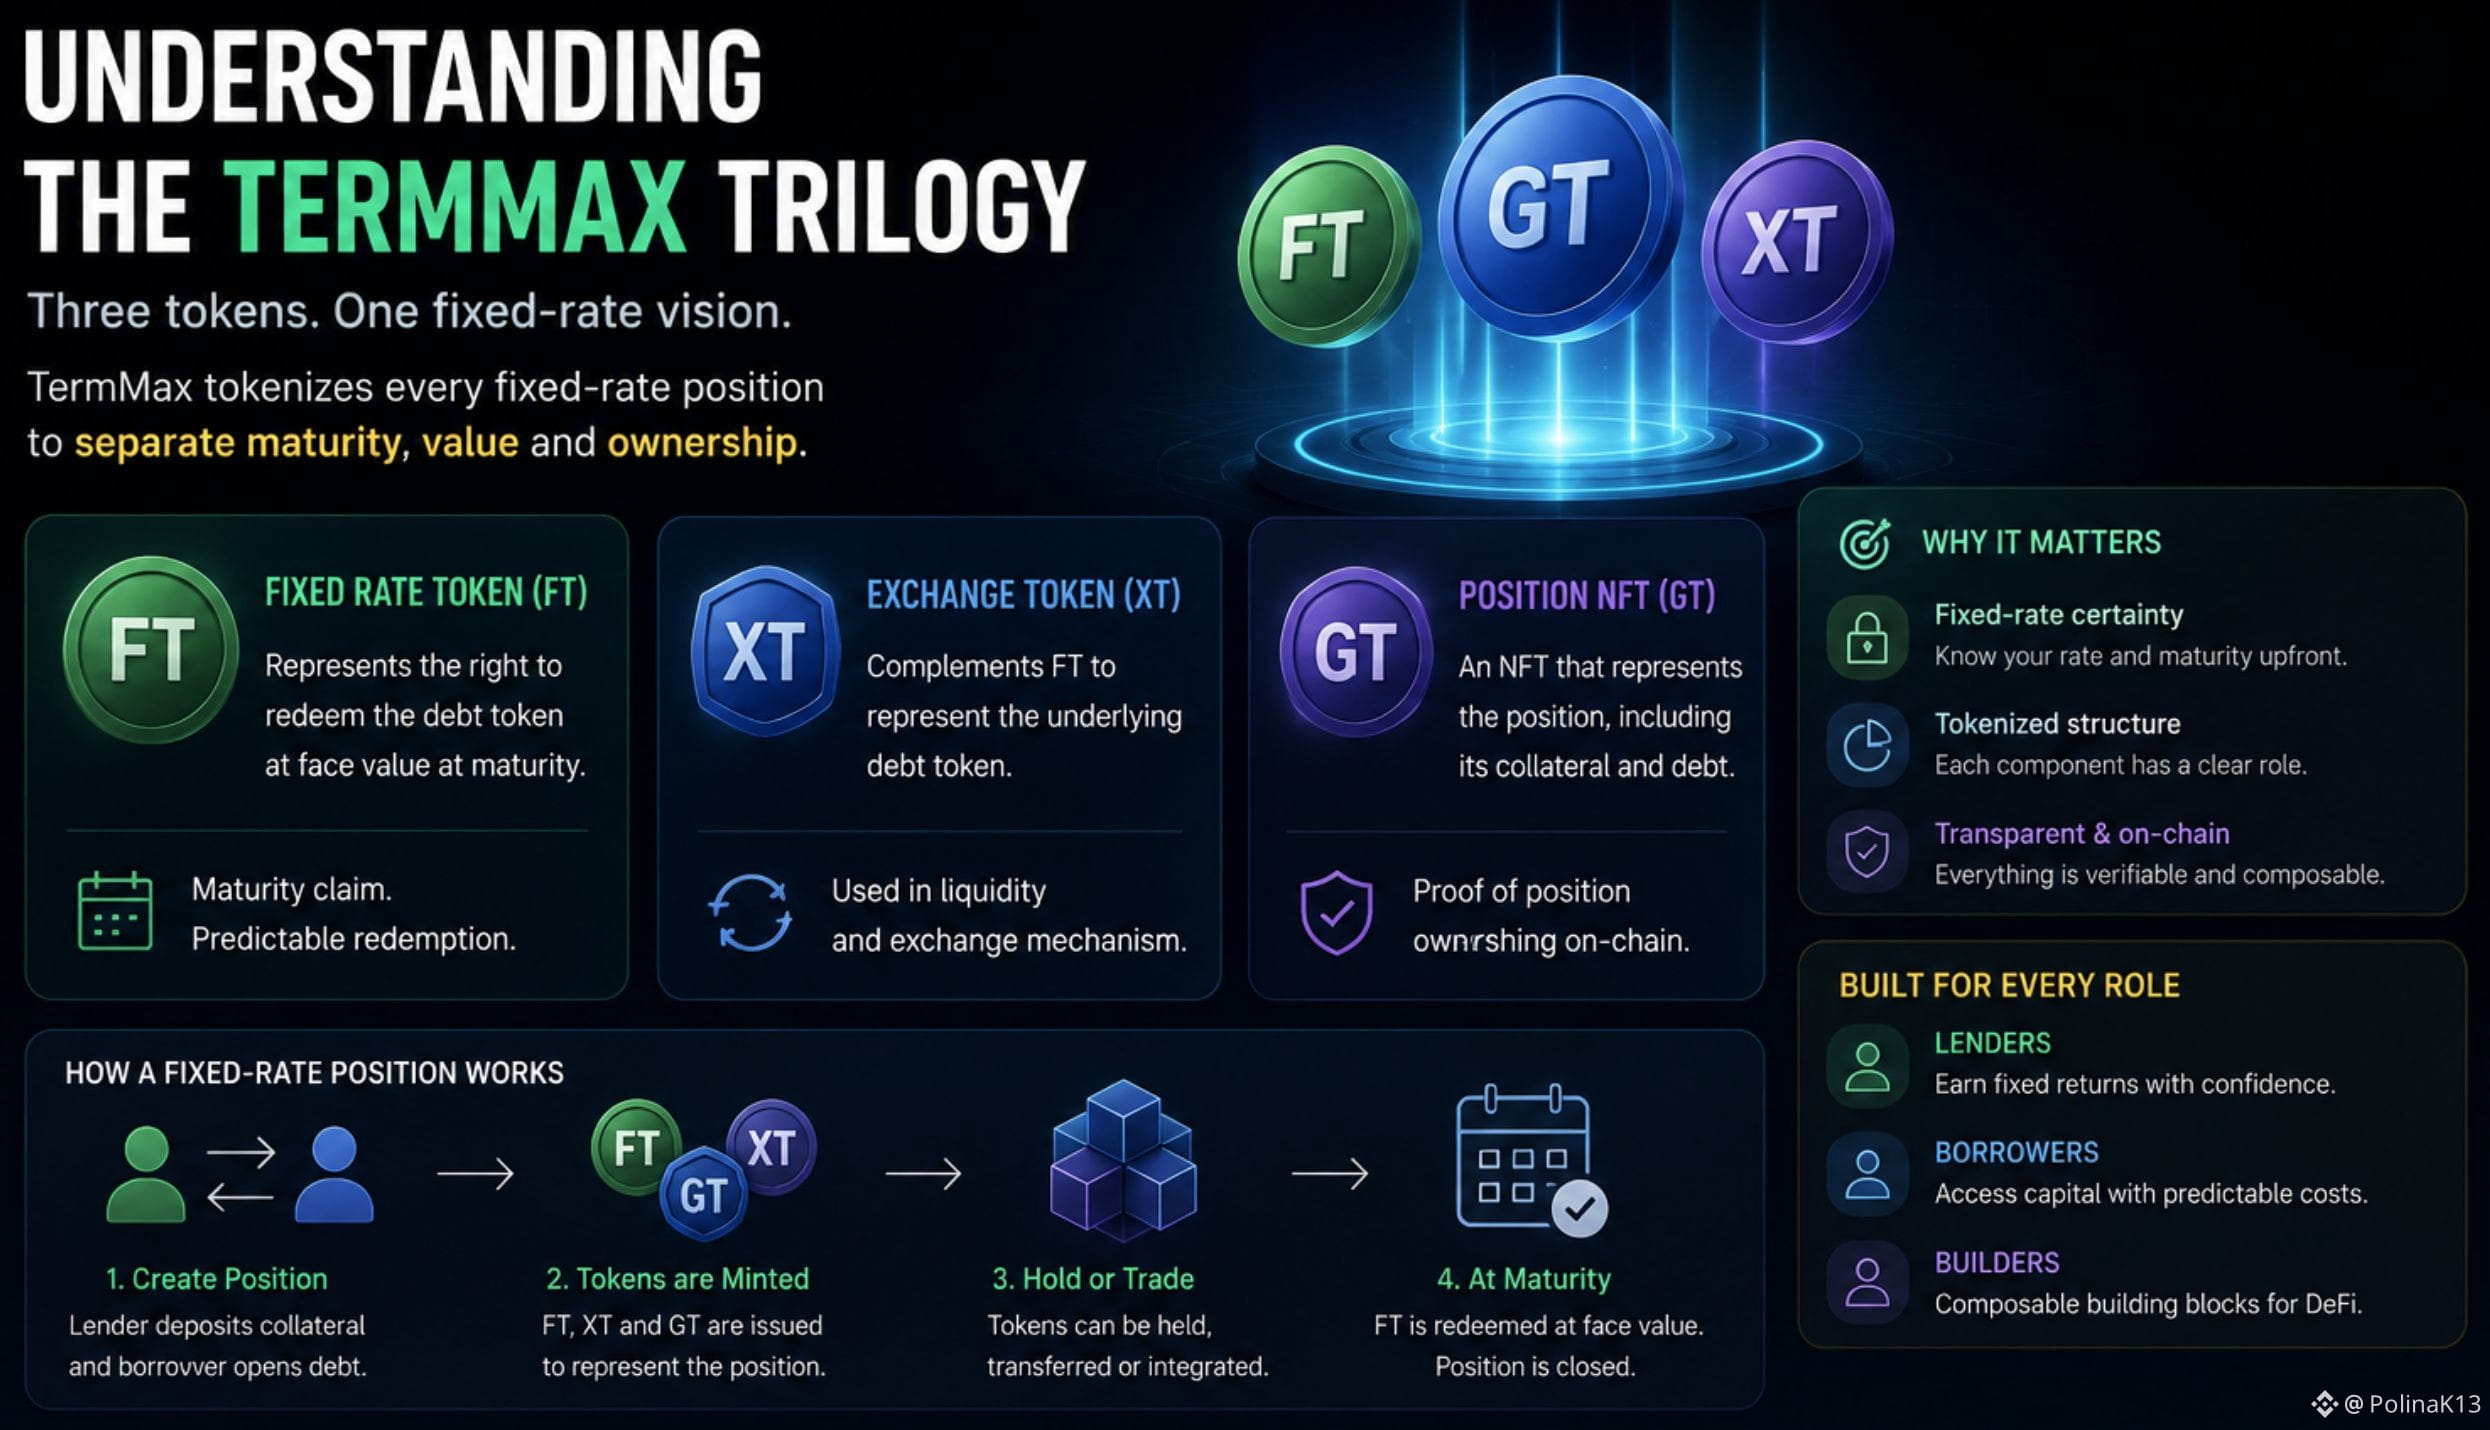
I wanted to understand what actually happens inside a TermMax fixed-rate position.
The architecture is built around three main tokens:
FT → represents the right to redeem the debt token at face value at maturity.
XT → complements FT to represent the underlying debt token and plays a role in the liquidity mechanism.
GT → an NFT representing the position, including its collateral and debt.
So TermMax isn’t simply saying “here is a fixed rate.”
It tokenizes different parts of the position and separates the maturity claim from the underlying economics.
For lenders, this creates a fixed-return position.
For borrowers, it creates financing with a defined maturity and rate structure.
That token architecture is probably one of the most interesting things to understand before judging TermMax as just another lending protocol.
#termmax @termmax
I wanted to understand what actually happens inside a TermMax fixed-rate position.
The architecture is built around three main tokens:
FT → represents the right to redeem the debt token at face value at maturity.
XT → complements FT to represent the underlying debt token and plays a role in the liquidity mechanism.
GT → an NFT representing the position, including its collateral and debt.
So TermMax isn’t simply saying “here is a fixed rate.”
It tokenizes different parts of the position and separates the maturity claim from the underlying economics.
For lenders, this creates a fixed-return position.
For borrowers, it creates financing with a defined maturity and rate structure.
That token architecture is probably one of the most interesting things to understand before judging TermMax as just another lending protocol.
#termmax @TermMax
The architecture is built around three main tokens:
FT → represents the right to redeem the debt token at face value at maturity.
XT → complements FT to represent the underlying debt token and plays a role in the liquidity mechanism.
GT → an NFT representing the position, including its collateral and debt.
So TermMax isn’t simply saying “here is a fixed rate.”
It tokenizes different parts of the position and separates the maturity claim from the underlying economics.
For lenders, this creates a fixed-return position.
For borrowers, it creates financing with a defined maturity and rate structure.
That token architecture is probably one of the most interesting things to understand before judging TermMax as just another lending protocol.
#termmax @TermMax
71
·
--
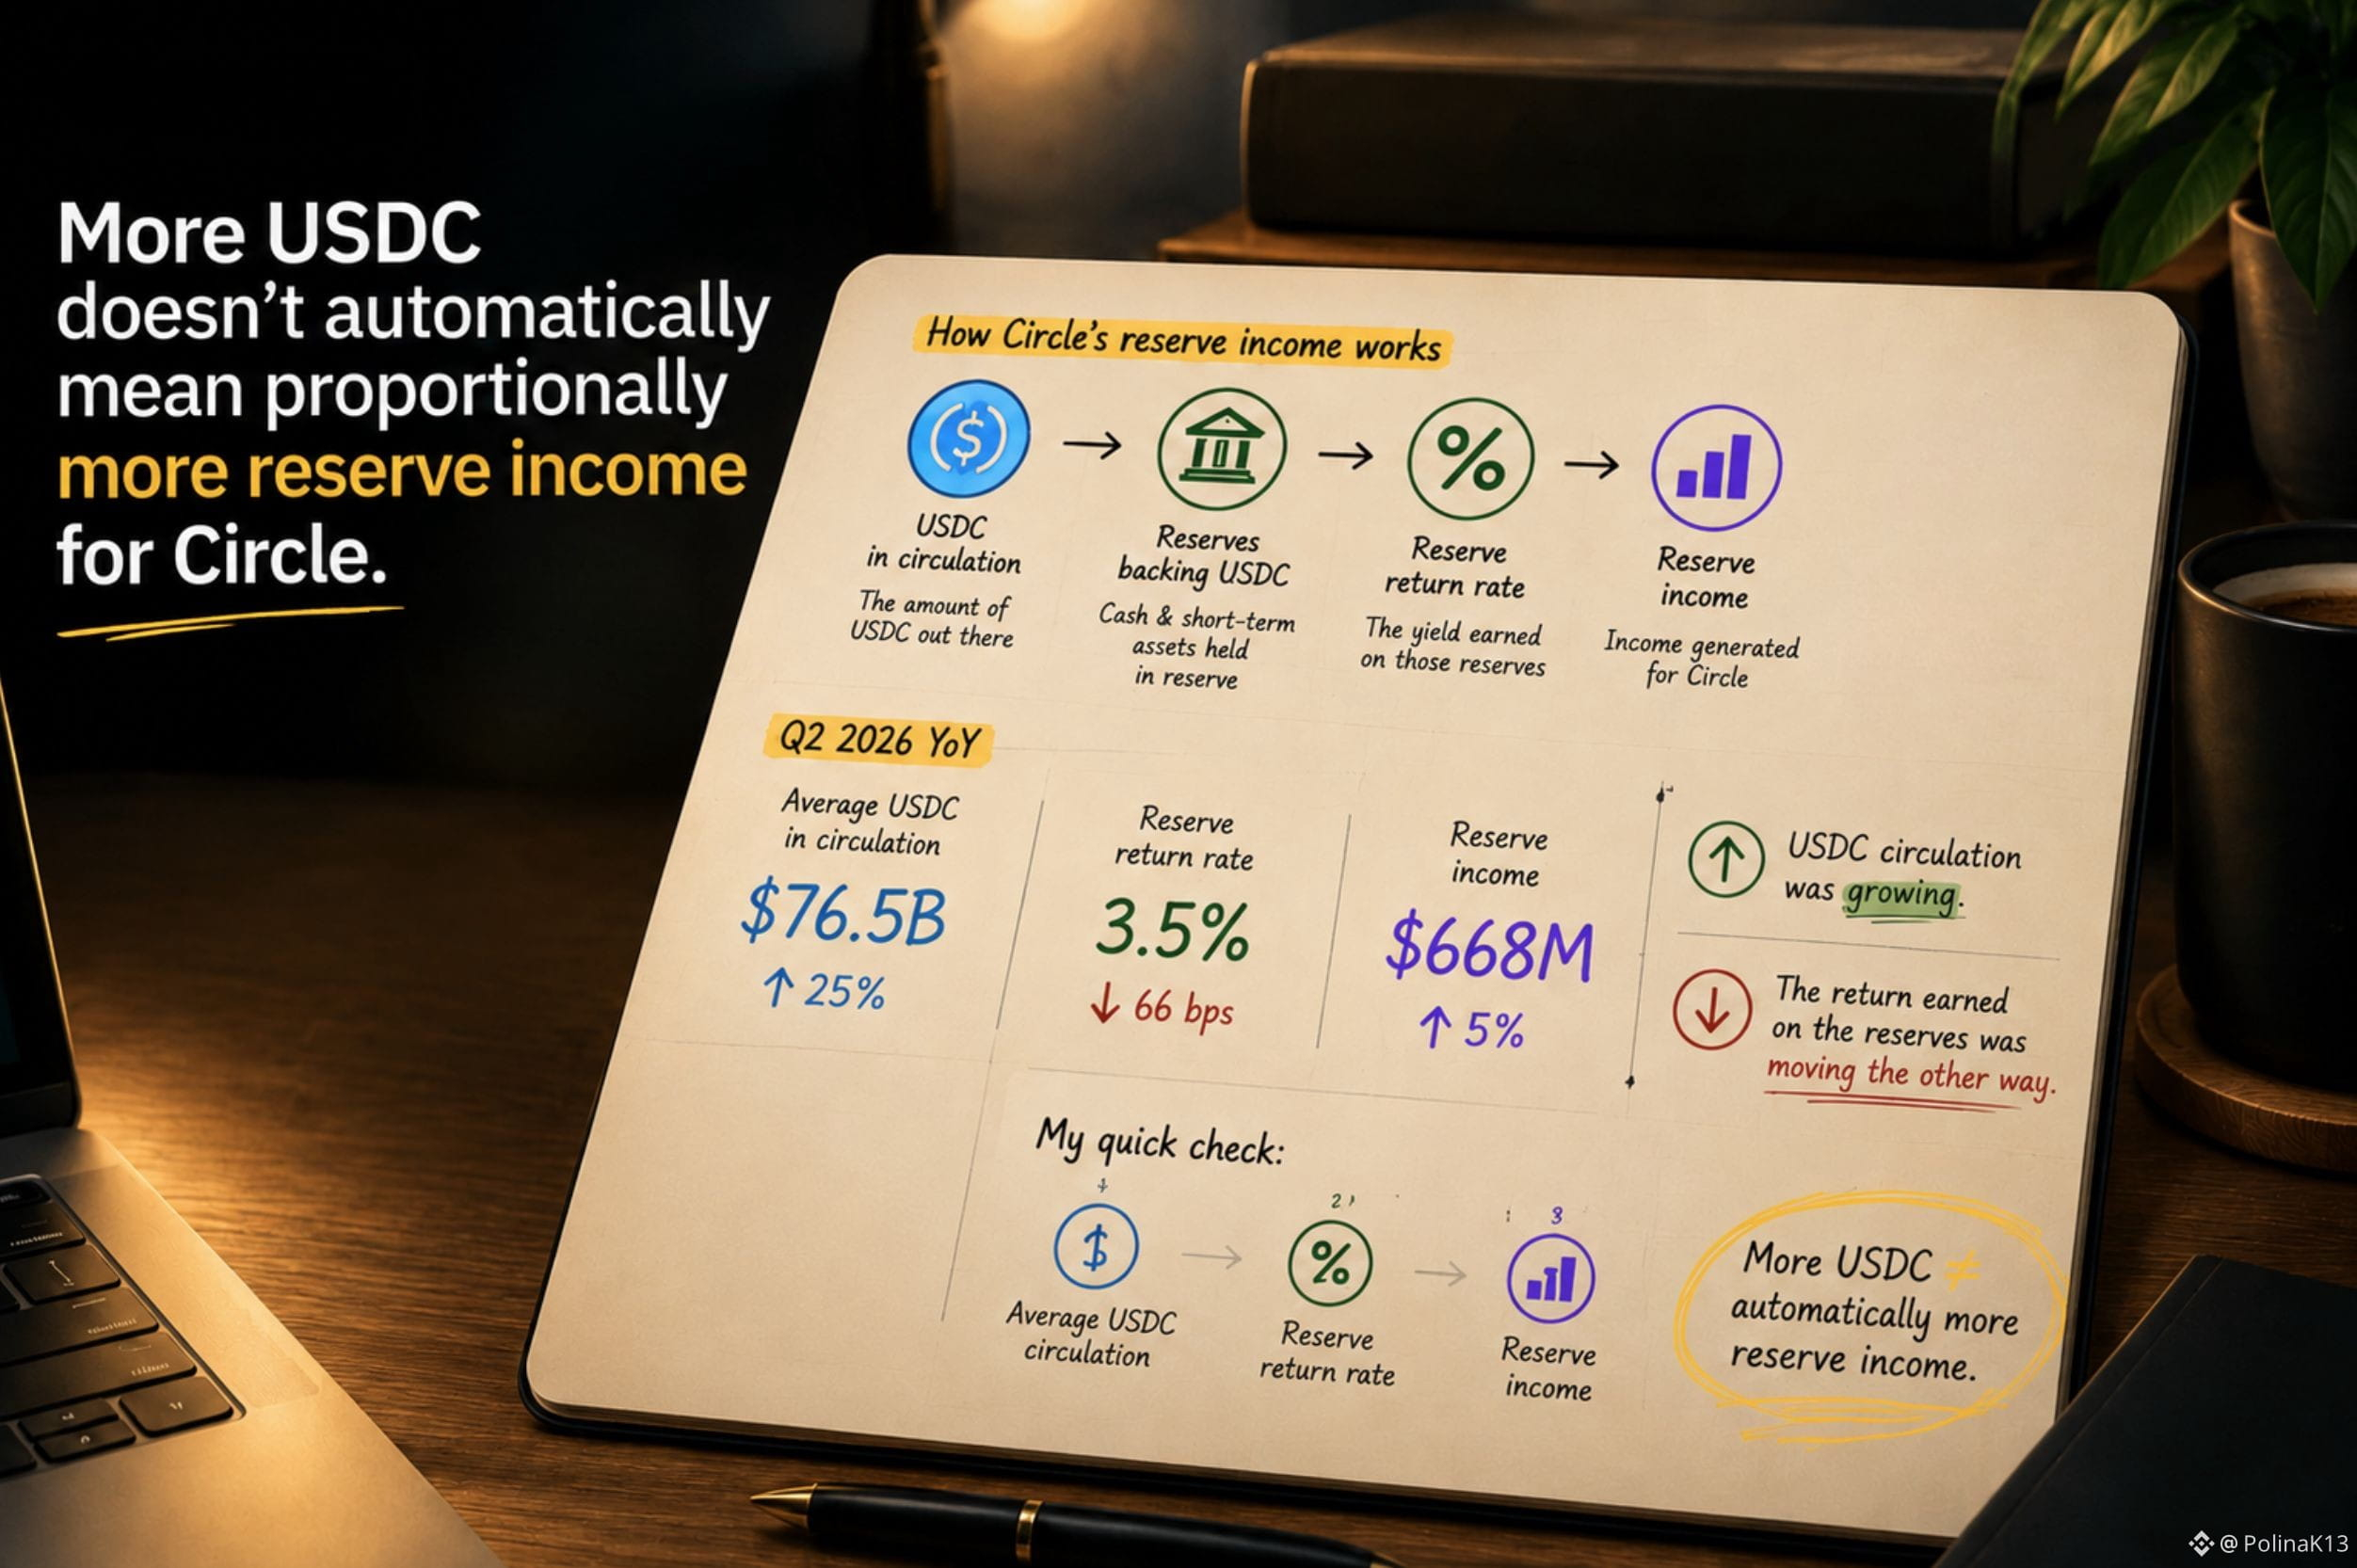
More USDC doesn't automatically mean proportionally more reserve income for Circle.
CRCLB is one of the bStocks that caught my attention because the obvious label is simple:
Circle = USDC.
So when USDC circulation grows, my first instinct is to expect Circle's reserve income to grow at roughly the same pace.
But the latest numbers made that assumption look too simple.
In Q2, average USDC in circulation reached about $76.5B, up 25% YoY.
Yet reserve income was about $668M, up only 5% YoY.
Why the gap?
Because reserve income depends on both the amount of USDC in circulation and the return earned on the reserves backing it.
And while circulation was growing, the reserve return rate fell to about 3.5%, down 66 bps YoY.
USDC circulation was growing. The return earned on the reserves was moving the other way.
That changed how I look at CRCLB.
I don't want to stop at:
“USDC adoption is growing.”
I want to ask:
“What is that growth actually doing to Circle's economics?”
My quick check would be:
1. Average USDC circulation
2. Reserve return rate
3. Reserve income
Because:
More USDC ≠ automatically more reserve income.
#bstockscis @BinanceCIS
More USDC doesn't automatically mean proportionally more reserve income for Circle.
CRCLB is one of the bStocks that caught my attention because the obvious label is simple:
Circle = USDC.
So when USDC circulation grows, my first instinct is to expect Circle's reserve income to grow at roughly the same pace.
But the latest numbers made that assumption look too simple.
In Q2, average USDC in circulation reached about $76.5B, up 25% YoY.
Yet reserve income was about $668M, up only 5% YoY.
Why the gap?
Because reserve income depends on both the amount of USDC in circulation and the return earned on the reserves backing it.
And while circulation was growing, the reserve return rate fell to about 3.5%, down 66 bps YoY.
USDC circulation was growing. The return earned on the reserves was moving the other way.
That changed how I look at CRCLB.
I don't want to stop at:
“USDC adoption is growing.”
I want to ask:
“What is that growth actually doing to Circle's economics?”
My quick check would be:
1. Average USDC circulation
2. Reserve return rate
3. Reserve income
Because:
More USDC ≠ automatically more reserve income.
#bstockscis @BinanceCIS
CRCLB is one of the bStocks that caught my attention because the obvious label is simple:
Circle = USDC.
So when USDC circulation grows, my first instinct is to expect Circle's reserve income to grow at roughly the same pace.
But the latest numbers made that assumption look too simple.
In Q2, average USDC in circulation reached about $76.5B, up 25% YoY.
Yet reserve income was about $668M, up only 5% YoY.
Why the gap?
Because reserve income depends on both the amount of USDC in circulation and the return earned on the reserves backing it.
And while circulation was growing, the reserve return rate fell to about 3.5%, down 66 bps YoY.
USDC circulation was growing. The return earned on the reserves was moving the other way.
That changed how I look at CRCLB.
I don't want to stop at:
“USDC adoption is growing.”
I want to ask:
“What is that growth actually doing to Circle's economics?”
My quick check would be:
1. Average USDC circulation
2. Reserve return rate
3. Reserve income
Because:
More USDC ≠ automatically more reserve income.
#bstockscis @BinanceCIS
2
1
212
·
--
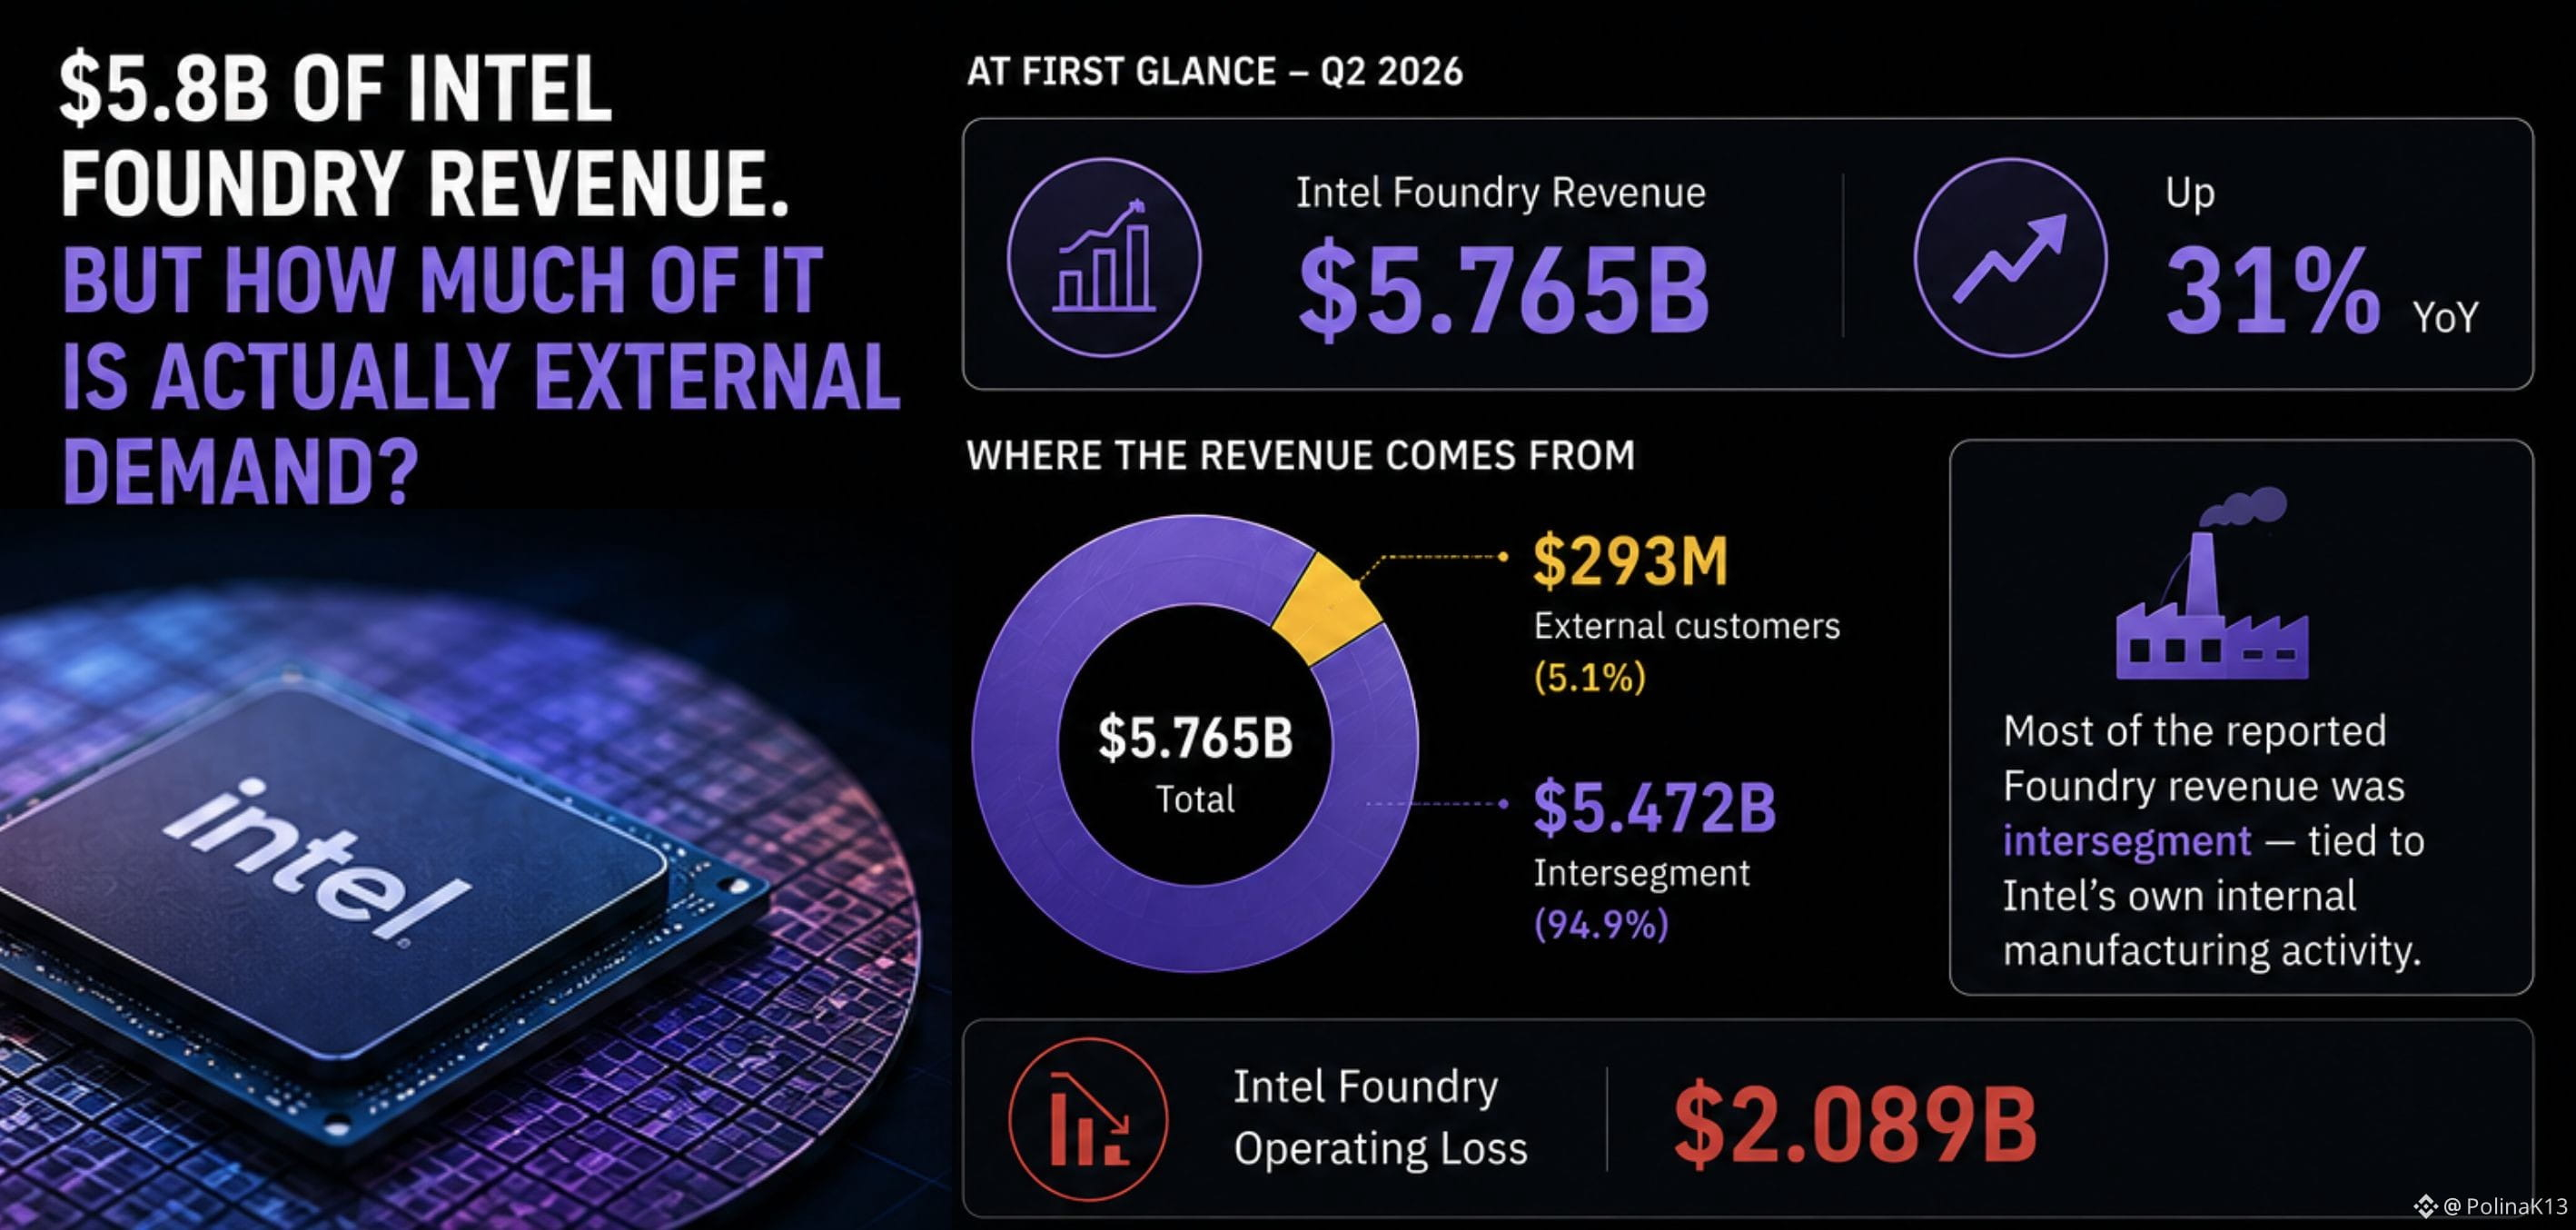
$5.8B of Intel Foundry revenue. But how much of it is actually external demand?
INTCB is one of the bStocks we can use to get exposure to Intel.
At first glance, Intel Foundry's Q2 revenue looks like a large foundry business:
$5.765B, up 31% YoY.
But then I looked one layer deeper.
Only $293M came from external customers.
Most of the reported Foundry revenue was intersegment — tied to Intel's own internal manufacturing activity. Intel also reported a $2.089B operating loss for the segment.
That changed how I read the headline number.
Foundry revenue ≠ external foundry demand.
A segment can be large before its external customer business is.
So when I look at INTCB, I don't just want to know:
“How big is Intel Foundry?”
I want to know:
“How much of that business is actually being bought by outside customers?”
For me, that's a much more useful way to read a foundry story.
#bstockscis @BinanceCIS
$5.8B of Intel Foundry revenue. But how much of it is actually external demand?
INTCB is one of the bStocks we can use to get exposure to Intel.
At first glance, Intel Foundry's Q2 revenue looks like a large foundry business:
$5.765B, up 31% YoY.
But then I looked one layer deeper.
Only $293M came from external customers.
Most of the reported Foundry revenue was intersegment — tied to Intel's own internal manufacturing activity. Intel also reported a $2.089B operating loss for the segment.
That changed how I read the headline number.
Foundry revenue ≠ external foundry demand.
A segment can be large before its external customer business is.
So when I look at INTCB, I don't just want to know:
“How big is Intel Foundry?”
I want to know:
“How much of that business is actually being bought by outside customers?”
For me, that's a much more useful way to read a foundry story.
#bstockscis @BinanceCIS
INTCB is one of the bStocks we can use to get exposure to Intel.
At first glance, Intel Foundry's Q2 revenue looks like a large foundry business:
$5.765B, up 31% YoY.
But then I looked one layer deeper.
Only $293M came from external customers.
Most of the reported Foundry revenue was intersegment — tied to Intel's own internal manufacturing activity. Intel also reported a $2.089B operating loss for the segment.
That changed how I read the headline number.
Foundry revenue ≠ external foundry demand.
A segment can be large before its external customer business is.
So when I look at INTCB, I don't just want to know:
“How big is Intel Foundry?”
I want to know:
“How much of that business is actually being bought by outside customers?”
For me, that's a much more useful way to read a foundry story.
#bstockscis @BinanceCIS
4
2
91
·
--
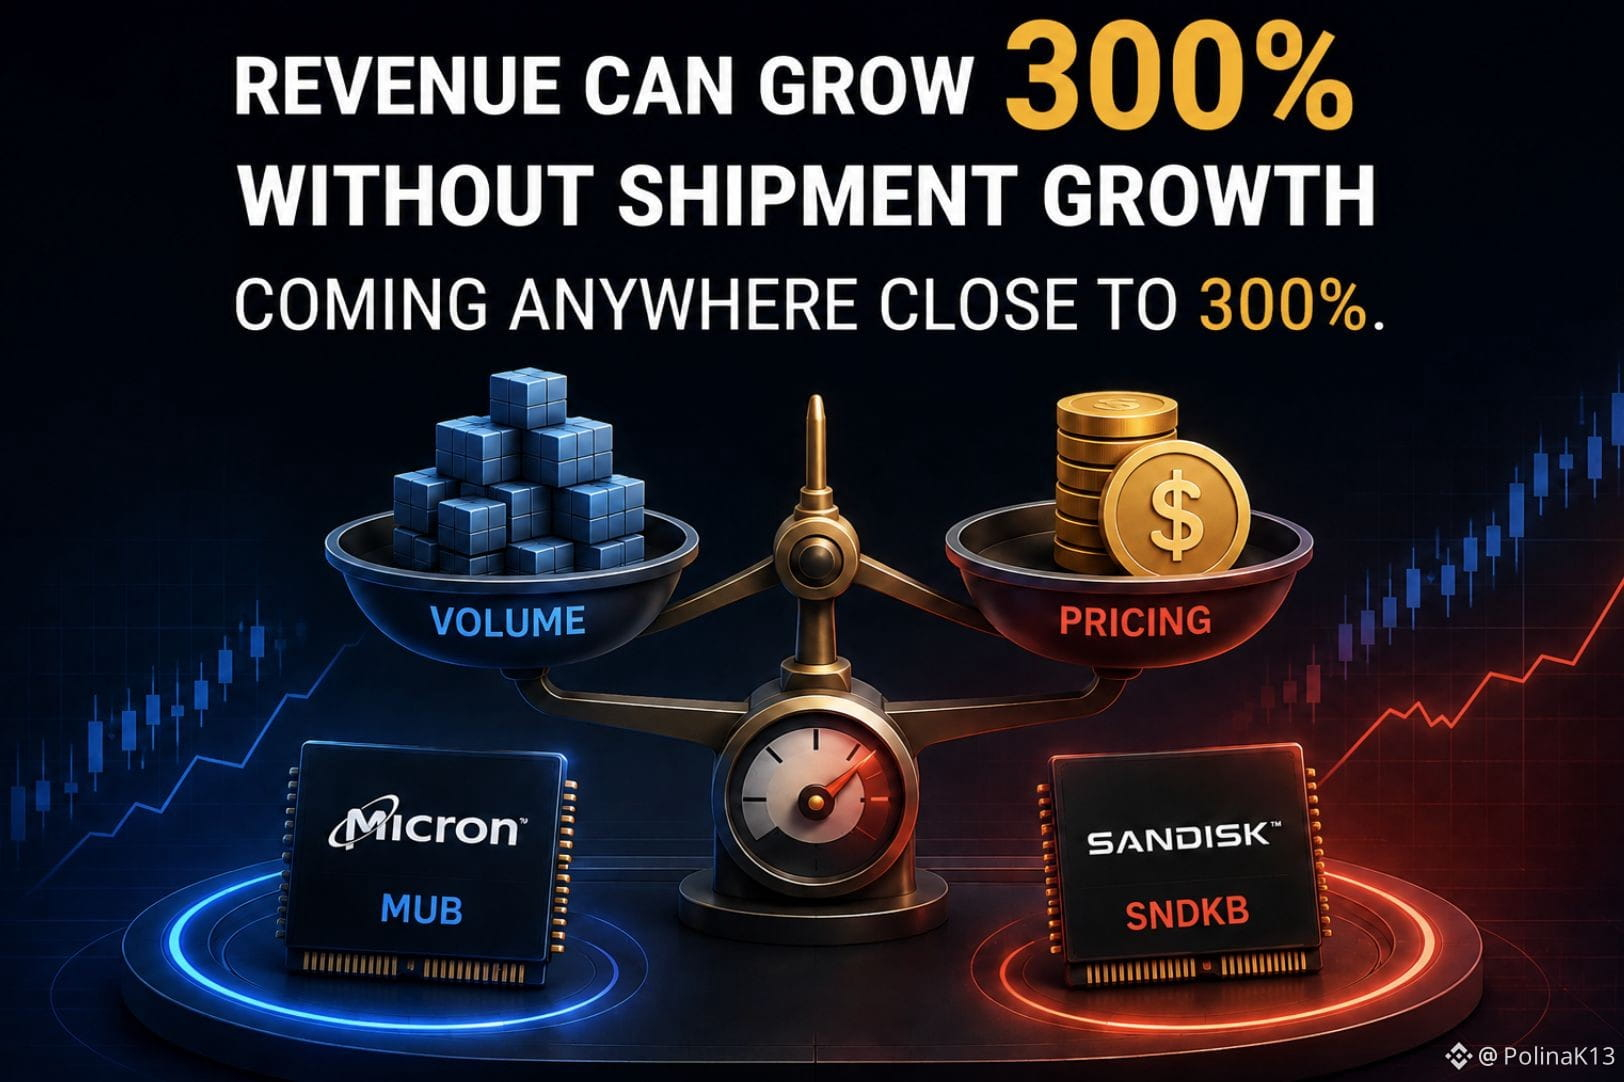
Revenue can grow 300%+ without shipment growth coming anywhere close to 300%.
MUB and SNDKB are both available as bStocks and sit in the broader semiconductor/memory universe.
So at first glance, it’s easy to group them into the same broader semiconductor growth story.
But look at what’s actually driving the numbers.
For Micron, DRAM revenue reached $31.3B in fiscal Q3, up 343% YoY and representing 76% of total revenue.
Yet DRAM bit shipments grew only in the low-20% range YoY, while DRAM ASPs increased in the low-260% range.
In other words, DRAM revenue growth wasn't simply about selling dramatically more bits.
SanDisk's latest quarter tells a similar story from a different angle.
Its fiscal Q4 revenue reached $8.97B, up 51% sequentially — with roughly one-third of the sequential increase coming from higher volume and two-thirds from higher pricing.
That made me rethink how I read “growth” when looking at bStocks.
The ticker tells me which company I'm getting exposure to.
But the headline growth number doesn't automatically tell me what is driving that exposure.
Two bStocks can sit in the same broad category while very different things drive their financial results.
Before comparing growth rates, ask what's underneath the growth.
#bstockscis @BinanceCIS
Revenue can grow 300%+ without shipment growth coming anywhere close to 300%.
MUB and SNDKB are both available as bStocks and sit in the broader semiconductor/memory universe.
So at first glance, it’s easy to group them into the same broader semiconductor growth story.
But look at what’s actually driving the numbers.
For Micron, DRAM revenue reached $31.3B in fiscal Q3, up 343% YoY and representing 76% of total revenue.
Yet DRAM bit shipments grew only in the low-20% range YoY, while DRAM ASPs increased in the low-260% range.
In other words, DRAM revenue growth wasn't simply about selling dramatically more bits.
SanDisk's latest quarter tells a similar story from a different angle.
Its fiscal Q4 revenue reached $8.97B, up 51% sequentially — with roughly one-third of the sequential increase coming from higher volume and two-thirds from higher pricing.
That made me rethink how I read “growth” when looking at bStocks.
The ticker tells me which company I'm getting exposure to.
But the headline growth number doesn't automatically tell me what is driving that exposure.
Two bStocks can sit in the same broad category while very different things drive their financial results.
Before comparing growth rates, ask what's underneath the growth.
#bstockscis @BinanceCIS
MUB and SNDKB are both available as bStocks and sit in the broader semiconductor/memory universe.
So at first glance, it’s easy to group them into the same broader semiconductor growth story.
But look at what’s actually driving the numbers.
For Micron, DRAM revenue reached $31.3B in fiscal Q3, up 343% YoY and representing 76% of total revenue.
Yet DRAM bit shipments grew only in the low-20% range YoY, while DRAM ASPs increased in the low-260% range.
In other words, DRAM revenue growth wasn't simply about selling dramatically more bits.
SanDisk's latest quarter tells a similar story from a different angle.
Its fiscal Q4 revenue reached $8.97B, up 51% sequentially — with roughly one-third of the sequential increase coming from higher volume and two-thirds from higher pricing.
That made me rethink how I read “growth” when looking at bStocks.
The ticker tells me which company I'm getting exposure to.
But the headline growth number doesn't automatically tell me what is driving that exposure.
Two bStocks can sit in the same broad category while very different things drive their financial results.
Before comparing growth rates, ask what's underneath the growth.
#bstockscis @BinanceCIS
2
1
130
·
--
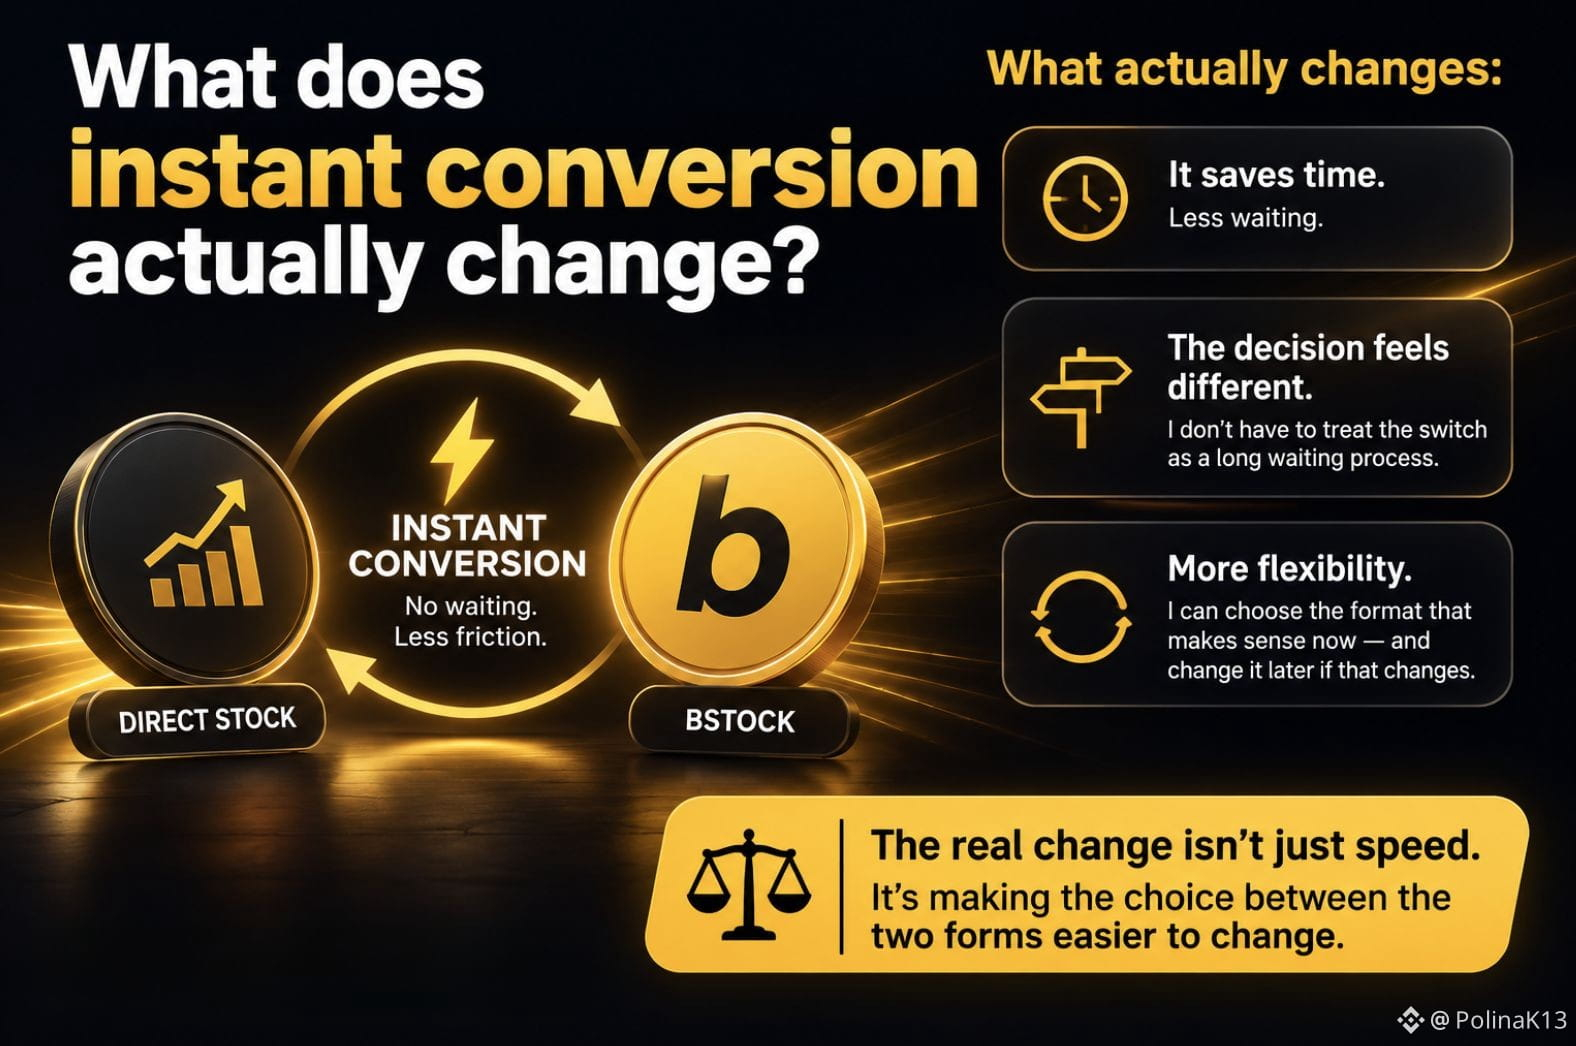
What does instant conversion actually change?
When I first saw that eligible stocks can be converted into bStocks instantly, I thought the main benefit was obvious:
It saves time.
But the more I thought about it, the less that seemed to be the whole story.
If moving between a direct stock and a bStock doesn't require me to wait for a traditional conversion process, the decision itself starts to feel different.
I don't have to treat the switch as a decision that comes with a long waiting period.
I can choose the format that makes sense for what I want to do now — and change it later if that changes.
That made me look at the word “instant” differently.
It's not just about how quickly the conversion happens.
It's about how much friction there is in changing my decision.
So I started wondering:
Does instant conversion simply save time, or does it make switching between the two forms of exposure a different kind of decision?
For me, that's the more interesting part.
The value isn't only in getting from one form to another faster.
It's in making the choice between them easier to change.
#bstockscis @BinanceCIS
What does instant conversion actually change?
When I first saw that eligible stocks can be converted into bStocks instantly, I thought the main benefit was obvious:
It saves time.
But the more I thought about it, the less that seemed to be the whole story.
If moving between a direct stock and a bStock doesn't require me to wait for a traditional conversion process, the decision itself starts to feel different.
I don't have to treat the switch as a decision that comes with a long waiting period.
I can choose the format that makes sense for what I want to do now — and change it later if that changes.
That made me look at the word “instant” differently.
It's not just about how quickly the conversion happens.
It's about how much friction there is in changing my decision.
So I started wondering:
Does instant conversion simply save time, or does it make switching between the two forms of exposure a different kind of decision?
For me, that's the more interesting part.
The value isn't only in getting from one form to another faster.
It's in making the choice between them easier to change.
#bstockscis @BinanceCIS
When I first saw that eligible stocks can be converted into bStocks instantly, I thought the main benefit was obvious:
It saves time.
But the more I thought about it, the less that seemed to be the whole story.
If moving between a direct stock and a bStock doesn't require me to wait for a traditional conversion process, the decision itself starts to feel different.
I don't have to treat the switch as a decision that comes with a long waiting period.
I can choose the format that makes sense for what I want to do now — and change it later if that changes.
That made me look at the word “instant” differently.
It's not just about how quickly the conversion happens.
It's about how much friction there is in changing my decision.
So I started wondering:
Does instant conversion simply save time, or does it make switching between the two forms of exposure a different kind of decision?
For me, that's the more interesting part.
The value isn't only in getting from one form to another faster.
It's in making the choice between them easier to change.
#bstockscis @BinanceCIS
85
·
--
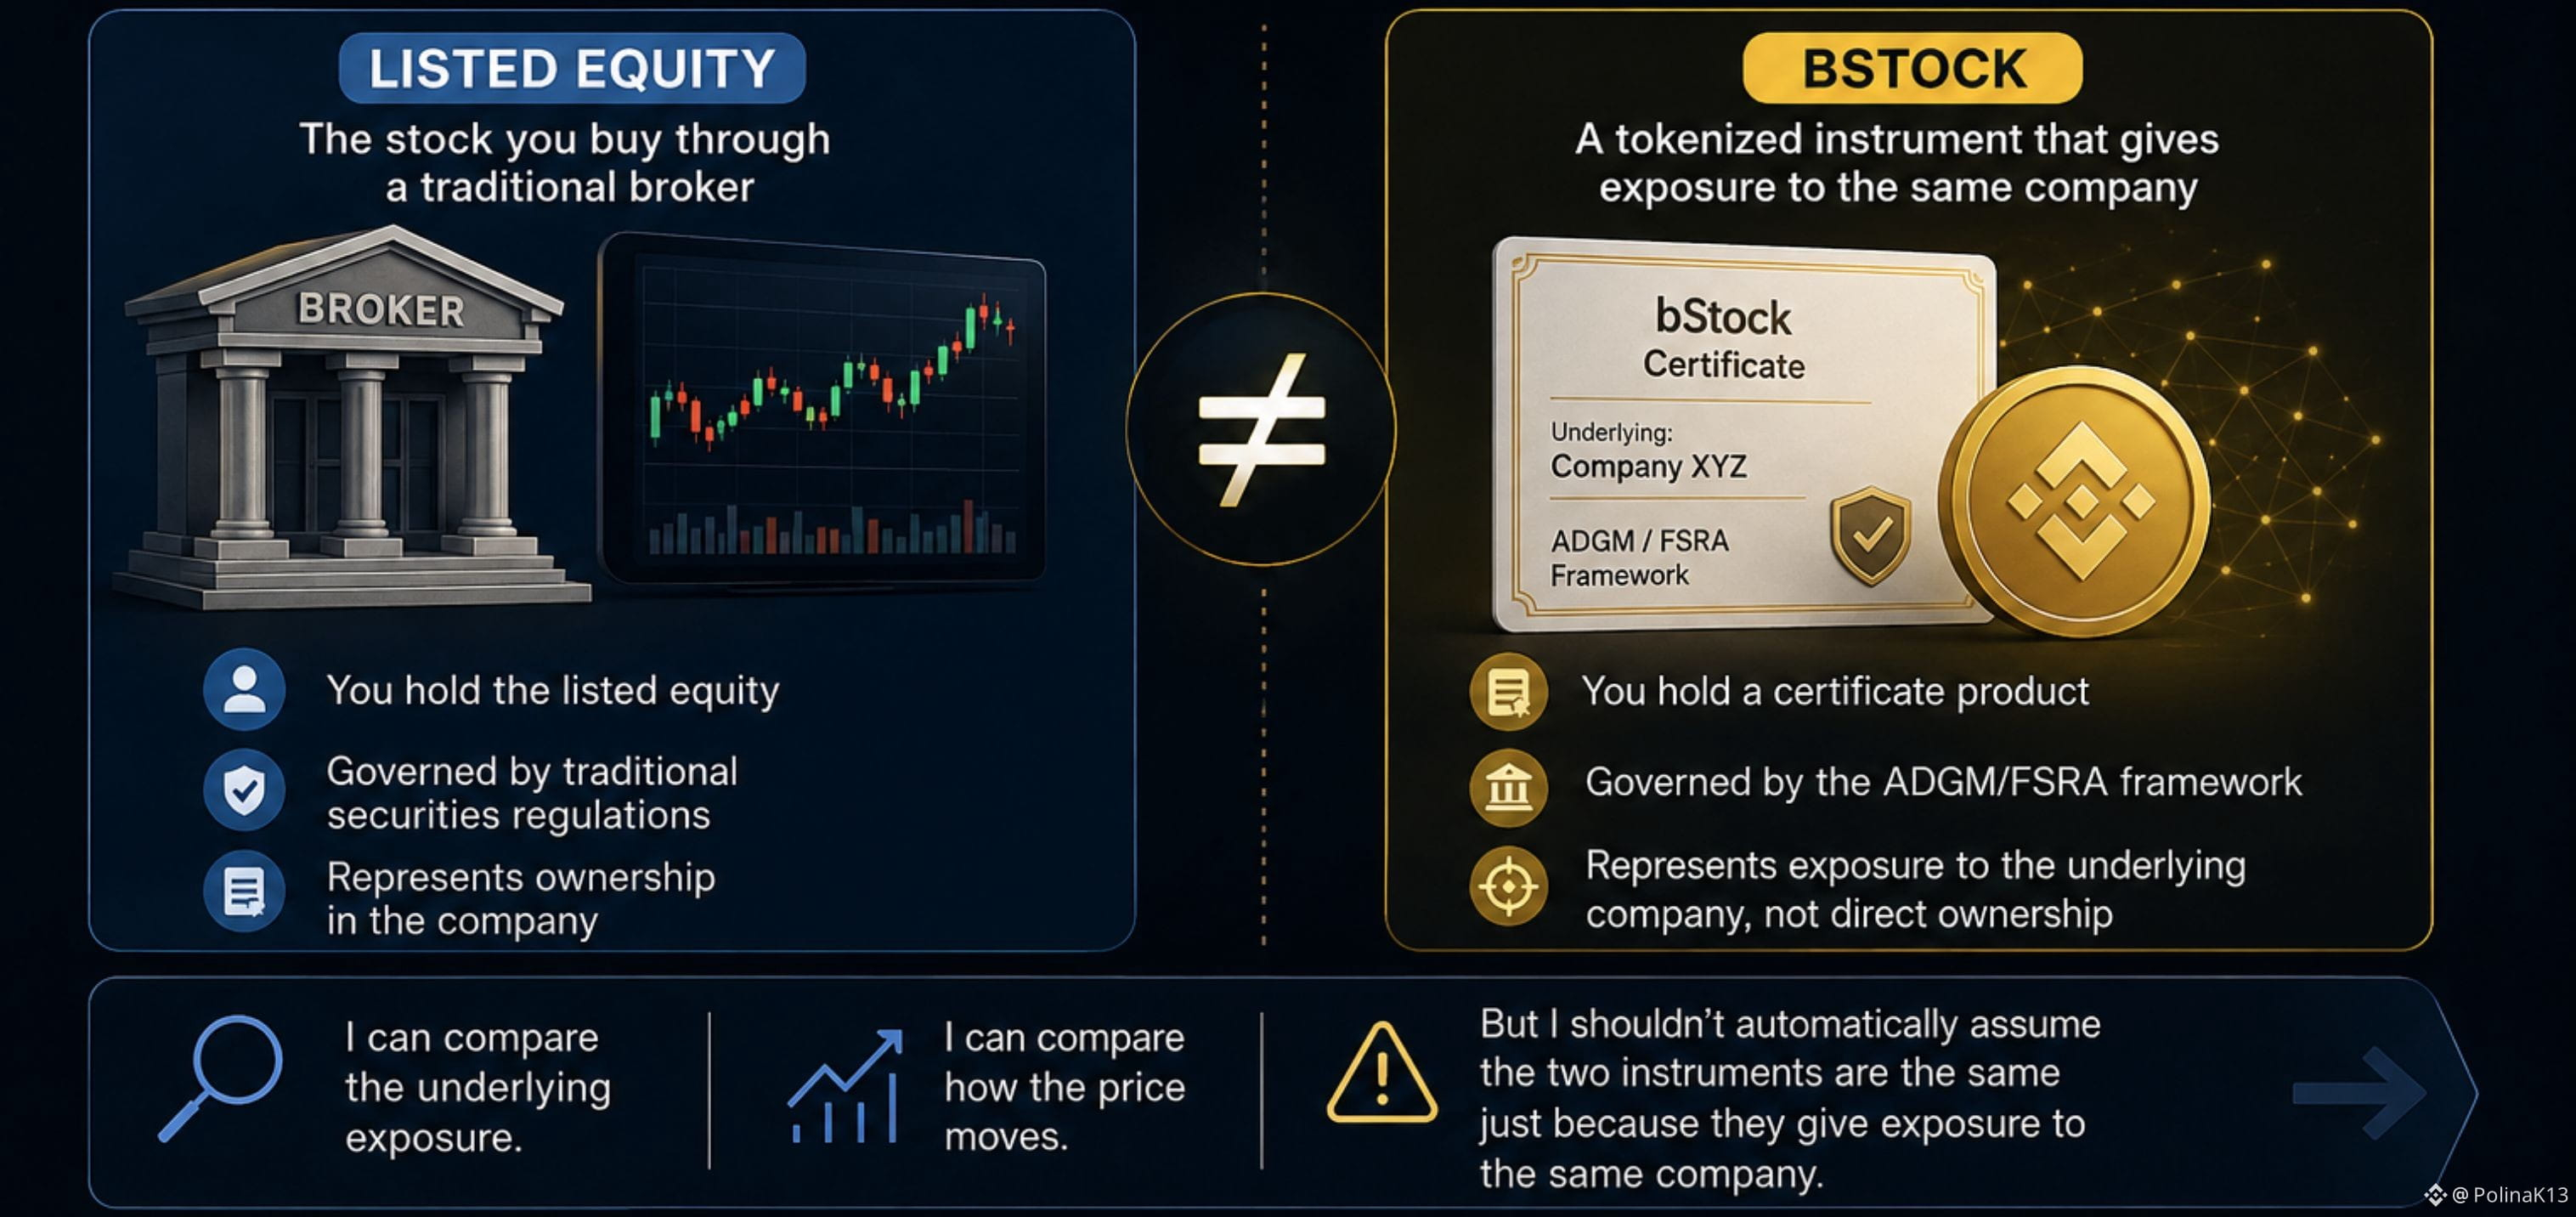
If a bStock tracks a listed stock, is it the same financial product?
When I first looked at bStocks, I naturally made a simple connection.
If a bStock gives me exposure to a listed company, I assumed the product itself should be pretty similar to the stock I would buy through a traditional broker.
But that's where I realized I was mixing two different things.
A bStock can give me exposure to the same underlying company without being the listed equity itself.
It is a certificate product under the ADGM/FSRA framework, rather than the listed equity.
And that distinction matters.
Two products can give me exposure to the same company without being the same financial product.
That made me change the question I ask when looking at a bStock.
Not only:
“Which company am I getting exposure to?”
But also:
“What kind of financial product am I actually holding?”
I can compare the underlying exposure.
I can compare how the price moves.
But I shouldn't automatically assume that the two instruments are the same just because they give me exposure to the same company.
For me, that's one of the important distinctions to understand with tokenized assets.
Same underlying company doesn't necessarily mean the same financial product.
#bstockscis @BinanceCIS
If a bStock tracks a listed stock, is it the same financial product?
When I first looked at bStocks, I naturally made a simple connection.
If a bStock gives me exposure to a listed company, I assumed the product itself should be pretty similar to the stock I would buy through a traditional broker.
But that's where I realized I was mixing two different things.
A bStock can give me exposure to the same underlying company without being the listed equity itself.
It is a certificate product under the ADGM/FSRA framework, rather than the listed equity.
And that distinction matters.
Two products can give me exposure to the same company without being the same financial product.
That made me change the question I ask when looking at a bStock.
Not only:
“Which company am I getting exposure to?”
But also:
“What kind of financial product am I actually holding?”
I can compare the underlying exposure.
I can compare how the price moves.
But I shouldn't automatically assume that the two instruments are the same just because they give me exposure to the same company.
For me, that's one of the important distinctions to understand with tokenized assets.
Same underlying company doesn't necessarily mean the same financial product.
#bstockscis @BinanceCIS
When I first looked at bStocks, I naturally made a simple connection.
If a bStock gives me exposure to a listed company, I assumed the product itself should be pretty similar to the stock I would buy through a traditional broker.
But that's where I realized I was mixing two different things.
A bStock can give me exposure to the same underlying company without being the listed equity itself.
It is a certificate product under the ADGM/FSRA framework, rather than the listed equity.
And that distinction matters.
Two products can give me exposure to the same company without being the same financial product.
That made me change the question I ask when looking at a bStock.
Not only:
“Which company am I getting exposure to?”
But also:
“What kind of financial product am I actually holding?”
I can compare the underlying exposure.
I can compare how the price moves.
But I shouldn't automatically assume that the two instruments are the same just because they give me exposure to the same company.
For me, that's one of the important distinctions to understand with tokenized assets.
Same underlying company doesn't necessarily mean the same financial product.
#bstockscis @BinanceCIS
73
·
--
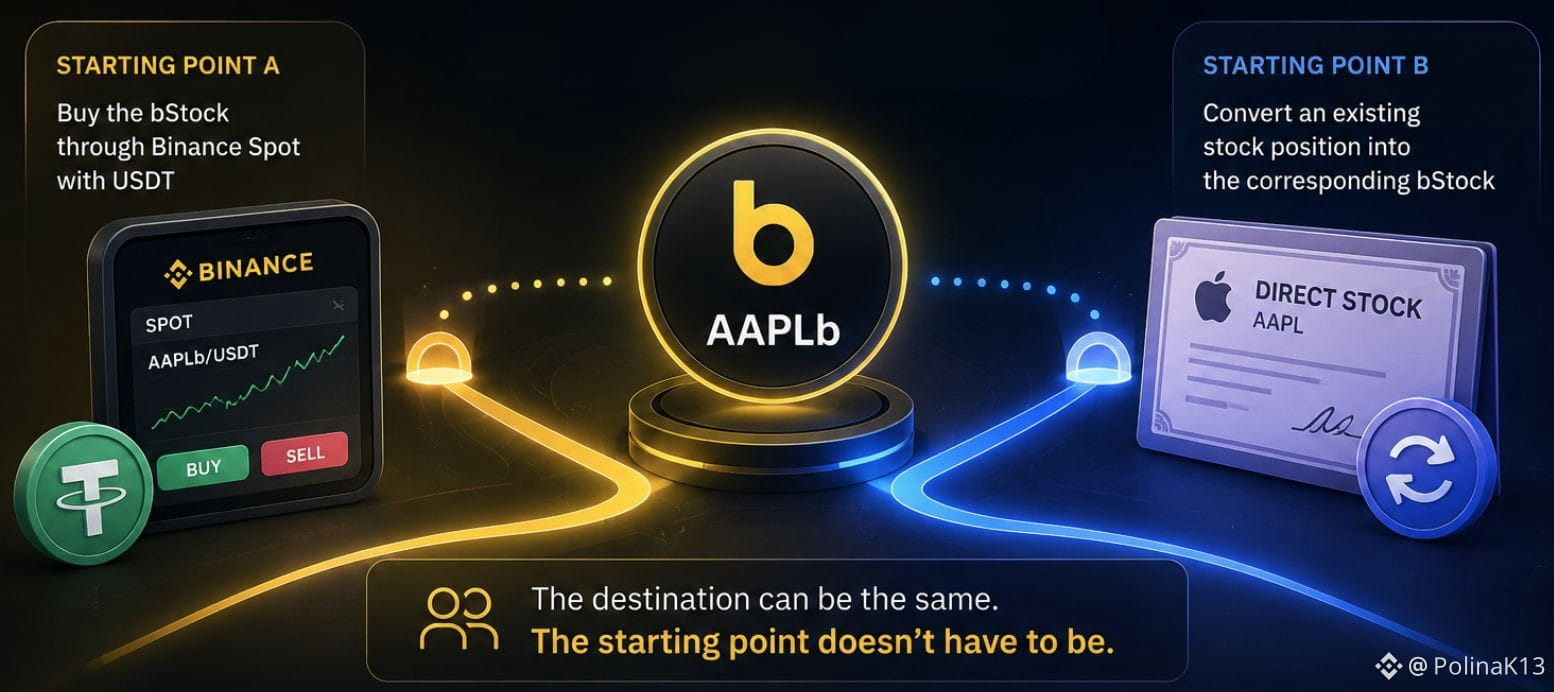
Why can the same bStock have completely different starting points?
When I first looked at bStocks, I mostly thought about the token itself.
Then I started thinking about the person holding it.
Two people can end up with the same bStock while coming from completely different places.
One might already hold USDT and buy the bStock through Binance Spot.
Someone else might already have exposure to the underlying stock and enter the same bStock through the conversion route.
Same token.
Different starting point.
And I think that's more interesting than it first sounds.
Tokenization doesn't necessarily have to be a completely new path for someone entering the market.
It can also become another format for someone who already has exposure to the underlying asset.
That's why I started looking at bStocks less as a single way to access stocks and more as a bridge between different starting points.
The question isn't only:
“How do I get this bStock?”
It's:
“Where am I starting from before I get there?”
For me, that's one of the more interesting things about tokenized assets.
The destination can be the same.
The starting point doesn't have to be.
#bstockscis @BinanceCIS
Why can the same bStock have completely different starting points?
When I first looked at bStocks, I mostly thought about the token itself.
Then I started thinking about the person holding it.
Two people can end up with the same bStock while coming from completely different places.
One might already hold USDT and buy the bStock through Binance Spot.
Someone else might already have exposure to the underlying stock and enter the same bStock through the conversion route.
Same token.
Different starting point.
And I think that's more interesting than it first sounds.
Tokenization doesn't necessarily have to be a completely new path for someone entering the market.
It can also become another format for someone who already has exposure to the underlying asset.
That's why I started looking at bStocks less as a single way to access stocks and more as a bridge between different starting points.
The question isn't only:
“How do I get this bStock?”
It's:
“Where am I starting from before I get there?”
For me, that's one of the more interesting things about tokenized assets.
The destination can be the same.
The starting point doesn't have to be.
#bstockscis @BinanceCIS
When I first looked at bStocks, I mostly thought about the token itself.
Then I started thinking about the person holding it.
Two people can end up with the same bStock while coming from completely different places.
One might already hold USDT and buy the bStock through Binance Spot.
Someone else might already have exposure to the underlying stock and enter the same bStock through the conversion route.
Same token.
Different starting point.
And I think that's more interesting than it first sounds.
Tokenization doesn't necessarily have to be a completely new path for someone entering the market.
It can also become another format for someone who already has exposure to the underlying asset.
That's why I started looking at bStocks less as a single way to access stocks and more as a bridge between different starting points.
The question isn't only:
“How do I get this bStock?”
It's:
“Where am I starting from before I get there?”
For me, that's one of the more interesting things about tokenized assets.
The destination can be the same.
The starting point doesn't have to be.
#bstockscis @BinanceCIS
3
1
95
Log in to explore more content
Join global crypto users on Binance Square
⚡️ Get latest and useful information about crypto.
💬 Trusted by the world’s largest crypto exchange.
👍 Discover real insights from verified creators.
Email / Phone number
Trending Topics
AIStocksWhatNext
41,380 views
149 Discussing
Share & Win Traffic Reward in our Trending Hashtag Campaign
✨Topic: What Other Investment Opportunities Remain as AI Stocks Keep Rising?
👉How to Join:
Publish a short post or article with hashtag #AIStocksWhatNext
Share whether you’re bullish or bearish, and post your AI stock holdings or trade — using the trade widget may improve your eligibility.
You can also strengthen your post by sharing data or charts, and avoiding AI-generated images.
✍️Create content based on the below angles:
- Nvidia says chip sales will double next year, and top AI companies keep hitting record revenue, the compute spend behind it is just as staggering. Is AI demand really taking off? And how long can it last? AI stocks are up across the board. Is this a real breakout, or just a short-term bounce?
- Industry leaders are calling to slow down AI development, while Trump plans to build an “AI Force”, claiming AI could account for 25% of U.S. GDP in the future. Whose side are you on? Will state-level backing be a long-term win for AI stocks?
- Are you buying AI stocks? Share your AI-related trade/holdings with our trade sharing widget.
⏰Campaign Period:
- 2026-09-22 7:00 - 2026-09-24 4:00 UTC
🎁Reward:
- Qualified posts that comply with the above guidelines and contain more than 100 words will be reviewed and may receive a random traffic boost of 500 to 3,000 views. You will receive a notification from your feed secretary if your post is selected.
- Get a chance to have your article featured on Binance Square Official
Need ideas for your post? Visit the topic page #AIStocksWhatNext or the Square Guide on How to Post for Better Reach.
Binance Square Official
·147 Likes
·172.2k views
MuseOvertakesChatGPTAsTopFreeIOSApp
0 views
0 Discussing
TokenizedStockPlatformsCouldLaunchNextQuarter
240 views
0 Discussing