

OGpi
1k Posts

OGpi
Report
Block User
我来做交易是为了暴富的!不是来暴负的。
Frequent Trader
6.3 Years
16 Following
62 Followers
82 Liked
Posts
All
Quotes
·
--
$ONDO
Today’s chart: ONDO is holding up pretty well. As of 18:57 Beijing time, Binance spot is up about 4.7% over the past 48 hours, but it has already pulled back from 0.4434 to around 0.41. Strong is strong, but the sell pressure overhead hasn’t been polite.
On September 16, Ondo announced that its Oasis Pro Markets has joined the DTCC Fund/SERV. Tokenized funds are taking another step forward in using traditional distribution channels. This development is worth watching—just don’t immediately assume it translates directly into收益 for ONDO holders.
I’ll watch to see whether support holds around 0.40. If it breaks and can’t be reclaimed, I’ll cool off first. Do you think this RWA move can keep running, or will it grind after the news? #RWA
$ONDO
Today’s chart: ONDO is holding up pretty well. As of 18:57 Beijing time, Binance spot is up about 4.7% over the past 48 hours, but it has already pulled back from 0.4434 to around 0.41. Strong is strong, but the sell pressure overhead hasn’t been polite.
On September 16, Ondo announced that its Oasis Pro Markets has joined the DTCC Fund/SERV. Tokenized funds are taking another step forward in using traditional distribution channels. This development is worth watching—just don’t immediately assume it translates directly into收益 for ONDO holders.
I’ll watch to see whether support holds around 0.40. If it breaks and can’t be reclaimed, I’ll cool off first. Do you think this RWA move can keep running, or will it grind after the news? #RWA
Today’s chart: ONDO is holding up pretty well. As of 18:57 Beijing time, Binance spot is up about 4.7% over the past 48 hours, but it has already pulled back from 0.4434 to around 0.41. Strong is strong, but the sell pressure overhead hasn’t been polite.
On September 16, Ondo announced that its Oasis Pro Markets has joined the DTCC Fund/SERV. Tokenized funds are taking another step forward in using traditional distribution channels. This development is worth watching—just don’t immediately assume it translates directly into收益 for ONDO holders.
I’ll watch to see whether support holds around 0.40. If it breaks and can’t be reclaimed, I’ll cool off first. Do you think this RWA move can keep running, or will it grind after the news? #RWA

1
134
·
--
$BTC $ETH
Don’t just focus on the coin price—what can truly change capital preference is that on-chain assets have started to “move”⚡
The latest breakdown from Binance Research on September 18 is quite interesting: as of September 15, the managed size of RWA was about $34.18 billion, up 85.2% year-to-date. But more importantly, the overall capital activation rate is only around 12%—meaning that while investors have bought on-chain assets, most of them haven’t yet entered liquidity, lending, or collateral use cases.
The activation rate for equity-like assets, however, rose from 1.95% to 7.54%, suggesting the market is starting to shift from “how much is issued” to “can it be used repeatedly.”
What this implies for mainstream coins is: today in Binance spot, $BTC is around 80510, 24H -1.01%; and $ETH is around 2581, 24H -2.27%. A pullback doesn’t necessarily mean the narrative is broken, but capital will be more selective—assets without real usage get cut when sentiment fades. Only assets that can move into liquidity and collateral paths have a better chance to weather volatility.
In the next 15 days, I’ll look for two confirmations: whether RWA’s CAR can keep climbing, and whether BTC can hold around the 80,000 level. If it can’t stand firm, don’t force short-term price weakness with a long-term narrative—wait for trading activity and mainstream coins to stabilize again, then observe in batches. Do you think RWA’s next step is to compete on issuance scale, or on capital turnover?
#BTC #ETH #RWA
$BTC $ETH
Don’t just focus on the coin price—what can truly change capital preference is that on-chain assets have started to “move”⚡
The latest breakdown from Binance Research on September 18 is quite interesting: as of September 15, the managed size of RWA was about $34.18 billion, up 85.2% year-to-date. But more importantly, the overall capital activation rate is only around 12%—meaning that while investors have bought on-chain assets, most of them haven’t yet entered liquidity, lending, or collateral use cases.
The activation rate for equity-like assets, however, rose from 1.95% to 7.54%, suggesting the market is starting to shift from “how much is issued” to “can it be used repeatedly.”
What this implies for mainstream coins is: today in Binance spot, $BTC is around 80510, 24H -1.01%; and $ETH is around 2581, 24H -2.27%. A pullback doesn’t necessarily mean the narrative is broken, but capital will be more selective—assets without real usage get cut when sentiment fades. Only assets that can move into liquidity and collateral paths have a better chance to weather volatility.
In the next 15 days, I’ll look for two confirmations: whether RWA’s CAR can keep climbing, and whether BTC can hold around the 80,000 level. If it can’t stand firm, don’t force short-term price weakness with a long-term narrative—wait for trading activity and mainstream coins to stabilize again, then observe in batches. Do you think RWA’s next step is to compete on issuance scale, or on capital turnover?
#BTC #ETH #RWA
Don’t just focus on the coin price—what can truly change capital preference is that on-chain assets have started to “move”⚡
The latest breakdown from Binance Research on September 18 is quite interesting: as of September 15, the managed size of RWA was about $34.18 billion, up 85.2% year-to-date. But more importantly, the overall capital activation rate is only around 12%—meaning that while investors have bought on-chain assets, most of them haven’t yet entered liquidity, lending, or collateral use cases.
The activation rate for equity-like assets, however, rose from 1.95% to 7.54%, suggesting the market is starting to shift from “how much is issued” to “can it be used repeatedly.”
What this implies for mainstream coins is: today in Binance spot, $BTC is around 80510, 24H -1.01%; and $ETH is around 2581, 24H -2.27%. A pullback doesn’t necessarily mean the narrative is broken, but capital will be more selective—assets without real usage get cut when sentiment fades. Only assets that can move into liquidity and collateral paths have a better chance to weather volatility.
In the next 15 days, I’ll look for two confirmations: whether RWA’s CAR can keep climbing, and whether BTC can hold around the 80,000 level. If it can’t stand firm, don’t force short-term price weakness with a long-term narrative—wait for trading activity and mainstream coins to stabilize again, then observe in batches. Do you think RWA’s next step is to compete on issuance scale, or on capital turnover?
#BTC #ETH #RWA

218
·
--
$LSK $MARSCOIN
$LSK: This dip is pretty harsh—don’t rush to label it as an “unexpected negative catalyst.” In this round, I haven’t verified any new official bad daily news. It feels more like the market is repricing the migration narrative: LSK is currently 0.381, down 13.59% in 24h, with trading volume around 14.0152M USDT. During the day it has already moved close to the 0.3763 low, and short-term sentiment is clearly weak. What can be confirmed officially is that the Lisk Chain will be closed on 2026-10-31. After that, LSK will mainly remain on Ethereum as a Lisk loyalty token, and the burning of 100M LSK is also underway. What matters for this coin now isn’t the old-chain story, but whether the new product, reward, and fee scenarios can truly start running. On the chart, the 0.3848 support level has been tested repeatedly. If it fails to reclaim it, it’s likely to continue grinding lower in the low range. For a repair, at least price needs to push back toward the 0.4799 resistance area first, before it looks like capital is willing to pick up this line again. ⚠️
$MARSCOIN: MARSCOIN isn’t lacking volume today—it’s that after the sell-off with heavy volume, it’s now starting to test whether bids can absorb. Current price is 0.0982, down 6.12% in 24h, with trading volume around 16.3604M USDT. The intraday high is 0.1072 and the low is 0.0923, suggesting that the hot-money chasing earlier has cooled down. The project itself is a very strong narrative-style old PoW coin. Its official site has consistently focused on permanent settlement on Mars, independent finance, on-chain governance, wallets, mining, and the Martian Republic. The token is more like a symbol of community and future governance infrastructure. For the short term, I don’t yet see any clearly confirmed new positive schedule from the team. What we can look for is whether merged mining continues, whether the network stability after the v28 upgrade holds up, and whether community applications and governance tools keep progressing. On the chart, 0.0954 is the consolidation/support level I’ll be watching. If it holds, it can be tested repeatedly. If it breaks, it means sentiment has retreated even further. Until price reclaims 0.1151, any rebound should be treated only as a repair attempt.
#LSK #MARSCOIN #现货跌幅榜 #chain migration
$LSK $MARSCOIN
$LSK : This dip is pretty harsh—don’t rush to label it as an “unexpected negative catalyst.” In this round, I haven’t verified any new official bad daily news. It feels more like the market is repricing the migration narrative: LSK is currently 0.381, down 13.59% in 24h, with trading volume around 14.0152M USDT. During the day it has already moved close to the 0.3763 low, and short-term sentiment is clearly weak. What can be confirmed officially is that the Lisk Chain will be closed on 2026-10-31. After that, LSK will mainly remain on Ethereum as a Lisk loyalty token, and the burning of 100M LSK is also underway. What matters for this coin now isn’t the old-chain story, but whether the new product, reward, and fee scenarios can truly start running. On the chart, the 0.3848 support level has been tested repeatedly. If it fails to reclaim it, it’s likely to continue grinding lower in the low range. For a repair, at least price needs to push back toward the 0.4799 resistance area first, before it looks like capital is willing to pick up this line again. ⚠️
$MARSCOIN : MARSCOIN isn’t lacking volume today—it’s that after the sell-off with heavy volume, it’s now starting to test whether bids can absorb. Current price is 0.0982, down 6.12% in 24h, with trading volume around 16.3604M USDT. The intraday high is 0.1072 and the low is 0.0923, suggesting that the hot-money chasing earlier has cooled down. The project itself is a very strong narrative-style old PoW coin. Its official site has consistently focused on permanent settlement on Mars, independent finance, on-chain governance, wallets, mining, and the Martian Republic. The token is more like a symbol of community and future governance infrastructure. For the short term, I don’t yet see any clearly confirmed new positive schedule from the team. What we can look for is whether merged mining continues, whether the network stability after the v28 upgrade holds up, and whether community applications and governance tools keep progressing. On the chart, 0.0954 is the consolidation/support level I’ll be watching. If it holds, it can be tested repeatedly. If it breaks, it means sentiment has retreated even further. Until price reclaims 0.1151, any rebound should be treated only as a repair attempt.
#LSK #MARSCOIN #现货跌幅榜 #chain migration
$LSK : This dip is pretty harsh—don’t rush to label it as an “unexpected negative catalyst.” In this round, I haven’t verified any new official bad daily news. It feels more like the market is repricing the migration narrative: LSK is currently 0.381, down 13.59% in 24h, with trading volume around 14.0152M USDT. During the day it has already moved close to the 0.3763 low, and short-term sentiment is clearly weak. What can be confirmed officially is that the Lisk Chain will be closed on 2026-10-31. After that, LSK will mainly remain on Ethereum as a Lisk loyalty token, and the burning of 100M LSK is also underway. What matters for this coin now isn’t the old-chain story, but whether the new product, reward, and fee scenarios can truly start running. On the chart, the 0.3848 support level has been tested repeatedly. If it fails to reclaim it, it’s likely to continue grinding lower in the low range. For a repair, at least price needs to push back toward the 0.4799 resistance area first, before it looks like capital is willing to pick up this line again. ⚠️
$MARSCOIN : MARSCOIN isn’t lacking volume today—it’s that after the sell-off with heavy volume, it’s now starting to test whether bids can absorb. Current price is 0.0982, down 6.12% in 24h, with trading volume around 16.3604M USDT. The intraday high is 0.1072 and the low is 0.0923, suggesting that the hot-money chasing earlier has cooled down. The project itself is a very strong narrative-style old PoW coin. Its official site has consistently focused on permanent settlement on Mars, independent finance, on-chain governance, wallets, mining, and the Martian Republic. The token is more like a symbol of community and future governance infrastructure. For the short term, I don’t yet see any clearly confirmed new positive schedule from the team. What we can look for is whether merged mining continues, whether the network stability after the v28 upgrade holds up, and whether community applications and governance tools keep progressing. On the chart, 0.0954 is the consolidation/support level I’ll be watching. If it holds, it can be tested repeatedly. If it breaks, it means sentiment has retreated even further. Until price reclaims 0.1151, any rebound should be treated only as a repair attempt.
#LSK #MARSCOIN #现货跌幅榜 #chain migration
3
924
·
--
$G $EVAA
$G: This momentum is really too eye-catching. In the last 24 hours it climbed to 91.19%, with trading volume of about 488 million USDT. During the day, it moved from 0.007561 up to 0.015134. Short-term capital is clearly chasing strong volatility. Right now it’s not a quiet, slow push anymore; it’s more like emotions and volume are squeezing in together. Whether it can hold the support near 0.014 is crucial—if it falls back, it could easily turn into a “buy quickly, sell quickly” type of realization/exit.
$EVAA: It’s not that explosive, but a 26.50% surge paired with about 30.9 million USDT in trading volume also shows that capital is starting to shine a light on small-cap, high-beta names. 0.7722 is today’s high. If the price can stay steady above 0.7, there’s still room for the momentum to continue. If volume can’t keep up and it surges, the pullback after the spike will be fairly harsh—don’t treat it like a low-volatility product.
#Binance #合约交易 #热门合约 #risk control
$G $EVAA
$G : This momentum is really too eye-catching. In the last 24 hours it climbed to 91.19%, with trading volume of about 488 million USDT. During the day, it moved from 0.007561 up to 0.015134. Short-term capital is clearly chasing strong volatility. Right now it’s not a quiet, slow push anymore; it’s more like emotions and volume are squeezing in together. Whether it can hold the support near 0.014 is crucial—if it falls back, it could easily turn into a “buy quickly, sell quickly” type of realization/exit.
$EVAA : It’s not that explosive, but a 26.50% surge paired with about 30.9 million USDT in trading volume also shows that capital is starting to shine a light on small-cap, high-beta names. 0.7722 is today’s high. If the price can stay steady above 0.7, there’s still room for the momentum to continue. If volume can’t keep up and it surges, the pullback after the spike will be fairly harsh—don’t treat it like a low-volatility product.
#Binance #合约交易 #热门合约 #risk control
$G : This momentum is really too eye-catching. In the last 24 hours it climbed to 91.19%, with trading volume of about 488 million USDT. During the day, it moved from 0.007561 up to 0.015134. Short-term capital is clearly chasing strong volatility. Right now it’s not a quiet, slow push anymore; it’s more like emotions and volume are squeezing in together. Whether it can hold the support near 0.014 is crucial—if it falls back, it could easily turn into a “buy quickly, sell quickly” type of realization/exit.
$EVAA : It’s not that explosive, but a 26.50% surge paired with about 30.9 million USDT in trading volume also shows that capital is starting to shine a light on small-cap, high-beta names. 0.7722 is today’s high. If the price can stay steady above 0.7, there’s still room for the momentum to continue. If volume can’t keep up and it surges, the pullback after the spike will be fairly harsh—don’t treat it like a low-volatility product.
#Binance #合约交易 #热门合约 #risk control
256
·
--
$BTC $ETH $ONE
After the rate hike, this market hasn’t simply folded over immediately—which actually suggests that funds are still watching risk assets for their resilience. But don’t get too carried away with the rebound; macro interest rates and regulatory disappointment are still pressing down overhead, and people chasing price will be especially sensitive.
Right now, the market is focused on two things: first, whether Bitcoin can continue to hold around 80,000; second, whether Ethereum can stop the pullback. As long as neither of these breaks down, altcoins will still have room to rotate.
ONE is already leading in terms of gains on Binance spot, so sentiment is there. But the biggest risk with this kind of sudden surge is that when volume fades, it can quickly give the gains back. For the short term, I only look at follow-through/support—no slogans.
#BTC #ETH #ONE #行情分析 #加密市场
$BTC $ETH $ONE
After the rate hike, this market hasn’t simply folded over immediately—which actually suggests that funds are still watching risk assets for their resilience. But don’t get too carried away with the rebound; macro interest rates and regulatory disappointment are still pressing down overhead, and people chasing price will be especially sensitive.
Right now, the market is focused on two things: first, whether Bitcoin can continue to hold around 80,000; second, whether Ethereum can stop the pullback. As long as neither of these breaks down, altcoins will still have room to rotate.
ONE is already leading in terms of gains on Binance spot, so sentiment is there. But the biggest risk with this kind of sudden surge is that when volume fades, it can quickly give the gains back. For the short term, I only look at follow-through/support—no slogans.
#BTC #ETH #ONE #行情分析 #加密市场
After the rate hike, this market hasn’t simply folded over immediately—which actually suggests that funds are still watching risk assets for their resilience. But don’t get too carried away with the rebound; macro interest rates and regulatory disappointment are still pressing down overhead, and people chasing price will be especially sensitive.
Right now, the market is focused on two things: first, whether Bitcoin can continue to hold around 80,000; second, whether Ethereum can stop the pullback. As long as neither of these breaks down, altcoins will still have room to rotate.
ONE is already leading in terms of gains on Binance spot, so sentiment is there. But the biggest risk with this kind of sudden surge is that when volume fades, it can quickly give the gains back. For the short term, I only look at follow-through/support—no slogans.
#BTC #ETH #ONE #行情分析 #加密市场
1
441
·
--
$CELR $ENA $INJ
$CELR: Celer isn’t just about the two words “cross-chain.” At its core, it’s about cross-chain messaging and liquidity connectivity. Things like cBridge, cross-chain application calls, and the State Guardian Network ultimately all come down to whether real multi-chain demand and a solid safety reputation can hold up. This round on the chart is very intense. The current price is 0.004802; in the past 24 hours it’s up 107.79%, and over the last 6 hours it’s also surged 61.90%. Trading volume is about 75.46 million USDT, and the 6-hour OI has increased 75.45%. Don’t get carried away chasing strength. Around 0.004859 is the near-term resistance; only if it can absorb volume and break through does it count as truly continuing. If it drops back below 0.002808, then for the short term don’t force the narrative of strength.
$ENA: Ethena is building an ecosystem of synthetic dollars and yield-bearing stablecoins like USDe. ENA is more of a tool for protocol governance and ecosystem incentives. The outlook depends on whether the collateral, hedging costs, the funding rate environment, and USDe usage can keep lining up. After refresh, ENA is at 0.20269, with the 24-hour gain narrowing to 15.37%. 24-hour trading volume is about 619 million USDT—volume is still there, but after being pushed down from the 0.22222 high, chasing seems clearly less comfortable. 0.19808 is the level I’d watch for support. If it holds, it looks like a strong consolidation; if it breaks, treat this burst of momentum as cooling off first.
$INJ: Injective follows the on-chain finance and derivatives application chain logic. What the project wants to capture is demand from trading, DeFi, and institutionalized on-chain finance. The real support still depends on ecosystem trading volume and application retention. INJ’s current price is 8.039; it’s up 17.24% in the past 24 hours, up 4.50% over the last 6 hours, with trading volume of about 200 million USDT. It isn’t as “explosive” as CELR, but the pace is a bit steadier. 8.355 is the prior high resistance; 7.677 is short-term support. If it can hold, there’s still money willing to step in—if it breaks, it means the financial-chain narrative needs to cool down first.
#山寨异动 #链上金融 #cross-chain ecosystem
$CELR $ENA $INJ
$CELR : Celer isn’t just about the two words “cross-chain.” At its core, it’s about cross-chain messaging and liquidity connectivity. Things like cBridge, cross-chain application calls, and the State Guardian Network ultimately all come down to whether real multi-chain demand and a solid safety reputation can hold up. This round on the chart is very intense. The current price is 0.004802; in the past 24 hours it’s up 107.79%, and over the last 6 hours it’s also surged 61.90%. Trading volume is about 75.46 million USDT, and the 6-hour OI has increased 75.45%. Don’t get carried away chasing strength. Around 0.004859 is the near-term resistance; only if it can absorb volume and break through does it count as truly continuing. If it drops back below 0.002808, then for the short term don’t force the narrative of strength.
$ENA : Ethena is building an ecosystem of synthetic dollars and yield-bearing stablecoins like USDe. ENA is more of a tool for protocol governance and ecosystem incentives. The outlook depends on whether the collateral, hedging costs, the funding rate environment, and USDe usage can keep lining up. After refresh, ENA is at 0.20269, with the 24-hour gain narrowing to 15.37%. 24-hour trading volume is about 619 million USDT—volume is still there, but after being pushed down from the 0.22222 high, chasing seems clearly less comfortable. 0.19808 is the level I’d watch for support. If it holds, it looks like a strong consolidation; if it breaks, treat this burst of momentum as cooling off first.
$INJ : Injective follows the on-chain finance and derivatives application chain logic. What the project wants to capture is demand from trading, DeFi, and institutionalized on-chain finance. The real support still depends on ecosystem trading volume and application retention. INJ’s current price is 8.039; it’s up 17.24% in the past 24 hours, up 4.50% over the last 6 hours, with trading volume of about 200 million USDT. It isn’t as “explosive” as CELR, but the pace is a bit steadier. 8.355 is the prior high resistance; 7.677 is short-term support. If it can hold, there’s still money willing to step in—if it breaks, it means the financial-chain narrative needs to cool down first.
#山寨异动 #链上金融 #cross-chain ecosystem
$CELR : Celer isn’t just about the two words “cross-chain.” At its core, it’s about cross-chain messaging and liquidity connectivity. Things like cBridge, cross-chain application calls, and the State Guardian Network ultimately all come down to whether real multi-chain demand and a solid safety reputation can hold up. This round on the chart is very intense. The current price is 0.004802; in the past 24 hours it’s up 107.79%, and over the last 6 hours it’s also surged 61.90%. Trading volume is about 75.46 million USDT, and the 6-hour OI has increased 75.45%. Don’t get carried away chasing strength. Around 0.004859 is the near-term resistance; only if it can absorb volume and break through does it count as truly continuing. If it drops back below 0.002808, then for the short term don’t force the narrative of strength.
$ENA : Ethena is building an ecosystem of synthetic dollars and yield-bearing stablecoins like USDe. ENA is more of a tool for protocol governance and ecosystem incentives. The outlook depends on whether the collateral, hedging costs, the funding rate environment, and USDe usage can keep lining up. After refresh, ENA is at 0.20269, with the 24-hour gain narrowing to 15.37%. 24-hour trading volume is about 619 million USDT—volume is still there, but after being pushed down from the 0.22222 high, chasing seems clearly less comfortable. 0.19808 is the level I’d watch for support. If it holds, it looks like a strong consolidation; if it breaks, treat this burst of momentum as cooling off first.
$INJ : Injective follows the on-chain finance and derivatives application chain logic. What the project wants to capture is demand from trading, DeFi, and institutionalized on-chain finance. The real support still depends on ecosystem trading volume and application retention. INJ’s current price is 8.039; it’s up 17.24% in the past 24 hours, up 4.50% over the last 6 hours, with trading volume of about 200 million USDT. It isn’t as “explosive” as CELR, but the pace is a bit steadier. 8.355 is the prior high resistance; 7.677 is short-term support. If it can hold, there’s still money willing to step in—if it breaks, it means the financial-chain narrative needs to cool down first.
#山寨异动 #链上金融 #cross-chain ecosystem

364
·
--
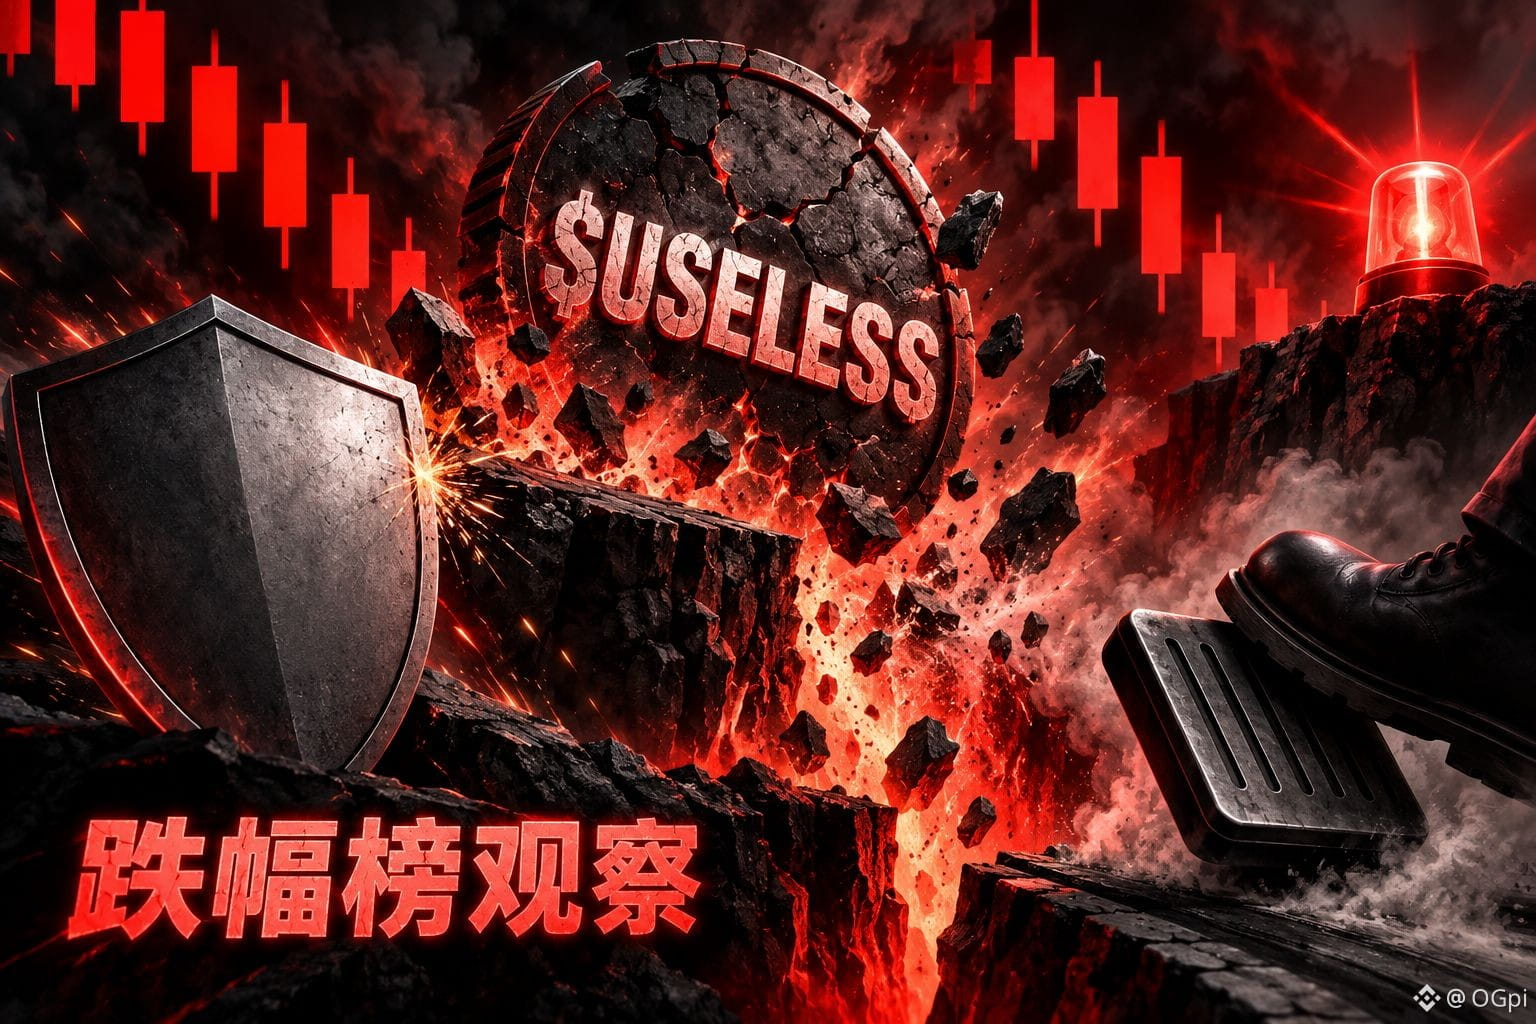
$BTW $USELESS
$BTW: 0.64333 failed to hold in that zone; the price returned to 0.5917, down 7.864% over 24 hours. The low reached 0.5608, and even the rebound couldn’t reclaim the prior high area. The trading volume of about 35.57 million USDT isn’t exactly quiet, suggesting that sell-side liquidity was released in a rather straightforward way—more like capital withdrawing and technical conditions weakening among high-volatility new listings. There isn’t enough evidence pointing to any single specific piece of news. Bitway’s positioning is an internet-capital gateway that connects on-chain liquidity with global opportunities; $BTW plays a role in ecosystem participation and value connectivity.⚠️ At present, there is no clearly confirmable bullish catalyst. Going forward, the focus should be on whether the official side publishes product progress that can be implemented on the ground, asset onboarding, or partnerships—and whether an effective bid wall/hold can form around 0.5608.
$USELESS: It fell 14.094% in a single day. Selling pressure above 0.30925 kept pushing the price down to 0.25807, not far from the intraday low of 0.25003. The trading volume of about 69.79 million USDT fell sharply as well, indicating that when sentiment cooled, holders cashed out quickly. It is a pure Meme token on Solana; its core is to satirize the functional narrative of traditional projects by using “no use” as the premise. Price action is driven mostly by community hype, liquidity, and Meme rotation.🚨 The official roadmap itself has a teasing/satirical tone; currently there’s no clearly confirmable bullish catalyst. If you want to assess whether a repair is underway, you can only watch community activity, whether trading depth is recovering, and whether the price can climb back above the 0.28 area. Don’t treat slogans as fulfillment of fundamentals.
#合约跌幅榜 #市场分析 #Meme币 #风险管理
$BTW $USELESS
$BTW : 0.64333 failed to hold in that zone; the price returned to 0.5917, down 7.864% over 24 hours. The low reached 0.5608, and even the rebound couldn’t reclaim the prior high area. The trading volume of about 35.57 million USDT isn’t exactly quiet, suggesting that sell-side liquidity was released in a rather straightforward way—more like capital withdrawing and technical conditions weakening among high-volatility new listings. There isn’t enough evidence pointing to any single specific piece of news. Bitway’s positioning is an internet-capital gateway that connects on-chain liquidity with global opportunities; $BTW plays a role in ecosystem participation and value connectivity.⚠️ At present, there is no clearly confirmable bullish catalyst. Going forward, the focus should be on whether the official side publishes product progress that can be implemented on the ground, asset onboarding, or partnerships—and whether an effective bid wall/hold can form around 0.5608.
$USELESS : It fell 14.094% in a single day. Selling pressure above 0.30925 kept pushing the price down to 0.25807, not far from the intraday low of 0.25003. The trading volume of about 69.79 million USDT fell sharply as well, indicating that when sentiment cooled, holders cashed out quickly. It is a pure Meme token on Solana; its core is to satirize the functional narrative of traditional projects by using “no use” as the premise. Price action is driven mostly by community hype, liquidity, and Meme rotation.🚨 The official roadmap itself has a teasing/satirical tone; currently there’s no clearly confirmable bullish catalyst. If you want to assess whether a repair is underway, you can only watch community activity, whether trading depth is recovering, and whether the price can climb back above the 0.28 area. Don’t treat slogans as fulfillment of fundamentals.
#合约跌幅榜 #市场分析 #Meme币 #风险管理
$BTW : 0.64333 failed to hold in that zone; the price returned to 0.5917, down 7.864% over 24 hours. The low reached 0.5608, and even the rebound couldn’t reclaim the prior high area. The trading volume of about 35.57 million USDT isn’t exactly quiet, suggesting that sell-side liquidity was released in a rather straightforward way—more like capital withdrawing and technical conditions weakening among high-volatility new listings. There isn’t enough evidence pointing to any single specific piece of news. Bitway’s positioning is an internet-capital gateway that connects on-chain liquidity with global opportunities; $BTW plays a role in ecosystem participation and value connectivity.⚠️ At present, there is no clearly confirmable bullish catalyst. Going forward, the focus should be on whether the official side publishes product progress that can be implemented on the ground, asset onboarding, or partnerships—and whether an effective bid wall/hold can form around 0.5608.
$USELESS : It fell 14.094% in a single day. Selling pressure above 0.30925 kept pushing the price down to 0.25807, not far from the intraday low of 0.25003. The trading volume of about 69.79 million USDT fell sharply as well, indicating that when sentiment cooled, holders cashed out quickly. It is a pure Meme token on Solana; its core is to satirize the functional narrative of traditional projects by using “no use” as the premise. Price action is driven mostly by community hype, liquidity, and Meme rotation.🚨 The official roadmap itself has a teasing/satirical tone; currently there’s no clearly confirmable bullish catalyst. If you want to assess whether a repair is underway, you can only watch community activity, whether trading depth is recovering, and whether the price can climb back above the 0.28 area. Don’t treat slogans as fulfillment of fundamentals.
#合约跌幅榜 #市场分析 #Meme币 #风险管理
338
·
--
$BTC $ETH
The “money shot” is pretty straightforward: BTC is already above 81,000, and once institutional funds turn back, the market starts to give off a bit of a “short-squeeze” vibe. 🔥
I just checked the Binance spot snapshot: BTC is around 81,339, up 0.486% over 24H; intraday high 81,951, low 80,844, with trading volume of about 863 million USDT. ETH is around 2,633, up 0.799% over 24H, with trading volume of about 487 million USDT. Prices haven’t gone haywire, but major coins are clearly still fighting in the high-level accumulation zone.
Public reports also mentioned that the BTC spot ETF recorded roughly $160 million in net inflows on September 17. The earlier outflows are just being reversed, and this kind of rhythm is the easiest way to wear down the shorts until they start doubting everything.
For the next 15 days, I’m watching just two lines: whether BTC can continue holding the 80,800–81,000 range, and whether ETH can reclaim 2,668 as the intraday high. If the capital flow keeps turning positive, pullbacks are actually where you observe the spots to scale in. But if the ETF starts seeing consecutive outflows again, don’t let one green candle blow your mind.
Do you think this move is institutions reopening positions, or just a short-term rebound? Drop your levels in the comments.#BTC #ETH #ETF
$BTC $ETH
The “money shot” is pretty straightforward: BTC is already above 81,000, and once institutional funds turn back, the market starts to give off a bit of a “short-squeeze” vibe. 🔥
I just checked the Binance spot snapshot: BTC is around 81,339, up 0.486% over 24H; intraday high 81,951, low 80,844, with trading volume of about 863 million USDT. ETH is around 2,633, up 0.799% over 24H, with trading volume of about 487 million USDT. Prices haven’t gone haywire, but major coins are clearly still fighting in the high-level accumulation zone.
Public reports also mentioned that the BTC spot ETF recorded roughly $160 million in net inflows on September 17. The earlier outflows are just being reversed, and this kind of rhythm is the easiest way to wear down the shorts until they start doubting everything.
For the next 15 days, I’m watching just two lines: whether BTC can continue holding the 80,800–81,000 range, and whether ETH can reclaim 2,668 as the intraday high. If the capital flow keeps turning positive, pullbacks are actually where you observe the spots to scale in. But if the ETF starts seeing consecutive outflows again, don’t let one green candle blow your mind.
Do you think this move is institutions reopening positions, or just a short-term rebound? Drop your levels in the comments.#BTC #ETH #ETF
The “money shot” is pretty straightforward: BTC is already above 81,000, and once institutional funds turn back, the market starts to give off a bit of a “short-squeeze” vibe. 🔥
I just checked the Binance spot snapshot: BTC is around 81,339, up 0.486% over 24H; intraday high 81,951, low 80,844, with trading volume of about 863 million USDT. ETH is around 2,633, up 0.799% over 24H, with trading volume of about 487 million USDT. Prices haven’t gone haywire, but major coins are clearly still fighting in the high-level accumulation zone.
Public reports also mentioned that the BTC spot ETF recorded roughly $160 million in net inflows on September 17. The earlier outflows are just being reversed, and this kind of rhythm is the easiest way to wear down the shorts until they start doubting everything.
For the next 15 days, I’m watching just two lines: whether BTC can continue holding the 80,800–81,000 range, and whether ETH can reclaim 2,668 as the intraday high. If the capital flow keeps turning positive, pullbacks are actually where you observe the spots to scale in. But if the ETF starts seeing consecutive outflows again, don’t let one green candle blow your mind.
Do you think this move is institutions reopening positions, or just a short-term rebound? Drop your levels in the comments.#BTC #ETH #ETF

18
·
--
$TAO
$TAO This move feels a bit like an AI line getting reignited—it's moving up without dragging, and the money is also willing to chase strength.
But I won’t treat it as a standalone frenzy. It’s more like, after the broader market warms up, investors start looking again for stocks with “a narrative and room to move.” TAO just happens to sit right at the AI spot.
For the short term, it comes down to whether support at the recent high-level turnover can hold. If it can absorb it, the momentum will keep rolling; if it can’t, a fast breakout will also wash people out.
$TAO
$TAO This move feels a bit like an AI line getting reignited—it's moving up without dragging, and the money is also willing to chase strength.
But I won’t treat it as a standalone frenzy. It’s more like, after the broader market warms up, investors start looking again for stocks with “a narrative and room to move.” TAO just happens to sit right at the AI spot.
For the short term, it comes down to whether support at the recent high-level turnover can hold. If it can absorb it, the momentum will keep rolling; if it can’t, a fast breakout will also wash people out.
$TAO This move feels a bit like an AI line getting reignited—it's moving up without dragging, and the money is also willing to chase strength.
But I won’t treat it as a standalone frenzy. It’s more like, after the broader market warms up, investors start looking again for stocks with “a narrative and room to move.” TAO just happens to sit right at the AI spot.
For the short term, it comes down to whether support at the recent high-level turnover can hold. If it can absorb it, the momentum will keep rolling; if it can’t, a fast breakout will also wash people out.

121
·
--
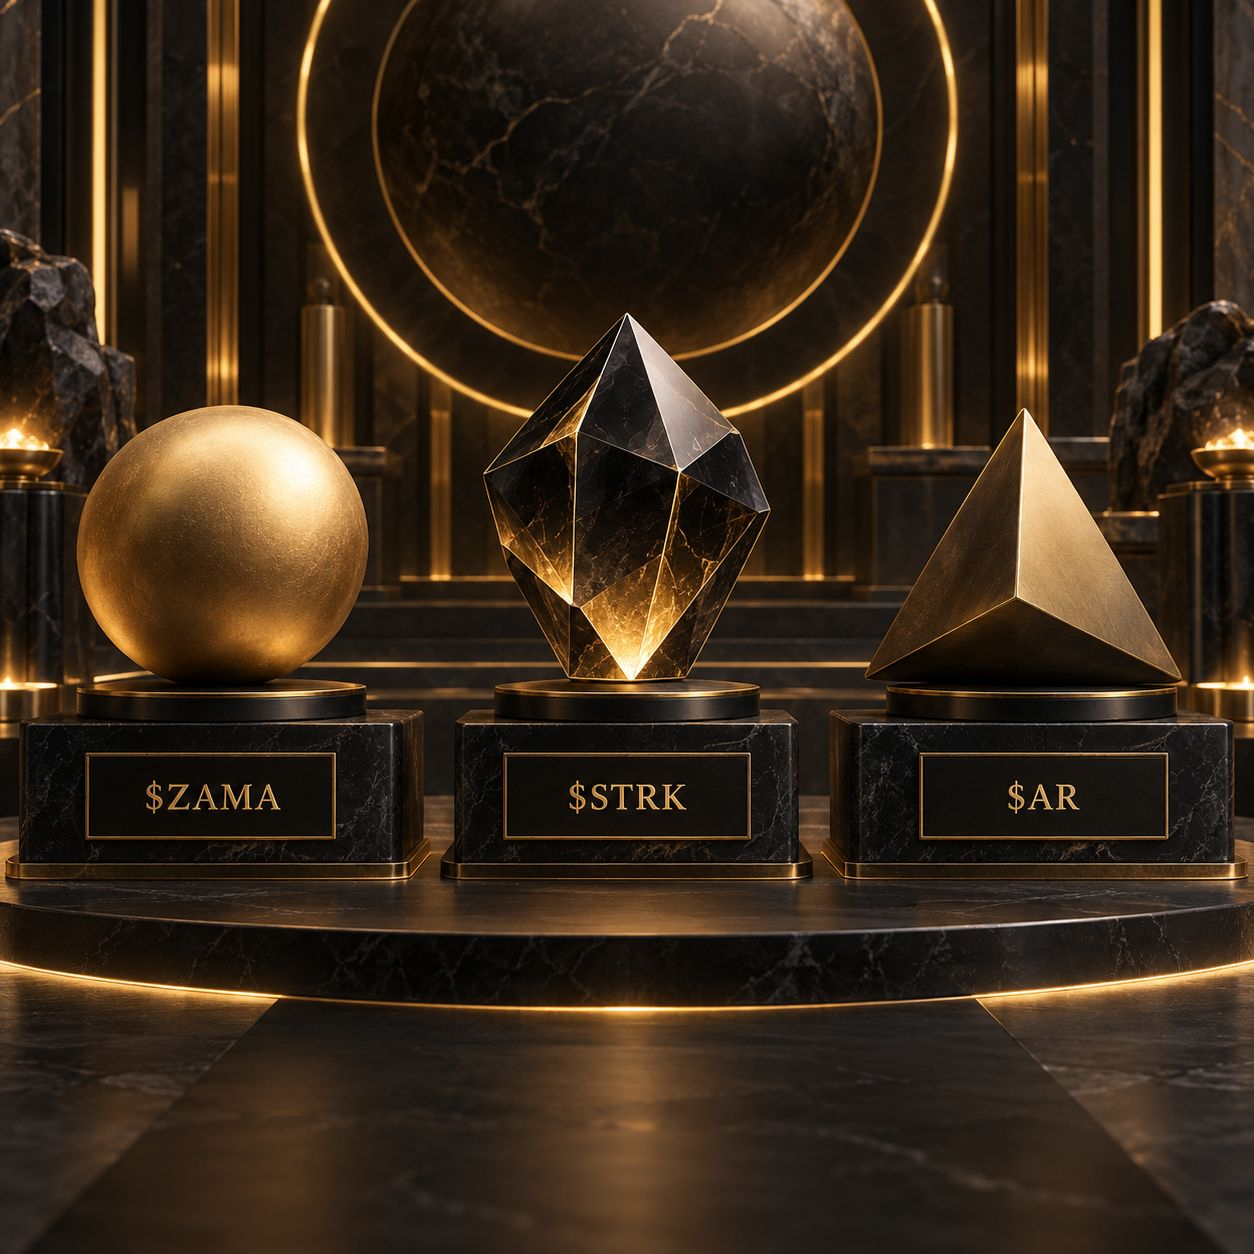
$ZAMA $STRK $AR
$ZAMA: Zama focuses on FHE—enabling on-chain applications to compute directly on encrypted data. The key is not to reinvent a generic privacy concept, but to turn use cases like confidential transfers, confidential DeFi, and enterprise-grade on-chain settlement into protocols that developers can actually use. How far it can go mainly depends on whether the developer tools, ecosystem integrations, and real-world use cases keep up. The market is very hot right now: current price 0.07692, up 37.68% in 24 hours, up 23.55% in the last 6 hours, with contract trading volume around 116.5M USDT. 0.08481 is overhead resistance, while around 0.06124 we should first look for support. OI has risen noticeably over the past six hours—strength is strength—but don’t treat sentiment as a perpetual engine.
$STRK: Starknet is a ZK Rollup on Ethereum. Its core purpose is to use STARK proofs to help applications scale, and STRK is also used for network fees, governance, and staking security. Its outlook depends more on whether developers stay active, ecosystem transaction volume continues, and whether the unlocking schedule can be absorbed by the market. Current price is 0.04679, up 40.60% in 24 hours, up 15.04% in the last 6 hours, with trading volume around 190.2M USDT. The price is already close to the 0.04736 resistance zone; only if it can break above with volume will there be room to open further upside. If it falls back below 0.03941, the strength of this short-term move will drop a notch.
$AR: Arweave provides permanent data storage. AR’s use cases are tied to storage payments and network incentives. When the market buys AR, it’s essentially buying the ability to sustain demand for long-term data retention, decentralized web, and the AO ecosystem. Current price is 4.571, up 46.55% in 24 hours, up 6.02% in the last 6 hours, with trading volume around 193.4M USDT. Resistance near 4.778 is the high of this leg; 3.813 is the key support level in the recent 6-hour structure. Funding rates are slightly negative, suggesting it’s not a one-sided long crowd—but the upside has already been substantial, so chasing should be contingent on the quality of any pullback.
#市场异动 #隐私计算 #Layer2 #Decentralized storage
$ZAMA $STRK $AR
$ZAMA : Zama focuses on FHE—enabling on-chain applications to compute directly on encrypted data. The key is not to reinvent a generic privacy concept, but to turn use cases like confidential transfers, confidential DeFi, and enterprise-grade on-chain settlement into protocols that developers can actually use. How far it can go mainly depends on whether the developer tools, ecosystem integrations, and real-world use cases keep up. The market is very hot right now: current price 0.07692, up 37.68% in 24 hours, up 23.55% in the last 6 hours, with contract trading volume around 116.5M USDT. 0.08481 is overhead resistance, while around 0.06124 we should first look for support. OI has risen noticeably over the past six hours—strength is strength—but don’t treat sentiment as a perpetual engine.
$STRK : Starknet is a ZK Rollup on Ethereum. Its core purpose is to use STARK proofs to help applications scale, and STRK is also used for network fees, governance, and staking security. Its outlook depends more on whether developers stay active, ecosystem transaction volume continues, and whether the unlocking schedule can be absorbed by the market. Current price is 0.04679, up 40.60% in 24 hours, up 15.04% in the last 6 hours, with trading volume around 190.2M USDT. The price is already close to the 0.04736 resistance zone; only if it can break above with volume will there be room to open further upside. If it falls back below 0.03941, the strength of this short-term move will drop a notch.
$AR : Arweave provides permanent data storage. AR’s use cases are tied to storage payments and network incentives. When the market buys AR, it’s essentially buying the ability to sustain demand for long-term data retention, decentralized web, and the AO ecosystem. Current price is 4.571, up 46.55% in 24 hours, up 6.02% in the last 6 hours, with trading volume around 193.4M USDT. Resistance near 4.778 is the high of this leg; 3.813 is the key support level in the recent 6-hour structure. Funding rates are slightly negative, suggesting it’s not a one-sided long crowd—but the upside has already been substantial, so chasing should be contingent on the quality of any pullback.
#市场异动 #隐私计算 #Layer2 #Decentralized storage
$ZAMA : Zama focuses on FHE—enabling on-chain applications to compute directly on encrypted data. The key is not to reinvent a generic privacy concept, but to turn use cases like confidential transfers, confidential DeFi, and enterprise-grade on-chain settlement into protocols that developers can actually use. How far it can go mainly depends on whether the developer tools, ecosystem integrations, and real-world use cases keep up. The market is very hot right now: current price 0.07692, up 37.68% in 24 hours, up 23.55% in the last 6 hours, with contract trading volume around 116.5M USDT. 0.08481 is overhead resistance, while around 0.06124 we should first look for support. OI has risen noticeably over the past six hours—strength is strength—but don’t treat sentiment as a perpetual engine.
$STRK : Starknet is a ZK Rollup on Ethereum. Its core purpose is to use STARK proofs to help applications scale, and STRK is also used for network fees, governance, and staking security. Its outlook depends more on whether developers stay active, ecosystem transaction volume continues, and whether the unlocking schedule can be absorbed by the market. Current price is 0.04679, up 40.60% in 24 hours, up 15.04% in the last 6 hours, with trading volume around 190.2M USDT. The price is already close to the 0.04736 resistance zone; only if it can break above with volume will there be room to open further upside. If it falls back below 0.03941, the strength of this short-term move will drop a notch.
$AR : Arweave provides permanent data storage. AR’s use cases are tied to storage payments and network incentives. When the market buys AR, it’s essentially buying the ability to sustain demand for long-term data retention, decentralized web, and the AO ecosystem. Current price is 4.571, up 46.55% in 24 hours, up 6.02% in the last 6 hours, with trading volume around 193.4M USDT. Resistance near 4.778 is the high of this leg; 3.813 is the key support level in the recent 6-hour structure. Funding rates are slightly negative, suggesting it’s not a one-sided long crowd—but the upside has already been substantial, so chasing should be contingent on the quality of any pullback.
#市场异动 #隐私计算 #Layer2 #Decentralized storage
318
·
--
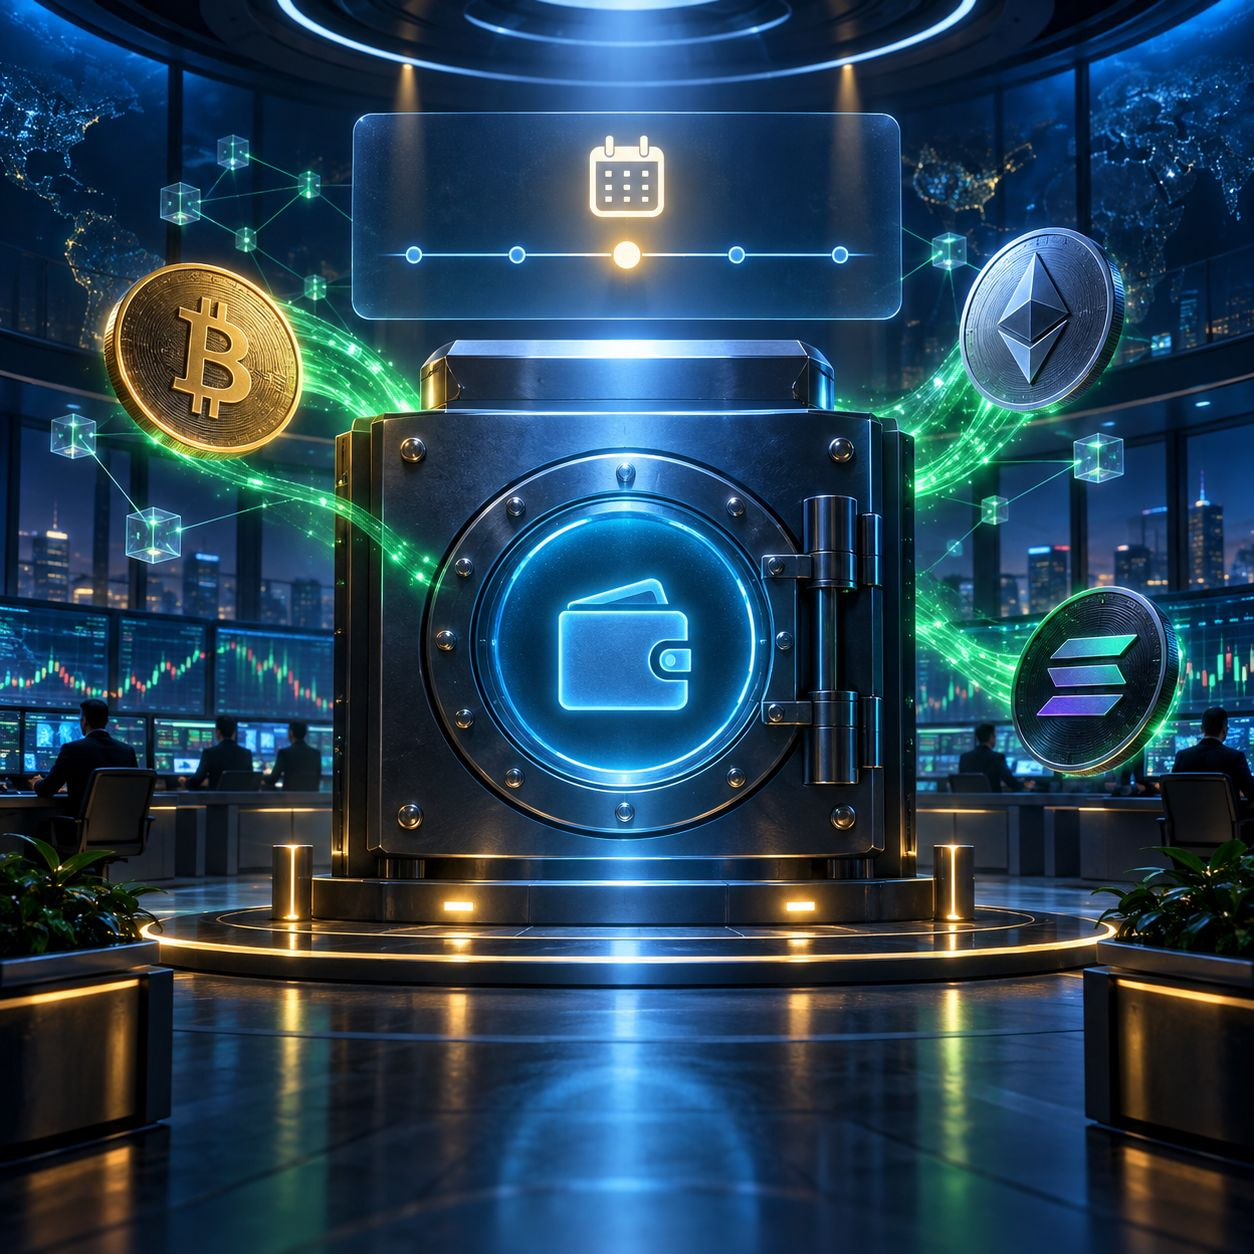
$BTC $ETH $SOL
Don’t treat the wallet upgrade on September 22 as if the market is about to be shut down. What really matters is this: deposits and withdrawals are temporarily paused, but spot trading continues. On-chain availability and the order-book price may be slightly out of sync for a short period.
Binance’s announcement shows that starting at 14:00 Beijing time on September 22, the wallet infrastructure upgrade is expected to take about 1 hour. Deposits and withdrawals will be paused and then resumed once things stabilize. In the current Binance spot snapshots, $BTC is around 81330 (24H +4.006%); $ETH is around 2640.82 (+5.222%); and $SOL is around 111.80 (+4.986%). Most major coins are rebounding. What traders fear most in the short term is that someone could misread “you can’t withdraw coins” as “trading is also halted,” and then sell impulsively out of emotion.
Over the next 15 days, I’ll treat 14:00–15:30 as the observation window: whether market depth is normal, how long it takes for deposits and withdrawals to resume after the upgrade, and whether BTC and ETH can hold their intraday strength. Don’t rush to transfer funds mid-upgrade to beat the clock; don’t chase abnormal volatility with new orders during the upgrade; and after it’s restored, check whether the price spread has returned to normal. Do you think this kind of system event will amplify volatility, or is it just a brief bout of noise?
#BTC #ETH #SOL #Binance
$BTC $ETH $SOL
Don’t treat the wallet upgrade on September 22 as if the market is about to be shut down. What really matters is this: deposits and withdrawals are temporarily paused, but spot trading continues. On-chain availability and the order-book price may be slightly out of sync for a short period.
Binance’s announcement shows that starting at 14:00 Beijing time on September 22, the wallet infrastructure upgrade is expected to take about 1 hour. Deposits and withdrawals will be paused and then resumed once things stabilize. In the current Binance spot snapshots, $BTC is around 81330 (24H +4.006%); $ETH is around 2640.82 (+5.222%); and $SOL is around 111.80 (+4.986%). Most major coins are rebounding. What traders fear most in the short term is that someone could misread “you can’t withdraw coins” as “trading is also halted,” and then sell impulsively out of emotion.
Over the next 15 days, I’ll treat 14:00–15:30 as the observation window: whether market depth is normal, how long it takes for deposits and withdrawals to resume after the upgrade, and whether BTC and ETH can hold their intraday strength. Don’t rush to transfer funds mid-upgrade to beat the clock; don’t chase abnormal volatility with new orders during the upgrade; and after it’s restored, check whether the price spread has returned to normal. Do you think this kind of system event will amplify volatility, or is it just a brief bout of noise?
#BTC #ETH #SOL #Binance
Don’t treat the wallet upgrade on September 22 as if the market is about to be shut down. What really matters is this: deposits and withdrawals are temporarily paused, but spot trading continues. On-chain availability and the order-book price may be slightly out of sync for a short period.
Binance’s announcement shows that starting at 14:00 Beijing time on September 22, the wallet infrastructure upgrade is expected to take about 1 hour. Deposits and withdrawals will be paused and then resumed once things stabilize. In the current Binance spot snapshots, $BTC is around 81330 (24H +4.006%); $ETH is around 2640.82 (+5.222%); and $SOL is around 111.80 (+4.986%). Most major coins are rebounding. What traders fear most in the short term is that someone could misread “you can’t withdraw coins” as “trading is also halted,” and then sell impulsively out of emotion.
Over the next 15 days, I’ll treat 14:00–15:30 as the observation window: whether market depth is normal, how long it takes for deposits and withdrawals to resume after the upgrade, and whether BTC and ETH can hold their intraday strength. Don’t rush to transfer funds mid-upgrade to beat the clock; don’t chase abnormal volatility with new orders during the upgrade; and after it’s restored, check whether the price spread has returned to normal. Do you think this kind of system event will amplify volatility, or is it just a brief bout of noise?
#BTC #ETH #SOL #Binance
394
·
--
$MARSCOIN $AVA
$MARSCOIN: For this leg of the decline, I’m basing it on the chart—there hasn’t been any official negative event I can confirm. At the time, MARSCOIN was trading at 0.1044, down 7.04% over 24h. The intraday low was 0.1028, very close to the current price, suggesting selling pressure has already been pushed down into a low area. The trading volume was 14.67 million USDT—not a complete lack of liquidity. This doesn’t look like an empty, dead-bear candle drift; it’s more like “realization” after the hype in this narrative coin cools off. The project itself is a Mars-themed meme token on BNB Chain. Its gameplay is more community- and sentiment-driven, not a protocol with clear cash flows already in place. For now there’s no verifiable upcoming catalyst. I’m watching two things: whether volume can keep staying in the main range, and whether price can retest the 0.1222 resistance zone. If it can’t even hold steady around 0.1048, short-term sentiment will likely remain fragile ⚠️
$AVA: For this move in AVA, I also didn’t see any official-level negative news from Travala—it looks more like profit-taking after a push higher. Back then, the price was 0.2331, down 7.13% in 24h. The low was 0.2185 and the high 0.2792, with very large volatility. The 5.01 million USDT trading value just nudged above the main-range threshold—liquidity seems sufficient, but the order-book support isn’t particularly thick. AVA is tied to Travala’s travel booking ecosystem, which can be used for member discounts, rebates, and platform benefits—so the logic is a bit more grounded than a pure meme. Next, I’ll watch whether AVA Smart Program, car-rental rebates, and crypto payment coverage can keep generating real usage momentum. On the chart, 0.2246 is short-term support. For any rebound, first watch the 0.2997 area; if it can’t break through, don’t rush to call the bounce a reversal.
#MARSCOIN #AVA #现货跌幅榜
$MARSCOIN $AVA
$MARSCOIN : For this leg of the decline, I’m basing it on the chart—there hasn’t been any official negative event I can confirm. At the time, MARSCOIN was trading at 0.1044, down 7.04% over 24h. The intraday low was 0.1028, very close to the current price, suggesting selling pressure has already been pushed down into a low area. The trading volume was 14.67 million USDT—not a complete lack of liquidity. This doesn’t look like an empty, dead-bear candle drift; it’s more like “realization” after the hype in this narrative coin cools off. The project itself is a Mars-themed meme token on BNB Chain. Its gameplay is more community- and sentiment-driven, not a protocol with clear cash flows already in place. For now there’s no verifiable upcoming catalyst. I’m watching two things: whether volume can keep staying in the main range, and whether price can retest the 0.1222 resistance zone. If it can’t even hold steady around 0.1048, short-term sentiment will likely remain fragile ⚠️
$AVA : For this move in AVA, I also didn’t see any official-level negative news from Travala—it looks more like profit-taking after a push higher. Back then, the price was 0.2331, down 7.13% in 24h. The low was 0.2185 and the high 0.2792, with very large volatility. The 5.01 million USDT trading value just nudged above the main-range threshold—liquidity seems sufficient, but the order-book support isn’t particularly thick. AVA is tied to Travala’s travel booking ecosystem, which can be used for member discounts, rebates, and platform benefits—so the logic is a bit more grounded than a pure meme. Next, I’ll watch whether AVA Smart Program, car-rental rebates, and crypto payment coverage can keep generating real usage momentum. On the chart, 0.2246 is short-term support. For any rebound, first watch the 0.2997 area; if it can’t break through, don’t rush to call the bounce a reversal.
#MARSCOIN #AVA #现货跌幅榜
$MARSCOIN : For this leg of the decline, I’m basing it on the chart—there hasn’t been any official negative event I can confirm. At the time, MARSCOIN was trading at 0.1044, down 7.04% over 24h. The intraday low was 0.1028, very close to the current price, suggesting selling pressure has already been pushed down into a low area. The trading volume was 14.67 million USDT—not a complete lack of liquidity. This doesn’t look like an empty, dead-bear candle drift; it’s more like “realization” after the hype in this narrative coin cools off. The project itself is a Mars-themed meme token on BNB Chain. Its gameplay is more community- and sentiment-driven, not a protocol with clear cash flows already in place. For now there’s no verifiable upcoming catalyst. I’m watching two things: whether volume can keep staying in the main range, and whether price can retest the 0.1222 resistance zone. If it can’t even hold steady around 0.1048, short-term sentiment will likely remain fragile ⚠️
$AVA : For this move in AVA, I also didn’t see any official-level negative news from Travala—it looks more like profit-taking after a push higher. Back then, the price was 0.2331, down 7.13% in 24h. The low was 0.2185 and the high 0.2792, with very large volatility. The 5.01 million USDT trading value just nudged above the main-range threshold—liquidity seems sufficient, but the order-book support isn’t particularly thick. AVA is tied to Travala’s travel booking ecosystem, which can be used for member discounts, rebates, and platform benefits—so the logic is a bit more grounded than a pure meme. Next, I’ll watch whether AVA Smart Program, car-rental rebates, and crypto payment coverage can keep generating real usage momentum. On the chart, 0.2246 is short-term support. For any rebound, first watch the 0.2997 area; if it can’t break through, don’t rush to call the bounce a reversal.
#MARSCOIN #AVA #现货跌幅榜

511
·
--
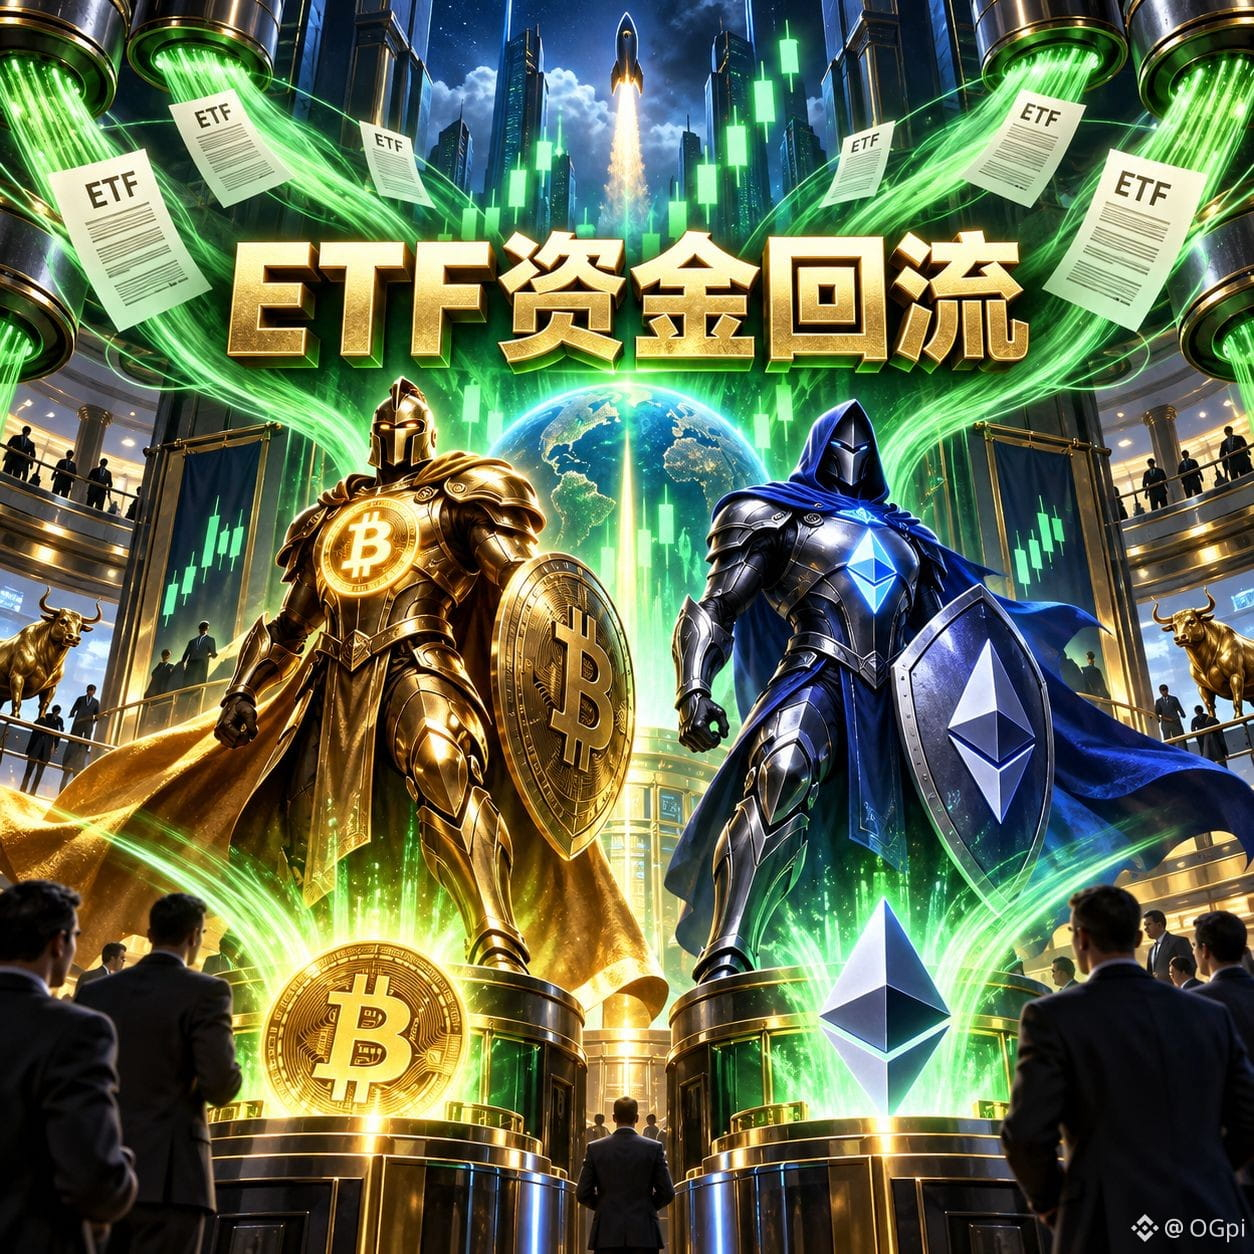
$BTC $ETH
Last night, don’t pretend you can’t see this—mainstream funds are back in 🔥
On Binance spot: $BTC is now around 81356. In the past 24H it’s up 4.27%, the high touched 81741. $ETH is even stronger—around 2651; up 6.10% in 24H, moving from the low of 2494 all the way to 2662. This isn’t small-cap hype—mainstream coins are taking back direction first.
Even more aggressive is the ETF flow. According to Farside’s data for Sept 18: BTC spot ETFs saw net inflows of $433 million, and ETH ETFs saw net inflows of $143.7 million. The money that was scared off just a couple of days ago turned around and started refilling again. I don’t want to call out anyone to chase here—but once funds re-enter the market, you can’t keep viewing the chart with a bearish mindset.
In the next 15 days, I’m watching two things: can BTC hold steady above 80k, and can ETH turn 2600 into support. If pullbacks don’t break it, buying in batches feels more comfortable than impulsively chasing on emotion. If it breaks down on increased volume, don’t be stubborn—protect yourself first.
Do you think this wave is a real ETF rebound back in, or just a one-day bear-trap/counter-pump? Comment section—go at it👇
#BTC #ETH #ETF
$BTC $ETH
Last night, don’t pretend you can’t see this—mainstream funds are back in 🔥
On Binance spot: $BTC is now around 81356. In the past 24H it’s up 4.27%, the high touched 81741. $ETH is even stronger—around 2651; up 6.10% in 24H, moving from the low of 2494 all the way to 2662. This isn’t small-cap hype—mainstream coins are taking back direction first.
Even more aggressive is the ETF flow. According to Farside’s data for Sept 18: BTC spot ETFs saw net inflows of $433 million, and ETH ETFs saw net inflows of $143.7 million. The money that was scared off just a couple of days ago turned around and started refilling again. I don’t want to call out anyone to chase here—but once funds re-enter the market, you can’t keep viewing the chart with a bearish mindset.
In the next 15 days, I’m watching two things: can BTC hold steady above 80k, and can ETH turn 2600 into support. If pullbacks don’t break it, buying in batches feels more comfortable than impulsively chasing on emotion. If it breaks down on increased volume, don’t be stubborn—protect yourself first.
Do you think this wave is a real ETF rebound back in, or just a one-day bear-trap/counter-pump? Comment section—go at it👇
#BTC #ETH #ETF
Last night, don’t pretend you can’t see this—mainstream funds are back in 🔥
On Binance spot: $BTC is now around 81356. In the past 24H it’s up 4.27%, the high touched 81741. $ETH is even stronger—around 2651; up 6.10% in 24H, moving from the low of 2494 all the way to 2662. This isn’t small-cap hype—mainstream coins are taking back direction first.
Even more aggressive is the ETF flow. According to Farside’s data for Sept 18: BTC spot ETFs saw net inflows of $433 million, and ETH ETFs saw net inflows of $143.7 million. The money that was scared off just a couple of days ago turned around and started refilling again. I don’t want to call out anyone to chase here—but once funds re-enter the market, you can’t keep viewing the chart with a bearish mindset.
In the next 15 days, I’m watching two things: can BTC hold steady above 80k, and can ETH turn 2600 into support. If pullbacks don’t break it, buying in batches feels more comfortable than impulsively chasing on emotion. If it breaks down on increased volume, don’t be stubborn—protect yourself first.
Do you think this wave is a real ETF rebound back in, or just a one-day bear-trap/counter-pump? Comment section—go at it👇
#BTC #ETH #ETF
301
·
--
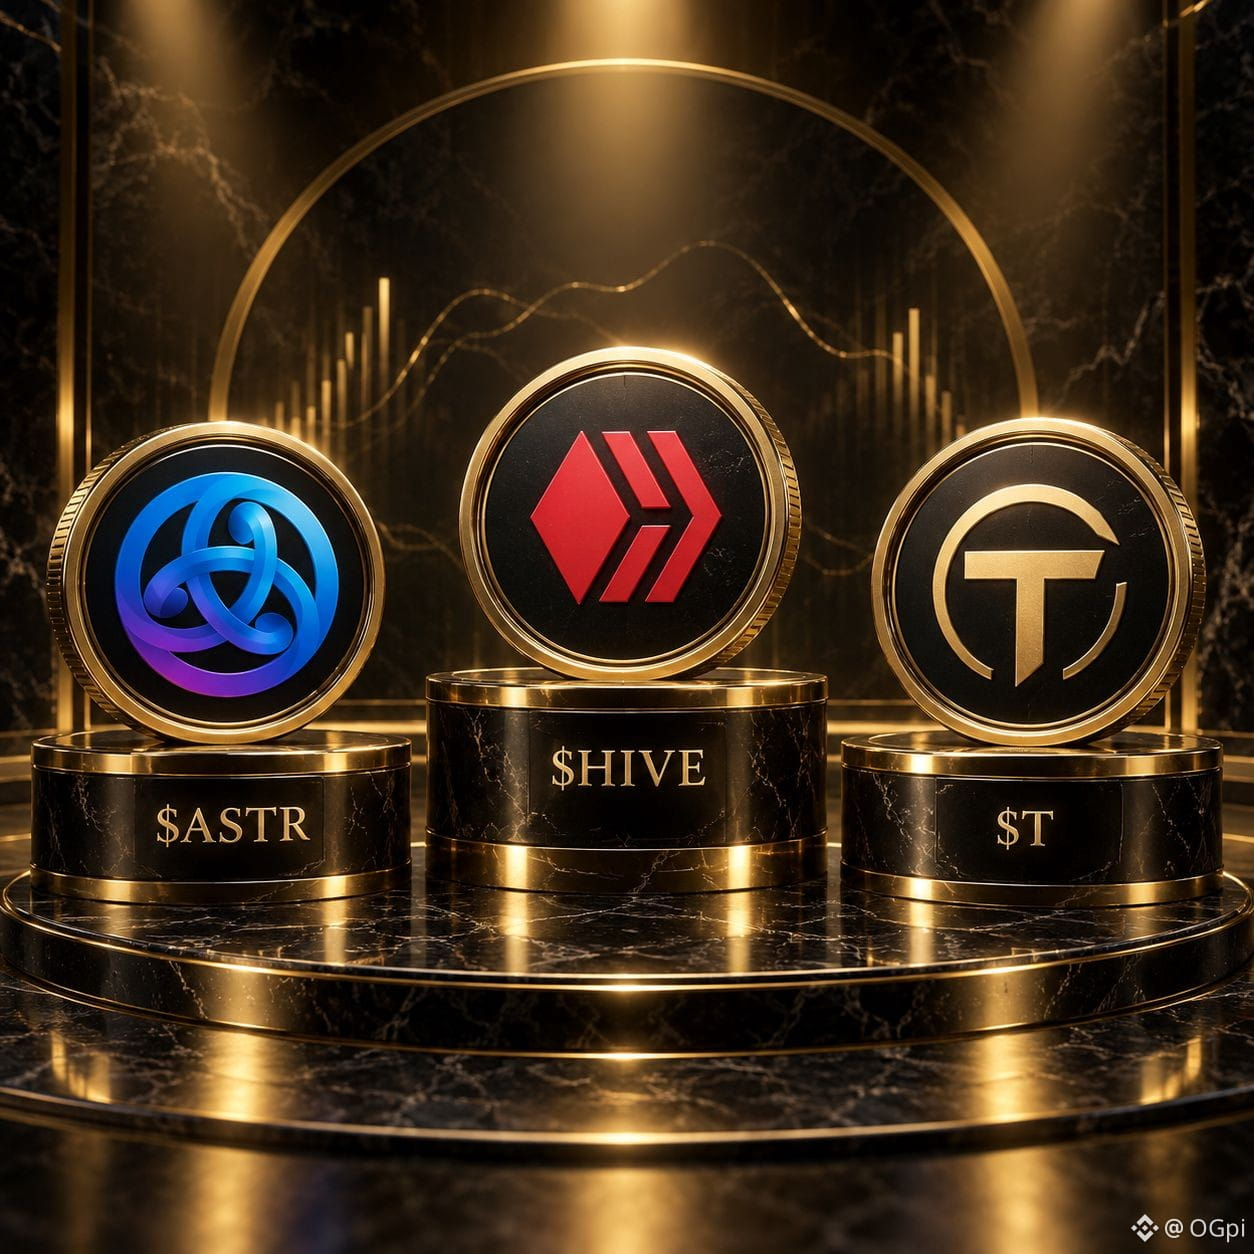
$ASTR $HIVE $T
$ASTR: Astar is built around this line of multi-chain smart contracts and dApp staking. ASTR’s main utility lies in fees, governance, staking, and allocating incentives to application-side participants. Whether the market can keep focusing on it depends on whether developers, application activity, and cross-chain ecosystem truly have real demand. Currently, the price is 0.007412; it’s up 15.98% over the past 24 hours and has surged 21.35% in the last 6 hours. Trading volume is 21.02 million USDT—so it’s not that there’s no capital. The issue is that around 0.008184 and above is already nearing short-term resistance. The funding rate is still negative, and OI (open interest) has risen 35.29% over six hours. With this kind of order book, it’s easy to see a market that’s both strong and crowded. If 0.005977 breaks, don’t force an argument for continuation.
$HIVE: Hive is a chain geared more toward content and community. The core idea is to run posting, interaction, applications, and account resource usage on-chain. HIVE is used for staking, governance, and to carry ecosystem rewards distribution. Its outlook isn’t driven by a single piece of narrative; it depends on community activity, application retention, and whether the content economy can keep turning over. Now at 0.05842, it’s up 14.93% over the past 24 hours, and in the last 6 hours it’s still up 10.08%. Trading volume is 26.19 million USDT. Support to watch first is 0.05208, while resistance is at 0.06214. The funding rate is slightly negative, and OI has increased by 33.16% over six hours, meaning shorts haven’t stayed out either. After a push higher, it’s even more important to see whether volume can hold up and absorb the move.
$T: Threshold (T) is more of a base-layer infrastructure theme. T leverages tBTC, node staking, governance, and network security. At its core, it’s about cross-chain BTC liquidity and the demand for decentralized custody. This theme isn’t flashy, but if tBTC usage doesn’t rise, the coin’s price elasticity may end up relying only on short-term capital. Currently at 0.005093, it’s up 14.50% over the past 24 hours, and the last 1 hour is up 2.06%. Volume has expanded to 111 million USDT. 0.004735 is the承接 (support/absorption) level for this leg; treat around 0.005312 as resistance first. Only once it can build volume and break above, then we can call it strong—otherwise chasing just under resistance will feel pretty uncomfortable.
#币安广场 #山寨币 #Market observation
$ASTR $HIVE $T
$ASTR : Astar is built around this line of multi-chain smart contracts and dApp staking. ASTR’s main utility lies in fees, governance, staking, and allocating incentives to application-side participants. Whether the market can keep focusing on it depends on whether developers, application activity, and cross-chain ecosystem truly have real demand. Currently, the price is 0.007412; it’s up 15.98% over the past 24 hours and has surged 21.35% in the last 6 hours. Trading volume is 21.02 million USDT—so it’s not that there’s no capital. The issue is that around 0.008184 and above is already nearing short-term resistance. The funding rate is still negative, and OI (open interest) has risen 35.29% over six hours. With this kind of order book, it’s easy to see a market that’s both strong and crowded. If 0.005977 breaks, don’t force an argument for continuation.
$HIVE : Hive is a chain geared more toward content and community. The core idea is to run posting, interaction, applications, and account resource usage on-chain. HIVE is used for staking, governance, and to carry ecosystem rewards distribution. Its outlook isn’t driven by a single piece of narrative; it depends on community activity, application retention, and whether the content economy can keep turning over. Now at 0.05842, it’s up 14.93% over the past 24 hours, and in the last 6 hours it’s still up 10.08%. Trading volume is 26.19 million USDT. Support to watch first is 0.05208, while resistance is at 0.06214. The funding rate is slightly negative, and OI has increased by 33.16% over six hours, meaning shorts haven’t stayed out either. After a push higher, it’s even more important to see whether volume can hold up and absorb the move.
$T : Threshold (T) is more of a base-layer infrastructure theme. T leverages tBTC, node staking, governance, and network security. At its core, it’s about cross-chain BTC liquidity and the demand for decentralized custody. This theme isn’t flashy, but if tBTC usage doesn’t rise, the coin’s price elasticity may end up relying only on short-term capital. Currently at 0.005093, it’s up 14.50% over the past 24 hours, and the last 1 hour is up 2.06%. Volume has expanded to 111 million USDT. 0.004735 is the承接 (support/absorption) level for this leg; treat around 0.005312 as resistance first. Only once it can build volume and break above, then we can call it strong—otherwise chasing just under resistance will feel pretty uncomfortable.
#币安广场 #山寨币 #Market observation
$ASTR : Astar is built around this line of multi-chain smart contracts and dApp staking. ASTR’s main utility lies in fees, governance, staking, and allocating incentives to application-side participants. Whether the market can keep focusing on it depends on whether developers, application activity, and cross-chain ecosystem truly have real demand. Currently, the price is 0.007412; it’s up 15.98% over the past 24 hours and has surged 21.35% in the last 6 hours. Trading volume is 21.02 million USDT—so it’s not that there’s no capital. The issue is that around 0.008184 and above is already nearing short-term resistance. The funding rate is still negative, and OI (open interest) has risen 35.29% over six hours. With this kind of order book, it’s easy to see a market that’s both strong and crowded. If 0.005977 breaks, don’t force an argument for continuation.
$HIVE : Hive is a chain geared more toward content and community. The core idea is to run posting, interaction, applications, and account resource usage on-chain. HIVE is used for staking, governance, and to carry ecosystem rewards distribution. Its outlook isn’t driven by a single piece of narrative; it depends on community activity, application retention, and whether the content economy can keep turning over. Now at 0.05842, it’s up 14.93% over the past 24 hours, and in the last 6 hours it’s still up 10.08%. Trading volume is 26.19 million USDT. Support to watch first is 0.05208, while resistance is at 0.06214. The funding rate is slightly negative, and OI has increased by 33.16% over six hours, meaning shorts haven’t stayed out either. After a push higher, it’s even more important to see whether volume can hold up and absorb the move.
$T : Threshold (T) is more of a base-layer infrastructure theme. T leverages tBTC, node staking, governance, and network security. At its core, it’s about cross-chain BTC liquidity and the demand for decentralized custody. This theme isn’t flashy, but if tBTC usage doesn’t rise, the coin’s price elasticity may end up relying only on short-term capital. Currently at 0.005093, it’s up 14.50% over the past 24 hours, and the last 1 hour is up 2.06%. Volume has expanded to 111 million USDT. 0.004735 is the承接 (support/absorption) level for this leg; treat around 0.005312 as resistance first. Only once it can build volume and break above, then we can call it strong—otherwise chasing just under resistance will feel pretty uncomfortable.
#币安广场 #山寨币 #Market observation
247
·
--
$XLM
$XLM Today this one stands out a bit. It suddenly appeared among the old coins, and the market’s attention got pulled toward it immediately.
What this type of coin fears most is having no eyes on it. Once volume and sentiment both come back, in the short term it’s easy for funds to keep testing it. But I won’t treat it as a straight-line trend—if it runs too fast, it will likely get shaken out.
I’ll watch whether it can hold the strong zone. If it holds, the topic can continue; if it doesn’t, it’s just a burst of sentiment.
$XLM
$XLM Today this one stands out a bit. It suddenly appeared among the old coins, and the market’s attention got pulled toward it immediately.
What this type of coin fears most is having no eyes on it. Once volume and sentiment both come back, in the short term it’s easy for funds to keep testing it. But I won’t treat it as a straight-line trend—if it runs too fast, it will likely get shaken out.
I’ll watch whether it can hold the strong zone. If it holds, the topic can continue; if it doesn’t, it’s just a burst of sentiment.
$XLM Today this one stands out a bit. It suddenly appeared among the old coins, and the market’s attention got pulled toward it immediately.
What this type of coin fears most is having no eyes on it. Once volume and sentiment both come back, in the short term it’s easy for funds to keep testing it. But I won’t treat it as a straight-line trend—if it runs too fast, it will likely get shaken out.
I’ll watch whether it can hold the strong zone. If it holds, the topic can continue; if it doesn’t, it’s just a burst of sentiment.

43
·
--
This rally—what will truly be tested isn’t the sentiment, but whether the spot market and ETFs can hold up.
Binance Research’s September observations are straightforward: the total market cap rose 17.6% month-over-month, but it looks more like an interest-rate trade. BTC surged 24.8% over a week. Historical samples have also reminded us that in a sharp rise, there’s a phase where short sellers cover. Now in Binance spot, BTC is up about 2.05% over 24 hours, ETH is up 1.05%, and SOL is up 1.90%, but none of them has really delivered on the “sustained increase in volume” yet.
I’ll watch two signals: whether BTC can stay firm around the $79,000 area, and whether the strength of ETH and SOL can keep up. Also, during pullbacks, I want to see whether trading volume clearly weakens—not whether volume expands immediately when price drops. If it can hold steady, it means capital is willing to turn short-term pulses into a trend; if price and volume diverge after a run-up, treat it first as a rebound—don’t rush to chase.
In the next two weeks, ETF inflows and spot absorption matter more than any single big bullish candle. At this level, you can wait for a pullback and confirmation. Don’t mistake “it went up fast” for “risk has gone down.” Do you think BTC will keep leading, or will ETH and SOL catch up?
#BTC #ETH #SOL #资金流 #Binance Square
This rally—what will truly be tested isn’t the sentiment, but whether the spot market and ETFs can hold up.
Binance Research’s September observations are straightforward: the total market cap rose 17.6% month-over-month, but it looks more like an interest-rate trade. BTC surged 24.8% over a week. Historical samples have also reminded us that in a sharp rise, there’s a phase where short sellers cover. Now in Binance spot, BTC is up about 2.05% over 24 hours, ETH is up 1.05%, and SOL is up 1.90%, but none of them has really delivered on the “sustained increase in volume” yet.
I’ll watch two signals: whether BTC can stay firm around the $79,000 area, and whether the strength of ETH and SOL can keep up. Also, during pullbacks, I want to see whether trading volume clearly weakens—not whether volume expands immediately when price drops. If it can hold steady, it means capital is willing to turn short-term pulses into a trend; if price and volume diverge after a run-up, treat it first as a rebound—don’t rush to chase.
In the next two weeks, ETF inflows and spot absorption matter more than any single big bullish candle. At this level, you can wait for a pullback and confirmation. Don’t mistake “it went up fast” for “risk has gone down.” Do you think BTC will keep leading, or will ETH and SOL catch up?
#BTC #ETH #SOL #资金流 #Binance Square
Binance Research’s September observations are straightforward: the total market cap rose 17.6% month-over-month, but it looks more like an interest-rate trade. BTC surged 24.8% over a week. Historical samples have also reminded us that in a sharp rise, there’s a phase where short sellers cover. Now in Binance spot, BTC is up about 2.05% over 24 hours, ETH is up 1.05%, and SOL is up 1.90%, but none of them has really delivered on the “sustained increase in volume” yet.
I’ll watch two signals: whether BTC can stay firm around the $79,000 area, and whether the strength of ETH and SOL can keep up. Also, during pullbacks, I want to see whether trading volume clearly weakens—not whether volume expands immediately when price drops. If it can hold steady, it means capital is willing to turn short-term pulses into a trend; if price and volume diverge after a run-up, treat it first as a rebound—don’t rush to chase.
In the next two weeks, ETF inflows and spot absorption matter more than any single big bullish candle. At this level, you can wait for a pullback and confirmation. Don’t mistake “it went up fast” for “risk has gone down.” Do you think BTC will keep leading, or will ETH and SOL catch up?
#BTC #ETH #SOL #资金流 #Binance Square

192
·
--
$T $IOTA $XLM
$T: Threshold is still mainly centered around tBTC—using BTC with threshold encryption and a node network to bring it into DeFi. The highlights of $T lie in whether staking nodes, tBTC fee income, and cross-chain BTC demand can truly be amplified. This round of trading is very hot: the current price is 0.004963, up 13.16% in 24 hours, and still up 9.23% in the last 6 hours, but it has pulled back 6.46% in the last hour. That suggests the capital that chased in has started to clash. Contract volume is about 64.41 million USDT; OI (open interest) over 6 hours increased by 96.10%; funding rate is slightly negative. This combination is extremely stimulating and also very likely to shake people out. First, look for 0.005696. If you can’t break above it, don’t chase hard. If 0.004526 is lost, then short-term strength will drop by one level.
$IOTA: IOTA is currently more of a Move-based L1 narrative. It focuses on a high-performance chain and developer tools. The future outlook mainly depends on whether there is real usage—such as application migration, DePIN, or enterprise data scenarios—not just relying on the credibility of an established brand. Current price is 0.04666, up 15.47% in 24 hours; up 11.40% in the last ~6 hours. Trade volume is about 12.53 million USDT—nothing like a huge spike, but the direction is quite decisive. OI over 6 hours rose 21.36%, indicating fresh positions are coming in. 0.04721 is near-term resistance; only if it can expand volume through it will there be a more “continuation” feel. If it falls back below 0.04097, this move will look more like a momentum/emotion-driven rally.
$XLM: Stellar builds a payments and asset issuance network. XLM mainly supports account activation, transaction fees, and consumption of network resources. The narrative isn’t flashy, but what matters is whether cross-border payments, stablecoins, and institutional integrations can continue to drive real on-chain activity. Current price is 0.19201, up 7.55% in 24 hours; up 4.16% in the last ~6 hours. Trade volume is about 55.94 million USDT—steadier than many smaller coins. In the short term, it’s already close to the 0.19269 resistance zone. The strength is truly strong, but here it’s more suitable to watch whether it can hold than to chase a single candle. If it drops below 0.18310, the earlier lift will turn out to be hollow.
#山寨异动 #BTCFi #支付网络 #Binance Square
$T $IOTA $XLM
$T : Threshold is still mainly centered around tBTC—using BTC with threshold encryption and a node network to bring it into DeFi. The highlights of $T lie in whether staking nodes, tBTC fee income, and cross-chain BTC demand can truly be amplified. This round of trading is very hot: the current price is 0.004963, up 13.16% in 24 hours, and still up 9.23% in the last 6 hours, but it has pulled back 6.46% in the last hour. That suggests the capital that chased in has started to clash. Contract volume is about 64.41 million USDT; OI (open interest) over 6 hours increased by 96.10%; funding rate is slightly negative. This combination is extremely stimulating and also very likely to shake people out. First, look for 0.005696. If you can’t break above it, don’t chase hard. If 0.004526 is lost, then short-term strength will drop by one level.
$IOTA : IOTA is currently more of a Move-based L1 narrative. It focuses on a high-performance chain and developer tools. The future outlook mainly depends on whether there is real usage—such as application migration, DePIN, or enterprise data scenarios—not just relying on the credibility of an established brand. Current price is 0.04666, up 15.47% in 24 hours; up 11.40% in the last ~6 hours. Trade volume is about 12.53 million USDT—nothing like a huge spike, but the direction is quite decisive. OI over 6 hours rose 21.36%, indicating fresh positions are coming in. 0.04721 is near-term resistance; only if it can expand volume through it will there be a more “continuation” feel. If it falls back below 0.04097, this move will look more like a momentum/emotion-driven rally.
$XLM : Stellar builds a payments and asset issuance network. XLM mainly supports account activation, transaction fees, and consumption of network resources. The narrative isn’t flashy, but what matters is whether cross-border payments, stablecoins, and institutional integrations can continue to drive real on-chain activity. Current price is 0.19201, up 7.55% in 24 hours; up 4.16% in the last ~6 hours. Trade volume is about 55.94 million USDT—steadier than many smaller coins. In the short term, it’s already close to the 0.19269 resistance zone. The strength is truly strong, but here it’s more suitable to watch whether it can hold than to chase a single candle. If it drops below 0.18310, the earlier lift will turn out to be hollow.
#山寨异动 #BTCFi #支付网络 #Binance Square
$T : Threshold is still mainly centered around tBTC—using BTC with threshold encryption and a node network to bring it into DeFi. The highlights of $T lie in whether staking nodes, tBTC fee income, and cross-chain BTC demand can truly be amplified. This round of trading is very hot: the current price is 0.004963, up 13.16% in 24 hours, and still up 9.23% in the last 6 hours, but it has pulled back 6.46% in the last hour. That suggests the capital that chased in has started to clash. Contract volume is about 64.41 million USDT; OI (open interest) over 6 hours increased by 96.10%; funding rate is slightly negative. This combination is extremely stimulating and also very likely to shake people out. First, look for 0.005696. If you can’t break above it, don’t chase hard. If 0.004526 is lost, then short-term strength will drop by one level.
$IOTA : IOTA is currently more of a Move-based L1 narrative. It focuses on a high-performance chain and developer tools. The future outlook mainly depends on whether there is real usage—such as application migration, DePIN, or enterprise data scenarios—not just relying on the credibility of an established brand. Current price is 0.04666, up 15.47% in 24 hours; up 11.40% in the last ~6 hours. Trade volume is about 12.53 million USDT—nothing like a huge spike, but the direction is quite decisive. OI over 6 hours rose 21.36%, indicating fresh positions are coming in. 0.04721 is near-term resistance; only if it can expand volume through it will there be a more “continuation” feel. If it falls back below 0.04097, this move will look more like a momentum/emotion-driven rally.
$XLM : Stellar builds a payments and asset issuance network. XLM mainly supports account activation, transaction fees, and consumption of network resources. The narrative isn’t flashy, but what matters is whether cross-border payments, stablecoins, and institutional integrations can continue to drive real on-chain activity. Current price is 0.19201, up 7.55% in 24 hours; up 4.16% in the last ~6 hours. Trade volume is about 55.94 million USDT—steadier than many smaller coins. In the short term, it’s already close to the 0.19269 resistance zone. The strength is truly strong, but here it’s more suitable to watch whether it can hold than to chase a single candle. If it drops below 0.18310, the earlier lift will turn out to be hollow.
#山寨异动 #BTCFi #支付网络 #Binance Square

1
1
253
·
--
$VTHO $FLOCK
$VTHO:0.0009584 was not held; the price returned to 0.0007502, down 17.74% in 24 hours. Although it rebounded a bit from the low of 0.0006986, the sell pressure above remains heavy. Trading volume is about 158 million USDT. It looks more like increased turnover driven by shifting risk appetite rather than something that can be neatly explained by news. VTHO is the gas-on-chain and transaction-cost token of VeChainThor; its network usage affects its consumption. The project’s public materials list the 2026 Interstellar stage as a key focus afterward, including JSON-RPC and cross-chain interoperability. If implemented as planned, it may broaden development and app access, but whether the price benefits still depends on real on-chain demand.⚠️
$FLOCK:After spiking around 0.0899, it was pushed down all the way to 0.06816. Down 11.80% over 24 hours, the price is hovering close to the intraday low of 0.06624. Trading volume of roughly 102 million USDT suggests fierce competition—more like funds retreating in a highly volatile AI sector and a technical breakdown. FLock.io focuses on decentralized AI training, inference, and model assetization, with FLOCK used for incentives and governance. The official 2026 roadmap lists Q3 items such as FOMO 2.0, model-token voting, and an expansion of AI Arena image/video model plans; Q4 also aims to add audio and speech models. If these milestones are delivered, they could increase platform usage scenarios—better to watch delivery than to price in too early.💡
#合约跌幅榜 #市场分析 #VeChain #去中心化AI #risk management
$VTHO $FLOCK
$VTHO :0.0009584 was not held; the price returned to 0.0007502, down 17.74% in 24 hours. Although it rebounded a bit from the low of 0.0006986, the sell pressure above remains heavy. Trading volume is about 158 million USDT. It looks more like increased turnover driven by shifting risk appetite rather than something that can be neatly explained by news. VTHO is the gas-on-chain and transaction-cost token of VeChainThor; its network usage affects its consumption. The project’s public materials list the 2026 Interstellar stage as a key focus afterward, including JSON-RPC and cross-chain interoperability. If implemented as planned, it may broaden development and app access, but whether the price benefits still depends on real on-chain demand.⚠️
$FLOCK :After spiking around 0.0899, it was pushed down all the way to 0.06816. Down 11.80% over 24 hours, the price is hovering close to the intraday low of 0.06624. Trading volume of roughly 102 million USDT suggests fierce competition—more like funds retreating in a highly volatile AI sector and a technical breakdown. FLock.io focuses on decentralized AI training, inference, and model assetization, with FLOCK used for incentives and governance. The official 2026 roadmap lists Q3 items such as FOMO 2.0, model-token voting, and an expansion of AI Arena image/video model plans; Q4 also aims to add audio and speech models. If these milestones are delivered, they could increase platform usage scenarios—better to watch delivery than to price in too early.💡
#合约跌幅榜 #市场分析 #VeChain #去中心化AI #risk management
$VTHO :0.0009584 was not held; the price returned to 0.0007502, down 17.74% in 24 hours. Although it rebounded a bit from the low of 0.0006986, the sell pressure above remains heavy. Trading volume is about 158 million USDT. It looks more like increased turnover driven by shifting risk appetite rather than something that can be neatly explained by news. VTHO is the gas-on-chain and transaction-cost token of VeChainThor; its network usage affects its consumption. The project’s public materials list the 2026 Interstellar stage as a key focus afterward, including JSON-RPC and cross-chain interoperability. If implemented as planned, it may broaden development and app access, but whether the price benefits still depends on real on-chain demand.⚠️
$FLOCK :After spiking around 0.0899, it was pushed down all the way to 0.06816. Down 11.80% over 24 hours, the price is hovering close to the intraday low of 0.06624. Trading volume of roughly 102 million USDT suggests fierce competition—more like funds retreating in a highly volatile AI sector and a technical breakdown. FLock.io focuses on decentralized AI training, inference, and model assetization, with FLOCK used for incentives and governance. The official 2026 roadmap lists Q3 items such as FOMO 2.0, model-token voting, and an expansion of AI Arena image/video model plans; Q4 also aims to add audio and speech models. If these milestones are delivered, they could increase platform usage scenarios—better to watch delivery than to price in too early.💡
#合约跌幅榜 #市场分析 #VeChain #去中心化AI #risk management

101
·
--
$BR $POWER
This chart looks hot at first glance. The money isn’t being moved slowly—it’s being smashed directly into strong volatility.
$BR: In the past 24H it’s been pulled up 59.57%. The high has already reached 0.3995, while the low is still 0.24699. The full-day intraday range is extremely “hard.” Trading volume is 80.12M USDT, which suggests it’s not just some small circle hyping itself—chasing buyers and short-term switchers have both come in. Now the key thing to watch is whether the strength is still there. The closer it gets to the high, the more you need to watch volume capacity. When it charges hard, the pullback will also be very decisive.
$POWER: Up 18.40%, but don’t underestimate it. Trading volume is also 73.41M USDT. The price has been pushed from 0.10053 all the way to a highest of 0.14363, indicating there was clearly aggressive buy-side pressure during the session. It’s not as “explosive” as the previous one, but the advantage is that the heat is still spreading. The crucial point is whether it can hold steady around 0.119. If it shows volume but no longer lifts higher, the short-term funds will run very quickly.
#Binance #合约交易 #涨幅观察 #Short-term rhythm
$BR $POWER
This chart looks hot at first glance. The money isn’t being moved slowly—it’s being smashed directly into strong volatility.
$BR : In the past 24H it’s been pulled up 59.57%. The high has already reached 0.3995, while the low is still 0.24699. The full-day intraday range is extremely “hard.” Trading volume is 80.12M USDT, which suggests it’s not just some small circle hyping itself—chasing buyers and short-term switchers have both come in. Now the key thing to watch is whether the strength is still there. The closer it gets to the high, the more you need to watch volume capacity. When it charges hard, the pullback will also be very decisive.
$POWER : Up 18.40%, but don’t underestimate it. Trading volume is also 73.41M USDT. The price has been pushed from 0.10053 all the way to a highest of 0.14363, indicating there was clearly aggressive buy-side pressure during the session. It’s not as “explosive” as the previous one, but the advantage is that the heat is still spreading. The crucial point is whether it can hold steady around 0.119. If it shows volume but no longer lifts higher, the short-term funds will run very quickly.
#Binance #合约交易 #涨幅观察 #Short-term rhythm
This chart looks hot at first glance. The money isn’t being moved slowly—it’s being smashed directly into strong volatility.
$BR : In the past 24H it’s been pulled up 59.57%. The high has already reached 0.3995, while the low is still 0.24699. The full-day intraday range is extremely “hard.” Trading volume is 80.12M USDT, which suggests it’s not just some small circle hyping itself—chasing buyers and short-term switchers have both come in. Now the key thing to watch is whether the strength is still there. The closer it gets to the high, the more you need to watch volume capacity. When it charges hard, the pullback will also be very decisive.
$POWER : Up 18.40%, but don’t underestimate it. Trading volume is also 73.41M USDT. The price has been pushed from 0.10053 all the way to a highest of 0.14363, indicating there was clearly aggressive buy-side pressure during the session. It’s not as “explosive” as the previous one, but the advantage is that the heat is still spreading. The crucial point is whether it can hold steady around 0.119. If it shows volume but no longer lifts higher, the short-term funds will run very quickly.
#Binance #合约交易 #涨幅观察 #Short-term rhythm
156
·
--
$BTC $ETH $FIL
After CPI comes out, the market is still waiting on the Fed. BTC isn’t weak now; the issue is it hasn’t yet given a new direction. ETH has been dragging a little, which suggests the capital isn’t in a hurry to fully load up risk positions.
I’ll first see whether we can hold around 77,000 over the next couple of days. If we can hold, then there’s still room for rotation into smaller coins. If we can’t, don’t treat the rebound as a trend.
Today FIL surged into Binance spot and is leading the early movers by percentage gain; short-term momentum is strong. But at this position, it’s more about follow-through—so it’s not suitable to chase the whole move as soon as the sentiment ramps up.
#BTC #ETH #FIL #FOMC #Crypto
$BTC $ETH $FIL
After CPI comes out, the market is still waiting on the Fed. BTC isn’t weak now; the issue is it hasn’t yet given a new direction. ETH has been dragging a little, which suggests the capital isn’t in a hurry to fully load up risk positions.
I’ll first see whether we can hold around 77,000 over the next couple of days. If we can hold, then there’s still room for rotation into smaller coins. If we can’t, don’t treat the rebound as a trend.
Today FIL surged into Binance spot and is leading the early movers by percentage gain; short-term momentum is strong. But at this position, it’s more about follow-through—so it’s not suitable to chase the whole move as soon as the sentiment ramps up.
#BTC #ETH #FIL #FOMC #Crypto
After CPI comes out, the market is still waiting on the Fed. BTC isn’t weak now; the issue is it hasn’t yet given a new direction. ETH has been dragging a little, which suggests the capital isn’t in a hurry to fully load up risk positions.
I’ll first see whether we can hold around 77,000 over the next couple of days. If we can hold, then there’s still room for rotation into smaller coins. If we can’t, don’t treat the rebound as a trend.
Today FIL surged into Binance spot and is leading the early movers by percentage gain; short-term momentum is strong. But at this position, it’s more about follow-through—so it’s not suitable to chase the whole move as soon as the sentiment ramps up.
#BTC #ETH #FIL #FOMC #Crypto
165
Log in to explore more content
Join global crypto users on Binance Square
⚡️ Get latest and useful information about crypto.
💬 Trusted by the world’s largest crypto exchange.
👍 Discover real insights from verified creators.
Email / Phone number