
老邪
36 Posts

老邪
Report
Block User
34 Following
71 Followers
31 Liked
Posts
All
Quotes
·
--
$BTC always feels that the bull market hasn't ended, and this time it is a deep washout, I choose to hold the spot!
$BTC always feels that the bull market hasn't ended, and this time it is a deep washout, I choose to hold the spot!
63
·
--
As long as Bitcoin returns to 100,000, market confidence will be reignited, and a 5% increase is really not a difficult task, so everyone, don't be anxious!
As long as Bitcoin returns to 100,000, market confidence will be reignited, and a 5% increase is really not a difficult task, so everyone, don't be anxious!
85
·
--
#加密市场回调 has a feeling that this wave of increased volume and decline should be the prelude to a counterfeit bull market! Don't criticize me, I really have this feeling! Let's wait and see.
#加密市场回调 has a feeling that this wave of increased volume and decline should be the prelude to a counterfeit bull market! Don't criticize me, I really have this feeling! Let's wait and see.
3
·
--
#SOL I feel that SOL will likely break a new high in this bull market! Hold on tight!
#SOL I feel that SOL will likely break a new high in this bull market! Hold on tight!
202
·
--
80
·
--
#比特币市场波动观 The short-term market is mainly characterized by wide fluctuations. You can make some swings, hold half of your position, and adopt a strategy of swinging with half of your position! The second half of the bull market has already arrived!!!!!!!!!
#比特币市场波动观 The short-term market is mainly characterized by wide fluctuations. You can make some swings, hold half of your position, and adopt a strategy of swinging with half of your position! The second half of the bull market has already arrived!!!!!!!!!
·
--
$BTC BTC has always been strong, even when the technicals need to correct, it does so in a sideways manner, indicating that the big coin is building momentum. Altcoins still rely on the leading effect, and a general bullish market has not yet arrived. Everyone needs to be patient; during a bull market, do not frequently change positions. One must withstand severe fluctuations to hold onto tenfold or hundredfold coins. Never fall before dawn, and remember to never touch contracts, only trade in spot!
$BTC BTC has always been strong, even when the technicals need to correct, it does so in a sideways manner, indicating that the big coin is building momentum. Altcoins still rely on the leading effect, and a general bullish market has not yet arrived. Everyone needs to be patient; during a bull market, do not frequently change positions. One must withstand severe fluctuations to hold onto tenfold or hundredfold coins. Never fall before dawn, and remember to never touch contracts, only trade in spot!
200
·
--
#加密市场狂欢 , BTC has always been strong. Even when a technical correction is needed, it substitutes the correction with sideways movement, indicating that the main coin is building momentum. Currently, altcoins still rely on the leading effect; a widespread bull market has not yet arrived. Everyone needs to be patient. During a bull market, do not frequently change positions; you must withstand severe volatility to hold onto 10x coins and 100x coins. Never fall before dawn, and remember to avoid contracts; only trade spot!
#加密市场狂欢 , BTC has always been strong. Even when a technical correction is needed, it substitutes the correction with sideways movement, indicating that the main coin is building momentum. Currently, altcoins still rely on the leading effect; a widespread bull market has not yet arrived. Everyone needs to be patient. During a bull market, do not frequently change positions; you must withstand severe volatility to hold onto 10x coins and 100x coins. Never fall before dawn, and remember to avoid contracts; only trade spot!
280
·
--
#加密市场狂欢 The counterfeit season will start after waiting for one more callback!
#加密市场狂欢 The counterfeit season will start after waiting for one more callback!
20
·
--
Bullish
$ETH
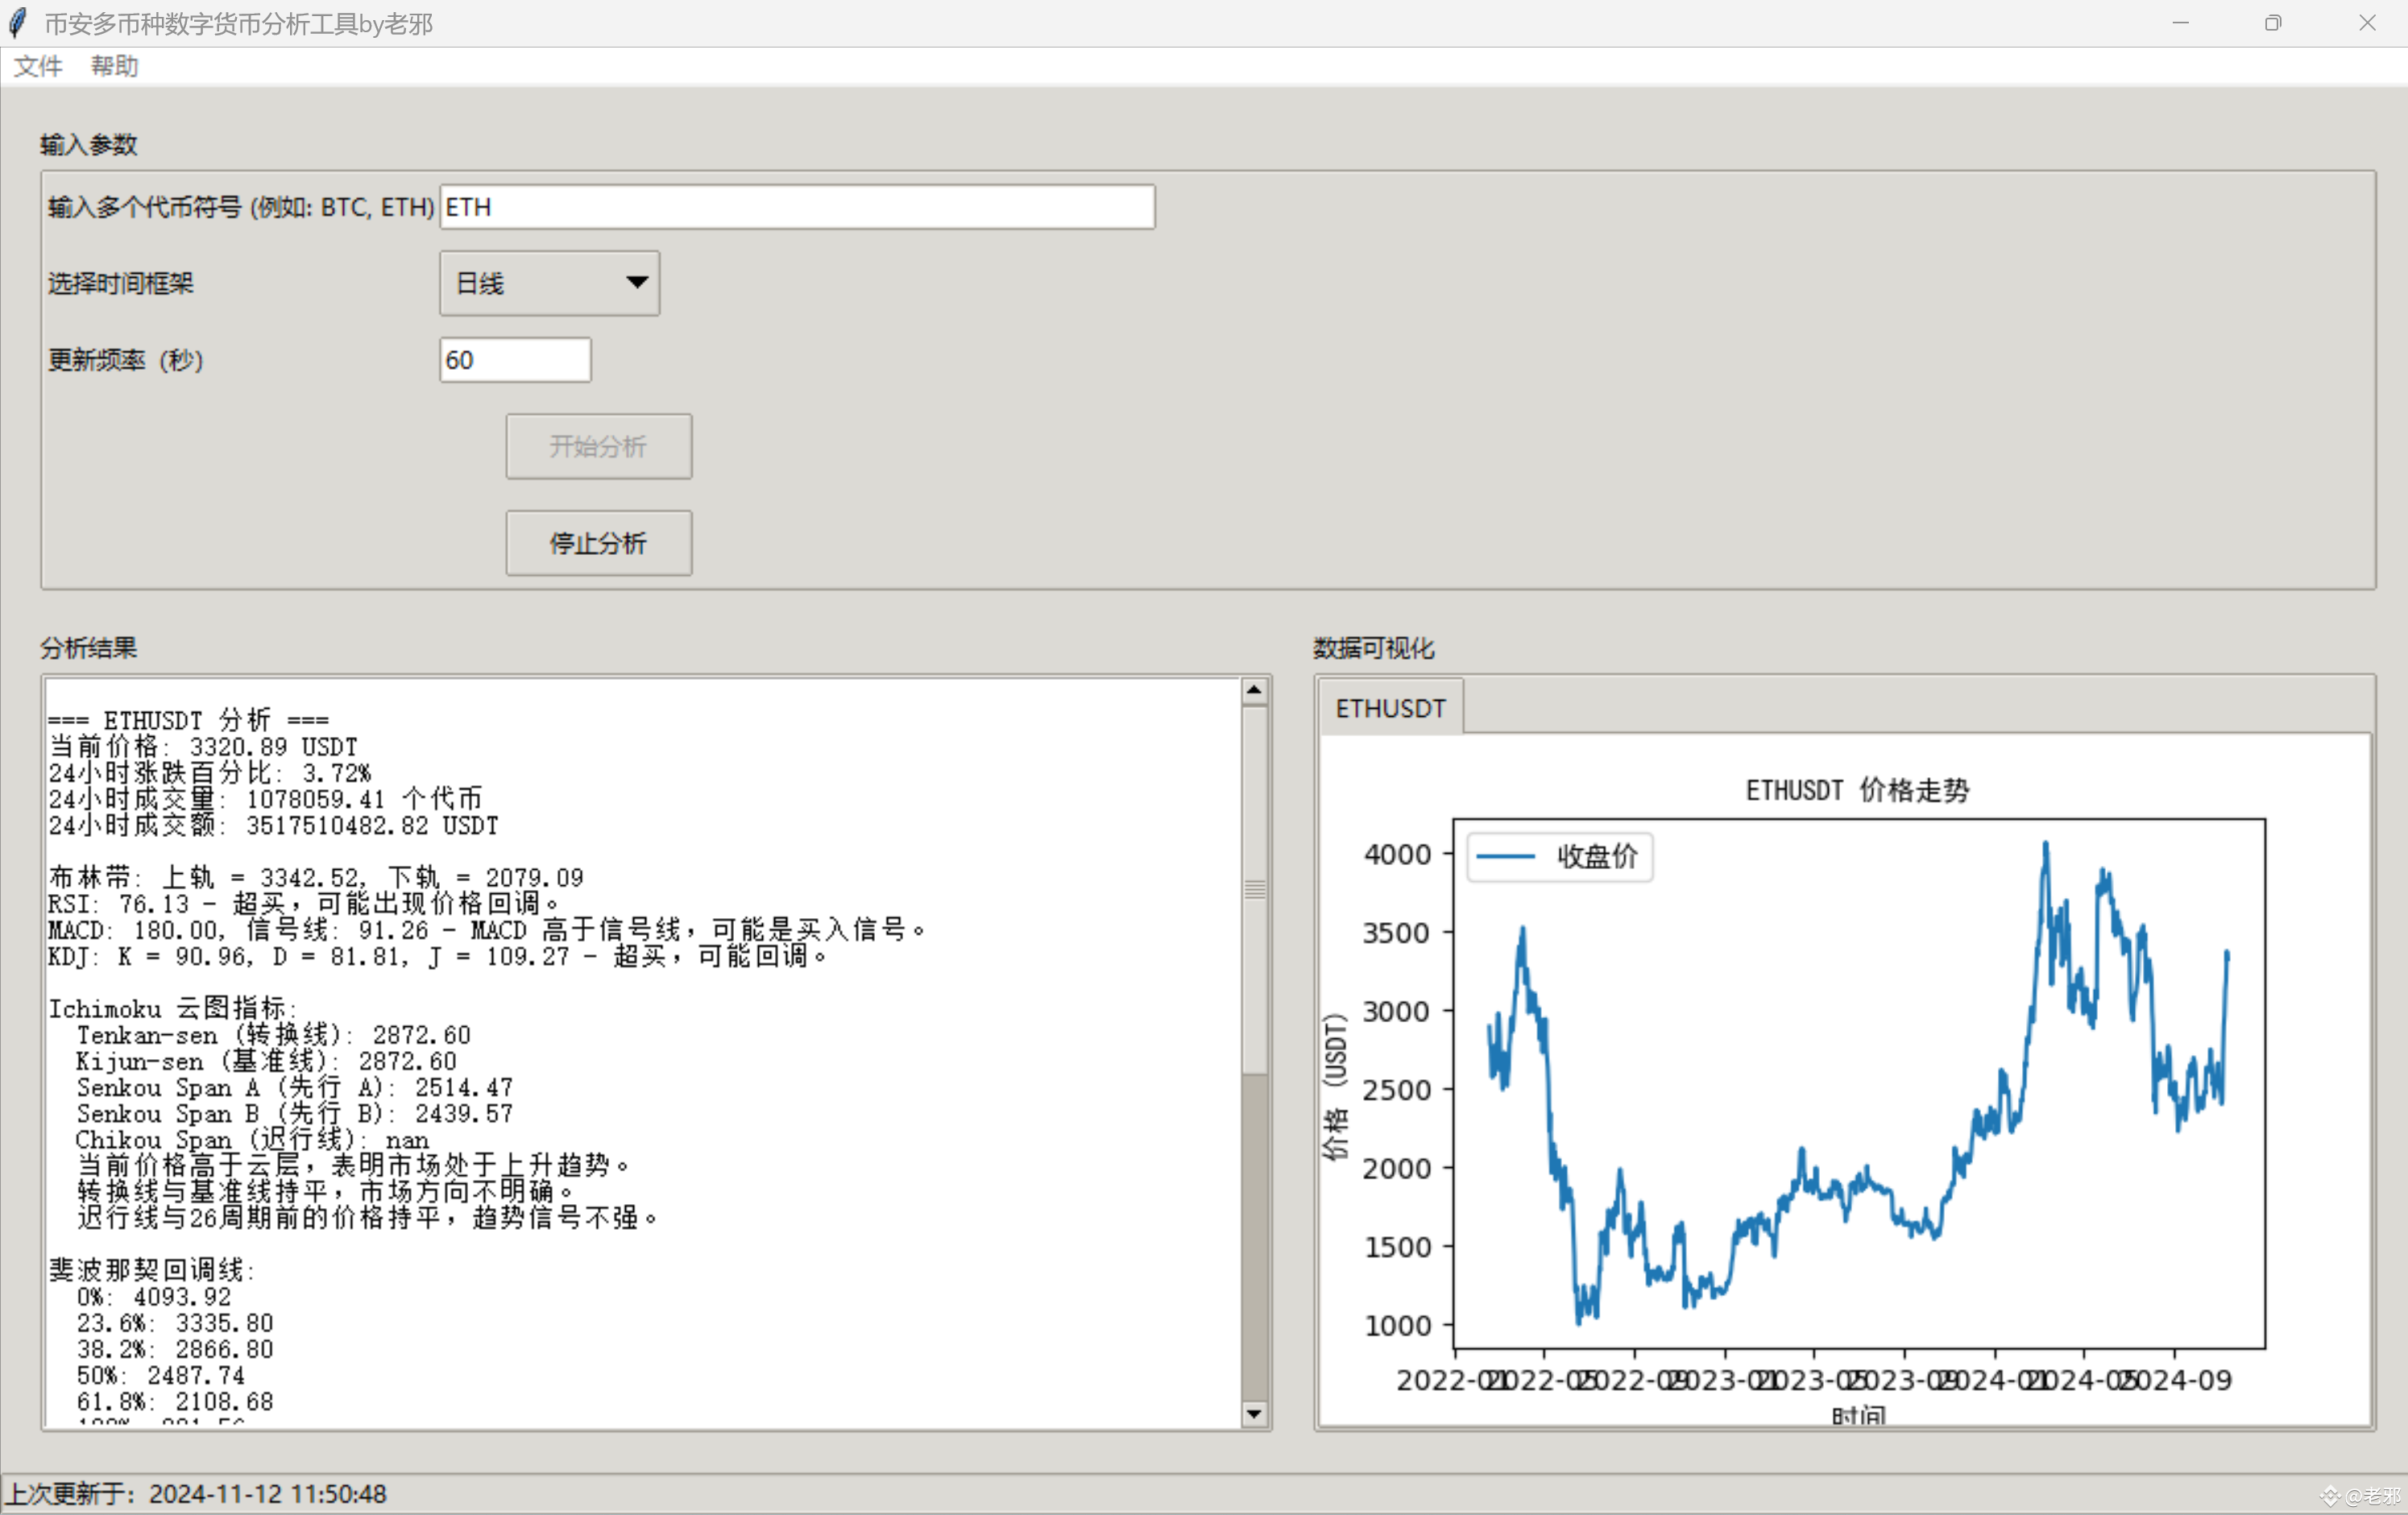
=== ETHUSDT Analysis ===
Current Price: 3320.89 USDT
24-Hour Price Change Percentage: 3.72%
24-Hour Trading Volume: 1078059.41 Tokens
24-Hour Trading Amount: 3517510482.82 USDT
Bollinger Bands: Upper Band = 3342.52, Lower Band = 2079.09
RSI: 76.13 - Overbought, a price correction may occur.
MACD: 180.00, Signal Line: 91.26 - MACD above the signal line, may be a buy signal.
KDJ: K = 90.96, D = 81.81, J = 109.27 - Overbought, may correct.
Ichimoku Cloud Indicator:
Tenkan-sen (Conversion Line): 2872.60
Kijun-sen (Base Line): 2872.60
Senkou Span A (Leading A): 2514.47
Senkou Span B (Leading B): 2439.57
Chikou Span (Lagging Line): nan
Current price is above the cloud, indicating a bullish market trend.
Conversion line and base line are flat, market direction is unclear.
Lagging line is flat with the price 26 periods ago, trend signal is weak.
Fibonacci Retracement Levels:
0%: 4093.92
23.6%: 3335.80
38.2%: 2866.80
50%: 2487.74
61.8%: 2108.68
100%: 881.56
Fibonacci Extension Levels:
100%: 4093.92
161.8%: 6079.16
261.8%: 9291.52
423.6%: 11276.76
Moving Average Crossover Signals (Potential Support and Resistance Levels):
Support Point: 2023-02-09 00:00:00 - 1545.35 USDT
Support Point: 2023-11-21 00:00:00 - 1933.01 USDT
Resistance Point: 2023-09-01 00:00:00 - 1629.12 USDT
Resistance Point: 2024-08-08 00:00:00 - 2682.50 USDT
Pivot Points Support and Resistance Levels:
Pivot Point: 3314.70
Resistance Level 1: 3380.98
Support Level 1: 3254.62
Resistance Level 2: 3441.06
Support Level 2: 3188.34
Resistance Level 3: 3507.34
Support Level 3: 3128.26
Trading Signal: No strong signals
$ETH
=== ETHUSDT Analysis ===
Current Price: 3320.89 USDT
24-Hour Price Change Percentage: 3.72%
24-Hour Trading Volume: 1078059.41 Tokens
24-Hour Trading Amount: 3517510482.82 USDT
Bollinger Bands: Upper Band = 3342.52, Lower Band = 2079.09
RSI: 76.13 - Overbought, a price correction may occur.
MACD: 180.00, Signal Line: 91.26 - MACD above the signal line, may be a buy signal.
KDJ: K = 90.96, D = 81.81, J = 109.27 - Overbought, may correct.
Ichimoku Cloud Indicator:
Tenkan-sen (Conversion Line): 2872.60
Kijun-sen (Base Line): 2872.60
Senkou Span A (Leading A): 2514.47
Senkou Span B (Leading B): 2439.57
Chikou Span (Lagging Line): nan
Current price is above the cloud, indicating a bullish market trend.
Conversion line and base line are flat, market direction is unclear.
Lagging line is flat with the price 26 periods ago, trend signal is weak.
Fibonacci Retracement Levels:
0%: 4093.92
23.6%: 3335.80
38.2%: 2866.80
50%: 2487.74
61.8%: 2108.68
100%: 881.56
Fibonacci Extension Levels:
100%: 4093.92
161.8%: 6079.16
261.8%: 9291.52
423.6%: 11276.76
Moving Average Crossover Signals (Potential Support and Resistance Levels):
Support Point: 2023-02-09 00:00:00 - 1545.35 USDT
Support Point: 2023-11-21 00:00:00 - 1933.01 USDT
Resistance Point: 2023-09-01 00:00:00 - 1629.12 USDT
Resistance Point: 2024-08-08 00:00:00 - 2682.50 USDT
Pivot Points Support and Resistance Levels:
Pivot Point: 3314.70
Resistance Level 1: 3380.98
Support Level 1: 3254.62
Resistance Level 2: 3441.06
Support Level 2: 3188.34
Resistance Level 3: 3507.34
Support Level 3: 3128.26
Trading Signal: No strong signals
=== ETHUSDT Analysis ===
Current Price: 3320.89 USDT
24-Hour Price Change Percentage: 3.72%
24-Hour Trading Volume: 1078059.41 Tokens
24-Hour Trading Amount: 3517510482.82 USDT
Bollinger Bands: Upper Band = 3342.52, Lower Band = 2079.09
RSI: 76.13 - Overbought, a price correction may occur.
MACD: 180.00, Signal Line: 91.26 - MACD above the signal line, may be a buy signal.
KDJ: K = 90.96, D = 81.81, J = 109.27 - Overbought, may correct.
Ichimoku Cloud Indicator:
Tenkan-sen (Conversion Line): 2872.60
Kijun-sen (Base Line): 2872.60
Senkou Span A (Leading A): 2514.47
Senkou Span B (Leading B): 2439.57
Chikou Span (Lagging Line): nan
Current price is above the cloud, indicating a bullish market trend.
Conversion line and base line are flat, market direction is unclear.
Lagging line is flat with the price 26 periods ago, trend signal is weak.
Fibonacci Retracement Levels:
0%: 4093.92
23.6%: 3335.80
38.2%: 2866.80
50%: 2487.74
61.8%: 2108.68
100%: 881.56
Fibonacci Extension Levels:
100%: 4093.92
161.8%: 6079.16
261.8%: 9291.52
423.6%: 11276.76
Moving Average Crossover Signals (Potential Support and Resistance Levels):
Support Point: 2023-02-09 00:00:00 - 1545.35 USDT
Support Point: 2023-11-21 00:00:00 - 1933.01 USDT
Resistance Point: 2023-09-01 00:00:00 - 1629.12 USDT
Resistance Point: 2024-08-08 00:00:00 - 2682.50 USDT
Pivot Points Support and Resistance Levels:
Pivot Point: 3314.70
Resistance Level 1: 3380.98
Support Level 1: 3254.62
Resistance Level 2: 3441.06
Support Level 2: 3188.34
Resistance Level 3: 3507.34
Support Level 3: 3128.26
Trading Signal: No strong signals
140
·
--
Bullish
$BNB
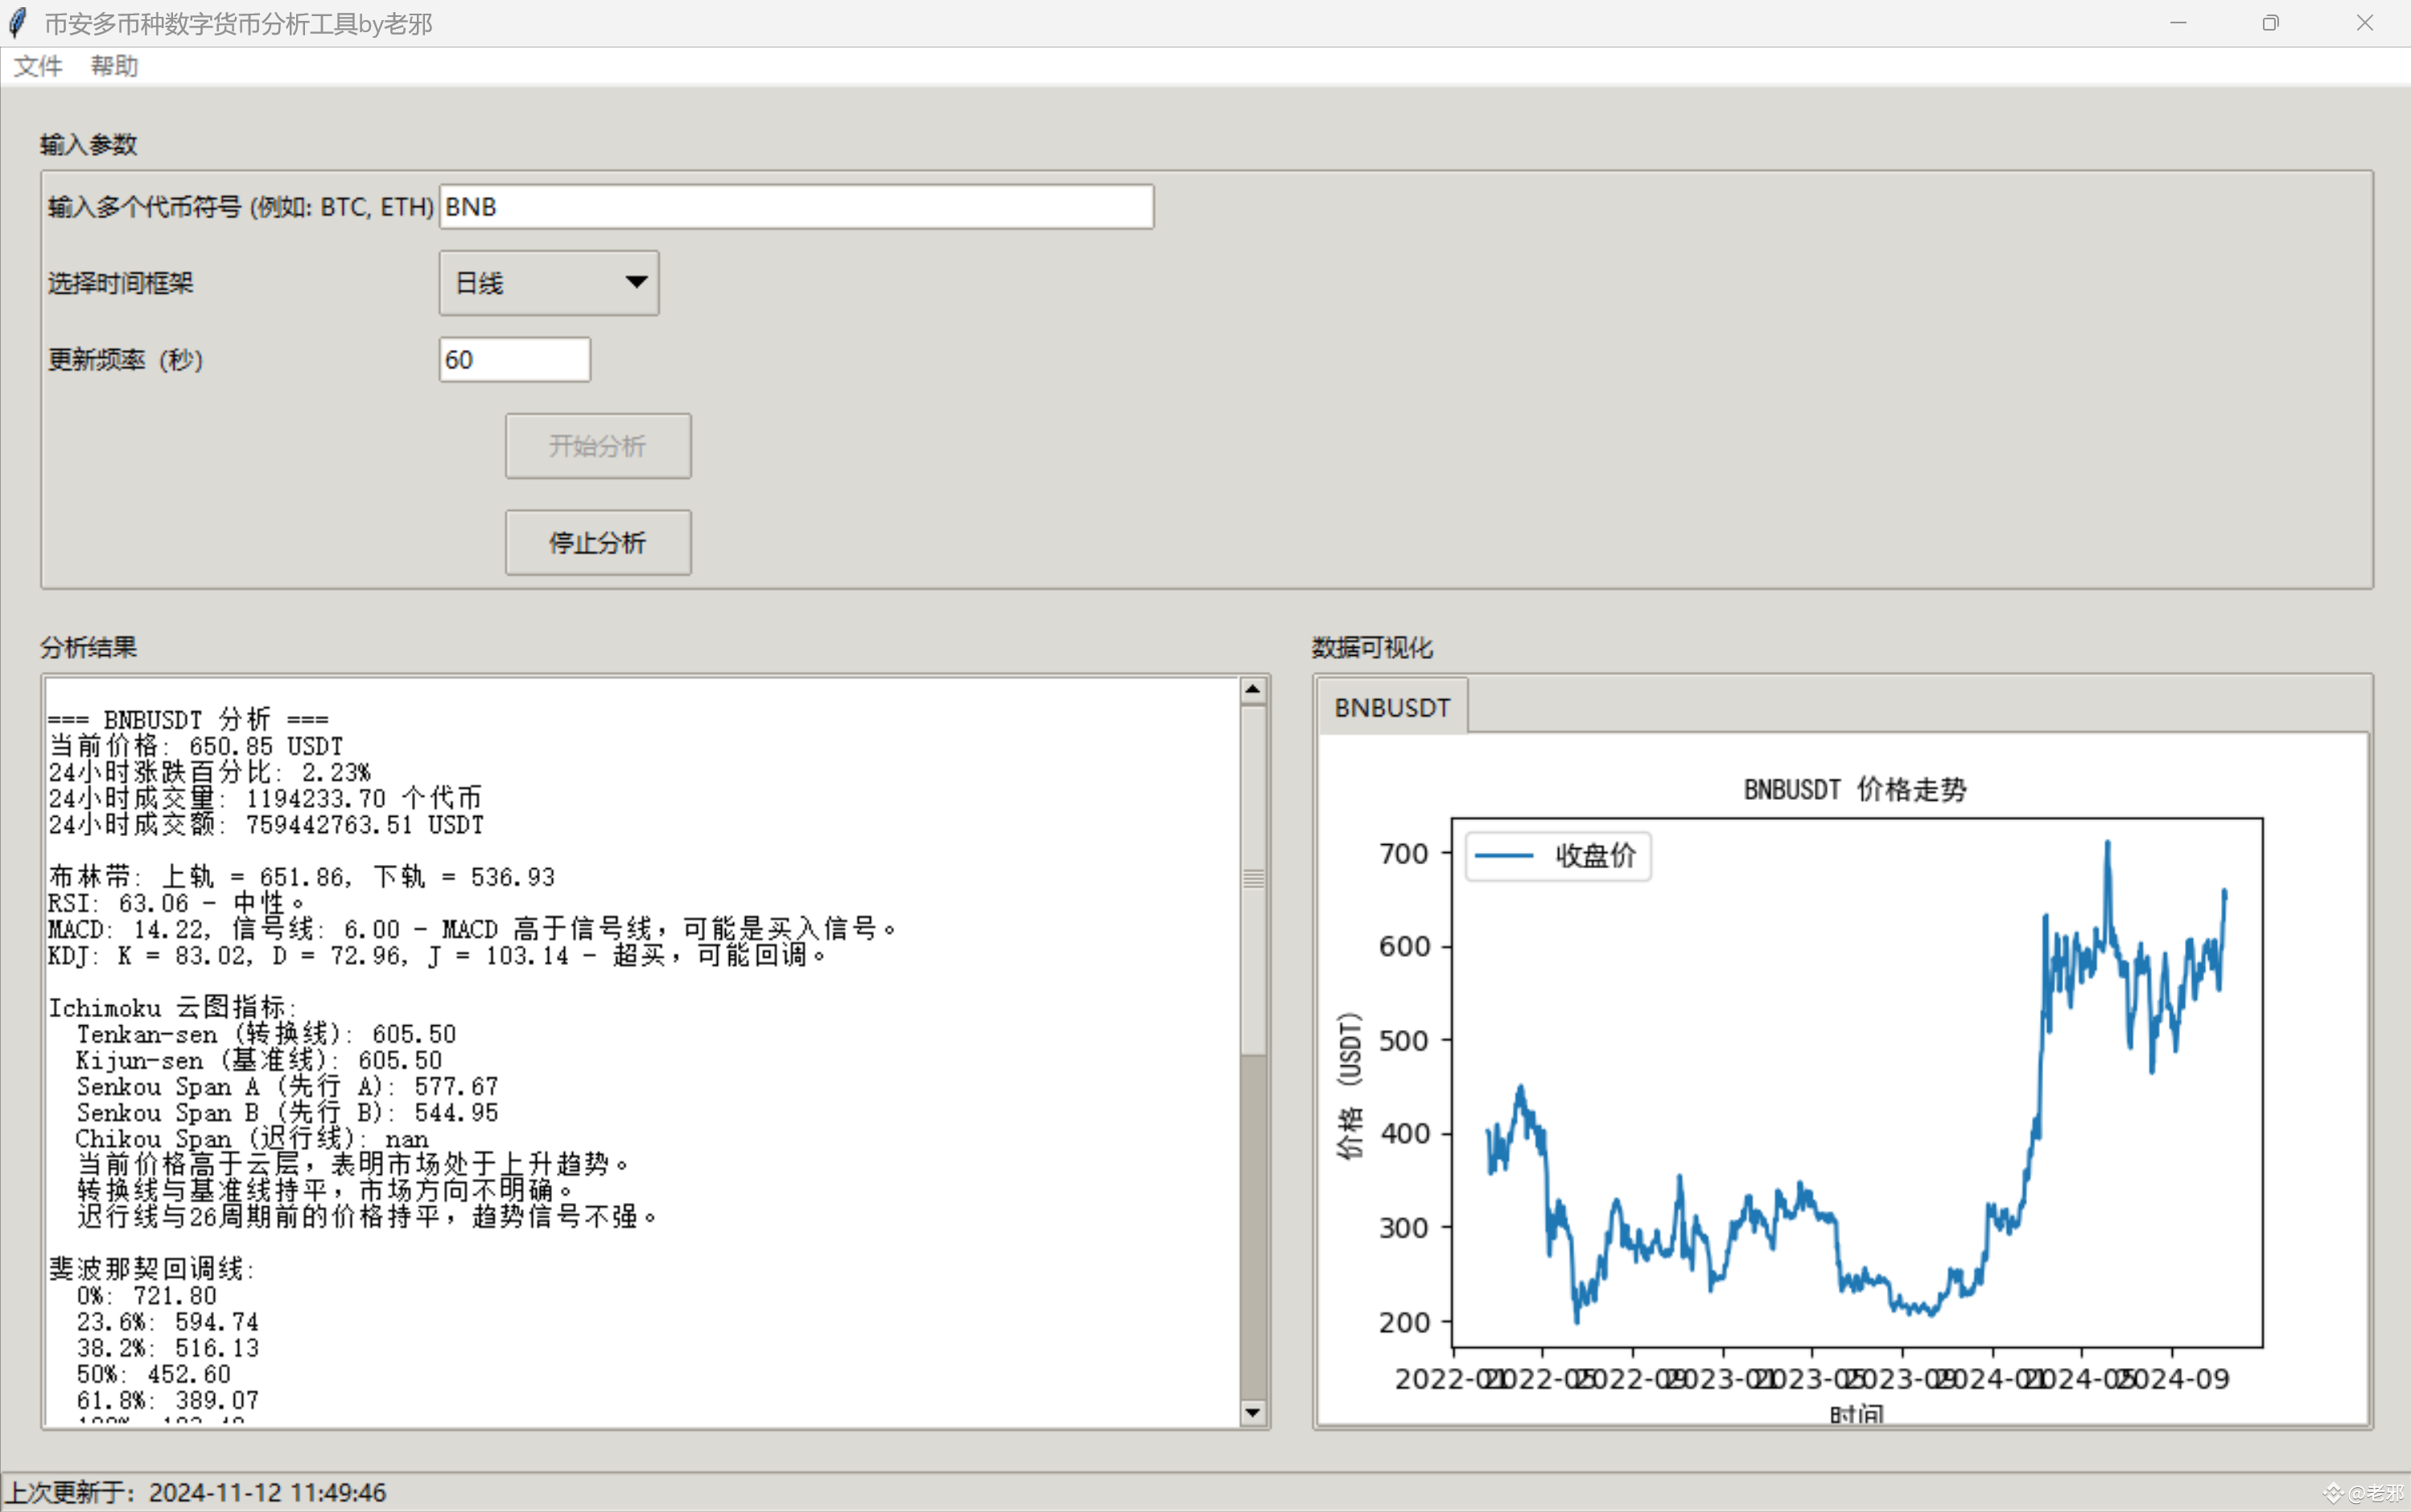
=== BNBUSDT Analysis ===
Current Price: 651.19 USDT
24-hour Change Percentage: 2.35%
24-hour Trading Volume: 1194450.24 Tokens
24-hour Trading Amount: 759569782.02 USDT
Bollinger Bands: Upper Band = 651.95, Lower Band = 536.88
RSI: 63.18 - Neutral.
MACD: 14.25, Signal Line: 6.01 - MACD is above the Signal Line, possibly a buy signal.
KDJ: K = 83.11, D = 72.99, J = 103.35 - Overbought, possible pullback.
Ichimoku Cloud Indicator:
Tenkan-sen (Conversion Line): 605.50
Kijun-sen (Base Line): 605.50
Senkou Span A (Leading A): 577.67
Senkou Span B (Leading B): 544.95
Chikou Span (Lagging Line): nan
Current price is above the cloud, indicating that the market is in an upward trend.
Conversion line and base line are flat, market direction is unclear.
Lagging line is flat with the price 26 periods ago, trend signal is weak.
Fibonacci Retracement Levels:
0%: 721.80
23.6%: 594.74
38.2%: 516.13
50%: 452.60
61.8%: 389.07
100%: 183.40
Fibonacci Extension Levels:
100%: 721.80
161.8%: 1054.53
261.8%: 1592.93
423.6%: 1925.66
Moving Average Crossover Signals (Potential Support and Resistance Levels):
Support Level: 2022-11-08 00:00:00 - 327.40 USDT
Support Level: 2023-02-10 00:00:00 - 305.80 USDT
Support Level: 2023-12-10 00:00:00 - 239.80 USDT
Support Level: 2024-10-27 00:00:00 - 589.20 USDT
Resistance Level: 2022-12-28 00:00:00 - 244.50 USDT
Resistance Level: 2023-06-16 00:00:00 - 239.30 USDT
Resistance Level: 2024-08-30 00:00:00 - 535.20 USDT
Pivot Points Support and Resistance Levels:
Pivot Point: 650.41
Resistance Level 1: 668.18
Support Level 1: 633.43
Resistance Level 2: 685.16
Support Level 2: 615.66
Resistance Level 3: 702.93
Support Level 3: 598.68
Trading Signal: No strong signal
$BNB
=== BNBUSDT Analysis ===
Current Price: 651.19 USDT
24-hour Change Percentage: 2.35%
24-hour Trading Volume: 1194450.24 Tokens
24-hour Trading Amount: 759569782.02 USDT
Bollinger Bands: Upper Band = 651.95, Lower Band = 536.88
RSI: 63.18 - Neutral.
MACD: 14.25, Signal Line: 6.01 - MACD is above the Signal Line, possibly a buy signal.
KDJ: K = 83.11, D = 72.99, J = 103.35 - Overbought, possible pullback.
Ichimoku Cloud Indicator:
Tenkan-sen (Conversion Line): 605.50
Kijun-sen (Base Line): 605.50
Senkou Span A (Leading A): 577.67
Senkou Span B (Leading B): 544.95
Chikou Span (Lagging Line): nan
Current price is above the cloud, indicating that the market is in an upward trend.
Conversion line and base line are flat, market direction is unclear.
Lagging line is flat with the price 26 periods ago, trend signal is weak.
Fibonacci Retracement Levels:
0%: 721.80
23.6%: 594.74
38.2%: 516.13
50%: 452.60
61.8%: 389.07
100%: 183.40
Fibonacci Extension Levels:
100%: 721.80
161.8%: 1054.53
261.8%: 1592.93
423.6%: 1925.66
Moving Average Crossover Signals (Potential Support and Resistance Levels):
Support Level: 2022-11-08 00:00:00 - 327.40 USDT
Support Level: 2023-02-10 00:00:00 - 305.80 USDT
Support Level: 2023-12-10 00:00:00 - 239.80 USDT
Support Level: 2024-10-27 00:00:00 - 589.20 USDT
Resistance Level: 2022-12-28 00:00:00 - 244.50 USDT
Resistance Level: 2023-06-16 00:00:00 - 239.30 USDT
Resistance Level: 2024-08-30 00:00:00 - 535.20 USDT
Pivot Points Support and Resistance Levels:
Pivot Point: 650.41
Resistance Level 1: 668.18
Support Level 1: 633.43
Resistance Level 2: 685.16
Support Level 2: 615.66
Resistance Level 3: 702.93
Support Level 3: 598.68
Trading Signal: No strong signal
=== BNBUSDT Analysis ===
Current Price: 651.19 USDT
24-hour Change Percentage: 2.35%
24-hour Trading Volume: 1194450.24 Tokens
24-hour Trading Amount: 759569782.02 USDT
Bollinger Bands: Upper Band = 651.95, Lower Band = 536.88
RSI: 63.18 - Neutral.
MACD: 14.25, Signal Line: 6.01 - MACD is above the Signal Line, possibly a buy signal.
KDJ: K = 83.11, D = 72.99, J = 103.35 - Overbought, possible pullback.
Ichimoku Cloud Indicator:
Tenkan-sen (Conversion Line): 605.50
Kijun-sen (Base Line): 605.50
Senkou Span A (Leading A): 577.67
Senkou Span B (Leading B): 544.95
Chikou Span (Lagging Line): nan
Current price is above the cloud, indicating that the market is in an upward trend.
Conversion line and base line are flat, market direction is unclear.
Lagging line is flat with the price 26 periods ago, trend signal is weak.
Fibonacci Retracement Levels:
0%: 721.80
23.6%: 594.74
38.2%: 516.13
50%: 452.60
61.8%: 389.07
100%: 183.40
Fibonacci Extension Levels:
100%: 721.80
161.8%: 1054.53
261.8%: 1592.93
423.6%: 1925.66
Moving Average Crossover Signals (Potential Support and Resistance Levels):
Support Level: 2022-11-08 00:00:00 - 327.40 USDT
Support Level: 2023-02-10 00:00:00 - 305.80 USDT
Support Level: 2023-12-10 00:00:00 - 239.80 USDT
Support Level: 2024-10-27 00:00:00 - 589.20 USDT
Resistance Level: 2022-12-28 00:00:00 - 244.50 USDT
Resistance Level: 2023-06-16 00:00:00 - 239.30 USDT
Resistance Level: 2024-08-30 00:00:00 - 535.20 USDT
Pivot Points Support and Resistance Levels:
Pivot Point: 650.41
Resistance Level 1: 668.18
Support Level 1: 633.43
Resistance Level 2: 685.16
Support Level 2: 615.66
Resistance Level 3: 702.93
Support Level 3: 598.68
Trading Signal: No strong signal
1
201
·
--
$SOL SOL Technical Indicator Analysis
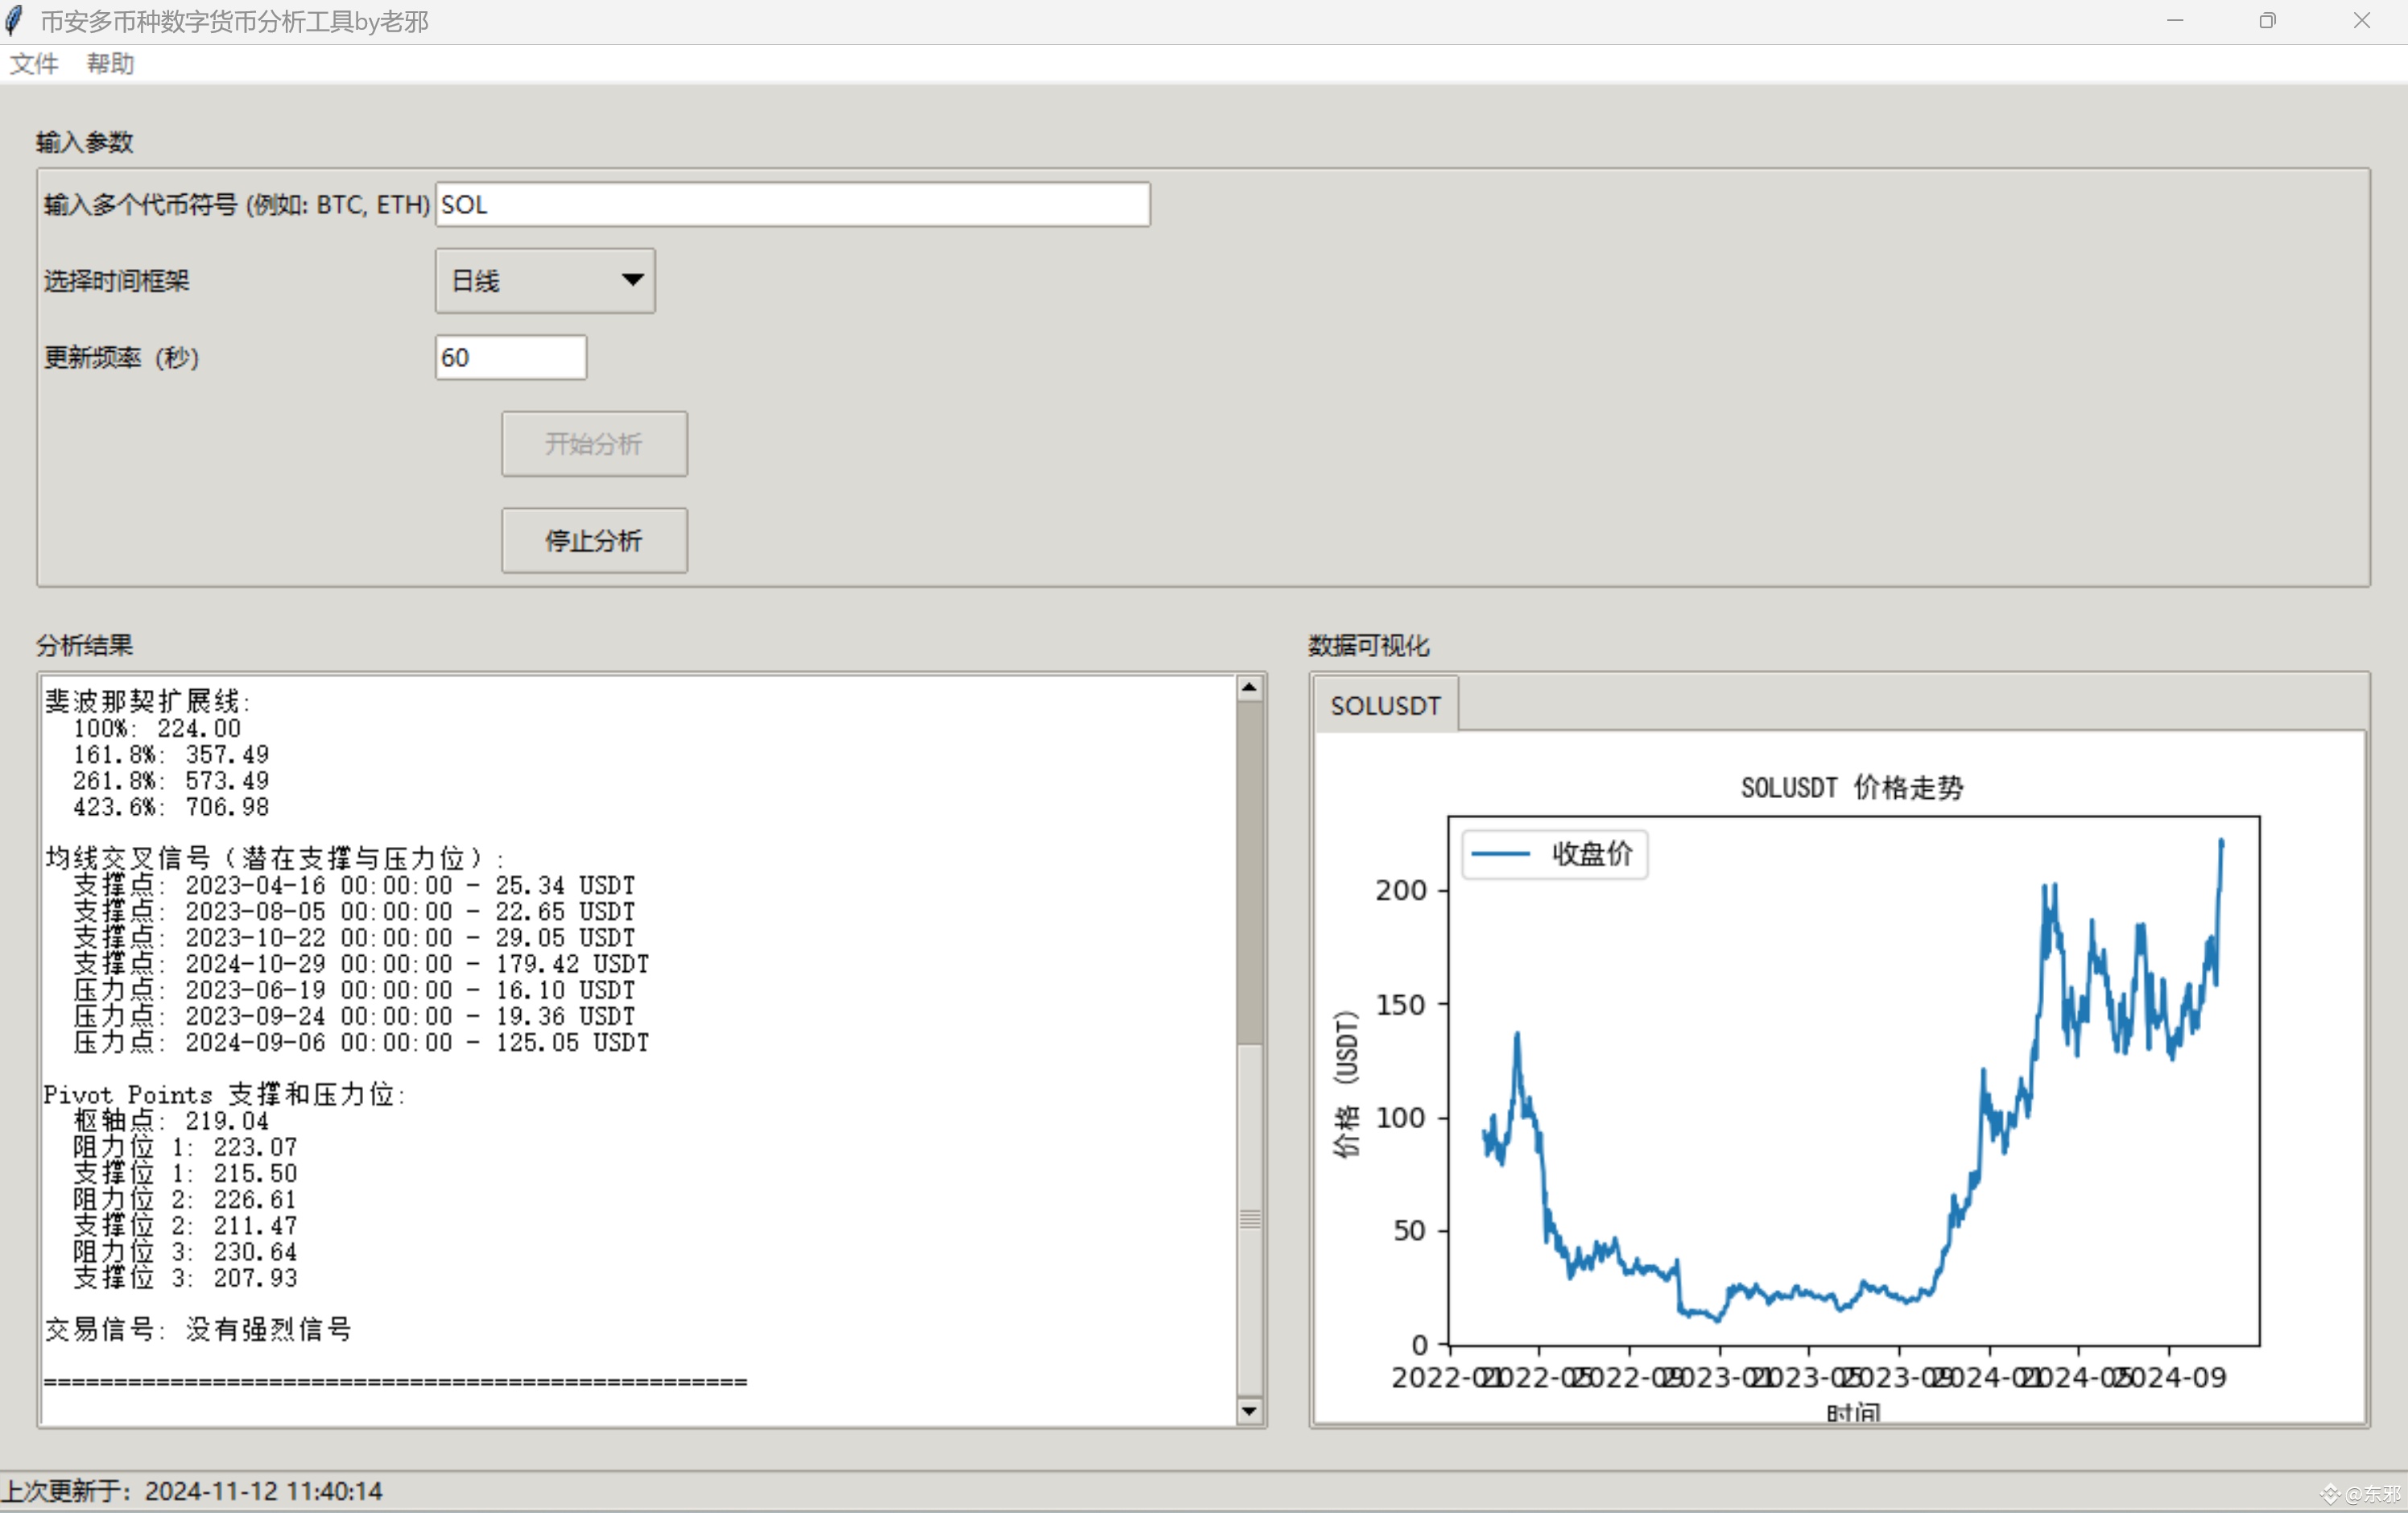
=== SOLUSDT Analysis ===
Current Price: 219.55 USDT
24-Hour Price Change Percentage: 4.63%
24-Hour Trading Volume: 9171888.46 Tokens
24-Hour Trading Amount: 1983863084.40 USDT
Bollinger Bands: Upper Band = 220.86, Lower Band = 143.61
RSI: 72.70 - Overbought, price correction may occur.
MACD: 14.25, Signal Line: 9.66 - MACD above the Signal Line, potential buy signal.
KDJ: K = 89.99, D = 81.96, J = 106.04 - Overbought, correction may occur.
Ichimoku Cloud Indicator:
Tenkan-sen (Conversion Line): 189.56
Kijun-sen (Base Line): 186.78
Senkou Span A (Leading A): 147.53
Senkou Span B (Leading B): 140.89
Chikou Span (Lagging Line): nan
Current price is above the cloud, indicating a bullish market trend.
Conversion line is above the base line, potential buy signal.
Lagging line is flat with the price 26 periods ago, trend signal is weak.
Fibonacci Retracement Levels:
0%: 224.00
23.6%: 173.02
38.2%: 141.49
50%: 116.00
61.8%: 90.51
100%: 8.00
Fibonacci Extension Levels:
100%: 224.00
161.8%: 357.49
261.8%: 573.49
423.6%: 706.98
Moving Average Crossover Signals (Potential Support and Resistance Levels):
Support Point: 2023-04-16 00:00:00 - 25.34 USDT
Support Point: 2023-08-05 00:00:00 - 22.65 USDT
Support Point: 2023-10-22 00:00:00 - 29.05 USDT
Support Point: 2024-10-29 00:00:00 - 179.42 USDT
Resistance Point: 2023-06-19 00:00:00 - 16.10 USDT
Resistance Point: 2023-09-24 00:00:00 - 19.36 USDT
Resistance Point: 2024-09-06 00:00:00 - 125.05 USDT
Pivot Points Support and Resistance Levels:
Pivot Point: 219.04
Resistance Level 1: 223.07
Support Level 1: 215.50
Resistance Level 2: 226.61
Support Level 2: 211.47
Resistance Level 3: 230.64
Support Level 3: 207.93
Trading Signal: No strong signals
$SOL SOL Technical Indicator Analysis
=== SOLUSDT Analysis ===
Current Price: 219.55 USDT
24-Hour Price Change Percentage: 4.63%
24-Hour Trading Volume: 9171888.46 Tokens
24-Hour Trading Amount: 1983863084.40 USDT
Bollinger Bands: Upper Band = 220.86, Lower Band = 143.61
RSI: 72.70 - Overbought, price correction may occur.
MACD: 14.25, Signal Line: 9.66 - MACD above the Signal Line, potential buy signal.
KDJ: K = 89.99, D = 81.96, J = 106.04 - Overbought, correction may occur.
Ichimoku Cloud Indicator:
Tenkan-sen (Conversion Line): 189.56
Kijun-sen (Base Line): 186.78
Senkou Span A (Leading A): 147.53
Senkou Span B (Leading B): 140.89
Chikou Span (Lagging Line): nan
Current price is above the cloud, indicating a bullish market trend.
Conversion line is above the base line, potential buy signal.
Lagging line is flat with the price 26 periods ago, trend signal is weak.
Fibonacci Retracement Levels:
0%: 224.00
23.6%: 173.02
38.2%: 141.49
50%: 116.00
61.8%: 90.51
100%: 8.00
Fibonacci Extension Levels:
100%: 224.00
161.8%: 357.49
261.8%: 573.49
423.6%: 706.98
Moving Average Crossover Signals (Potential Support and Resistance Levels):
Support Point: 2023-04-16 00:00:00 - 25.34 USDT
Support Point: 2023-08-05 00:00:00 - 22.65 USDT
Support Point: 2023-10-22 00:00:00 - 29.05 USDT
Support Point: 2024-10-29 00:00:00 - 179.42 USDT
Resistance Point: 2023-06-19 00:00:00 - 16.10 USDT
Resistance Point: 2023-09-24 00:00:00 - 19.36 USDT
Resistance Point: 2024-09-06 00:00:00 - 125.05 USDT
Pivot Points Support and Resistance Levels:
Pivot Point: 219.04
Resistance Level 1: 223.07
Support Level 1: 215.50
Resistance Level 2: 226.61
Support Level 2: 211.47
Resistance Level 3: 230.64
Support Level 3: 207.93
Trading Signal: No strong signals
=== SOLUSDT Analysis ===
Current Price: 219.55 USDT
24-Hour Price Change Percentage: 4.63%
24-Hour Trading Volume: 9171888.46 Tokens
24-Hour Trading Amount: 1983863084.40 USDT
Bollinger Bands: Upper Band = 220.86, Lower Band = 143.61
RSI: 72.70 - Overbought, price correction may occur.
MACD: 14.25, Signal Line: 9.66 - MACD above the Signal Line, potential buy signal.
KDJ: K = 89.99, D = 81.96, J = 106.04 - Overbought, correction may occur.
Ichimoku Cloud Indicator:
Tenkan-sen (Conversion Line): 189.56
Kijun-sen (Base Line): 186.78
Senkou Span A (Leading A): 147.53
Senkou Span B (Leading B): 140.89
Chikou Span (Lagging Line): nan
Current price is above the cloud, indicating a bullish market trend.
Conversion line is above the base line, potential buy signal.
Lagging line is flat with the price 26 periods ago, trend signal is weak.
Fibonacci Retracement Levels:
0%: 224.00
23.6%: 173.02
38.2%: 141.49
50%: 116.00
61.8%: 90.51
100%: 8.00
Fibonacci Extension Levels:
100%: 224.00
161.8%: 357.49
261.8%: 573.49
423.6%: 706.98
Moving Average Crossover Signals (Potential Support and Resistance Levels):
Support Point: 2023-04-16 00:00:00 - 25.34 USDT
Support Point: 2023-08-05 00:00:00 - 22.65 USDT
Support Point: 2023-10-22 00:00:00 - 29.05 USDT
Support Point: 2024-10-29 00:00:00 - 179.42 USDT
Resistance Point: 2023-06-19 00:00:00 - 16.10 USDT
Resistance Point: 2023-09-24 00:00:00 - 19.36 USDT
Resistance Point: 2024-09-06 00:00:00 - 125.05 USDT
Pivot Points Support and Resistance Levels:
Pivot Point: 219.04
Resistance Level 1: 223.07
Support Level 1: 215.50
Resistance Level 2: 226.61
Support Level 2: 211.47
Resistance Level 3: 230.64
Support Level 3: 207.93
Trading Signal: No strong signals
168
Log in to explore more content
Join global crypto users on Binance Square
⚡️ Get latest and useful information about crypto.
💬 Trusted by the world’s largest crypto exchange.
👍 Discover real insights from verified creators.
Email / Phone number
Trending Topics
BinanceReopensWithdrawalsForHYPE&APT
16,797 views
342 Discussing
Binance Re-Enables Withdrawals for HYPE and APT, Extends List of Restored Assets
Binance News
·12 Likes
·7.3k views
SouthKoreaDraftLawTargets15To20%ShareholderCap
21,334 views
256 Discussing
TradFiForBeginners
129,200 views
1,371 Discussing