$BNB
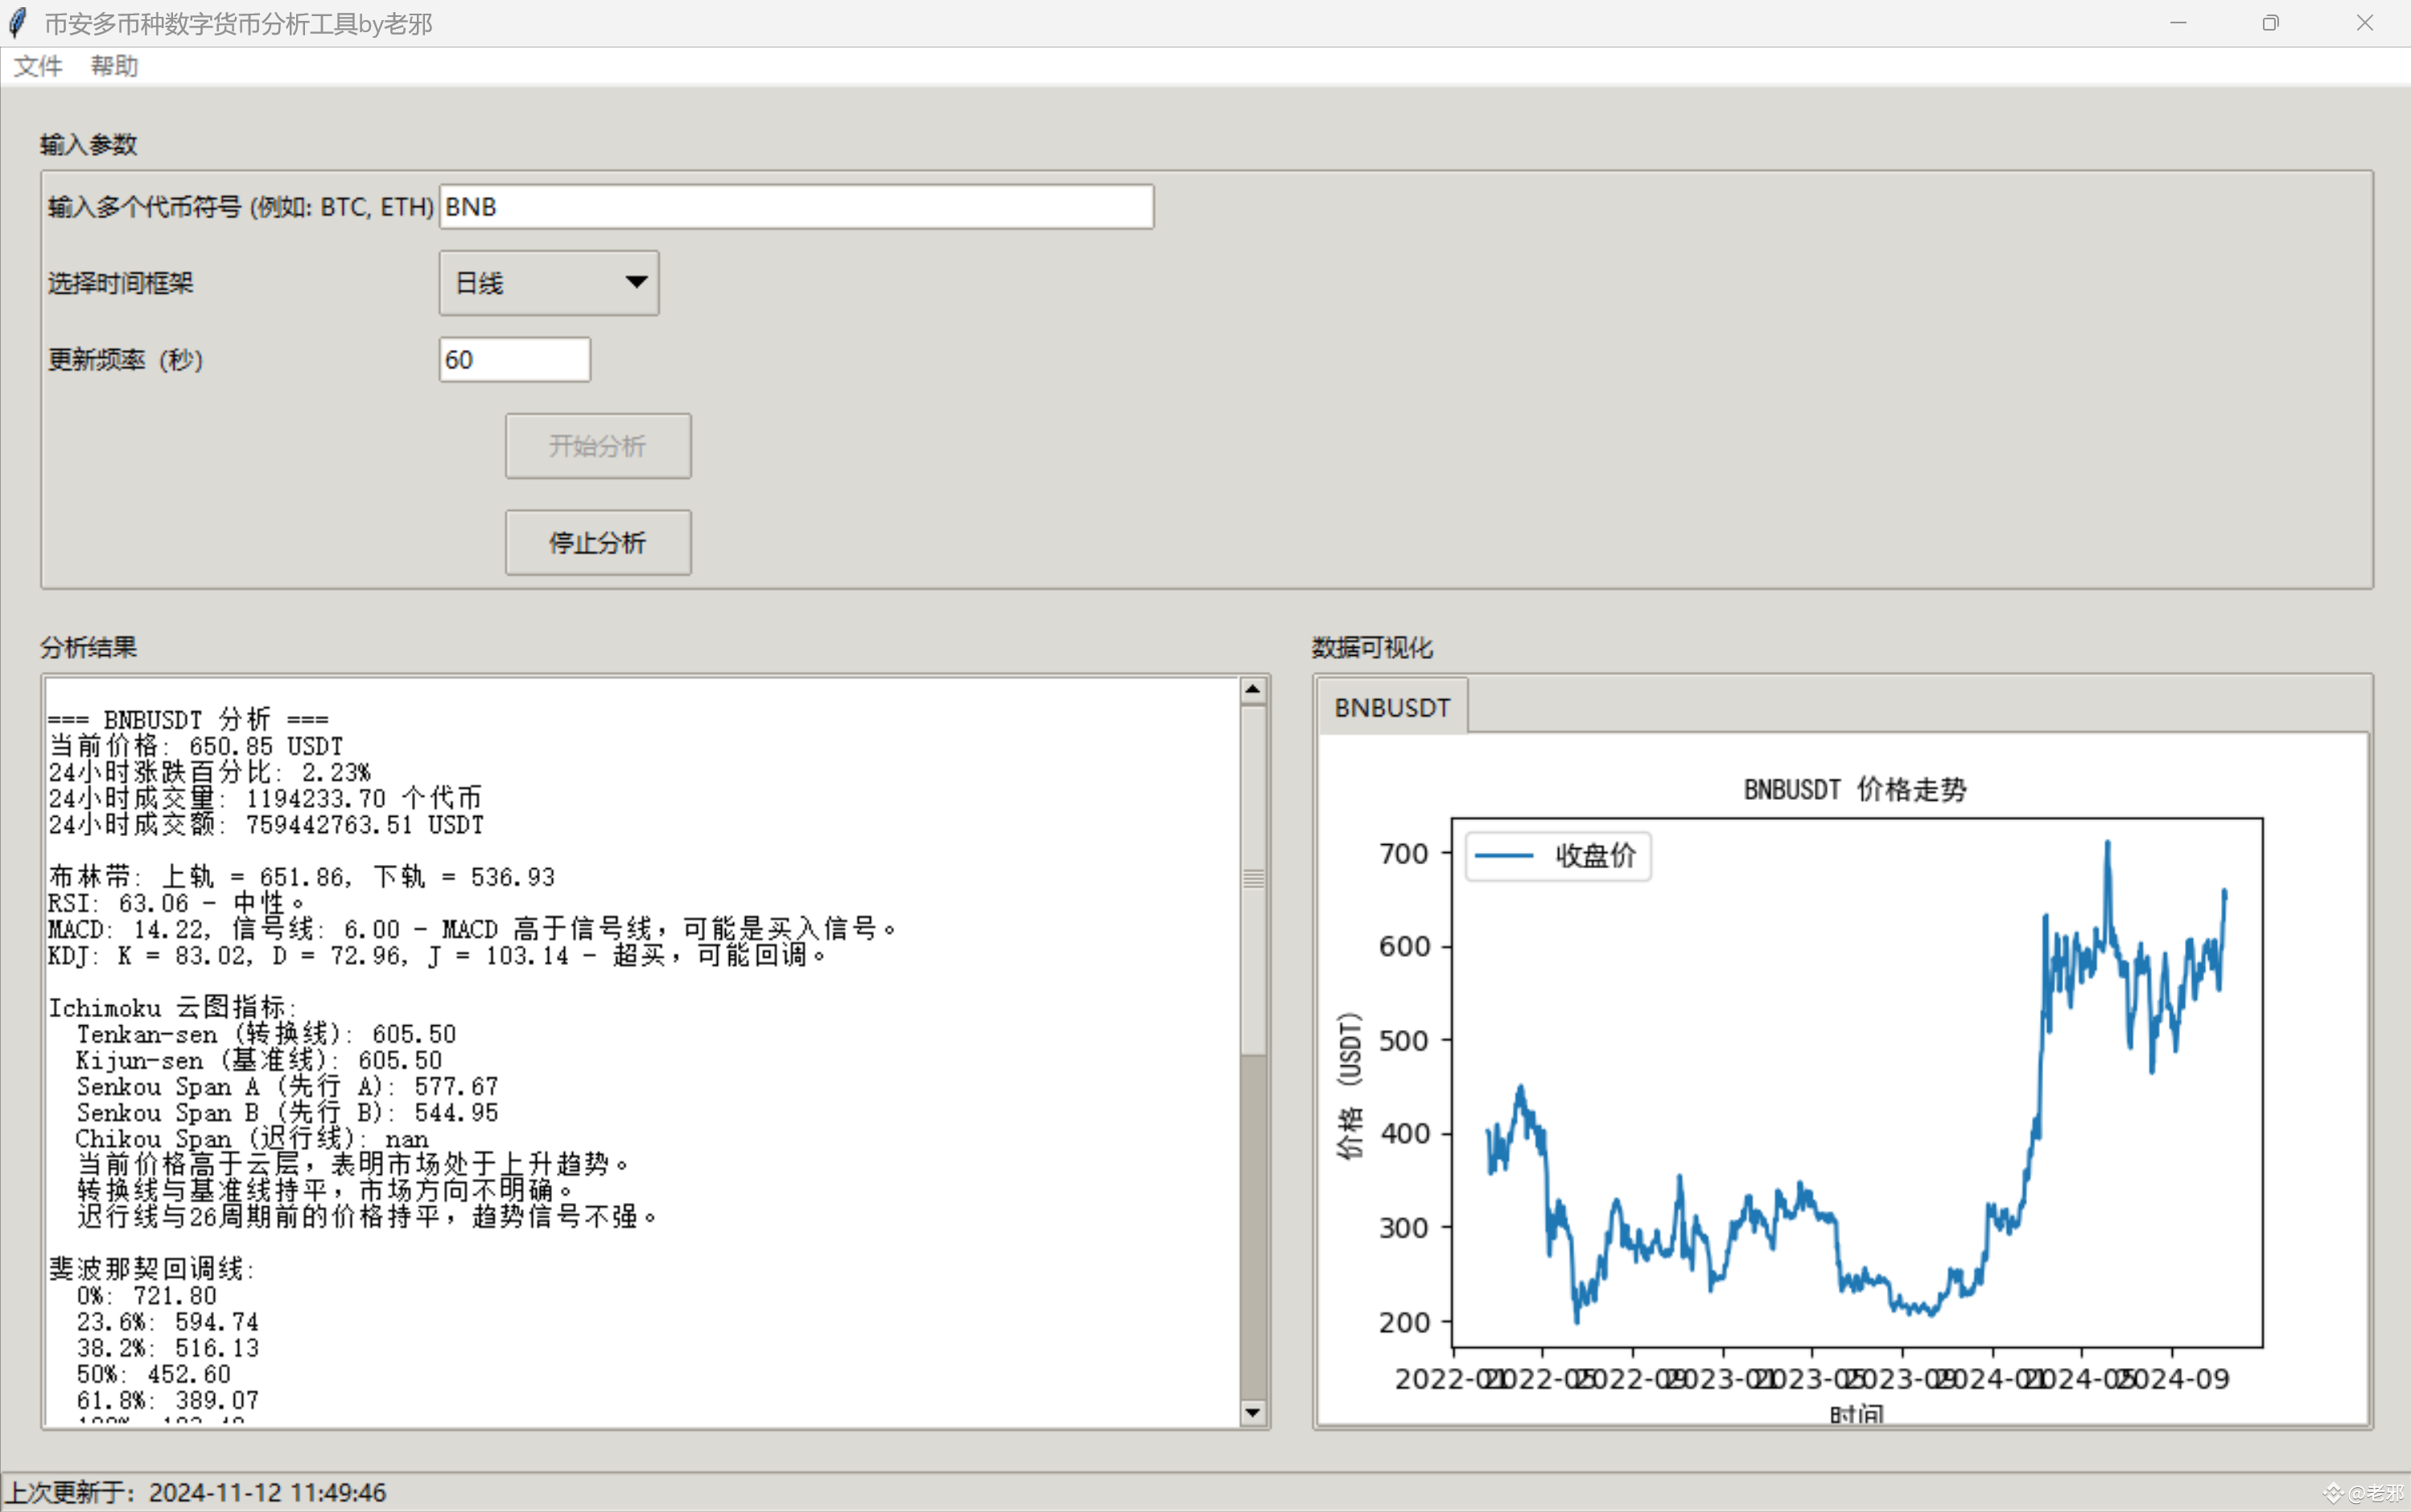
=== BNBUSDT Analysis ===
Current Price: 651.19 USDT
24-hour Change Percentage: 2.35%
24-hour Trading Volume: 1194450.24 Tokens
24-hour Trading Amount: 759569782.02 USDT
Bollinger Bands: Upper Band = 651.95, Lower Band = 536.88
RSI: 63.18 - Neutral.
MACD: 14.25, Signal Line: 6.01 - MACD is above the Signal Line, possibly a buy signal.
KDJ: K = 83.11, D = 72.99, J = 103.35 - Overbought, possible pullback.
Ichimoku Cloud Indicator:
Tenkan-sen (Conversion Line): 605.50
Kijun-sen (Base Line): 605.50
Senkou Span A (Leading A): 577.67
Senkou Span B (Leading B): 544.95
Chikou Span (Lagging Line): nan
Current price is above the cloud, indicating that the market is in an upward trend.
Conversion line and base line are flat, market direction is unclear.
Lagging line is flat with the price 26 periods ago, trend signal is weak.
Fibonacci Retracement Levels:
0%: 721.80
23.6%: 594.74
38.2%: 516.13
50%: 452.60
61.8%: 389.07
100%: 183.40
Fibonacci Extension Levels:
100%: 721.80
161.8%: 1054.53
261.8%: 1592.93
423.6%: 1925.66
Moving Average Crossover Signals (Potential Support and Resistance Levels):
Support Level: 2022-11-08 00:00:00 - 327.40 USDT
Support Level: 2023-02-10 00:00:00 - 305.80 USDT
Support Level: 2023-12-10 00:00:00 - 239.80 USDT
Support Level: 2024-10-27 00:00:00 - 589.20 USDT
Resistance Level: 2022-12-28 00:00:00 - 244.50 USDT
Resistance Level: 2023-06-16 00:00:00 - 239.30 USDT
Resistance Level: 2024-08-30 00:00:00 - 535.20 USDT
Pivot Points Support and Resistance Levels:
Pivot Point: 650.41
Resistance Level 1: 668.18
Support Level 1: 633.43
Resistance Level 2: 685.16
Support Level 2: 615.66
Resistance Level 3: 702.93
Support Level 3: 598.68
Trading Signal: No strong signal
=== BNBUSDT Analysis ===
Current Price: 651.19 USDT
24-hour Change Percentage: 2.35%
24-hour Trading Volume: 1194450.24 Tokens
24-hour Trading Amount: 759569782.02 USDT
Bollinger Bands: Upper Band = 651.95, Lower Band = 536.88
RSI: 63.18 - Neutral.
MACD: 14.25, Signal Line: 6.01 - MACD is above the Signal Line, possibly a buy signal.
KDJ: K = 83.11, D = 72.99, J = 103.35 - Overbought, possible pullback.
Ichimoku Cloud Indicator:
Tenkan-sen (Conversion Line): 605.50
Kijun-sen (Base Line): 605.50
Senkou Span A (Leading A): 577.67
Senkou Span B (Leading B): 544.95
Chikou Span (Lagging Line): nan
Current price is above the cloud, indicating that the market is in an upward trend.
Conversion line and base line are flat, market direction is unclear.
Lagging line is flat with the price 26 periods ago, trend signal is weak.
Fibonacci Retracement Levels:
0%: 721.80
23.6%: 594.74
38.2%: 516.13
50%: 452.60
61.8%: 389.07
100%: 183.40
Fibonacci Extension Levels:
100%: 721.80
161.8%: 1054.53
261.8%: 1592.93
423.6%: 1925.66
Moving Average Crossover Signals (Potential Support and Resistance Levels):
Support Level: 2022-11-08 00:00:00 - 327.40 USDT
Support Level: 2023-02-10 00:00:00 - 305.80 USDT
Support Level: 2023-12-10 00:00:00 - 239.80 USDT
Support Level: 2024-10-27 00:00:00 - 589.20 USDT
Resistance Level: 2022-12-28 00:00:00 - 244.50 USDT
Resistance Level: 2023-06-16 00:00:00 - 239.30 USDT
Resistance Level: 2024-08-30 00:00:00 - 535.20 USDT
Pivot Points Support and Resistance Levels:
Pivot Point: 650.41
Resistance Level 1: 668.18
Support Level 1: 633.43
Resistance Level 2: 685.16
Support Level 2: 615.66
Resistance Level 3: 702.93
Support Level 3: 598.68
Trading Signal: No strong signal