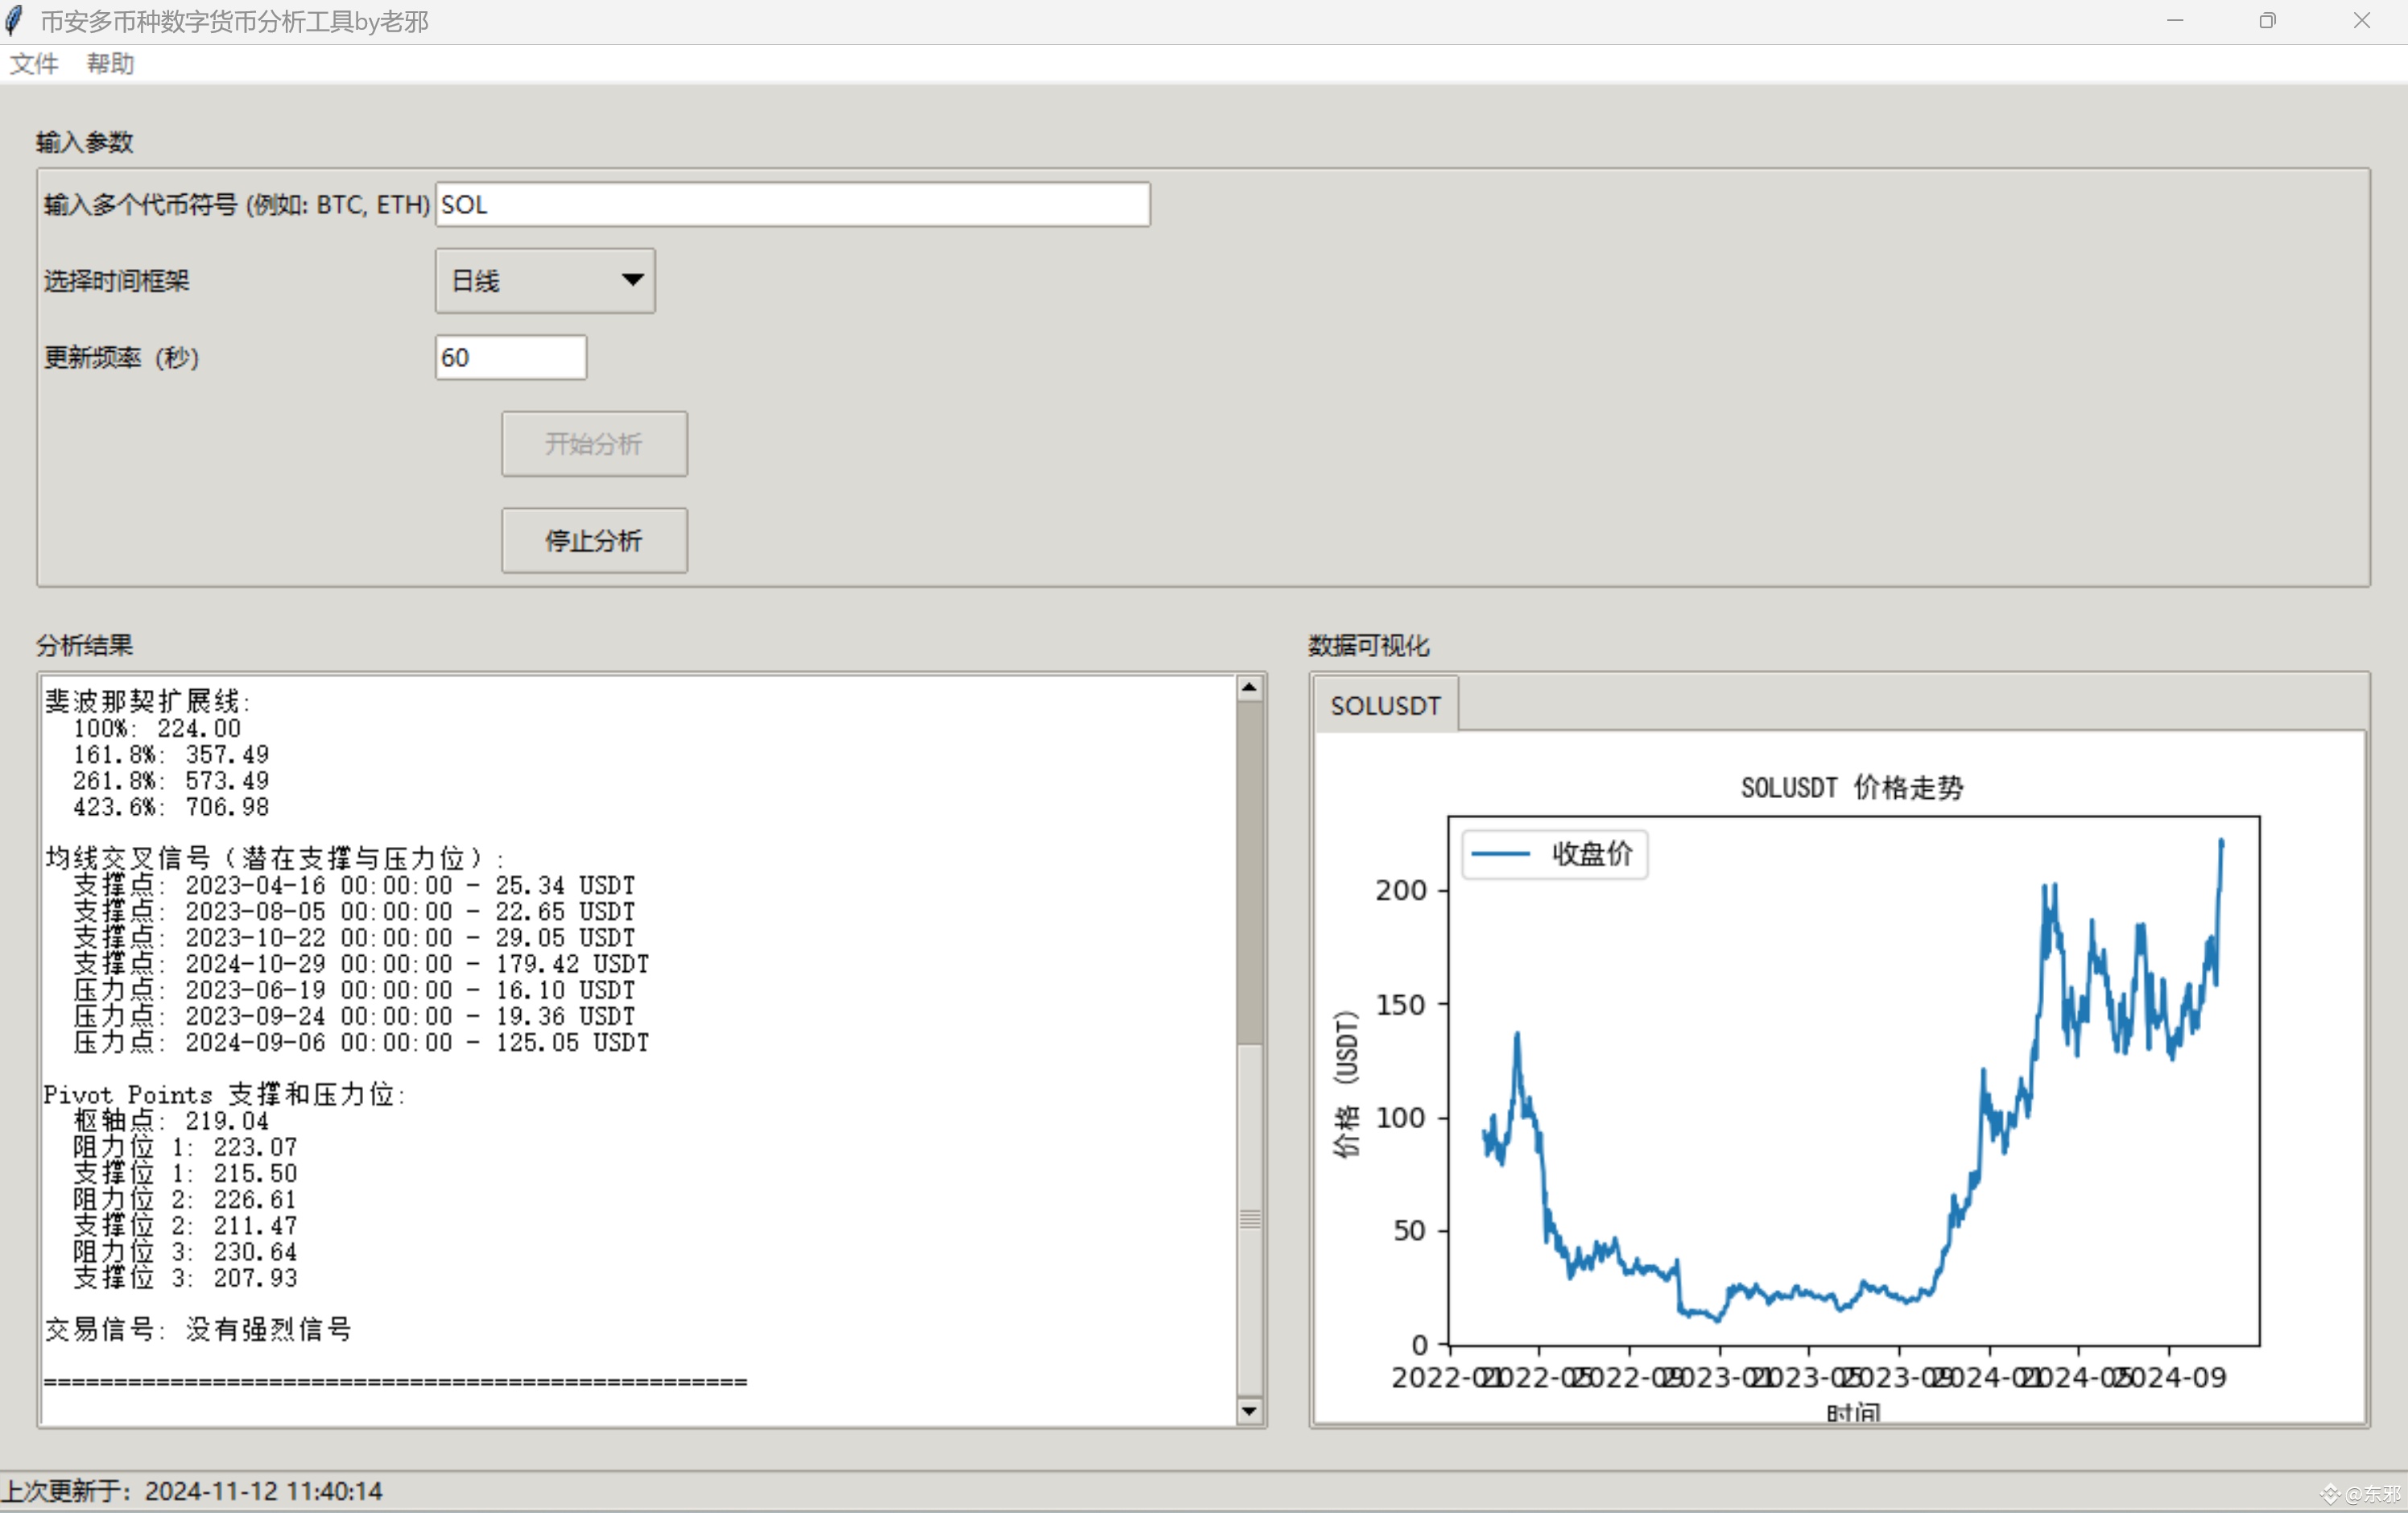
$SOL SOL Technical Indicator Analysis
=== SOLUSDT Analysis ===
Current Price: 219.55 USDT
24-Hour Price Change Percentage: 4.63%
24-Hour Trading Volume: 9171888.46 Tokens
24-Hour Trading Amount: 1983863084.40 USDT
Bollinger Bands: Upper Band = 220.86, Lower Band = 143.61
RSI: 72.70 - Overbought, price correction may occur.
MACD: 14.25, Signal Line: 9.66 - MACD above the Signal Line, potential buy signal.
KDJ: K = 89.99, D = 81.96, J = 106.04 - Overbought, correction may occur.
Ichimoku Cloud Indicator:
Tenkan-sen (Conversion Line): 189.56
Kijun-sen (Base Line): 186.78
Senkou Span A (Leading A): 147.53
Senkou Span B (Leading B): 140.89
Chikou Span (Lagging Line): nan
Current price is above the cloud, indicating a bullish market trend.
Conversion line is above the base line, potential buy signal.
Lagging line is flat with the price 26 periods ago, trend signal is weak.
Fibonacci Retracement Levels:
0%: 224.00
23.6%: 173.02
38.2%: 141.49
50%: 116.00
61.8%: 90.51
100%: 8.00
Fibonacci Extension Levels:
100%: 224.00
161.8%: 357.49
261.8%: 573.49
423.6%: 706.98
Moving Average Crossover Signals (Potential Support and Resistance Levels):
Support Point: 2023-04-16 00:00:00 - 25.34 USDT
Support Point: 2023-08-05 00:00:00 - 22.65 USDT
Support Point: 2023-10-22 00:00:00 - 29.05 USDT
Support Point: 2024-10-29 00:00:00 - 179.42 USDT
Resistance Point: 2023-06-19 00:00:00 - 16.10 USDT
Resistance Point: 2023-09-24 00:00:00 - 19.36 USDT
Resistance Point: 2024-09-06 00:00:00 - 125.05 USDT
Pivot Points Support and Resistance Levels:
Pivot Point: 219.04
Resistance Level 1: 223.07
Support Level 1: 215.50
Resistance Level 2: 226.61
Support Level 2: 211.47
Resistance Level 3: 230.64
Support Level 3: 207.93
Trading Signal: No strong signals
=== SOLUSDT Analysis ===
Current Price: 219.55 USDT
24-Hour Price Change Percentage: 4.63%
24-Hour Trading Volume: 9171888.46 Tokens
24-Hour Trading Amount: 1983863084.40 USDT
Bollinger Bands: Upper Band = 220.86, Lower Band = 143.61
RSI: 72.70 - Overbought, price correction may occur.
MACD: 14.25, Signal Line: 9.66 - MACD above the Signal Line, potential buy signal.
KDJ: K = 89.99, D = 81.96, J = 106.04 - Overbought, correction may occur.
Ichimoku Cloud Indicator:
Tenkan-sen (Conversion Line): 189.56
Kijun-sen (Base Line): 186.78
Senkou Span A (Leading A): 147.53
Senkou Span B (Leading B): 140.89
Chikou Span (Lagging Line): nan
Current price is above the cloud, indicating a bullish market trend.
Conversion line is above the base line, potential buy signal.
Lagging line is flat with the price 26 periods ago, trend signal is weak.
Fibonacci Retracement Levels:
0%: 224.00
23.6%: 173.02
38.2%: 141.49
50%: 116.00
61.8%: 90.51
100%: 8.00
Fibonacci Extension Levels:
100%: 224.00
161.8%: 357.49
261.8%: 573.49
423.6%: 706.98
Moving Average Crossover Signals (Potential Support and Resistance Levels):
Support Point: 2023-04-16 00:00:00 - 25.34 USDT
Support Point: 2023-08-05 00:00:00 - 22.65 USDT
Support Point: 2023-10-22 00:00:00 - 29.05 USDT
Support Point: 2024-10-29 00:00:00 - 179.42 USDT
Resistance Point: 2023-06-19 00:00:00 - 16.10 USDT
Resistance Point: 2023-09-24 00:00:00 - 19.36 USDT
Resistance Point: 2024-09-06 00:00:00 - 125.05 USDT
Pivot Points Support and Resistance Levels:
Pivot Point: 219.04
Resistance Level 1: 223.07
Support Level 1: 215.50
Resistance Level 2: 226.61
Support Level 2: 211.47
Resistance Level 3: 230.64
Support Level 3: 207.93
Trading Signal: No strong signals