

老吴ETH
175 Posts

老吴ETH
Report
Block User
我叫噜噜!每天分享不同新闻资讯!感谢点赞关注
Frequent Trader
1.6 Years
5 Following
572 Followers
858 Liked
Posts
·
--
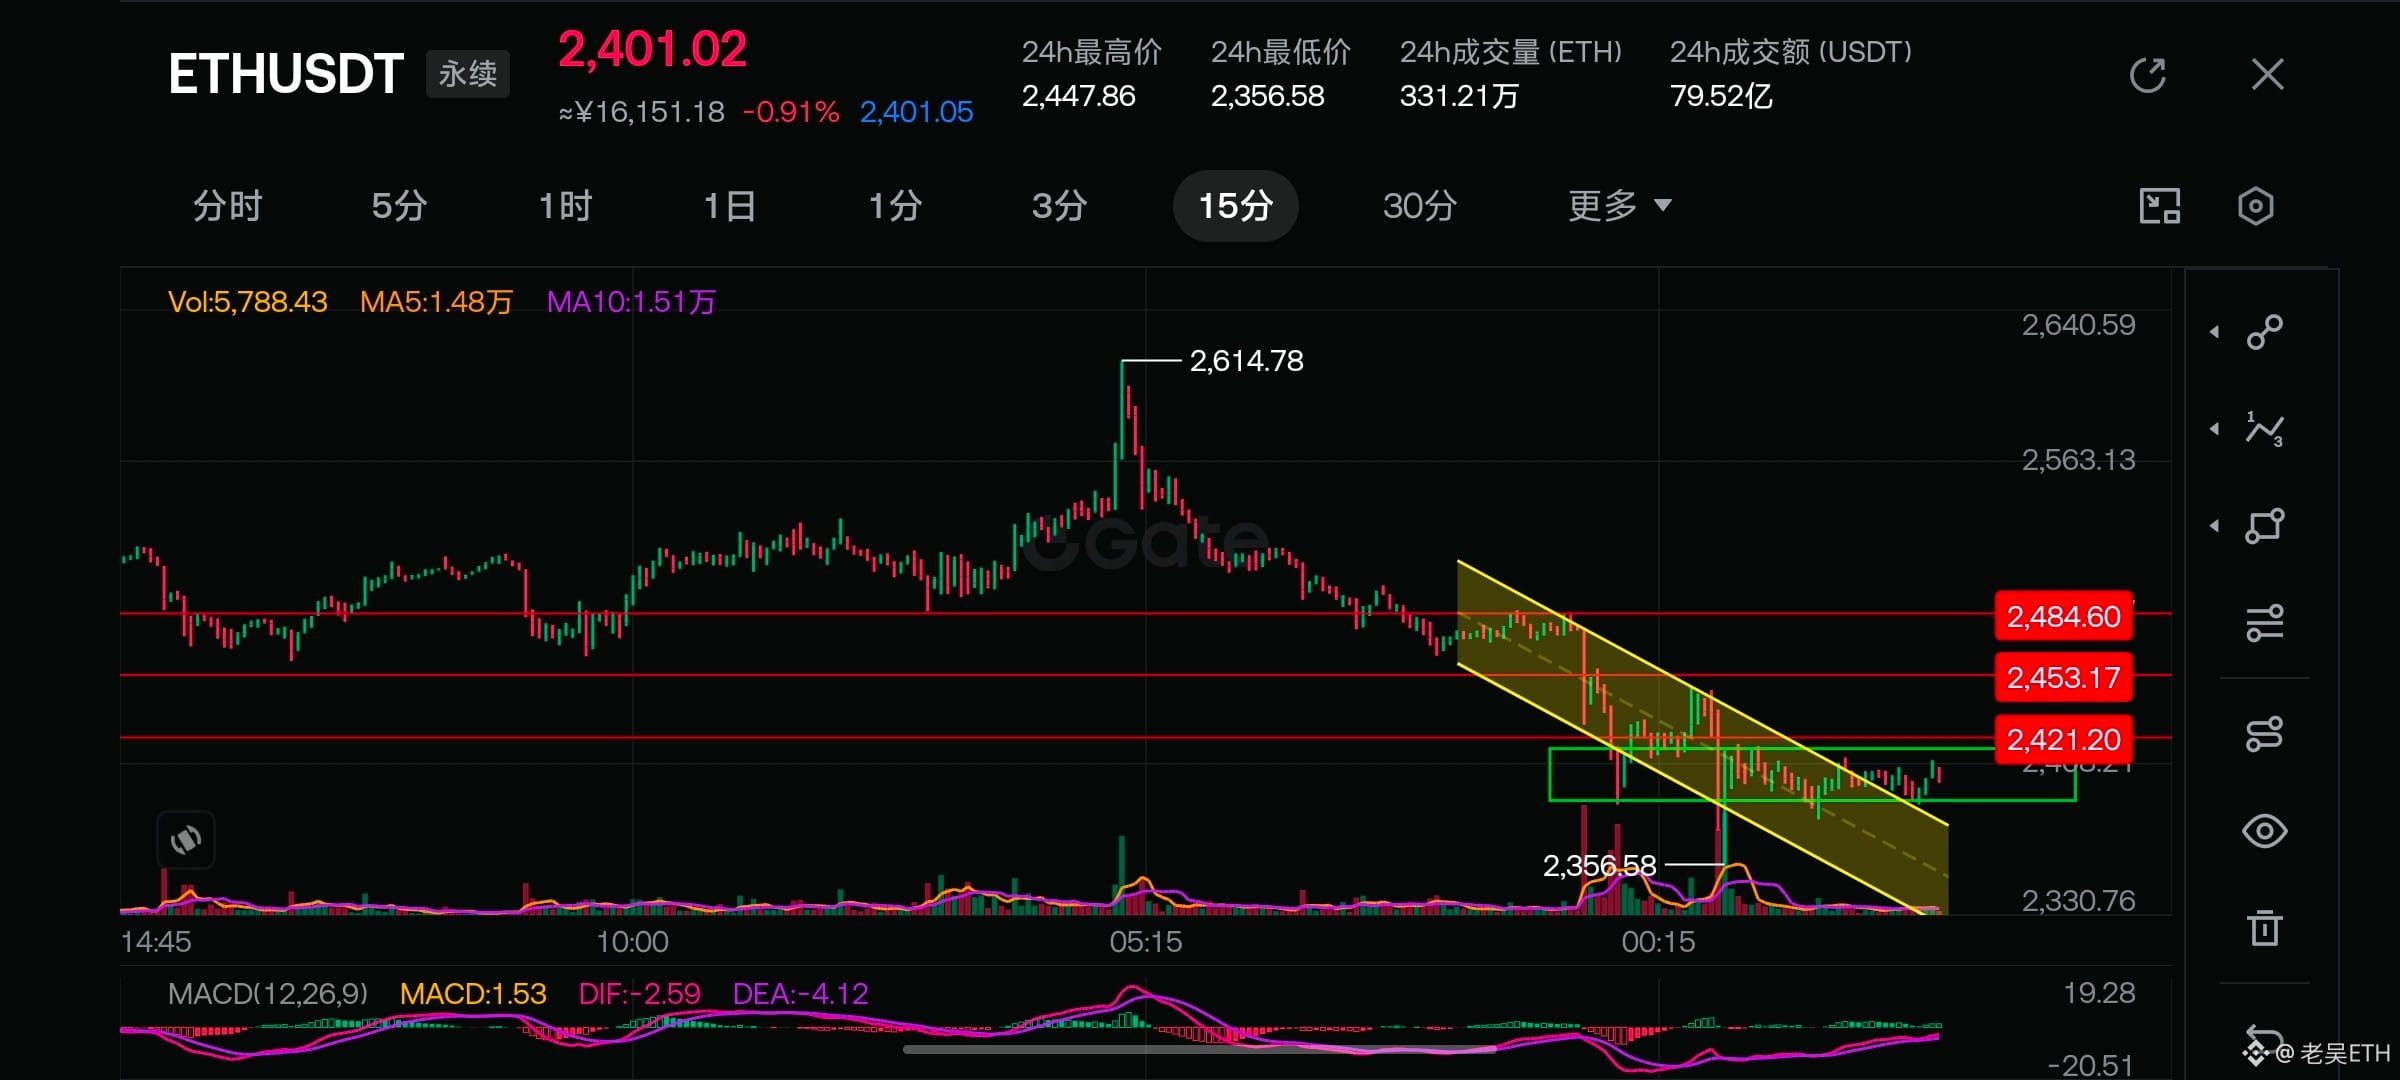
As shown in Lao Wu’s perspective👇
The yellow parallel lines indicate that the downward channel has already ended
Now we’re entering a sideways consolidation adjustment in a green rectangular range
Trading suggestion: short; set a stop loss near 2420
If it rallies, observe the pace—right now the market activity is sluggish
Lao Wu’s approach: only short, and wait for the direction. If it rallies, watch the strength—or just smash the market
If you’re not sure, go to cash and wait; only take short-term trades👀#ETH $ETH
{future}(ETHUSDT)
As shown in Lao Wu’s perspective👇
The yellow parallel lines indicate that the downward channel has already ended
Now we’re entering a sideways consolidation adjustment in a green rectangular range
Trading suggestion: short; set a stop loss near 2420
If it rallies, observe the pace—right now the market activity is sluggish
Lao Wu’s approach: only short, and wait for the direction. If it rallies, watch the strength—or just smash the market
If you’re not sure, go to cash and wait; only take short-term trades👀#ETH $ETH
The yellow parallel lines indicate that the downward channel has already ended
Now we’re entering a sideways consolidation adjustment in a green rectangular range
Trading suggestion: short; set a stop loss near 2420
If it rallies, observe the pace—right now the market activity is sluggish
Lao Wu’s approach: only short, and wait for the direction. If it rallies, watch the strength—or just smash the market
If you’re not sure, go to cash and wait; only take short-term trades👀#ETH $ETH
2
280
·
--
Bearish
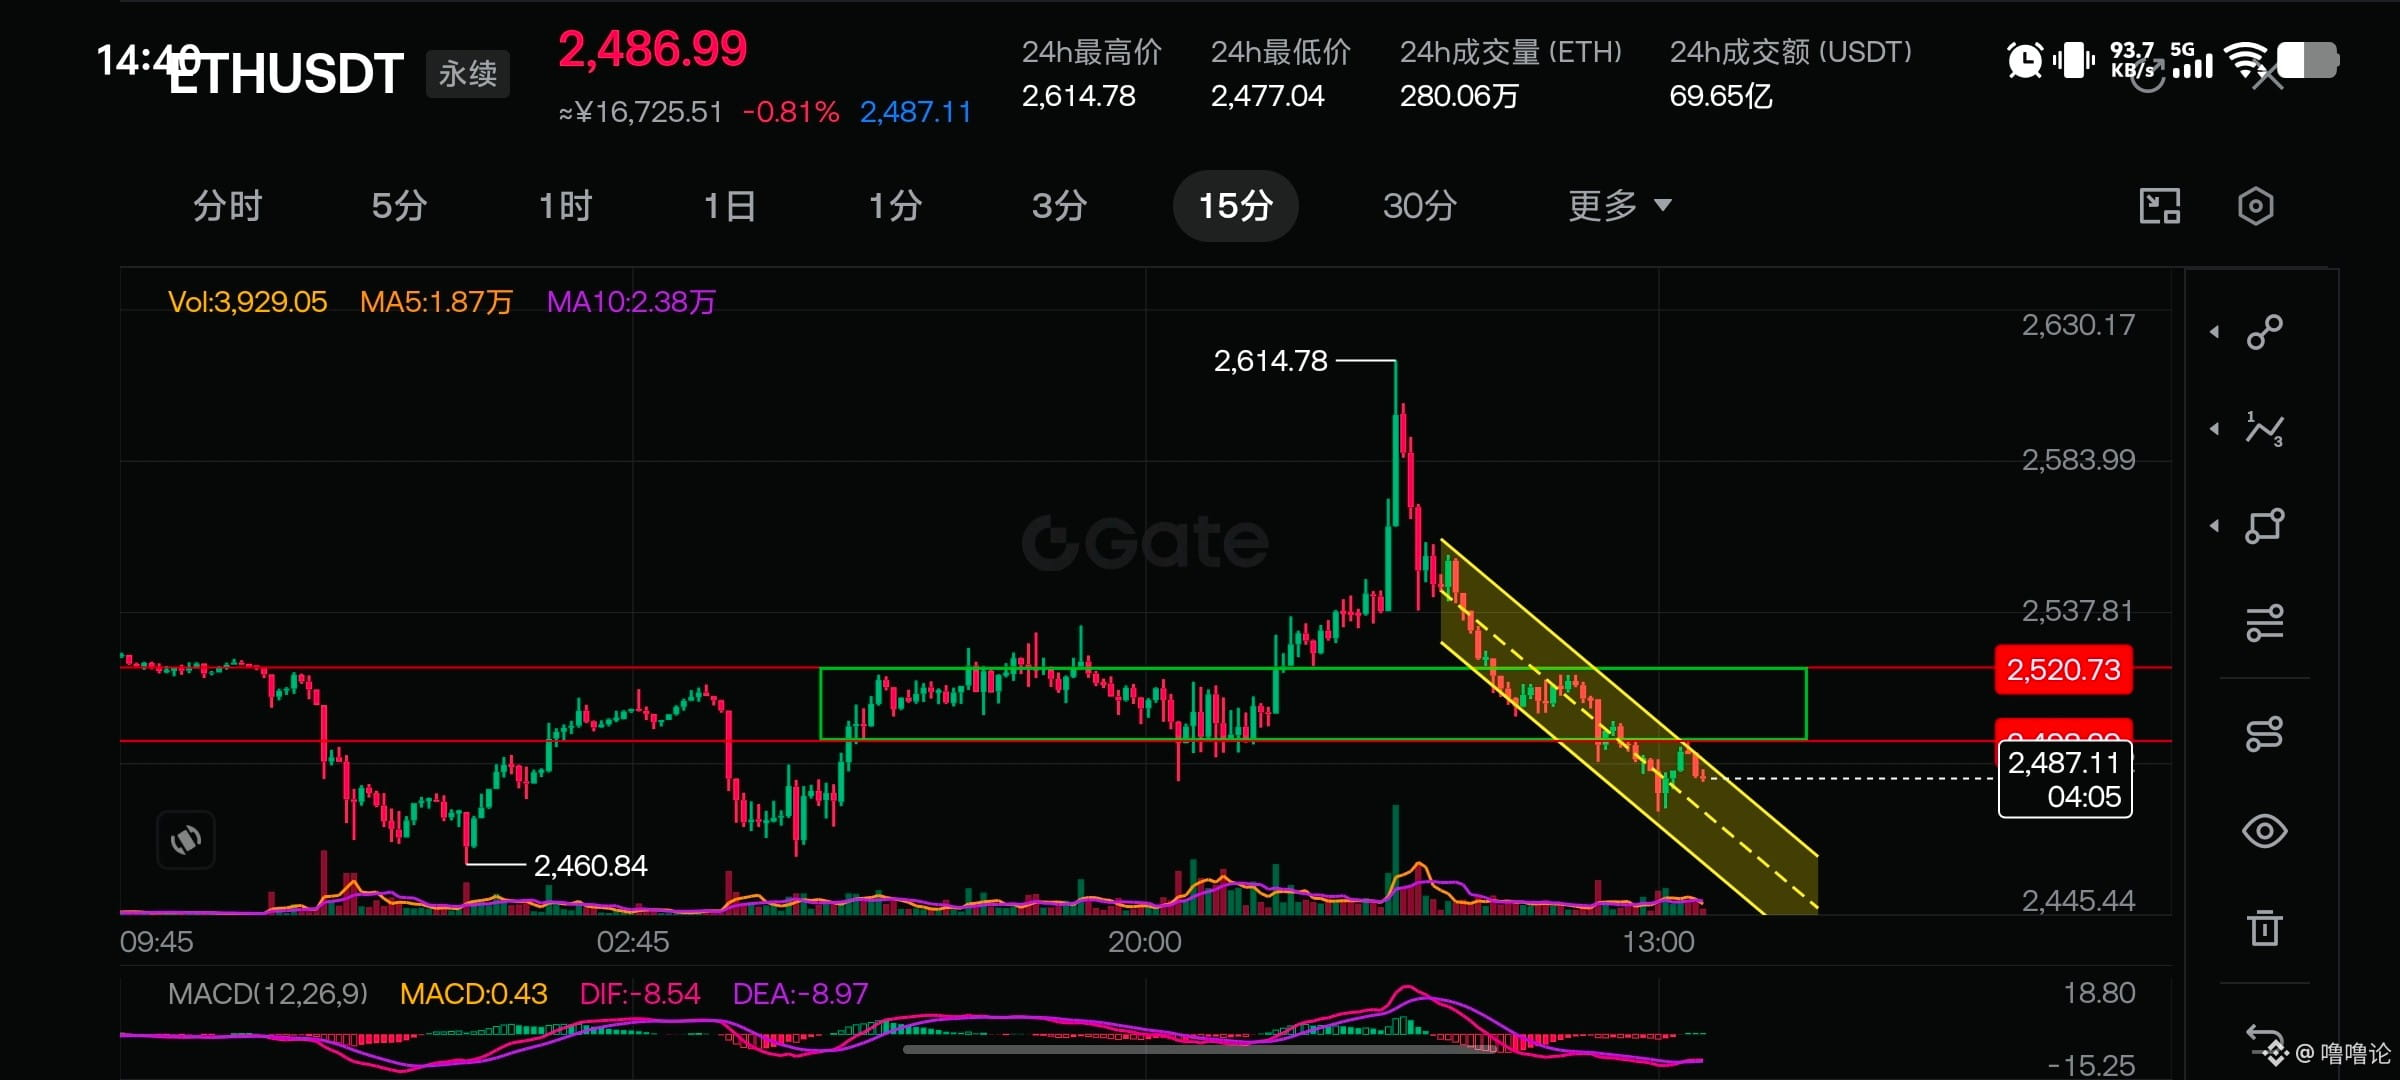
The chart shows the ETH 15-minute candlestick chart.
The yellow parallel lines clearly indicate a downward channel.
The green grid lines show a support/resistance pressure level below the channel around 2500, and an upper pressure level around 2520.
The red price line is considered an effective breakout only if it breaks above 2500 and holds steady above 2520.
Trading suggestion: short (sell).
Stop-loss set around 2520, more conservative.
Stop-loss set around 2500, more aggressive.#eth $ETH
{future}(ETHUSDT)
The chart shows the ETH 15-minute candlestick chart.
The yellow parallel lines clearly indicate a downward channel.
The green grid lines show a support/resistance pressure level below the channel around 2500, and an upper pressure level around 2520.
The red price line is considered an effective breakout only if it breaks above 2500 and holds steady above 2520.
Trading suggestion: short (sell).
Stop-loss set around 2520, more conservative.
Stop-loss set around 2500, more aggressive.#eth $ETH
The yellow parallel lines clearly indicate a downward channel.
The green grid lines show a support/resistance pressure level below the channel around 2500, and an upper pressure level around 2520.
The red price line is considered an effective breakout only if it breaks above 2500 and holds steady above 2520.
Trading suggestion: short (sell).
Stop-loss set around 2520, more conservative.
Stop-loss set around 2500, more aggressive.#eth $ETH
2
766
·
--
Article
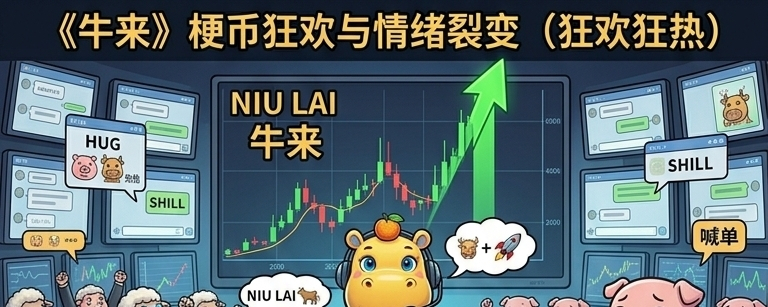
《“Bull’s here” for half a year—this time the whales might really use it as a showroom》If there’s one thing that the crypto market lacks the least, it’s narratives. But the absolute thing it lacks is a “super symbol” that makes all retail investors instantly understand—and are willing to pay for.
Not long ago, that low-resolution, laughably shoddy anime with the same name—who would’ve thought it would turn into this year’s most surreal delivery slip? From “blessing” emoji packs in stock trading groups, to on-chain speculation: the market used dozens of G of emoji packs to force “Bull’s here” into an outlet for emotions across the entire internet.
The logic is actually frighteningly simple: retail investors have been suffering through bearishness for a long time.
No matter how much you talk about complex ZK technology and L2 scaling, and make it sound dazzling, most people still can’t really follow. But as soon as someone in the group throws out a single “Bull’s here,” the wealth-making psychology implied by those two words becomes the top-tier natural catalyst for viral spread. Money always chases the path of least resistance. And the emotion that spreads with the least resistance is always the plain and easy-to-understand “meme.”
《“Bull’s here” for half a year—this time the whales might really use it as a showroom》
If there’s one thing that the crypto market lacks the least, it’s narratives. But the absolute thing it lacks is a “super symbol” that makes all retail investors instantly understand—and are willing to pay for.
Not long ago, that low-resolution, laughably shoddy anime with the same name—who would’ve thought it would turn into this year’s most surreal delivery slip? From “blessing” emoji packs in stock trading groups, to on-chain speculation: the market used dozens of G of emoji packs to force “Bull’s here” into an outlet for emotions across the entire internet.
The logic is actually frighteningly simple: retail investors have been suffering through bearishness for a long time.
No matter how much you talk about complex ZK technology and L2 scaling, and make it sound dazzling, most people still can’t really follow. But as soon as someone in the group throws out a single “Bull’s here,” the wealth-making psychology implied by those two words becomes the top-tier natural catalyst for viral spread. Money always chases the path of least resistance. And the emotion that spreads with the least resistance is always the plain and easy-to-understand “meme.”
Not long ago, that low-resolution, laughably shoddy anime with the same name—who would’ve thought it would turn into this year’s most surreal delivery slip? From “blessing” emoji packs in stock trading groups, to on-chain speculation: the market used dozens of G of emoji packs to force “Bull’s here” into an outlet for emotions across the entire internet.
The logic is actually frighteningly simple: retail investors have been suffering through bearishness for a long time.
No matter how much you talk about complex ZK technology and L2 scaling, and make it sound dazzling, most people still can’t really follow. But as soon as someone in the group throws out a single “Bull’s here,” the wealth-making psychology implied by those two words becomes the top-tier natural catalyst for viral spread. Money always chases the path of least resistance. And the emotion that spreads with the least resistance is always the plain and easy-to-understand “meme.”
1
550
·
--
Bullish
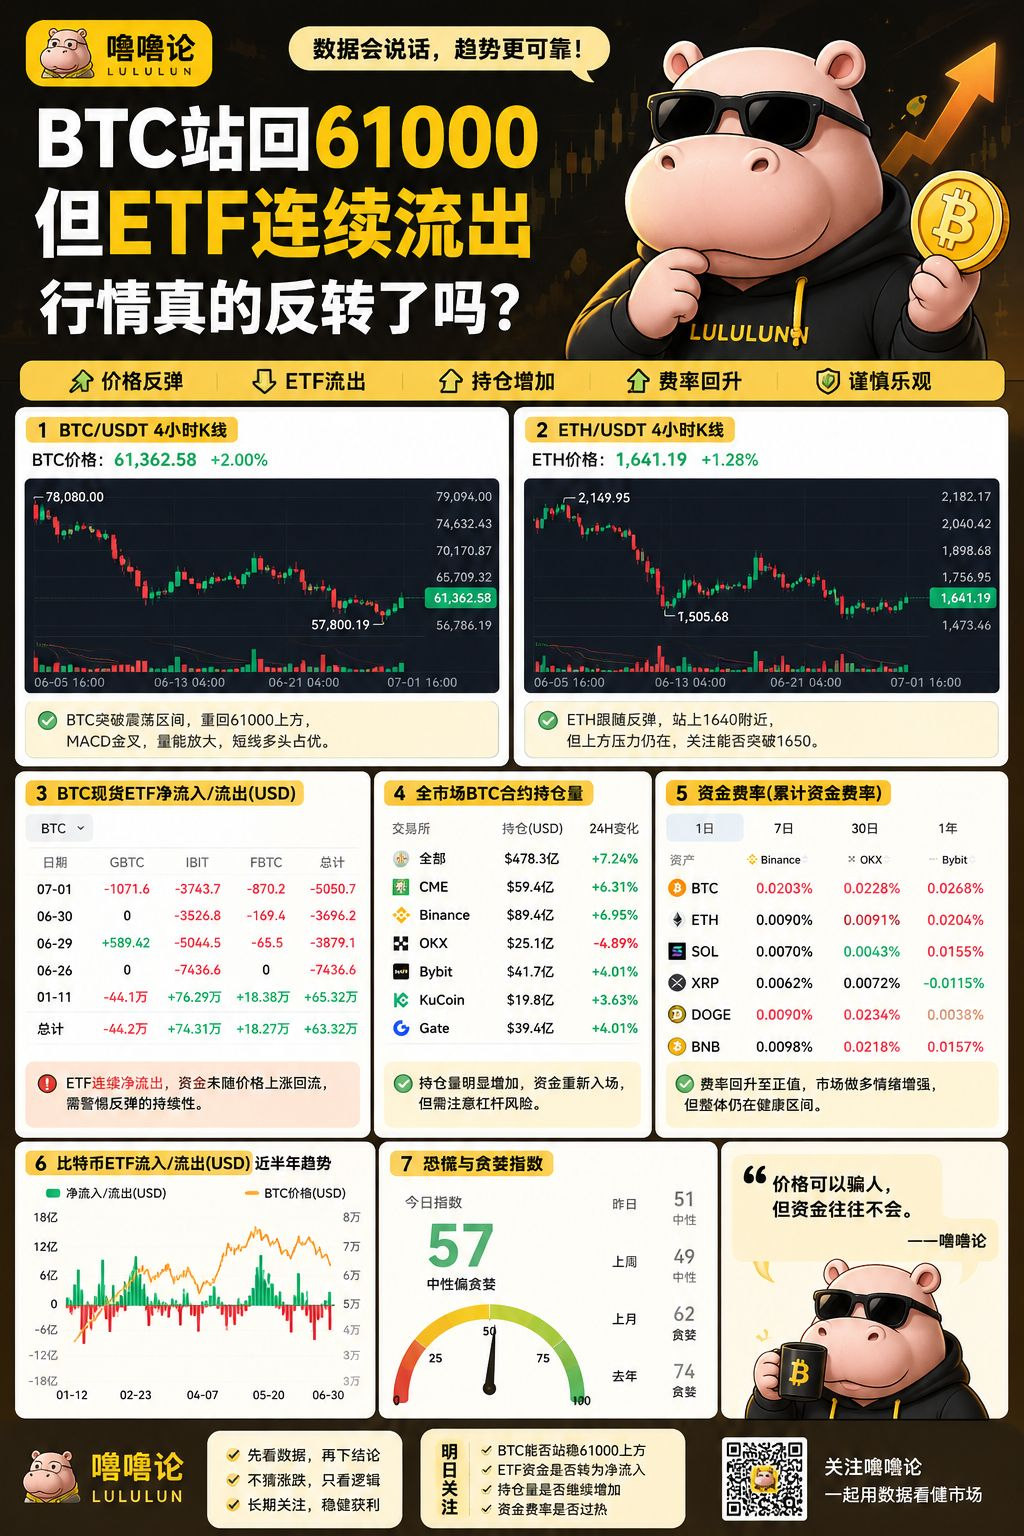
Today, Bitcoin has once again reclaimed the area around $61,300, and ETH has also returned above $1,640. After several days of continuous pullbacks, the market has finally seen a decent rebound.
Many people are already shouting that the bull market is back.
But based on the data, I don’t think we should jump to conclusions yet.
1. Prices are rising, but ETFs continue to see outflows
Today, what’s most worth watching isn’t the price, but the ETF data.
The screenshot shows that Bitcoin spot ETFs have still maintained net outflows over the past few trading days, with no return of capital despite the price increase.
What does that mean?
It suggests that the current rise in price isn’t being driven by continuous ETF buying pressure, but more likely comes from:
Short-covering;
Spot/market participants buying actively;
Some leveraged funds pushing the rebound.
So, although this rally has momentum, the capital structure hasn’t improved completely yet.
2. Open interest has clearly increased
From open interest data, the total BTC open contracts across the entire market have risen to about 780,000 BTC.
As the price rises, open interest increases at the same time.
This means:
It’s not just上涨 caused by shorts closing; there are new funds starting to re-enter the market.
This is a positive signal.
However, it also implies that leverage in the market is increasing.
If the rally later loses steam, high leverage can also lead to a rapid pullback.
3. Funding rates start to heat up
Today, the funding rates on major exchanges have rebounded noticeably compared to yesterday.
BTC has returned to a positive funding rate.
On some ETH platforms, funding rates have also started turning positive.
This indicates that long sentiment in the market is recovering.
That said, funding rates still haven’t entered extreme territory, so for now there’s no sign of severe overheating.
4. What does the technical picture suggest?
On the BTC four-hour timeframe, price has already broken above the consolidation range from the past few days.
MACD has formed a new golden cross.
Trading volume has increased compared to the previous few days.
In the short term, bullish momentum has regained control.
However, there are still trapped positions overhead from earlier.
If trading volume can’t continue to expand afterward, then this upswing looks more like a corrective rebound rather than a trend-changing breakout.
📌 What to watch today
BTC: Pay close attention to support around $61,000–$61,500.
ETH: Watch whether it can further break above around $1,650.
ETF fund flows remain the most important indicator to monitor over the next few days.#BTC
Today, Bitcoin has once again reclaimed the area around $61,300, and ETH has also returned above $1,640. After several days of continuous pullbacks, the market has finally seen a decent rebound.
Many people are already shouting that the bull market is back.
But based on the data, I don’t think we should jump to conclusions yet.
1. Prices are rising, but ETFs continue to see outflows
Today, what’s most worth watching isn’t the price, but the ETF data.
The screenshot shows that Bitcoin spot ETFs have still maintained net outflows over the past few trading days, with no return of capital despite the price increase.
What does that mean?
It suggests that the current rise in price isn’t being driven by continuous ETF buying pressure, but more likely comes from:
Short-covering;
Spot/market participants buying actively;
Some leveraged funds pushing the rebound.
So, although this rally has momentum, the capital structure hasn’t improved completely yet.
2. Open interest has clearly increased
From open interest data, the total BTC open contracts across the entire market have risen to about 780,000 BTC.
As the price rises, open interest increases at the same time.
This means:
It’s not just上涨 caused by shorts closing; there are new funds starting to re-enter the market.
This is a positive signal.
However, it also implies that leverage in the market is increasing.
If the rally later loses steam, high leverage can also lead to a rapid pullback.
3. Funding rates start to heat up
Today, the funding rates on major exchanges have rebounded noticeably compared to yesterday.
BTC has returned to a positive funding rate.
On some ETH platforms, funding rates have also started turning positive.
This indicates that long sentiment in the market is recovering.
That said, funding rates still haven’t entered extreme territory, so for now there’s no sign of severe overheating.
4. What does the technical picture suggest?
On the BTC four-hour timeframe, price has already broken above the consolidation range from the past few days.
MACD has formed a new golden cross.
Trading volume has increased compared to the previous few days.
In the short term, bullish momentum has regained control.
However, there are still trapped positions overhead from earlier.
If trading volume can’t continue to expand afterward, then this upswing looks more like a corrective rebound rather than a trend-changing breakout.
📌 What to watch today
BTC: Pay close attention to support around $61,000–$61,500.
ETH: Watch whether it can further break above around $1,650.
ETF fund flows remain the most important indicator to monitor over the next few days.#BTC
Many people are already shouting that the bull market is back.
But based on the data, I don’t think we should jump to conclusions yet.
1. Prices are rising, but ETFs continue to see outflows
Today, what’s most worth watching isn’t the price, but the ETF data.
The screenshot shows that Bitcoin spot ETFs have still maintained net outflows over the past few trading days, with no return of capital despite the price increase.
What does that mean?
It suggests that the current rise in price isn’t being driven by continuous ETF buying pressure, but more likely comes from:
Short-covering;
Spot/market participants buying actively;
Some leveraged funds pushing the rebound.
So, although this rally has momentum, the capital structure hasn’t improved completely yet.
2. Open interest has clearly increased
From open interest data, the total BTC open contracts across the entire market have risen to about 780,000 BTC.
As the price rises, open interest increases at the same time.
This means:
It’s not just上涨 caused by shorts closing; there are new funds starting to re-enter the market.
This is a positive signal.
However, it also implies that leverage in the market is increasing.
If the rally later loses steam, high leverage can also lead to a rapid pullback.
3. Funding rates start to heat up
Today, the funding rates on major exchanges have rebounded noticeably compared to yesterday.
BTC has returned to a positive funding rate.
On some ETH platforms, funding rates have also started turning positive.
This indicates that long sentiment in the market is recovering.
That said, funding rates still haven’t entered extreme territory, so for now there’s no sign of severe overheating.
4. What does the technical picture suggest?
On the BTC four-hour timeframe, price has already broken above the consolidation range from the past few days.
MACD has formed a new golden cross.
Trading volume has increased compared to the previous few days.
In the short term, bullish momentum has regained control.
However, there are still trapped positions overhead from earlier.
If trading volume can’t continue to expand afterward, then this upswing looks more like a corrective rebound rather than a trend-changing breakout.
📌 What to watch today
BTC: Pay close attention to support around $61,000–$61,500.
ETH: Watch whether it can further break above around $1,650.
ETF fund flows remain the most important indicator to monitor over the next few days.#BTC
1
941
·
--
Bullish
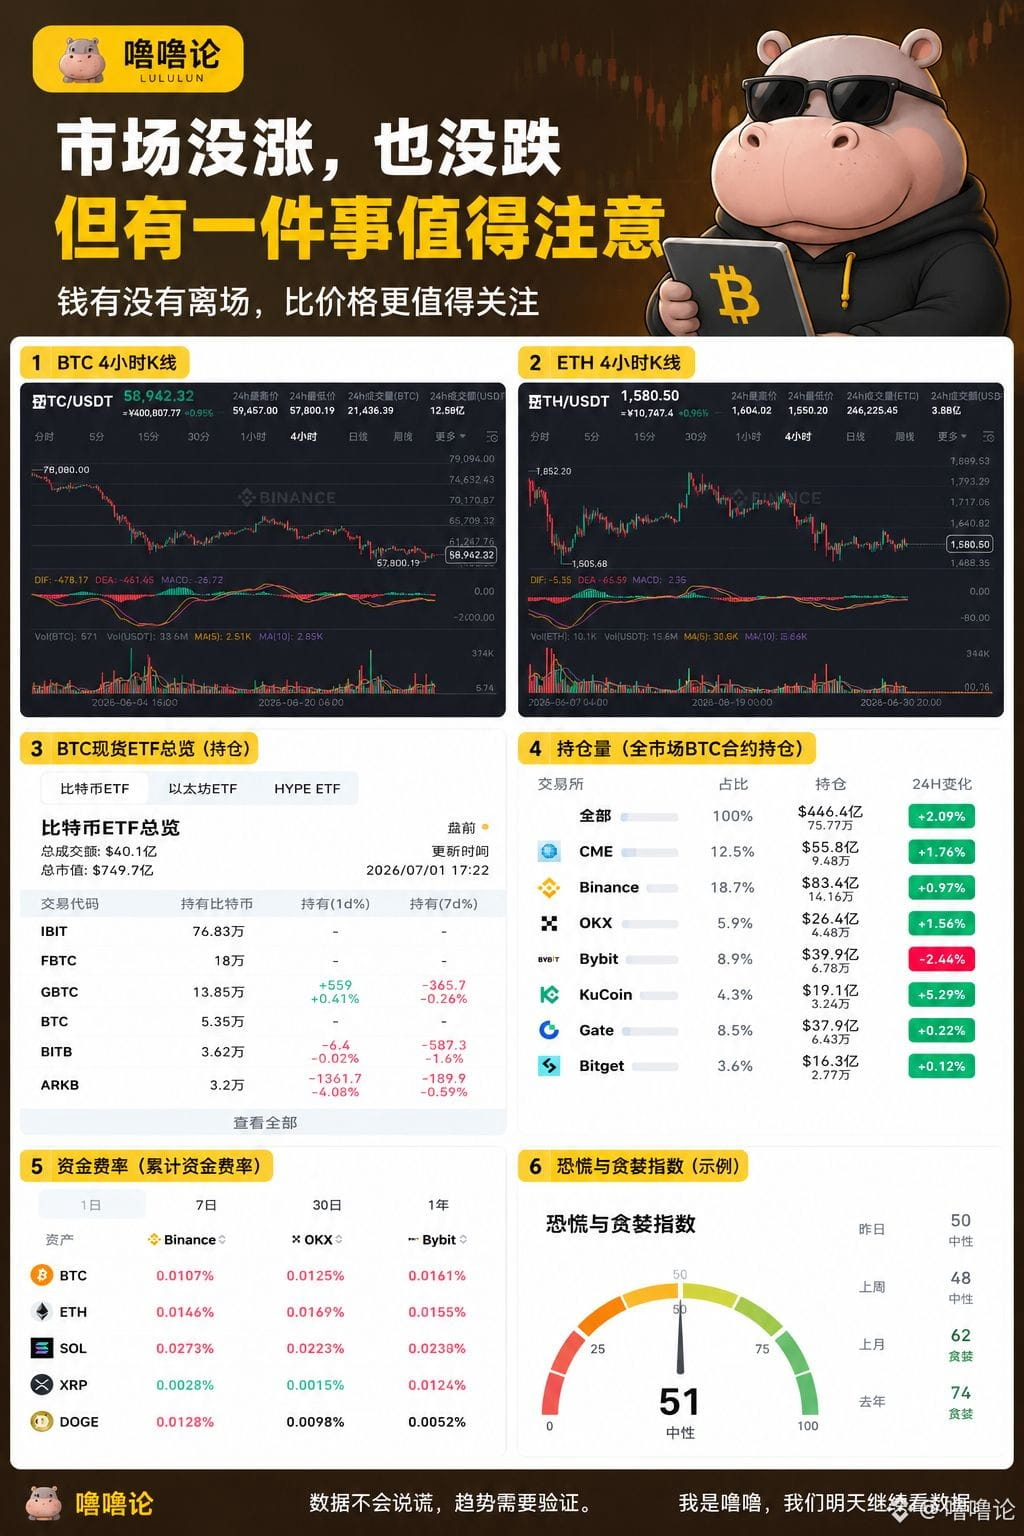
The market hasn’t gone up or down, but there’s one thing worth noting.
Many people think the recent行情 is boring.
Bitcoin has been trading back and forth around $59,000, and Ethereum hasn’t broken out into a true, meaningful trend.
So some people have started to wonder:
Is the bull market over?
But I think what’s really worth watching now isn’t the price—it’s the money.
Based on today’s data:
✅ Bitcoin is around 58,942
✅ Ethereum is around 1,580
Although the price hasn’t broken through, there hasn’t been a clear outflow of market funds.
Looking at the ETF data, the spot ETFs still hold nearly 750,000 BTC, which suggests long-term allocation capital is still staying in the market.
Now check the derivatives data: the total open interest across the whole market remains at a relatively high level. The funding rate stays positive, indicating that there is still some desire to go long in the market, but sentiment hasn’t entered a frenzied phase.
So what does this mean?
My understanding is simple.
It’s more like the market is waiting for direction, rather than the trend having already ended.
What you truly need to focus on is:
Whether ETF capital continues to flow in;
Whether open interest keeps increasing;
Whether trading volume can expand again.
If these three indicators start improving in sync, then the market may have a chance to see a new breakout.
Otherwise, it’s likely the market will continue to range, and patience matters more than chasing a rally.
🦛 Luru’s View
Many people only watch the candlestick chart.
What’s really worth watching is whether the money has left.
Price can be misleading,
But capital usually won’t.#比特币跌至59250美元
The market hasn’t gone up or down, but there’s one thing worth noting.
Many people think the recent行情 is boring.
Bitcoin has been trading back and forth around $59,000, and Ethereum hasn’t broken out into a true, meaningful trend.
So some people have started to wonder:
Is the bull market over?
But I think what’s really worth watching now isn’t the price—it’s the money.
Based on today’s data:
✅ Bitcoin is around 58,942
✅ Ethereum is around 1,580
Although the price hasn’t broken through, there hasn’t been a clear outflow of market funds.
Looking at the ETF data, the spot ETFs still hold nearly 750,000 BTC, which suggests long-term allocation capital is still staying in the market.
Now check the derivatives data: the total open interest across the whole market remains at a relatively high level. The funding rate stays positive, indicating that there is still some desire to go long in the market, but sentiment hasn’t entered a frenzied phase.
So what does this mean?
My understanding is simple.
It’s more like the market is waiting for direction, rather than the trend having already ended.
What you truly need to focus on is:
Whether ETF capital continues to flow in;
Whether open interest keeps increasing;
Whether trading volume can expand again.
If these three indicators start improving in sync, then the market may have a chance to see a new breakout.
Otherwise, it’s likely the market will continue to range, and patience matters more than chasing a rally.
🦛 Luru’s View
Many people only watch the candlestick chart.
What’s really worth watching is whether the money has left.
Price can be misleading,
But capital usually won’t.#比特币跌至59250美元
Many people think the recent行情 is boring.
Bitcoin has been trading back and forth around $59,000, and Ethereum hasn’t broken out into a true, meaningful trend.
So some people have started to wonder:
Is the bull market over?
But I think what’s really worth watching now isn’t the price—it’s the money.
Based on today’s data:
✅ Bitcoin is around 58,942
✅ Ethereum is around 1,580
Although the price hasn’t broken through, there hasn’t been a clear outflow of market funds.
Looking at the ETF data, the spot ETFs still hold nearly 750,000 BTC, which suggests long-term allocation capital is still staying in the market.
Now check the derivatives data: the total open interest across the whole market remains at a relatively high level. The funding rate stays positive, indicating that there is still some desire to go long in the market, but sentiment hasn’t entered a frenzied phase.
So what does this mean?
My understanding is simple.
It’s more like the market is waiting for direction, rather than the trend having already ended.
What you truly need to focus on is:
Whether ETF capital continues to flow in;
Whether open interest keeps increasing;
Whether trading volume can expand again.
If these three indicators start improving in sync, then the market may have a chance to see a new breakout.
Otherwise, it’s likely the market will continue to range, and patience matters more than chasing a rally.
🦛 Luru’s View
Many people only watch the candlestick chart.
What’s really worth watching is whether the money has left.
Price can be misleading,
But capital usually won’t.#比特币跌至59250美元
1
570
·
--
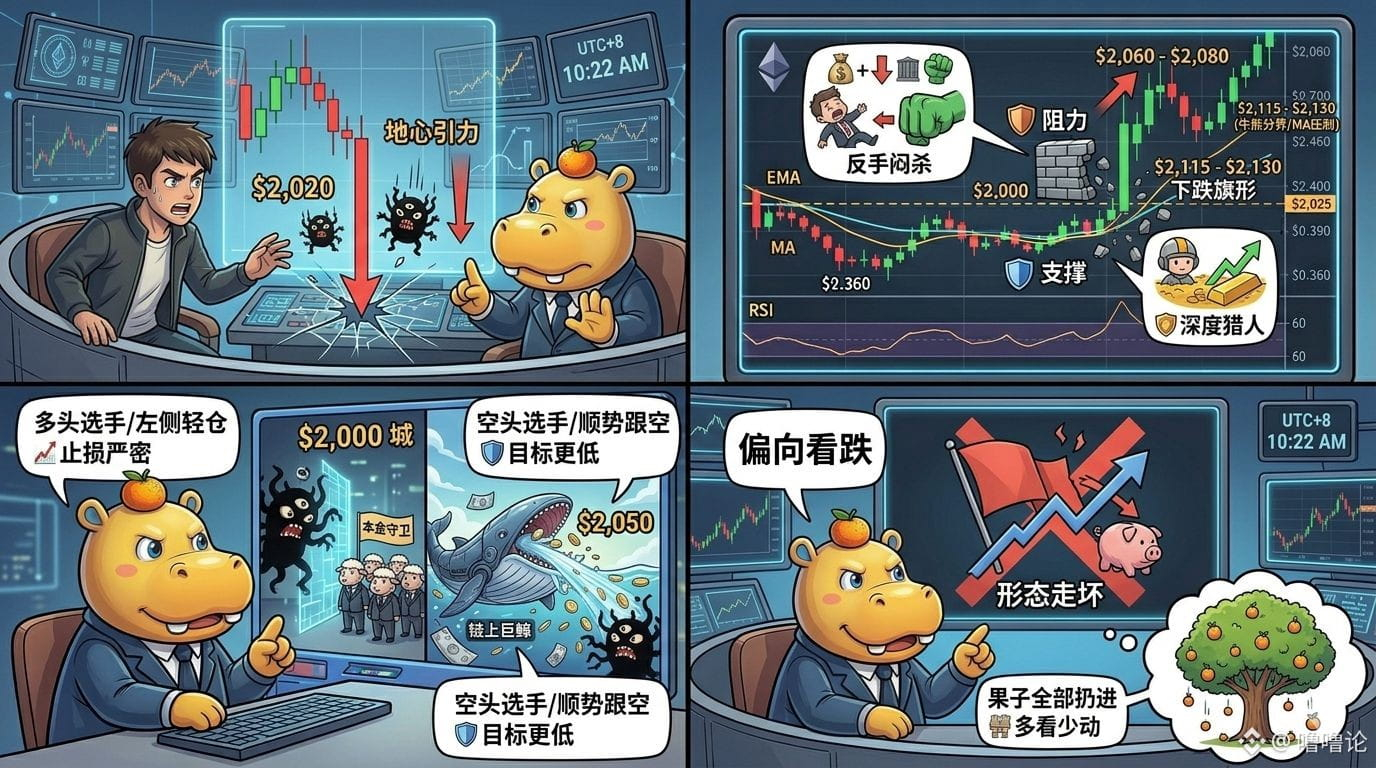
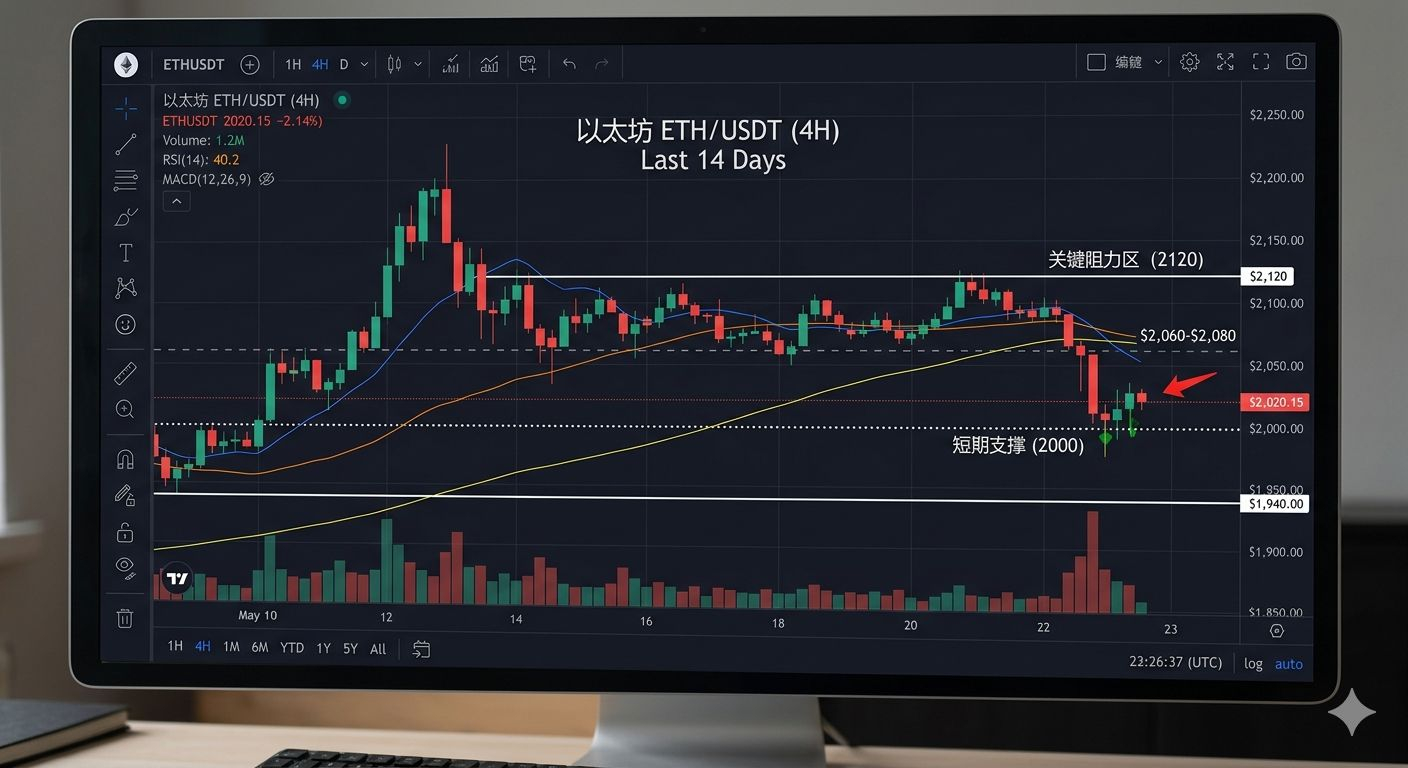
From the current perspective, Ethereum experienced a rapid drop around 2020 due to overwhelming 'gravity'. Now let's widen the screen and see what the technicals are telling us:
1. Structured candlestick deep analysis
📉 Resistance levels (upward pressure):
First resistance (just around the corner): 2060-2080
This is the 'consolidation zone' where it was trading sideways earlier today. After just breaking down, this has switched from being the 'floor' to the 'ceiling' (support-resistance flip). If ETH wants to bounce back, this is the first hurdle for the bulls.
Key resistance (bull-bear line): 2115-2130
Looking at the daily and 4-hour charts, this level is where the 50-day and 200-day moving averages (MA) converge. Currently, the price is below all major MAs, indicating that the bears are temporarily in control of the game.
🛡️ Support levels (downward defense):
Short-term strong support: 2000 psychological level
This is a very critical integer level. The price is currently hovering around 2020, just a step away from here. If it can stabilize at 2000, the market might shift to sideways consolidation.
Deep pit support: 1930 - 1950
If 2000 is lost, the next structural demand zone is in this range, which is also a spot where many 'deep-sea hunters' are waiting to scoop up the bottom.
2. How to operate? (Lulu's tactical board)
If you are a 'bull' player (buying faction):
Left-side thinking: You can try a light position around 2000, but this is 'picking up pennies in front of a steamroller'; stop-loss must be tight (like setting it below 1980).
Right-side thinking (more conservative): Wait for the price to regain above 2080, and look for a breakout signal before entering to catch a bounce to 2150.
If you are a 'bear' player (selling faction):
The current trend is more favorable for you. If the price retraces to the 2050 - 2065 area and faces resistance, consider shorting with the trend, targeting 2000 or even lower.
3. Final judgment: Bullish or bearish?
Current conclusion: Leaning bearish (or weak consolidation).
Reasons are as follows:
1. Bad shape: The recent plunge broke the short-term ascending channel, and we are currently in a clear 'descending flag'.
2. MA pressure: The price is below both short and long-term moving averages, indicating that the average cost of market participants is above, creating enormous pressure for a rebound. #ETH $ETH
From the current perspective, Ethereum experienced a rapid drop around 2020 due to overwhelming 'gravity'. Now let's widen the screen and see what the technicals are telling us:
1. Structured candlestick deep analysis
📉 Resistance levels (upward pressure):
First resistance (just around the corner): 2060-2080
This is the 'consolidation zone' where it was trading sideways earlier today. After just breaking down, this has switched from being the 'floor' to the 'ceiling' (support-resistance flip). If ETH wants to bounce back, this is the first hurdle for the bulls.
Key resistance (bull-bear line): 2115-2130
Looking at the daily and 4-hour charts, this level is where the 50-day and 200-day moving averages (MA) converge. Currently, the price is below all major MAs, indicating that the bears are temporarily in control of the game.
🛡️ Support levels (downward defense):
Short-term strong support: 2000 psychological level
This is a very critical integer level. The price is currently hovering around 2020, just a step away from here. If it can stabilize at 2000, the market might shift to sideways consolidation.
Deep pit support: 1930 - 1950
If 2000 is lost, the next structural demand zone is in this range, which is also a spot where many 'deep-sea hunters' are waiting to scoop up the bottom.
2. How to operate? (Lulu's tactical board)
If you are a 'bull' player (buying faction):
Left-side thinking: You can try a light position around 2000, but this is 'picking up pennies in front of a steamroller'; stop-loss must be tight (like setting it below 1980).
Right-side thinking (more conservative): Wait for the price to regain above 2080, and look for a breakout signal before entering to catch a bounce to 2150.
If you are a 'bear' player (selling faction):
The current trend is more favorable for you. If the price retraces to the 2050 - 2065 area and faces resistance, consider shorting with the trend, targeting 2000 or even lower.
3. Final judgment: Bullish or bearish?
Current conclusion: Leaning bearish (or weak consolidation).
Reasons are as follows:
1. Bad shape: The recent plunge broke the short-term ascending channel, and we are currently in a clear 'descending flag'.
2. MA pressure: The price is below both short and long-term moving averages, indicating that the average cost of market participants is above, creating enormous pressure for a rebound. #ETH $ETH
1. Structured candlestick deep analysis
📉 Resistance levels (upward pressure):
First resistance (just around the corner): 2060-2080
This is the 'consolidation zone' where it was trading sideways earlier today. After just breaking down, this has switched from being the 'floor' to the 'ceiling' (support-resistance flip). If ETH wants to bounce back, this is the first hurdle for the bulls.
Key resistance (bull-bear line): 2115-2130
Looking at the daily and 4-hour charts, this level is where the 50-day and 200-day moving averages (MA) converge. Currently, the price is below all major MAs, indicating that the bears are temporarily in control of the game.
🛡️ Support levels (downward defense):
Short-term strong support: 2000 psychological level
This is a very critical integer level. The price is currently hovering around 2020, just a step away from here. If it can stabilize at 2000, the market might shift to sideways consolidation.
Deep pit support: 1930 - 1950
If 2000 is lost, the next structural demand zone is in this range, which is also a spot where many 'deep-sea hunters' are waiting to scoop up the bottom.
2. How to operate? (Lulu's tactical board)
If you are a 'bull' player (buying faction):
Left-side thinking: You can try a light position around 2000, but this is 'picking up pennies in front of a steamroller'; stop-loss must be tight (like setting it below 1980).
Right-side thinking (more conservative): Wait for the price to regain above 2080, and look for a breakout signal before entering to catch a bounce to 2150.
If you are a 'bear' player (selling faction):
The current trend is more favorable for you. If the price retraces to the 2050 - 2065 area and faces resistance, consider shorting with the trend, targeting 2000 or even lower.
3. Final judgment: Bullish or bearish?
Current conclusion: Leaning bearish (or weak consolidation).
Reasons are as follows:
1. Bad shape: The recent plunge broke the short-term ascending channel, and we are currently in a clear 'descending flag'.
2. MA pressure: The price is below both short and long-term moving averages, indicating that the average cost of market participants is above, creating enormous pressure for a rebound. #ETH $ETH
1
899
·
--
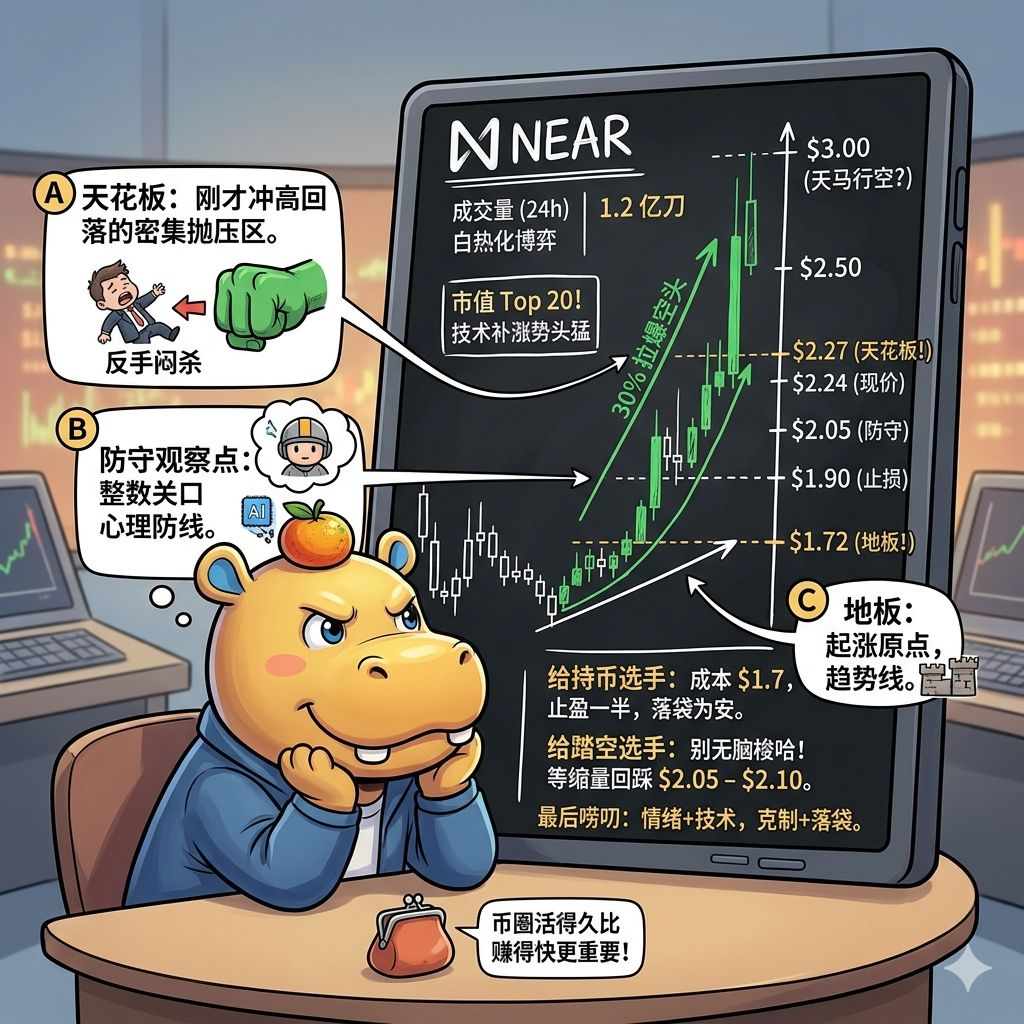
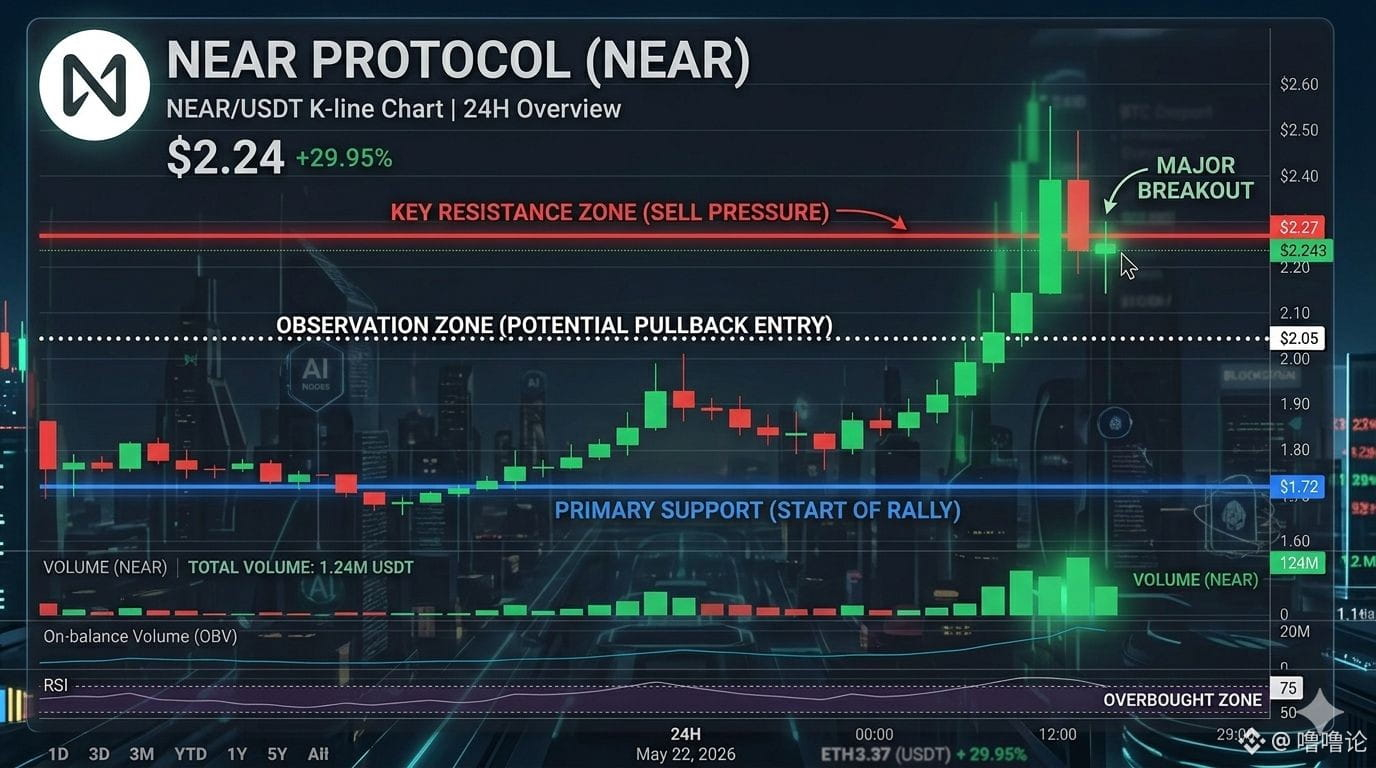
Brothers, stop fixating on those moonshot shitcoins! Today, I'm here to show you a real "tech guru"—NEAR Protocol, which is currently on fire and has the vibe of a major rally about to kick off!🐾
If you haven't jumped on board yet, or you're still hesitating about what this coin is all about, take three minutes to check out this "life-saving" guide.
🚀 What is NEAR? (In a nutshell)
NEAR isn't just any ordinary token; it's a high-performance, low-cost, developer-friendly layer-1 blockchain. You can think of it as a super spacious, traffic-free digital highway where all applications and AI bots can zoom along.
🔥 Why is NEAR going "parabolic"? (This is the crux!)
1. Pure AI lineage: NEAR's founder, Illia Polosukhin, is one of the authors of the groundbreaking paper "Attention Is All You Need" that laid the foundation for modern AI (the core tech behind ChatGPT). This means NEAR is born with "AI genes" and is being hailed as the "king of AI infrastructure" by the market.
2. NVIDIA's good news ignited the fire: Just yesterday (May 21, 2026), NVIDIA released a mind-blowing earnings report, raking in $58.3 billion. This sparked a surge across the entire AI sector, and NEAR, as the sector leader, skyrocketed in response.
3. The "chain abstraction" revolution: NEAR has now achieved universal account access. With Chain Abstraction technology, you can use your NEAR account to initiate transactions on Ethereum, Bitcoin, and even Solana. This "one-chain-to-rule-them-all" capability makes it a traffic hub across the entire network.
The AI wave hasn't receded yet, and NEAR's story is just hitting its peak. It’s one of the few projects backed by top-notch technology with extensive real-world applications.
"Missing out is more painful than losing money; taking a small position to feel the rhythm is always the wisdom of seasoned traders." #NEAR🚀🚀🚀 $NEAR
Brothers, stop fixating on those moonshot shitcoins! Today, I'm here to show you a real "tech guru"—NEAR Protocol, which is currently on fire and has the vibe of a major rally about to kick off!🐾
If you haven't jumped on board yet, or you're still hesitating about what this coin is all about, take three minutes to check out this "life-saving" guide.
🚀 What is NEAR? (In a nutshell)
NEAR isn't just any ordinary token; it's a high-performance, low-cost, developer-friendly layer-1 blockchain. You can think of it as a super spacious, traffic-free digital highway where all applications and AI bots can zoom along.
🔥 Why is NEAR going "parabolic"? (This is the crux!)
1. Pure AI lineage: NEAR's founder, Illia Polosukhin, is one of the authors of the groundbreaking paper "Attention Is All You Need" that laid the foundation for modern AI (the core tech behind ChatGPT). This means NEAR is born with "AI genes" and is being hailed as the "king of AI infrastructure" by the market.
2. NVIDIA's good news ignited the fire: Just yesterday (May 21, 2026), NVIDIA released a mind-blowing earnings report, raking in $58.3 billion. This sparked a surge across the entire AI sector, and NEAR, as the sector leader, skyrocketed in response.
3. The "chain abstraction" revolution: NEAR has now achieved universal account access. With Chain Abstraction technology, you can use your NEAR account to initiate transactions on Ethereum, Bitcoin, and even Solana. This "one-chain-to-rule-them-all" capability makes it a traffic hub across the entire network.
The AI wave hasn't receded yet, and NEAR's story is just hitting its peak. It’s one of the few projects backed by top-notch technology with extensive real-world applications.
"Missing out is more painful than losing money; taking a small position to feel the rhythm is always the wisdom of seasoned traders." #NEAR🚀🚀🚀 $NEAR
If you haven't jumped on board yet, or you're still hesitating about what this coin is all about, take three minutes to check out this "life-saving" guide.
🚀 What is NEAR? (In a nutshell)
NEAR isn't just any ordinary token; it's a high-performance, low-cost, developer-friendly layer-1 blockchain. You can think of it as a super spacious, traffic-free digital highway where all applications and AI bots can zoom along.
🔥 Why is NEAR going "parabolic"? (This is the crux!)
1. Pure AI lineage: NEAR's founder, Illia Polosukhin, is one of the authors of the groundbreaking paper "Attention Is All You Need" that laid the foundation for modern AI (the core tech behind ChatGPT). This means NEAR is born with "AI genes" and is being hailed as the "king of AI infrastructure" by the market.
2. NVIDIA's good news ignited the fire: Just yesterday (May 21, 2026), NVIDIA released a mind-blowing earnings report, raking in $58.3 billion. This sparked a surge across the entire AI sector, and NEAR, as the sector leader, skyrocketed in response.
3. The "chain abstraction" revolution: NEAR has now achieved universal account access. With Chain Abstraction technology, you can use your NEAR account to initiate transactions on Ethereum, Bitcoin, and even Solana. This "one-chain-to-rule-them-all" capability makes it a traffic hub across the entire network.
The AI wave hasn't receded yet, and NEAR's story is just hitting its peak. It’s one of the few projects backed by top-notch technology with extensive real-world applications.
"Missing out is more painful than losing money; taking a small position to feel the rhythm is always the wisdom of seasoned traders." #NEAR🚀🚀🚀 $NEAR
1
262
·
--
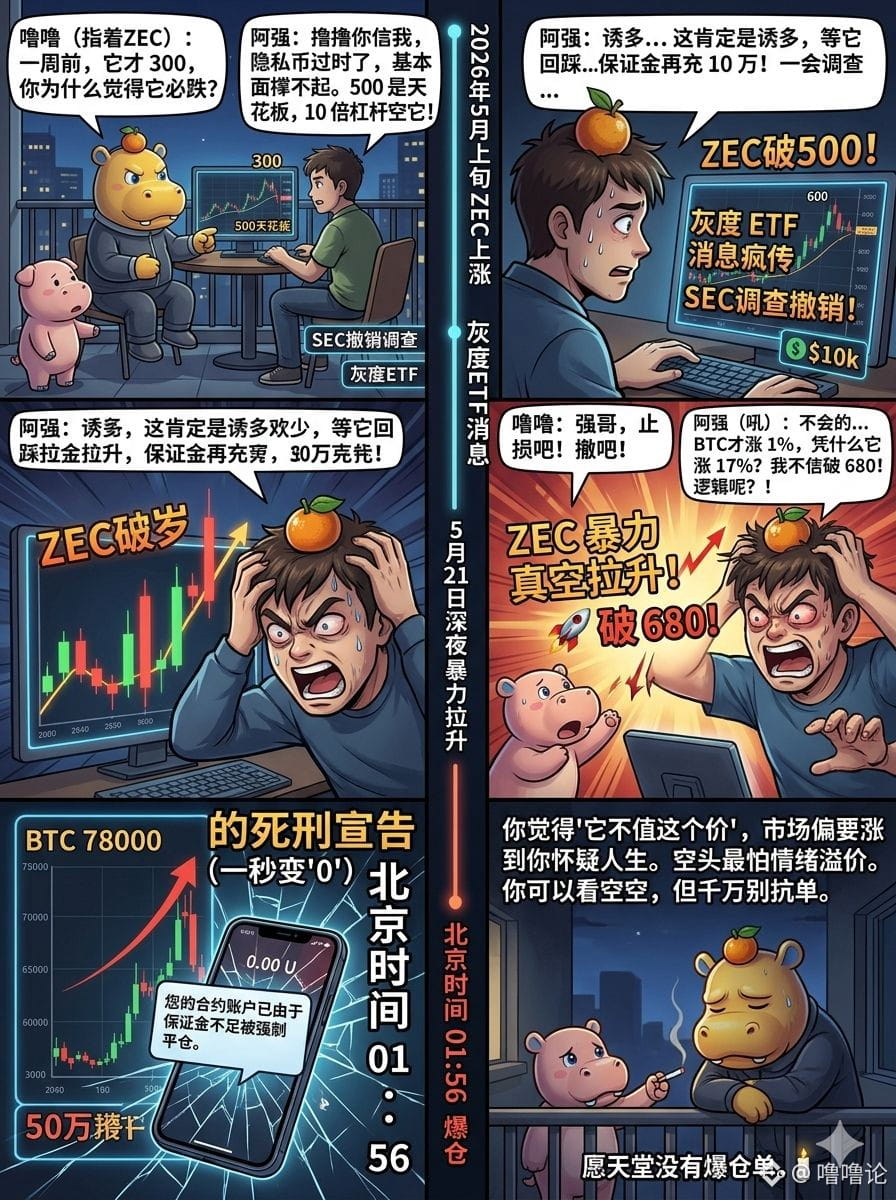
Brothers, at this moment, I'm sitting on the balcony at 2 AM, looking at the charts, feeling a mix of emotions. My best buddy, Aqiang, just watched his savings from the past three years turn to dust right before my eyes.
A week ago, ZEC was still hovering around 300. Aqiang, being an old-school trader, was convinced this was just a "dead cat bounce" for altcoins.
"Lulu, trust me, privacy coins are outdated; the fundamentals can't support this price. 500 is definitely the ceiling; if we don't short it, who will?"
He went in with 10x leverage. At the time, I thought it made sense; after all, doubling from 300 to 600 seemed like a pipe dream.
Who would have thought May would turn out to be ZEC's "magic month"?
First, the SEC dropped the investigation into the Zcash Foundation, and the weight on our shoulders disappeared;
Then news of the Grayscale ETF started spreading, and big money began pouring in like crazy.
When the price broke 500, Aqiang was still laughing: "This is just a trap, wait for the pullback."
When it broke 600, Aqiang started sweating, and he added another 100K to his margin.
Tonight, ZEC kicked off a wild and aggressive vacuum rally.
I was watching the ZEC candlestick chart shoot up straight into the sky.
"Qiang, get out, cut your losses!" I grabbed his arm.
Aqiang's eyes were bloodshot, fixed on the screen: "No way... BTC only went up 1%, why should it go up 17%? This doesn’t make sense! I refuse to believe it can break 680!"
That moment is something I'll never forget.
BTC broke 78000, and as the market pulled up, ZEC instantly faced a liquidity squeeze. The numbers on the screen jumped from 663 to 688 in an instant.
Aqiang's phone buzzed with a notification:
【Your contract account has been forcibly liquidated due to insufficient margin】.
500K, earned through countless sleepless nights, turned to "0" in a second.
Now, ZEC is still bouncing around 668, mocking everyone trying to "call the top."
Aqiang turned off the screen, said nothing, just borrowed a cigarette from me.
In the crypto space, logic is often a double-edged sword. You think, "It’s not worth this price," but the market insists on pushing up until you doubt your sanity. Bears fear not the good news, but this kind of irrational emotional premium after a good news and technical breakthrough.
You can be bearish, but never hold a losing position.
May there be no liquidation orders in heaven. #ZECUSDT $ZEC
Brothers, at this moment, I'm sitting on the balcony at 2 AM, looking at the charts, feeling a mix of emotions. My best buddy, Aqiang, just watched his savings from the past three years turn to dust right before my eyes.
A week ago, ZEC was still hovering around 300. Aqiang, being an old-school trader, was convinced this was just a "dead cat bounce" for altcoins.
"Lulu, trust me, privacy coins are outdated; the fundamentals can't support this price. 500 is definitely the ceiling; if we don't short it, who will?"
He went in with 10x leverage. At the time, I thought it made sense; after all, doubling from 300 to 600 seemed like a pipe dream.
Who would have thought May would turn out to be ZEC's "magic month"?
First, the SEC dropped the investigation into the Zcash Foundation, and the weight on our shoulders disappeared;
Then news of the Grayscale ETF started spreading, and big money began pouring in like crazy.
When the price broke 500, Aqiang was still laughing: "This is just a trap, wait for the pullback."
When it broke 600, Aqiang started sweating, and he added another 100K to his margin.
Tonight, ZEC kicked off a wild and aggressive vacuum rally.
I was watching the ZEC candlestick chart shoot up straight into the sky.
"Qiang, get out, cut your losses!" I grabbed his arm.
Aqiang's eyes were bloodshot, fixed on the screen: "No way... BTC only went up 1%, why should it go up 17%? This doesn’t make sense! I refuse to believe it can break 680!"
That moment is something I'll never forget.
BTC broke 78000, and as the market pulled up, ZEC instantly faced a liquidity squeeze. The numbers on the screen jumped from 663 to 688 in an instant.
Aqiang's phone buzzed with a notification:
【Your contract account has been forcibly liquidated due to insufficient margin】.
500K, earned through countless sleepless nights, turned to "0" in a second.
Now, ZEC is still bouncing around 668, mocking everyone trying to "call the top."
Aqiang turned off the screen, said nothing, just borrowed a cigarette from me.
In the crypto space, logic is often a double-edged sword. You think, "It’s not worth this price," but the market insists on pushing up until you doubt your sanity. Bears fear not the good news, but this kind of irrational emotional premium after a good news and technical breakthrough.
You can be bearish, but never hold a losing position.
May there be no liquidation orders in heaven. #ZECUSDT $ZEC
A week ago, ZEC was still hovering around 300. Aqiang, being an old-school trader, was convinced this was just a "dead cat bounce" for altcoins.
"Lulu, trust me, privacy coins are outdated; the fundamentals can't support this price. 500 is definitely the ceiling; if we don't short it, who will?"
He went in with 10x leverage. At the time, I thought it made sense; after all, doubling from 300 to 600 seemed like a pipe dream.
Who would have thought May would turn out to be ZEC's "magic month"?
First, the SEC dropped the investigation into the Zcash Foundation, and the weight on our shoulders disappeared;
Then news of the Grayscale ETF started spreading, and big money began pouring in like crazy.
When the price broke 500, Aqiang was still laughing: "This is just a trap, wait for the pullback."
When it broke 600, Aqiang started sweating, and he added another 100K to his margin.
Tonight, ZEC kicked off a wild and aggressive vacuum rally.
I was watching the ZEC candlestick chart shoot up straight into the sky.
"Qiang, get out, cut your losses!" I grabbed his arm.
Aqiang's eyes were bloodshot, fixed on the screen: "No way... BTC only went up 1%, why should it go up 17%? This doesn’t make sense! I refuse to believe it can break 680!"
That moment is something I'll never forget.
BTC broke 78000, and as the market pulled up, ZEC instantly faced a liquidity squeeze. The numbers on the screen jumped from 663 to 688 in an instant.
Aqiang's phone buzzed with a notification:
【Your contract account has been forcibly liquidated due to insufficient margin】.
500K, earned through countless sleepless nights, turned to "0" in a second.
Now, ZEC is still bouncing around 668, mocking everyone trying to "call the top."
Aqiang turned off the screen, said nothing, just borrowed a cigarette from me.
In the crypto space, logic is often a double-edged sword. You think, "It’s not worth this price," but the market insists on pushing up until you doubt your sanity. Bears fear not the good news, but this kind of irrational emotional premium after a good news and technical breakthrough.
You can be bearish, but never hold a losing position.
May there be no liquidation orders in heaven. #ZECUSDT $ZEC
1
261
·
--
Good afternoon, crypto dolphins swimming in the depths of the market.
Right now, the market can be summed up in four words: heart racing. Due to the stalemate in the Strait of Hormuz and the fluctuating macro inflation data, we’ve entered an extremely sensitive defensive period.
For those holding BTC above the 80k mark, it might be time to take a breather. The current candlestick action is hovering around 76,700.
Resistance level: The first hurdle is at 78,962 (50% Fibonacci retracement level), where a lot of trapped positions are stacked up. If we can't reclaim 81,700, this rebound may just be a “dead cat bounce.”
Support level: 76,700 is the current psychological line. If it breaks down, we’ll have to face the 74,500 range below.
ETH: Jumping around on the icy surface of 2,100.
The performance of our second coin has been consistently “sluggish.” Currently, it’s affected by low on-chain activity, leading to weak momentum.
Key level: We must reclaim 2,150 to have a chance to breathe.
Ultimate defense: 2,065. If this level cracks, everyone should be prepared to scoop up some chips around the psychological barrier of 2,000.
⚠️ Just a reminder:
Risk aversion is rising: Don’t forget, the current logic is “when gold rises, BTC falls.” With geopolitical instability, risk-off funds are leaning more towards traditional safe-haven assets.
Shrinking trading volume: The current consolidation is characterized by “low volume bearish declines,” which can easily wear down patience. Avoid frequently flipping positions in the middle of the range; be cautious of fees eating into your capital.
Macro variables: Keep an eye on news flow regarding the US-Iran situation; right now, the market isn’t driven by technical indicators but by news headlines. #ETH $BTC $ETH
Good afternoon, crypto dolphins swimming in the depths of the market.
Right now, the market can be summed up in four words: heart racing. Due to the stalemate in the Strait of Hormuz and the fluctuating macro inflation data, we’ve entered an extremely sensitive defensive period.
For those holding BTC above the 80k mark, it might be time to take a breather. The current candlestick action is hovering around 76,700.
Resistance level: The first hurdle is at 78,962 (50% Fibonacci retracement level), where a lot of trapped positions are stacked up. If we can't reclaim 81,700, this rebound may just be a “dead cat bounce.”
Support level: 76,700 is the current psychological line. If it breaks down, we’ll have to face the 74,500 range below.
ETH: Jumping around on the icy surface of 2,100.
The performance of our second coin has been consistently “sluggish.” Currently, it’s affected by low on-chain activity, leading to weak momentum.
Key level: We must reclaim 2,150 to have a chance to breathe.
Ultimate defense: 2,065. If this level cracks, everyone should be prepared to scoop up some chips around the psychological barrier of 2,000.
⚠️ Just a reminder:
Risk aversion is rising: Don’t forget, the current logic is “when gold rises, BTC falls.” With geopolitical instability, risk-off funds are leaning more towards traditional safe-haven assets.
Shrinking trading volume: The current consolidation is characterized by “low volume bearish declines,” which can easily wear down patience. Avoid frequently flipping positions in the middle of the range; be cautious of fees eating into your capital.
Macro variables: Keep an eye on news flow regarding the US-Iran situation; right now, the market isn’t driven by technical indicators but by news headlines. #ETH $BTC $ETH
Right now, the market can be summed up in four words: heart racing. Due to the stalemate in the Strait of Hormuz and the fluctuating macro inflation data, we’ve entered an extremely sensitive defensive period.
For those holding BTC above the 80k mark, it might be time to take a breather. The current candlestick action is hovering around 76,700.
Resistance level: The first hurdle is at 78,962 (50% Fibonacci retracement level), where a lot of trapped positions are stacked up. If we can't reclaim 81,700, this rebound may just be a “dead cat bounce.”
Support level: 76,700 is the current psychological line. If it breaks down, we’ll have to face the 74,500 range below.
ETH: Jumping around on the icy surface of 2,100.
The performance of our second coin has been consistently “sluggish.” Currently, it’s affected by low on-chain activity, leading to weak momentum.
Key level: We must reclaim 2,150 to have a chance to breathe.
Ultimate defense: 2,065. If this level cracks, everyone should be prepared to scoop up some chips around the psychological barrier of 2,000.
⚠️ Just a reminder:
Risk aversion is rising: Don’t forget, the current logic is “when gold rises, BTC falls.” With geopolitical instability, risk-off funds are leaning more towards traditional safe-haven assets.
Shrinking trading volume: The current consolidation is characterized by “low volume bearish declines,” which can easily wear down patience. Avoid frequently flipping positions in the middle of the range; be cautious of fees eating into your capital.
Macro variables: Keep an eye on news flow regarding the US-Iran situation; right now, the market isn’t driven by technical indicators but by news headlines. #ETH $BTC $ETH


1
624
·
--
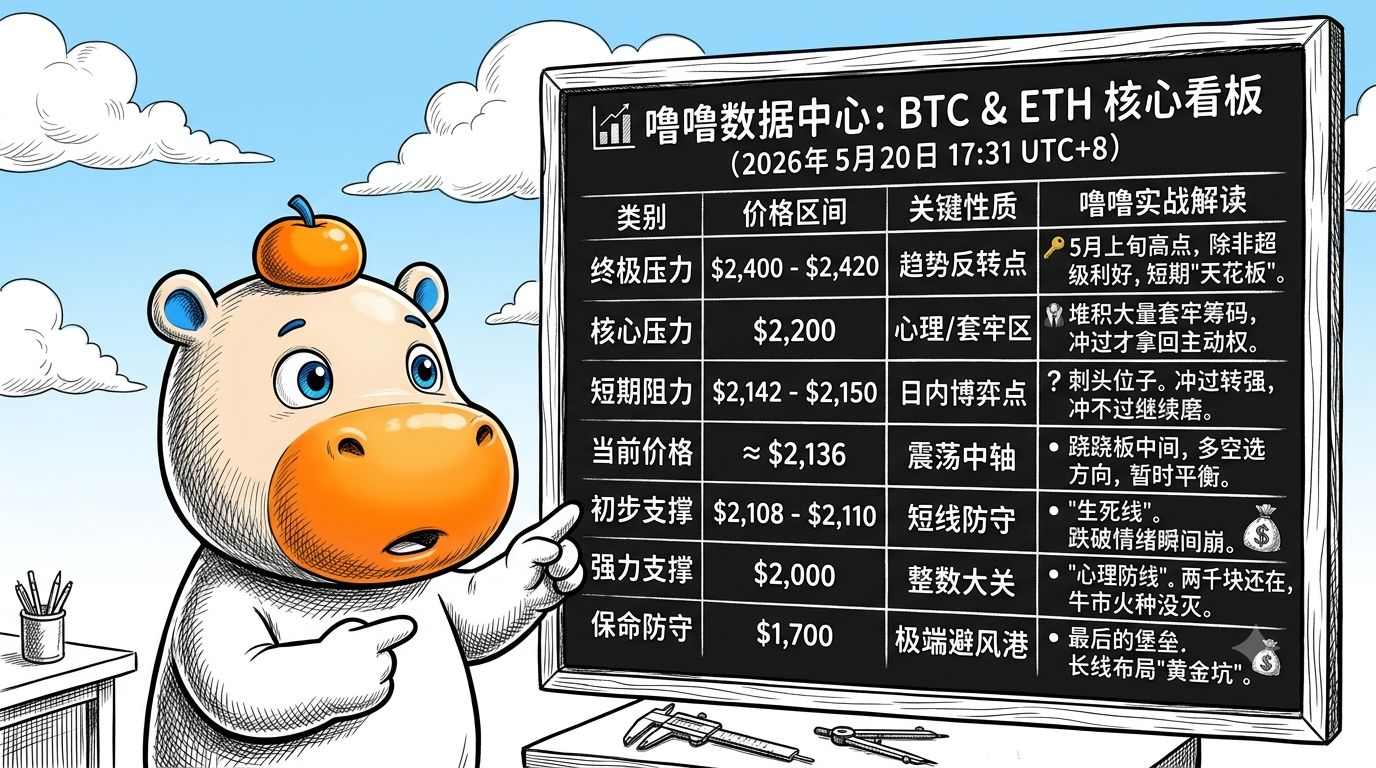
Right now, the market feels a bit like playing 'heartbeat pinball'; every little gust in the macro situation is directly reflected on the candlestick chart. Let me break down the current key levels and trading suggestions for you:
🚀 BTC Technical Analysis
BTC is currently in a tug-of-war around 77000, trying to bounce back from the morning's lows.
Resistance Levels:
78200 - 79100 (Short-term pressure zone): This is the average cost area for short-term holders and the current 'psychological barrier'.
80000 (Strong resistance wall): Not only is this an integer level, but it also houses a lot of trapped short positions. We can only say we've completely shaken off the current downtrend once we securely stand above 80000 on the daily chart.
Support Levels:
75000 - 76000 (First defense line): The market rebounded in this range this morning, indicating significant buy support.
72350 (Line of life and death): This is the 100-day moving average. If we break below here, panic in the market could drag prices down to 70000.
📉 ETH Technical Analysis
ETH is behaving a bit 'fragile' right now, currently consolidating just above 2100.
Resistance Levels:
2150 (Key short-term level): Due to recent heavy selling pressure, the price has repeatedly spiked and then pulled back.
2200 (Strong pressure level): We need to break above this to reverse the short-term bearish trend.
Support Levels:
2100 (Current support): We are currently testing this level, and the support seems decent.
2050 - 2075 (Danger zone): If we drop below 2050, we could directly pull back to the integer level.
💡 Trading Suggestions
Given the current situation, I recommend taking a 'defensive offensive' strategy:
1. Left-side trading (limit order approach):
Long position: If BTC retests around 75500, you might consider a small long position, with a stop loss set below 74800.
Short position: In the heavy pressure zone of 79800 - 80200, you can place short orders in batches, anticipating a pullback after a false breakout.
2. Right-side trading (confirmation approach):
Wait for signals: Currently, we are in a sideways consolidation. The best move is to wait until BTC firmly holds above 78200 before chasing long, targeting 82000.
Watch for macro variables: The current market is highly dependent on U.S.-Iran relations and geopolitical news. Any sudden breaking news could render technical levels ineffective. 'News > Technicals' is the unspoken rule right now. #BTC☀ $BTC $ETH
Right now, the market feels a bit like playing 'heartbeat pinball'; every little gust in the macro situation is directly reflected on the candlestick chart. Let me break down the current key levels and trading suggestions for you:
🚀 BTC Technical Analysis
BTC is currently in a tug-of-war around 77000, trying to bounce back from the morning's lows.
Resistance Levels:
78200 - 79100 (Short-term pressure zone): This is the average cost area for short-term holders and the current 'psychological barrier'.
80000 (Strong resistance wall): Not only is this an integer level, but it also houses a lot of trapped short positions. We can only say we've completely shaken off the current downtrend once we securely stand above 80000 on the daily chart.
Support Levels:
75000 - 76000 (First defense line): The market rebounded in this range this morning, indicating significant buy support.
72350 (Line of life and death): This is the 100-day moving average. If we break below here, panic in the market could drag prices down to 70000.
📉 ETH Technical Analysis
ETH is behaving a bit 'fragile' right now, currently consolidating just above 2100.
Resistance Levels:
2150 (Key short-term level): Due to recent heavy selling pressure, the price has repeatedly spiked and then pulled back.
2200 (Strong pressure level): We need to break above this to reverse the short-term bearish trend.
Support Levels:
2100 (Current support): We are currently testing this level, and the support seems decent.
2050 - 2075 (Danger zone): If we drop below 2050, we could directly pull back to the integer level.
💡 Trading Suggestions
Given the current situation, I recommend taking a 'defensive offensive' strategy:
1. Left-side trading (limit order approach):
Long position: If BTC retests around 75500, you might consider a small long position, with a stop loss set below 74800.
Short position: In the heavy pressure zone of 79800 - 80200, you can place short orders in batches, anticipating a pullback after a false breakout.
2. Right-side trading (confirmation approach):
Wait for signals: Currently, we are in a sideways consolidation. The best move is to wait until BTC firmly holds above 78200 before chasing long, targeting 82000.
Watch for macro variables: The current market is highly dependent on U.S.-Iran relations and geopolitical news. Any sudden breaking news could render technical levels ineffective. 'News > Technicals' is the unspoken rule right now. #BTC☀ $BTC $ETH
🚀 BTC Technical Analysis
BTC is currently in a tug-of-war around 77000, trying to bounce back from the morning's lows.
Resistance Levels:
78200 - 79100 (Short-term pressure zone): This is the average cost area for short-term holders and the current 'psychological barrier'.
80000 (Strong resistance wall): Not only is this an integer level, but it also houses a lot of trapped short positions. We can only say we've completely shaken off the current downtrend once we securely stand above 80000 on the daily chart.
Support Levels:
75000 - 76000 (First defense line): The market rebounded in this range this morning, indicating significant buy support.
72350 (Line of life and death): This is the 100-day moving average. If we break below here, panic in the market could drag prices down to 70000.
📉 ETH Technical Analysis
ETH is behaving a bit 'fragile' right now, currently consolidating just above 2100.
Resistance Levels:
2150 (Key short-term level): Due to recent heavy selling pressure, the price has repeatedly spiked and then pulled back.
2200 (Strong pressure level): We need to break above this to reverse the short-term bearish trend.
Support Levels:
2100 (Current support): We are currently testing this level, and the support seems decent.
2050 - 2075 (Danger zone): If we drop below 2050, we could directly pull back to the integer level.
💡 Trading Suggestions
Given the current situation, I recommend taking a 'defensive offensive' strategy:
1. Left-side trading (limit order approach):
Long position: If BTC retests around 75500, you might consider a small long position, with a stop loss set below 74800.
Short position: In the heavy pressure zone of 79800 - 80200, you can place short orders in batches, anticipating a pullback after a false breakout.
2. Right-side trading (confirmation approach):
Wait for signals: Currently, we are in a sideways consolidation. The best move is to wait until BTC firmly holds above 78200 before chasing long, targeting 82000.
Watch for macro variables: The current market is highly dependent on U.S.-Iran relations and geopolitical news. Any sudden breaking news could render technical levels ineffective. 'News > Technicals' is the unspoken rule right now. #BTC☀ $BTC $ETH
1
303
·
--
Article
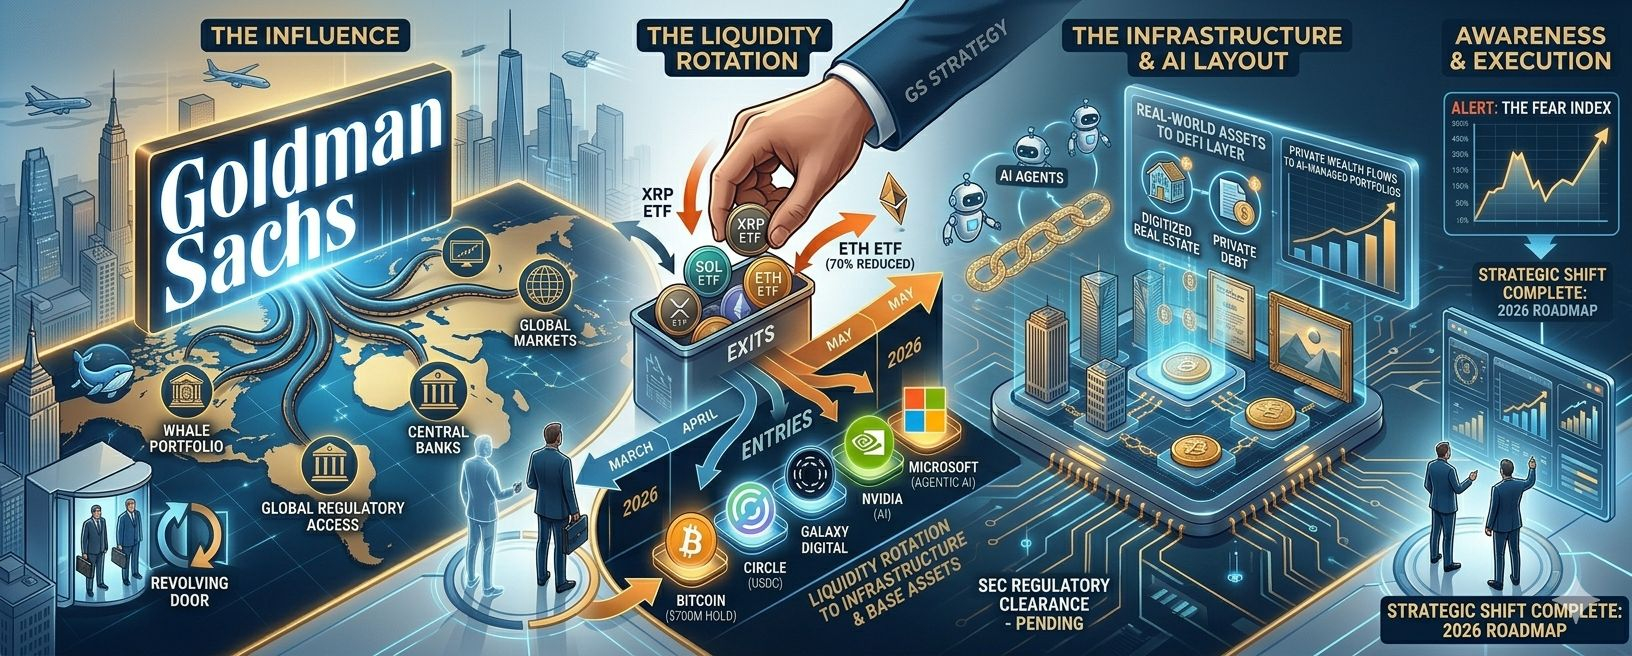
Wall Street's 'Octopus' Big Reallocation: The 150-Year Unbeaten Scheme and Strategy of Goldman SachsIn the finance world, if you say Goldman Sachs is the 'White House branch on Wall Street,' no one would be surprised. This 'financial empire' established over 150 years ago has its tentacles reaching into every crack of global power, like an octopus.
Recently, a late-night disclosure of Goldman Sachs' 13F holdings hit the market like a depth charge, shaking the calm of summer 2026. Everyone's buzzing about 'Goldman going short,' but the reality is far more spine-chilling than just liquidating positions.
1. Background: Who is Goldman Sachs? The 'kingmaker' of finance.
Goldman Sachs isn't just a bank; it's the 'command center' of global capital. From starting out in 1869 by picking up scraps of tickets on the road to now managing over $2.8 trillion in assets, their strength lies not just in making profits but in 'defining the rules.'
Wall Street's 'Octopus' Big Reallocation: The 150-Year Unbeaten Scheme and Strategy of Goldman Sachs
In the finance world, if you say Goldman Sachs is the 'White House branch on Wall Street,' no one would be surprised. This 'financial empire' established over 150 years ago has its tentacles reaching into every crack of global power, like an octopus.
Recently, a late-night disclosure of Goldman Sachs' 13F holdings hit the market like a depth charge, shaking the calm of summer 2026. Everyone's buzzing about 'Goldman going short,' but the reality is far more spine-chilling than just liquidating positions.
1. Background: Who is Goldman Sachs? The 'kingmaker' of finance.
Goldman Sachs isn't just a bank; it's the 'command center' of global capital. From starting out in 1869 by picking up scraps of tickets on the road to now managing over $2.8 trillion in assets, their strength lies not just in making profits but in 'defining the rules.'
Recently, a late-night disclosure of Goldman Sachs' 13F holdings hit the market like a depth charge, shaking the calm of summer 2026. Everyone's buzzing about 'Goldman going short,' but the reality is far more spine-chilling than just liquidating positions.
1. Background: Who is Goldman Sachs? The 'kingmaker' of finance.
Goldman Sachs isn't just a bank; it's the 'command center' of global capital. From starting out in 1869 by picking up scraps of tickets on the road to now managing over $2.8 trillion in assets, their strength lies not just in making profits but in 'defining the rules.'
1
2
473
·
--
Bullish
Currently, Ethereum's price is hovering around 2136, and the whole market exudes a lazy "if the enemy doesn't move, I won't move" vibe. But from a technical chart perspective, several key levels have been clearly drawn out:
🧗♂️ Resistance Levels — Those walls we want to break through
1. First Resistance Level: 2142 - 2150
Analysis: This is the intraday high and a short-term psychological battleground. If it can hold steady here, the bulls can catch their breath.
2. Key Resistance Level: 2200
Analysis: This is an extremely heavy "ceiling." Recent market sentiment has been affected by ETF fund outflows and institutional selling pressure, with a lot of trapped positions accumulating around 2200.
3. Ultimate Resistance Level: 2400 - 2420
Analysis: The high point from early May. Unless there’s a major positive catalyst (like substantial breakthroughs from the CLARITY Act), it will be tough to break through this wall in the short term.
🛡️ Support Levels — Those floors we can't break below
1. First Support Level: 2108 - 2110
Analysis: ** This is currently the "line of life and death." If the daily close falls below here, the bears will pounce like sharks sensing blood.
2. Strong Support Level: 2000 (round psychological barrier)
Analysis: Psychological defense line. As long as the 2000 mark holds, the market hasn't reached absolute despair. If it breaks, there will be a large vacuum below.
3. Defensive Level: 1700
Analysis: If extreme circumstances occur (like macro liquidity drying up), this is the last safe haven.
🐢 Lulz's Advice:
Indicators suggest: RSI is currently hovering around 50, and MACD hasn't climbed back above the zero line yet. Translated into plain language: "Still indecisive, hasn’t picked a direction yet."
Current Strategy: Right now, ETH feels more like it’s in a "sideways grind" market. Instead of forcing a prediction, it’s better to wait and see how it performs on volume when it touches 2110 or 2150.
Although ETH looks a bit weak lately, the big player BitMine has taken advantage of the drop below 2200 to stack up over 70,000 more coins. The big fish are eating meat, and the little shrimp should hold tight.
Lulz’s summary: Resistance levels pressing down from above, support levels cushioning from below. It’s a classic "range-bound fluctuation" right now. I suggest watching more and acting less, enjoying a cup of coffee, and learning from the capybara — adapt to changes without changing yourself. #ETH走势分析 $ETH
Currently, Ethereum's price is hovering around 2136, and the whole market exudes a lazy "if the enemy doesn't move, I won't move" vibe. But from a technical chart perspective, several key levels have been clearly drawn out:
🧗♂️ Resistance Levels — Those walls we want to break through
1. First Resistance Level: 2142 - 2150
Analysis: This is the intraday high and a short-term psychological battleground. If it can hold steady here, the bulls can catch their breath.
2. Key Resistance Level: 2200
Analysis: This is an extremely heavy "ceiling." Recent market sentiment has been affected by ETF fund outflows and institutional selling pressure, with a lot of trapped positions accumulating around 2200.
3. Ultimate Resistance Level: 2400 - 2420
Analysis: The high point from early May. Unless there’s a major positive catalyst (like substantial breakthroughs from the CLARITY Act), it will be tough to break through this wall in the short term.
🛡️ Support Levels — Those floors we can't break below
1. First Support Level: 2108 - 2110
Analysis: ** This is currently the "line of life and death." If the daily close falls below here, the bears will pounce like sharks sensing blood.
2. Strong Support Level: 2000 (round psychological barrier)
Analysis: Psychological defense line. As long as the 2000 mark holds, the market hasn't reached absolute despair. If it breaks, there will be a large vacuum below.
3. Defensive Level: 1700
Analysis: If extreme circumstances occur (like macro liquidity drying up), this is the last safe haven.
🐢 Lulz's Advice:
Indicators suggest: RSI is currently hovering around 50, and MACD hasn't climbed back above the zero line yet. Translated into plain language: "Still indecisive, hasn’t picked a direction yet."
Current Strategy: Right now, ETH feels more like it’s in a "sideways grind" market. Instead of forcing a prediction, it’s better to wait and see how it performs on volume when it touches 2110 or 2150.
Although ETH looks a bit weak lately, the big player BitMine has taken advantage of the drop below 2200 to stack up over 70,000 more coins. The big fish are eating meat, and the little shrimp should hold tight.
Lulz’s summary: Resistance levels pressing down from above, support levels cushioning from below. It’s a classic "range-bound fluctuation" right now. I suggest watching more and acting less, enjoying a cup of coffee, and learning from the capybara — adapt to changes without changing yourself. #ETH走势分析 $ETH
🧗♂️ Resistance Levels — Those walls we want to break through
1. First Resistance Level: 2142 - 2150
Analysis: This is the intraday high and a short-term psychological battleground. If it can hold steady here, the bulls can catch their breath.
2. Key Resistance Level: 2200
Analysis: This is an extremely heavy "ceiling." Recent market sentiment has been affected by ETF fund outflows and institutional selling pressure, with a lot of trapped positions accumulating around 2200.
3. Ultimate Resistance Level: 2400 - 2420
Analysis: The high point from early May. Unless there’s a major positive catalyst (like substantial breakthroughs from the CLARITY Act), it will be tough to break through this wall in the short term.
🛡️ Support Levels — Those floors we can't break below
1. First Support Level: 2108 - 2110
Analysis: ** This is currently the "line of life and death." If the daily close falls below here, the bears will pounce like sharks sensing blood.
2. Strong Support Level: 2000 (round psychological barrier)
Analysis: Psychological defense line. As long as the 2000 mark holds, the market hasn't reached absolute despair. If it breaks, there will be a large vacuum below.
3. Defensive Level: 1700
Analysis: If extreme circumstances occur (like macro liquidity drying up), this is the last safe haven.
🐢 Lulz's Advice:
Indicators suggest: RSI is currently hovering around 50, and MACD hasn't climbed back above the zero line yet. Translated into plain language: "Still indecisive, hasn’t picked a direction yet."
Current Strategy: Right now, ETH feels more like it’s in a "sideways grind" market. Instead of forcing a prediction, it’s better to wait and see how it performs on volume when it touches 2110 or 2150.
Although ETH looks a bit weak lately, the big player BitMine has taken advantage of the drop below 2200 to stack up over 70,000 more coins. The big fish are eating meat, and the little shrimp should hold tight.
Lulz’s summary: Resistance levels pressing down from above, support levels cushioning from below. It’s a classic "range-bound fluctuation" right now. I suggest watching more and acting less, enjoying a cup of coffee, and learning from the capybara — adapt to changes without changing yourself. #ETH走势分析 $ETH

1
356
·
--
Honestly, looking at the current situation between the US and Iran feels like watching a high-stakes game that's about to blow up. I just wrapped up the latest intel, and the air is thick with tension.
The core issue now is that both sides have shown their cards, but neither is willing to back down. The US is being as tough as nails, insisting that Iran hand over those hundreds of kilos of enriched uranium and lay all its cards on the table before even talking. Iran, on the other hand, is not backing down at all, firing back that if the sanctions aren't lifted and the frozen assets aren't returned, this isn't over. Right now, it's like both sides are flooring the gas, just waiting to see who will swerve first.
What strikes me as surreal is the Strait of Hormuz, where Iran is not just blocking access but also considering a “toll” system. That move is brilliant, turning geopolitical strategy into a rental business. However, there was some good news today; the gas tanker finally broke through to Japan, giving the nearly depleted energy market a much-needed breath of life.
Trump has also been busy online, posting all sorts of "countdowns" and those bizarre AI maps, really cranking up the psychological warfare. While we haven't reached a point of no return yet, this feeling of "slow suffocation" is even worse.
Everyone should stay alert lately, whether it's keeping an eye on oil prices or that little stash of assets you have; this week is likely to be a real rollercoaster. I think at this critical juncture, it's best not to bet on any "absolute peace" too easily and be ready for the situation to flip at any moment—that’s the most professional approach. Anyway, let's hope this tightrope doesn't snap for real. #伊朗加密航运保险平台 $BTC $ETH
Honestly, looking at the current situation between the US and Iran feels like watching a high-stakes game that's about to blow up. I just wrapped up the latest intel, and the air is thick with tension.
The core issue now is that both sides have shown their cards, but neither is willing to back down. The US is being as tough as nails, insisting that Iran hand over those hundreds of kilos of enriched uranium and lay all its cards on the table before even talking. Iran, on the other hand, is not backing down at all, firing back that if the sanctions aren't lifted and the frozen assets aren't returned, this isn't over. Right now, it's like both sides are flooring the gas, just waiting to see who will swerve first.
What strikes me as surreal is the Strait of Hormuz, where Iran is not just blocking access but also considering a “toll” system. That move is brilliant, turning geopolitical strategy into a rental business. However, there was some good news today; the gas tanker finally broke through to Japan, giving the nearly depleted energy market a much-needed breath of life.
Trump has also been busy online, posting all sorts of "countdowns" and those bizarre AI maps, really cranking up the psychological warfare. While we haven't reached a point of no return yet, this feeling of "slow suffocation" is even worse.
Everyone should stay alert lately, whether it's keeping an eye on oil prices or that little stash of assets you have; this week is likely to be a real rollercoaster. I think at this critical juncture, it's best not to bet on any "absolute peace" too easily and be ready for the situation to flip at any moment—that’s the most professional approach. Anyway, let's hope this tightrope doesn't snap for real. #伊朗加密航运保险平台 $BTC $ETH
The core issue now is that both sides have shown their cards, but neither is willing to back down. The US is being as tough as nails, insisting that Iran hand over those hundreds of kilos of enriched uranium and lay all its cards on the table before even talking. Iran, on the other hand, is not backing down at all, firing back that if the sanctions aren't lifted and the frozen assets aren't returned, this isn't over. Right now, it's like both sides are flooring the gas, just waiting to see who will swerve first.
What strikes me as surreal is the Strait of Hormuz, where Iran is not just blocking access but also considering a “toll” system. That move is brilliant, turning geopolitical strategy into a rental business. However, there was some good news today; the gas tanker finally broke through to Japan, giving the nearly depleted energy market a much-needed breath of life.
Trump has also been busy online, posting all sorts of "countdowns" and those bizarre AI maps, really cranking up the psychological warfare. While we haven't reached a point of no return yet, this feeling of "slow suffocation" is even worse.
Everyone should stay alert lately, whether it's keeping an eye on oil prices or that little stash of assets you have; this week is likely to be a real rollercoaster. I think at this critical juncture, it's best not to bet on any "absolute peace" too easily and be ready for the situation to flip at any moment—that’s the most professional approach. Anyway, let's hope this tightrope doesn't snap for real. #伊朗加密航运保险平台 $BTC $ETH

1
1
273
·
--
Bearish
Help, is this broken market trying to make everyone report to the electronic factory? 😡
Waking up with my heart skipping a beat. I thought I could just chill and achieve financial freedom, but this market wants me to "financially self-destruct" instead!
Bitcoin: Are you a reincarnated diver or what?
77003.
Haha, so much for the promised bull market lasting forever! This Bitcoin really can’t handle compliments; just a two-point rise and it’s already bungee jumping. Is that over ten thousand BTC ETF net outflow for real? Those Wall Street foxes are running faster than rabbits, while BlackRock is over there shouting, "Everyone, don’t panic, I'm bottom-fishing," yeah right! Just because you’re missing a bit of my fees, huh? If this 77k level can’t hold, everyone better get ready to queue on the rooftop for their tickets!
Ethereum is no better: Just change your name to "ETH Crash" already.
2120 range.
I’m really fed up with the Ethereum Foundation! Every time the market takes a breath, you pull BTC out of Lido to sell. 50 million dollars? Are you short on cash for salaries or for a trip to Mars? If we break below 2100, we’ll be losing our shorts too. Meanwhile, that HYPE next door is skyrocketing, and you’re here strolling like an old lady—can’t you show some ambition?!
Talking about long-term holding, but behind the scenes, selling harder than anyone else.
Don’t touch leverage: What kind of leverage are you planning to use in this market? You must really be tired of living.
Mindset is collapsing: Right now, the market is like "bulls are crying, bears are laughing, institutions are cashing out, and I’m going crazy."
Final warning:
Don’t ask me if it’s time to bottom-fish; my wallet is cleaner than my face! If you insist on entering the market, I suggest you burn some high incense at a temple first, or just turn off your phone and take a long nap.
I really don’t want to stay in this messed-up circle for even a minute longer; once I break even (though I have no idea when that’ll be), I’ll definitely delete this app and run! Ugh! #ETH $BTC $ETH
Help, is this broken market trying to make everyone report to the electronic factory? 😡
Waking up with my heart skipping a beat. I thought I could just chill and achieve financial freedom, but this market wants me to "financially self-destruct" instead!
Bitcoin: Are you a reincarnated diver or what?
77003.
Haha, so much for the promised bull market lasting forever! This Bitcoin really can’t handle compliments; just a two-point rise and it’s already bungee jumping. Is that over ten thousand BTC ETF net outflow for real? Those Wall Street foxes are running faster than rabbits, while BlackRock is over there shouting, "Everyone, don’t panic, I'm bottom-fishing," yeah right! Just because you’re missing a bit of my fees, huh? If this 77k level can’t hold, everyone better get ready to queue on the rooftop for their tickets!
Ethereum is no better: Just change your name to "ETH Crash" already.
2120 range.
I’m really fed up with the Ethereum Foundation! Every time the market takes a breath, you pull BTC out of Lido to sell. 50 million dollars? Are you short on cash for salaries or for a trip to Mars? If we break below 2100, we’ll be losing our shorts too. Meanwhile, that HYPE next door is skyrocketing, and you’re here strolling like an old lady—can’t you show some ambition?!
Talking about long-term holding, but behind the scenes, selling harder than anyone else.
Don’t touch leverage: What kind of leverage are you planning to use in this market? You must really be tired of living.
Mindset is collapsing: Right now, the market is like "bulls are crying, bears are laughing, institutions are cashing out, and I’m going crazy."
Final warning:
Don’t ask me if it’s time to bottom-fish; my wallet is cleaner than my face! If you insist on entering the market, I suggest you burn some high incense at a temple first, or just turn off your phone and take a long nap.
I really don’t want to stay in this messed-up circle for even a minute longer; once I break even (though I have no idea when that’ll be), I’ll definitely delete this app and run! Ugh! #ETH $BTC $ETH
Waking up with my heart skipping a beat. I thought I could just chill and achieve financial freedom, but this market wants me to "financially self-destruct" instead!
Bitcoin: Are you a reincarnated diver or what?
77003.
Haha, so much for the promised bull market lasting forever! This Bitcoin really can’t handle compliments; just a two-point rise and it’s already bungee jumping. Is that over ten thousand BTC ETF net outflow for real? Those Wall Street foxes are running faster than rabbits, while BlackRock is over there shouting, "Everyone, don’t panic, I'm bottom-fishing," yeah right! Just because you’re missing a bit of my fees, huh? If this 77k level can’t hold, everyone better get ready to queue on the rooftop for their tickets!
Ethereum is no better: Just change your name to "ETH Crash" already.
2120 range.
I’m really fed up with the Ethereum Foundation! Every time the market takes a breath, you pull BTC out of Lido to sell. 50 million dollars? Are you short on cash for salaries or for a trip to Mars? If we break below 2100, we’ll be losing our shorts too. Meanwhile, that HYPE next door is skyrocketing, and you’re here strolling like an old lady—can’t you show some ambition?!
Talking about long-term holding, but behind the scenes, selling harder than anyone else.
Don’t touch leverage: What kind of leverage are you planning to use in this market? You must really be tired of living.
Mindset is collapsing: Right now, the market is like "bulls are crying, bears are laughing, institutions are cashing out, and I’m going crazy."
Final warning:
Don’t ask me if it’s time to bottom-fish; my wallet is cleaner than my face! If you insist on entering the market, I suggest you burn some high incense at a temple first, or just turn off your phone and take a long nap.
I really don’t want to stay in this messed-up circle for even a minute longer; once I break even (though I have no idea when that’ll be), I’ll definitely delete this app and run! Ugh! #ETH $BTC $ETH

1
397
·
--
Bullish
Folks, we're getting wrecked! This market has me waking up at night just to sip on some cold water to calm down...
I just finished checking the latest charts, and BTC is still jumping around that 78000 level. Honestly, the current market feels like a bad boyfriend, giving you a glimmer of hope (bumping up a couple hundred points), only to turn around and hit you with some cold shoulder (sideways for two hours).
Let me hit you with the key points (all solid info):
BTC: Right now, it's in a bit of an awkward spot. Just washed out 550 million in long positions, and the shorts are feeling pretty smug. But I took a look at the depth chart on Binance, and there’s a “golden wall” at 77000 holding strong. As long as we don’t break below this level, we’re still good friends, and I’m eyeing a rebound around 79600.
ETH: Ugh, mentioning Ethereum just breaks my heart. The exchange rate has dropped to 0.0278; this isn’t just “following the dip,” it’s like it’s in free fall! If it doesn’t regain 2260 in the short term, I advise everyone to hold off on catching knives and keep your USDT warm for now.
To sum up the current “crazy moves”: The macro environment (yeah, that pesky PPI data) isn’t very friendly, and everyone’s waiting for a breeze. If you’re itching to jump in now, I’ll give you six words: light exposure, stop loss, don’t FOMO!
Don’t be fooled by those influencers shouting about “100x coins”; we need to survive longer to actually make profit. The current strategy is: watch BTC, sit tight on ETH, hold USDT, and stay calm.
What’s everyone thinking right now? Are we looking at a “flashback” rebound, or are we bracing for a deeper correction? Let’s discuss in the comments and see who’s the real “contrarian indicator”! 👇#BTC $BTC $ETH
Folks, we're getting wrecked! This market has me waking up at night just to sip on some cold water to calm down...
I just finished checking the latest charts, and BTC is still jumping around that 78000 level. Honestly, the current market feels like a bad boyfriend, giving you a glimmer of hope (bumping up a couple hundred points), only to turn around and hit you with some cold shoulder (sideways for two hours).
Let me hit you with the key points (all solid info):
BTC: Right now, it's in a bit of an awkward spot. Just washed out 550 million in long positions, and the shorts are feeling pretty smug. But I took a look at the depth chart on Binance, and there’s a “golden wall” at 77000 holding strong. As long as we don’t break below this level, we’re still good friends, and I’m eyeing a rebound around 79600.
ETH: Ugh, mentioning Ethereum just breaks my heart. The exchange rate has dropped to 0.0278; this isn’t just “following the dip,” it’s like it’s in free fall! If it doesn’t regain 2260 in the short term, I advise everyone to hold off on catching knives and keep your USDT warm for now.
To sum up the current “crazy moves”: The macro environment (yeah, that pesky PPI data) isn’t very friendly, and everyone’s waiting for a breeze. If you’re itching to jump in now, I’ll give you six words: light exposure, stop loss, don’t FOMO!
Don’t be fooled by those influencers shouting about “100x coins”; we need to survive longer to actually make profit. The current strategy is: watch BTC, sit tight on ETH, hold USDT, and stay calm.
What’s everyone thinking right now? Are we looking at a “flashback” rebound, or are we bracing for a deeper correction? Let’s discuss in the comments and see who’s the real “contrarian indicator”! 👇#BTC $BTC $ETH
I just finished checking the latest charts, and BTC is still jumping around that 78000 level. Honestly, the current market feels like a bad boyfriend, giving you a glimmer of hope (bumping up a couple hundred points), only to turn around and hit you with some cold shoulder (sideways for two hours).
Let me hit you with the key points (all solid info):
BTC: Right now, it's in a bit of an awkward spot. Just washed out 550 million in long positions, and the shorts are feeling pretty smug. But I took a look at the depth chart on Binance, and there’s a “golden wall” at 77000 holding strong. As long as we don’t break below this level, we’re still good friends, and I’m eyeing a rebound around 79600.
ETH: Ugh, mentioning Ethereum just breaks my heart. The exchange rate has dropped to 0.0278; this isn’t just “following the dip,” it’s like it’s in free fall! If it doesn’t regain 2260 in the short term, I advise everyone to hold off on catching knives and keep your USDT warm for now.
To sum up the current “crazy moves”: The macro environment (yeah, that pesky PPI data) isn’t very friendly, and everyone’s waiting for a breeze. If you’re itching to jump in now, I’ll give you six words: light exposure, stop loss, don’t FOMO!
Don’t be fooled by those influencers shouting about “100x coins”; we need to survive longer to actually make profit. The current strategy is: watch BTC, sit tight on ETH, hold USDT, and stay calm.
What’s everyone thinking right now? Are we looking at a “flashback” rebound, or are we bracing for a deeper correction? Let’s discuss in the comments and see who’s the real “contrarian indicator”! 👇#BTC $BTC $ETH

1
1.2k
·
--
Bearish
The real reason behind SpaceX going public👇👇👇#SpaceX最快6月12日纳斯达克上市 $BTC
{future}(BTCUSDT)
The real reason behind SpaceX going public👇👇👇#SpaceX最快6月12日纳斯达克上市 $BTC




1
155
·
--
Bullish
The battle between bulls and bears is intense, and the market rhythm is gradually shifting towards a choppy consolidation. From a technical standpoint, short-term traders need to focus on the strength of bull defense at key support levels. Here’s an analysis of the core support and resistance levels for the current market:
📊 BTC: Tug-of-war around the psychological level of 80000
BTC is currently oscillating around the whole number range of 79000 to 80000. This week, bulls made attempts to push higher, but under the pressure of key moving averages on the daily chart, the overall control is temporarily dominated by bears.
Core resistance zone:
80000 - 80500: Short-term psychological whole number level. To reverse the downturn, bulls need to establish consecutive daily closes above this area.
82000 - 82230: The strong resistance zone of the 200-day moving average (200-day MA). This level has faced resistance five times this month; any rebound will first be seen as a broad consolidation until a volume breakout occurs.
Core support zone:
79000: This week’s dense trading area and the “bull line” that has repeatedly bounced back. If this level is breached, the short-term downside potential will open further.
76500 - 77000: The intersection of the daily ascending trend support line and previous breakout points, which is a higher-level buy defense zone.
📉 ETH: Weak consolidation after breaking moving averages
ETH’s performance is significantly weaker than the market, having broken below the dense area where the 50-day and 200-day moving averages intersect, currently in a state of following the market's sell-off.
Core resistance zone:
2280 - 2300: The dense area near the weekly opening price; bulls need to reclaim this zone to effectively stem the bleeding.
2335 - 2375: The dense intersection of the 50-day and 200-day moving averages. With the 200-day MA showing signs of a downturn, the technical pressure here is very strong.
Core support zone:
2210 - 2230: The short-term previous low on the 4-hour chart, also the last line of defense for bullish funds trying to resist intraday selling.
2150: The boundary of a strong liquidity vacuum zone deep on the daily chart; if 2210 breaks, the market is likely to retest this long-term support downwards.
💡 Trading Strategy:
Against the backdrop of rising U.S. Treasury yields and suppressed macro expectations, the market is unlikely to break upward in one go; it’s more probable to maintain a “pressure from moving averages above and support from funds below” grinding rhythm. In terms of operations, it’s advisable to stay cautious, watch more, and act less. #BTC☀ #ETH走势分析 $ETH
{future}(ETHUSDT)
The battle between bulls and bears is intense, and the market rhythm is gradually shifting towards a choppy consolidation. From a technical standpoint, short-term traders need to focus on the strength of bull defense at key support levels. Here’s an analysis of the core support and resistance levels for the current market:
📊 BTC: Tug-of-war around the psychological level of 80000
BTC is currently oscillating around the whole number range of 79000 to 80000. This week, bulls made attempts to push higher, but under the pressure of key moving averages on the daily chart, the overall control is temporarily dominated by bears.
Core resistance zone:
80000 - 80500: Short-term psychological whole number level. To reverse the downturn, bulls need to establish consecutive daily closes above this area.
82000 - 82230: The strong resistance zone of the 200-day moving average (200-day MA). This level has faced resistance five times this month; any rebound will first be seen as a broad consolidation until a volume breakout occurs.
Core support zone:
79000: This week’s dense trading area and the “bull line” that has repeatedly bounced back. If this level is breached, the short-term downside potential will open further.
76500 - 77000: The intersection of the daily ascending trend support line and previous breakout points, which is a higher-level buy defense zone.
📉 ETH: Weak consolidation after breaking moving averages
ETH’s performance is significantly weaker than the market, having broken below the dense area where the 50-day and 200-day moving averages intersect, currently in a state of following the market's sell-off.
Core resistance zone:
2280 - 2300: The dense area near the weekly opening price; bulls need to reclaim this zone to effectively stem the bleeding.
2335 - 2375: The dense intersection of the 50-day and 200-day moving averages. With the 200-day MA showing signs of a downturn, the technical pressure here is very strong.
Core support zone:
2210 - 2230: The short-term previous low on the 4-hour chart, also the last line of defense for bullish funds trying to resist intraday selling.
2150: The boundary of a strong liquidity vacuum zone deep on the daily chart; if 2210 breaks, the market is likely to retest this long-term support downwards.
💡 Trading Strategy:
Against the backdrop of rising U.S. Treasury yields and suppressed macro expectations, the market is unlikely to break upward in one go; it’s more probable to maintain a “pressure from moving averages above and support from funds below” grinding rhythm. In terms of operations, it’s advisable to stay cautious, watch more, and act less. #BTC☀ #ETH走势分析 $ETH
📊 BTC: Tug-of-war around the psychological level of 80000
BTC is currently oscillating around the whole number range of 79000 to 80000. This week, bulls made attempts to push higher, but under the pressure of key moving averages on the daily chart, the overall control is temporarily dominated by bears.
Core resistance zone:
80000 - 80500: Short-term psychological whole number level. To reverse the downturn, bulls need to establish consecutive daily closes above this area.
82000 - 82230: The strong resistance zone of the 200-day moving average (200-day MA). This level has faced resistance five times this month; any rebound will first be seen as a broad consolidation until a volume breakout occurs.
Core support zone:
79000: This week’s dense trading area and the “bull line” that has repeatedly bounced back. If this level is breached, the short-term downside potential will open further.
76500 - 77000: The intersection of the daily ascending trend support line and previous breakout points, which is a higher-level buy defense zone.
📉 ETH: Weak consolidation after breaking moving averages
ETH’s performance is significantly weaker than the market, having broken below the dense area where the 50-day and 200-day moving averages intersect, currently in a state of following the market's sell-off.
Core resistance zone:
2280 - 2300: The dense area near the weekly opening price; bulls need to reclaim this zone to effectively stem the bleeding.
2335 - 2375: The dense intersection of the 50-day and 200-day moving averages. With the 200-day MA showing signs of a downturn, the technical pressure here is very strong.
Core support zone:
2210 - 2230: The short-term previous low on the 4-hour chart, also the last line of defense for bullish funds trying to resist intraday selling.
2150: The boundary of a strong liquidity vacuum zone deep on the daily chart; if 2210 breaks, the market is likely to retest this long-term support downwards.
💡 Trading Strategy:
Against the backdrop of rising U.S. Treasury yields and suppressed macro expectations, the market is unlikely to break upward in one go; it’s more probable to maintain a “pressure from moving averages above and support from funds below” grinding rhythm. In terms of operations, it’s advisable to stay cautious, watch more, and act less. #BTC☀ #ETH走势分析 $ETH

1
1
568
·
--
Bullish
Hey fam, have you noticed how the charts are getting harder to read lately? Staring at those short-term candlesticks bouncing up and down every day, feels like we're all caught in the fog of a double whammy from bulls and bears, right?
Today, I’m not gonna bore you with those fluffy technical indicators. Let’s elevate our perspective and talk about the 'deep waters' this market is navigating.
The macro 'water' and the institutional 'net'
Stop viewing the current crypto market with that old-school 'wild jungle' retail mindset. It’s already been unknowingly tethered to the gravitational pull of the global macro economy.
Every tiny stir in inflation data from the Fed (be it PPI or CPI) directly influences the risk appetite of off-exchange funds. But thankfully, the spot ETF 'net' has been cast wide enough, completely opening up the funding channels for traditional institutions. What does this mean? The resilience of major assets (BTC, ETH) is becoming institutionalized, resembling an amplified version of tech stocks. ** The wild volatility of grassroots myths is fading, replaced by a more mature and brutal game of institutional plays.
In the past, everyone feared regulation; now, it seems more like a double-edged sword.
Recently, moves like the Clarity Act aimed at stabilizing and regulating digital assets are indeed cleansing the gray area bubbles in the short term. But in the long run, it's actually handing out compliant 'tickets to entry' for serious big funds (like pensions and sovereign funds).
Especially stablecoins, they are becoming the killer app for RWA (real-world assets) and cross-border payments. In the future, whichever chain can support larger-scale compliant stablecoin liquidity will have the strongest value moat for its underlying token.
The future market will definitely not be a mindless bull run of 'all up, all down'; instead, it’ll be a brutal elimination race with extreme differentiation.
The market is changing, and we need to adapt our thinking. In the short term, amidst the fog of macro data and the pains of policy implementation, the market will likely maintain a high-frequency oscillation and deep washout pattern, continually testing the structural support of bulls and bears.
Only by understanding the underlying logic of funds and policies can we remain steady amid the storm. #比特币ETF净流入1.31亿美元 #BTC $BTC $ETH
Hey fam, have you noticed how the charts are getting harder to read lately? Staring at those short-term candlesticks bouncing up and down every day, feels like we're all caught in the fog of a double whammy from bulls and bears, right?
Today, I’m not gonna bore you with those fluffy technical indicators. Let’s elevate our perspective and talk about the 'deep waters' this market is navigating.
The macro 'water' and the institutional 'net'
Stop viewing the current crypto market with that old-school 'wild jungle' retail mindset. It’s already been unknowingly tethered to the gravitational pull of the global macro economy.
Every tiny stir in inflation data from the Fed (be it PPI or CPI) directly influences the risk appetite of off-exchange funds. But thankfully, the spot ETF 'net' has been cast wide enough, completely opening up the funding channels for traditional institutions. What does this mean? The resilience of major assets (BTC, ETH) is becoming institutionalized, resembling an amplified version of tech stocks. ** The wild volatility of grassroots myths is fading, replaced by a more mature and brutal game of institutional plays.
In the past, everyone feared regulation; now, it seems more like a double-edged sword.
Recently, moves like the Clarity Act aimed at stabilizing and regulating digital assets are indeed cleansing the gray area bubbles in the short term. But in the long run, it's actually handing out compliant 'tickets to entry' for serious big funds (like pensions and sovereign funds).
Especially stablecoins, they are becoming the killer app for RWA (real-world assets) and cross-border payments. In the future, whichever chain can support larger-scale compliant stablecoin liquidity will have the strongest value moat for its underlying token.
The future market will definitely not be a mindless bull run of 'all up, all down'; instead, it’ll be a brutal elimination race with extreme differentiation.
The market is changing, and we need to adapt our thinking. In the short term, amidst the fog of macro data and the pains of policy implementation, the market will likely maintain a high-frequency oscillation and deep washout pattern, continually testing the structural support of bulls and bears.
Only by understanding the underlying logic of funds and policies can we remain steady amid the storm. #比特币ETF净流入1.31亿美元 #BTC $BTC $ETH
Today, I’m not gonna bore you with those fluffy technical indicators. Let’s elevate our perspective and talk about the 'deep waters' this market is navigating.
The macro 'water' and the institutional 'net'
Stop viewing the current crypto market with that old-school 'wild jungle' retail mindset. It’s already been unknowingly tethered to the gravitational pull of the global macro economy.
Every tiny stir in inflation data from the Fed (be it PPI or CPI) directly influences the risk appetite of off-exchange funds. But thankfully, the spot ETF 'net' has been cast wide enough, completely opening up the funding channels for traditional institutions. What does this mean? The resilience of major assets (BTC, ETH) is becoming institutionalized, resembling an amplified version of tech stocks. ** The wild volatility of grassroots myths is fading, replaced by a more mature and brutal game of institutional plays.
In the past, everyone feared regulation; now, it seems more like a double-edged sword.
Recently, moves like the Clarity Act aimed at stabilizing and regulating digital assets are indeed cleansing the gray area bubbles in the short term. But in the long run, it's actually handing out compliant 'tickets to entry' for serious big funds (like pensions and sovereign funds).
Especially stablecoins, they are becoming the killer app for RWA (real-world assets) and cross-border payments. In the future, whichever chain can support larger-scale compliant stablecoin liquidity will have the strongest value moat for its underlying token.
The future market will definitely not be a mindless bull run of 'all up, all down'; instead, it’ll be a brutal elimination race with extreme differentiation.
The market is changing, and we need to adapt our thinking. In the short term, amidst the fog of macro data and the pains of policy implementation, the market will likely maintain a high-frequency oscillation and deep washout pattern, continually testing the structural support of bulls and bears.
Only by understanding the underlying logic of funds and policies can we remain steady amid the storm. #比特币ETF净流入1.31亿美元 #BTC $BTC $ETH


1
233
·
--
Bullish
The market saw a precise volume-reducing dip this afternoon, with ETH briefly breaking through the previous consolidation zone, hitting a low of 2,245. Many retail traders, after witnessing two weeks of continuous bearish action and prices falling below the 50-day and 200-day moving averages, started to hand over their chips and even flipped to short positions.
But let me splash some cold water here: this is by no means the end of the bull market, but rather an epic "short squeeze" orchestrated by institutions and whales!
The smart money has been quietly accumulating.
Just yesterday, the U.S. Senate Banking Committee officially passed the landmark "CLARITY Act."
The passage of this act means that the regulatory fog surrounding stablecoins and decentralized infrastructure has been completely cleared.
As the world's largest smart contract and decentralized application (dApp) underlying network, Ethereum is an essential bridge for compliant institutional funds (like infrastructure ETFs and tokenized real-world assets) entering Web3. The extremely bullish fundamentals, combined with the minor adjustments in the short-term charts, have created a significant "value divergence."
📈 Market Performance
Back to the charts: after ETH hit an intraday low of 2,245, it stabilized around 2,254, forming a clear lower shadow. This is a very typical "volume reduction wash, low-level support" characteristic.
```
【ETH Intraday Long-Short Conversion Levels】
↑
2335 (200-day MA / Mid-term bull-bear watershed)
↑
2280 (break this level and the short squeeze starts)
↑
【Current Position】 $2,254 (strong left-side accumulation zone)
↓
2245 (the solid support confirmed this afternoon)
```
🎯 Trading Strategy Recommendation:
Left-side long-term investors: Spot buying in this range (2,240 - 2,260 USD) is an excellent golden pocket area. With each downward spike, you're getting cheap chips handed to you by the main players.
Right-side breakout traders: Keep a close eye on the movement after the evening U.S. market opens. As long as ETH can reclaim 2280 on the daily chart (i.e., recover the dense zone of the 50-day and 200-day MAs), once the shorts are liquidated, the rebound will snap back like a spring, launching directly towards 2375 or even higher. #ETH $ETH
{future}(ETHUSDT)
The market saw a precise volume-reducing dip this afternoon, with ETH briefly breaking through the previous consolidation zone, hitting a low of 2,245. Many retail traders, after witnessing two weeks of continuous bearish action and prices falling below the 50-day and 200-day moving averages, started to hand over their chips and even flipped to short positions.
But let me splash some cold water here: this is by no means the end of the bull market, but rather an epic "short squeeze" orchestrated by institutions and whales!
The smart money has been quietly accumulating.
Just yesterday, the U.S. Senate Banking Committee officially passed the landmark "CLARITY Act."
The passage of this act means that the regulatory fog surrounding stablecoins and decentralized infrastructure has been completely cleared.
As the world's largest smart contract and decentralized application (dApp) underlying network, Ethereum is an essential bridge for compliant institutional funds (like infrastructure ETFs and tokenized real-world assets) entering Web3. The extremely bullish fundamentals, combined with the minor adjustments in the short-term charts, have created a significant "value divergence."
📈 Market Performance
Back to the charts: after ETH hit an intraday low of 2,245, it stabilized around 2,254, forming a clear lower shadow. This is a very typical "volume reduction wash, low-level support" characteristic.
```
【ETH Intraday Long-Short Conversion Levels】
↑
2335 (200-day MA / Mid-term bull-bear watershed)
↑
2280 (break this level and the short squeeze starts)
↑
【Current Position】 $2,254 (strong left-side accumulation zone)
↓
2245 (the solid support confirmed this afternoon)
```
🎯 Trading Strategy Recommendation:
Left-side long-term investors: Spot buying in this range (2,240 - 2,260 USD) is an excellent golden pocket area. With each downward spike, you're getting cheap chips handed to you by the main players.
Right-side breakout traders: Keep a close eye on the movement after the evening U.S. market opens. As long as ETH can reclaim 2280 on the daily chart (i.e., recover the dense zone of the 50-day and 200-day MAs), once the shorts are liquidated, the rebound will snap back like a spring, launching directly towards 2375 or even higher. #ETH $ETH
But let me splash some cold water here: this is by no means the end of the bull market, but rather an epic "short squeeze" orchestrated by institutions and whales!
The smart money has been quietly accumulating.
Just yesterday, the U.S. Senate Banking Committee officially passed the landmark "CLARITY Act."
The passage of this act means that the regulatory fog surrounding stablecoins and decentralized infrastructure has been completely cleared.
As the world's largest smart contract and decentralized application (dApp) underlying network, Ethereum is an essential bridge for compliant institutional funds (like infrastructure ETFs and tokenized real-world assets) entering Web3. The extremely bullish fundamentals, combined with the minor adjustments in the short-term charts, have created a significant "value divergence."
📈 Market Performance
Back to the charts: after ETH hit an intraday low of 2,245, it stabilized around 2,254, forming a clear lower shadow. This is a very typical "volume reduction wash, low-level support" characteristic.
```
【ETH Intraday Long-Short Conversion Levels】
↑
2335 (200-day MA / Mid-term bull-bear watershed)
↑
2280 (break this level and the short squeeze starts)
↑
【Current Position】 $2,254 (strong left-side accumulation zone)
↓
2245 (the solid support confirmed this afternoon)
```
🎯 Trading Strategy Recommendation:
Left-side long-term investors: Spot buying in this range (2,240 - 2,260 USD) is an excellent golden pocket area. With each downward spike, you're getting cheap chips handed to you by the main players.
Right-side breakout traders: Keep a close eye on the movement after the evening U.S. market opens. As long as ETH can reclaim 2280 on the daily chart (i.e., recover the dense zone of the 50-day and 200-day MAs), once the shorts are liquidated, the rebound will snap back like a spring, launching directly towards 2375 or even higher. #ETH $ETH
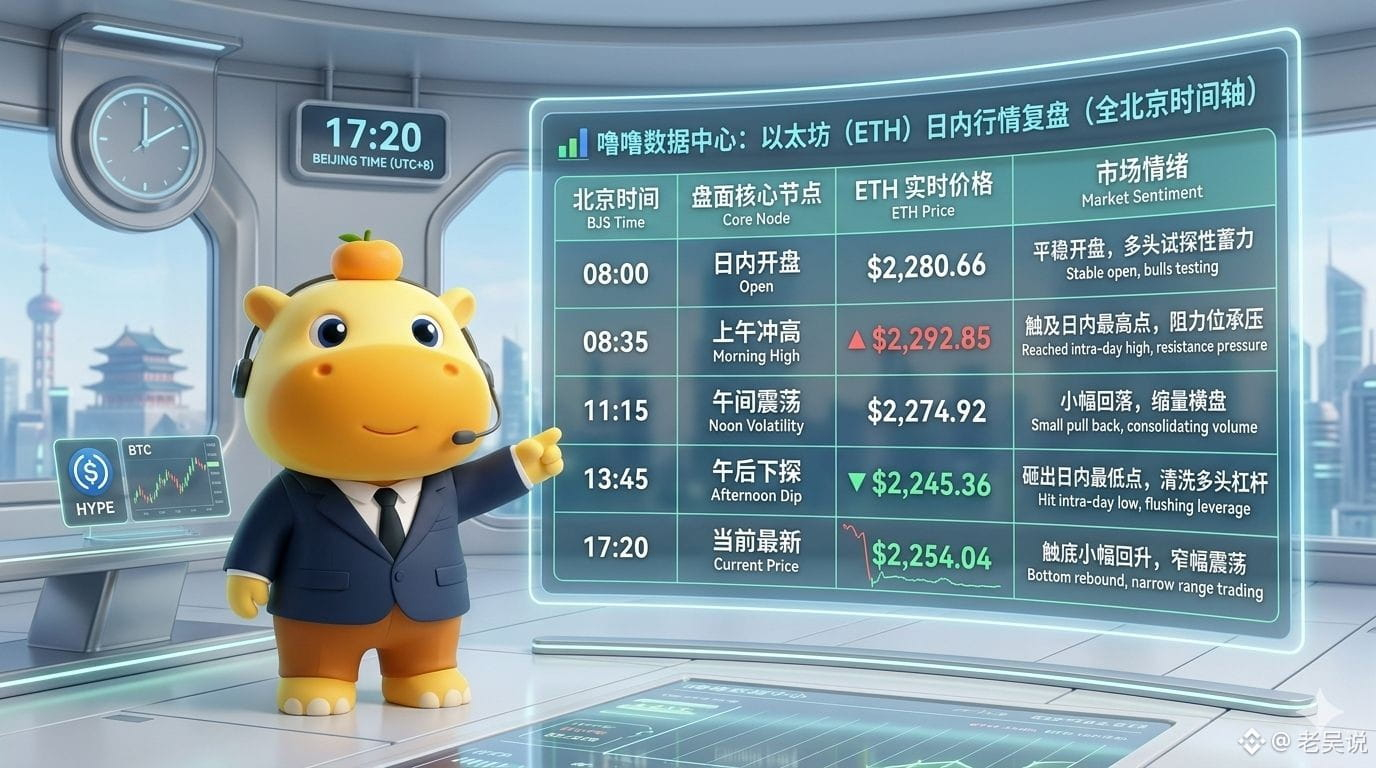
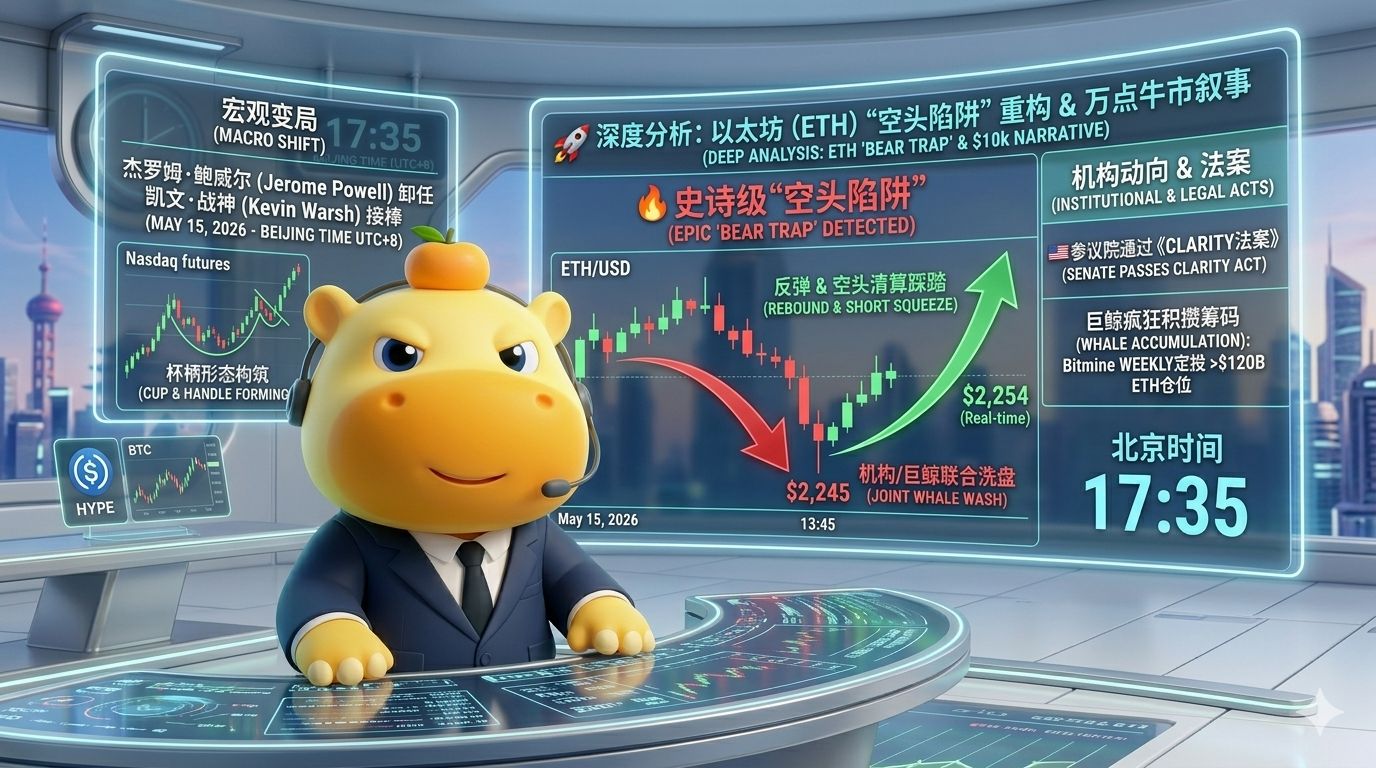
1
1.2k
·
--
Bullish
Brothers, in the blink of an eye, HYPE has smashed through the ceiling and is holding steady at 46! This isn't just an uptrend; it's like riding a vertical elevator straight up!
Why does Lululu dare to say this surge has just begun? Check out these "hardcore" reasons, and you'll see why the bears are at a loss for words:
Institutions are going wild for the chips: That Bitwise spot ETF (BHYP) with staking rewards is like a nuclear bomb! This means the Wall Street suits finally understand the moat of Hyperliquid. They had no way in before, but now the door is wide open; it would be crazy for them not to scoop up such quality assets.
The king of liquidity: The collaboration between Coinbase and Circle has made it clear—Hyperliquid is no longer just a "user-friendly chain"; it's becoming the underlying standard for on-chain finance. When USDC officially starts staking HYPE, what are you still hesitating for?
The bears' "blood bag" isn't drained yet: That big bear 0x8def, who is sitting on a paper loss of over 5 million dollars, is still holding strong! If the price nudges up just a bit, that strong liquidation buy of over 1.2 million HYPE will launch us like rocket fuel to 50!
Right now, the trend is a classic "pulling a scallion from dry ground"; all indicators are dulled because sentiment has completely taken over the market. At 46, this could be the last chance you get to snag some "cheap goods" in this bull market.
I know some are feeling the fear of heights, but as the saying goes: "If you didn't buy at 20 and are doubting at 40, are you really going to catch the bag at 100?"
Don’t try to guess the top; in the face of such epic bullish news, your imagination is your only limit. Tonight, we won't let go until we see 50! #hype $HYPE
{future}(HYPEUSDT)
Brothers, in the blink of an eye, HYPE has smashed through the ceiling and is holding steady at 46! This isn't just an uptrend; it's like riding a vertical elevator straight up!
Why does Lululu dare to say this surge has just begun? Check out these "hardcore" reasons, and you'll see why the bears are at a loss for words:
Institutions are going wild for the chips: That Bitwise spot ETF (BHYP) with staking rewards is like a nuclear bomb! This means the Wall Street suits finally understand the moat of Hyperliquid. They had no way in before, but now the door is wide open; it would be crazy for them not to scoop up such quality assets.
The king of liquidity: The collaboration between Coinbase and Circle has made it clear—Hyperliquid is no longer just a "user-friendly chain"; it's becoming the underlying standard for on-chain finance. When USDC officially starts staking HYPE, what are you still hesitating for?
The bears' "blood bag" isn't drained yet: That big bear 0x8def, who is sitting on a paper loss of over 5 million dollars, is still holding strong! If the price nudges up just a bit, that strong liquidation buy of over 1.2 million HYPE will launch us like rocket fuel to 50!
Right now, the trend is a classic "pulling a scallion from dry ground"; all indicators are dulled because sentiment has completely taken over the market. At 46, this could be the last chance you get to snag some "cheap goods" in this bull market.
I know some are feeling the fear of heights, but as the saying goes: "If you didn't buy at 20 and are doubting at 40, are you really going to catch the bag at 100?"
Don’t try to guess the top; in the face of such epic bullish news, your imagination is your only limit. Tonight, we won't let go until we see 50! #hype $HYPE
Why does Lululu dare to say this surge has just begun? Check out these "hardcore" reasons, and you'll see why the bears are at a loss for words:
Institutions are going wild for the chips: That Bitwise spot ETF (BHYP) with staking rewards is like a nuclear bomb! This means the Wall Street suits finally understand the moat of Hyperliquid. They had no way in before, but now the door is wide open; it would be crazy for them not to scoop up such quality assets.
The king of liquidity: The collaboration between Coinbase and Circle has made it clear—Hyperliquid is no longer just a "user-friendly chain"; it's becoming the underlying standard for on-chain finance. When USDC officially starts staking HYPE, what are you still hesitating for?
The bears' "blood bag" isn't drained yet: That big bear 0x8def, who is sitting on a paper loss of over 5 million dollars, is still holding strong! If the price nudges up just a bit, that strong liquidation buy of over 1.2 million HYPE will launch us like rocket fuel to 50!
Right now, the trend is a classic "pulling a scallion from dry ground"; all indicators are dulled because sentiment has completely taken over the market. At 46, this could be the last chance you get to snag some "cheap goods" in this bull market.
I know some are feeling the fear of heights, but as the saying goes: "If you didn't buy at 20 and are doubting at 40, are you really going to catch the bag at 100?"
Don’t try to guess the top; in the face of such epic bullish news, your imagination is your only limit. Tonight, we won't let go until we see 50! #hype $HYPE


1
432
Log in to explore more content
Join global crypto users on Binance Square
⚡️ Get latest and useful information about crypto.
💬 Trusted by the world’s largest crypto exchange.
👍 Discover real insights from verified creators.
Email / Phone number