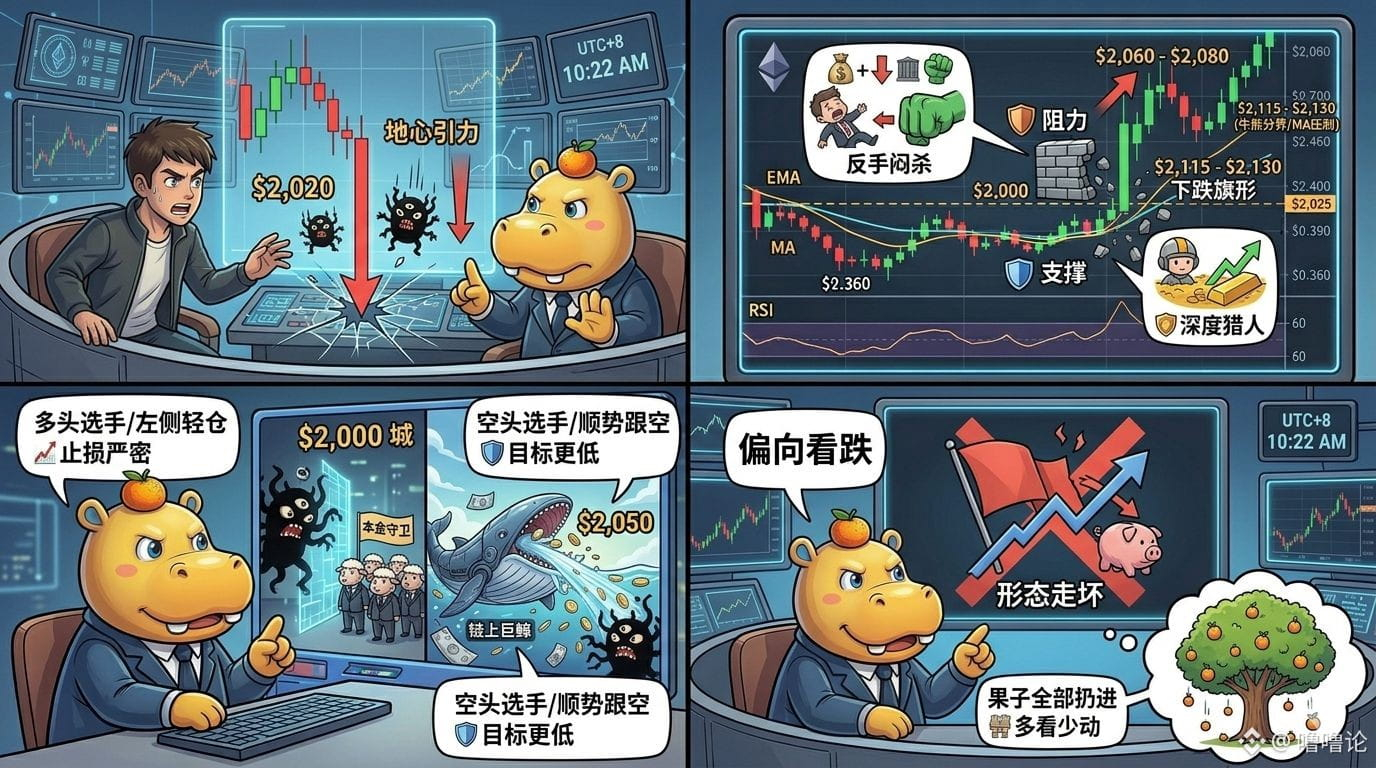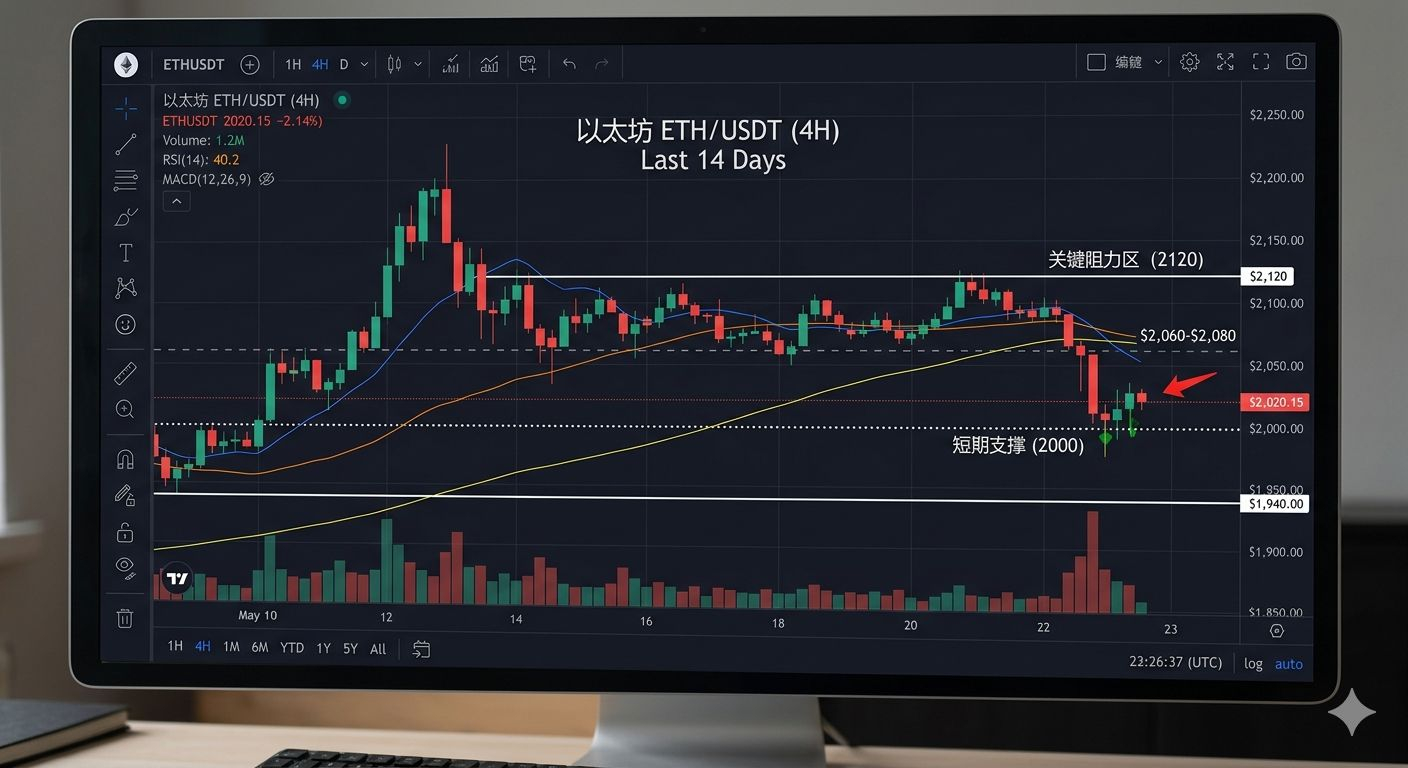
From the current perspective, Ethereum experienced a rapid drop around 2020 due to overwhelming 'gravity'. Now let's widen the screen and see what the technicals are telling us:
1. Structured candlestick deep analysis
📉 Resistance levels (upward pressure):
First resistance (just around the corner): 2060-2080
This is the 'consolidation zone' where it was trading sideways earlier today. After just breaking down, this has switched from being the 'floor' to the 'ceiling' (support-resistance flip). If ETH wants to bounce back, this is the first hurdle for the bulls.
Key resistance (bull-bear line): 2115-2130
Looking at the daily and 4-hour charts, this level is where the 50-day and 200-day moving averages (MA) converge. Currently, the price is below all major MAs, indicating that the bears are temporarily in control of the game.
🛡️ Support levels (downward defense):
Short-term strong support: 2000 psychological level
This is a very critical integer level. The price is currently hovering around 2020, just a step away from here. If it can stabilize at 2000, the market might shift to sideways consolidation.
Deep pit support: 1930 - 1950
If 2000 is lost, the next structural demand zone is in this range, which is also a spot where many 'deep-sea hunters' are waiting to scoop up the bottom.
2. How to operate? (Lulu's tactical board)
If you are a 'bull' player (buying faction):
Left-side thinking: You can try a light position around 2000, but this is 'picking up pennies in front of a steamroller'; stop-loss must be tight (like setting it below 1980).
Right-side thinking (more conservative): Wait for the price to regain above 2080, and look for a breakout signal before entering to catch a bounce to 2150.
If you are a 'bear' player (selling faction):
The current trend is more favorable for you. If the price retraces to the 2050 - 2065 area and faces resistance, consider shorting with the trend, targeting 2000 or even lower.
3. Final judgment: Bullish or bearish?
Current conclusion: Leaning bearish (or weak consolidation).
Reasons are as follows:
1. Bad shape: The recent plunge broke the short-term ascending channel, and we are currently in a clear 'descending flag'.
2. MA pressure: The price is below both short and long-term moving averages, indicating that the average cost of market participants is above, creating enormous pressure for a rebound. #ETH $ETH
1. Structured candlestick deep analysis
📉 Resistance levels (upward pressure):
First resistance (just around the corner): 2060-2080
This is the 'consolidation zone' where it was trading sideways earlier today. After just breaking down, this has switched from being the 'floor' to the 'ceiling' (support-resistance flip). If ETH wants to bounce back, this is the first hurdle for the bulls.
Key resistance (bull-bear line): 2115-2130
Looking at the daily and 4-hour charts, this level is where the 50-day and 200-day moving averages (MA) converge. Currently, the price is below all major MAs, indicating that the bears are temporarily in control of the game.
🛡️ Support levels (downward defense):
Short-term strong support: 2000 psychological level
This is a very critical integer level. The price is currently hovering around 2020, just a step away from here. If it can stabilize at 2000, the market might shift to sideways consolidation.
Deep pit support: 1930 - 1950
If 2000 is lost, the next structural demand zone is in this range, which is also a spot where many 'deep-sea hunters' are waiting to scoop up the bottom.
2. How to operate? (Lulu's tactical board)
If you are a 'bull' player (buying faction):
Left-side thinking: You can try a light position around 2000, but this is 'picking up pennies in front of a steamroller'; stop-loss must be tight (like setting it below 1980).
Right-side thinking (more conservative): Wait for the price to regain above 2080, and look for a breakout signal before entering to catch a bounce to 2150.
If you are a 'bear' player (selling faction):
The current trend is more favorable for you. If the price retraces to the 2050 - 2065 area and faces resistance, consider shorting with the trend, targeting 2000 or even lower.
3. Final judgment: Bullish or bearish?
Current conclusion: Leaning bearish (or weak consolidation).
Reasons are as follows:
1. Bad shape: The recent plunge broke the short-term ascending channel, and we are currently in a clear 'descending flag'.
2. MA pressure: The price is below both short and long-term moving averages, indicating that the average cost of market participants is above, creating enormous pressure for a rebound. #ETH $ETH