
Junii Ahmad
737 Posts
Junii Ahmad
Report
Block User
📊 Crypto Trader | Technical Analysis & Risk Management | Disciplined Execution over Emotion 🎯
Frequent Trader
2 Years
214 Following
71 Followers
224 Liked
Posts
All
Quotes
Videos
Live
PINNED
·
--
Bullish
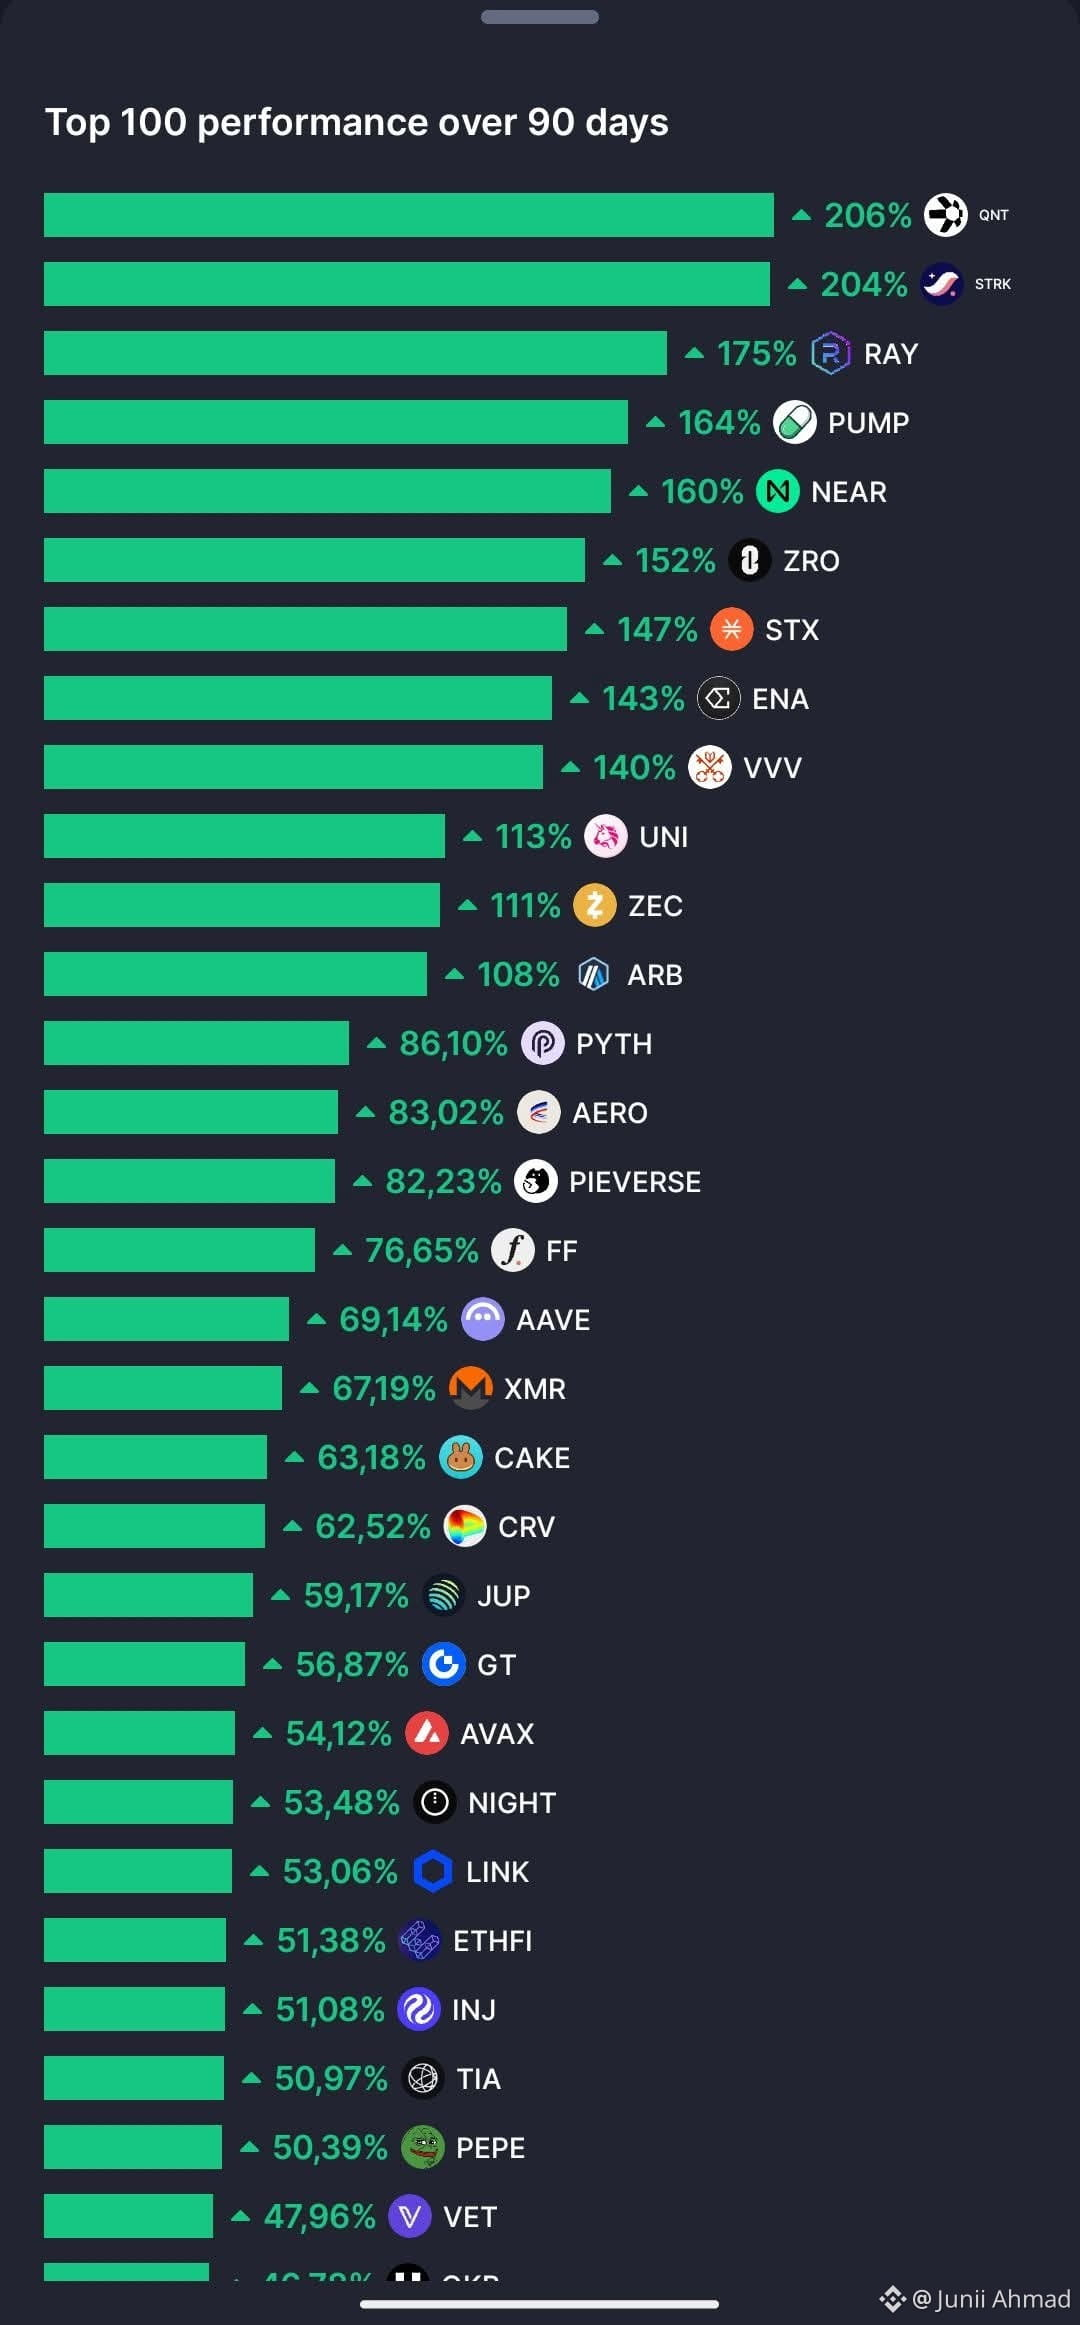
"Looking at the performance of the top 100 coins over the past 90 days, we have picked out some of the top ones to show you."
$QNT $STRK $RAY
#CelestiaRises16%To2026High #NasdaqDowWeeklyGapWidestSinceJuly2002 #Nasdaq100Falls5.5%InWorstWeekIn18Months #StrategySharesFall9%OnFriday #USPPIRises6.3%YearOverYear
"Looking at the performance of the top 100 coins over the past 90 days, we have picked out some of the top ones to show you."
$QNT $STRK $RAY
#CelestiaRises16%To2026High #NasdaqDowWeeklyGapWidestSinceJuly2002 #Nasdaq100Falls5.5%InWorstWeekIn18Months #StrategySharesFall9%OnFriday #USPPIRises6.3%YearOverYear
$QNT $STRK $RAY
#CelestiaRises16%To2026High #NasdaqDowWeeklyGapWidestSinceJuly2002 #Nasdaq100Falls5.5%InWorstWeekIn18Months #StrategySharesFall9%OnFriday #USPPIRises6.3%YearOverYear
2
3
4.3k
·
--
Article
Hope - The Trader's Double-Edged SwordHope is the most dangerous emotion in trading because it feels like a virtue while acting like a vice.
You bought a stock at $50 after careful analysis indicated it was fundamentally undervalued and technically oversold. The company had solid earnings and good management, and you felt confident about your research. The stock climbed to $60, validating your thesis and making you feel smart. Then earnings came out slightly below expectations, and the stock dropped to $45. Your predetermined stop loss was at $47, but you didn't take it because you hoped it would recover. After all, the fundamentals hadn't really changed, and surely the market was overreacting.
Then it went to $40. Then $35. Then $30. Each day, you find new reasons to hope: maybe the next earnings will be better, maybe an analyst will upgrade the stock, or maybe the whole sector is due for a bounce. What started as a well-researched trade based on sound analysis has become a desperate wish that the market will somehow validate your original decision, or at least get back to even, so you can exit without a loss.
If this scenario sounds painfully familiar, you're not alone. Hope might be the most complex and dangerous emotion that traders face, precisely because it masquerades as something positive while slowly destroying your account.
The Paradox of Hope in Trading.
Hope presents a unique challenge for traders because in almost every other area of life, hope is considered positive and essential. Hope motivates us to pursue difficult goals, sustains us through challenging times, and helps us maintain optimism in the face of setbacks. In these contexts, hope costs nothing and provides significant psychological benefits even when things don't work out as planned.
Trading turns this equation upside down. In the markets, hope has a direct financial cost that increases every moment you hold onto a losing position. When you hope that a declining stock will recover, you're not maintaining a positive attitude; you're actively losing money with each tick lower. When you hope your analysis will eventually be proven right, you risk turning a small, manageable loss into a large one that hurts financially, mentally, and emotionally.
The paradox deepens when you consider that some level of hope is absolutely necessary for trading success. Without hope, you wouldn't have the confidence to enter trades based on your analysis or persist through the inevitable learning curve every trader faces. The challenge lies in learning to harness hope's motivational power while preventing it from clouding your judgment about individual trades.
This dual nature makes hope particularly insidious. When greed takes over, you usually know you're being greedy. When fear paralyzes you, you're aware that you're afraid. But when hope keeps you in a losing trade, you often feel like you're being patient, disciplined, or faithful to your analysis. The voice of hope sounds reasonable and measured, making arguments that seem logical even as they lead you toward a big financial loss. Strong conviction in a losing trade is not a positive emotion.
Understanding Hope's Two Faces
To manage hope effectively, you must first understand the fundamental difference between its constructive and destructive forms. These two faces of hope can look remarkably similar on the surface, but they lead to completely different outcomes in your trading.
Constructive hope is grounded in evidence and realistic expectations. It's the hope that your carefully researched stock will eventually reflect its fair value, but it comes with predetermined time limits and exit strategies. It's the hope that your proven trading system will continue to work over time, even though individual trades may fail. This type of hope acknowledges uncertainty and prepares for multiple outcomes. It says, "I hope this trade works out, but if it doesn't, I know exactly when and how I'll exit."
Constructive hope also maintains perspective on the bigger picture. It focuses on long-term results rather than individual trade outcomes, sustaining you through difficult periods without preventing you from taking necessary losses.
Destructive hope, on the other hand, is characterized by wishful thinking that ignores evidence and avoids planning for adverse outcomes. Hope keeps you in losing trades long after your original analysis has been proven wrong. This type of hope has no time limits, no exit strategies, and no acknowledgment that things might not work out as desired.
Destructive hope often becomes more intense as losses mount. Instead of accepting that a trade isn't working, this type of hope doubles down on optimism, finding increasingly desperate reasons why the position should recover. It goes from "I hope this works" to "It has to work" to "I can't afford this not to work."
The difference between constructive and destructive hope often comes down to timing and planning. Constructive hope does its work before and between trades, motivating you to research opportunities and maintain confidence. Destructive hope takes over during trades, particularly losing ones, and prevents you from executing your predetermined exit strategies.
The Psychology Behind Trading Hope
To understand why hope can be so destructive in trading, you need to understand what's happening in your brain when you're holding onto losing positions. Hope activates the same neural pathways involved in addiction, creating chemical rewards that make it difficult to abandon losing positions. When you hope for a trade to recover, your brain releases dopamine in anticipation of that recovery, even though the recovery may never come.
Cognitive dissonance plays a major role in how hope develops and persists. When reality conflicts with your beliefs or expectations, your brain experiences psychological discomfort and works to resolve the conflict. If you believe you're a good trader but your current position is losing money, hope offers a convenient solution: it suggests the position will eventually become profitable.
Hope also functions as a coping mechanism that helps you avoid the immediate emotional pain of realizing losses. Taking a loss requires you to confront the reality that you were wrong and that you lost money. Hope allows you to postpone this confrontation indefinitely by maintaining the fiction that the loss isn't real as long as you haven't closed the position.
The sunk cost fallacy amplifies hope by making you focus on what you've already invested rather than what you're likely to gain or lose going forward. The more money you've lost on a position, the harder it becomes to close it because hope whispers that walking away now would mean all those losses were for nothing.
The Hope-Denial Spectrum
One of the most important skills you can develop is recognizing where you fall on the spectrum from healthy optimism to dangerous denial. Hope doesn't suddenly become destructive. It gradually transforms from reasonable expectation into desperate wishful thinking.
The spectrum begins with reasonable optimism, which is healthy and necessary for trading. When you enter a well-researched trade, it's reasonable to be optimistic about the outcome. This optimism is grounded in evidence, acknowledges the possibility of being wrong, and includes specific plans for adverse scenarios.
As a trade moves against you, reasonable optimism can shift into stubborn hope. You start ignoring new information that contradicts your thesis while giving extra weight to any positive developments. The shift is subtle but important: you're no longer updating your analysis based on new information but filtering information to support your existing hope.
Stubborn hope can escalate into desperate hope as losses mount. At this stage, you're no longer hoping based on analysis; you're hoping because you need the trade to work out. Your reasons become increasingly emotional and less logical: "I can't afford to lose this much money" or "This position has to recover because I've already lost so much."
The final stage is complete denial, where you refuse to acknowledge that the position is a loser. You stop monitoring the position closely, avoid looking at your account balance, or convince yourself that the loss doesn't count because you haven't closed the position yet.
Each stage represents a deeper departure from rational trading. The key is learning to recognize where you are on this spectrum in real time, particularly during the transition from reasonable optimism to stubborn hope, where you still have the most control.
When Hope Becomes Averaging Down
One of the most dangerous manifestations of hope is when it leads to averaging down, buying more of a position as the price declines. Hope makes averaging down feel logical by reframing declining prices as opportunities rather than warnings. If your analysis was right at $50, surely it's even more right at $45.
The mathematics of averaging down can be seductive. If you bought 100 shares at $50 and another 100 at $45, your average cost is now $47.50. Hope focuses on the smaller recovery needed to break even, while ignoring the possibility that the stock might continue to decline.
Averaging down also offers psychological benefits that hopeful people want. It gives you something active to do instead of passively watching your position lose money. This sense of taking control can be emotionally satisfying, even when the action is making the situation worse.
The danger becomes clear when averaging down fails. The increasingly attractive average price seems to justify each additional purchase, but each addition increases your total exposure. What started as a manageable 5% position can easily become 10%, 15%, or even 20% of your account.
Hope makes averaging down particularly dangerous because it changes your relationship with the position. Instead of viewing declining prices as evidence that your original analysis might have been wrong, hope reframes them as opportunities to improve your average cost. This prevents objective evaluation of whether your original reasons for buying are still valid. Dollar-cost averaging is for investors in indexes over decades, not traders on a daily chart looking for profits on an individual trade. Averaging down in a losing trade due to hope is one of the most destructive behaviors that keep traders unprofitable and their capital trapped on the wrong side of the trend.
Setting Hope Boundaries
Just as you set financial boundaries through position sizing and stop losses, you need psychological boundaries that prevent hope from overriding rational decision-making. These hope boundaries serve as circuit breakers that trigger when hope begins transforming from a helpful emotion into a destructive force.
Time-based boundaries are among the most effective limits. Before entering any trade, establish a maximum holding periodif it's not working as expected. When your time stop limit is reached, close the position regardless of your emotions about its potential.
Stop-loss boundaries provide another crucial constraint. Predetermine the maximum amount you're willing to lose on any single trade, and close the position when that loss is reached. This boundary should be set before entering the trade, when you're thinking clearly and objectively.
Evidence-based boundaries help prevent hope from overriding objective analysis. Before entering a trade, identify specific technical or fundamental changes that would invalidate your original thesis. When these predetermined conditions are met, close the position regardless of your hope for recovery.
confidence that consistent execution of a sound approach will lead to profitability over time.
The most successful traders maintain tremendous hope and optimism about their long-term prospects while being absolutely ruthless in managing individual positions. They hope their systems will continue working and that they'll continue improving as traders. But they never let hope prevent them from taking necessary stops, managing risk appropriately, or admitting when individual trades aren't working.
As you continue developing your trading skills, pay attention to the quality and direction of your hope. Notice when it's motivating productive behavior like research and planning, and when it's encouraging passive behavior like holding losing positions or avoiding difficult decisions. The more aware you become of hope's influence, the better you can channel it toward activities that actually improve your trading results.
Key Strategies for Managing Hope
*Set predetermined time limits for all trades: Close positions when time limits are reached, regardless of hope for recovery
*Establish maximum loss limits before entering trades: Exit when loss limits are hit, no matter how much you hope for a turnaround
*Create specific invalidation criteria for each trade: Predetermine what evidence would prove your analysis wrong
*Schedule regular position reviews with a fresh-eyed evaluation: Ask whether you would initiate each position if starting today
*Write detailed pre-trade plans, including exit strategies like profit targets and trailing stops: Refer back to original analysis when hope clouds judgment
*Keep a trading journal to identify patterns: Track instances when hope overrode rational decision-making
*Use automated stops and alerts to remove emotions: Let technology execute predetermined exit strategies
*Focus hope on process improvement rather than trade outcomes: Hope for better skills, not individual position recovery
*Convert hopes into specific scenario planning: Prepare concrete responses for different market conditions
#WhatWillDriveCryptoandStocks’NextRebound? #Anthropic’s6xIPODemandSignalsPotentialRecordRaise #JaneStreetNearlyOctuplesFidelityBitcoinETFHoldings #USPPIMissMayEaseBTCPressure #BitcoinCoreDisclosesTorTrafficVulnerability
Hope - The Trader's Double-Edged Sword
Hope is the most dangerous emotion in trading because it feels like a virtue while acting like a vice.
You bought a stock at $50 after careful analysis indicated it was fundamentally undervalued and technically oversold. The company had solid earnings and good management, and you felt confident about your research. The stock climbed to $60, validating your thesis and making you feel smart. Then earnings came out slightly below expectations, and the stock dropped to $45. Your predetermined stop loss was at $47, but you didn't take it because you hoped it would recover. After all, the fundamentals hadn't really changed, and surely the market was overreacting.
Then it went to $40. Then $35. Then $30. Each day, you find new reasons to hope: maybe the next earnings will be better, maybe an analyst will upgrade the stock, or maybe the whole sector is due for a bounce. What started as a well-researched trade based on sound analysis has become a desperate wish that the market will somehow validate your original decision, or at least get back to even, so you can exit without a loss.
If this scenario sounds painfully familiar, you're not alone. Hope might be the most complex and dangerous emotion that traders face, precisely because it masquerades as something positive while slowly destroying your account.
The Paradox of Hope in Trading.
Hope presents a unique challenge for traders because in almost every other area of life, hope is considered positive and essential. Hope motivates us to pursue difficult goals, sustains us through challenging times, and helps us maintain optimism in the face of setbacks. In these contexts, hope costs nothing and provides significant psychological benefits even when things don't work out as planned.
Trading turns this equation upside down. In the markets, hope has a direct financial cost that increases every moment you hold onto a losing position. When you hope that a declining stock will recover, you're not maintaining a positive attitude; you're actively losing money with each tick lower. When you hope your analysis will eventually be proven right, you risk turning a small, manageable loss into a large one that hurts financially, mentally, and emotionally.
The paradox deepens when you consider that some level of hope is absolutely necessary for trading success. Without hope, you wouldn't have the confidence to enter trades based on your analysis or persist through the inevitable learning curve every trader faces. The challenge lies in learning to harness hope's motivational power while preventing it from clouding your judgment about individual trades.
This dual nature makes hope particularly insidious. When greed takes over, you usually know you're being greedy. When fear paralyzes you, you're aware that you're afraid. But when hope keeps you in a losing trade, you often feel like you're being patient, disciplined, or faithful to your analysis. The voice of hope sounds reasonable and measured, making arguments that seem logical even as they lead you toward a big financial loss. Strong conviction in a losing trade is not a positive emotion.
Understanding Hope's Two Faces
To manage hope effectively, you must first understand the fundamental difference between its constructive and destructive forms. These two faces of hope can look remarkably similar on the surface, but they lead to completely different outcomes in your trading.
Constructive hope is grounded in evidence and realistic expectations. It's the hope that your carefully researched stock will eventually reflect its fair value, but it comes with predetermined time limits and exit strategies. It's the hope that your proven trading system will continue to work over time, even though individual trades may fail. This type of hope acknowledges uncertainty and prepares for multiple outcomes. It says, "I hope this trade works out, but if it doesn't, I know exactly when and how I'll exit."
Constructive hope also maintains perspective on the bigger picture. It focuses on long-term results rather than individual trade outcomes, sustaining you through difficult periods without preventing you from taking necessary losses.
Destructive hope, on the other hand, is characterized by wishful thinking that ignores evidence and avoids planning for adverse outcomes. Hope keeps you in losing trades long after your original analysis has been proven wrong. This type of hope has no time limits, no exit strategies, and no acknowledgment that things might not work out as desired.
Destructive hope often becomes more intense as losses mount. Instead of accepting that a trade isn't working, this type of hope doubles down on optimism, finding increasingly desperate reasons why the position should recover. It goes from "I hope this works" to "It has to work" to "I can't afford this not to work."
The difference between constructive and destructive hope often comes down to timing and planning. Constructive hope does its work before and between trades, motivating you to research opportunities and maintain confidence. Destructive hope takes over during trades, particularly losing ones, and prevents you from executing your predetermined exit strategies.
The Psychology Behind Trading Hope
To understand why hope can be so destructive in trading, you need to understand what's happening in your brain when you're holding onto losing positions. Hope activates the same neural pathways involved in addiction, creating chemical rewards that make it difficult to abandon losing positions. When you hope for a trade to recover, your brain releases dopamine in anticipation of that recovery, even though the recovery may never come.
Cognitive dissonance plays a major role in how hope develops and persists. When reality conflicts with your beliefs or expectations, your brain experiences psychological discomfort and works to resolve the conflict. If you believe you're a good trader but your current position is losing money, hope offers a convenient solution: it suggests the position will eventually become profitable.
Hope also functions as a coping mechanism that helps you avoid the immediate emotional pain of realizing losses. Taking a loss requires you to confront the reality that you were wrong and that you lost money. Hope allows you to postpone this confrontation indefinitely by maintaining the fiction that the loss isn't real as long as you haven't closed the position.
The sunk cost fallacy amplifies hope by making you focus on what you've already invested rather than what you're likely to gain or lose going forward. The more money you've lost on a position, the harder it becomes to close it because hope whispers that walking away now would mean all those losses were for nothing.
The Hope-Denial Spectrum
One of the most important skills you can develop is recognizing where you fall on the spectrum from healthy optimism to dangerous denial. Hope doesn't suddenly become destructive. It gradually transforms from reasonable expectation into desperate wishful thinking.
The spectrum begins with reasonable optimism, which is healthy and necessary for trading. When you enter a well-researched trade, it's reasonable to be optimistic about the outcome. This optimism is grounded in evidence, acknowledges the possibility of being wrong, and includes specific plans for adverse scenarios.
As a trade moves against you, reasonable optimism can shift into stubborn hope. You start ignoring new information that contradicts your thesis while giving extra weight to any positive developments. The shift is subtle but important: you're no longer updating your analysis based on new information but filtering information to support your existing hope.
Stubborn hope can escalate into desperate hope as losses mount. At this stage, you're no longer hoping based on analysis; you're hoping because you need the trade to work out. Your reasons become increasingly emotional and less logical: "I can't afford to lose this much money" or "This position has to recover because I've already lost so much."
The final stage is complete denial, where you refuse to acknowledge that the position is a loser. You stop monitoring the position closely, avoid looking at your account balance, or convince yourself that the loss doesn't count because you haven't closed the position yet.
Each stage represents a deeper departure from rational trading. The key is learning to recognize where you are on this spectrum in real time, particularly during the transition from reasonable optimism to stubborn hope, where you still have the most control.
When Hope Becomes Averaging Down
One of the most dangerous manifestations of hope is when it leads to averaging down, buying more of a position as the price declines. Hope makes averaging down feel logical by reframing declining prices as opportunities rather than warnings. If your analysis was right at $50, surely it's even more right at $45.
The mathematics of averaging down can be seductive. If you bought 100 shares at $50 and another 100 at $45, your average cost is now $47.50. Hope focuses on the smaller recovery needed to break even, while ignoring the possibility that the stock might continue to decline.
Averaging down also offers psychological benefits that hopeful people want. It gives you something active to do instead of passively watching your position lose money. This sense of taking control can be emotionally satisfying, even when the action is making the situation worse.
The danger becomes clear when averaging down fails. The increasingly attractive average price seems to justify each additional purchase, but each addition increases your total exposure. What started as a manageable 5% position can easily become 10%, 15%, or even 20% of your account.
Hope makes averaging down particularly dangerous because it changes your relationship with the position. Instead of viewing declining prices as evidence that your original analysis might have been wrong, hope reframes them as opportunities to improve your average cost. This prevents objective evaluation of whether your original reasons for buying are still valid. Dollar-cost averaging is for investors in indexes over decades, not traders on a daily chart looking for profits on an individual trade. Averaging down in a losing trade due to hope is one of the most destructive behaviors that keep traders unprofitable and their capital trapped on the wrong side of the trend.
Setting Hope Boundaries
Just as you set financial boundaries through position sizing and stop losses, you need psychological boundaries that prevent hope from overriding rational decision-making. These hope boundaries serve as circuit breakers that trigger when hope begins transforming from a helpful emotion into a destructive force.
Time-based boundaries are among the most effective limits. Before entering any trade, establish a maximum holding periodif it's not working as expected. When your time stop limit is reached, close the position regardless of your emotions about its potential.
Stop-loss boundaries provide another crucial constraint. Predetermine the maximum amount you're willing to lose on any single trade, and close the position when that loss is reached. This boundary should be set before entering the trade, when you're thinking clearly and objectively.
Evidence-based boundaries help prevent hope from overriding objective analysis. Before entering a trade, identify specific technical or fundamental changes that would invalidate your original thesis. When these predetermined conditions are met, close the position regardless of your hope for recovery.
confidence that consistent execution of a sound approach will lead to profitability over time.
The most successful traders maintain tremendous hope and optimism about their long-term prospects while being absolutely ruthless in managing individual positions. They hope their systems will continue working and that they'll continue improving as traders. But they never let hope prevent them from taking necessary stops, managing risk appropriately, or admitting when individual trades aren't working.
As you continue developing your trading skills, pay attention to the quality and direction of your hope. Notice when it's motivating productive behavior like research and planning, and when it's encouraging passive behavior like holding losing positions or avoiding difficult decisions. The more aware you become of hope's influence, the better you can channel it toward activities that actually improve your trading results.
Key Strategies for Managing Hope
*Set predetermined time limits for all trades: Close positions when time limits are reached, regardless of hope for recovery
*Establish maximum loss limits before entering trades: Exit when loss limits are hit, no matter how much you hope for a turnaround
*Create specific invalidation criteria for each trade: Predetermine what evidence would prove your analysis wrong
*Schedule regular position reviews with a fresh-eyed evaluation: Ask whether you would initiate each position if starting today
*Write detailed pre-trade plans, including exit strategies like profit targets and trailing stops: Refer back to original analysis when hope clouds judgment
*Keep a trading journal to identify patterns: Track instances when hope overrode rational decision-making
*Use automated stops and alerts to remove emotions: Let technology execute predetermined exit strategies
*Focus hope on process improvement rather than trade outcomes: Hope for better skills, not individual position recovery
*Convert hopes into specific scenario planning: Prepare concrete responses for different market conditions
#WhatWillDriveCryptoandStocks’NextRebound? #Anthropic’s6xIPODemandSignalsPotentialRecordRaise #JaneStreetNearlyOctuplesFidelityBitcoinETFHoldings #USPPIMissMayEaseBTCPressure #BitcoinCoreDisclosesTorTrafficVulnerability
You bought a stock at $50 after careful analysis indicated it was fundamentally undervalued and technically oversold. The company had solid earnings and good management, and you felt confident about your research. The stock climbed to $60, validating your thesis and making you feel smart. Then earnings came out slightly below expectations, and the stock dropped to $45. Your predetermined stop loss was at $47, but you didn't take it because you hoped it would recover. After all, the fundamentals hadn't really changed, and surely the market was overreacting.
Then it went to $40. Then $35. Then $30. Each day, you find new reasons to hope: maybe the next earnings will be better, maybe an analyst will upgrade the stock, or maybe the whole sector is due for a bounce. What started as a well-researched trade based on sound analysis has become a desperate wish that the market will somehow validate your original decision, or at least get back to even, so you can exit without a loss.
If this scenario sounds painfully familiar, you're not alone. Hope might be the most complex and dangerous emotion that traders face, precisely because it masquerades as something positive while slowly destroying your account.
The Paradox of Hope in Trading.
Hope presents a unique challenge for traders because in almost every other area of life, hope is considered positive and essential. Hope motivates us to pursue difficult goals, sustains us through challenging times, and helps us maintain optimism in the face of setbacks. In these contexts, hope costs nothing and provides significant psychological benefits even when things don't work out as planned.
Trading turns this equation upside down. In the markets, hope has a direct financial cost that increases every moment you hold onto a losing position. When you hope that a declining stock will recover, you're not maintaining a positive attitude; you're actively losing money with each tick lower. When you hope your analysis will eventually be proven right, you risk turning a small, manageable loss into a large one that hurts financially, mentally, and emotionally.
The paradox deepens when you consider that some level of hope is absolutely necessary for trading success. Without hope, you wouldn't have the confidence to enter trades based on your analysis or persist through the inevitable learning curve every trader faces. The challenge lies in learning to harness hope's motivational power while preventing it from clouding your judgment about individual trades.
This dual nature makes hope particularly insidious. When greed takes over, you usually know you're being greedy. When fear paralyzes you, you're aware that you're afraid. But when hope keeps you in a losing trade, you often feel like you're being patient, disciplined, or faithful to your analysis. The voice of hope sounds reasonable and measured, making arguments that seem logical even as they lead you toward a big financial loss. Strong conviction in a losing trade is not a positive emotion.
Understanding Hope's Two Faces
To manage hope effectively, you must first understand the fundamental difference between its constructive and destructive forms. These two faces of hope can look remarkably similar on the surface, but they lead to completely different outcomes in your trading.
Constructive hope is grounded in evidence and realistic expectations. It's the hope that your carefully researched stock will eventually reflect its fair value, but it comes with predetermined time limits and exit strategies. It's the hope that your proven trading system will continue to work over time, even though individual trades may fail. This type of hope acknowledges uncertainty and prepares for multiple outcomes. It says, "I hope this trade works out, but if it doesn't, I know exactly when and how I'll exit."
Constructive hope also maintains perspective on the bigger picture. It focuses on long-term results rather than individual trade outcomes, sustaining you through difficult periods without preventing you from taking necessary losses.
Destructive hope, on the other hand, is characterized by wishful thinking that ignores evidence and avoids planning for adverse outcomes. Hope keeps you in losing trades long after your original analysis has been proven wrong. This type of hope has no time limits, no exit strategies, and no acknowledgment that things might not work out as desired.
Destructive hope often becomes more intense as losses mount. Instead of accepting that a trade isn't working, this type of hope doubles down on optimism, finding increasingly desperate reasons why the position should recover. It goes from "I hope this works" to "It has to work" to "I can't afford this not to work."
The difference between constructive and destructive hope often comes down to timing and planning. Constructive hope does its work before and between trades, motivating you to research opportunities and maintain confidence. Destructive hope takes over during trades, particularly losing ones, and prevents you from executing your predetermined exit strategies.
The Psychology Behind Trading Hope
To understand why hope can be so destructive in trading, you need to understand what's happening in your brain when you're holding onto losing positions. Hope activates the same neural pathways involved in addiction, creating chemical rewards that make it difficult to abandon losing positions. When you hope for a trade to recover, your brain releases dopamine in anticipation of that recovery, even though the recovery may never come.
Cognitive dissonance plays a major role in how hope develops and persists. When reality conflicts with your beliefs or expectations, your brain experiences psychological discomfort and works to resolve the conflict. If you believe you're a good trader but your current position is losing money, hope offers a convenient solution: it suggests the position will eventually become profitable.
Hope also functions as a coping mechanism that helps you avoid the immediate emotional pain of realizing losses. Taking a loss requires you to confront the reality that you were wrong and that you lost money. Hope allows you to postpone this confrontation indefinitely by maintaining the fiction that the loss isn't real as long as you haven't closed the position.
The sunk cost fallacy amplifies hope by making you focus on what you've already invested rather than what you're likely to gain or lose going forward. The more money you've lost on a position, the harder it becomes to close it because hope whispers that walking away now would mean all those losses were for nothing.
The Hope-Denial Spectrum
One of the most important skills you can develop is recognizing where you fall on the spectrum from healthy optimism to dangerous denial. Hope doesn't suddenly become destructive. It gradually transforms from reasonable expectation into desperate wishful thinking.
The spectrum begins with reasonable optimism, which is healthy and necessary for trading. When you enter a well-researched trade, it's reasonable to be optimistic about the outcome. This optimism is grounded in evidence, acknowledges the possibility of being wrong, and includes specific plans for adverse scenarios.
As a trade moves against you, reasonable optimism can shift into stubborn hope. You start ignoring new information that contradicts your thesis while giving extra weight to any positive developments. The shift is subtle but important: you're no longer updating your analysis based on new information but filtering information to support your existing hope.
Stubborn hope can escalate into desperate hope as losses mount. At this stage, you're no longer hoping based on analysis; you're hoping because you need the trade to work out. Your reasons become increasingly emotional and less logical: "I can't afford to lose this much money" or "This position has to recover because I've already lost so much."
The final stage is complete denial, where you refuse to acknowledge that the position is a loser. You stop monitoring the position closely, avoid looking at your account balance, or convince yourself that the loss doesn't count because you haven't closed the position yet.
Each stage represents a deeper departure from rational trading. The key is learning to recognize where you are on this spectrum in real time, particularly during the transition from reasonable optimism to stubborn hope, where you still have the most control.
When Hope Becomes Averaging Down
One of the most dangerous manifestations of hope is when it leads to averaging down, buying more of a position as the price declines. Hope makes averaging down feel logical by reframing declining prices as opportunities rather than warnings. If your analysis was right at $50, surely it's even more right at $45.
The mathematics of averaging down can be seductive. If you bought 100 shares at $50 and another 100 at $45, your average cost is now $47.50. Hope focuses on the smaller recovery needed to break even, while ignoring the possibility that the stock might continue to decline.
Averaging down also offers psychological benefits that hopeful people want. It gives you something active to do instead of passively watching your position lose money. This sense of taking control can be emotionally satisfying, even when the action is making the situation worse.
The danger becomes clear when averaging down fails. The increasingly attractive average price seems to justify each additional purchase, but each addition increases your total exposure. What started as a manageable 5% position can easily become 10%, 15%, or even 20% of your account.
Hope makes averaging down particularly dangerous because it changes your relationship with the position. Instead of viewing declining prices as evidence that your original analysis might have been wrong, hope reframes them as opportunities to improve your average cost. This prevents objective evaluation of whether your original reasons for buying are still valid. Dollar-cost averaging is for investors in indexes over decades, not traders on a daily chart looking for profits on an individual trade. Averaging down in a losing trade due to hope is one of the most destructive behaviors that keep traders unprofitable and their capital trapped on the wrong side of the trend.
Setting Hope Boundaries
Just as you set financial boundaries through position sizing and stop losses, you need psychological boundaries that prevent hope from overriding rational decision-making. These hope boundaries serve as circuit breakers that trigger when hope begins transforming from a helpful emotion into a destructive force.
Time-based boundaries are among the most effective limits. Before entering any trade, establish a maximum holding periodif it's not working as expected. When your time stop limit is reached, close the position regardless of your emotions about its potential.
Stop-loss boundaries provide another crucial constraint. Predetermine the maximum amount you're willing to lose on any single trade, and close the position when that loss is reached. This boundary should be set before entering the trade, when you're thinking clearly and objectively.
Evidence-based boundaries help prevent hope from overriding objective analysis. Before entering a trade, identify specific technical or fundamental changes that would invalidate your original thesis. When these predetermined conditions are met, close the position regardless of your hope for recovery.
confidence that consistent execution of a sound approach will lead to profitability over time.
The most successful traders maintain tremendous hope and optimism about their long-term prospects while being absolutely ruthless in managing individual positions. They hope their systems will continue working and that they'll continue improving as traders. But they never let hope prevent them from taking necessary stops, managing risk appropriately, or admitting when individual trades aren't working.
As you continue developing your trading skills, pay attention to the quality and direction of your hope. Notice when it's motivating productive behavior like research and planning, and when it's encouraging passive behavior like holding losing positions or avoiding difficult decisions. The more aware you become of hope's influence, the better you can channel it toward activities that actually improve your trading results.
Key Strategies for Managing Hope
*Set predetermined time limits for all trades: Close positions when time limits are reached, regardless of hope for recovery
*Establish maximum loss limits before entering trades: Exit when loss limits are hit, no matter how much you hope for a turnaround
*Create specific invalidation criteria for each trade: Predetermine what evidence would prove your analysis wrong
*Schedule regular position reviews with a fresh-eyed evaluation: Ask whether you would initiate each position if starting today
*Write detailed pre-trade plans, including exit strategies like profit targets and trailing stops: Refer back to original analysis when hope clouds judgment
*Keep a trading journal to identify patterns: Track instances when hope overrode rational decision-making
*Use automated stops and alerts to remove emotions: Let technology execute predetermined exit strategies
*Focus hope on process improvement rather than trade outcomes: Hope for better skills, not individual position recovery
*Convert hopes into specific scenario planning: Prepare concrete responses for different market conditions
#WhatWillDriveCryptoandStocks’NextRebound? #Anthropic’s6xIPODemandSignalsPotentialRecordRaise #JaneStreetNearlyOctuplesFidelityBitcoinETFHoldings #USPPIMissMayEaseBTCPressure #BitcoinCoreDisclosesTorTrafficVulnerability
3
·
--

Article
Thinking in Probabilities, Not Predictions or OpinionsTrading the Distribution, Not Obsessing Over Short-Term Outcomes
You will never know what the market is going to do. Nobody does. The analyst on television doesn't know, and the fund manager speaking confidently doesn't either. Neither do you, however good your chart looks when you take your entry. If you can understand this one idea, you're already ahead of most of the people you're trading against. Most of the people on the other side of your trades will spend all their time chasing the one thing that can't be done, which is predicting the future.
This is Chapter 1 from my book: How to Trade Like a Mathematician: Quantitative Trade Management Strategies, Risk Management, and Mathematical Models to Master the Stock Market.
A person who wants to trade like a mathematician takes a different approach entirely. They assign probabilities to a range of futures, then structure their decisions so that the math works out in their favor over many repetitions. That's the complete shift this chapter asks of you. Instead of asking, "What will this stock do next?" Ask a better question: "What does the distribution of outcomes look like for this trade, and does the math still favor me if I take this exact trade a hundred times?"
The Casino Owner's Mindset
Consider how a casino runs its floor. When a gambler sits down at the roulette table, the casino does not know whether that particular spin will win-or-lose money for the house. The gambler might hit their number and walk out with thirty-five times their bet. The casino shrugs. On an American roulette wheel, there are 38 pockets: the numbers 1 through 36, plus 0 and 00. A straight-up bet on a single number pays 35 to 1. The player therefore has a 1-in-38 probability of winning and a 37-in-38 probability of losing. For every $1 wagered, the casino’s expected profit is:
Expected casino profit = (37/38 × $1) − (1/38 × $35)
This equals approximately $0.0526, or 5.26 cents per dollar wagered. In percentage terms, the American roulette wheel gives the casino a 5.26% house edge. The casino won’t earn exactly 5.26% over every short period, but as the number of wagers increases, its average profit typically converges toward that mathematical expectation.
Notice what the casino never bothers to do. It never forecasts a spin. It owns a small edge and lets the law of large numbers grind that edge into money, night after night, table after table. On any evening, the house can lose. Over ten thousand spins, the outcome is close to certain. That is the model to follow: trade the way the house operates, and evaluate every position the way the casino evaluates a wheel, through expected value and never through opinion.
Expected Value: The Only Question That Matters
Expected value, or EV, is the mathematical heart of probabilistic trading. The formula:
EV = (Probability of Winning × Average Win) minus (Probability of Losing × Average Loss)
A positive number means the trade is worth taking repeatedly. A negative number means the trade is a slow donation to someone else's account, and it stays a donation no matter how strongly you feel about the setup or how many people on social media agree with you. That is why EV is the only question that matters.
Time for real numbers. Suppose you tracked a specific setup in your trading journal, such as a pullback to the 20-day moving average in a stock trending upward. Over 100 occurrences, 45 trades were winners and 55 were losers. Your winning trades averaged a gain of 2.5R, where R represents the amount risked per trade, while your losing trades averaged a loss of 1R because you consistently honored your stop-loss. Your estimated expectancy per trade would be:
EV = (0.45 × 2.5R) − (0.55 × 1R)
EV = 1.125R − 0.55R = +0.575R
This means the setup historically earned an average of 0.575R per trade. If you risked $100 per trade, that would equal an estimated average profit of $57.50 per trade. This does not mean every trade will earn 0.575R. It means that, across a sufficiently large sample of similar trades, the average result would be expected to approach that amount if the setup’s win rate and payoff ratio remain stable.
Across a sufficiently large number of comparable trades, this setup has historically produced an average gain of 0.575R per trade, even though it loses more often than it wins. Read that again. It challenges one of the most damaging beliefs in trading: that a profitable trader must be right most of the time.
A 45 percent win rate combined with an average winner of 2.5R and an average loser of 1R creates strong positive expectancy before commissions, slippage, and other trading costs. Meanwhile, a strategy with a 70 percent win rate can still lose money if its average loss is three times its average win.
EV = (0.70 × 1R) − (0.30 × 3R)
EV = 0.70R − 0.90R = −0.20R per trade
That trader may feel successful on most trading days while steadily losing capital over a large sample of trades. Whether the trader eventually goes broke depends on position sizing, available capital, the sequence of returns, and how long the negative-expectancy strategy is traded.
This is also why unsupported opinions are dangerous. An opinion says, “Apple is going up.” A probability-based trading statement says, “Based on 100 historical occurrences of this setup, approximately 45 percent reached the 2.5R target before hitting the 1R stop. If those results remain representative and execution costs do not eliminate the edge, the setup has an estimated expectancy of +0.575R per trade.”
That statement does not guarantee the outcome of the next trade. It provides a testable hypothesis with numbers that can be used for position sizing, risk management, and ongoing performance review. The shift from certainty and prediction to probability and expectancy is the whole point.
Individual Trades Mean Nothing; Samples Mean Everything
Now for the place where most traders quietly sabotage themselves. They judge their system trade by trade. They take a perfectly good positive expectancy trade, it loses, and they conclude the setup is broken. Or they take a terrible negative expectancy trade, it wins, and they conclude they've discovered a new edge. Both conclusions are mathematically illiterate, and I say that with love, because I want you to feel a small sting every time you catch yourself doing it.
A single outcome tells you very little about the quality of the decision that produced it. Flip a fair coin ten times, and there is about a 17 percent chance of getting seven or more heads. Seven heads in ten flips would not be sound evidence that the coin was biased because ten observations are too few to separate skill, edge, or bias from ordinary randomness.
Traders often make the same mistake when evaluating a system. They abandon a strategy after a short losing streak, even when that streak is consistent with the system’s expected win rate. A strategy with a 45 percent win rate loses 55 percent of its trades. The probability that any sequence of five trades will contain five consecutive losses is:
0.55⁵ ≈ 5.03 percent
That does not mean a five-trade losing streak will occur exactly once every twenty trades. Streaks can overlap, cluster, or remain absent for long periods. However, across hundreds of trades, one or more five-loss streaks should not be surprising. A single losing streak provides limited evidence that the strategy’s underlying edge has disappeared. Random sequences naturally produce clusters of wins and losses.
The practical defense is to establish evaluation rules before trading the system. Do not judge a setup from a handful of outcomes. Thirty trades may provide an initial sign, but 50 to 100 trades offer a more useful sample, and some strategies require far more because of their win rate, payoff distribution, trade frequency, and sensitivity to changing market conditions.
Record every valid occurrence in a trading journal, including the entry, stop, target, trailing stop, market conditions, execution costs, and the result in R multiples. Then compare the observed win rate, average win, average loss, expectancy, and drawdown with the strategy’s historical assumptions.
Even a large sample does not prove that an edge will continue forever. It gives you a stronger statistical basis for deciding whether recent results are consistent with normal variation or whether the strategy may have materially changed. The goal is not to replace judgment entirely, but to ensure judgment is grounded in evidence rather than emotion, isolated outcomes, or short-term noise.
Watch how this plays out under pressure. Say you trade a breakout strategy and you're 12 trades in with a record of 4 wins and 8 losses. Your emotional brain screams that the strategy is failing. Your mathematical brain runs a check instead. It asks how unusual 4 wins in 12 trades would be if the true win rate really were the expected 45 percent. The binomial distribution answers: getting 4 or fewer wins in 12 trials at a 45 percent win rate happens roughly a quarter of the time. Ordinary. It's the equivalent of rolling a die twice without seeing a six, and you'd never call that die broken. So you keep executing your strategy because 12 trades is far too small a sample to override a tested edge.
Position Sizing Is Where Probability Becomes Survival
Thinking in probabilities forces a hard conclusion about position sizing, too. Since any single trade can lose, no single trade can ever be allowed to matter very much. A setup that wins 45 percent of the time will hand you losing streaks of 5, 6, or even 8 trades with mathematical certainty over a long career. So your position sizing has to guarantee you survive the worst losing streak probability will realistically deal you eventually, and risk management has to guarantee your account survival in advance.
Run the numbers on risking 10 percent of your current account equity per trade. After eight consecutive full-risk losses, the account would retain:
0.90⁸ ≈ 43.05 percent
That is a drawdown of approximately 56.95 percent. Recovering from that loss would require a gain of about 132 percent just to return to the starting balance.
Now apply the same eight-trade losing streak while risking 1 percent of current equity per trade:
0.99⁸ ≈ 92.27 percent
The account would experience a drawdown of approximately 7.73 percent. Recovering from that loss would require a gain of about 8.38 percent.
For a strategy with a 45 percent win rate, eight consecutive losses are unlikely in any eight-trade sequence, but they become increasingly plausible as the number of trades grows. A probability-based trader therefore sizes positions for losing streaks that can reasonably occur, not for the winning trade expected next.
Many disciplined traders risk only a small fraction of their equity on each position, often around 0.5 percent to 2 percent, although the amount depends on the strategy’s historical drawdowns, volatility, correlation between positions, stop-loss reliability, and the trader’s risk tolerance. The principle is straightforward: position size should allow the account to survive normal losing streaks without suffering a drawdown so deep that recovery becomes mathematically difficult or psychologically unbearable.
Turning Market Views into Probability Estimates
The market won't hand you probabilities the way a roulette wheel does, so you have to build your own estimates, and three sources do most of the work. Your own journal comes first: log every setup, let your realized win rate and average R multiples become your probability inputs, then update them as the sample grows.
Backtesting comes second. Before risking capital on a rule-based setup, test it across a sufficiently large sample covering different market regimes, volatility environments, and trend conditions. The goal is not just to prove that the strategy will work in the future, but to estimate its historical win rate, payoff ratio, expectancy, drawdowns, and sensitivity to changing market conditions.
The options market provides another useful source of information. Option prices can be used to derive model-based, risk-neutral probability estimates from implied volatility, strike prices, expiration dates, and the shape of the volatility skew. These estimates are not forecasts of the stock’s true future probabilities, but they show how the options market is pricing uncertainty at that moment.
Suppose a stock trades at $100, and one-month options imply an expected range of approximately $92 to $108. That range is often interpreted as roughly one standard deviation, which corresponds to about 68 percent under a simplified normal-distribution assumption. It does not guarantee that the stock has exactly a 68 percent chance of remaining inside that range, but it provides a useful benchmark for judging whether your price target is consistent with the movement currently priced into the options market.
If your trade requires the stock to reach $120 within one month, you can examine option prices to estimate how unlikely the market considers that outcome. If a model assigns it approximately a 5 percent probability, a binary wager on that event would require a net payoff of about 19 to 1 merely to break even before fees:
Break-even payoff = (1 − 0.05) ÷ 0.05 = 19 to 1
A conventional stock trade is more complicated because its expectancy also depends on the stop-loss level, the path of price movement, partial exits, slippage, and whether the target must merely be touched or held through expiration. Still, the comparison is valuable. If your target lies far outside the option-implied distribution and the potential reward does not compensate for the low estimated probability, the trade may not offer favorable expectancy.
Backtesting, observed market data, and option-implied distributions do not eliminate uncertainty. They convert vague predictions into measurable assumptions that can be tested, sized, and reviewed before capital is placed at risk.
One honest caution belongs here. Your probability estimates will always be imperfect. Markets shift, edges decay, and past frequencies are estimates, never guarantees. Perfect inputs are out of reach, and that's fine, because approximately correct probabilities paired with conservative sizing will work for you over time if you stay consistent with on strategy. When you're somewhat wrong about the size of your edge under that arrangement, the error dents your results instead of wrecking your account. A person thinking like a mathematician builds humility directly into their position size.
The Daily Practice
The routine itself is short. Before every trade, write three numbers: your estimated win probability, your reward measured in R, and your risk of 1R. Compute the expected value. If the number cannot come out clearly positive, you skip the trade, no matter what your impulses are shouting. After every trade, record the outcome without judgment, because one outcome is a single data point landing somewhere inside a distribution you already accepted when you clicked the buy button. Once a month, review your samples by setup, recalculate your actual win rates and payoffs, and adjust your estimates. Run yourself like a floor manager walking the casino at closing time, checking that each table is being managed properly to hold its edge.
Something useful happens to your psychology once this becomes a habit. Losses stop registering as failures. A loss taken on a positive expected value trade, at proper size, with the stop honored, counts as a correctly executed trade in every way that matters mathematically. Log it, note the R multiple, and move to the next entry in the queue.
Executing These Principles in Your Trading Plan
Write an expected value requirement into your plan: no trade is taken unless EV = (Win% × Avg Win) minus (Loss% × Avg Loss) comes out positive based on backtested or journaled trading data.Before each entry, record your three inputs in writing (estimated win probability, reward in R multiples, and risk of 1R), then calculate the EV.Set a fixed risk per trade of 0.5 to 2 percent of account equity so that mathematically inevitable losing streaks of 5 to 8 trades produce recoverable drawdowns.Define a minimum sample size rule: no setup gets judged, changed, or abandoned on fewer than 30 recorded trades, preferably 50 to 100.Journal every trade with entry, stop, target, and R multiple results, tagged by setup, so your probability estimates come from data rather than feelings.When a losing streak occurs, run the binomial math to check whether the streak is statistically normal for your win rate before changing anything.Use implied volatility to check trade probabilities: if the market prices your target as a low-probability event, demand a payoff large enough to justify it, or skip the trade.Schedule a monthly review to recalculate each setup's actual win rate, average win, and average loss, then update your EV inputs accordingly.Ban prediction language from your process: replace "this will go up" with a written probability and payoff statement for every trade.
You can purchase this book on Amazon worldwide: How to Trade Like a Mathematician: Quantitative Trade Management Strategies, Risk Management, and Mathematical Models to Master the Stock Market.
<<<<<<<<<<<<<<................>>>>>>>>>>>>>>>
#JobsReportRaisesHikeOdds #CPITestsDecemberRateOutlook #BitcoinRebounds$75KAsChipsLead #US Data Center Rules May Constrain AI Expansion #WillAnthropicListOnTime
Thinking in Probabilities, Not Predictions or Opinions
Trading the Distribution, Not Obsessing Over Short-Term Outcomes
You will never know what the market is going to do. Nobody does. The analyst on television doesn't know, and the fund manager speaking confidently doesn't either. Neither do you, however good your chart looks when you take your entry. If you can understand this one idea, you're already ahead of most of the people you're trading against. Most of the people on the other side of your trades will spend all their time chasing the one thing that can't be done, which is predicting the future.
This is Chapter 1 from my book: How to Trade Like a Mathematician: Quantitative Trade Management Strategies, Risk Management, and Mathematical Models to Master the Stock Market.
A person who wants to trade like a mathematician takes a different approach entirely. They assign probabilities to a range of futures, then structure their decisions so that the math works out in their favor over many repetitions. That's the complete shift this chapter asks of you. Instead of asking, "What will this stock do next?" Ask a better question: "What does the distribution of outcomes look like for this trade, and does the math still favor me if I take this exact trade a hundred times?"
The Casino Owner's Mindset
Consider how a casino runs its floor. When a gambler sits down at the roulette table, the casino does not know whether that particular spin will win-or-lose money for the house. The gambler might hit their number and walk out with thirty-five times their bet. The casino shrugs. On an American roulette wheel, there are 38 pockets: the numbers 1 through 36, plus 0 and 00. A straight-up bet on a single number pays 35 to 1. The player therefore has a 1-in-38 probability of winning and a 37-in-38 probability of losing. For every $1 wagered, the casino’s expected profit is:
Expected casino profit = (37/38 × $1) − (1/38 × $35)
This equals approximately $0.0526, or 5.26 cents per dollar wagered. In percentage terms, the American roulette wheel gives the casino a 5.26% house edge. The casino won’t earn exactly 5.26% over every short period, but as the number of wagers increases, its average profit typically converges toward that mathematical expectation.
Notice what the casino never bothers to do. It never forecasts a spin. It owns a small edge and lets the law of large numbers grind that edge into money, night after night, table after table. On any evening, the house can lose. Over ten thousand spins, the outcome is close to certain. That is the model to follow: trade the way the house operates, and evaluate every position the way the casino evaluates a wheel, through expected value and never through opinion.
Expected Value: The Only Question That Matters
Expected value, or EV, is the mathematical heart of probabilistic trading. The formula:
EV = (Probability of Winning × Average Win) minus (Probability of Losing × Average Loss)
A positive number means the trade is worth taking repeatedly. A negative number means the trade is a slow donation to someone else's account, and it stays a donation no matter how strongly you feel about the setup or how many people on social media agree with you. That is why EV is the only question that matters.
Time for real numbers. Suppose you tracked a specific setup in your trading journal, such as a pullback to the 20-day moving average in a stock trending upward. Over 100 occurrences, 45 trades were winners and 55 were losers. Your winning trades averaged a gain of 2.5R, where R represents the amount risked per trade, while your losing trades averaged a loss of 1R because you consistently honored your stop-loss. Your estimated expectancy per trade would be:
EV = (0.45 × 2.5R) − (0.55 × 1R)
EV = 1.125R − 0.55R = +0.575R
This means the setup historically earned an average of 0.575R per trade. If you risked $100 per trade, that would equal an estimated average profit of $57.50 per trade. This does not mean every trade will earn 0.575R. It means that, across a sufficiently large sample of similar trades, the average result would be expected to approach that amount if the setup’s win rate and payoff ratio remain stable.
Across a sufficiently large number of comparable trades, this setup has historically produced an average gain of 0.575R per trade, even though it loses more often than it wins. Read that again. It challenges one of the most damaging beliefs in trading: that a profitable trader must be right most of the time.
A 45 percent win rate combined with an average winner of 2.5R and an average loser of 1R creates strong positive expectancy before commissions, slippage, and other trading costs. Meanwhile, a strategy with a 70 percent win rate can still lose money if its average loss is three times its average win.
EV = (0.70 × 1R) − (0.30 × 3R)
EV = 0.70R − 0.90R = −0.20R per trade
That trader may feel successful on most trading days while steadily losing capital over a large sample of trades. Whether the trader eventually goes broke depends on position sizing, available capital, the sequence of returns, and how long the negative-expectancy strategy is traded.
This is also why unsupported opinions are dangerous. An opinion says, “Apple is going up.” A probability-based trading statement says, “Based on 100 historical occurrences of this setup, approximately 45 percent reached the 2.5R target before hitting the 1R stop. If those results remain representative and execution costs do not eliminate the edge, the setup has an estimated expectancy of +0.575R per trade.”
That statement does not guarantee the outcome of the next trade. It provides a testable hypothesis with numbers that can be used for position sizing, risk management, and ongoing performance review. The shift from certainty and prediction to probability and expectancy is the whole point.
Individual Trades Mean Nothing; Samples Mean Everything
Now for the place where most traders quietly sabotage themselves. They judge their system trade by trade. They take a perfectly good positive expectancy trade, it loses, and they conclude the setup is broken. Or they take a terrible negative expectancy trade, it wins, and they conclude they've discovered a new edge. Both conclusions are mathematically illiterate, and I say that with love, because I want you to feel a small sting every time you catch yourself doing it.
A single outcome tells you very little about the quality of the decision that produced it. Flip a fair coin ten times, and there is about a 17 percent chance of getting seven or more heads. Seven heads in ten flips would not be sound evidence that the coin was biased because ten observations are too few to separate skill, edge, or bias from ordinary randomness.
Traders often make the same mistake when evaluating a system. They abandon a strategy after a short losing streak, even when that streak is consistent with the system’s expected win rate. A strategy with a 45 percent win rate loses 55 percent of its trades. The probability that any sequence of five trades will contain five consecutive losses is:
0.55⁵ ≈ 5.03 percent
That does not mean a five-trade losing streak will occur exactly once every twenty trades. Streaks can overlap, cluster, or remain absent for long periods. However, across hundreds of trades, one or more five-loss streaks should not be surprising. A single losing streak provides limited evidence that the strategy’s underlying edge has disappeared. Random sequences naturally produce clusters of wins and losses.
The practical defense is to establish evaluation rules before trading the system. Do not judge a setup from a handful of outcomes. Thirty trades may provide an initial sign, but 50 to 100 trades offer a more useful sample, and some strategies require far more because of their win rate, payoff distribution, trade frequency, and sensitivity to changing market conditions.
Record every valid occurrence in a trading journal, including the entry, stop, target, trailing stop, market conditions, execution costs, and the result in R multiples. Then compare the observed win rate, average win, average loss, expectancy, and drawdown with the strategy’s historical assumptions.
Even a large sample does not prove that an edge will continue forever. It gives you a stronger statistical basis for deciding whether recent results are consistent with normal variation or whether the strategy may have materially changed. The goal is not to replace judgment entirely, but to ensure judgment is grounded in evidence rather than emotion, isolated outcomes, or short-term noise.
Watch how this plays out under pressure. Say you trade a breakout strategy and you're 12 trades in with a record of 4 wins and 8 losses. Your emotional brain screams that the strategy is failing. Your mathematical brain runs a check instead. It asks how unusual 4 wins in 12 trades would be if the true win rate really were the expected 45 percent. The binomial distribution answers: getting 4 or fewer wins in 12 trials at a 45 percent win rate happens roughly a quarter of the time. Ordinary. It's the equivalent of rolling a die twice without seeing a six, and you'd never call that die broken. So you keep executing your strategy because 12 trades is far too small a sample to override a tested edge.
Position Sizing Is Where Probability Becomes Survival
Thinking in probabilities forces a hard conclusion about position sizing, too. Since any single trade can lose, no single trade can ever be allowed to matter very much. A setup that wins 45 percent of the time will hand you losing streaks of 5, 6, or even 8 trades with mathematical certainty over a long career. So your position sizing has to guarantee you survive the worst losing streak probability will realistically deal you eventually, and risk management has to guarantee your account survival in advance.
Run the numbers on risking 10 percent of your current account equity per trade. After eight consecutive full-risk losses, the account would retain:
0.90⁸ ≈ 43.05 percent
That is a drawdown of approximately 56.95 percent. Recovering from that loss would require a gain of about 132 percent just to return to the starting balance.
Now apply the same eight-trade losing streak while risking 1 percent of current equity per trade:
0.99⁸ ≈ 92.27 percent
The account would experience a drawdown of approximately 7.73 percent. Recovering from that loss would require a gain of about 8.38 percent.
For a strategy with a 45 percent win rate, eight consecutive losses are unlikely in any eight-trade sequence, but they become increasingly plausible as the number of trades grows. A probability-based trader therefore sizes positions for losing streaks that can reasonably occur, not for the winning trade expected next.
Many disciplined traders risk only a small fraction of their equity on each position, often around 0.5 percent to 2 percent, although the amount depends on the strategy’s historical drawdowns, volatility, correlation between positions, stop-loss reliability, and the trader’s risk tolerance. The principle is straightforward: position size should allow the account to survive normal losing streaks without suffering a drawdown so deep that recovery becomes mathematically difficult or psychologically unbearable.
Turning Market Views into Probability Estimates
The market won't hand you probabilities the way a roulette wheel does, so you have to build your own estimates, and three sources do most of the work. Your own journal comes first: log every setup, let your realized win rate and average R multiples become your probability inputs, then update them as the sample grows.
Backtesting comes second. Before risking capital on a rule-based setup, test it across a sufficiently large sample covering different market regimes, volatility environments, and trend conditions. The goal is not just to prove that the strategy will work in the future, but to estimate its historical win rate, payoff ratio, expectancy, drawdowns, and sensitivity to changing market conditions.
The options market provides another useful source of information. Option prices can be used to derive model-based, risk-neutral probability estimates from implied volatility, strike prices, expiration dates, and the shape of the volatility skew. These estimates are not forecasts of the stock’s true future probabilities, but they show how the options market is pricing uncertainty at that moment.
Suppose a stock trades at $100, and one-month options imply an expected range of approximately $92 to $108. That range is often interpreted as roughly one standard deviation, which corresponds to about 68 percent under a simplified normal-distribution assumption. It does not guarantee that the stock has exactly a 68 percent chance of remaining inside that range, but it provides a useful benchmark for judging whether your price target is consistent with the movement currently priced into the options market.
If your trade requires the stock to reach $120 within one month, you can examine option prices to estimate how unlikely the market considers that outcome. If a model assigns it approximately a 5 percent probability, a binary wager on that event would require a net payoff of about 19 to 1 merely to break even before fees:
Break-even payoff = (1 − 0.05) ÷ 0.05 = 19 to 1
A conventional stock trade is more complicated because its expectancy also depends on the stop-loss level, the path of price movement, partial exits, slippage, and whether the target must merely be touched or held through expiration. Still, the comparison is valuable. If your target lies far outside the option-implied distribution and the potential reward does not compensate for the low estimated probability, the trade may not offer favorable expectancy.
Backtesting, observed market data, and option-implied distributions do not eliminate uncertainty. They convert vague predictions into measurable assumptions that can be tested, sized, and reviewed before capital is placed at risk.
One honest caution belongs here. Your probability estimates will always be imperfect. Markets shift, edges decay, and past frequencies are estimates, never guarantees. Perfect inputs are out of reach, and that's fine, because approximately correct probabilities paired with conservative sizing will work for you over time if you stay consistent with on strategy. When you're somewhat wrong about the size of your edge under that arrangement, the error dents your results instead of wrecking your account. A person thinking like a mathematician builds humility directly into their position size.
The Daily Practice
The routine itself is short. Before every trade, write three numbers: your estimated win probability, your reward measured in R, and your risk of 1R. Compute the expected value. If the number cannot come out clearly positive, you skip the trade, no matter what your impulses are shouting. After every trade, record the outcome without judgment, because one outcome is a single data point landing somewhere inside a distribution you already accepted when you clicked the buy button. Once a month, review your samples by setup, recalculate your actual win rates and payoffs, and adjust your estimates. Run yourself like a floor manager walking the casino at closing time, checking that each table is being managed properly to hold its edge.
Something useful happens to your psychology once this becomes a habit. Losses stop registering as failures. A loss taken on a positive expected value trade, at proper size, with the stop honored, counts as a correctly executed trade in every way that matters mathematically. Log it, note the R multiple, and move to the next entry in the queue.
Executing These Principles in Your Trading Plan
Write an expected value requirement into your plan: no trade is taken unless EV = (Win% × Avg Win) minus (Loss% × Avg Loss) comes out positive based on backtested or journaled trading data.Before each entry, record your three inputs in writing (estimated win probability, reward in R multiples, and risk of 1R), then calculate the EV.Set a fixed risk per trade of 0.5 to 2 percent of account equity so that mathematically inevitable losing streaks of 5 to 8 trades produce recoverable drawdowns.Define a minimum sample size rule: no setup gets judged, changed, or abandoned on fewer than 30 recorded trades, preferably 50 to 100.Journal every trade with entry, stop, target, and R multiple results, tagged by setup, so your probability estimates come from data rather than feelings.When a losing streak occurs, run the binomial math to check whether the streak is statistically normal for your win rate before changing anything.Use implied volatility to check trade probabilities: if the market prices your target as a low-probability event, demand a payoff large enough to justify it, or skip the trade.Schedule a monthly review to recalculate each setup's actual win rate, average win, and average loss, then update your EV inputs accordingly.Ban prediction language from your process: replace "this will go up" with a written probability and payoff statement for every trade.
You can purchase this book on Amazon worldwide: How to Trade Like a Mathematician: Quantitative Trade Management Strategies, Risk Management, and Mathematical Models to Master the Stock Market.
<<<<<<<<<<<<<<................>>>>>>>>>>>>>>>
#JobsReportRaisesHikeOdds #CPITestsDecemberRateOutlook #BitcoinRebounds$75KAsChipsLead #US Data Center Rules May Constrain AI Expansion #WillAnthropicListOnTime
You will never know what the market is going to do. Nobody does. The analyst on television doesn't know, and the fund manager speaking confidently doesn't either. Neither do you, however good your chart looks when you take your entry. If you can understand this one idea, you're already ahead of most of the people you're trading against. Most of the people on the other side of your trades will spend all their time chasing the one thing that can't be done, which is predicting the future.
This is Chapter 1 from my book: How to Trade Like a Mathematician: Quantitative Trade Management Strategies, Risk Management, and Mathematical Models to Master the Stock Market.
A person who wants to trade like a mathematician takes a different approach entirely. They assign probabilities to a range of futures, then structure their decisions so that the math works out in their favor over many repetitions. That's the complete shift this chapter asks of you. Instead of asking, "What will this stock do next?" Ask a better question: "What does the distribution of outcomes look like for this trade, and does the math still favor me if I take this exact trade a hundred times?"
The Casino Owner's Mindset
Consider how a casino runs its floor. When a gambler sits down at the roulette table, the casino does not know whether that particular spin will win-or-lose money for the house. The gambler might hit their number and walk out with thirty-five times their bet. The casino shrugs. On an American roulette wheel, there are 38 pockets: the numbers 1 through 36, plus 0 and 00. A straight-up bet on a single number pays 35 to 1. The player therefore has a 1-in-38 probability of winning and a 37-in-38 probability of losing. For every $1 wagered, the casino’s expected profit is:
Expected casino profit = (37/38 × $1) − (1/38 × $35)
This equals approximately $0.0526, or 5.26 cents per dollar wagered. In percentage terms, the American roulette wheel gives the casino a 5.26% house edge. The casino won’t earn exactly 5.26% over every short period, but as the number of wagers increases, its average profit typically converges toward that mathematical expectation.
Notice what the casino never bothers to do. It never forecasts a spin. It owns a small edge and lets the law of large numbers grind that edge into money, night after night, table after table. On any evening, the house can lose. Over ten thousand spins, the outcome is close to certain. That is the model to follow: trade the way the house operates, and evaluate every position the way the casino evaluates a wheel, through expected value and never through opinion.
Expected Value: The Only Question That Matters
Expected value, or EV, is the mathematical heart of probabilistic trading. The formula:
EV = (Probability of Winning × Average Win) minus (Probability of Losing × Average Loss)
A positive number means the trade is worth taking repeatedly. A negative number means the trade is a slow donation to someone else's account, and it stays a donation no matter how strongly you feel about the setup or how many people on social media agree with you. That is why EV is the only question that matters.
Time for real numbers. Suppose you tracked a specific setup in your trading journal, such as a pullback to the 20-day moving average in a stock trending upward. Over 100 occurrences, 45 trades were winners and 55 were losers. Your winning trades averaged a gain of 2.5R, where R represents the amount risked per trade, while your losing trades averaged a loss of 1R because you consistently honored your stop-loss. Your estimated expectancy per trade would be:
EV = (0.45 × 2.5R) − (0.55 × 1R)
EV = 1.125R − 0.55R = +0.575R
This means the setup historically earned an average of 0.575R per trade. If you risked $100 per trade, that would equal an estimated average profit of $57.50 per trade. This does not mean every trade will earn 0.575R. It means that, across a sufficiently large sample of similar trades, the average result would be expected to approach that amount if the setup’s win rate and payoff ratio remain stable.
Across a sufficiently large number of comparable trades, this setup has historically produced an average gain of 0.575R per trade, even though it loses more often than it wins. Read that again. It challenges one of the most damaging beliefs in trading: that a profitable trader must be right most of the time.
A 45 percent win rate combined with an average winner of 2.5R and an average loser of 1R creates strong positive expectancy before commissions, slippage, and other trading costs. Meanwhile, a strategy with a 70 percent win rate can still lose money if its average loss is three times its average win.
EV = (0.70 × 1R) − (0.30 × 3R)
EV = 0.70R − 0.90R = −0.20R per trade
That trader may feel successful on most trading days while steadily losing capital over a large sample of trades. Whether the trader eventually goes broke depends on position sizing, available capital, the sequence of returns, and how long the negative-expectancy strategy is traded.
This is also why unsupported opinions are dangerous. An opinion says, “Apple is going up.” A probability-based trading statement says, “Based on 100 historical occurrences of this setup, approximately 45 percent reached the 2.5R target before hitting the 1R stop. If those results remain representative and execution costs do not eliminate the edge, the setup has an estimated expectancy of +0.575R per trade.”
That statement does not guarantee the outcome of the next trade. It provides a testable hypothesis with numbers that can be used for position sizing, risk management, and ongoing performance review. The shift from certainty and prediction to probability and expectancy is the whole point.
Individual Trades Mean Nothing; Samples Mean Everything
Now for the place where most traders quietly sabotage themselves. They judge their system trade by trade. They take a perfectly good positive expectancy trade, it loses, and they conclude the setup is broken. Or they take a terrible negative expectancy trade, it wins, and they conclude they've discovered a new edge. Both conclusions are mathematically illiterate, and I say that with love, because I want you to feel a small sting every time you catch yourself doing it.
A single outcome tells you very little about the quality of the decision that produced it. Flip a fair coin ten times, and there is about a 17 percent chance of getting seven or more heads. Seven heads in ten flips would not be sound evidence that the coin was biased because ten observations are too few to separate skill, edge, or bias from ordinary randomness.
Traders often make the same mistake when evaluating a system. They abandon a strategy after a short losing streak, even when that streak is consistent with the system’s expected win rate. A strategy with a 45 percent win rate loses 55 percent of its trades. The probability that any sequence of five trades will contain five consecutive losses is:
0.55⁵ ≈ 5.03 percent
That does not mean a five-trade losing streak will occur exactly once every twenty trades. Streaks can overlap, cluster, or remain absent for long periods. However, across hundreds of trades, one or more five-loss streaks should not be surprising. A single losing streak provides limited evidence that the strategy’s underlying edge has disappeared. Random sequences naturally produce clusters of wins and losses.
The practical defense is to establish evaluation rules before trading the system. Do not judge a setup from a handful of outcomes. Thirty trades may provide an initial sign, but 50 to 100 trades offer a more useful sample, and some strategies require far more because of their win rate, payoff distribution, trade frequency, and sensitivity to changing market conditions.
Record every valid occurrence in a trading journal, including the entry, stop, target, trailing stop, market conditions, execution costs, and the result in R multiples. Then compare the observed win rate, average win, average loss, expectancy, and drawdown with the strategy’s historical assumptions.
Even a large sample does not prove that an edge will continue forever. It gives you a stronger statistical basis for deciding whether recent results are consistent with normal variation or whether the strategy may have materially changed. The goal is not to replace judgment entirely, but to ensure judgment is grounded in evidence rather than emotion, isolated outcomes, or short-term noise.
Watch how this plays out under pressure. Say you trade a breakout strategy and you're 12 trades in with a record of 4 wins and 8 losses. Your emotional brain screams that the strategy is failing. Your mathematical brain runs a check instead. It asks how unusual 4 wins in 12 trades would be if the true win rate really were the expected 45 percent. The binomial distribution answers: getting 4 or fewer wins in 12 trials at a 45 percent win rate happens roughly a quarter of the time. Ordinary. It's the equivalent of rolling a die twice without seeing a six, and you'd never call that die broken. So you keep executing your strategy because 12 trades is far too small a sample to override a tested edge.
Position Sizing Is Where Probability Becomes Survival
Thinking in probabilities forces a hard conclusion about position sizing, too. Since any single trade can lose, no single trade can ever be allowed to matter very much. A setup that wins 45 percent of the time will hand you losing streaks of 5, 6, or even 8 trades with mathematical certainty over a long career. So your position sizing has to guarantee you survive the worst losing streak probability will realistically deal you eventually, and risk management has to guarantee your account survival in advance.
Run the numbers on risking 10 percent of your current account equity per trade. After eight consecutive full-risk losses, the account would retain:
0.90⁸ ≈ 43.05 percent
That is a drawdown of approximately 56.95 percent. Recovering from that loss would require a gain of about 132 percent just to return to the starting balance.
Now apply the same eight-trade losing streak while risking 1 percent of current equity per trade:
0.99⁸ ≈ 92.27 percent
The account would experience a drawdown of approximately 7.73 percent. Recovering from that loss would require a gain of about 8.38 percent.
For a strategy with a 45 percent win rate, eight consecutive losses are unlikely in any eight-trade sequence, but they become increasingly plausible as the number of trades grows. A probability-based trader therefore sizes positions for losing streaks that can reasonably occur, not for the winning trade expected next.
Many disciplined traders risk only a small fraction of their equity on each position, often around 0.5 percent to 2 percent, although the amount depends on the strategy’s historical drawdowns, volatility, correlation between positions, stop-loss reliability, and the trader’s risk tolerance. The principle is straightforward: position size should allow the account to survive normal losing streaks without suffering a drawdown so deep that recovery becomes mathematically difficult or psychologically unbearable.
Turning Market Views into Probability Estimates
The market won't hand you probabilities the way a roulette wheel does, so you have to build your own estimates, and three sources do most of the work. Your own journal comes first: log every setup, let your realized win rate and average R multiples become your probability inputs, then update them as the sample grows.
Backtesting comes second. Before risking capital on a rule-based setup, test it across a sufficiently large sample covering different market regimes, volatility environments, and trend conditions. The goal is not just to prove that the strategy will work in the future, but to estimate its historical win rate, payoff ratio, expectancy, drawdowns, and sensitivity to changing market conditions.
The options market provides another useful source of information. Option prices can be used to derive model-based, risk-neutral probability estimates from implied volatility, strike prices, expiration dates, and the shape of the volatility skew. These estimates are not forecasts of the stock’s true future probabilities, but they show how the options market is pricing uncertainty at that moment.
Suppose a stock trades at $100, and one-month options imply an expected range of approximately $92 to $108. That range is often interpreted as roughly one standard deviation, which corresponds to about 68 percent under a simplified normal-distribution assumption. It does not guarantee that the stock has exactly a 68 percent chance of remaining inside that range, but it provides a useful benchmark for judging whether your price target is consistent with the movement currently priced into the options market.
If your trade requires the stock to reach $120 within one month, you can examine option prices to estimate how unlikely the market considers that outcome. If a model assigns it approximately a 5 percent probability, a binary wager on that event would require a net payoff of about 19 to 1 merely to break even before fees:
Break-even payoff = (1 − 0.05) ÷ 0.05 = 19 to 1
A conventional stock trade is more complicated because its expectancy also depends on the stop-loss level, the path of price movement, partial exits, slippage, and whether the target must merely be touched or held through expiration. Still, the comparison is valuable. If your target lies far outside the option-implied distribution and the potential reward does not compensate for the low estimated probability, the trade may not offer favorable expectancy.
Backtesting, observed market data, and option-implied distributions do not eliminate uncertainty. They convert vague predictions into measurable assumptions that can be tested, sized, and reviewed before capital is placed at risk.
One honest caution belongs here. Your probability estimates will always be imperfect. Markets shift, edges decay, and past frequencies are estimates, never guarantees. Perfect inputs are out of reach, and that's fine, because approximately correct probabilities paired with conservative sizing will work for you over time if you stay consistent with on strategy. When you're somewhat wrong about the size of your edge under that arrangement, the error dents your results instead of wrecking your account. A person thinking like a mathematician builds humility directly into their position size.
The Daily Practice
The routine itself is short. Before every trade, write three numbers: your estimated win probability, your reward measured in R, and your risk of 1R. Compute the expected value. If the number cannot come out clearly positive, you skip the trade, no matter what your impulses are shouting. After every trade, record the outcome without judgment, because one outcome is a single data point landing somewhere inside a distribution you already accepted when you clicked the buy button. Once a month, review your samples by setup, recalculate your actual win rates and payoffs, and adjust your estimates. Run yourself like a floor manager walking the casino at closing time, checking that each table is being managed properly to hold its edge.
Something useful happens to your psychology once this becomes a habit. Losses stop registering as failures. A loss taken on a positive expected value trade, at proper size, with the stop honored, counts as a correctly executed trade in every way that matters mathematically. Log it, note the R multiple, and move to the next entry in the queue.
Executing These Principles in Your Trading Plan
Write an expected value requirement into your plan: no trade is taken unless EV = (Win% × Avg Win) minus (Loss% × Avg Loss) comes out positive based on backtested or journaled trading data.Before each entry, record your three inputs in writing (estimated win probability, reward in R multiples, and risk of 1R), then calculate the EV.Set a fixed risk per trade of 0.5 to 2 percent of account equity so that mathematically inevitable losing streaks of 5 to 8 trades produce recoverable drawdowns.Define a minimum sample size rule: no setup gets judged, changed, or abandoned on fewer than 30 recorded trades, preferably 50 to 100.Journal every trade with entry, stop, target, and R multiple results, tagged by setup, so your probability estimates come from data rather than feelings.When a losing streak occurs, run the binomial math to check whether the streak is statistically normal for your win rate before changing anything.Use implied volatility to check trade probabilities: if the market prices your target as a low-probability event, demand a payoff large enough to justify it, or skip the trade.Schedule a monthly review to recalculate each setup's actual win rate, average win, and average loss, then update your EV inputs accordingly.Ban prediction language from your process: replace "this will go up" with a written probability and payoff statement for every trade.
You can purchase this book on Amazon worldwide: How to Trade Like a Mathematician: Quantitative Trade Management Strategies, Risk Management, and Mathematical Models to Master the Stock Market.
<<<<<<<<<<<<<<................>>>>>>>>>>>>>>>
#JobsReportRaisesHikeOdds #CPITestsDecemberRateOutlook #BitcoinRebounds$75KAsChipsLead #US Data Center Rules May Constrain AI Expansion #WillAnthropicListOnTime
128
·
--
Bullish
Partly True
🚨UPDATE: Intel leads the S&P 500’s worst-performing stocks in Q4, plunging 56.5%, with tech companies accounting for 35 of the 50 biggest losers through Nov. 5, per Fiscalai.
..........................?...............?.......................
#JobsReportRaisesHikeOdds #BitcoinRebounds$75KAsChipsLead #US Data Center Rules May Constrain AI Expansion #WillAnthropicListOnTime #CPITestsDecemberRateOutlook
🚨UPDATE: Intel leads the S&P 500’s worst-performing stocks in Q4, plunging 56.5%, with tech companies accounting for 35 of the 50 biggest losers through Nov. 5, per Fiscalai.
..........................?...............?.......................
#JobsReportRaisesHikeOdds #BitcoinRebounds$75KAsChipsLead #US Data Center Rules May Constrain AI Expansion #WillAnthropicListOnTime #CPITestsDecemberRateOutlook
..........................?...............?.......................
#JobsReportRaisesHikeOdds #BitcoinRebounds$75KAsChipsLead #US Data Center Rules May Constrain AI Expansion #WillAnthropicListOnTime #CPITestsDecemberRateOutlook
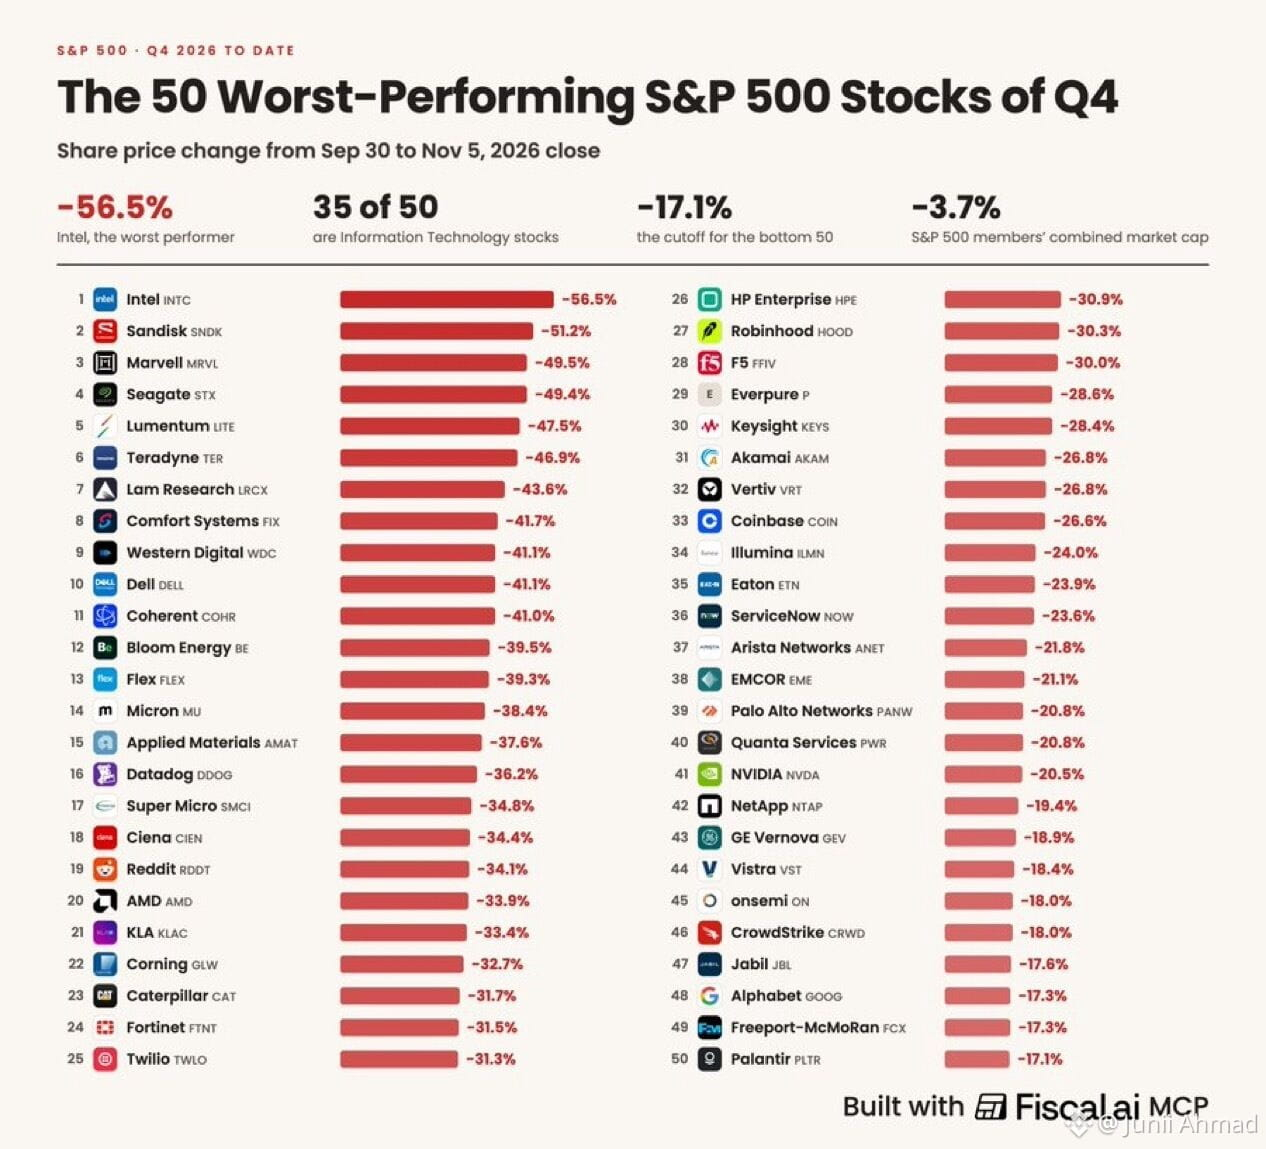
393
·
--
Verified
⚠️
BREAKING:
*ASIA-PACIFIC MARKETS END MIXED ACROSS THE REGION; KOREA'S KOSPI TUMBLES 5.3%
#BinanceReopensWithdrawalsForMoreAssets #BTCRebounds80K #Binance98PercentReplenished #ADPUSPrivateEmployersAdd86000JobsInOctober #USMidterms-WhatAreMarketsExpecting?
⚠️
BREAKING:
*ASIA-PACIFIC MARKETS END MIXED ACROSS THE REGION; KOREA'S KOSPI TUMBLES 5.3%
#BinanceReopensWithdrawalsForMoreAssets #BTCRebounds80K #Binance98PercentReplenished #ADPUSPrivateEmployersAdd86000JobsInOctober #USMidterms-WhatAreMarketsExpecting?
BREAKING:
*ASIA-PACIFIC MARKETS END MIXED ACROSS THE REGION; KOREA'S KOSPI TUMBLES 5.3%
#BinanceReopensWithdrawalsForMoreAssets #BTCRebounds80K #Binance98PercentReplenished #ADPUSPrivateEmployersAdd86000JobsInOctober #USMidterms-WhatAreMarketsExpecting?
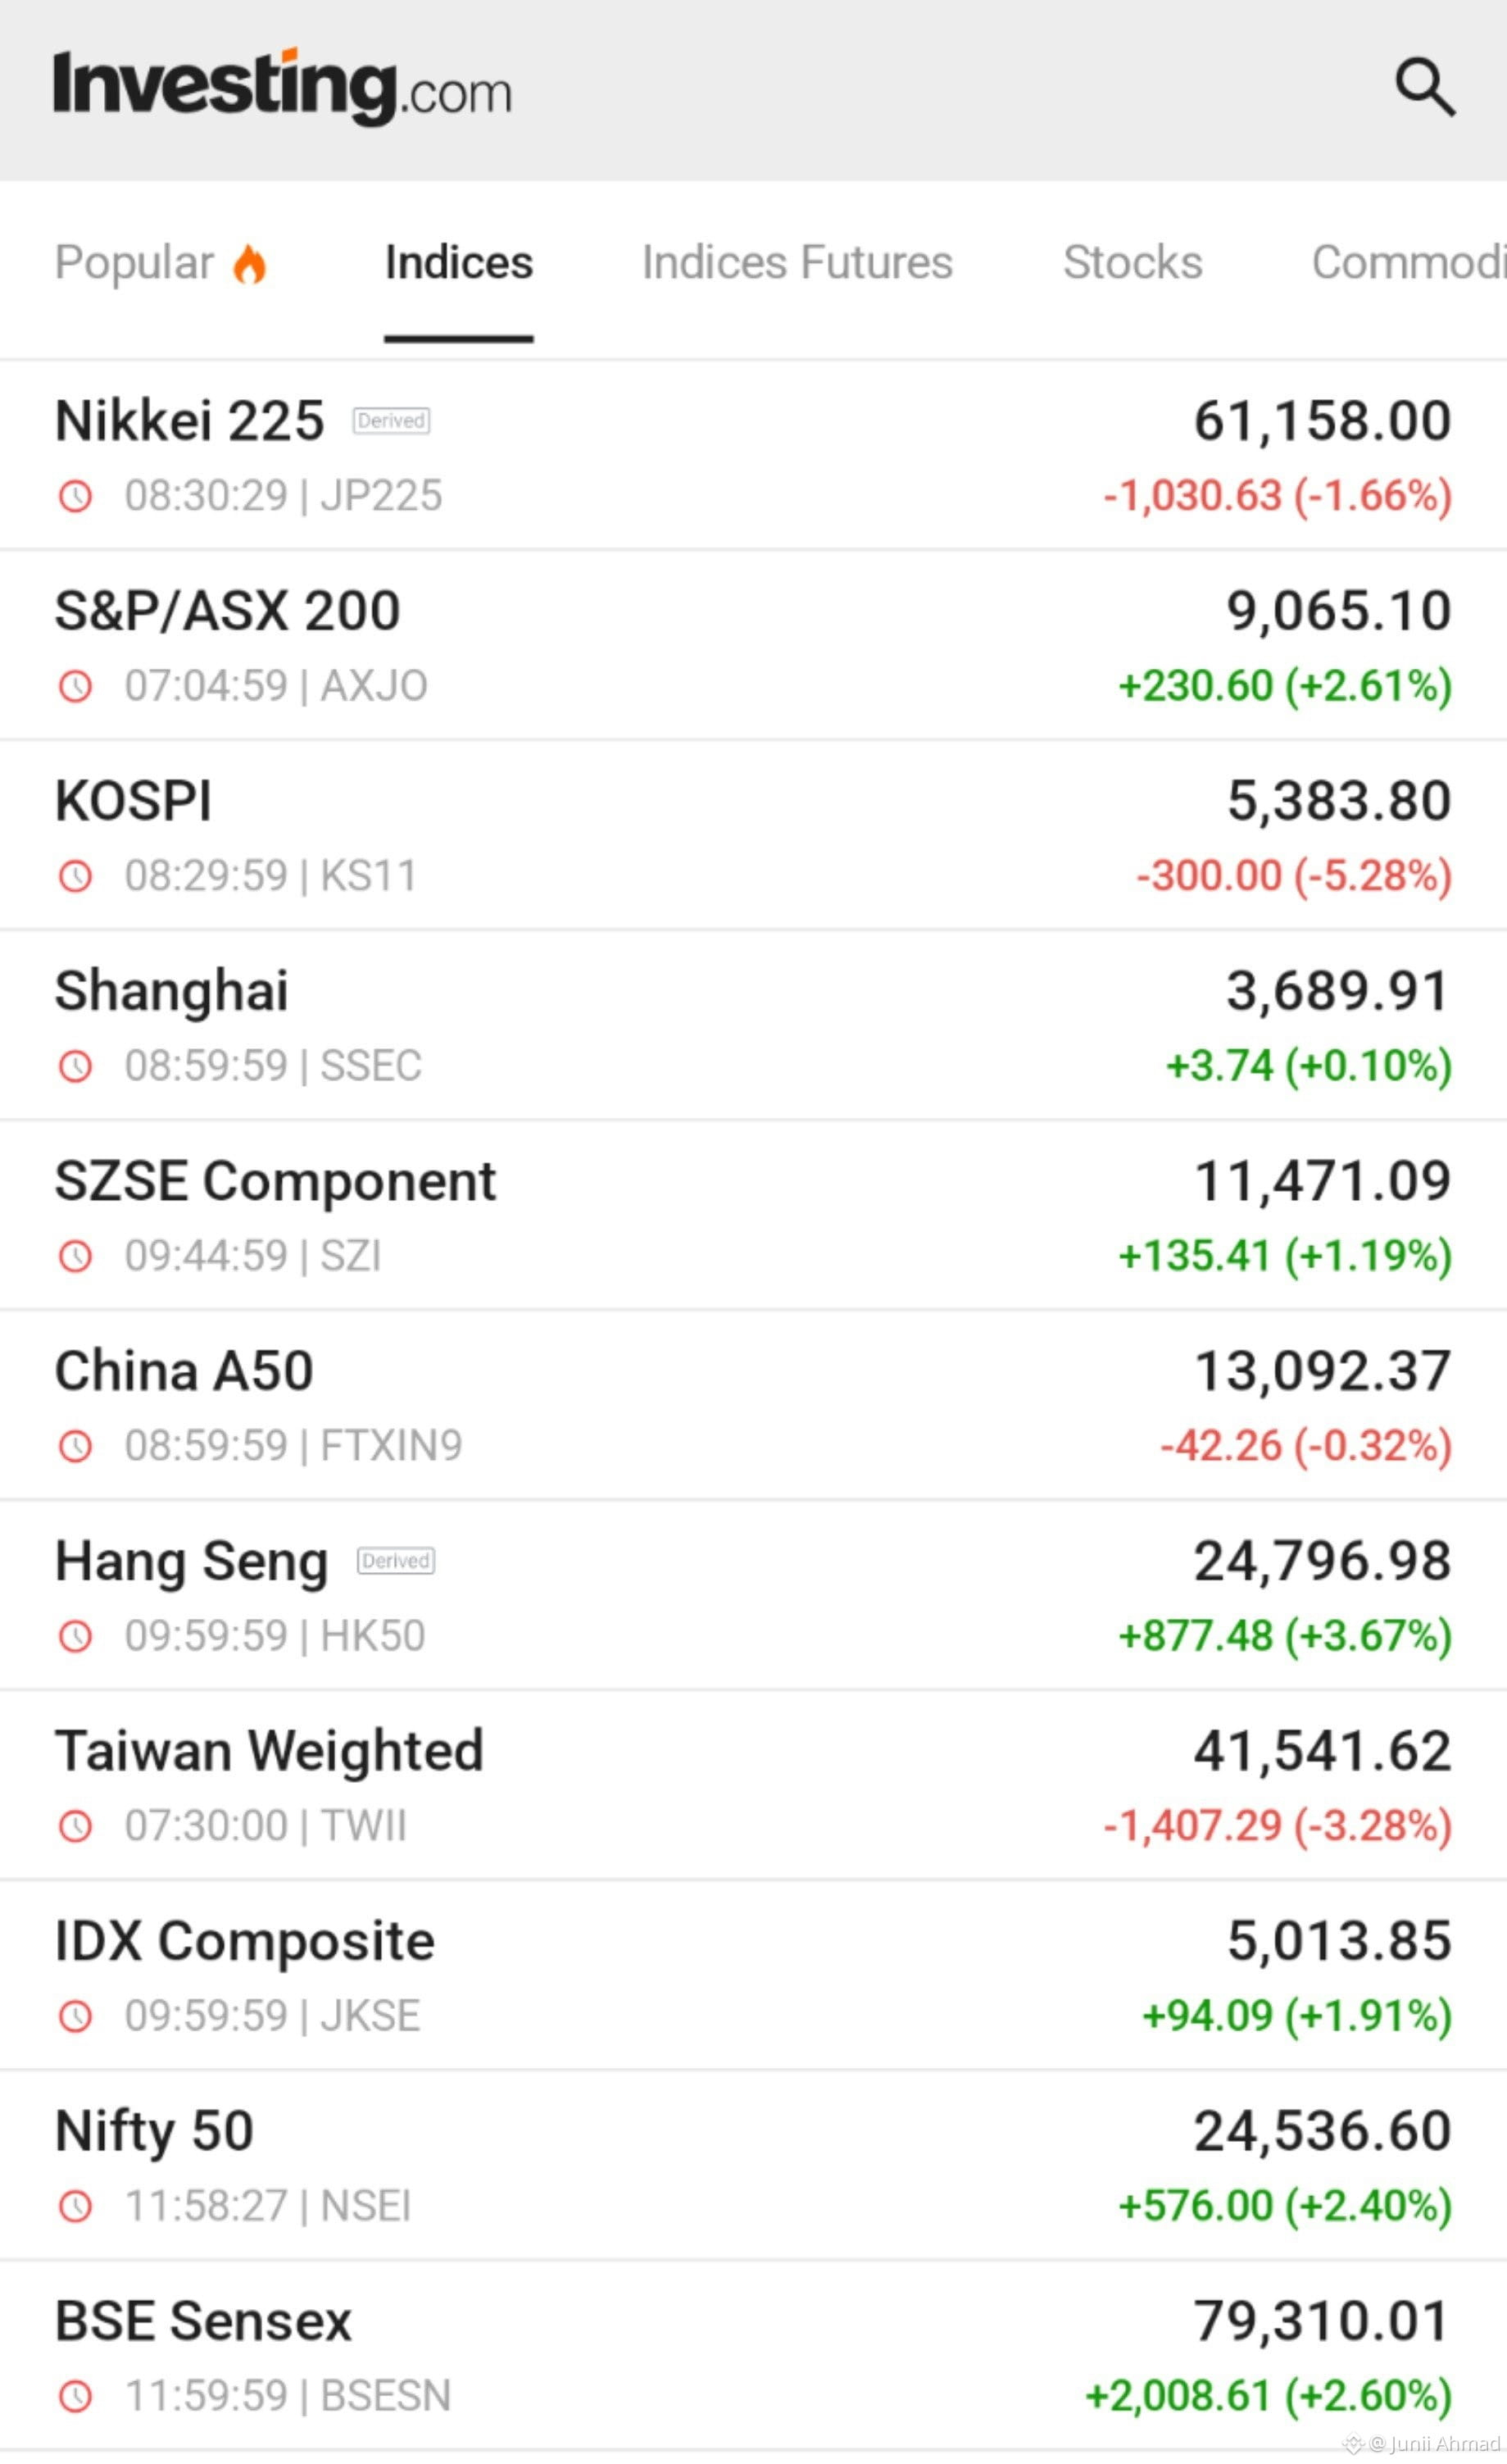
42
·
--
APPLE IS NOW WORTH $5.08 TRILLION.
Bigger than the entire yearly economy of:
Japan: $4.34T
The UK: $4.27T
France: $3.55T
Italy: $2.70T
Only three countries are bigger: the US, China and Germany.
One phone company.
#BinanceReopensWithdrawalsForMoreAssets #BTCRebounds80K #Binance98PercentReplenished #ADPUSPrivateEmployersAdd86000JobsInOctober #USMidterms-WhatAreMarketsExpecting?
APPLE IS NOW WORTH $5.08 TRILLION.
Bigger than the entire yearly economy of:
Japan: $4.34T
The UK: $4.27T
France: $3.55T
Italy: $2.70T
Only three countries are bigger: the US, China and Germany.
One phone company.
#BinanceReopensWithdrawalsForMoreAssets #BTCRebounds80K #Binance98PercentReplenished #ADPUSPrivateEmployersAdd86000JobsInOctober #USMidterms-WhatAreMarketsExpecting?
Bigger than the entire yearly economy of:
Japan: $4.34T
The UK: $4.27T
France: $3.55T
Italy: $2.70T
Only three countries are bigger: the US, China and Germany.
One phone company.
#BinanceReopensWithdrawalsForMoreAssets #BTCRebounds80K #Binance98PercentReplenished #ADPUSPrivateEmployersAdd86000JobsInOctober #USMidterms-WhatAreMarketsExpecting?
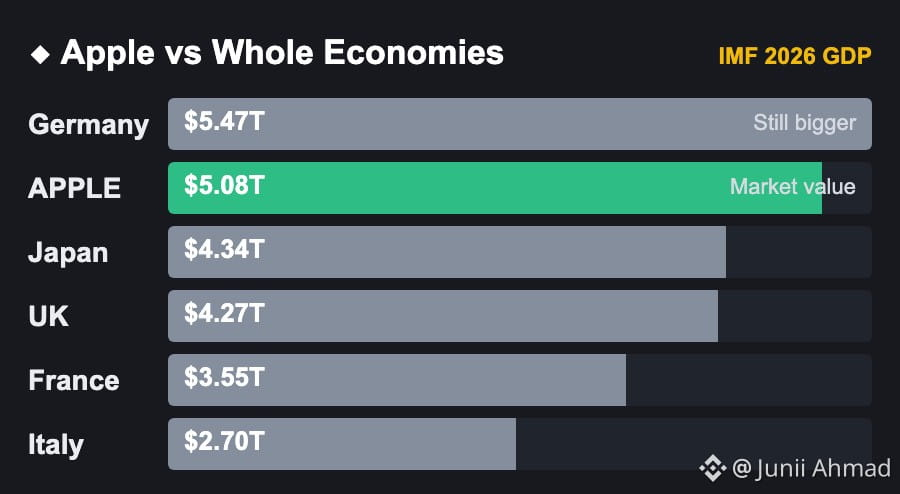
203
·
--
Verified
🚨
Get ready for a busy Thursday:
• Earnings: Lumentum
$LITE , Cloudflare $NET.US , Iren $IREN , Applied Optoelectronics $AAOI
• Economic Jobless Claims
• Fed Speakers: Barkin, Hammack
#BinanceReopensWithdrawalsForMoreAssets #BTCRebounds80K #Binance98PercentReplenished #ADPUSPrivateEmployersAdd86000JobsInOctober #USMidterms-WhatAreMarketsExpecting?
🚨
Get ready for a busy Thursday:
• Earnings: Lumentum
$LITE , Cloudflare $NET.US , Iren $IREN , Applied Optoelectronics $AAOI
• Economic Jobless Claims
• Fed Speakers: Barkin, Hammack
#BinanceReopensWithdrawalsForMoreAssets #BTCRebounds80K #Binance98PercentReplenished #ADPUSPrivateEmployersAdd86000JobsInOctober #USMidterms-WhatAreMarketsExpecting?
Get ready for a busy Thursday:
• Earnings: Lumentum
$LITE , Cloudflare $NET.US , Iren $IREN , Applied Optoelectronics $AAOI
• Economic Jobless Claims
• Fed Speakers: Barkin, Hammack
#BinanceReopensWithdrawalsForMoreAssets #BTCRebounds80K #Binance98PercentReplenished #ADPUSPrivateEmployersAdd86000JobsInOctober #USMidterms-WhatAreMarketsExpecting?
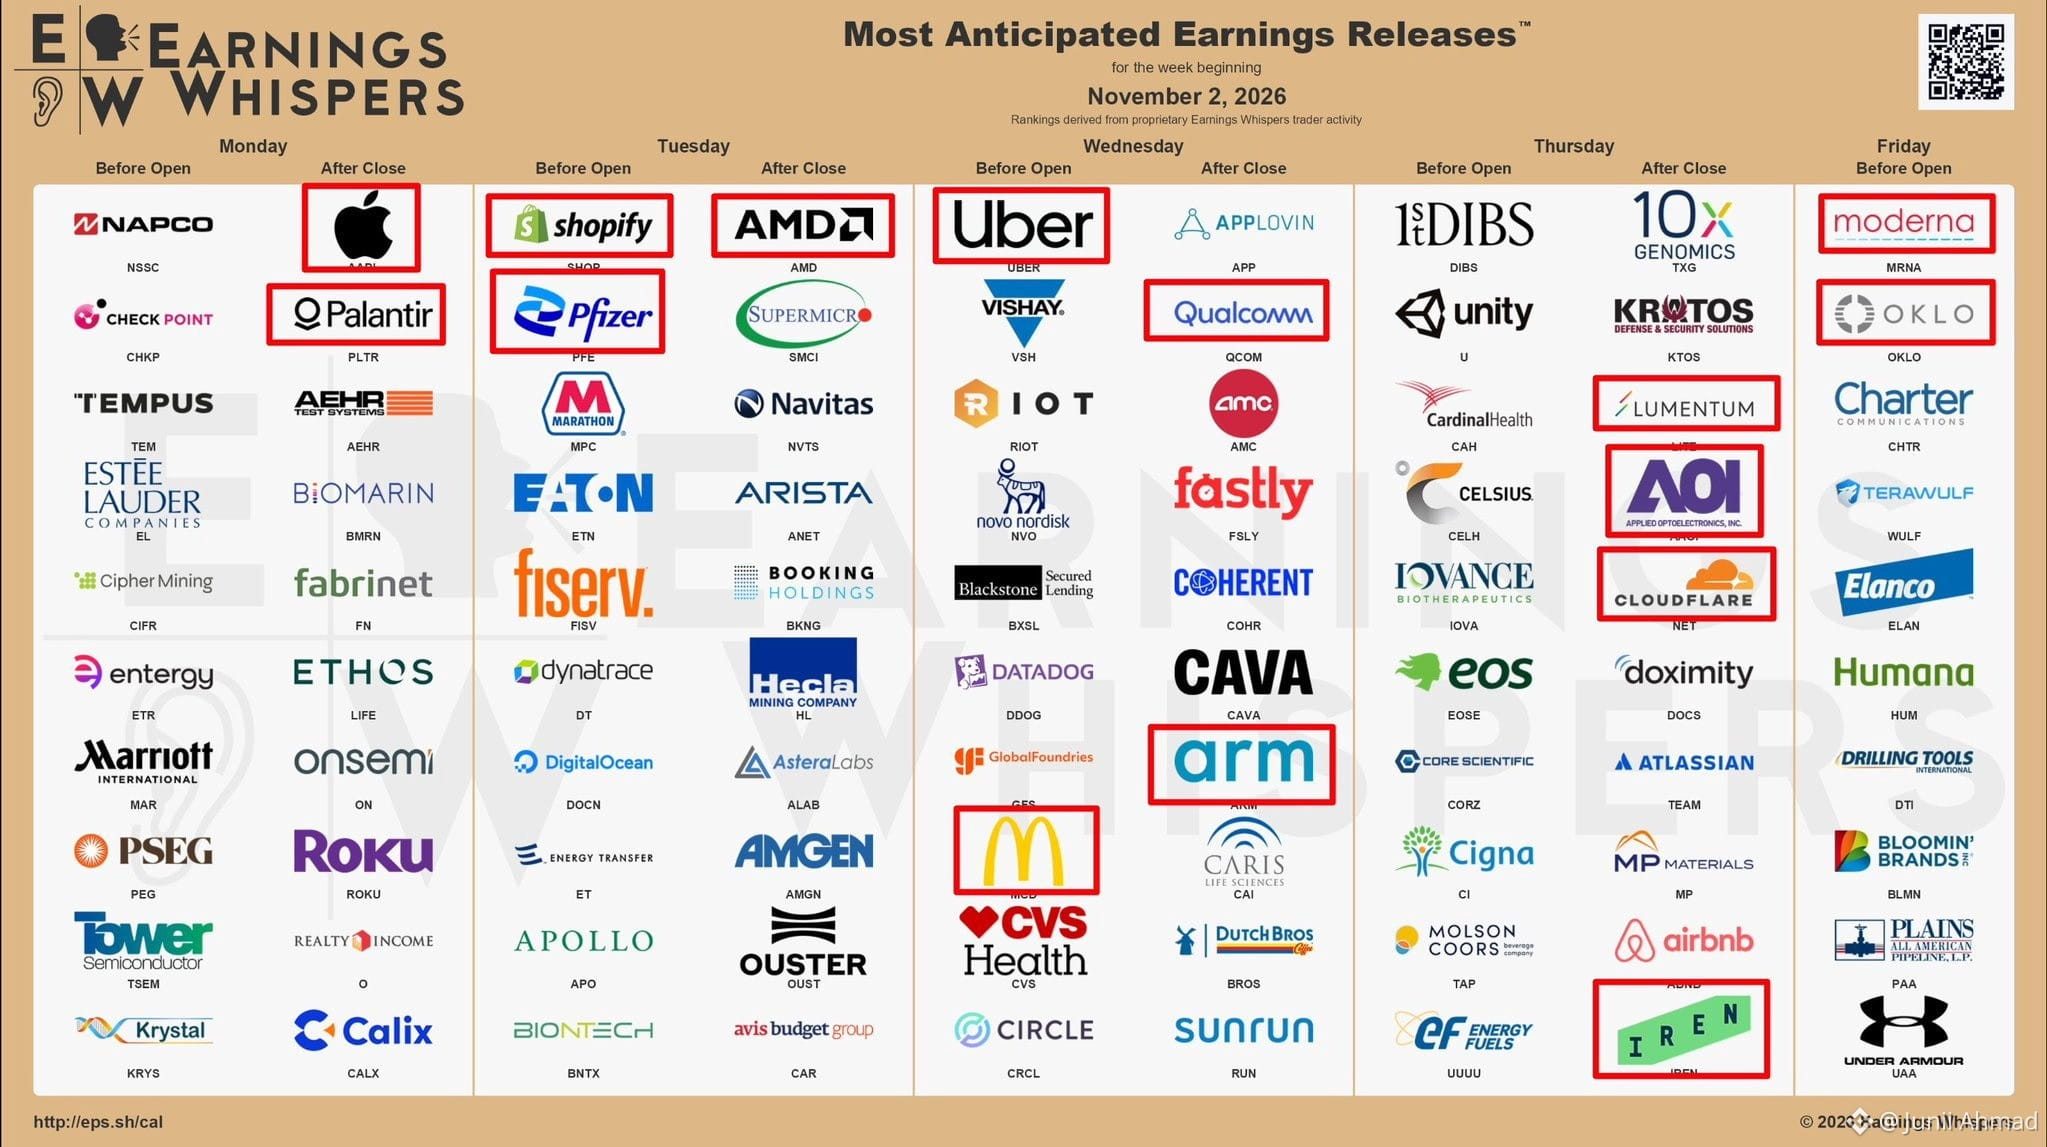
997
·
--

Article
Why Trading Is MathYou're about to discover something the market has been trying to teach you since your first trade: the market doesn't care about your opinion. It doesn't care about your prediction of what's going to happen next quarter. It certainly doesn't care about the story you've constructed about why a particular stock will soar or crash. The market operates on numbers, and if you want to extract profits from it consistently, you need to speak its language. That language is mathematics.
This is the introduction to my book "Trading is Math"
Most traders lose money. Studies consistently show that between 70% and 90% of retail traders lose money. But here's what's interesting: the market itself isn't designed to make you lose. The market is simply a machine that processes information and executes transactions based on supply and demand. The reason most traders fail isn't that the market is rigged. It's because they're playing a math game with emotion, opinion, and narrative as their primary tools.
When you enter a trade based on a "feeling" that a stock is going to rise, what are you actually doing? You're deciding with real money based on something you can't measure, can't replicate, and can't improve upon systematically. You might get lucky several times in a row. But over hundreds or thousands of trades, luck evens out. What remains is your edge, and if you think your edge is based on strong opinions and good predictions rather than mathematical principles, you don't actually have an edge at all.
Consider the trader who buys a stock after reading an article about the company's potential. They purchase at $50. As the price drops to $45, then to $40, they reassure themselves it's temporary and may buy more. When the price reaches $30, they're either selling at a loss or holding on, stuck between their belief and the market's reality.
Now consider a different trader approaching the same stock with a mathematical framework. Before entering, they calculate their position size based on their account equity, determining that they'll risk exactly 1% of their total capital on this trade. They set their entry point at $50 and their stop loss at $47.50, a 5% decline based on the stock's average true range and recent support levels. Their target is $57.50, giving them a 3:1 reward-to-risk ratio. When the stock drops to $47.50, their stop-loss executes automatically. They lose 1% of their capital, exactly as planned, and move on to the next opportunity. Over 100 such trades, even with a 40% win rate, this trader will be profitable because their math ensures that winners are substantially larger than losers by cutting their losses short and letting their winners run. They just have to focus on finding the stocks that can go up three times faster than they go down on average.
This is the fundamental difference between trading as math and trading as storytelling. Math gives you a framework that works regardless of whether any individual trade succeeds. Stories give you hope, but hope isn't a strategy.
Position Sizing: The Foundation of Mathematical Trading
Mathematical trading means defining every aspect of your approach in quantifiable terms and executing those terms with discipline. This starts with position sizing, arguably the most important mathematical concept in trading.
Most novice traders find a stock they like, then invest as much as they feel comfortable with. Maybe it's $1,000, maybe it's $10,000. The amount is based on emotion rather than risk management principles.
Mathematical position sizing works differently. Say you have a $100,000 trading account, and you've determined that you'll risk 1% of your capital—meaning you'll potentially lose $1,000 on any single trade. Position size is the number of shares you buy, calculated based on your risk per trade and the dollar amount you could lose per share. For example, if you buy a stock at $50 with a stop loss at $47.50 (the price you set to exit the trade if the market moves against you), your risk per share is $2.50. To risk $1,000 overall, you divide $1,000 by $2.50, meaning you buy 400 shares. You select this number not because you like the stock, but because it aligns exactly with your mathematically determined risk parameters.
This approach normalizes risk across all your trades. Whether you're trading a $10 stock or a $500 stock, whether your stop loss is tight or wide, you're risking the same percentage of your capital. This means your results become statistically meaningful. You can calculate your expected value, determine whether your strategy has an edge, and systematically improve your approach.
Expected Value: Understanding Your Edge
Expected value, often abbreviated as EV, is a statistical calculation that expresses the average outcome of an action. over time. It is calculated by multiplying each outcome by its probability and summing the results. In trading terms, you calculate it by taking your average winning trade multiplied by your win rate, then subtracting your average losing trade multiplied by your loss rate.
Suppose your trading strategy wins 45% of the time with an average gain of $1,500 per winning trade. It loses 55% of the time with an average loss of $500 per losing trade. Your expected value per trade would be (0.45 × $1,500) - (0.55 × $500) = $675 - $275 = $400. Over 100 trades, you can expect to make approximately $40,000. These numbers should emerge from your previous trading results or, if you are just starting, from backtesting your strategy on historical charts.
This is why traders who understand mathematics don't get emotional about individual trades. They know any single trade is just one sample in a larger statistical distribution. The winning trade they just closed isn't proof they're geniuses. The losing trade isn't evidence they're terrible at trading. Both are simply data points contributing to their overall expected value.
Risk-Reward Ratios: The Key to Profitability
A risk-reward ratio (also called a reward-to-risk ratio) compares the amount you're risking to the amount you’re trying to gain on a trade. For example, if you're risking $500 to potentially make $1,500, you have a 1:3 risk-reward ratio. This number determines the minimum win rate you need to be profitable.
With a 1:3 risk-reward ratio, you can be profitable with a win rate just a little higher than 25%. You can be wrong three times out of four and still make money. If you take four trades, each risking $500, and lose three times while winning once, you lose $1,500 on the losers but gain $1,500 on the winner. You break even. Push your win rate slightly above 25%, and you're profitable even though you're losing more often than winning.
Contrast this with a trader using a 1:1 risk-reward ratio. This trader needs to win over 50% of the time just to break even after accounting for commissions and slippage. That's much harder than needing to be right only 26% of the time. The 1:1 risk-reward ratio also requires keeping all losses very small to be profitable; you can't let any losses get out of control with no big wins to offset them.
Mathematical Trading in Action
Imagine you're looking at a stock that's been consolidating between $30 and $35 for three months. The stock is currently trading at $30.25. A narrative-based trader might see this as a story about a stock "coiling up for a breakout." They might buy based on their beliefs, with no framework for when they're wrong.
A mathematical trader approaches this differently. They observe that $30 has acted as support multiple times. They enter at $30.25, placing their stop loss at $29.50, just below the support level. Their target is $34.50, just before resistance. Their risk is $0.75 per share, and their potential reward is $4.25 per share, a 5.67:1 risk-reward ratio.
With a $100,000 account and a 1% risk rule, they're willing to lose $1,000. Dividing $1,000 by $0.75 gives a position size of 1,333 shares. They set a stop loss, a trailing stop, and a profit target, then enter and wait. The stock either hits the stop loss, the trailing stop, or the profit target. No adjustment for news or emotion—the math set everything. All that remains is the execution.
The Mathematics of Drawdown and Recovery
If you lose 10% of your capital, you need to make 11.1% on your remaining capital to get back to breakeven. If you lose 25%, you need to make 33.3% to recover. If you lose 50%, you need to make 100% to get back to where you started.
These facts show why protecting your capital is crucial. Losing 50% of your account creates a much steeper climb than losing 10%. This is why many successful traders risk only 1-2% of capital per trade.
The Power of Compounding
Compound growth is exponential, not linear. If you consistently generate a 2% return per month, you don’t make 24% in a year—you make about 26.8%, because each month’s gains become part of the base for the next month’s return. Over five years, that same 2% monthly return compounds to roughly 228%. Over ten years, it grows to nearly 1,000%.
A trader who makes 2% every month outperforms one who gains 50% and then loses 30%. Consistent compounding is rewarded; volatility is punished.
Your Path Forward
The market rewards those who respect its mathematical nature. It punishes those who try to outsmart it with opinions and predictions. Every successful professional trader, every quantitative hedge fund, every algorithmic trading system operates on mathematical principles.
This book is your guide to the mathematical foundations of profitable trading. Each chapter will introduce specific formulas, calculations, and ways to apply mathematical thinking to your trading decisions. Some concepts will challenge your existing beliefs. Some will seem counterintuitive. But all are grounded in mathematical truth.
Trading is math. Your opinion about a stock doesn't move its price. Your prediction doesn't change what happens. Your story doesn't make you right. But using the correct math, executed with discipline and consistency, gives you an edge that compounds over time into substantial, sustainable profits.
Executing the Math: Practical Steps for Mathematical Trading
Calculate your maximum risk per trade as a fixed percentage of your total account equity, typically between 0.5% and 2%, and never deviate from this number, regardless of how confident you feel about any trade.
Determine your position size for every trade by dividing your dollar risk amount by your per-share risk, which is the difference between your entry price and your stop-loss price, ensuring consistent risk across all positions.
Establish your stop-loss before entering any trade by identifying a technical level, support or resistance zone, or percentage that represents your maximum acceptable loss, and place this stop-loss order immediately upon entry.
Calculate the risk-reward ratio for every potential trade by dividing your potential profit by your potential loss and only take trades that offer at least a 2:1 ratio or better based on your strategy's requirements.
Track every trade in a spreadsheet or journal, recording your entry price, exit price, position size, profit or loss in dollars, and profit or loss as a percentage so you can calculate your actual win rate and average win/loss over time.
Compute your expected value periodically by multiplying your win rate by your average winner, then subtracting your loss rate multiplied by your average loser, to verify that your trading system has a positive mathematical edge.
Review your maximum drawdown regularly by calculating the largest peak-to-trough decline in your account, and determine the percentage gain required to recover from any losses to understand the asymmetric nature of drawdowns and recoveries.
Apply the compound growth formula to project realistic returns over time, recognizing that consistent monthly returns of 1-2% can create substantial long-term wealth through exponential growth rather than linear addition.
Set profit targets based on mathematical probabilities by measuring the distance to resistance levels, recent price ranges, or average true range multiples rather than arbitrary numbers or emotional price points.
Calculate the minimum win rate required for profitability at your current risk-reward ratio using the formula: Minimum Win Rate = 1 / (1 + Risk-Reward Ratio), so you know exactly how often you need to be right to make money.
We will dive deeply into each of these math principles and more throughout the rest of this book. This introduction was just to set the framework that we will dive into.
You can read the rest of this book by purchasing "Trading is Math" on Amazon worldwide.
#USMidterms-WhatAreMarketsExpecting? #Binance98PercentReplenished #BTCRebounds80K #BinanceReopensWithdrawalsForMoreAssets #ADPUSPrivateEmployersAdd86000JobsInOctober
Why Trading Is Math
You're about to discover something the market has been trying to teach you since your first trade: the market doesn't care about your opinion. It doesn't care about your prediction of what's going to happen next quarter. It certainly doesn't care about the story you've constructed about why a particular stock will soar or crash. The market operates on numbers, and if you want to extract profits from it consistently, you need to speak its language. That language is mathematics.
This is the introduction to my book "Trading is Math"
Most traders lose money. Studies consistently show that between 70% and 90% of retail traders lose money. But here's what's interesting: the market itself isn't designed to make you lose. The market is simply a machine that processes information and executes transactions based on supply and demand. The reason most traders fail isn't that the market is rigged. It's because they're playing a math game with emotion, opinion, and narrative as their primary tools.
When you enter a trade based on a "feeling" that a stock is going to rise, what are you actually doing? You're deciding with real money based on something you can't measure, can't replicate, and can't improve upon systematically. You might get lucky several times in a row. But over hundreds or thousands of trades, luck evens out. What remains is your edge, and if you think your edge is based on strong opinions and good predictions rather than mathematical principles, you don't actually have an edge at all.
Consider the trader who buys a stock after reading an article about the company's potential. They purchase at $50. As the price drops to $45, then to $40, they reassure themselves it's temporary and may buy more. When the price reaches $30, they're either selling at a loss or holding on, stuck between their belief and the market's reality.
Now consider a different trader approaching the same stock with a mathematical framework. Before entering, they calculate their position size based on their account equity, determining that they'll risk exactly 1% of their total capital on this trade. They set their entry point at $50 and their stop loss at $47.50, a 5% decline based on the stock's average true range and recent support levels. Their target is $57.50, giving them a 3:1 reward-to-risk ratio. When the stock drops to $47.50, their stop-loss executes automatically. They lose 1% of their capital, exactly as planned, and move on to the next opportunity. Over 100 such trades, even with a 40% win rate, this trader will be profitable because their math ensures that winners are substantially larger than losers by cutting their losses short and letting their winners run. They just have to focus on finding the stocks that can go up three times faster than they go down on average.
This is the fundamental difference between trading as math and trading as storytelling. Math gives you a framework that works regardless of whether any individual trade succeeds. Stories give you hope, but hope isn't a strategy.
Position Sizing: The Foundation of Mathematical Trading
Mathematical trading means defining every aspect of your approach in quantifiable terms and executing those terms with discipline. This starts with position sizing, arguably the most important mathematical concept in trading.
Most novice traders find a stock they like, then invest as much as they feel comfortable with. Maybe it's $1,000, maybe it's $10,000. The amount is based on emotion rather than risk management principles.
Mathematical position sizing works differently. Say you have a $100,000 trading account, and you've determined that you'll risk 1% of your capital—meaning you'll potentially lose $1,000 on any single trade. Position size is the number of shares you buy, calculated based on your risk per trade and the dollar amount you could lose per share. For example, if you buy a stock at $50 with a stop loss at $47.50 (the price you set to exit the trade if the market moves against you), your risk per share is $2.50. To risk $1,000 overall, you divide $1,000 by $2.50, meaning you buy 400 shares. You select this number not because you like the stock, but because it aligns exactly with your mathematically determined risk parameters.
This approach normalizes risk across all your trades. Whether you're trading a $10 stock or a $500 stock, whether your stop loss is tight or wide, you're risking the same percentage of your capital. This means your results become statistically meaningful. You can calculate your expected value, determine whether your strategy has an edge, and systematically improve your approach.
Expected Value: Understanding Your Edge
Expected value, often abbreviated as EV, is a statistical calculation that expresses the average outcome of an action. over time. It is calculated by multiplying each outcome by its probability and summing the results. In trading terms, you calculate it by taking your average winning trade multiplied by your win rate, then subtracting your average losing trade multiplied by your loss rate.
Suppose your trading strategy wins 45% of the time with an average gain of $1,500 per winning trade. It loses 55% of the time with an average loss of $500 per losing trade. Your expected value per trade would be (0.45 × $1,500) - (0.55 × $500) = $675 - $275 = $400. Over 100 trades, you can expect to make approximately $40,000. These numbers should emerge from your previous trading results or, if you are just starting, from backtesting your strategy on historical charts.
This is why traders who understand mathematics don't get emotional about individual trades. They know any single trade is just one sample in a larger statistical distribution. The winning trade they just closed isn't proof they're geniuses. The losing trade isn't evidence they're terrible at trading. Both are simply data points contributing to their overall expected value.
Risk-Reward Ratios: The Key to Profitability
A risk-reward ratio (also called a reward-to-risk ratio) compares the amount you're risking to the amount you’re trying to gain on a trade. For example, if you're risking $500 to potentially make $1,500, you have a 1:3 risk-reward ratio. This number determines the minimum win rate you need to be profitable.
With a 1:3 risk-reward ratio, you can be profitable with a win rate just a little higher than 25%. You can be wrong three times out of four and still make money. If you take four trades, each risking $500, and lose three times while winning once, you lose $1,500 on the losers but gain $1,500 on the winner. You break even. Push your win rate slightly above 25%, and you're profitable even though you're losing more often than winning.
Contrast this with a trader using a 1:1 risk-reward ratio. This trader needs to win over 50% of the time just to break even after accounting for commissions and slippage. That's much harder than needing to be right only 26% of the time. The 1:1 risk-reward ratio also requires keeping all losses very small to be profitable; you can't let any losses get out of control with no big wins to offset them.
Mathematical Trading in Action
Imagine you're looking at a stock that's been consolidating between $30 and $35 for three months. The stock is currently trading at $30.25. A narrative-based trader might see this as a story about a stock "coiling up for a breakout." They might buy based on their beliefs, with no framework for when they're wrong.
A mathematical trader approaches this differently. They observe that $30 has acted as support multiple times. They enter at $30.25, placing their stop loss at $29.50, just below the support level. Their target is $34.50, just before resistance. Their risk is $0.75 per share, and their potential reward is $4.25 per share, a 5.67:1 risk-reward ratio.
With a $100,000 account and a 1% risk rule, they're willing to lose $1,000. Dividing $1,000 by $0.75 gives a position size of 1,333 shares. They set a stop loss, a trailing stop, and a profit target, then enter and wait. The stock either hits the stop loss, the trailing stop, or the profit target. No adjustment for news or emotion—the math set everything. All that remains is the execution.
The Mathematics of Drawdown and Recovery
If you lose 10% of your capital, you need to make 11.1% on your remaining capital to get back to breakeven. If you lose 25%, you need to make 33.3% to recover. If you lose 50%, you need to make 100% to get back to where you started.
These facts show why protecting your capital is crucial. Losing 50% of your account creates a much steeper climb than losing 10%. This is why many successful traders risk only 1-2% of capital per trade.
The Power of Compounding
Compound growth is exponential, not linear. If you consistently generate a 2% return per month, you don’t make 24% in a year—you make about 26.8%, because each month’s gains become part of the base for the next month’s return. Over five years, that same 2% monthly return compounds to roughly 228%. Over ten years, it grows to nearly 1,000%.
A trader who makes 2% every month outperforms one who gains 50% and then loses 30%. Consistent compounding is rewarded; volatility is punished.
Your Path Forward
The market rewards those who respect its mathematical nature. It punishes those who try to outsmart it with opinions and predictions. Every successful professional trader, every quantitative hedge fund, every algorithmic trading system operates on mathematical principles.
This book is your guide to the mathematical foundations of profitable trading. Each chapter will introduce specific formulas, calculations, and ways to apply mathematical thinking to your trading decisions. Some concepts will challenge your existing beliefs. Some will seem counterintuitive. But all are grounded in mathematical truth.
Trading is math. Your opinion about a stock doesn't move its price. Your prediction doesn't change what happens. Your story doesn't make you right. But using the correct math, executed with discipline and consistency, gives you an edge that compounds over time into substantial, sustainable profits.
Executing the Math: Practical Steps for Mathematical Trading
Calculate your maximum risk per trade as a fixed percentage of your total account equity, typically between 0.5% and 2%, and never deviate from this number, regardless of how confident you feel about any trade.
Determine your position size for every trade by dividing your dollar risk amount by your per-share risk, which is the difference between your entry price and your stop-loss price, ensuring consistent risk across all positions.
Establish your stop-loss before entering any trade by identifying a technical level, support or resistance zone, or percentage that represents your maximum acceptable loss, and place this stop-loss order immediately upon entry.
Calculate the risk-reward ratio for every potential trade by dividing your potential profit by your potential loss and only take trades that offer at least a 2:1 ratio or better based on your strategy's requirements.
Track every trade in a spreadsheet or journal, recording your entry price, exit price, position size, profit or loss in dollars, and profit or loss as a percentage so you can calculate your actual win rate and average win/loss over time.
Compute your expected value periodically by multiplying your win rate by your average winner, then subtracting your loss rate multiplied by your average loser, to verify that your trading system has a positive mathematical edge.
Review your maximum drawdown regularly by calculating the largest peak-to-trough decline in your account, and determine the percentage gain required to recover from any losses to understand the asymmetric nature of drawdowns and recoveries.
Apply the compound growth formula to project realistic returns over time, recognizing that consistent monthly returns of 1-2% can create substantial long-term wealth through exponential growth rather than linear addition.
Set profit targets based on mathematical probabilities by measuring the distance to resistance levels, recent price ranges, or average true range multiples rather than arbitrary numbers or emotional price points.
Calculate the minimum win rate required for profitability at your current risk-reward ratio using the formula: Minimum Win Rate = 1 / (1 + Risk-Reward Ratio), so you know exactly how often you need to be right to make money.
We will dive deeply into each of these math principles and more throughout the rest of this book. This introduction was just to set the framework that we will dive into.
You can read the rest of this book by purchasing "Trading is Math" on Amazon worldwide.
#USMidterms-WhatAreMarketsExpecting? #Binance98PercentReplenished #BTCRebounds80K #BinanceReopensWithdrawalsForMoreAssets #ADPUSPrivateEmployersAdd86000JobsInOctober
This is the introduction to my book "Trading is Math"
Most traders lose money. Studies consistently show that between 70% and 90% of retail traders lose money. But here's what's interesting: the market itself isn't designed to make you lose. The market is simply a machine that processes information and executes transactions based on supply and demand. The reason most traders fail isn't that the market is rigged. It's because they're playing a math game with emotion, opinion, and narrative as their primary tools.
When you enter a trade based on a "feeling" that a stock is going to rise, what are you actually doing? You're deciding with real money based on something you can't measure, can't replicate, and can't improve upon systematically. You might get lucky several times in a row. But over hundreds or thousands of trades, luck evens out. What remains is your edge, and if you think your edge is based on strong opinions and good predictions rather than mathematical principles, you don't actually have an edge at all.
Consider the trader who buys a stock after reading an article about the company's potential. They purchase at $50. As the price drops to $45, then to $40, they reassure themselves it's temporary and may buy more. When the price reaches $30, they're either selling at a loss or holding on, stuck between their belief and the market's reality.
Now consider a different trader approaching the same stock with a mathematical framework. Before entering, they calculate their position size based on their account equity, determining that they'll risk exactly 1% of their total capital on this trade. They set their entry point at $50 and their stop loss at $47.50, a 5% decline based on the stock's average true range and recent support levels. Their target is $57.50, giving them a 3:1 reward-to-risk ratio. When the stock drops to $47.50, their stop-loss executes automatically. They lose 1% of their capital, exactly as planned, and move on to the next opportunity. Over 100 such trades, even with a 40% win rate, this trader will be profitable because their math ensures that winners are substantially larger than losers by cutting their losses short and letting their winners run. They just have to focus on finding the stocks that can go up three times faster than they go down on average.
This is the fundamental difference between trading as math and trading as storytelling. Math gives you a framework that works regardless of whether any individual trade succeeds. Stories give you hope, but hope isn't a strategy.
Position Sizing: The Foundation of Mathematical Trading
Mathematical trading means defining every aspect of your approach in quantifiable terms and executing those terms with discipline. This starts with position sizing, arguably the most important mathematical concept in trading.
Most novice traders find a stock they like, then invest as much as they feel comfortable with. Maybe it's $1,000, maybe it's $10,000. The amount is based on emotion rather than risk management principles.
Mathematical position sizing works differently. Say you have a $100,000 trading account, and you've determined that you'll risk 1% of your capital—meaning you'll potentially lose $1,000 on any single trade. Position size is the number of shares you buy, calculated based on your risk per trade and the dollar amount you could lose per share. For example, if you buy a stock at $50 with a stop loss at $47.50 (the price you set to exit the trade if the market moves against you), your risk per share is $2.50. To risk $1,000 overall, you divide $1,000 by $2.50, meaning you buy 400 shares. You select this number not because you like the stock, but because it aligns exactly with your mathematically determined risk parameters.
This approach normalizes risk across all your trades. Whether you're trading a $10 stock or a $500 stock, whether your stop loss is tight or wide, you're risking the same percentage of your capital. This means your results become statistically meaningful. You can calculate your expected value, determine whether your strategy has an edge, and systematically improve your approach.
Expected Value: Understanding Your Edge
Expected value, often abbreviated as EV, is a statistical calculation that expresses the average outcome of an action. over time. It is calculated by multiplying each outcome by its probability and summing the results. In trading terms, you calculate it by taking your average winning trade multiplied by your win rate, then subtracting your average losing trade multiplied by your loss rate.
Suppose your trading strategy wins 45% of the time with an average gain of $1,500 per winning trade. It loses 55% of the time with an average loss of $500 per losing trade. Your expected value per trade would be (0.45 × $1,500) - (0.55 × $500) = $675 - $275 = $400. Over 100 trades, you can expect to make approximately $40,000. These numbers should emerge from your previous trading results or, if you are just starting, from backtesting your strategy on historical charts.
This is why traders who understand mathematics don't get emotional about individual trades. They know any single trade is just one sample in a larger statistical distribution. The winning trade they just closed isn't proof they're geniuses. The losing trade isn't evidence they're terrible at trading. Both are simply data points contributing to their overall expected value.
Risk-Reward Ratios: The Key to Profitability
A risk-reward ratio (also called a reward-to-risk ratio) compares the amount you're risking to the amount you’re trying to gain on a trade. For example, if you're risking $500 to potentially make $1,500, you have a 1:3 risk-reward ratio. This number determines the minimum win rate you need to be profitable.
With a 1:3 risk-reward ratio, you can be profitable with a win rate just a little higher than 25%. You can be wrong three times out of four and still make money. If you take four trades, each risking $500, and lose three times while winning once, you lose $1,500 on the losers but gain $1,500 on the winner. You break even. Push your win rate slightly above 25%, and you're profitable even though you're losing more often than winning.
Contrast this with a trader using a 1:1 risk-reward ratio. This trader needs to win over 50% of the time just to break even after accounting for commissions and slippage. That's much harder than needing to be right only 26% of the time. The 1:1 risk-reward ratio also requires keeping all losses very small to be profitable; you can't let any losses get out of control with no big wins to offset them.
Mathematical Trading in Action
Imagine you're looking at a stock that's been consolidating between $30 and $35 for three months. The stock is currently trading at $30.25. A narrative-based trader might see this as a story about a stock "coiling up for a breakout." They might buy based on their beliefs, with no framework for when they're wrong.
A mathematical trader approaches this differently. They observe that $30 has acted as support multiple times. They enter at $30.25, placing their stop loss at $29.50, just below the support level. Their target is $34.50, just before resistance. Their risk is $0.75 per share, and their potential reward is $4.25 per share, a 5.67:1 risk-reward ratio.
With a $100,000 account and a 1% risk rule, they're willing to lose $1,000. Dividing $1,000 by $0.75 gives a position size of 1,333 shares. They set a stop loss, a trailing stop, and a profit target, then enter and wait. The stock either hits the stop loss, the trailing stop, or the profit target. No adjustment for news or emotion—the math set everything. All that remains is the execution.
The Mathematics of Drawdown and Recovery
If you lose 10% of your capital, you need to make 11.1% on your remaining capital to get back to breakeven. If you lose 25%, you need to make 33.3% to recover. If you lose 50%, you need to make 100% to get back to where you started.
These facts show why protecting your capital is crucial. Losing 50% of your account creates a much steeper climb than losing 10%. This is why many successful traders risk only 1-2% of capital per trade.
The Power of Compounding
Compound growth is exponential, not linear. If you consistently generate a 2% return per month, you don’t make 24% in a year—you make about 26.8%, because each month’s gains become part of the base for the next month’s return. Over five years, that same 2% monthly return compounds to roughly 228%. Over ten years, it grows to nearly 1,000%.
A trader who makes 2% every month outperforms one who gains 50% and then loses 30%. Consistent compounding is rewarded; volatility is punished.
Your Path Forward
The market rewards those who respect its mathematical nature. It punishes those who try to outsmart it with opinions and predictions. Every successful professional trader, every quantitative hedge fund, every algorithmic trading system operates on mathematical principles.
This book is your guide to the mathematical foundations of profitable trading. Each chapter will introduce specific formulas, calculations, and ways to apply mathematical thinking to your trading decisions. Some concepts will challenge your existing beliefs. Some will seem counterintuitive. But all are grounded in mathematical truth.
Trading is math. Your opinion about a stock doesn't move its price. Your prediction doesn't change what happens. Your story doesn't make you right. But using the correct math, executed with discipline and consistency, gives you an edge that compounds over time into substantial, sustainable profits.
Executing the Math: Practical Steps for Mathematical Trading
Calculate your maximum risk per trade as a fixed percentage of your total account equity, typically between 0.5% and 2%, and never deviate from this number, regardless of how confident you feel about any trade.
Determine your position size for every trade by dividing your dollar risk amount by your per-share risk, which is the difference between your entry price and your stop-loss price, ensuring consistent risk across all positions.
Establish your stop-loss before entering any trade by identifying a technical level, support or resistance zone, or percentage that represents your maximum acceptable loss, and place this stop-loss order immediately upon entry.
Calculate the risk-reward ratio for every potential trade by dividing your potential profit by your potential loss and only take trades that offer at least a 2:1 ratio or better based on your strategy's requirements.
Track every trade in a spreadsheet or journal, recording your entry price, exit price, position size, profit or loss in dollars, and profit or loss as a percentage so you can calculate your actual win rate and average win/loss over time.
Compute your expected value periodically by multiplying your win rate by your average winner, then subtracting your loss rate multiplied by your average loser, to verify that your trading system has a positive mathematical edge.
Review your maximum drawdown regularly by calculating the largest peak-to-trough decline in your account, and determine the percentage gain required to recover from any losses to understand the asymmetric nature of drawdowns and recoveries.
Apply the compound growth formula to project realistic returns over time, recognizing that consistent monthly returns of 1-2% can create substantial long-term wealth through exponential growth rather than linear addition.
Set profit targets based on mathematical probabilities by measuring the distance to resistance levels, recent price ranges, or average true range multiples rather than arbitrary numbers or emotional price points.
Calculate the minimum win rate required for profitability at your current risk-reward ratio using the formula: Minimum Win Rate = 1 / (1 + Risk-Reward Ratio), so you know exactly how often you need to be right to make money.
We will dive deeply into each of these math principles and more throughout the rest of this book. This introduction was just to set the framework that we will dive into.
You can read the rest of this book by purchasing "Trading is Math" on Amazon worldwide.
#USMidterms-WhatAreMarketsExpecting? #Binance98PercentReplenished #BTCRebounds80K #BinanceReopensWithdrawalsForMoreAssets #ADPUSPrivateEmployersAdd86000JobsInOctober
67
·
--

Article
How Your Brain Is Wired to Make Trading MistakesLearn how cognitive biases quietly influence your decisions and how to reduce their impact
Cognitive Psychology: The human brain developed for survival, not for making probability-based decisions.
Here is Chapter 12 from my book: How to Trade Like a Scientist: Use the Principles of Science to Build, Test, and Continuously Improve a Profitable Trading System.
The human brain developed to survive uncertainty, not to manage probability. For hundreds of thousands of years, staying alive meant making fast decisions with limited information. The brain learned to spot danger quickly, remember painful experiences vividly, and stick close to the safety of the group. Those instincts kept people alive on the savanna. Financial markets reward almost the opposite set of behaviors.
Successful trading calls for patience rather than urgency, accepting small losses rather than avoiding them, independent thinking rather than following the crowd, and decisions built on probabilities rather than raw instinct. That mismatch between the wiring people carry and the behavior markets actually reward is the subject of this chapter. The mental shortcuts responsible for it are well-documented and, more usefully, predictable. Once a trader can name a bias, they can build a specific defense against it rather than fighting a vague feeling of being pulled off course.
Anchoring Keeps You Focused on the Wrong Number
The brain naturally latches onto the first piece of information it receives and continues to treat it as important, even after it has stopped being useful. Psychologists call this anchoring.
In trading, the anchor is often your purchase price, a recent high or low, or a price you believe an asset should reach. Those numbers may feel important, but they have no influence on what the market does next. The market only trades at the current price. The market does not care what your entry price was.
Imagine you buy a stock at $50, and it falls to $45. Many traders become emotionally attached to the original purchase price and refuse to sell because they want to "get back to even." But the market doesn't know you paid $50. From today's price of $45, the only question that matters is whether you would buy the stock today based on your trading system.
If the answer is yes, it remains in a buy zone; continue holding it. If the answer is no, your original purchase price shouldn't prevent you from selling and cutting your loss after your entry signal has been proven wrong. The $50 price is part of history. It doesn't change the probability of what the stock is likely to do next. Your trading plan likely told you to cut your loss before you got to this point.
The lesson is simple: don't decide based on where you entered the trade. Decide based on where the market is now and what your trading plan tells you to do next.
Why Losses Hurt More Than Gains Feel Good
Psychologists Daniel Kahneman and Amos Tversky discovered that people feel the pain of a loss much more strongly than the pleasure of an equal gain. Losing $100 usually feels worse than gaining $100 feels good.
This made sense throughout human history. Losing food, shelter, or protection could threaten survival, so our brains evolved to avoid losses. In trading, however, this instinct often works against us.
Many traders hold losing positions too long because taking the loss feels painful. They sell winning positions too quickly because they don't want to risk giving back a profit. Both habits reduce long-term performance. Both are based on loss aversion, trying to avoid the pain of feeling a loss.
Imagine your trading plan calls for risking $100 to make $200. If you consistently let your losses grow to $200 while still taking profits at $200, your reward-to-risk ratio changes from 2-to-1 to 1-to-1. Even if your win rate stays exactly the same, your trading edge becomes much smaller.
The market doesn't care how you feel about a loss. It only rewards disciplined execution. The lesson is simple: don't let the fear of taking a loss or the desire to protect a small gain override your trading plan. A small, planned loss is often the price of achieving much larger gains over the long run. Much of your success as a trader will come down to your skill of keeping losses small and accepting them fast.
Recent Results Feel More Important Than They Are
The human brain naturally gives more importance to recent events than to older ones. Psychologists call this recency bias. After several winning trades, it's easy to feel you've figured out the market. After several losing trades, it's just as easy to believe your trading strategy has stopped working. Neither conclusion is correct.
Imagine you've followed the same trading strategy for 200 trades. The last five trades represent only 2.5 percent of everything you've learned about that strategy. Yet those five trades are often the ones you remember most clearly, making them seem much more important than they really are.
The larger sample tells the real story. A handful of recent trades rarely provides enough evidence to conclude that a trading strategy has changed. Winning and losing streaks are a normal part of trading.
The lesson is simple: don't let your last few trades outweigh the evidence from your entire trading history. Judge your strategy over a large sample of trades, not by the emotions created by your most recent results.
Memorable Events Distort Your Judgment
The brain remembers dramatic events much better than ordinary ones. A market crash, a spectacular bull market rally, or a major news event stays in your memory because it was unusual and emotional. As a result, those events often feel more likely to happen again than they really are. Psychologists call this the availability bias.
For example, after living through a major market crash, many investors expect another crash even when the market is behaving normally. Likewise, after a powerful bull market, it becomes easy to believe prices will continue rising indefinitely.
The problem is that memorable events are not always the most common events. Markets spend most of their time making relatively ordinary moves, but our brains naturally focus on the exceptions rather than the rule. Before making an important trading decision, ask yourself whether you are reacting to current market conditions or simply recalling a dramatic past event.
The lesson is simple: don't mistake what is easiest to remember for what is most likely to happen. Base your decisions on evidence, not on the events that stand out most in your memory. Over the long term, the stock market will most of the time exhibit normal price action and revert to its historical average. Don't get stuck mentally on the fear of market crashes or on nonstop parabolic bull markets, as neither is normal.
Success Can Create Overconfidence
A winning streak can lead traders to believe they are more skilled than they really are. This false confidence often leads to taking bigger risks, becoming less selective, and paying less attention to the rules that created the success.
Imagine a trader who normally risks 1 percent of their account on each trade. After several wins in a row, they become confident and increase their risk to 3 percent per trade. Nothing about the trading strategy has changed. The only change is the trader's confidence.
If the next few trades are losses, those losses are now three times as large as they would have been under the original position-sizing parameters. A small losing streak that would have been easy to recover from can quickly become a much larger setback. Winning streaks do not prove that a trading strategy has become better. They are a normal part of any profitable system.
The lesson is simple: success is not a reason to abandon discipline. Continue following the same position-sizing and risk-management rules that produced the winning streak.
Looking Back Makes the Future Seem Obvious
After a market move has already happened, it often feels like it was easy to predict. Psychologists call this hindsight bias. Once we know the outcome, our brains quietly rewrite the past, making us believe the warning signs were obvious all along. In reality, they usually weren't.
Imagine reviewing a trade that ended in a loss. Looking back, you may think, "I should have known this would happen." But before the trade, you didn't have the benefit of knowing the outcome. You only had the information available at that moment, and the future was still uncertain.
The same thing happens after successful trades. A winning trade can make you believe the opportunity was obvious and you should have increased your position sizing, even though it may have looked far less certain before you entered.
The lesson is simple: judge your decisions based on the information you had at the time, not on what became obvious afterward. Good traders don't expect to predict the future perfectly. They focus on making the best possible decision with the information available. Hindsight can be a parasite on a trader's mind, making you second-guess yourself through the illusion of present knowledge. If you followed your trading signals in real time, you did the right thing under the uncertainty of that moment.
Don't Let the Past Control Today's Decisions
One of the strongest biases in human psychology is the sunk-cost fallacy. It is our tendency to continue investing in something simply because we have already invested so much time, research, effort, or money in it.
This instinct is easy to understand. Nobody enjoys admitting that their time, effort, or money has been wasted. Once we commit to a decision, our brains naturally want to justify that commitment. Walking away feels like accepting failure, even when it is clearly the better choice. The problem is that the market doesn't care how much you've already invested or lost.
Imagine buying a stock at $60 and watching it fall to $50. At that point, the $10 loss has already happened. Holding the position can't erase it, and neither can buying more shares. Yet many traders continue holding because selling would force them to admit the original decision didn't work out. Others invest even more money because they feel they have "too much invested to quit now." Both reactions are driven by the past instead of the future.
The money already invested is gone, whether you hold, sell, or buy more. It has become a sunk cost. The only question that matters now is which decision gives you the best chance of success from now on.
This bias appears everywhere in life. People stay in failing businesses because they've already invested years building them. They remain in unhappy relationships because they've spent too much time to leave. They finish books they no longer enjoy simply because they're halfway through. In every case, past investments influence decisions that should depend only on future benefits and future costs.
The lesson is simple: yesterday's investment or trade is history. Today's decision should be based only on what gives you the best outcome from this point forward, regardless of how much time, effort, or money you've already committed.
The Way Information Is Presented Changes Decisions
People often make different decisions based on how the same information is presented, even when the facts are identical. Psychologists call this the framing effect.
For example, imagine two trading strategies.
The first is described as winning 70 percent of its trades.The second is described as losing 30 percent of its trades.
Most people naturally prefer the first description, even though both strategies are identical. The wording changed. The facts did not.
The same thing happens in the financial markets. Headlines, analyst reports, and market commentary often present information in ways that create excitement or fear without changing the underlying facts. Successful traders learn to look past the presentation and focus on the information itself. Before reacting to any new information, ask yourself whether the facts have actually changed or only the way they were presented.
The lesson is simple: don't let the presentation of information influence your decisions more than the information itself.
Too Much Information Can Lead to Worse Decisions
Many people believe that having more information automatically leads to better decisions. In reality, the brain can only process a limited amount of information at one time. As more information competes for your attention, it becomes harder to identify what actually matters.
Imagine trying to decide whether to buy a stock. One indicator suggests buying. Another suggests waiting. A third signals selling. Meanwhile, financial news, social media, television commentators, and online forums all offer different opinions. Instead of making decisions easier, the extra information often creates confusion. This is known as cognitive overload.
When the brain becomes overloaded, people often hesitate, second-guess themselves, or focus on whatever information confirms what they already wanted to do. Successful traders avoid this trap by simplifying their decision-making process. They identify the information that consistently helps them make better decisions and ignore everything else.
The lesson is simple: more information does not always produce better decisions. Often, a smaller amount of relevant information leads to clearer thinking and more consistent execution. Your job as a trader is to create a trading system that filters out the complexity and makes trading profitably simpler by focusing on what signals matter the most to you in your own timeframe.
Why These Biases Matter
Every trader experiences these cognitive biases because they are part of normal human psychology. They aren't signs of a lack of intelligence, experience, or discipline. They are shortcuts the brain developed to help our ancestors survive in an uncertain world.
The problem is that what helped people survive thousands of years ago doesn't always help them make good decisions in today's financial markets. Our instincts often encourage us to avoid losses, follow the crowd, remember dramatic events, and rely on recent experiences. Successful trading often requires doing the opposite.
The goal isn't to eliminate these biases completely. That's impossible. The goal is to recognize when they are influencing your thinking before they influence your decisions.
The more aware you become of these mental shortcuts, the less control they have over your trading. Every time you ask, "Am I reacting to the facts or to one of my biases?" You give yourself the opportunity to make a more objective decision.
Trading like a scientist means studying more than the markets. It also means understanding the strengths and weaknesses of your mind when making trading decisions. The better you understand both, the more consistently you can make rational decisions in an uncertain market.
Build Defenses Against Your Own Cognitive Biases
Base every trading decision on the current evidence, not on the price at which you entered the trade.Don't let the fear of taking a loss or the excitement of making a profit cause you to ignore your trading plan.Judge your trading strategy over a large sample of trades instead of reacting to recent wins or losses.Before acting on a strong feeling about the market, ask whether it is supported by evidence or simply influenced by a memorable past event.Stay disciplined after winning streaks. Success is not a reason to increase risk or abandon good trading rules.Evaluate your decisions based on the information available at the time, not on what became obvious after the outcome was known.Don't let money, research, time, or effort already invested influence your next decision. Focus only on what gives you the best opportunity in the future.Look beyond headlines and opinions by focusing on the facts rather than the way information is presented.Keep your trading process simple. Too much information can make good decisions harder, not easier.Recognize when cognitive biases are influencing your thinking, and rely on your tested trading process rather than your instincts.
You can pick up a copy of How to Trade Like a Scientist: Use the Principles of Science to Build, Test, and Continuously Improve a Profitable Trading System on Amazon worldwide if you want to read the rest of this book.
#BinanceReopensWithdrawalsForMoreAssets #BTCRebounds80K #Binance98PercentReplenished #USMidterms-WhatAreMarketsExpecting? #ADPUSPrivateEmployersAdd86000JobsInOctober
How Your Brain Is Wired to Make Trading Mistakes
Learn how cognitive biases quietly influence your decisions and how to reduce their impact
Cognitive Psychology: The human brain developed for survival, not for making probability-based decisions.
Here is Chapter 12 from my book: How to Trade Like a Scientist: Use the Principles of Science to Build, Test, and Continuously Improve a Profitable Trading System.
The human brain developed to survive uncertainty, not to manage probability. For hundreds of thousands of years, staying alive meant making fast decisions with limited information. The brain learned to spot danger quickly, remember painful experiences vividly, and stick close to the safety of the group. Those instincts kept people alive on the savanna. Financial markets reward almost the opposite set of behaviors.
Successful trading calls for patience rather than urgency, accepting small losses rather than avoiding them, independent thinking rather than following the crowd, and decisions built on probabilities rather than raw instinct. That mismatch between the wiring people carry and the behavior markets actually reward is the subject of this chapter. The mental shortcuts responsible for it are well-documented and, more usefully, predictable. Once a trader can name a bias, they can build a specific defense against it rather than fighting a vague feeling of being pulled off course.
Anchoring Keeps You Focused on the Wrong Number
The brain naturally latches onto the first piece of information it receives and continues to treat it as important, even after it has stopped being useful. Psychologists call this anchoring.
In trading, the anchor is often your purchase price, a recent high or low, or a price you believe an asset should reach. Those numbers may feel important, but they have no influence on what the market does next. The market only trades at the current price. The market does not care what your entry price was.
Imagine you buy a stock at $50, and it falls to $45. Many traders become emotionally attached to the original purchase price and refuse to sell because they want to "get back to even." But the market doesn't know you paid $50. From today's price of $45, the only question that matters is whether you would buy the stock today based on your trading system.
If the answer is yes, it remains in a buy zone; continue holding it. If the answer is no, your original purchase price shouldn't prevent you from selling and cutting your loss after your entry signal has been proven wrong. The $50 price is part of history. It doesn't change the probability of what the stock is likely to do next. Your trading plan likely told you to cut your loss before you got to this point.
The lesson is simple: don't decide based on where you entered the trade. Decide based on where the market is now and what your trading plan tells you to do next.
Why Losses Hurt More Than Gains Feel Good
Psychologists Daniel Kahneman and Amos Tversky discovered that people feel the pain of a loss much more strongly than the pleasure of an equal gain. Losing $100 usually feels worse than gaining $100 feels good.
This made sense throughout human history. Losing food, shelter, or protection could threaten survival, so our brains evolved to avoid losses. In trading, however, this instinct often works against us.
Many traders hold losing positions too long because taking the loss feels painful. They sell winning positions too quickly because they don't want to risk giving back a profit. Both habits reduce long-term performance. Both are based on loss aversion, trying to avoid the pain of feeling a loss.
Imagine your trading plan calls for risking $100 to make $200. If you consistently let your losses grow to $200 while still taking profits at $200, your reward-to-risk ratio changes from 2-to-1 to 1-to-1. Even if your win rate stays exactly the same, your trading edge becomes much smaller.
The market doesn't care how you feel about a loss. It only rewards disciplined execution. The lesson is simple: don't let the fear of taking a loss or the desire to protect a small gain override your trading plan. A small, planned loss is often the price of achieving much larger gains over the long run. Much of your success as a trader will come down to your skill of keeping losses small and accepting them fast.
Recent Results Feel More Important Than They Are
The human brain naturally gives more importance to recent events than to older ones. Psychologists call this recency bias. After several winning trades, it's easy to feel you've figured out the market. After several losing trades, it's just as easy to believe your trading strategy has stopped working. Neither conclusion is correct.
Imagine you've followed the same trading strategy for 200 trades. The last five trades represent only 2.5 percent of everything you've learned about that strategy. Yet those five trades are often the ones you remember most clearly, making them seem much more important than they really are.
The larger sample tells the real story. A handful of recent trades rarely provides enough evidence to conclude that a trading strategy has changed. Winning and losing streaks are a normal part of trading.
The lesson is simple: don't let your last few trades outweigh the evidence from your entire trading history. Judge your strategy over a large sample of trades, not by the emotions created by your most recent results.
Memorable Events Distort Your Judgment
The brain remembers dramatic events much better than ordinary ones. A market crash, a spectacular bull market rally, or a major news event stays in your memory because it was unusual and emotional. As a result, those events often feel more likely to happen again than they really are. Psychologists call this the availability bias.
For example, after living through a major market crash, many investors expect another crash even when the market is behaving normally. Likewise, after a powerful bull market, it becomes easy to believe prices will continue rising indefinitely.
The problem is that memorable events are not always the most common events. Markets spend most of their time making relatively ordinary moves, but our brains naturally focus on the exceptions rather than the rule. Before making an important trading decision, ask yourself whether you are reacting to current market conditions or simply recalling a dramatic past event.
The lesson is simple: don't mistake what is easiest to remember for what is most likely to happen. Base your decisions on evidence, not on the events that stand out most in your memory. Over the long term, the stock market will most of the time exhibit normal price action and revert to its historical average. Don't get stuck mentally on the fear of market crashes or on nonstop parabolic bull markets, as neither is normal.
Success Can Create Overconfidence
A winning streak can lead traders to believe they are more skilled than they really are. This false confidence often leads to taking bigger risks, becoming less selective, and paying less attention to the rules that created the success.
Imagine a trader who normally risks 1 percent of their account on each trade. After several wins in a row, they become confident and increase their risk to 3 percent per trade. Nothing about the trading strategy has changed. The only change is the trader's confidence.
If the next few trades are losses, those losses are now three times as large as they would have been under the original position-sizing parameters. A small losing streak that would have been easy to recover from can quickly become a much larger setback. Winning streaks do not prove that a trading strategy has become better. They are a normal part of any profitable system.
The lesson is simple: success is not a reason to abandon discipline. Continue following the same position-sizing and risk-management rules that produced the winning streak.
Looking Back Makes the Future Seem Obvious
After a market move has already happened, it often feels like it was easy to predict. Psychologists call this hindsight bias. Once we know the outcome, our brains quietly rewrite the past, making us believe the warning signs were obvious all along. In reality, they usually weren't.
Imagine reviewing a trade that ended in a loss. Looking back, you may think, "I should have known this would happen." But before the trade, you didn't have the benefit of knowing the outcome. You only had the information available at that moment, and the future was still uncertain.
The same thing happens after successful trades. A winning trade can make you believe the opportunity was obvious and you should have increased your position sizing, even though it may have looked far less certain before you entered.
The lesson is simple: judge your decisions based on the information you had at the time, not on what became obvious afterward. Good traders don't expect to predict the future perfectly. They focus on making the best possible decision with the information available. Hindsight can be a parasite on a trader's mind, making you second-guess yourself through the illusion of present knowledge. If you followed your trading signals in real time, you did the right thing under the uncertainty of that moment.
Don't Let the Past Control Today's Decisions
One of the strongest biases in human psychology is the sunk-cost fallacy. It is our tendency to continue investing in something simply because we have already invested so much time, research, effort, or money in it.
This instinct is easy to understand. Nobody enjoys admitting that their time, effort, or money has been wasted. Once we commit to a decision, our brains naturally want to justify that commitment. Walking away feels like accepting failure, even when it is clearly the better choice. The problem is that the market doesn't care how much you've already invested or lost.
Imagine buying a stock at $60 and watching it fall to $50. At that point, the $10 loss has already happened. Holding the position can't erase it, and neither can buying more shares. Yet many traders continue holding because selling would force them to admit the original decision didn't work out. Others invest even more money because they feel they have "too much invested to quit now." Both reactions are driven by the past instead of the future.
The money already invested is gone, whether you hold, sell, or buy more. It has become a sunk cost. The only question that matters now is which decision gives you the best chance of success from now on.
This bias appears everywhere in life. People stay in failing businesses because they've already invested years building them. They remain in unhappy relationships because they've spent too much time to leave. They finish books they no longer enjoy simply because they're halfway through. In every case, past investments influence decisions that should depend only on future benefits and future costs.
The lesson is simple: yesterday's investment or trade is history. Today's decision should be based only on what gives you the best outcome from this point forward, regardless of how much time, effort, or money you've already committed.
The Way Information Is Presented Changes Decisions
People often make different decisions based on how the same information is presented, even when the facts are identical. Psychologists call this the framing effect.
For example, imagine two trading strategies.
The first is described as winning 70 percent of its trades.The second is described as losing 30 percent of its trades.
Most people naturally prefer the first description, even though both strategies are identical. The wording changed. The facts did not.
The same thing happens in the financial markets. Headlines, analyst reports, and market commentary often present information in ways that create excitement or fear without changing the underlying facts. Successful traders learn to look past the presentation and focus on the information itself. Before reacting to any new information, ask yourself whether the facts have actually changed or only the way they were presented.
The lesson is simple: don't let the presentation of information influence your decisions more than the information itself.
Too Much Information Can Lead to Worse Decisions
Many people believe that having more information automatically leads to better decisions. In reality, the brain can only process a limited amount of information at one time. As more information competes for your attention, it becomes harder to identify what actually matters.
Imagine trying to decide whether to buy a stock. One indicator suggests buying. Another suggests waiting. A third signals selling. Meanwhile, financial news, social media, television commentators, and online forums all offer different opinions. Instead of making decisions easier, the extra information often creates confusion. This is known as cognitive overload.
When the brain becomes overloaded, people often hesitate, second-guess themselves, or focus on whatever information confirms what they already wanted to do. Successful traders avoid this trap by simplifying their decision-making process. They identify the information that consistently helps them make better decisions and ignore everything else.
The lesson is simple: more information does not always produce better decisions. Often, a smaller amount of relevant information leads to clearer thinking and more consistent execution. Your job as a trader is to create a trading system that filters out the complexity and makes trading profitably simpler by focusing on what signals matter the most to you in your own timeframe.
Why These Biases Matter
Every trader experiences these cognitive biases because they are part of normal human psychology. They aren't signs of a lack of intelligence, experience, or discipline. They are shortcuts the brain developed to help our ancestors survive in an uncertain world.
The problem is that what helped people survive thousands of years ago doesn't always help them make good decisions in today's financial markets. Our instincts often encourage us to avoid losses, follow the crowd, remember dramatic events, and rely on recent experiences. Successful trading often requires doing the opposite.
The goal isn't to eliminate these biases completely. That's impossible. The goal is to recognize when they are influencing your thinking before they influence your decisions.
The more aware you become of these mental shortcuts, the less control they have over your trading. Every time you ask, "Am I reacting to the facts or to one of my biases?" You give yourself the opportunity to make a more objective decision.
Trading like a scientist means studying more than the markets. It also means understanding the strengths and weaknesses of your mind when making trading decisions. The better you understand both, the more consistently you can make rational decisions in an uncertain market.
Build Defenses Against Your Own Cognitive Biases
Base every trading decision on the current evidence, not on the price at which you entered the trade.Don't let the fear of taking a loss or the excitement of making a profit cause you to ignore your trading plan.Judge your trading strategy over a large sample of trades instead of reacting to recent wins or losses.Before acting on a strong feeling about the market, ask whether it is supported by evidence or simply influenced by a memorable past event.Stay disciplined after winning streaks. Success is not a reason to increase risk or abandon good trading rules.Evaluate your decisions based on the information available at the time, not on what became obvious after the outcome was known.Don't let money, research, time, or effort already invested influence your next decision. Focus only on what gives you the best opportunity in the future.Look beyond headlines and opinions by focusing on the facts rather than the way information is presented.Keep your trading process simple. Too much information can make good decisions harder, not easier.Recognize when cognitive biases are influencing your thinking, and rely on your tested trading process rather than your instincts.
You can pick up a copy of How to Trade Like a Scientist: Use the Principles of Science to Build, Test, and Continuously Improve a Profitable Trading System on Amazon worldwide if you want to read the rest of this book.
#BinanceReopensWithdrawalsForMoreAssets #BTCRebounds80K #Binance98PercentReplenished #USMidterms-WhatAreMarketsExpecting? #ADPUSPrivateEmployersAdd86000JobsInOctober
Cognitive Psychology: The human brain developed for survival, not for making probability-based decisions.
Here is Chapter 12 from my book: How to Trade Like a Scientist: Use the Principles of Science to Build, Test, and Continuously Improve a Profitable Trading System.
The human brain developed to survive uncertainty, not to manage probability. For hundreds of thousands of years, staying alive meant making fast decisions with limited information. The brain learned to spot danger quickly, remember painful experiences vividly, and stick close to the safety of the group. Those instincts kept people alive on the savanna. Financial markets reward almost the opposite set of behaviors.
Successful trading calls for patience rather than urgency, accepting small losses rather than avoiding them, independent thinking rather than following the crowd, and decisions built on probabilities rather than raw instinct. That mismatch between the wiring people carry and the behavior markets actually reward is the subject of this chapter. The mental shortcuts responsible for it are well-documented and, more usefully, predictable. Once a trader can name a bias, they can build a specific defense against it rather than fighting a vague feeling of being pulled off course.
Anchoring Keeps You Focused on the Wrong Number
The brain naturally latches onto the first piece of information it receives and continues to treat it as important, even after it has stopped being useful. Psychologists call this anchoring.
In trading, the anchor is often your purchase price, a recent high or low, or a price you believe an asset should reach. Those numbers may feel important, but they have no influence on what the market does next. The market only trades at the current price. The market does not care what your entry price was.
Imagine you buy a stock at $50, and it falls to $45. Many traders become emotionally attached to the original purchase price and refuse to sell because they want to "get back to even." But the market doesn't know you paid $50. From today's price of $45, the only question that matters is whether you would buy the stock today based on your trading system.
If the answer is yes, it remains in a buy zone; continue holding it. If the answer is no, your original purchase price shouldn't prevent you from selling and cutting your loss after your entry signal has been proven wrong. The $50 price is part of history. It doesn't change the probability of what the stock is likely to do next. Your trading plan likely told you to cut your loss before you got to this point.
The lesson is simple: don't decide based on where you entered the trade. Decide based on where the market is now and what your trading plan tells you to do next.
Why Losses Hurt More Than Gains Feel Good
Psychologists Daniel Kahneman and Amos Tversky discovered that people feel the pain of a loss much more strongly than the pleasure of an equal gain. Losing $100 usually feels worse than gaining $100 feels good.
This made sense throughout human history. Losing food, shelter, or protection could threaten survival, so our brains evolved to avoid losses. In trading, however, this instinct often works against us.
Many traders hold losing positions too long because taking the loss feels painful. They sell winning positions too quickly because they don't want to risk giving back a profit. Both habits reduce long-term performance. Both are based on loss aversion, trying to avoid the pain of feeling a loss.
Imagine your trading plan calls for risking $100 to make $200. If you consistently let your losses grow to $200 while still taking profits at $200, your reward-to-risk ratio changes from 2-to-1 to 1-to-1. Even if your win rate stays exactly the same, your trading edge becomes much smaller.
The market doesn't care how you feel about a loss. It only rewards disciplined execution. The lesson is simple: don't let the fear of taking a loss or the desire to protect a small gain override your trading plan. A small, planned loss is often the price of achieving much larger gains over the long run. Much of your success as a trader will come down to your skill of keeping losses small and accepting them fast.
Recent Results Feel More Important Than They Are
The human brain naturally gives more importance to recent events than to older ones. Psychologists call this recency bias. After several winning trades, it's easy to feel you've figured out the market. After several losing trades, it's just as easy to believe your trading strategy has stopped working. Neither conclusion is correct.
Imagine you've followed the same trading strategy for 200 trades. The last five trades represent only 2.5 percent of everything you've learned about that strategy. Yet those five trades are often the ones you remember most clearly, making them seem much more important than they really are.
The larger sample tells the real story. A handful of recent trades rarely provides enough evidence to conclude that a trading strategy has changed. Winning and losing streaks are a normal part of trading.
The lesson is simple: don't let your last few trades outweigh the evidence from your entire trading history. Judge your strategy over a large sample of trades, not by the emotions created by your most recent results.
Memorable Events Distort Your Judgment
The brain remembers dramatic events much better than ordinary ones. A market crash, a spectacular bull market rally, or a major news event stays in your memory because it was unusual and emotional. As a result, those events often feel more likely to happen again than they really are. Psychologists call this the availability bias.
For example, after living through a major market crash, many investors expect another crash even when the market is behaving normally. Likewise, after a powerful bull market, it becomes easy to believe prices will continue rising indefinitely.
The problem is that memorable events are not always the most common events. Markets spend most of their time making relatively ordinary moves, but our brains naturally focus on the exceptions rather than the rule. Before making an important trading decision, ask yourself whether you are reacting to current market conditions or simply recalling a dramatic past event.
The lesson is simple: don't mistake what is easiest to remember for what is most likely to happen. Base your decisions on evidence, not on the events that stand out most in your memory. Over the long term, the stock market will most of the time exhibit normal price action and revert to its historical average. Don't get stuck mentally on the fear of market crashes or on nonstop parabolic bull markets, as neither is normal.
Success Can Create Overconfidence
A winning streak can lead traders to believe they are more skilled than they really are. This false confidence often leads to taking bigger risks, becoming less selective, and paying less attention to the rules that created the success.
Imagine a trader who normally risks 1 percent of their account on each trade. After several wins in a row, they become confident and increase their risk to 3 percent per trade. Nothing about the trading strategy has changed. The only change is the trader's confidence.
If the next few trades are losses, those losses are now three times as large as they would have been under the original position-sizing parameters. A small losing streak that would have been easy to recover from can quickly become a much larger setback. Winning streaks do not prove that a trading strategy has become better. They are a normal part of any profitable system.
The lesson is simple: success is not a reason to abandon discipline. Continue following the same position-sizing and risk-management rules that produced the winning streak.
Looking Back Makes the Future Seem Obvious
After a market move has already happened, it often feels like it was easy to predict. Psychologists call this hindsight bias. Once we know the outcome, our brains quietly rewrite the past, making us believe the warning signs were obvious all along. In reality, they usually weren't.
Imagine reviewing a trade that ended in a loss. Looking back, you may think, "I should have known this would happen." But before the trade, you didn't have the benefit of knowing the outcome. You only had the information available at that moment, and the future was still uncertain.
The same thing happens after successful trades. A winning trade can make you believe the opportunity was obvious and you should have increased your position sizing, even though it may have looked far less certain before you entered.
The lesson is simple: judge your decisions based on the information you had at the time, not on what became obvious afterward. Good traders don't expect to predict the future perfectly. They focus on making the best possible decision with the information available. Hindsight can be a parasite on a trader's mind, making you second-guess yourself through the illusion of present knowledge. If you followed your trading signals in real time, you did the right thing under the uncertainty of that moment.
Don't Let the Past Control Today's Decisions
One of the strongest biases in human psychology is the sunk-cost fallacy. It is our tendency to continue investing in something simply because we have already invested so much time, research, effort, or money in it.
This instinct is easy to understand. Nobody enjoys admitting that their time, effort, or money has been wasted. Once we commit to a decision, our brains naturally want to justify that commitment. Walking away feels like accepting failure, even when it is clearly the better choice. The problem is that the market doesn't care how much you've already invested or lost.
Imagine buying a stock at $60 and watching it fall to $50. At that point, the $10 loss has already happened. Holding the position can't erase it, and neither can buying more shares. Yet many traders continue holding because selling would force them to admit the original decision didn't work out. Others invest even more money because they feel they have "too much invested to quit now." Both reactions are driven by the past instead of the future.
The money already invested is gone, whether you hold, sell, or buy more. It has become a sunk cost. The only question that matters now is which decision gives you the best chance of success from now on.
This bias appears everywhere in life. People stay in failing businesses because they've already invested years building them. They remain in unhappy relationships because they've spent too much time to leave. They finish books they no longer enjoy simply because they're halfway through. In every case, past investments influence decisions that should depend only on future benefits and future costs.
The lesson is simple: yesterday's investment or trade is history. Today's decision should be based only on what gives you the best outcome from this point forward, regardless of how much time, effort, or money you've already committed.
The Way Information Is Presented Changes Decisions
People often make different decisions based on how the same information is presented, even when the facts are identical. Psychologists call this the framing effect.
For example, imagine two trading strategies.
The first is described as winning 70 percent of its trades.The second is described as losing 30 percent of its trades.
Most people naturally prefer the first description, even though both strategies are identical. The wording changed. The facts did not.
The same thing happens in the financial markets. Headlines, analyst reports, and market commentary often present information in ways that create excitement or fear without changing the underlying facts. Successful traders learn to look past the presentation and focus on the information itself. Before reacting to any new information, ask yourself whether the facts have actually changed or only the way they were presented.
The lesson is simple: don't let the presentation of information influence your decisions more than the information itself.
Too Much Information Can Lead to Worse Decisions
Many people believe that having more information automatically leads to better decisions. In reality, the brain can only process a limited amount of information at one time. As more information competes for your attention, it becomes harder to identify what actually matters.
Imagine trying to decide whether to buy a stock. One indicator suggests buying. Another suggests waiting. A third signals selling. Meanwhile, financial news, social media, television commentators, and online forums all offer different opinions. Instead of making decisions easier, the extra information often creates confusion. This is known as cognitive overload.
When the brain becomes overloaded, people often hesitate, second-guess themselves, or focus on whatever information confirms what they already wanted to do. Successful traders avoid this trap by simplifying their decision-making process. They identify the information that consistently helps them make better decisions and ignore everything else.
The lesson is simple: more information does not always produce better decisions. Often, a smaller amount of relevant information leads to clearer thinking and more consistent execution. Your job as a trader is to create a trading system that filters out the complexity and makes trading profitably simpler by focusing on what signals matter the most to you in your own timeframe.
Why These Biases Matter
Every trader experiences these cognitive biases because they are part of normal human psychology. They aren't signs of a lack of intelligence, experience, or discipline. They are shortcuts the brain developed to help our ancestors survive in an uncertain world.
The problem is that what helped people survive thousands of years ago doesn't always help them make good decisions in today's financial markets. Our instincts often encourage us to avoid losses, follow the crowd, remember dramatic events, and rely on recent experiences. Successful trading often requires doing the opposite.
The goal isn't to eliminate these biases completely. That's impossible. The goal is to recognize when they are influencing your thinking before they influence your decisions.
The more aware you become of these mental shortcuts, the less control they have over your trading. Every time you ask, "Am I reacting to the facts or to one of my biases?" You give yourself the opportunity to make a more objective decision.
Trading like a scientist means studying more than the markets. It also means understanding the strengths and weaknesses of your mind when making trading decisions. The better you understand both, the more consistently you can make rational decisions in an uncertain market.
Build Defenses Against Your Own Cognitive Biases
Base every trading decision on the current evidence, not on the price at which you entered the trade.Don't let the fear of taking a loss or the excitement of making a profit cause you to ignore your trading plan.Judge your trading strategy over a large sample of trades instead of reacting to recent wins or losses.Before acting on a strong feeling about the market, ask whether it is supported by evidence or simply influenced by a memorable past event.Stay disciplined after winning streaks. Success is not a reason to increase risk or abandon good trading rules.Evaluate your decisions based on the information available at the time, not on what became obvious after the outcome was known.Don't let money, research, time, or effort already invested influence your next decision. Focus only on what gives you the best opportunity in the future.Look beyond headlines and opinions by focusing on the facts rather than the way information is presented.Keep your trading process simple. Too much information can make good decisions harder, not easier.Recognize when cognitive biases are influencing your thinking, and rely on your tested trading process rather than your instincts.
You can pick up a copy of How to Trade Like a Scientist: Use the Principles of Science to Build, Test, and Continuously Improve a Profitable Trading System on Amazon worldwide if you want to read the rest of this book.
#BinanceReopensWithdrawalsForMoreAssets #BTCRebounds80K #Binance98PercentReplenished #USMidterms-WhatAreMarketsExpecting? #ADPUSPrivateEmployersAdd86000JobsInOctober
78
·
--
Chart Pattern drop parameters:
-5% = Normal chart pullback
-10% = Normal chart correction
-15% = Big chart correction
-20% = Technical bear market territory
-30% = Chart plunge
-40% = Chart crash
-50% = Crisis in fundamentals
#USMidtermElections #BinanceRestores28FiatWithdrawals #USOctoberNFP-AreRateCutsStillPossible #BinanceWithdrawalScamWarning #AppleEarningsAhead-CanStockHitNewHigh
Chart Pattern drop parameters:
-5% = Normal chart pullback
-10% = Normal chart correction
-15% = Big chart correction
-20% = Technical bear market territory
-30% = Chart plunge
-40% = Chart crash
-50% = Crisis in fundamentals
#USMidtermElections #BinanceRestores28FiatWithdrawals #USOctoberNFP-AreRateCutsStillPossible #BinanceWithdrawalScamWarning #AppleEarningsAhead-CanStockHitNewHigh
-5% = Normal chart pullback
-10% = Normal chart correction
-15% = Big chart correction
-20% = Technical bear market territory
-30% = Chart plunge
-40% = Chart crash
-50% = Crisis in fundamentals
#USMidtermElections #BinanceRestores28FiatWithdrawals #USOctoberNFP-AreRateCutsStillPossible #BinanceWithdrawalScamWarning #AppleEarningsAhead-CanStockHitNewHigh
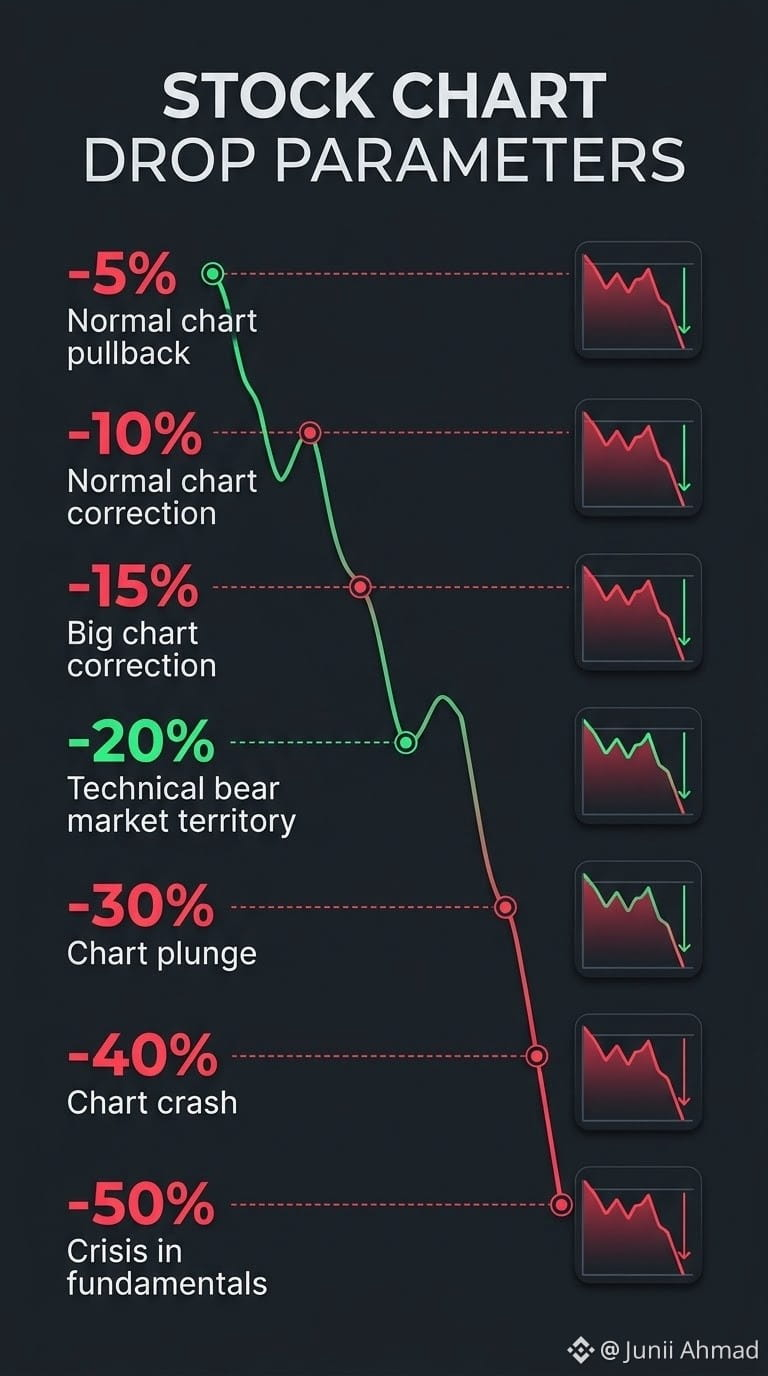
2
67
·
--
Bullish
Verified
[JUNII AHMAD](https://www.binance.com/register?ref=1025949147)
via
@Junaid_Ahmad1
$AAPLB PL $PLTRB LTR $AAPLB MD $SHOP $MRNA $SMCI $TXG $UBER $LITE $COHR $DIBS $APP $AEHR $QCOM $AMC $CAVA $RIOT $BKNG $TEAM $NVO $ABNB $ETN $BXSL $MPC $FN $GFS $DDOG $MP $U $IREN $FISV $BROS $RUN $ALAB $ARM $CHKP $KTOS $NVTS $ANET $FSLY $AAOI $BMRN $VSH $NET $OKLO $DOCS $TEM $PFE $CIFR $EL
#BinanceRestores28FiatWithdrawals #BinanceProcesses$4.65BWithdrawals #BitcoinClosesAbove50WeekMAFor7thStraightWeek #BitcoinSpotETFsPost$203MWeeklyOutflow #ETHFalls16.1%InOctober
JUNII AHMAD
via
@Junii Ahmad
$AAPLB PL $PLTRB LTR $AAPLB MD $SHOP $MRNA $SMCI $TXG $UBER $LITE $COHR $DIBS $APP $AEHR $QCOM $AMC $CAVA $RIOT $BKNG $TEAM $NVO $ABNB $ETN $BXSL $MPC $FN $GFS $DDOG $MP $U $IREN $FISV $BROS $RUN $ALAB $ARM $CHKP $KTOS $NVTS $ANET $FSLY $AAOI $BMRN $VSH $NET $OKLO $DOCS $TEM $PFE $CIFR $EL
#BinanceRestores28FiatWithdrawals #BinanceProcesses$4.65BWithdrawals #BitcoinClosesAbove50WeekMAFor7thStraightWeek #BitcoinSpotETFsPost$203MWeeklyOutflow #ETHFalls16.1%InOctober
via
@Junii Ahmad
$AAPLB PL $PLTRB LTR $AAPLB MD $SHOP $MRNA $SMCI $TXG $UBER $LITE $COHR $DIBS $APP $AEHR $QCOM $AMC $CAVA $RIOT $BKNG $TEAM $NVO $ABNB $ETN $BXSL $MPC $FN $GFS $DDOG $MP $U $IREN $FISV $BROS $RUN $ALAB $ARM $CHKP $KTOS $NVTS $ANET $FSLY $AAOI $BMRN $VSH $NET $OKLO $DOCS $TEM $PFE $CIFR $EL
#BinanceRestores28FiatWithdrawals #BinanceProcesses$4.65BWithdrawals #BitcoinClosesAbove50WeekMAFor7thStraightWeek #BitcoinSpotETFsPost$203MWeeklyOutflow #ETHFalls16.1%InOctober
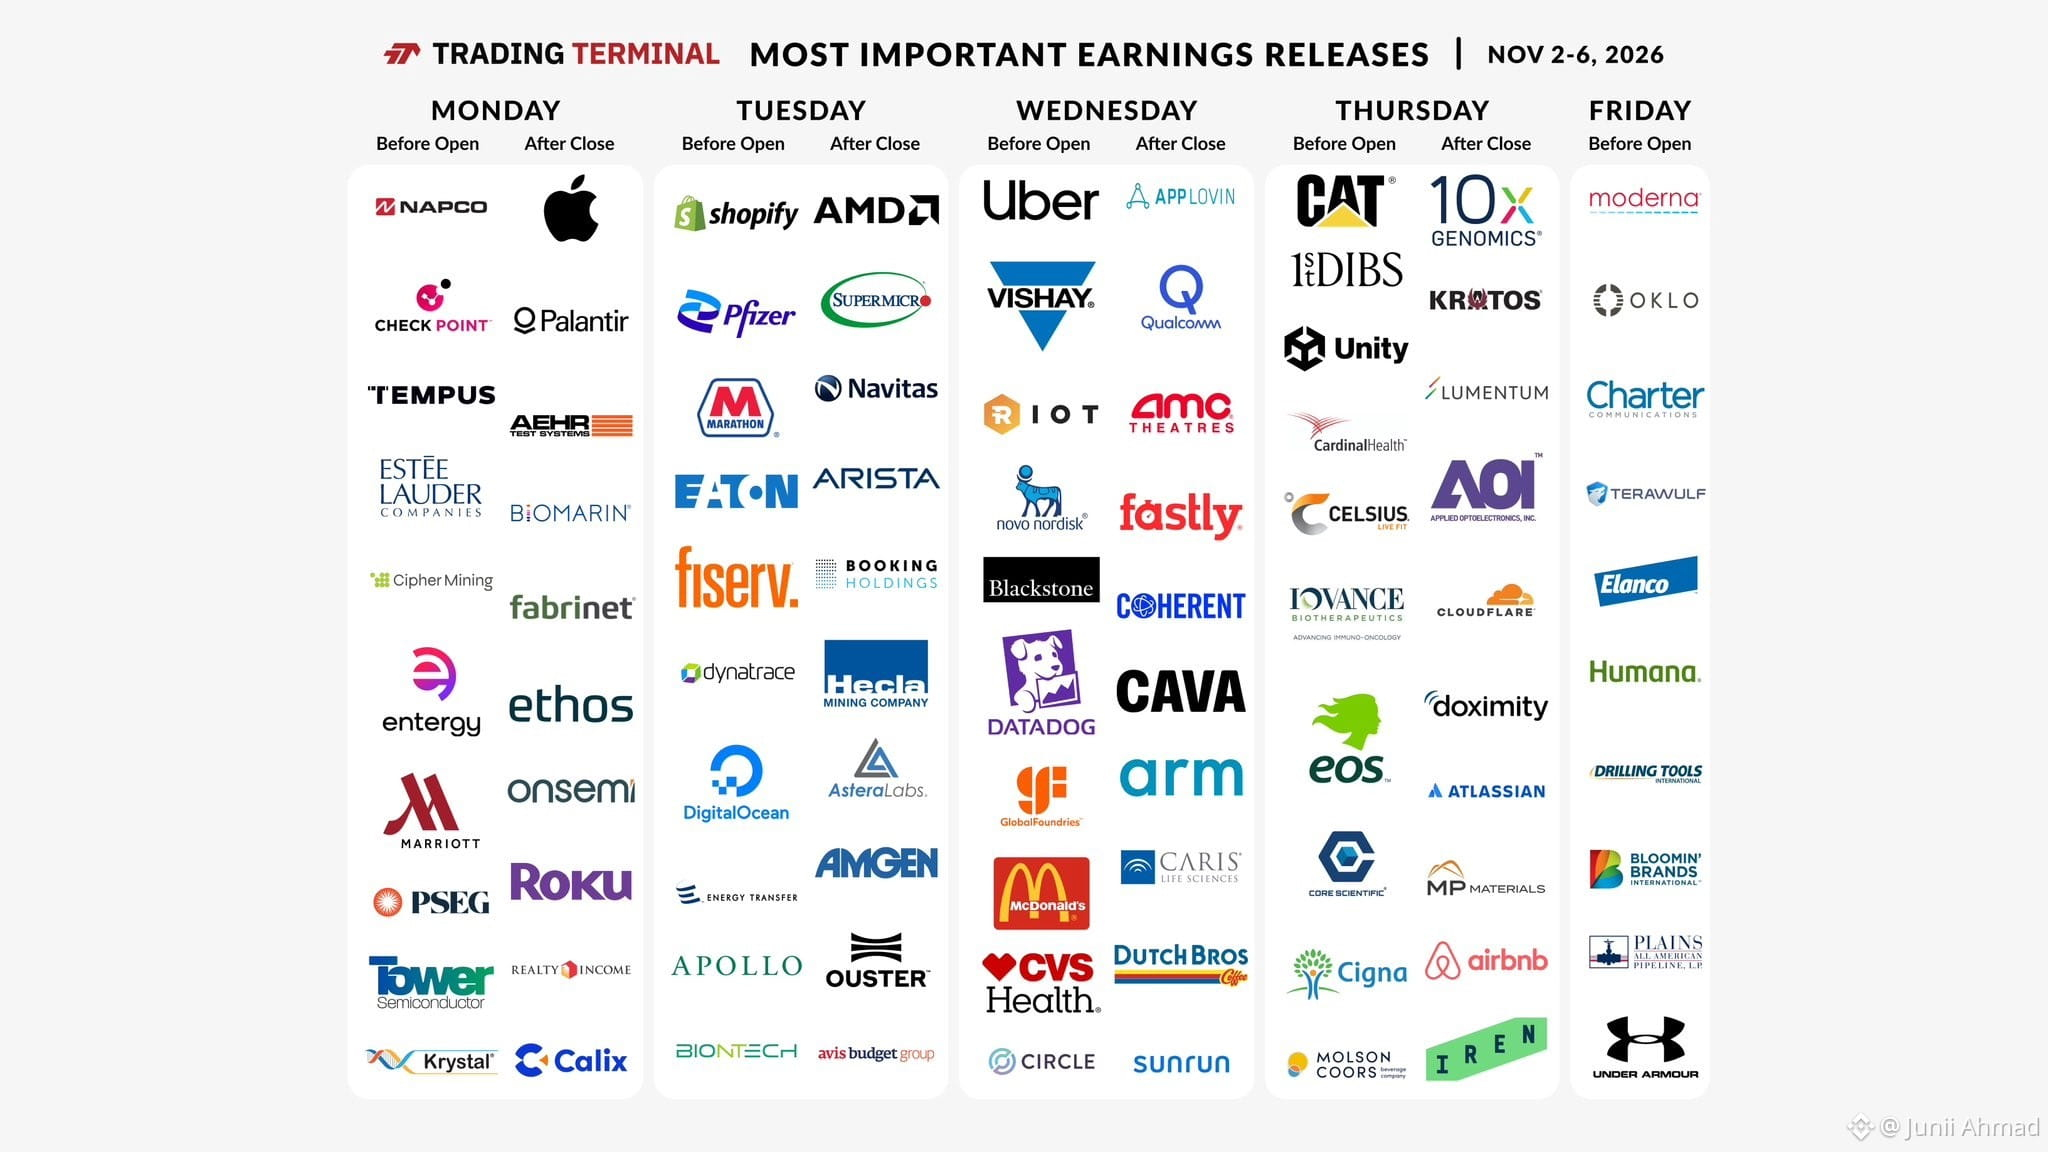
1
1.1k
·
--

Article
The Mathematics of Great BusinessesThis is Chapter 6 from my book: How To Pick Growth Stocks Like A Mathematician: Using Logic, Probability, and Data to Find the Next Big Stock Market Winners
BQS = (ROIC/15) + (Gross Margin/40) + (LTV/CAC/3) + (Operating Income Growth/Revenue Growth) + (FCF/Net Income)
BQS = Business Quality ScoreROIC = Return on Invested Capital divided by 15 (your minimum ROIC threshold)Gross Margin divided by 40 (your minimum gross margin threshold)LTV/CAC divided by 3 (your minimum LTV/CAC threshold)Operating Income Growth divided by Revenue Growth (the operating leverage ratio)Free Cash Flow divided by Net Income (the free cash flow conversion rate)
ROIC is divided by 15, Gross Margin by 40, and LTV/CAC by 3 because these represent baseline quality thresholds. Operating Income Growth is divided by Revenue Growth to measure operating leverage, while Free Cash Flow is divided by Net Income to measure earnings quality and cash conversion.
Each component is normalized so that a company meeting the baseline threshold contributes approximately 1.0 point to the total score. A company meeting all baseline thresholds scores roughly 5.0, while businesses that exceed those thresholds score progressively higher. The composite score provides a quick snapshot of how far above baseline quality a company ranks across capital efficiency, profitability, unit economics, operating leverage, and cash generation.
This formula does not predict stock returns. Instead, it measures five characteristics commonly present in many of history's most successful businesses: capital efficiency, pricing power, customer economics, operating leverage, and cash-flow quality. Build on this framework by considering how these characteristics influence long-term performance.
Revenue growth alone rarely delivers extraordinary long-term shareholder returns. Businesses that compound value for years typically combine rapid growth with high returns on capital, expanding profit margins, improving unit economics, and increasing cash generation. A rising score may signal that a company is strengthening its economic engine as it scales, though future stock returns will also depend on valuation, competition, industry dynamics, and execution.
Stock prices follow earnings and free cash flow. That sentence sounds simple, but the math behind it explains nearly everything about why the best growth stocks in history produced the returns they did. The previous chapter explained what power-law returns look like from the outside and which financial signals predict them. This chapter goes inside the business itself, to the specific mathematical relationships between revenues, costs, capital, and cash that determine whether a fast-growing company will eventually produce extraordinary shareholder returns or merely decent ones. These are not qualitative judgments about management quality or brand strength. They are measurable numbers, and learning to read them correctly is one of the most valuable skills a growth stock investor can develop.
Return on Invested Capital: The Master Metric
Return on invested capital (ROIC) is the percentage return a business generates on the total capital it has invested in its operations. The formula is straightforward: ROIC = Net Operating Profit After Tax divided by Invested Capital. Invested capital is the sum of equity and interest-bearing debt minus non-operating cash. The result tells you how many cents of after-tax operating profit the business generates for every dollar of capital it has put to work.
Why does this number matter so much to stock returns? Because a business that earns a high ROIC and can reinvest its profits at that same high rate compounds its intrinsic value, the stock price eventually follows. A company earning 30% ROIC that reinvests 80% of its profits back into growth is compounding the economic value of the business at roughly 24% per year before any external financing. Over ten years, every dollar of invested capital becomes roughly $8.60 in economic value at that rate. The stock price doesn't always track this in real time, but over full business cycles it does, and the gap between the current price and compounding intrinsic value is where the long-term return comes from.
The comparison between high-ROIC and low-ROIC businesses over time is stark. Academic research on U.S. public companies going back to the 1960s consistently shows that companies sustaining ROIC above 20% for five years or more generate stock returns that outperform the broader market by a wide margin, while companies with ROIC below the cost of capital destroy shareholder value regardless of how fast their revenue grows. Revenue growth without high ROIC is growth that requires constant external capital to sustain itself, diluting existing shareholders and limiting compounding. Revenue growth with high ROIC is self-funding, meaning the business becomes more valuable with each passing year without issuing new shares or taking on debt.
In practice, you want to see ROIC above 15% as a minimum threshold for any growth stock candidate, and the trend matters as much as the level. A company with ROIC rising from 12% to 22% over three years is a better signal than one sitting at a flat 25%, because rising ROIC shows the business model is producing better economics at scale, which is the mathematical model of a business with genuine competitive advantages. Falling ROIC while revenue grows fast is a serious warning sign. It means the business is deploying increasing amounts of capital to generate each additional dollar of profit, which is the opposite of what you want and a reliable predictor of disappointing long-term stock returns, even when the near-term growth story looks exciting.
Gross Margin and the Architecture of Competitive Advantage
Gross margin is revenue minus the direct cost of producing or delivering the product or service, expressed as a percentage of revenue. For a software company, the direct costs are primarily server infrastructure and customer support. For a pharmaceutical company, it is manufacturing and distribution. For a consumer products company, it is materials and production. The higher the gross margin, the more of each revenue dollar flows down to cover operating expenses and eventually becomes profit.
The mathematical significance of gross margin goes well beyond its face value as a profitability metric. High gross margins create a structural advantage in the economics of scaling. A company with 75% gross margins that grows revenue by $100 million adds $75 million to its gross profit pool. A company with 35% gross margins, growing revenue by the same $100 million, adds only $35 million. Both companies face similar levels of fixed operating costs in sales, marketing, research, and administration. The high-margin company can absorb those costs and reach profitability at a much lower revenue level, and once profitable, each additional dollar of revenue produces far more incremental operating income than the low-margin competitor.
The best-performing software growth stocks of the 2010s and early 2020s that ultimately produced 500% to 2,000% returns had gross margins above 65% when their major advances began. High gross margins were common because they enabled operating leverage, strong cash generation, and scalable growth, though there were exceptions. The gross margin provided the mathematical architecture for operating leverage to kick in as the business scaled, converting revenue growth into earnings growth at an accelerating rate. That acceleration in earnings growth drove the multiple expansion, multiplying stock returns beyond what revenue growth alone would have produced.
Here is a concrete example that makes this clear. Company A has $200 million in revenue, growing at 35% per year, with a 72% gross margin and $180 million in operating expenses. It is currently running at a small operating loss. Company B has $200 million in revenue, growing at 35% per year, with a 38% gross margin and $180 million in operating expenses. It is also running at a loss.
Fast forward two years. Both companies have grown revenue to approximately $365 million. Company A's 72% gross margin produces about $262 million in gross profit. If operating expenses grow at 11% annually, they rise to approximately $222 million. Operating income is now about $41 million, resulting in an operating margin of roughly 11%.
Company B also reaches $365 million in revenue. However, its 38% gross margin generates only about $139 million in gross profits. Against the same $222 million in operating expenses, the company is still losing roughly $83 million per year.
The two businesses started with the same revenue, the same growth rate, and the same operating expense structure. The difference was the gross margin. In just two years, Company A has crossed into profitability and can begin funding more of its growth internally. Company B remains dependent on external capital to sustain operations. Over time, investors reward this divergence because high gross margins create the operating leverage needed to convert revenue growth into earnings and cash flow growth.
The LTV to CAC Ratio: The Math of Scalable Growth
The customer lifetime value divided by customer acquisition cost, known as the LTV/CAC ratio, is one of the most revealing mathematical relationships in a growth business and one of the most consistently underused metrics for retail investors. LTV is the total net revenue a business expects to collect from a single customer over the entire duration of that customer relationship. CAC is the total sales and marketing cost required to acquire one new customer. The ratio between them indicates whether the business becomes more or less economically efficient as it grows.
The formula for LTV in a subscription or recurring revenue business is:
LTV = (Average Revenue Per Customer × Gross Margin Percentage) ÷ Customer Churn Rate.Suppose a software company charges $1,000 per year for its service, has a gross margin of 80%, and loses 10% of its customers each year. The lifetime value of a customer is:($1,000 × 0.80) ÷ 0.10 = $8,000The average customer generates about $8,000 in gross profit over their relationship with the company.Now assume the company spends $2,000 on sales and marketing to acquire each new customer. The LTV/CAC ratio is:$8,000 ÷ $2,000 = 4.0That means every dollar spent on customer acquisition eventually yields four dollars in gross profit.
An LTV/CAC ratio above 3 is healthy. Above 5 is excellent. A ratio below 2 is a warning sign because the company is spending too much to acquire customers relative to the value those customers provide. In that situation, growing faster does not necessarily create more value. It can simply magnify an already weak business model.
The best growth stocks often combine rapid customer acquisition with strong LTV/CAC ratios. Their customers stay for years, generate high margins, and produce far more profit than it costs to acquire them. That creates a self-reinforcing growth engine that becomes more valuable as the company scales.
The reason this metric matters to growth stock returns is specific. A business with a high LTV/CAC ratio gets more profitable per unit of growth capital deployed as it scales. Sales teams become more efficient as brand recognition grows and referral channels develop. Marketing costs per acquired customer fall as organic traffic increases. Product improvements reduce churn, raising LTV without increasing CAC. Each of these effects is mathematical and measurable, and together they produce the pattern you see in the financial statements of the best growth stocks: a rising LTV/CAC ratio over time, which translates into free cash flow margins expanding as the business grows rather than contracting. That expanding free cash flow margin drives the dual compounding of revenue growth and multiple expansion, producing the largest stock returns.
Most companies don't report LTV and CAC as explicit line items. Calculate them from what is disclosed. Gross margin is in the income statement. Churn can be estimated from net revenue retention figures when disclosed. CAC is approximated by dividing total sales and marketing expenses by the number of new customers added in the period. For companies that don't break out new customer counts, the ratio of sales and marketing expense growth to revenue growth is a useful proxy. When sales and marketing expenses grow more slowly than revenue over multiple consecutive quarters, the business is improving its CAC efficiency, a signal that the LTV/CAC ratio is expanding and unit economics are improving with scale.
Operating Leverage and the Profit Acceleration Effect
Operating leverage is the correlation between a company's fixed and variable costs, and it is the mechanism that causes profit growth to accelerate faster than revenue growth in well-structured businesses. A company with high operating leverage has a large proportion of its total costs fixed, meaning those costs don't increase in proportion to revenue. Once revenue exceeds the breakeven point at which fixed costs are covered, each additional dollar of revenue flows through to operating income at a very high rate.
The math is easier to see with numbers. A company has $300 million in revenue, $200 million in fixed operating costs, and variable costs equal to 15% of revenue. At $300 million in revenue, total costs are $200 million plus $45 million in variable costs, for $245 million, producing $55 million in operating income and an 18% operating margin. Revenue grew 30% to $390 million in year two. Fixed costs grew 8% to $216 million. Variable costs grew to $58.5 million. Total costs are $274.5 million. Operating income is now $115.5 million, a 30% operating margin. Revenue grew 30%, but operating income grew 110%. That acceleration in profit growth relative to revenue growth is operating leverage in action. When investors see this pattern emerge in a growth company's financial statements, the market often re-rates the stock at a higher multiple because the earnings power is now visibly larger than the revenue growth rate alone suggested.
The businesses with the strongest operating leverage are those in which the product or service can be delivered to additional customers at minimal incremental cost. Software is the most obvious example because the marginal cost of delivering software to one more customer is close to zero. Once the code is written and the infrastructure is provisioned, adding customers adds almost no cost. This is why software companies with strong revenue growth frequently show operating margins expanding from negative territory to 20%, 30%, even 40% over three to five years as scale kicks in. The fixed cost base is spread across a larger revenue base, and the resulting profit acceleration pushes the stock price higher even if the revenue growth rate stays constant.
As a growth stock investor, you can measure operating leverage directly by tracking the ratio of operating income growth to revenue growth over rolling four-quarter periods. When operating income consistently grows at two to three times the revenue growth rate, the business is exhibiting strong operating leverage, and the earnings compounding effect is in full force. You can also look at the trend in operating margins quarter by quarter. Expanding operating margins in a fast-growing company are the clearest visible signal that operating leverage is present and that the profit acceleration effect will continue as long as revenue growth holds.
Free Cash Flow Conversion: Where Returns Are Actually Made
Two companies can have identical revenue growth rates, identical gross margins, and identical reported earnings, but produce wildly different stock returns over a decade if their free cash flow conversion rates differ. The free cash flow conversion is the percentage of net income that converts into cash the business can use, return to shareholders, or reinvest without issuing new shares. The formula is free cash flow divided by net income. A ratio above 100% means the business is generating more cash than it reports in earnings, typically because of non-cash charges such as depreciation and stock-based compensation. A ratio well below 100% means the business requires significant reinvestment just to sustain its reported earnings, leaving less cash available for compounding.
This distinction matters enormously in practice. A capital-intensive business growing revenue at 30% per year might report strong earnings but require $2 of capital expenditure for every $3 of operating cash flow to maintain and expand its asset base. The actual free cash flow available to shareholders is a fraction of the reported net income. A capital-light business, typically software, consumer platforms, or asset-light services, growing revenue at the same 30% might generate free cash flow that exceeds net income because the business requires little reinvestment to sustain growth. Over ten years, the capital-light business compounds investor wealth at a dramatically faster rate, even when earnings growth looks identical on the surface.
Historically, winning growth stocks frequently shared a common characteristic: they converted much of their earnings into free cash flow and required relatively little incremental capital to support growth. Capital-light business models, particularly software, platforms, and asset-light service businesses, often produce some of the strongest long-term shareholder returns because a larger share of operating profits can be reinvested at attractive rates or returned to shareholders. Companies that require heavy ongoing capital investment often face a higher hurdle to create shareholder value because a significant portion of their cash flow has to be reinvested simply to sustain growth.
When evaluating a growth stock candidate, calculate free cash flow conversion over the trailing four quarters and compare it to the prior year. Rising free cash flow conversion alongside revenue growth confirms that the business is scaling efficiently and that reported earnings accurately reflect the economic value it is creating. Falling free cash flow conversion while earnings grow is a warning sign that the business is becoming more capital-intensive at scale, the opposite of what the best growth stocks exhibit. It is also worth checking capital expenditure as a percentage of revenue. For a software or platform business, capex above 10% of revenue warrants a closer look at whether the business model is as capital-light as the growth story implies.
The mathematics of great businesses, taken together, produces a compound picture that is more powerful than any single metric in isolation. High and rising ROIC confirms that the business creates value with every dollar of capital deployed. High gross margins create the architectural foundation for profit acceleration at scale. A strong LTV/CAC ratio confirms that the unit economics improve as the business grows. Operating leverage ensures profit growth outpaces revenue growth once scale is reached. High free cash flow conversion ensures that reported profits translate into actual cash available to compound. When all five of these mathematical characteristics are present and trending in the right direction, you are looking at the financial profile that has historically produced the largest growth stock returns in every market cycle. The stock price may not reflect it today. That gap is an opportunity.
Chapter Execution Checklist
Calculate ROIC for every growth stock candidate using the net operating profit after tax, divided by invested capital. Require a minimum of 15% and prioritize stocks with rising year-over-year ROIC. A company with ROIC expanding from 14% to 24% over three years is a stronger candidate than one sitting at a flat 20%, because rising ROIC signals that the business model produces better economics at scale, which is the mathematical signature of durable competitive advantage.Check the gross margin level and trend in every quarterly earnings report. Growth stocks in software and platform businesses require gross margins above 40% and look to expand by at least 1 percentage point per year. Run the two-company comparison exercise for any candidate with gross margins below 50%: project gross profit dollars at the current margin two years forward, using a realistic operating cost growth rate, to determine whether the business reaches profitability at the projected revenue base.Estimate the LTV/CAC ratio for any subscription or recurring revenue business using the formula (Average Revenue Per Customer x Gross Margin Percentage) divided by Churn Rate for LTV, and total sales and marketing expense divided by new customers added for CAC. A ratio above 3 is the minimum threshold. Track the ratio quarterly. Rising LTV/CAC over time confirms that the unit economics are improving with scale, which is the mathematical precondition for free cash flow margins expanding as revenue grows.Measure operating leverage by comparing operating income growth to revenue growth over rolling four-quarter periods. When operating income grows at 2 times or more the revenue growth rate, operating leverage is actively compressing the cost structure, and the profit acceleration effect is at work. Track the operating margin trend quarter by quarter. Expanding operating margins in a fast-growing company are the clearest visible confirmation that the profit acceleration effect will continue.You can calculate the free cash flow conversion as free cash flow divided by the net income over the previous trailing four quarters. Require a ratio above 80% for any capital-light business model. Check capital expenditure as a percentage of revenue and flag any software or platform company where capex exceeds 10% of revenue for closer examination of whether the business is as capital-light as the growth narrative implies.Score each growth stock candidate against all five mathematical characteristics: ROIC above 15% and rising, gross margins above 40% and expanding, LTV/CAC above 3 and rising, operating income growing at twice the revenue growth rate, and free cash flow conversion above 80%. A stock scoring four or five out of five deserves serious position sizing consideration. A stock scoring two or fewer, regardless of how fast revenue is growing, has not yet demonstrated the business quality mathematics that historically predict large, sustained stock returns.Re-run the five-metric scorecard on every open position at each quarterly earnings report. A single metric moving in the wrong direction is a yellow flag worth monitoring. Two metrics deteriorating simultaneously are a red flag that the business quality mathematics are weakening, and the position size should be reduced before the deterioration shows up fully in the revenue growth rate or the stock price.
For the rest of the content in this book, pick up a copy in paperback, Kindle, or Audible through the Amazon U.S. link here: How To Pick Growth Stocks Like A Mathematician: Using Logic, Probability, and Data to Find the Next Big Stock Market Winners
Or check Amazon in your own country for availability.
#BinanceRestores28FiatWithdrawals #BinanceProcesses$4.65BWithdrawals #BitcoinClosesAbove50WeekMAFor7thStraightWeek #ETHFalls16.1%InOctober #BitcoinClosesAbove50WeekMAFor7thStraightWeek
The Mathematics of Great Businesses
This is Chapter 6 from my book: How To Pick Growth Stocks Like A Mathematician: Using Logic, Probability, and Data to Find the Next Big Stock Market Winners
BQS = (ROIC/15) + (Gross Margin/40) + (LTV/CAC/3) + (Operating Income Growth/Revenue Growth) + (FCF/Net Income)
BQS = Business Quality ScoreROIC = Return on Invested Capital divided by 15 (your minimum ROIC threshold)Gross Margin divided by 40 (your minimum gross margin threshold)LTV/CAC divided by 3 (your minimum LTV/CAC threshold)Operating Income Growth divided by Revenue Growth (the operating leverage ratio)Free Cash Flow divided by Net Income (the free cash flow conversion rate)
ROIC is divided by 15, Gross Margin by 40, and LTV/CAC by 3 because these represent baseline quality thresholds. Operating Income Growth is divided by Revenue Growth to measure operating leverage, while Free Cash Flow is divided by Net Income to measure earnings quality and cash conversion.
Each component is normalized so that a company meeting the baseline threshold contributes approximately 1.0 point to the total score. A company meeting all baseline thresholds scores roughly 5.0, while businesses that exceed those thresholds score progressively higher. The composite score provides a quick snapshot of how far above baseline quality a company ranks across capital efficiency, profitability, unit economics, operating leverage, and cash generation.
This formula does not predict stock returns. Instead, it measures five characteristics commonly present in many of history's most successful businesses: capital efficiency, pricing power, customer economics, operating leverage, and cash-flow quality. Build on this framework by considering how these characteristics influence long-term performance.
Revenue growth alone rarely delivers extraordinary long-term shareholder returns. Businesses that compound value for years typically combine rapid growth with high returns on capital, expanding profit margins, improving unit economics, and increasing cash generation. A rising score may signal that a company is strengthening its economic engine as it scales, though future stock returns will also depend on valuation, competition, industry dynamics, and execution.
Stock prices follow earnings and free cash flow. That sentence sounds simple, but the math behind it explains nearly everything about why the best growth stocks in history produced the returns they did. The previous chapter explained what power-law returns look like from the outside and which financial signals predict them. This chapter goes inside the business itself, to the specific mathematical relationships between revenues, costs, capital, and cash that determine whether a fast-growing company will eventually produce extraordinary shareholder returns or merely decent ones. These are not qualitative judgments about management quality or brand strength. They are measurable numbers, and learning to read them correctly is one of the most valuable skills a growth stock investor can develop.
Return on Invested Capital: The Master Metric
Return on invested capital (ROIC) is the percentage return a business generates on the total capital it has invested in its operations. The formula is straightforward: ROIC = Net Operating Profit After Tax divided by Invested Capital. Invested capital is the sum of equity and interest-bearing debt minus non-operating cash. The result tells you how many cents of after-tax operating profit the business generates for every dollar of capital it has put to work.
Why does this number matter so much to stock returns? Because a business that earns a high ROIC and can reinvest its profits at that same high rate compounds its intrinsic value, the stock price eventually follows. A company earning 30% ROIC that reinvests 80% of its profits back into growth is compounding the economic value of the business at roughly 24% per year before any external financing. Over ten years, every dollar of invested capital becomes roughly $8.60 in economic value at that rate. The stock price doesn't always track this in real time, but over full business cycles it does, and the gap between the current price and compounding intrinsic value is where the long-term return comes from.
The comparison between high-ROIC and low-ROIC businesses over time is stark. Academic research on U.S. public companies going back to the 1960s consistently shows that companies sustaining ROIC above 20% for five years or more generate stock returns that outperform the broader market by a wide margin, while companies with ROIC below the cost of capital destroy shareholder value regardless of how fast their revenue grows. Revenue growth without high ROIC is growth that requires constant external capital to sustain itself, diluting existing shareholders and limiting compounding. Revenue growth with high ROIC is self-funding, meaning the business becomes more valuable with each passing year without issuing new shares or taking on debt.
In practice, you want to see ROIC above 15% as a minimum threshold for any growth stock candidate, and the trend matters as much as the level. A company with ROIC rising from 12% to 22% over three years is a better signal than one sitting at a flat 25%, because rising ROIC shows the business model is producing better economics at scale, which is the mathematical model of a business with genuine competitive advantages. Falling ROIC while revenue grows fast is a serious warning sign. It means the business is deploying increasing amounts of capital to generate each additional dollar of profit, which is the opposite of what you want and a reliable predictor of disappointing long-term stock returns, even when the near-term growth story looks exciting.
Gross Margin and the Architecture of Competitive Advantage
Gross margin is revenue minus the direct cost of producing or delivering the product or service, expressed as a percentage of revenue. For a software company, the direct costs are primarily server infrastructure and customer support. For a pharmaceutical company, it is manufacturing and distribution. For a consumer products company, it is materials and production. The higher the gross margin, the more of each revenue dollar flows down to cover operating expenses and eventually becomes profit.
The mathematical significance of gross margin goes well beyond its face value as a profitability metric. High gross margins create a structural advantage in the economics of scaling. A company with 75% gross margins that grows revenue by $100 million adds $75 million to its gross profit pool. A company with 35% gross margins, growing revenue by the same $100 million, adds only $35 million. Both companies face similar levels of fixed operating costs in sales, marketing, research, and administration. The high-margin company can absorb those costs and reach profitability at a much lower revenue level, and once profitable, each additional dollar of revenue produces far more incremental operating income than the low-margin competitor.
The best-performing software growth stocks of the 2010s and early 2020s that ultimately produced 500% to 2,000% returns had gross margins above 65% when their major advances began. High gross margins were common because they enabled operating leverage, strong cash generation, and scalable growth, though there were exceptions. The gross margin provided the mathematical architecture for operating leverage to kick in as the business scaled, converting revenue growth into earnings growth at an accelerating rate. That acceleration in earnings growth drove the multiple expansion, multiplying stock returns beyond what revenue growth alone would have produced.
Here is a concrete example that makes this clear. Company A has $200 million in revenue, growing at 35% per year, with a 72% gross margin and $180 million in operating expenses. It is currently running at a small operating loss. Company B has $200 million in revenue, growing at 35% per year, with a 38% gross margin and $180 million in operating expenses. It is also running at a loss.
Fast forward two years. Both companies have grown revenue to approximately $365 million. Company A's 72% gross margin produces about $262 million in gross profit. If operating expenses grow at 11% annually, they rise to approximately $222 million. Operating income is now about $41 million, resulting in an operating margin of roughly 11%.
Company B also reaches $365 million in revenue. However, its 38% gross margin generates only about $139 million in gross profits. Against the same $222 million in operating expenses, the company is still losing roughly $83 million per year.
The two businesses started with the same revenue, the same growth rate, and the same operating expense structure. The difference was the gross margin. In just two years, Company A has crossed into profitability and can begin funding more of its growth internally. Company B remains dependent on external capital to sustain operations. Over time, investors reward this divergence because high gross margins create the operating leverage needed to convert revenue growth into earnings and cash flow growth.
The LTV to CAC Ratio: The Math of Scalable Growth
The customer lifetime value divided by customer acquisition cost, known as the LTV/CAC ratio, is one of the most revealing mathematical relationships in a growth business and one of the most consistently underused metrics for retail investors. LTV is the total net revenue a business expects to collect from a single customer over the entire duration of that customer relationship. CAC is the total sales and marketing cost required to acquire one new customer. The ratio between them indicates whether the business becomes more or less economically efficient as it grows.
The formula for LTV in a subscription or recurring revenue business is:
LTV = (Average Revenue Per Customer × Gross Margin Percentage) ÷ Customer Churn Rate.Suppose a software company charges $1,000 per year for its service, has a gross margin of 80%, and loses 10% of its customers each year. The lifetime value of a customer is:($1,000 × 0.80) ÷ 0.10 = $8,000The average customer generates about $8,000 in gross profit over their relationship with the company.Now assume the company spends $2,000 on sales and marketing to acquire each new customer. The LTV/CAC ratio is:$8,000 ÷ $2,000 = 4.0That means every dollar spent on customer acquisition eventually yields four dollars in gross profit.
An LTV/CAC ratio above 3 is healthy. Above 5 is excellent. A ratio below 2 is a warning sign because the company is spending too much to acquire customers relative to the value those customers provide. In that situation, growing faster does not necessarily create more value. It can simply magnify an already weak business model.
The best growth stocks often combine rapid customer acquisition with strong LTV/CAC ratios. Their customers stay for years, generate high margins, and produce far more profit than it costs to acquire them. That creates a self-reinforcing growth engine that becomes more valuable as the company scales.
The reason this metric matters to growth stock returns is specific. A business with a high LTV/CAC ratio gets more profitable per unit of growth capital deployed as it scales. Sales teams become more efficient as brand recognition grows and referral channels develop. Marketing costs per acquired customer fall as organic traffic increases. Product improvements reduce churn, raising LTV without increasing CAC. Each of these effects is mathematical and measurable, and together they produce the pattern you see in the financial statements of the best growth stocks: a rising LTV/CAC ratio over time, which translates into free cash flow margins expanding as the business grows rather than contracting. That expanding free cash flow margin drives the dual compounding of revenue growth and multiple expansion, producing the largest stock returns.
Most companies don't report LTV and CAC as explicit line items. Calculate them from what is disclosed. Gross margin is in the income statement. Churn can be estimated from net revenue retention figures when disclosed. CAC is approximated by dividing total sales and marketing expenses by the number of new customers added in the period. For companies that don't break out new customer counts, the ratio of sales and marketing expense growth to revenue growth is a useful proxy. When sales and marketing expenses grow more slowly than revenue over multiple consecutive quarters, the business is improving its CAC efficiency, a signal that the LTV/CAC ratio is expanding and unit economics are improving with scale.
Operating Leverage and the Profit Acceleration Effect
Operating leverage is the correlation between a company's fixed and variable costs, and it is the mechanism that causes profit growth to accelerate faster than revenue growth in well-structured businesses. A company with high operating leverage has a large proportion of its total costs fixed, meaning those costs don't increase in proportion to revenue. Once revenue exceeds the breakeven point at which fixed costs are covered, each additional dollar of revenue flows through to operating income at a very high rate.
The math is easier to see with numbers. A company has $300 million in revenue, $200 million in fixed operating costs, and variable costs equal to 15% of revenue. At $300 million in revenue, total costs are $200 million plus $45 million in variable costs, for $245 million, producing $55 million in operating income and an 18% operating margin. Revenue grew 30% to $390 million in year two. Fixed costs grew 8% to $216 million. Variable costs grew to $58.5 million. Total costs are $274.5 million. Operating income is now $115.5 million, a 30% operating margin. Revenue grew 30%, but operating income grew 110%. That acceleration in profit growth relative to revenue growth is operating leverage in action. When investors see this pattern emerge in a growth company's financial statements, the market often re-rates the stock at a higher multiple because the earnings power is now visibly larger than the revenue growth rate alone suggested.
The businesses with the strongest operating leverage are those in which the product or service can be delivered to additional customers at minimal incremental cost. Software is the most obvious example because the marginal cost of delivering software to one more customer is close to zero. Once the code is written and the infrastructure is provisioned, adding customers adds almost no cost. This is why software companies with strong revenue growth frequently show operating margins expanding from negative territory to 20%, 30%, even 40% over three to five years as scale kicks in. The fixed cost base is spread across a larger revenue base, and the resulting profit acceleration pushes the stock price higher even if the revenue growth rate stays constant.
As a growth stock investor, you can measure operating leverage directly by tracking the ratio of operating income growth to revenue growth over rolling four-quarter periods. When operating income consistently grows at two to three times the revenue growth rate, the business is exhibiting strong operating leverage, and the earnings compounding effect is in full force. You can also look at the trend in operating margins quarter by quarter. Expanding operating margins in a fast-growing company are the clearest visible signal that operating leverage is present and that the profit acceleration effect will continue as long as revenue growth holds.
Free Cash Flow Conversion: Where Returns Are Actually Made
Two companies can have identical revenue growth rates, identical gross margins, and identical reported earnings, but produce wildly different stock returns over a decade if their free cash flow conversion rates differ. The free cash flow conversion is the percentage of net income that converts into cash the business can use, return to shareholders, or reinvest without issuing new shares. The formula is free cash flow divided by net income. A ratio above 100% means the business is generating more cash than it reports in earnings, typically because of non-cash charges such as depreciation and stock-based compensation. A ratio well below 100% means the business requires significant reinvestment just to sustain its reported earnings, leaving less cash available for compounding.
This distinction matters enormously in practice. A capital-intensive business growing revenue at 30% per year might report strong earnings but require $2 of capital expenditure for every $3 of operating cash flow to maintain and expand its asset base. The actual free cash flow available to shareholders is a fraction of the reported net income. A capital-light business, typically software, consumer platforms, or asset-light services, growing revenue at the same 30% might generate free cash flow that exceeds net income because the business requires little reinvestment to sustain growth. Over ten years, the capital-light business compounds investor wealth at a dramatically faster rate, even when earnings growth looks identical on the surface.
Historically, winning growth stocks frequently shared a common characteristic: they converted much of their earnings into free cash flow and required relatively little incremental capital to support growth. Capital-light business models, particularly software, platforms, and asset-light service businesses, often produce some of the strongest long-term shareholder returns because a larger share of operating profits can be reinvested at attractive rates or returned to shareholders. Companies that require heavy ongoing capital investment often face a higher hurdle to create shareholder value because a significant portion of their cash flow has to be reinvested simply to sustain growth.
When evaluating a growth stock candidate, calculate free cash flow conversion over the trailing four quarters and compare it to the prior year. Rising free cash flow conversion alongside revenue growth confirms that the business is scaling efficiently and that reported earnings accurately reflect the economic value it is creating. Falling free cash flow conversion while earnings grow is a warning sign that the business is becoming more capital-intensive at scale, the opposite of what the best growth stocks exhibit. It is also worth checking capital expenditure as a percentage of revenue. For a software or platform business, capex above 10% of revenue warrants a closer look at whether the business model is as capital-light as the growth story implies.
The mathematics of great businesses, taken together, produces a compound picture that is more powerful than any single metric in isolation. High and rising ROIC confirms that the business creates value with every dollar of capital deployed. High gross margins create the architectural foundation for profit acceleration at scale. A strong LTV/CAC ratio confirms that the unit economics improve as the business grows. Operating leverage ensures profit growth outpaces revenue growth once scale is reached. High free cash flow conversion ensures that reported profits translate into actual cash available to compound. When all five of these mathematical characteristics are present and trending in the right direction, you are looking at the financial profile that has historically produced the largest growth stock returns in every market cycle. The stock price may not reflect it today. That gap is an opportunity.
Chapter Execution Checklist
Calculate ROIC for every growth stock candidate using the net operating profit after tax, divided by invested capital. Require a minimum of 15% and prioritize stocks with rising year-over-year ROIC. A company with ROIC expanding from 14% to 24% over three years is a stronger candidate than one sitting at a flat 20%, because rising ROIC signals that the business model produces better economics at scale, which is the mathematical signature of durable competitive advantage.Check the gross margin level and trend in every quarterly earnings report. Growth stocks in software and platform businesses require gross margins above 40% and look to expand by at least 1 percentage point per year. Run the two-company comparison exercise for any candidate with gross margins below 50%: project gross profit dollars at the current margin two years forward, using a realistic operating cost growth rate, to determine whether the business reaches profitability at the projected revenue base.Estimate the LTV/CAC ratio for any subscription or recurring revenue business using the formula (Average Revenue Per Customer x Gross Margin Percentage) divided by Churn Rate for LTV, and total sales and marketing expense divided by new customers added for CAC. A ratio above 3 is the minimum threshold. Track the ratio quarterly. Rising LTV/CAC over time confirms that the unit economics are improving with scale, which is the mathematical precondition for free cash flow margins expanding as revenue grows.Measure operating leverage by comparing operating income growth to revenue growth over rolling four-quarter periods. When operating income grows at 2 times or more the revenue growth rate, operating leverage is actively compressing the cost structure, and the profit acceleration effect is at work. Track the operating margin trend quarter by quarter. Expanding operating margins in a fast-growing company are the clearest visible confirmation that the profit acceleration effect will continue.You can calculate the free cash flow conversion as free cash flow divided by the net income over the previous trailing four quarters. Require a ratio above 80% for any capital-light business model. Check capital expenditure as a percentage of revenue and flag any software or platform company where capex exceeds 10% of revenue for closer examination of whether the business is as capital-light as the growth narrative implies.Score each growth stock candidate against all five mathematical characteristics: ROIC above 15% and rising, gross margins above 40% and expanding, LTV/CAC above 3 and rising, operating income growing at twice the revenue growth rate, and free cash flow conversion above 80%. A stock scoring four or five out of five deserves serious position sizing consideration. A stock scoring two or fewer, regardless of how fast revenue is growing, has not yet demonstrated the business quality mathematics that historically predict large, sustained stock returns.Re-run the five-metric scorecard on every open position at each quarterly earnings report. A single metric moving in the wrong direction is a yellow flag worth monitoring. Two metrics deteriorating simultaneously are a red flag that the business quality mathematics are weakening, and the position size should be reduced before the deterioration shows up fully in the revenue growth rate or the stock price.
For the rest of the content in this book, pick up a copy in paperback, Kindle, or Audible through the Amazon U.S. link here: How To Pick Growth Stocks Like A Mathematician: Using Logic, Probability, and Data to Find the Next Big Stock Market Winners
Or check Amazon in your own country for availability.
#BinanceRestores28FiatWithdrawals #BinanceProcesses$4.65BWithdrawals #BitcoinClosesAbove50WeekMAFor7thStraightWeek #ETHFalls16.1%InOctober #BitcoinClosesAbove50WeekMAFor7thStraightWeek
BQS = (ROIC/15) + (Gross Margin/40) + (LTV/CAC/3) + (Operating Income Growth/Revenue Growth) + (FCF/Net Income)
BQS = Business Quality ScoreROIC = Return on Invested Capital divided by 15 (your minimum ROIC threshold)Gross Margin divided by 40 (your minimum gross margin threshold)LTV/CAC divided by 3 (your minimum LTV/CAC threshold)Operating Income Growth divided by Revenue Growth (the operating leverage ratio)Free Cash Flow divided by Net Income (the free cash flow conversion rate)
ROIC is divided by 15, Gross Margin by 40, and LTV/CAC by 3 because these represent baseline quality thresholds. Operating Income Growth is divided by Revenue Growth to measure operating leverage, while Free Cash Flow is divided by Net Income to measure earnings quality and cash conversion.
Each component is normalized so that a company meeting the baseline threshold contributes approximately 1.0 point to the total score. A company meeting all baseline thresholds scores roughly 5.0, while businesses that exceed those thresholds score progressively higher. The composite score provides a quick snapshot of how far above baseline quality a company ranks across capital efficiency, profitability, unit economics, operating leverage, and cash generation.
This formula does not predict stock returns. Instead, it measures five characteristics commonly present in many of history's most successful businesses: capital efficiency, pricing power, customer economics, operating leverage, and cash-flow quality. Build on this framework by considering how these characteristics influence long-term performance.
Revenue growth alone rarely delivers extraordinary long-term shareholder returns. Businesses that compound value for years typically combine rapid growth with high returns on capital, expanding profit margins, improving unit economics, and increasing cash generation. A rising score may signal that a company is strengthening its economic engine as it scales, though future stock returns will also depend on valuation, competition, industry dynamics, and execution.
Stock prices follow earnings and free cash flow. That sentence sounds simple, but the math behind it explains nearly everything about why the best growth stocks in history produced the returns they did. The previous chapter explained what power-law returns look like from the outside and which financial signals predict them. This chapter goes inside the business itself, to the specific mathematical relationships between revenues, costs, capital, and cash that determine whether a fast-growing company will eventually produce extraordinary shareholder returns or merely decent ones. These are not qualitative judgments about management quality or brand strength. They are measurable numbers, and learning to read them correctly is one of the most valuable skills a growth stock investor can develop.
Return on Invested Capital: The Master Metric
Return on invested capital (ROIC) is the percentage return a business generates on the total capital it has invested in its operations. The formula is straightforward: ROIC = Net Operating Profit After Tax divided by Invested Capital. Invested capital is the sum of equity and interest-bearing debt minus non-operating cash. The result tells you how many cents of after-tax operating profit the business generates for every dollar of capital it has put to work.
Why does this number matter so much to stock returns? Because a business that earns a high ROIC and can reinvest its profits at that same high rate compounds its intrinsic value, the stock price eventually follows. A company earning 30% ROIC that reinvests 80% of its profits back into growth is compounding the economic value of the business at roughly 24% per year before any external financing. Over ten years, every dollar of invested capital becomes roughly $8.60 in economic value at that rate. The stock price doesn't always track this in real time, but over full business cycles it does, and the gap between the current price and compounding intrinsic value is where the long-term return comes from.
The comparison between high-ROIC and low-ROIC businesses over time is stark. Academic research on U.S. public companies going back to the 1960s consistently shows that companies sustaining ROIC above 20% for five years or more generate stock returns that outperform the broader market by a wide margin, while companies with ROIC below the cost of capital destroy shareholder value regardless of how fast their revenue grows. Revenue growth without high ROIC is growth that requires constant external capital to sustain itself, diluting existing shareholders and limiting compounding. Revenue growth with high ROIC is self-funding, meaning the business becomes more valuable with each passing year without issuing new shares or taking on debt.
In practice, you want to see ROIC above 15% as a minimum threshold for any growth stock candidate, and the trend matters as much as the level. A company with ROIC rising from 12% to 22% over three years is a better signal than one sitting at a flat 25%, because rising ROIC shows the business model is producing better economics at scale, which is the mathematical model of a business with genuine competitive advantages. Falling ROIC while revenue grows fast is a serious warning sign. It means the business is deploying increasing amounts of capital to generate each additional dollar of profit, which is the opposite of what you want and a reliable predictor of disappointing long-term stock returns, even when the near-term growth story looks exciting.
Gross Margin and the Architecture of Competitive Advantage
Gross margin is revenue minus the direct cost of producing or delivering the product or service, expressed as a percentage of revenue. For a software company, the direct costs are primarily server infrastructure and customer support. For a pharmaceutical company, it is manufacturing and distribution. For a consumer products company, it is materials and production. The higher the gross margin, the more of each revenue dollar flows down to cover operating expenses and eventually becomes profit.
The mathematical significance of gross margin goes well beyond its face value as a profitability metric. High gross margins create a structural advantage in the economics of scaling. A company with 75% gross margins that grows revenue by $100 million adds $75 million to its gross profit pool. A company with 35% gross margins, growing revenue by the same $100 million, adds only $35 million. Both companies face similar levels of fixed operating costs in sales, marketing, research, and administration. The high-margin company can absorb those costs and reach profitability at a much lower revenue level, and once profitable, each additional dollar of revenue produces far more incremental operating income than the low-margin competitor.
The best-performing software growth stocks of the 2010s and early 2020s that ultimately produced 500% to 2,000% returns had gross margins above 65% when their major advances began. High gross margins were common because they enabled operating leverage, strong cash generation, and scalable growth, though there were exceptions. The gross margin provided the mathematical architecture for operating leverage to kick in as the business scaled, converting revenue growth into earnings growth at an accelerating rate. That acceleration in earnings growth drove the multiple expansion, multiplying stock returns beyond what revenue growth alone would have produced.
Here is a concrete example that makes this clear. Company A has $200 million in revenue, growing at 35% per year, with a 72% gross margin and $180 million in operating expenses. It is currently running at a small operating loss. Company B has $200 million in revenue, growing at 35% per year, with a 38% gross margin and $180 million in operating expenses. It is also running at a loss.
Fast forward two years. Both companies have grown revenue to approximately $365 million. Company A's 72% gross margin produces about $262 million in gross profit. If operating expenses grow at 11% annually, they rise to approximately $222 million. Operating income is now about $41 million, resulting in an operating margin of roughly 11%.
Company B also reaches $365 million in revenue. However, its 38% gross margin generates only about $139 million in gross profits. Against the same $222 million in operating expenses, the company is still losing roughly $83 million per year.
The two businesses started with the same revenue, the same growth rate, and the same operating expense structure. The difference was the gross margin. In just two years, Company A has crossed into profitability and can begin funding more of its growth internally. Company B remains dependent on external capital to sustain operations. Over time, investors reward this divergence because high gross margins create the operating leverage needed to convert revenue growth into earnings and cash flow growth.
The LTV to CAC Ratio: The Math of Scalable Growth
The customer lifetime value divided by customer acquisition cost, known as the LTV/CAC ratio, is one of the most revealing mathematical relationships in a growth business and one of the most consistently underused metrics for retail investors. LTV is the total net revenue a business expects to collect from a single customer over the entire duration of that customer relationship. CAC is the total sales and marketing cost required to acquire one new customer. The ratio between them indicates whether the business becomes more or less economically efficient as it grows.
The formula for LTV in a subscription or recurring revenue business is:
LTV = (Average Revenue Per Customer × Gross Margin Percentage) ÷ Customer Churn Rate.Suppose a software company charges $1,000 per year for its service, has a gross margin of 80%, and loses 10% of its customers each year. The lifetime value of a customer is:($1,000 × 0.80) ÷ 0.10 = $8,000The average customer generates about $8,000 in gross profit over their relationship with the company.Now assume the company spends $2,000 on sales and marketing to acquire each new customer. The LTV/CAC ratio is:$8,000 ÷ $2,000 = 4.0That means every dollar spent on customer acquisition eventually yields four dollars in gross profit.
An LTV/CAC ratio above 3 is healthy. Above 5 is excellent. A ratio below 2 is a warning sign because the company is spending too much to acquire customers relative to the value those customers provide. In that situation, growing faster does not necessarily create more value. It can simply magnify an already weak business model.
The best growth stocks often combine rapid customer acquisition with strong LTV/CAC ratios. Their customers stay for years, generate high margins, and produce far more profit than it costs to acquire them. That creates a self-reinforcing growth engine that becomes more valuable as the company scales.
The reason this metric matters to growth stock returns is specific. A business with a high LTV/CAC ratio gets more profitable per unit of growth capital deployed as it scales. Sales teams become more efficient as brand recognition grows and referral channels develop. Marketing costs per acquired customer fall as organic traffic increases. Product improvements reduce churn, raising LTV without increasing CAC. Each of these effects is mathematical and measurable, and together they produce the pattern you see in the financial statements of the best growth stocks: a rising LTV/CAC ratio over time, which translates into free cash flow margins expanding as the business grows rather than contracting. That expanding free cash flow margin drives the dual compounding of revenue growth and multiple expansion, producing the largest stock returns.
Most companies don't report LTV and CAC as explicit line items. Calculate them from what is disclosed. Gross margin is in the income statement. Churn can be estimated from net revenue retention figures when disclosed. CAC is approximated by dividing total sales and marketing expenses by the number of new customers added in the period. For companies that don't break out new customer counts, the ratio of sales and marketing expense growth to revenue growth is a useful proxy. When sales and marketing expenses grow more slowly than revenue over multiple consecutive quarters, the business is improving its CAC efficiency, a signal that the LTV/CAC ratio is expanding and unit economics are improving with scale.
Operating Leverage and the Profit Acceleration Effect
Operating leverage is the correlation between a company's fixed and variable costs, and it is the mechanism that causes profit growth to accelerate faster than revenue growth in well-structured businesses. A company with high operating leverage has a large proportion of its total costs fixed, meaning those costs don't increase in proportion to revenue. Once revenue exceeds the breakeven point at which fixed costs are covered, each additional dollar of revenue flows through to operating income at a very high rate.
The math is easier to see with numbers. A company has $300 million in revenue, $200 million in fixed operating costs, and variable costs equal to 15% of revenue. At $300 million in revenue, total costs are $200 million plus $45 million in variable costs, for $245 million, producing $55 million in operating income and an 18% operating margin. Revenue grew 30% to $390 million in year two. Fixed costs grew 8% to $216 million. Variable costs grew to $58.5 million. Total costs are $274.5 million. Operating income is now $115.5 million, a 30% operating margin. Revenue grew 30%, but operating income grew 110%. That acceleration in profit growth relative to revenue growth is operating leverage in action. When investors see this pattern emerge in a growth company's financial statements, the market often re-rates the stock at a higher multiple because the earnings power is now visibly larger than the revenue growth rate alone suggested.
The businesses with the strongest operating leverage are those in which the product or service can be delivered to additional customers at minimal incremental cost. Software is the most obvious example because the marginal cost of delivering software to one more customer is close to zero. Once the code is written and the infrastructure is provisioned, adding customers adds almost no cost. This is why software companies with strong revenue growth frequently show operating margins expanding from negative territory to 20%, 30%, even 40% over three to five years as scale kicks in. The fixed cost base is spread across a larger revenue base, and the resulting profit acceleration pushes the stock price higher even if the revenue growth rate stays constant.
As a growth stock investor, you can measure operating leverage directly by tracking the ratio of operating income growth to revenue growth over rolling four-quarter periods. When operating income consistently grows at two to three times the revenue growth rate, the business is exhibiting strong operating leverage, and the earnings compounding effect is in full force. You can also look at the trend in operating margins quarter by quarter. Expanding operating margins in a fast-growing company are the clearest visible signal that operating leverage is present and that the profit acceleration effect will continue as long as revenue growth holds.
Free Cash Flow Conversion: Where Returns Are Actually Made
Two companies can have identical revenue growth rates, identical gross margins, and identical reported earnings, but produce wildly different stock returns over a decade if their free cash flow conversion rates differ. The free cash flow conversion is the percentage of net income that converts into cash the business can use, return to shareholders, or reinvest without issuing new shares. The formula is free cash flow divided by net income. A ratio above 100% means the business is generating more cash than it reports in earnings, typically because of non-cash charges such as depreciation and stock-based compensation. A ratio well below 100% means the business requires significant reinvestment just to sustain its reported earnings, leaving less cash available for compounding.
This distinction matters enormously in practice. A capital-intensive business growing revenue at 30% per year might report strong earnings but require $2 of capital expenditure for every $3 of operating cash flow to maintain and expand its asset base. The actual free cash flow available to shareholders is a fraction of the reported net income. A capital-light business, typically software, consumer platforms, or asset-light services, growing revenue at the same 30% might generate free cash flow that exceeds net income because the business requires little reinvestment to sustain growth. Over ten years, the capital-light business compounds investor wealth at a dramatically faster rate, even when earnings growth looks identical on the surface.
Historically, winning growth stocks frequently shared a common characteristic: they converted much of their earnings into free cash flow and required relatively little incremental capital to support growth. Capital-light business models, particularly software, platforms, and asset-light service businesses, often produce some of the strongest long-term shareholder returns because a larger share of operating profits can be reinvested at attractive rates or returned to shareholders. Companies that require heavy ongoing capital investment often face a higher hurdle to create shareholder value because a significant portion of their cash flow has to be reinvested simply to sustain growth.
When evaluating a growth stock candidate, calculate free cash flow conversion over the trailing four quarters and compare it to the prior year. Rising free cash flow conversion alongside revenue growth confirms that the business is scaling efficiently and that reported earnings accurately reflect the economic value it is creating. Falling free cash flow conversion while earnings grow is a warning sign that the business is becoming more capital-intensive at scale, the opposite of what the best growth stocks exhibit. It is also worth checking capital expenditure as a percentage of revenue. For a software or platform business, capex above 10% of revenue warrants a closer look at whether the business model is as capital-light as the growth story implies.
The mathematics of great businesses, taken together, produces a compound picture that is more powerful than any single metric in isolation. High and rising ROIC confirms that the business creates value with every dollar of capital deployed. High gross margins create the architectural foundation for profit acceleration at scale. A strong LTV/CAC ratio confirms that the unit economics improve as the business grows. Operating leverage ensures profit growth outpaces revenue growth once scale is reached. High free cash flow conversion ensures that reported profits translate into actual cash available to compound. When all five of these mathematical characteristics are present and trending in the right direction, you are looking at the financial profile that has historically produced the largest growth stock returns in every market cycle. The stock price may not reflect it today. That gap is an opportunity.
Chapter Execution Checklist
Calculate ROIC for every growth stock candidate using the net operating profit after tax, divided by invested capital. Require a minimum of 15% and prioritize stocks with rising year-over-year ROIC. A company with ROIC expanding from 14% to 24% over three years is a stronger candidate than one sitting at a flat 20%, because rising ROIC signals that the business model produces better economics at scale, which is the mathematical signature of durable competitive advantage.Check the gross margin level and trend in every quarterly earnings report. Growth stocks in software and platform businesses require gross margins above 40% and look to expand by at least 1 percentage point per year. Run the two-company comparison exercise for any candidate with gross margins below 50%: project gross profit dollars at the current margin two years forward, using a realistic operating cost growth rate, to determine whether the business reaches profitability at the projected revenue base.Estimate the LTV/CAC ratio for any subscription or recurring revenue business using the formula (Average Revenue Per Customer x Gross Margin Percentage) divided by Churn Rate for LTV, and total sales and marketing expense divided by new customers added for CAC. A ratio above 3 is the minimum threshold. Track the ratio quarterly. Rising LTV/CAC over time confirms that the unit economics are improving with scale, which is the mathematical precondition for free cash flow margins expanding as revenue grows.Measure operating leverage by comparing operating income growth to revenue growth over rolling four-quarter periods. When operating income grows at 2 times or more the revenue growth rate, operating leverage is actively compressing the cost structure, and the profit acceleration effect is at work. Track the operating margin trend quarter by quarter. Expanding operating margins in a fast-growing company are the clearest visible confirmation that the profit acceleration effect will continue.You can calculate the free cash flow conversion as free cash flow divided by the net income over the previous trailing four quarters. Require a ratio above 80% for any capital-light business model. Check capital expenditure as a percentage of revenue and flag any software or platform company where capex exceeds 10% of revenue for closer examination of whether the business is as capital-light as the growth narrative implies.Score each growth stock candidate against all five mathematical characteristics: ROIC above 15% and rising, gross margins above 40% and expanding, LTV/CAC above 3 and rising, operating income growing at twice the revenue growth rate, and free cash flow conversion above 80%. A stock scoring four or five out of five deserves serious position sizing consideration. A stock scoring two or fewer, regardless of how fast revenue is growing, has not yet demonstrated the business quality mathematics that historically predict large, sustained stock returns.Re-run the five-metric scorecard on every open position at each quarterly earnings report. A single metric moving in the wrong direction is a yellow flag worth monitoring. Two metrics deteriorating simultaneously are a red flag that the business quality mathematics are weakening, and the position size should be reduced before the deterioration shows up fully in the revenue growth rate or the stock price.
For the rest of the content in this book, pick up a copy in paperback, Kindle, or Audible through the Amazon U.S. link here: How To Pick Growth Stocks Like A Mathematician: Using Logic, Probability, and Data to Find the Next Big Stock Market Winners
Or check Amazon in your own country for availability.
#BinanceRestores28FiatWithdrawals #BinanceProcesses$4.65BWithdrawals #BitcoinClosesAbove50WeekMAFor7thStraightWeek #ETHFalls16.1%InOctober #BitcoinClosesAbove50WeekMAFor7thStraightWeek
1
1
84
·
--
$HYPE /USDT just broke today's opening level and printed two solid red candles on the 15m chart. Looking at its overall price action over the last few days, I'm expecting a clean drop from here. Good setup for a short position if anyone wants to take it.
#hype #BinanceToResumePhaseOneOfWithdrawals #IntelHasItsWorstDaySince1974 #BinanceUpdatesProofofReservesAddresses #B14gReportsUnauthorizedTransferOfAbout97MCORE
$HYPE /USDT just broke today's opening level and printed two solid red candles on the 15m chart. Looking at its overall price action over the last few days, I'm expecting a clean drop from here. Good setup for a short position if anyone wants to take it.
#hype #BinanceToResumePhaseOneOfWithdrawals #IntelHasItsWorstDaySince1974 #BinanceUpdatesProofofReservesAddresses #B14gReportsUnauthorizedTransferOfAbout97MCORE
#hype #BinanceToResumePhaseOneOfWithdrawals #IntelHasItsWorstDaySince1974 #BinanceUpdatesProofofReservesAddresses #B14gReportsUnauthorizedTransferOfAbout97MCORE
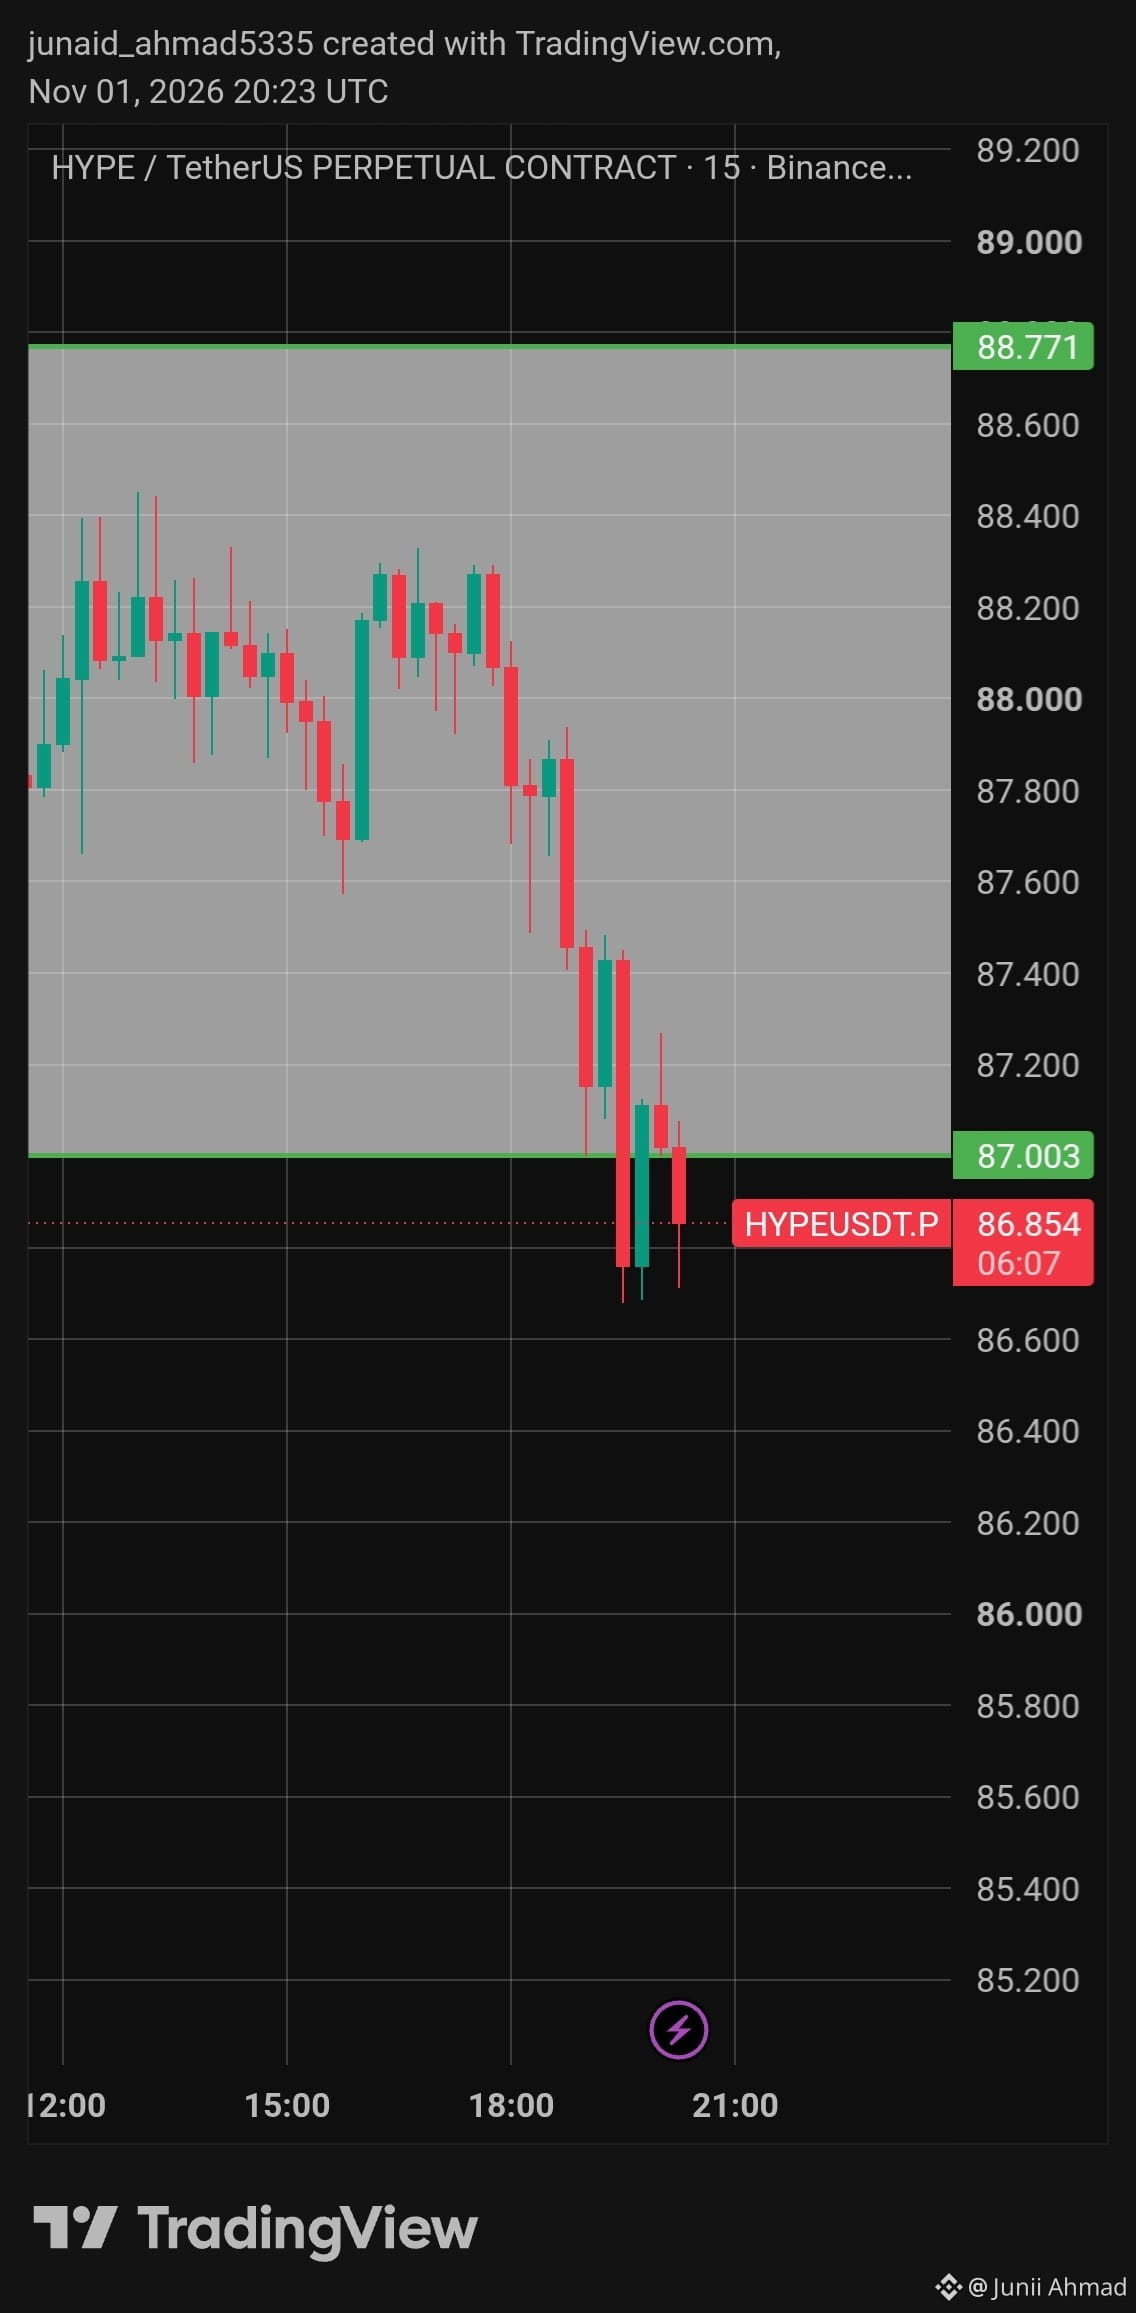
1
2
420
·
--

Article
10 Books Upper-Class People Read That Middle-Class and Working-Class People Almost Never OpenThe title is intentionally provocative. Reading habits do not cleanly sort people by income, and anybody can pick up a difficult book at a library, bookstore, or on a phone.
Yet certain titles keep turning up in conversations among investors, founders, executives, and people who manage money. They deal with incentives, capital, judgment, history, and power. They ask more of a reader than a quick lesson on saving money or chasing motivation. That is why they are worth opening, reading, rereading, and discussing with people who are aspiring to higher levels of success.
1. Poor Charlie’s Almanac about Charlie Munger
Charlie Munger did not sell the comforting idea that one habit fixes a life. His speeches push the reader toward mental models drawn from economics, psychology, biology, mathematics, and history. He wanted people to see a business decision from several angles before betting real money on it.
The book is big, expensive in some editions, and occasionally dry. It also refuses to hand over a fast formula. Munger’s central point lands harder after a few bad decisions: stupidity often costs more than a lack of brilliance in business and life.
2. The Intelligent Investor by Benjamin Graham
Benjamin Graham wrote for investors who want to manage their emotions in the market. He separates investment from speculation and insists on a margin of safety, meaning a buyer should leave room for error when valuing a business or security.
Warren Buffett has long credited Graham as a major influence. The reader will find old examples, dense passages, and little entertainment. In return, the book teaches a useful habit: ask what an asset is worth before getting carried away by what people say it should be worth.
3. Principles: Life and Work by Ray Dalio
Ray Dalio built Principles around a simple workplace problem. Smart people still make expensive errors when a company hides bad news, protects egos, or treats disagreement as disloyalty.
His answer is a written set of decision rules and a culture of direct feedback. Some readers will dislike the intensity of that approach. Others will recognize a hard truth in it: vague standards make it easier to repeat the same mistake while calling it experience.
4. The Wealth of Nations by Adam Smith
Adam Smith’s 1776 work asks how trade, specialization, and self-interest shape economic life. It is a long book written in eighteenth-century language, so it asks for more effort than a modern economics podcast.
Its ideas still matter. Smith explains why specialization can raise output and why rules around trade and competition affect ordinary people as well as merchants. Reading even selected sections gives a person more to work with than catchphrases about capitalism.
5. Meditations by Marcus Aurelius
Meditations was never intended as a polished self-help book. It is the private writing of a Roman emperor trying to keep his temper, duties, and fears under control while public problems pressed in on him.
That makes it useful for anyone in a position of responsibility. Marcus Aurelius returns again and again to this: do the work in front of you, avoid drama, and stop handing your peace of mind over to events you can’t control. The advice is plain. Living it is another matter.
6. Thinking, Fast and Slow by Daniel Kahneman
Daniel Kahneman examines how people judge risk, make guesses, and tell themselves stories from incomplete information. He covers familiar traps such as anchoring, overconfidence, loss aversion, and hindsight bias.
A trader can see these errors in a losing position. A business owner can see them in a hiring decision. The book does not turn anyone into a flawless thinker. It does make it harder to pretend that an immediate opinion is arrived at by pure logic.
7. The Innovator’s Dilemma by Clayton M. Christensen
Clayton Christensen looked at a frustrating pattern in business. Well-run companies can lose their lead because they keep serving their best current customers while a smaller rival develops a product that first looks inferior or unimportant.
That idea matters to executives and investors because success can narrow attention. A company with strong sales, polished products, and satisfied customers can still miss a shift in the market. Past wins do not buy permanent protection.
8. The Art of War by Sun Tzu
Sun Tzu’s military text is often misquoted in business circles. It is not a handbook for acting ruthlessly at work or turning every disagreement into a battle.
Read carefully; it argues for preparation, information, timing, and restraint. Winning without wasting resources is better than a loud fight. That point applies to negotiation, competition, investing, and even the decision to walk away from a bad deal.
9. Superintelligence: Paths, Dangers, Strategies by Nick Bostrom
Nick Bostrom looks far past the next software update. He considers what could happen if artificial intelligence becomes far more capable than humans and its goals do not align with human interests.
The subject can feel remote. So did many technologies before they became part of daily life. The book earns attention by forcing readers to think about second-order effects, concentrated power, and the cost of waiting until a problem becomes obvious.
10. Sapiens: A Brief History of Humankind by Yuval Noah Harari
Yuval Noah Harari takes a wide view of human history and asks why large groups cooperate with strangers. His answer places significant weight on shared beliefs such as money, law, religion, corporations, and nations.
Readers should treat broad history with healthy skepticism and seek other sources when a claim interests them. Even so, the book usefully shakes loose an assumption many people carry: that institutions feel permanent, when they are often human agreements that have changed before and can change again.
Conclusion
None of these books is a secret path to wealth. A rich person can ignore them, while someone on a tight budget can read every one and apply the ideas well.
The path to success requires a serious effort to understand and implement what they teach. These writers deal with errors, incentives, power, and time. Read one slowly, argue with it, and keep the parts that improve your decisions.
#BinanceUpdatesProofofReservesAddresses #BinanceToResumePhaseOneOfWithdrawals #FBIConfirmsNorthKoreaIsResponsibleForBinanceCryptoHack #CZDismissesClaimsBinanceHackWasPredicted #IntelHasItsWorstDaySince1974
10 Books Upper-Class People Read That Middle-Class and Working-Class People Almost Never Open
The title is intentionally provocative. Reading habits do not cleanly sort people by income, and anybody can pick up a difficult book at a library, bookstore, or on a phone.
Yet certain titles keep turning up in conversations among investors, founders, executives, and people who manage money. They deal with incentives, capital, judgment, history, and power. They ask more of a reader than a quick lesson on saving money or chasing motivation. That is why they are worth opening, reading, rereading, and discussing with people who are aspiring to higher levels of success.
1. Poor Charlie’s Almanac about Charlie Munger
Charlie Munger did not sell the comforting idea that one habit fixes a life. His speeches push the reader toward mental models drawn from economics, psychology, biology, mathematics, and history. He wanted people to see a business decision from several angles before betting real money on it.
The book is big, expensive in some editions, and occasionally dry. It also refuses to hand over a fast formula. Munger’s central point lands harder after a few bad decisions: stupidity often costs more than a lack of brilliance in business and life.
2. The Intelligent Investor by Benjamin Graham
Benjamin Graham wrote for investors who want to manage their emotions in the market. He separates investment from speculation and insists on a margin of safety, meaning a buyer should leave room for error when valuing a business or security.
Warren Buffett has long credited Graham as a major influence. The reader will find old examples, dense passages, and little entertainment. In return, the book teaches a useful habit: ask what an asset is worth before getting carried away by what people say it should be worth.
3. Principles: Life and Work by Ray Dalio
Ray Dalio built Principles around a simple workplace problem. Smart people still make expensive errors when a company hides bad news, protects egos, or treats disagreement as disloyalty.
His answer is a written set of decision rules and a culture of direct feedback. Some readers will dislike the intensity of that approach. Others will recognize a hard truth in it: vague standards make it easier to repeat the same mistake while calling it experience.
4. The Wealth of Nations by Adam Smith
Adam Smith’s 1776 work asks how trade, specialization, and self-interest shape economic life. It is a long book written in eighteenth-century language, so it asks for more effort than a modern economics podcast.
Its ideas still matter. Smith explains why specialization can raise output and why rules around trade and competition affect ordinary people as well as merchants. Reading even selected sections gives a person more to work with than catchphrases about capitalism.
5. Meditations by Marcus Aurelius
Meditations was never intended as a polished self-help book. It is the private writing of a Roman emperor trying to keep his temper, duties, and fears under control while public problems pressed in on him.
That makes it useful for anyone in a position of responsibility. Marcus Aurelius returns again and again to this: do the work in front of you, avoid drama, and stop handing your peace of mind over to events you can’t control. The advice is plain. Living it is another matter.
6. Thinking, Fast and Slow by Daniel Kahneman
Daniel Kahneman examines how people judge risk, make guesses, and tell themselves stories from incomplete information. He covers familiar traps such as anchoring, overconfidence, loss aversion, and hindsight bias.
A trader can see these errors in a losing position. A business owner can see them in a hiring decision. The book does not turn anyone into a flawless thinker. It does make it harder to pretend that an immediate opinion is arrived at by pure logic.
7. The Innovator’s Dilemma by Clayton M. Christensen
Clayton Christensen looked at a frustrating pattern in business. Well-run companies can lose their lead because they keep serving their best current customers while a smaller rival develops a product that first looks inferior or unimportant.
That idea matters to executives and investors because success can narrow attention. A company with strong sales, polished products, and satisfied customers can still miss a shift in the market. Past wins do not buy permanent protection.
8. The Art of War by Sun Tzu
Sun Tzu’s military text is often misquoted in business circles. It is not a handbook for acting ruthlessly at work or turning every disagreement into a battle.
Read carefully; it argues for preparation, information, timing, and restraint. Winning without wasting resources is better than a loud fight. That point applies to negotiation, competition, investing, and even the decision to walk away from a bad deal.
9. Superintelligence: Paths, Dangers, Strategies by Nick Bostrom
Nick Bostrom looks far past the next software update. He considers what could happen if artificial intelligence becomes far more capable than humans and its goals do not align with human interests.
The subject can feel remote. So did many technologies before they became part of daily life. The book earns attention by forcing readers to think about second-order effects, concentrated power, and the cost of waiting until a problem becomes obvious.
10. Sapiens: A Brief History of Humankind by Yuval Noah Harari
Yuval Noah Harari takes a wide view of human history and asks why large groups cooperate with strangers. His answer places significant weight on shared beliefs such as money, law, religion, corporations, and nations.
Readers should treat broad history with healthy skepticism and seek other sources when a claim interests them. Even so, the book usefully shakes loose an assumption many people carry: that institutions feel permanent, when they are often human agreements that have changed before and can change again.
Conclusion
None of these books is a secret path to wealth. A rich person can ignore them, while someone on a tight budget can read every one and apply the ideas well.
The path to success requires a serious effort to understand and implement what they teach. These writers deal with errors, incentives, power, and time. Read one slowly, argue with it, and keep the parts that improve your decisions.
#BinanceUpdatesProofofReservesAddresses #BinanceToResumePhaseOneOfWithdrawals #FBIConfirmsNorthKoreaIsResponsibleForBinanceCryptoHack #CZDismissesClaimsBinanceHackWasPredicted #IntelHasItsWorstDaySince1974
Yet certain titles keep turning up in conversations among investors, founders, executives, and people who manage money. They deal with incentives, capital, judgment, history, and power. They ask more of a reader than a quick lesson on saving money or chasing motivation. That is why they are worth opening, reading, rereading, and discussing with people who are aspiring to higher levels of success.
1. Poor Charlie’s Almanac about Charlie Munger
Charlie Munger did not sell the comforting idea that one habit fixes a life. His speeches push the reader toward mental models drawn from economics, psychology, biology, mathematics, and history. He wanted people to see a business decision from several angles before betting real money on it.
The book is big, expensive in some editions, and occasionally dry. It also refuses to hand over a fast formula. Munger’s central point lands harder after a few bad decisions: stupidity often costs more than a lack of brilliance in business and life.
2. The Intelligent Investor by Benjamin Graham
Benjamin Graham wrote for investors who want to manage their emotions in the market. He separates investment from speculation and insists on a margin of safety, meaning a buyer should leave room for error when valuing a business or security.
Warren Buffett has long credited Graham as a major influence. The reader will find old examples, dense passages, and little entertainment. In return, the book teaches a useful habit: ask what an asset is worth before getting carried away by what people say it should be worth.
3. Principles: Life and Work by Ray Dalio
Ray Dalio built Principles around a simple workplace problem. Smart people still make expensive errors when a company hides bad news, protects egos, or treats disagreement as disloyalty.
His answer is a written set of decision rules and a culture of direct feedback. Some readers will dislike the intensity of that approach. Others will recognize a hard truth in it: vague standards make it easier to repeat the same mistake while calling it experience.
4. The Wealth of Nations by Adam Smith
Adam Smith’s 1776 work asks how trade, specialization, and self-interest shape economic life. It is a long book written in eighteenth-century language, so it asks for more effort than a modern economics podcast.
Its ideas still matter. Smith explains why specialization can raise output and why rules around trade and competition affect ordinary people as well as merchants. Reading even selected sections gives a person more to work with than catchphrases about capitalism.
5. Meditations by Marcus Aurelius
Meditations was never intended as a polished self-help book. It is the private writing of a Roman emperor trying to keep his temper, duties, and fears under control while public problems pressed in on him.
That makes it useful for anyone in a position of responsibility. Marcus Aurelius returns again and again to this: do the work in front of you, avoid drama, and stop handing your peace of mind over to events you can’t control. The advice is plain. Living it is another matter.
6. Thinking, Fast and Slow by Daniel Kahneman
Daniel Kahneman examines how people judge risk, make guesses, and tell themselves stories from incomplete information. He covers familiar traps such as anchoring, overconfidence, loss aversion, and hindsight bias.
A trader can see these errors in a losing position. A business owner can see them in a hiring decision. The book does not turn anyone into a flawless thinker. It does make it harder to pretend that an immediate opinion is arrived at by pure logic.
7. The Innovator’s Dilemma by Clayton M. Christensen
Clayton Christensen looked at a frustrating pattern in business. Well-run companies can lose their lead because they keep serving their best current customers while a smaller rival develops a product that first looks inferior or unimportant.
That idea matters to executives and investors because success can narrow attention. A company with strong sales, polished products, and satisfied customers can still miss a shift in the market. Past wins do not buy permanent protection.
8. The Art of War by Sun Tzu
Sun Tzu’s military text is often misquoted in business circles. It is not a handbook for acting ruthlessly at work or turning every disagreement into a battle.
Read carefully; it argues for preparation, information, timing, and restraint. Winning without wasting resources is better than a loud fight. That point applies to negotiation, competition, investing, and even the decision to walk away from a bad deal.
9. Superintelligence: Paths, Dangers, Strategies by Nick Bostrom
Nick Bostrom looks far past the next software update. He considers what could happen if artificial intelligence becomes far more capable than humans and its goals do not align with human interests.
The subject can feel remote. So did many technologies before they became part of daily life. The book earns attention by forcing readers to think about second-order effects, concentrated power, and the cost of waiting until a problem becomes obvious.
10. Sapiens: A Brief History of Humankind by Yuval Noah Harari
Yuval Noah Harari takes a wide view of human history and asks why large groups cooperate with strangers. His answer places significant weight on shared beliefs such as money, law, religion, corporations, and nations.
Readers should treat broad history with healthy skepticism and seek other sources when a claim interests them. Even so, the book usefully shakes loose an assumption many people carry: that institutions feel permanent, when they are often human agreements that have changed before and can change again.
Conclusion
None of these books is a secret path to wealth. A rich person can ignore them, while someone on a tight budget can read every one and apply the ideas well.
The path to success requires a serious effort to understand and implement what they teach. These writers deal with errors, incentives, power, and time. Read one slowly, argue with it, and keep the parts that improve your decisions.
#BinanceUpdatesProofofReservesAddresses #BinanceToResumePhaseOneOfWithdrawals #FBIConfirmsNorthKoreaIsResponsibleForBinanceCryptoHack #CZDismissesClaimsBinanceHackWasPredicted #IntelHasItsWorstDaySince1974
2
364
·
--
Article
Top 10 Paul Tudor Jones Price Action Trading Quotes@Junaid_Ahmad1
Paul Tudor Jones is one of the greatest traders and money managers of his generation. He has had no losing years in his primary fund for decades. He more than doubled his capital under management during the Black Monday Crash of 1987, while others faced huge drawdowns and account blow-ups. He is ranked the 477th-richest person on Forbes. His net worth is around $8.1 billion and growing. Here is a guy that traders of all levels need to listen to what he has to say about trading.
“There is no training, classroom or otherwise, that can prepare for trading the last third of a move, whether it's the end of a bull market or the end of a bear market.” - Paul Tudor Jones
Volatility expands at the end of one trend and the beginning of another; what was working stops working, and the key to profitable trading changes.
“The most important rule is to play great defense, not great offense. Everyday I assume every position I have is wrong. I know where my stop risk points are going to be. I do that so I can define my maximum drawdown. Hopefully, I spend the rest of the day enjoying positions that are going in my direction. If they are going against me, then I have a game plan for getting out.” - Paul Tudor Jones
Always manage your risk, be open to being wrong about price action, set a stop-loss, and know your drawdown risk. Let your winners run until they stop, and then exit your position.
"I believe the very best money is made at the market turns. Everyone says you get killed trying to pick tops and bottoms and you make all your money by playing the trend in the middle. Well for twelve years I have been missing the meat in the middle but I have made a lot of money at tops and bottoms."shortingDon'tdon't""don't - Paul Tudor Jones
The best risk/reward ratios are with buying the dip near the bottom and selling short near the market top.
“Don’t ever average losers. Decrease your trading volume when you are trading poorly; increase your volume when you are trading well. Never trade in situations where you don’t have control. For example, I don’t risk significant amounts of money in front of key reports, since that is gambling, not trading.” - Paul Tudor Jones
Don't buy more of a losing position, trade smaller during losing streaks, and trade bigger during a winning streak. Don't risk a lot of money on reports like earnings or the Fed minutes; that is gambling.
"I always believe that prices move first and fundamentals come second." - Paul Tudor Jones
Price action prices in fundamentals in advance. The market is always projecting and calculating the future through price adjustments.
"I spend my day trying to make myself as happy and relaxed as I can be. If I have positions going against me, I get right out; if they are going for me, I keep them." - Paul Tudor Jones
Going with the flow of price action, letting your winners run and cutting your losses short, is a good psychological practice for a trader.
"Fundamentals might be good for the first third or first 50 or 60 percent of a move, but the last third of a great bull market is typically a blow-off, whereas the mania runs wild and prices go parabolic... There is no training, classroom or otherwise, that can prepare for trading the last third of a move, whether it's the end of a bull market or the end of a bear market." - Paul Tudor Jones
A market trend can move far outside the boundary of what people think is possible and become completely removed from fundamental values.
"When you get a range expansion, the market is sending you a very loud, clear signal that the market is getting ready to move in the direction of that expansion." - Paul Tudor Jones
A breakout and increase in a trading range signal the next direction of a move.
"The whole world is simply nothing more than a flow chart for capital." - Paul Tudor Jones
Money flows in search of returns sometimes and at other times in search of safety.
"My metric for everything I look at is the 200-day moving average of closing prices. I've seen too many things go to zero, stocks and commodities. The whole trick in investing is: "How do I keep from losing everything?" If you use the 200-day moving average rule, then you get out. You play defense, and you get out." - Paul Tudor Jones
The 200-day moving average of prices is a great defensive tool to know when to get out of a position. It is also the last line of defense in an uptrend before the probabilities shift to the beginning of a downtrend.
"The concept of paying one-hundred-and-something times earnings for any company for me is just anathema. Having said that, at the end of the day, your job is to buy what goes up and to sell what goes down so really who gives a damn about PE's?" - Paul Tudor Jones
Price-to-earnings ratios are not great trend trading tools, but price action is.
"You always want to be with whatever the predominant trend is." - Paul Tudor Jones
Always trade in the direction of the primary trend in your market. Go with the path of least resistance.
$HYPE
{spot}(HYPEUSDT)
#BinanceUpdatesProofofReservesAddresses #BinanceToResumePhaseOneOfWithdrawals #IntelHasItsWorstDaySince1974 #TRMCambodianCasinosReceived$1.07BInCrypto #FBIConfirmsNorthKoreaIsResponsibleForBinanceCryptoHack
Top 10 Paul Tudor Jones Price Action Trading Quotes
@Junii Ahmad
Paul Tudor Jones is one of the greatest traders and money managers of his generation. He has had no losing years in his primary fund for decades. He more than doubled his capital under management during the Black Monday Crash of 1987, while others faced huge drawdowns and account blow-ups. He is ranked the 477th-richest person on Forbes. His net worth is around $8.1 billion and growing. Here is a guy that traders of all levels need to listen to what he has to say about trading.
“There is no training, classroom or otherwise, that can prepare for trading the last third of a move, whether it's the end of a bull market or the end of a bear market.” - Paul Tudor Jones
Volatility expands at the end of one trend and the beginning of another; what was working stops working, and the key to profitable trading changes.
“The most important rule is to play great defense, not great offense. Everyday I assume every position I have is wrong. I know where my stop risk points are going to be. I do that so I can define my maximum drawdown. Hopefully, I spend the rest of the day enjoying positions that are going in my direction. If they are going against me, then I have a game plan for getting out.” - Paul Tudor Jones
Always manage your risk, be open to being wrong about price action, set a stop-loss, and know your drawdown risk. Let your winners run until they stop, and then exit your position.
"I believe the very best money is made at the market turns. Everyone says you get killed trying to pick tops and bottoms and you make all your money by playing the trend in the middle. Well for twelve years I have been missing the meat in the middle but I have made a lot of money at tops and bottoms."shortingDon'tdon't""don't - Paul Tudor Jones
The best risk/reward ratios are with buying the dip near the bottom and selling short near the market top.
“Don’t ever average losers. Decrease your trading volume when you are trading poorly; increase your volume when you are trading well. Never trade in situations where you don’t have control. For example, I don’t risk significant amounts of money in front of key reports, since that is gambling, not trading.” - Paul Tudor Jones
Don't buy more of a losing position, trade smaller during losing streaks, and trade bigger during a winning streak. Don't risk a lot of money on reports like earnings or the Fed minutes; that is gambling.
"I always believe that prices move first and fundamentals come second." - Paul Tudor Jones
Price action prices in fundamentals in advance. The market is always projecting and calculating the future through price adjustments.
"I spend my day trying to make myself as happy and relaxed as I can be. If I have positions going against me, I get right out; if they are going for me, I keep them." - Paul Tudor Jones
Going with the flow of price action, letting your winners run and cutting your losses short, is a good psychological practice for a trader.
"Fundamentals might be good for the first third or first 50 or 60 percent of a move, but the last third of a great bull market is typically a blow-off, whereas the mania runs wild and prices go parabolic... There is no training, classroom or otherwise, that can prepare for trading the last third of a move, whether it's the end of a bull market or the end of a bear market." - Paul Tudor Jones
A market trend can move far outside the boundary of what people think is possible and become completely removed from fundamental values.
"When you get a range expansion, the market is sending you a very loud, clear signal that the market is getting ready to move in the direction of that expansion." - Paul Tudor Jones
A breakout and increase in a trading range signal the next direction of a move.
"The whole world is simply nothing more than a flow chart for capital." - Paul Tudor Jones
Money flows in search of returns sometimes and at other times in search of safety.
"My metric for everything I look at is the 200-day moving average of closing prices. I've seen too many things go to zero, stocks and commodities. The whole trick in investing is: "How do I keep from losing everything?" If you use the 200-day moving average rule, then you get out. You play defense, and you get out." - Paul Tudor Jones
The 200-day moving average of prices is a great defensive tool to know when to get out of a position. It is also the last line of defense in an uptrend before the probabilities shift to the beginning of a downtrend.
"The concept of paying one-hundred-and-something times earnings for any company for me is just anathema. Having said that, at the end of the day, your job is to buy what goes up and to sell what goes down so really who gives a damn about PE's?" - Paul Tudor Jones
Price-to-earnings ratios are not great trend trading tools, but price action is.
"You always want to be with whatever the predominant trend is." - Paul Tudor Jones
Always trade in the direction of the primary trend in your market. Go with the path of least resistance.
$HYPE
#BinanceUpdatesProofofReservesAddresses #BinanceToResumePhaseOneOfWithdrawals #IntelHasItsWorstDaySince1974 #TRMCambodianCasinosReceived$1.07BInCrypto #FBIConfirmsNorthKoreaIsResponsibleForBinanceCryptoHack
Paul Tudor Jones is one of the greatest traders and money managers of his generation. He has had no losing years in his primary fund for decades. He more than doubled his capital under management during the Black Monday Crash of 1987, while others faced huge drawdowns and account blow-ups. He is ranked the 477th-richest person on Forbes. His net worth is around $8.1 billion and growing. Here is a guy that traders of all levels need to listen to what he has to say about trading.
“There is no training, classroom or otherwise, that can prepare for trading the last third of a move, whether it's the end of a bull market or the end of a bear market.” - Paul Tudor Jones
Volatility expands at the end of one trend and the beginning of another; what was working stops working, and the key to profitable trading changes.
“The most important rule is to play great defense, not great offense. Everyday I assume every position I have is wrong. I know where my stop risk points are going to be. I do that so I can define my maximum drawdown. Hopefully, I spend the rest of the day enjoying positions that are going in my direction. If they are going against me, then I have a game plan for getting out.” - Paul Tudor Jones
Always manage your risk, be open to being wrong about price action, set a stop-loss, and know your drawdown risk. Let your winners run until they stop, and then exit your position.
"I believe the very best money is made at the market turns. Everyone says you get killed trying to pick tops and bottoms and you make all your money by playing the trend in the middle. Well for twelve years I have been missing the meat in the middle but I have made a lot of money at tops and bottoms."shortingDon'tdon't""don't - Paul Tudor Jones
The best risk/reward ratios are with buying the dip near the bottom and selling short near the market top.
“Don’t ever average losers. Decrease your trading volume when you are trading poorly; increase your volume when you are trading well. Never trade in situations where you don’t have control. For example, I don’t risk significant amounts of money in front of key reports, since that is gambling, not trading.” - Paul Tudor Jones
Don't buy more of a losing position, trade smaller during losing streaks, and trade bigger during a winning streak. Don't risk a lot of money on reports like earnings or the Fed minutes; that is gambling.
"I always believe that prices move first and fundamentals come second." - Paul Tudor Jones
Price action prices in fundamentals in advance. The market is always projecting and calculating the future through price adjustments.
"I spend my day trying to make myself as happy and relaxed as I can be. If I have positions going against me, I get right out; if they are going for me, I keep them." - Paul Tudor Jones
Going with the flow of price action, letting your winners run and cutting your losses short, is a good psychological practice for a trader.
"Fundamentals might be good for the first third or first 50 or 60 percent of a move, but the last third of a great bull market is typically a blow-off, whereas the mania runs wild and prices go parabolic... There is no training, classroom or otherwise, that can prepare for trading the last third of a move, whether it's the end of a bull market or the end of a bear market." - Paul Tudor Jones
A market trend can move far outside the boundary of what people think is possible and become completely removed from fundamental values.
"When you get a range expansion, the market is sending you a very loud, clear signal that the market is getting ready to move in the direction of that expansion." - Paul Tudor Jones
A breakout and increase in a trading range signal the next direction of a move.
"The whole world is simply nothing more than a flow chart for capital." - Paul Tudor Jones
Money flows in search of returns sometimes and at other times in search of safety.
"My metric for everything I look at is the 200-day moving average of closing prices. I've seen too many things go to zero, stocks and commodities. The whole trick in investing is: "How do I keep from losing everything?" If you use the 200-day moving average rule, then you get out. You play defense, and you get out." - Paul Tudor Jones
The 200-day moving average of prices is a great defensive tool to know when to get out of a position. It is also the last line of defense in an uptrend before the probabilities shift to the beginning of a downtrend.
"The concept of paying one-hundred-and-something times earnings for any company for me is just anathema. Having said that, at the end of the day, your job is to buy what goes up and to sell what goes down so really who gives a damn about PE's?" - Paul Tudor Jones
Price-to-earnings ratios are not great trend trading tools, but price action is.
"You always want to be with whatever the predominant trend is." - Paul Tudor Jones
Always trade in the direction of the primary trend in your market. Go with the path of least resistance.
$HYPE
#BinanceUpdatesProofofReservesAddresses #BinanceToResumePhaseOneOfWithdrawals #IntelHasItsWorstDaySince1974 #TRMCambodianCasinosReceived$1.07BInCrypto #FBIConfirmsNorthKoreaIsResponsibleForBinanceCryptoHack
1
193
·
--

Article
The Top 10 Michael Burry Price Action Trading QuotesMichael J. Burry was once a physician, then a hedge fund manager of Scion Capital from 2000 until 2008, before closing it to focus on his own personal investments and trades. Michael Burry was made famous by his portrayal in the movie 'The Big Short,' starring Christian Bale, based on Michael Lewis's book. Mr. Burry was one of the first people to recognize and profit big from the 2008-2009 subprime mortgage crisis.
Here are ten of the top trading and investing quotes that could be the most helpful for understanding his investing and trading process. Burry has been both a value investor in stocks and a trader in credit default swaps. It is always great to hear from people who made a fortune in the markets while the majority lost a lot of money. It takes genius to bet against the majority with the right timing.
"It is ludicrous to believe that asset bubbles can only be recognized in hindsight." - Michael Burry
Extreme market bubbles can be seen in real time by the distance of prices from any reasonable valuations or projections.
"If you are going to be a great investor, you have to fit the style to who you are." - Michael Burry
Your investing methodology has to fit your own belief system, personality, and risk tolerance, or you will not be able to stick with it during capital drawdowns.
"Sometimes markets err big time. Markets erred when they gave America Online the currency to buy Time Warner. They erred when they bet against George Soros and for the British pound. And they are erring right now by continuing to float along as if the most significant credit bubble history has ever seen does not exist. Opportunities are rare, and large opportunities on which one can put nearly unlimited capital to work at tremendous potential returns are even more rare. Selectively shorting the most problematic mortgage-backed securities in history today amounts to just such an opportunity." - Michael Burry
Michael Burry explained in real time that the mortgage market was wrong and that he was going to bet it would collapse. When the market is wrong, it will eventually show you by price moving back to reality.
"In essence, the stock market represents three separate categories of business. They are, adjusted for inflation, those with shrinking intrinsic value, those with approximately stable intrinsic value, and those with steadily growing intrinsic value. The preference, always, would be to buy a long-term franchise at a substantial discount from growing intrinsic value." - Michael Burry
Buying the best companies for growth and earnings at a value price creates great risk/reward ratios and increases the probability of making money.
"However, if one has been playing the buy-and-hold game with quality securities, one has been exposed to a substantial amount of market risk because the valuations placed on these securities have implied overly rosy scenarios prone to popular revision in times of more realistic expectation. This is one of those times, but it is my feeling that the revisions have not been severe enough, the expectations not yet realistic enough. Hence, the world's best companies largely remain overpriced in the marketplace." - Michael Burry
The problem with buy-and-hold investing is that the stock market tends to revert to the mean. Prices always return to their true valuations, which causes significant drawdowns in capital because there is no exit strategy to lock in profits.
"My positioning with my investors was always, I need three to five years." - Michael Burry
Even the best investment and trading strategies need at least three to five years to play out. The short term can be random, but over the long term, over multiple market conditions, an edge will play out in your favor.
"Volatility does not determine risk." - Michael Burry
Your position sizing, stop loss, and time frame determine your risk not the volatility of price action.
"At one point, I recognized that Warren Buffett, though he had every advantage in learning from Ben Graham, did not copy Ben Graham but, rather, set out on his own path and ran money his way, by his own rules... I also immediately internalized the idea that no school could teach someone how to be a great investor." - Michael Burry
You can learn from investing and trading legends, but in the end, you have to create your own trading system that fits your beliefs about the market along with your own return goals and risk tolerance.
"It is a tenet of my investment style that, on the subject of common stock investment, maximizing the upside means first and foremost minimizing the downside. The deleterious effect of permanent capital loss on portfolio returns cannot be overstated." - Michael Burry
Your risk/reward ratio is one of the most important factors to consider before entering any position. It is more difficult to make money back than to lose it because of a reduced capital base. If you lose 20%, you must earn a 25% return to break even.
"Credit-default swaps remedied the problem of open-ended risk for me. If I bought a credit-default swap, my downside was defined and certain, and the upside was many multiples of it." - Michael Burry
Futures and option contracts can help with risk management by defining the risk in terms of the contract's cost while leaving the upside unlimited.
#BinanceReports80%Recoveryof$6.3BillioninLossesfromHackIncident #HeYiSaysWithdrawalsExpectedtoResumeWithin42Hours #CZSaysCompensationIsinPlaceUsersAreProtected #ASICHasReceivedNoPredictionMarketApplications #USDCCirculationFallsAbout800MInSevenDays
The Top 10 Michael Burry Price Action Trading Quotes
Michael J. Burry was once a physician, then a hedge fund manager of Scion Capital from 2000 until 2008, before closing it to focus on his own personal investments and trades. Michael Burry was made famous by his portrayal in the movie 'The Big Short,' starring Christian Bale, based on Michael Lewis's book. Mr. Burry was one of the first people to recognize and profit big from the 2008-2009 subprime mortgage crisis.
Here are ten of the top trading and investing quotes that could be the most helpful for understanding his investing and trading process. Burry has been both a value investor in stocks and a trader in credit default swaps. It is always great to hear from people who made a fortune in the markets while the majority lost a lot of money. It takes genius to bet against the majority with the right timing.
"It is ludicrous to believe that asset bubbles can only be recognized in hindsight." - Michael Burry
Extreme market bubbles can be seen in real time by the distance of prices from any reasonable valuations or projections.
"If you are going to be a great investor, you have to fit the style to who you are." - Michael Burry
Your investing methodology has to fit your own belief system, personality, and risk tolerance, or you will not be able to stick with it during capital drawdowns.
"Sometimes markets err big time. Markets erred when they gave America Online the currency to buy Time Warner. They erred when they bet against George Soros and for the British pound. And they are erring right now by continuing to float along as if the most significant credit bubble history has ever seen does not exist. Opportunities are rare, and large opportunities on which one can put nearly unlimited capital to work at tremendous potential returns are even more rare. Selectively shorting the most problematic mortgage-backed securities in history today amounts to just such an opportunity." - Michael Burry
Michael Burry explained in real time that the mortgage market was wrong and that he was going to bet it would collapse. When the market is wrong, it will eventually show you by price moving back to reality.
"In essence, the stock market represents three separate categories of business. They are, adjusted for inflation, those with shrinking intrinsic value, those with approximately stable intrinsic value, and those with steadily growing intrinsic value. The preference, always, would be to buy a long-term franchise at a substantial discount from growing intrinsic value." - Michael Burry
Buying the best companies for growth and earnings at a value price creates great risk/reward ratios and increases the probability of making money.
"However, if one has been playing the buy-and-hold game with quality securities, one has been exposed to a substantial amount of market risk because the valuations placed on these securities have implied overly rosy scenarios prone to popular revision in times of more realistic expectation. This is one of those times, but it is my feeling that the revisions have not been severe enough, the expectations not yet realistic enough. Hence, the world's best companies largely remain overpriced in the marketplace." - Michael Burry
The problem with buy-and-hold investing is that the stock market tends to revert to the mean. Prices always return to their true valuations, which causes significant drawdowns in capital because there is no exit strategy to lock in profits.
"My positioning with my investors was always, I need three to five years." - Michael Burry
Even the best investment and trading strategies need at least three to five years to play out. The short term can be random, but over the long term, over multiple market conditions, an edge will play out in your favor.
"Volatility does not determine risk." - Michael Burry
Your position sizing, stop loss, and time frame determine your risk not the volatility of price action.
"At one point, I recognized that Warren Buffett, though he had every advantage in learning from Ben Graham, did not copy Ben Graham but, rather, set out on his own path and ran money his way, by his own rules... I also immediately internalized the idea that no school could teach someone how to be a great investor." - Michael Burry
You can learn from investing and trading legends, but in the end, you have to create your own trading system that fits your beliefs about the market along with your own return goals and risk tolerance.
"It is a tenet of my investment style that, on the subject of common stock investment, maximizing the upside means first and foremost minimizing the downside. The deleterious effect of permanent capital loss on portfolio returns cannot be overstated." - Michael Burry
Your risk/reward ratio is one of the most important factors to consider before entering any position. It is more difficult to make money back than to lose it because of a reduced capital base. If you lose 20%, you must earn a 25% return to break even.
"Credit-default swaps remedied the problem of open-ended risk for me. If I bought a credit-default swap, my downside was defined and certain, and the upside was many multiples of it." - Michael Burry
Futures and option contracts can help with risk management by defining the risk in terms of the contract's cost while leaving the upside unlimited.
#BinanceReports80%Recoveryof$6.3BillioninLossesfromHackIncident #HeYiSaysWithdrawalsExpectedtoResumeWithin42Hours #CZSaysCompensationIsinPlaceUsersAreProtected #ASICHasReceivedNoPredictionMarketApplications #USDCCirculationFallsAbout800MInSevenDays
Here are ten of the top trading and investing quotes that could be the most helpful for understanding his investing and trading process. Burry has been both a value investor in stocks and a trader in credit default swaps. It is always great to hear from people who made a fortune in the markets while the majority lost a lot of money. It takes genius to bet against the majority with the right timing.
"It is ludicrous to believe that asset bubbles can only be recognized in hindsight." - Michael Burry
Extreme market bubbles can be seen in real time by the distance of prices from any reasonable valuations or projections.
"If you are going to be a great investor, you have to fit the style to who you are." - Michael Burry
Your investing methodology has to fit your own belief system, personality, and risk tolerance, or you will not be able to stick with it during capital drawdowns.
"Sometimes markets err big time. Markets erred when they gave America Online the currency to buy Time Warner. They erred when they bet against George Soros and for the British pound. And they are erring right now by continuing to float along as if the most significant credit bubble history has ever seen does not exist. Opportunities are rare, and large opportunities on which one can put nearly unlimited capital to work at tremendous potential returns are even more rare. Selectively shorting the most problematic mortgage-backed securities in history today amounts to just such an opportunity." - Michael Burry
Michael Burry explained in real time that the mortgage market was wrong and that he was going to bet it would collapse. When the market is wrong, it will eventually show you by price moving back to reality.
"In essence, the stock market represents three separate categories of business. They are, adjusted for inflation, those with shrinking intrinsic value, those with approximately stable intrinsic value, and those with steadily growing intrinsic value. The preference, always, would be to buy a long-term franchise at a substantial discount from growing intrinsic value." - Michael Burry
Buying the best companies for growth and earnings at a value price creates great risk/reward ratios and increases the probability of making money.
"However, if one has been playing the buy-and-hold game with quality securities, one has been exposed to a substantial amount of market risk because the valuations placed on these securities have implied overly rosy scenarios prone to popular revision in times of more realistic expectation. This is one of those times, but it is my feeling that the revisions have not been severe enough, the expectations not yet realistic enough. Hence, the world's best companies largely remain overpriced in the marketplace." - Michael Burry
The problem with buy-and-hold investing is that the stock market tends to revert to the mean. Prices always return to their true valuations, which causes significant drawdowns in capital because there is no exit strategy to lock in profits.
"My positioning with my investors was always, I need three to five years." - Michael Burry
Even the best investment and trading strategies need at least three to five years to play out. The short term can be random, but over the long term, over multiple market conditions, an edge will play out in your favor.
"Volatility does not determine risk." - Michael Burry
Your position sizing, stop loss, and time frame determine your risk not the volatility of price action.
"At one point, I recognized that Warren Buffett, though he had every advantage in learning from Ben Graham, did not copy Ben Graham but, rather, set out on his own path and ran money his way, by his own rules... I also immediately internalized the idea that no school could teach someone how to be a great investor." - Michael Burry
You can learn from investing and trading legends, but in the end, you have to create your own trading system that fits your beliefs about the market along with your own return goals and risk tolerance.
"It is a tenet of my investment style that, on the subject of common stock investment, maximizing the upside means first and foremost minimizing the downside. The deleterious effect of permanent capital loss on portfolio returns cannot be overstated." - Michael Burry
Your risk/reward ratio is one of the most important factors to consider before entering any position. It is more difficult to make money back than to lose it because of a reduced capital base. If you lose 20%, you must earn a 25% return to break even.
"Credit-default swaps remedied the problem of open-ended risk for me. If I bought a credit-default swap, my downside was defined and certain, and the upside was many multiples of it." - Michael Burry
Futures and option contracts can help with risk management by defining the risk in terms of the contract's cost while leaving the upside unlimited.
#BinanceReports80%Recoveryof$6.3BillioninLossesfromHackIncident #HeYiSaysWithdrawalsExpectedtoResumeWithin42Hours #CZSaysCompensationIsinPlaceUsersAreProtected #ASICHasReceivedNoPredictionMarketApplications #USDCCirculationFallsAbout800MInSevenDays
2
2
796
·
--

Article
10 Books Rich People Read That Broke People Almost Never OpenTom Corley's study tracking the habits of 233 millionaires revealed one stark difference between them and most other people: 88% of wealthy people love reading for self-improvement. Lower-income people (those with an annual income of $35,000 or less and a liquid net worth of $5,000 or less) primarily read for entertainment. The contrast isn't just academic—it directly impacts wealth creation.
The following books aren't merely popular among the rich—billionaires like Warren Buffett, Bill Gates and Jeff Bezos credit them as crucial tools that helped them build their fortunes.
Each offers tested frameworks and strategies that have helped create trillions in wealth. These aren't just books to read—they're blueprints for success that most people never open.
List of the Top 10 Books Rich People Read That Broke People Never Open
"Think and Grow Rich" by Napoleon Hill"How to Win Friends and Influence People" by Dale CarnegieThe Intelligent Investor" by Benjamin Graham"Zero to One" by Peter Thiel"The Lean Startup" by Eric Ries"Sapiens" by Yuval Noah Harari"The Hard Thing About Hard Things" by Ben Horowitz"Principles" by Ray Dalio"The Innovator's Dilemma" by Clayton Christensen"Poor Charlie's Almanack" compiled by Peter D. Kaufman
1. Why These Books Matter for Building Wealth
A recent study by Thomas Corley found that 85% of self-made millionaires read 2 or more self-improvement books each month. The combined net worth of the billionaires who regularly recommend these ten books exceeds $500 billion.
Some reading habits of ultra-successful people:
Bill Gates reads about 50 books per year, which breaks down to one per week.Mark Cuban reads more than three hours every day.Elon Musk is an avid reader, and when asked how he learned to build rockets, he said, "I read books."Mark Zuckerberg resolved to read a book every 2 weeks throughout 2015Oprah Winfrey selects one of her favorite books monthly for her Book Club members to read and discuss.
And these aren't just isolated examples. Another study of 1200 wealthy people, it was found that they all share reading as a pastime.
These aren't just books - they're blueprints for success that combine practical knowledge with transformative mindset shifts. When Warren Buffett was asked about the key to success, he pointed to a stack of books and said, "Read 500 pages like this every day. That's how knowledge works. It builds up, like compound interest."
2. Personal Development Cornerstones: Think and Grow Rich & How to Win Friends
Napoleon Hill said he spent 20 years interviewing over 500 successful people, including Henry Ford and Thomas Edison, to distill their secrets into "Think and Grow Rich." The book introduced concepts like the "mastermind principle" and the power of organized planning.
Dale Carnegie's principles have influenced leaders from Warren Buffett to Charles Schwab. Buffett proudly displays his Dale Carnegie certificate in his office - not his college degree. These foundational texts emphasize that success depends more on human relationships and mental attitudes than on technical skills alone.
3. Investment Wisdom from the Masters: Warren Buffett's Must-Read
"The Intelligent Investor" has been the investment bible for generations of successful investors. Its "margin of safety" principle has helped create countless fortunes.
Warren Buffett credits this book with laying the foundation for his investment philosophy, which turned Berkshire Hathaway into a $972 billion enterprise. Graham's teachings about viewing market fluctuations as opportunities rather than threats remain particularly relevant in today's volatile markets.
4. The Silicon Valley Success Blueprints: Zero to One and The Lean Startup
Peter Thiel's "Zero to One" and Eric Ries's "The Lean Startup" represent the modern entrepreneurial mindset. Thiel emphasizes creating unique solutions rather than competing in crowded markets, while Ries focuses on efficient execution through rapid testing and iteration.
Companies like Airbnb and Dropbox have used the principles and methodologies found in these books to achieve success. These books provide complementary perspectives: one on thinking differently and the other on executing efficiently.
5. Big Picture Thinking: Why Billionaires Love Sapiens
Mark Zuckerberg, Bill Gates, and other tech leaders praise "Sapiens" by Yuval Noah Harari for its sweeping perspective on human development. The book's insights into how humans organize, cooperate, and create shared beliefs have practical applications in business and innovation.
Gates noted that understanding the broad arc of human history helps identify future trends and opportunities. This macro-level thinking has influenced decisions at companies like Microsoft and Meta.
6. Leadership Under Pressure: Hard Things and Principles
"The Hard Thing About Hard Things" and "Principles" stand as raw testimonies to the brutal realities of leadership. In "The Hard Thing About Hard Things," Ben Horowitz details his journey from near-bankruptcy at Loudcloud to selling Opsware for $1.6 billion, offering unfiltered insights into making difficult decisions when no good options exist.
He tackles topics others avoid: how to fire friends, what to do when intelligent people are wrong, and how to manage your psychology while everything falls apart.
Ray Dalio's "Principles" emerged from building Bridgewater Associates into the world's largest hedge fund. The book outlines his "radical transparency" approach and systematic decision-making frameworks.
Dalio shares how he built a culture where critiquing the CEO is not just accepted but required and where every assumption must be stress-tested against reality. His systematic approach transformed Bridgewater from a tiny investment firm into a $150 billion powerhouse.
Together, these books reject feel-good leadership platitudes in favor of battle-tested wisdom. They teach that great leadership isn't about having all the answers - it's about building systems to find answers and having the courage to face brutal facts head-on.
7. Strategic Innovation: Disruption and Market Evolution
Clayton Christensen's "The Innovator's Dilemma" explains why great companies fail and how to avoid their fate. His theory of disruptive innovation has predicted countless market transformations, from steel minimills to smartphones.
Jeff Bezos made this book required reading for Amazon executives, using its principles to guide Amazon's expansion from books to becoming "the everything store." The book's frameworks help readers identify threats and opportunities in their industries.
8. Decision-Making Excellence: Charlie Munger's Collected Wisdom
"Poor Charlie's Almanac" introduces Munger's concept of worldly wisdom: combining insights from multiple disciplines to make better decisions. The framework of his mental model has influenced leaders across industries.
Bill Gates praised the book for its practical approach to decision-making, while numerous hedge fund managers credit it with improving their investment processes. The book demonstrates how connecting ideas from different fields leads to superior insights.
9. Why Most People Skip These Life-Changing Books
Only 11% of Americans read more than 15 books yearly, with significant disparities across income levels. These books often require deeper engagement than typical self-help material. They challenge existing beliefs and demand implementation rather than passive consumption.
The investment of time and mental energy is substantial, but the potential return is life-changing. These books are often passed over because their value isn't immediately apparent - but their principles have created trillions in wealth.
10. How to Apply These Books' Lessons in Your Life
Start with "Think and Grow Rich" and "How to Win Friends" to build foundational mindsets. Progress to "The Intelligent Investor" and "Zero to One" for business and investment principles.
Supplement with "Sapiens" for a broader perspective. Set aside dedicated daily reading time, focusing on one book at a time. Take notes, implement key ideas immediately, and review regularly. Join or create discussion groups to deepen understanding through dialogue.
Conclusion
These ten books represent a graduate-level education in the principles of success, delivered by some of history's most accomplished individuals. Their value lies in the information they provide and their ability to transform thinking patterns and decision-making processes.
The difference between reading and not reading these books could be worth millions over a lifetime. The question isn't whether you can afford the time to read them - it's whether you can afford not to.
#USDCCirculationFallsAbout800MInSevenDays #HeYiSaysWithdrawalsExpectedtoResumeWithin42Hours #CZSaysCompensationIsinPlaceUsersAreProtected #ASICHasReceivedNoPredictionMarketApplications #BinanceReports80%Recoveryof$6.3BillioninLossesfromHackIncident
10 Books Rich People Read That Broke People Almost Never Open
Tom Corley's study tracking the habits of 233 millionaires revealed one stark difference between them and most other people: 88% of wealthy people love reading for self-improvement. Lower-income people (those with an annual income of $35,000 or less and a liquid net worth of $5,000 or less) primarily read for entertainment. The contrast isn't just academic—it directly impacts wealth creation.
The following books aren't merely popular among the rich—billionaires like Warren Buffett, Bill Gates and Jeff Bezos credit them as crucial tools that helped them build their fortunes.
Each offers tested frameworks and strategies that have helped create trillions in wealth. These aren't just books to read—they're blueprints for success that most people never open.
List of the Top 10 Books Rich People Read That Broke People Never Open
"Think and Grow Rich" by Napoleon Hill"How to Win Friends and Influence People" by Dale CarnegieThe Intelligent Investor" by Benjamin Graham"Zero to One" by Peter Thiel"The Lean Startup" by Eric Ries"Sapiens" by Yuval Noah Harari"The Hard Thing About Hard Things" by Ben Horowitz"Principles" by Ray Dalio"The Innovator's Dilemma" by Clayton Christensen"Poor Charlie's Almanack" compiled by Peter D. Kaufman
1. Why These Books Matter for Building Wealth
A recent study by Thomas Corley found that 85% of self-made millionaires read 2 or more self-improvement books each month. The combined net worth of the billionaires who regularly recommend these ten books exceeds $500 billion.
Some reading habits of ultra-successful people:
Bill Gates reads about 50 books per year, which breaks down to one per week.Mark Cuban reads more than three hours every day.Elon Musk is an avid reader, and when asked how he learned to build rockets, he said, "I read books."Mark Zuckerberg resolved to read a book every 2 weeks throughout 2015Oprah Winfrey selects one of her favorite books monthly for her Book Club members to read and discuss.
And these aren't just isolated examples. Another study of 1200 wealthy people, it was found that they all share reading as a pastime.
These aren't just books - they're blueprints for success that combine practical knowledge with transformative mindset shifts. When Warren Buffett was asked about the key to success, he pointed to a stack of books and said, "Read 500 pages like this every day. That's how knowledge works. It builds up, like compound interest."
2. Personal Development Cornerstones: Think and Grow Rich & How to Win Friends
Napoleon Hill said he spent 20 years interviewing over 500 successful people, including Henry Ford and Thomas Edison, to distill their secrets into "Think and Grow Rich." The book introduced concepts like the "mastermind principle" and the power of organized planning.
Dale Carnegie's principles have influenced leaders from Warren Buffett to Charles Schwab. Buffett proudly displays his Dale Carnegie certificate in his office - not his college degree. These foundational texts emphasize that success depends more on human relationships and mental attitudes than on technical skills alone.
3. Investment Wisdom from the Masters: Warren Buffett's Must-Read
"The Intelligent Investor" has been the investment bible for generations of successful investors. Its "margin of safety" principle has helped create countless fortunes.
Warren Buffett credits this book with laying the foundation for his investment philosophy, which turned Berkshire Hathaway into a $972 billion enterprise. Graham's teachings about viewing market fluctuations as opportunities rather than threats remain particularly relevant in today's volatile markets.
4. The Silicon Valley Success Blueprints: Zero to One and The Lean Startup
Peter Thiel's "Zero to One" and Eric Ries's "The Lean Startup" represent the modern entrepreneurial mindset. Thiel emphasizes creating unique solutions rather than competing in crowded markets, while Ries focuses on efficient execution through rapid testing and iteration.
Companies like Airbnb and Dropbox have used the principles and methodologies found in these books to achieve success. These books provide complementary perspectives: one on thinking differently and the other on executing efficiently.
5. Big Picture Thinking: Why Billionaires Love Sapiens
Mark Zuckerberg, Bill Gates, and other tech leaders praise "Sapiens" by Yuval Noah Harari for its sweeping perspective on human development. The book's insights into how humans organize, cooperate, and create shared beliefs have practical applications in business and innovation.
Gates noted that understanding the broad arc of human history helps identify future trends and opportunities. This macro-level thinking has influenced decisions at companies like Microsoft and Meta.
6. Leadership Under Pressure: Hard Things and Principles
"The Hard Thing About Hard Things" and "Principles" stand as raw testimonies to the brutal realities of leadership. In "The Hard Thing About Hard Things," Ben Horowitz details his journey from near-bankruptcy at Loudcloud to selling Opsware for $1.6 billion, offering unfiltered insights into making difficult decisions when no good options exist.
He tackles topics others avoid: how to fire friends, what to do when intelligent people are wrong, and how to manage your psychology while everything falls apart.
Ray Dalio's "Principles" emerged from building Bridgewater Associates into the world's largest hedge fund. The book outlines his "radical transparency" approach and systematic decision-making frameworks.
Dalio shares how he built a culture where critiquing the CEO is not just accepted but required and where every assumption must be stress-tested against reality. His systematic approach transformed Bridgewater from a tiny investment firm into a $150 billion powerhouse.
Together, these books reject feel-good leadership platitudes in favor of battle-tested wisdom. They teach that great leadership isn't about having all the answers - it's about building systems to find answers and having the courage to face brutal facts head-on.
7. Strategic Innovation: Disruption and Market Evolution
Clayton Christensen's "The Innovator's Dilemma" explains why great companies fail and how to avoid their fate. His theory of disruptive innovation has predicted countless market transformations, from steel minimills to smartphones.
Jeff Bezos made this book required reading for Amazon executives, using its principles to guide Amazon's expansion from books to becoming "the everything store." The book's frameworks help readers identify threats and opportunities in their industries.
8. Decision-Making Excellence: Charlie Munger's Collected Wisdom
"Poor Charlie's Almanac" introduces Munger's concept of worldly wisdom: combining insights from multiple disciplines to make better decisions. The framework of his mental model has influenced leaders across industries.
Bill Gates praised the book for its practical approach to decision-making, while numerous hedge fund managers credit it with improving their investment processes. The book demonstrates how connecting ideas from different fields leads to superior insights.
9. Why Most People Skip These Life-Changing Books
Only 11% of Americans read more than 15 books yearly, with significant disparities across income levels. These books often require deeper engagement than typical self-help material. They challenge existing beliefs and demand implementation rather than passive consumption.
The investment of time and mental energy is substantial, but the potential return is life-changing. These books are often passed over because their value isn't immediately apparent - but their principles have created trillions in wealth.
10. How to Apply These Books' Lessons in Your Life
Start with "Think and Grow Rich" and "How to Win Friends" to build foundational mindsets. Progress to "The Intelligent Investor" and "Zero to One" for business and investment principles.
Supplement with "Sapiens" for a broader perspective. Set aside dedicated daily reading time, focusing on one book at a time. Take notes, implement key ideas immediately, and review regularly. Join or create discussion groups to deepen understanding through dialogue.
Conclusion
These ten books represent a graduate-level education in the principles of success, delivered by some of history's most accomplished individuals. Their value lies in the information they provide and their ability to transform thinking patterns and decision-making processes.
The difference between reading and not reading these books could be worth millions over a lifetime. The question isn't whether you can afford the time to read them - it's whether you can afford not to.
#USDCCirculationFallsAbout800MInSevenDays #HeYiSaysWithdrawalsExpectedtoResumeWithin42Hours #CZSaysCompensationIsinPlaceUsersAreProtected #ASICHasReceivedNoPredictionMarketApplications #BinanceReports80%Recoveryof$6.3BillioninLossesfromHackIncident
The following books aren't merely popular among the rich—billionaires like Warren Buffett, Bill Gates and Jeff Bezos credit them as crucial tools that helped them build their fortunes.
Each offers tested frameworks and strategies that have helped create trillions in wealth. These aren't just books to read—they're blueprints for success that most people never open.
List of the Top 10 Books Rich People Read That Broke People Never Open
"Think and Grow Rich" by Napoleon Hill"How to Win Friends and Influence People" by Dale CarnegieThe Intelligent Investor" by Benjamin Graham"Zero to One" by Peter Thiel"The Lean Startup" by Eric Ries"Sapiens" by Yuval Noah Harari"The Hard Thing About Hard Things" by Ben Horowitz"Principles" by Ray Dalio"The Innovator's Dilemma" by Clayton Christensen"Poor Charlie's Almanack" compiled by Peter D. Kaufman
1. Why These Books Matter for Building Wealth
A recent study by Thomas Corley found that 85% of self-made millionaires read 2 or more self-improvement books each month. The combined net worth of the billionaires who regularly recommend these ten books exceeds $500 billion.
Some reading habits of ultra-successful people:
Bill Gates reads about 50 books per year, which breaks down to one per week.Mark Cuban reads more than three hours every day.Elon Musk is an avid reader, and when asked how he learned to build rockets, he said, "I read books."Mark Zuckerberg resolved to read a book every 2 weeks throughout 2015Oprah Winfrey selects one of her favorite books monthly for her Book Club members to read and discuss.
And these aren't just isolated examples. Another study of 1200 wealthy people, it was found that they all share reading as a pastime.
These aren't just books - they're blueprints for success that combine practical knowledge with transformative mindset shifts. When Warren Buffett was asked about the key to success, he pointed to a stack of books and said, "Read 500 pages like this every day. That's how knowledge works. It builds up, like compound interest."
2. Personal Development Cornerstones: Think and Grow Rich & How to Win Friends
Napoleon Hill said he spent 20 years interviewing over 500 successful people, including Henry Ford and Thomas Edison, to distill their secrets into "Think and Grow Rich." The book introduced concepts like the "mastermind principle" and the power of organized planning.
Dale Carnegie's principles have influenced leaders from Warren Buffett to Charles Schwab. Buffett proudly displays his Dale Carnegie certificate in his office - not his college degree. These foundational texts emphasize that success depends more on human relationships and mental attitudes than on technical skills alone.
3. Investment Wisdom from the Masters: Warren Buffett's Must-Read
"The Intelligent Investor" has been the investment bible for generations of successful investors. Its "margin of safety" principle has helped create countless fortunes.
Warren Buffett credits this book with laying the foundation for his investment philosophy, which turned Berkshire Hathaway into a $972 billion enterprise. Graham's teachings about viewing market fluctuations as opportunities rather than threats remain particularly relevant in today's volatile markets.
4. The Silicon Valley Success Blueprints: Zero to One and The Lean Startup
Peter Thiel's "Zero to One" and Eric Ries's "The Lean Startup" represent the modern entrepreneurial mindset. Thiel emphasizes creating unique solutions rather than competing in crowded markets, while Ries focuses on efficient execution through rapid testing and iteration.
Companies like Airbnb and Dropbox have used the principles and methodologies found in these books to achieve success. These books provide complementary perspectives: one on thinking differently and the other on executing efficiently.
5. Big Picture Thinking: Why Billionaires Love Sapiens
Mark Zuckerberg, Bill Gates, and other tech leaders praise "Sapiens" by Yuval Noah Harari for its sweeping perspective on human development. The book's insights into how humans organize, cooperate, and create shared beliefs have practical applications in business and innovation.
Gates noted that understanding the broad arc of human history helps identify future trends and opportunities. This macro-level thinking has influenced decisions at companies like Microsoft and Meta.
6. Leadership Under Pressure: Hard Things and Principles
"The Hard Thing About Hard Things" and "Principles" stand as raw testimonies to the brutal realities of leadership. In "The Hard Thing About Hard Things," Ben Horowitz details his journey from near-bankruptcy at Loudcloud to selling Opsware for $1.6 billion, offering unfiltered insights into making difficult decisions when no good options exist.
He tackles topics others avoid: how to fire friends, what to do when intelligent people are wrong, and how to manage your psychology while everything falls apart.
Ray Dalio's "Principles" emerged from building Bridgewater Associates into the world's largest hedge fund. The book outlines his "radical transparency" approach and systematic decision-making frameworks.
Dalio shares how he built a culture where critiquing the CEO is not just accepted but required and where every assumption must be stress-tested against reality. His systematic approach transformed Bridgewater from a tiny investment firm into a $150 billion powerhouse.
Together, these books reject feel-good leadership platitudes in favor of battle-tested wisdom. They teach that great leadership isn't about having all the answers - it's about building systems to find answers and having the courage to face brutal facts head-on.
7. Strategic Innovation: Disruption and Market Evolution
Clayton Christensen's "The Innovator's Dilemma" explains why great companies fail and how to avoid their fate. His theory of disruptive innovation has predicted countless market transformations, from steel minimills to smartphones.
Jeff Bezos made this book required reading for Amazon executives, using its principles to guide Amazon's expansion from books to becoming "the everything store." The book's frameworks help readers identify threats and opportunities in their industries.
8. Decision-Making Excellence: Charlie Munger's Collected Wisdom
"Poor Charlie's Almanac" introduces Munger's concept of worldly wisdom: combining insights from multiple disciplines to make better decisions. The framework of his mental model has influenced leaders across industries.
Bill Gates praised the book for its practical approach to decision-making, while numerous hedge fund managers credit it with improving their investment processes. The book demonstrates how connecting ideas from different fields leads to superior insights.
9. Why Most People Skip These Life-Changing Books
Only 11% of Americans read more than 15 books yearly, with significant disparities across income levels. These books often require deeper engagement than typical self-help material. They challenge existing beliefs and demand implementation rather than passive consumption.
The investment of time and mental energy is substantial, but the potential return is life-changing. These books are often passed over because their value isn't immediately apparent - but their principles have created trillions in wealth.
10. How to Apply These Books' Lessons in Your Life
Start with "Think and Grow Rich" and "How to Win Friends" to build foundational mindsets. Progress to "The Intelligent Investor" and "Zero to One" for business and investment principles.
Supplement with "Sapiens" for a broader perspective. Set aside dedicated daily reading time, focusing on one book at a time. Take notes, implement key ideas immediately, and review regularly. Join or create discussion groups to deepen understanding through dialogue.
Conclusion
These ten books represent a graduate-level education in the principles of success, delivered by some of history's most accomplished individuals. Their value lies in the information they provide and their ability to transform thinking patterns and decision-making processes.
The difference between reading and not reading these books could be worth millions over a lifetime. The question isn't whether you can afford the time to read them - it's whether you can afford not to.
#USDCCirculationFallsAbout800MInSevenDays #HeYiSaysWithdrawalsExpectedtoResumeWithin42Hours #CZSaysCompensationIsinPlaceUsersAreProtected #ASICHasReceivedNoPredictionMarketApplications #BinanceReports80%Recoveryof$6.3BillioninLossesfromHackIncident
2
9
2.4k
·
--
JUST IN🚀 US stock market turned into a crypto memecoin market today.
• Intel
$INTC
: -31%
• Reddit
$RDDT
: -30%
• Roblox
$RBLX.US
: -20%
• Illumina
$ILMN
: -19%
• SanDisk
$SNDK
: -15%
• Arm
$ARM
: -12.7%
• Dell
$DELL: -12.5%
#UniswapA16zSeekDeFiExemptionFromIllinoisCryptoTax #USMidtermElections #BinanceWillListPredictPREDICT #$1.5BInLeveragedCryptoBetsLiquidated #KOSPIFalls3.53%BackBelow6000
JUST IN🚀 US stock market turned into a crypto memecoin market today.
• Intel
$INTC
: -31%
• Reddit
$RDDT
: -30%
• Roblox
$RBLX.US
: -20%
• Illumina
$ILMN
: -19%
• SanDisk
$SNDK
: -15%
• Arm
$ARM
: -12.7%
• Dell
$DELL: -12.5%
#UniswapA16zSeekDeFiExemptionFromIllinoisCryptoTax #USMidtermElections #BinanceWillListPredictPREDICT #$1.5BInLeveragedCryptoBetsLiquidated #KOSPIFalls3.53%BackBelow6000
• Intel
$INTC
: -31%
$RDDT
: -30%
• Roblox
$RBLX.US
: -20%
• Illumina
$ILMN
: -19%
• SanDisk
$SNDK
: -15%
• Arm
$ARM
: -12.7%
• Dell
$DELL: -12.5%
#UniswapA16zSeekDeFiExemptionFromIllinoisCryptoTax #USMidtermElections #BinanceWillListPredictPREDICT #$1.5BInLeveragedCryptoBetsLiquidated #KOSPIFalls3.53%BackBelow6000
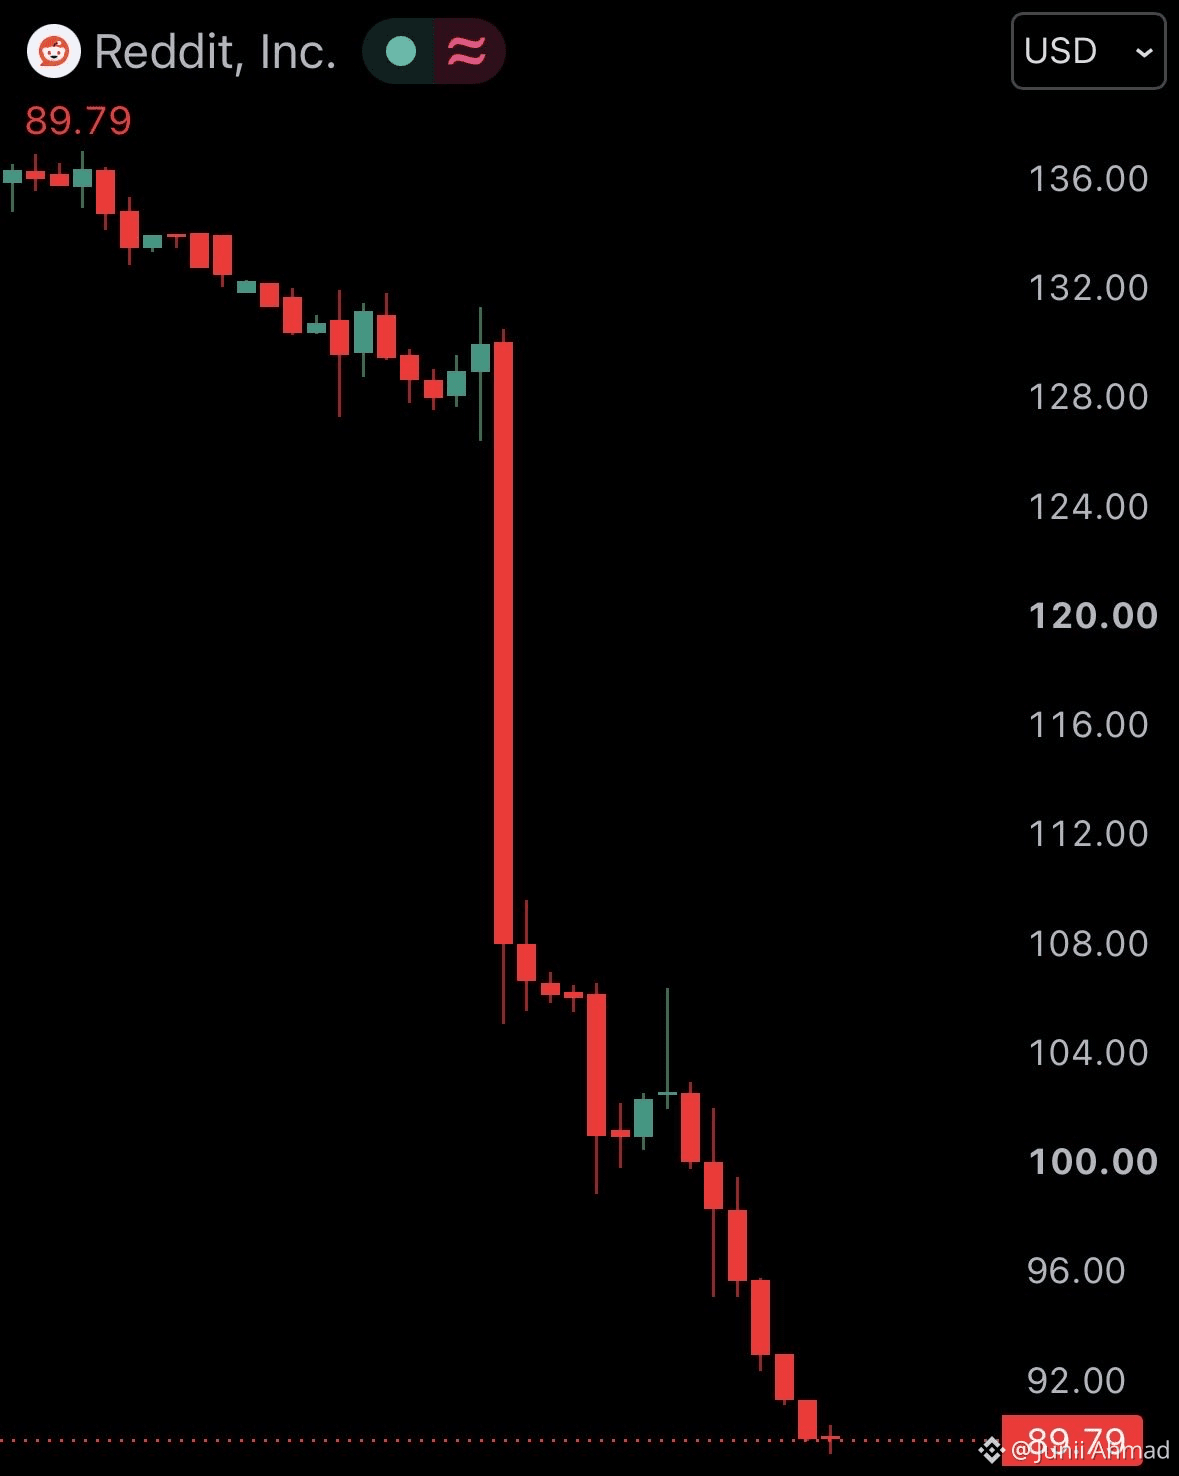
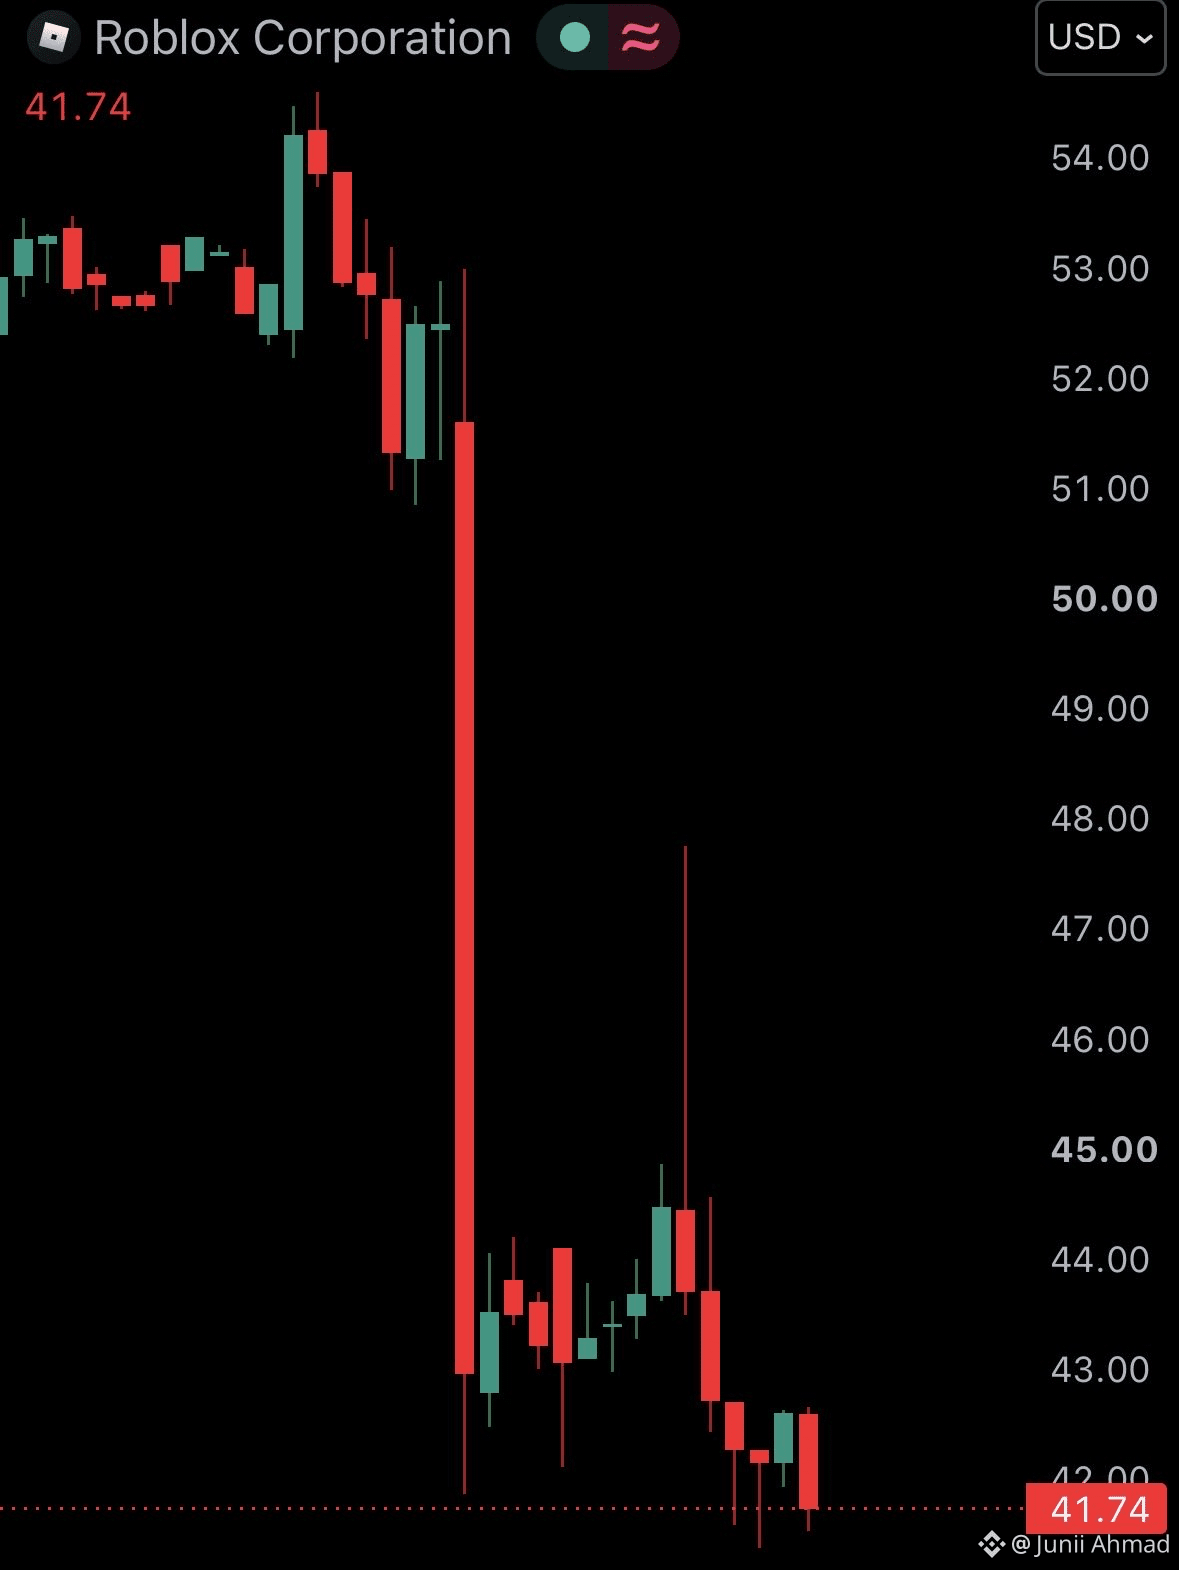
1
48
·
--
$HYPE
Big thanks to everyone for the continuous support truly learned a lot from you guys. Sharing a quick chart breakdown from today’s setup. Let me know if I missed anything
#KOSPIFalls3.53%BackBelow6000 #USMidtermElections #BinanceWillListPredictPREDICT #HKDollarStablecoinHKDAPToLaunchOnSolana
#
$HYPE
Big thanks to everyone for the continuous support truly learned a lot from you guys. Sharing a quick chart breakdown from today’s setup. Let me know if I missed anything
#KOSPIFalls3.53%BackBelow6000 #USMidtermElections #BinanceWillListPredictPREDICT #HKDollarStablecoinHKDAPToLaunchOnSolana
#
Big thanks to everyone for the continuous support truly learned a lot from you guys. Sharing a quick chart breakdown from today’s setup. Let me know if I missed anything
#KOSPIFalls3.53%BackBelow6000 #USMidtermElections #BinanceWillListPredictPREDICT #HKDollarStablecoinHKDAPToLaunchOnSolana
#
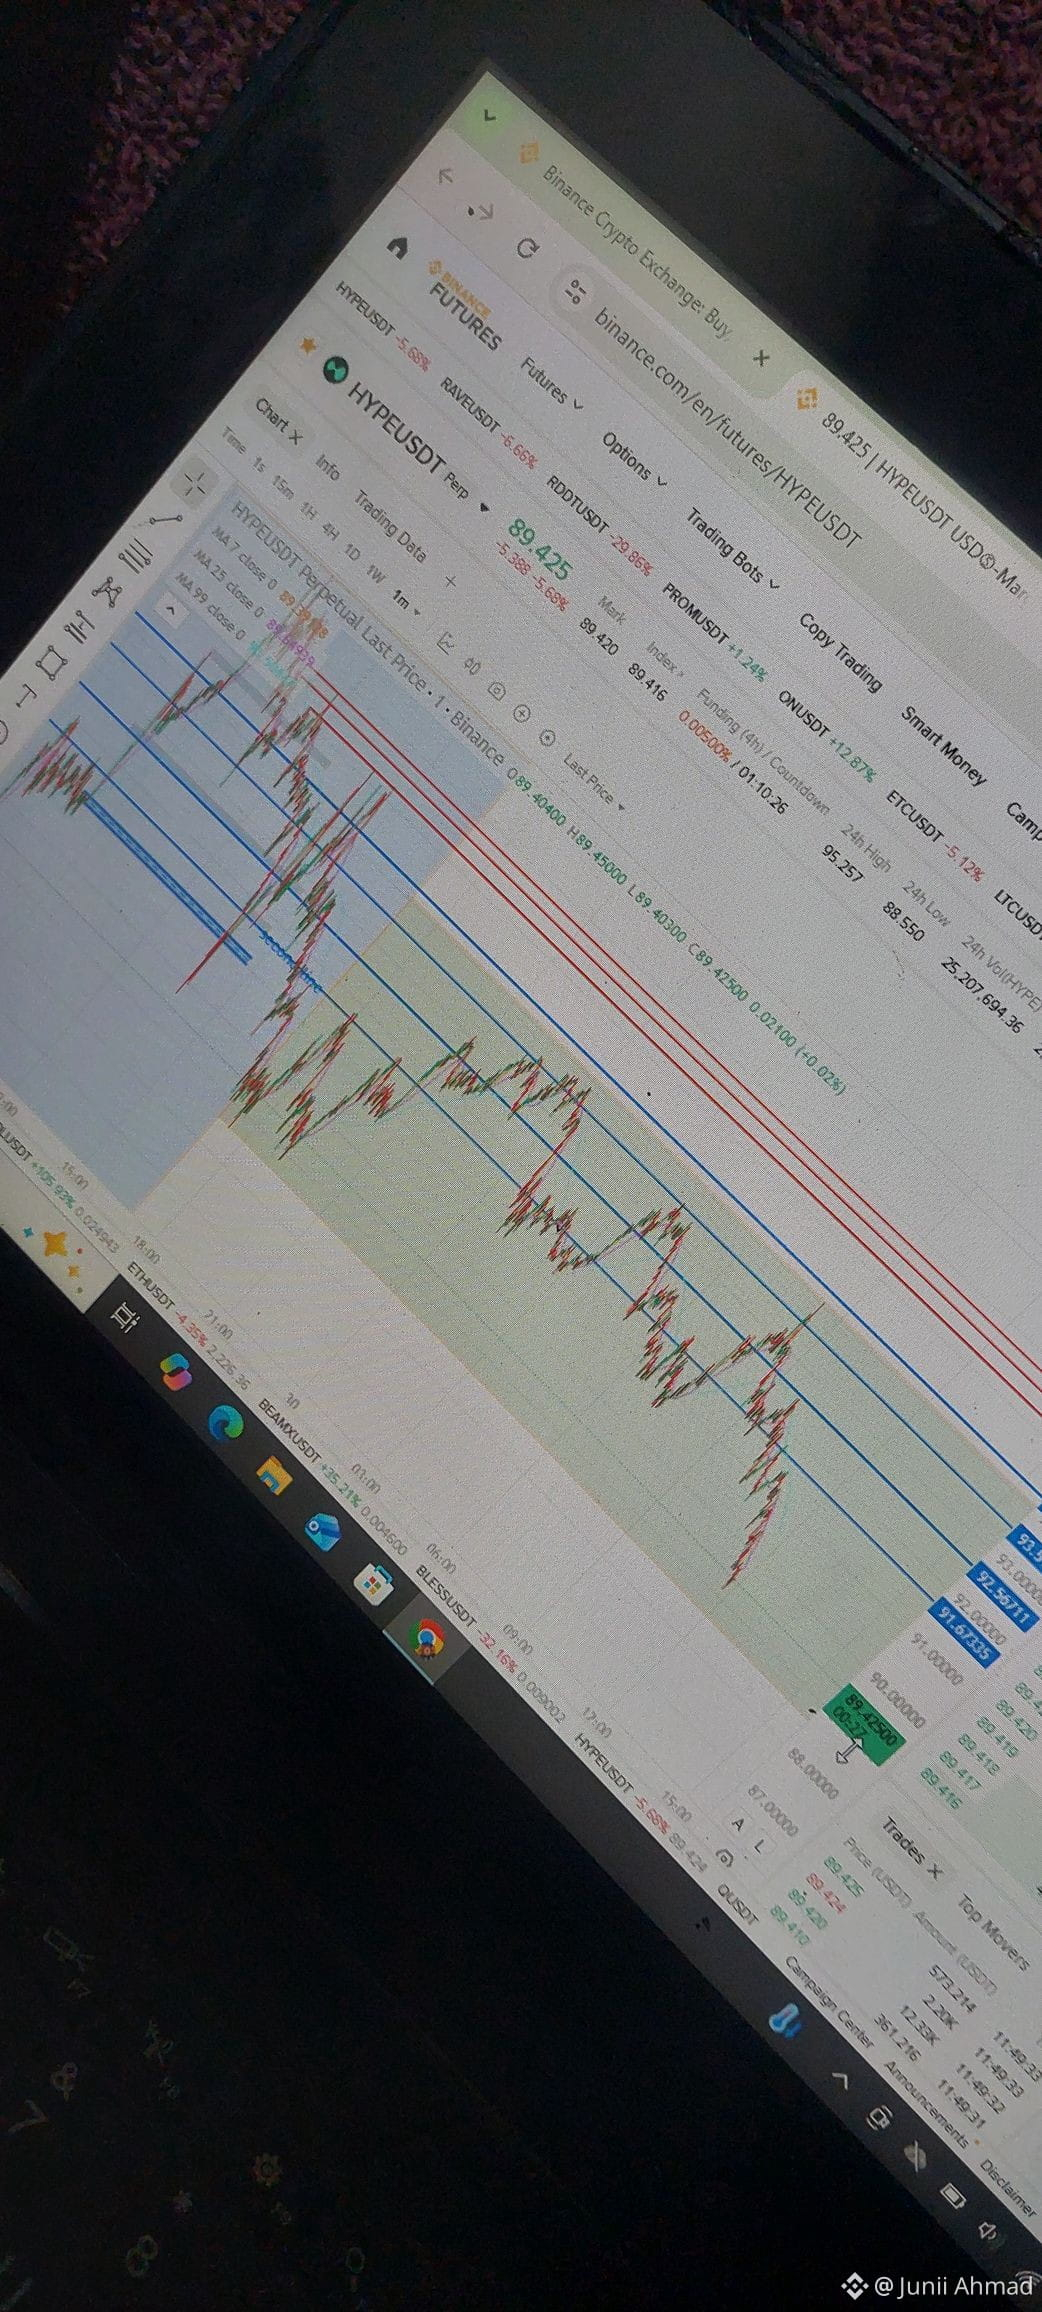
1
1
144
·
--
Here’s what I’ve been accumulating since I jumped into crypto 10 years ago..
This list was shared from CRYPTO Twitter
My picks for the next bull cycle:
1. $GRASS — Decentralized Data Network
2. $VVV — Private AI Inference
3. $HYPE — On-Chain Trading & L1 Blockchain
4. $ZANO — Private Layer 1 Blockchain
5. $ZAMA — Confidential Smart Contracts
6. $NEAR — Next-Gen L1
7. $QNT — Blockchain Interoperability
8. $ONDO — Tokenized Real-World Assets
9. $PENDLE — Yield Trading Protocol
10. $AERO — Base's Liquidity Hub
11. $LIT — Decentralized Perpetuals Exchange
12. $ZEC — Privacy-Focused Leader
13. $PUMP — Memecoin Launchpad
14. $GEOD — Decentralized Precision Positioning - don’t own
15. $TAO — Decentralized AI Network
16. $PENGU — Pudgy Penguins Ecosystem
17. $QUBIC — AI & Useful Proof of Work
18. $BP — Backpack Exchange Ecosystem
19. $CHEX — RWA Tokenization Infrastructure - don’t own
20. $LINK — Decentralized Oracle Network
21. $RENDER — Decentralized GPU Rendering
22. $PYTH — Decentralized Market Data Oracle
#USMidtermElections #BinanceWillListPredictPREDICT #AmazonSharesFallAbout7%InPremarketTrading #KOSPIFalls3.53%BackBelow6000 #UniswapA16zSeekDeFiExemptionFromIllinoisCryptoTax
Here’s what I’ve been accumulating since I jumped into crypto 10 years ago..
This list was shared from CRYPTO Twitter
My picks for the next bull cycle:
1. $GRASS — Decentralized Data Network
2. $VVV — Private AI Inference
3. $HYPE — On-Chain Trading & L1 Blockchain
4. $ZANO — Private Layer 1 Blockchain
5. $ZAMA — Confidential Smart Contracts
6. $NEAR — Next-Gen L1
7. $QNT — Blockchain Interoperability
8. $ONDO — Tokenized Real-World Assets
9. $PENDLE — Yield Trading Protocol
10. $AERO — Base's Liquidity Hub
11. $LIT — Decentralized Perpetuals Exchange
12. $ZEC — Privacy-Focused Leader
13. $PUMP — Memecoin Launchpad
14. $GEOD — Decentralized Precision Positioning - don’t own
15. $TAO — Decentralized AI Network
16. $PENGU — Pudgy Penguins Ecosystem
17. $QUBIC — AI & Useful Proof of Work
18. $BP — Backpack Exchange Ecosystem
19. $CHEX — RWA Tokenization Infrastructure - don’t own
20. $LINK — Decentralized Oracle Network
21. $RENDER — Decentralized GPU Rendering
22. $PYTH — Decentralized Market Data Oracle
#USMidtermElections #BinanceWillListPredictPREDICT #AmazonSharesFallAbout7%InPremarketTrading #KOSPIFalls3.53%BackBelow6000 #UniswapA16zSeekDeFiExemptionFromIllinoisCryptoTax
This list was shared from CRYPTO Twitter
My picks for the next bull cycle:
1. $GRASS — Decentralized Data Network
2. $VVV — Private AI Inference
3. $HYPE — On-Chain Trading & L1 Blockchain
4. $ZANO — Private Layer 1 Blockchain
5. $ZAMA — Confidential Smart Contracts
6. $NEAR — Next-Gen L1
7. $QNT — Blockchain Interoperability
8. $ONDO — Tokenized Real-World Assets
9. $PENDLE — Yield Trading Protocol
10. $AERO — Base's Liquidity Hub
11. $LIT — Decentralized Perpetuals Exchange
12. $ZEC — Privacy-Focused Leader
13. $PUMP — Memecoin Launchpad
14. $GEOD — Decentralized Precision Positioning - don’t own
15. $TAO — Decentralized AI Network
16. $PENGU — Pudgy Penguins Ecosystem
17. $QUBIC — AI & Useful Proof of Work
18. $BP — Backpack Exchange Ecosystem
19. $CHEX — RWA Tokenization Infrastructure - don’t own
20. $LINK — Decentralized Oracle Network
21. $RENDER — Decentralized GPU Rendering
22. $PYTH — Decentralized Market Data Oracle
#USMidtermElections #BinanceWillListPredictPREDICT #AmazonSharesFallAbout7%InPremarketTrading #KOSPIFalls3.53%BackBelow6000 #UniswapA16zSeekDeFiExemptionFromIllinoisCryptoTax
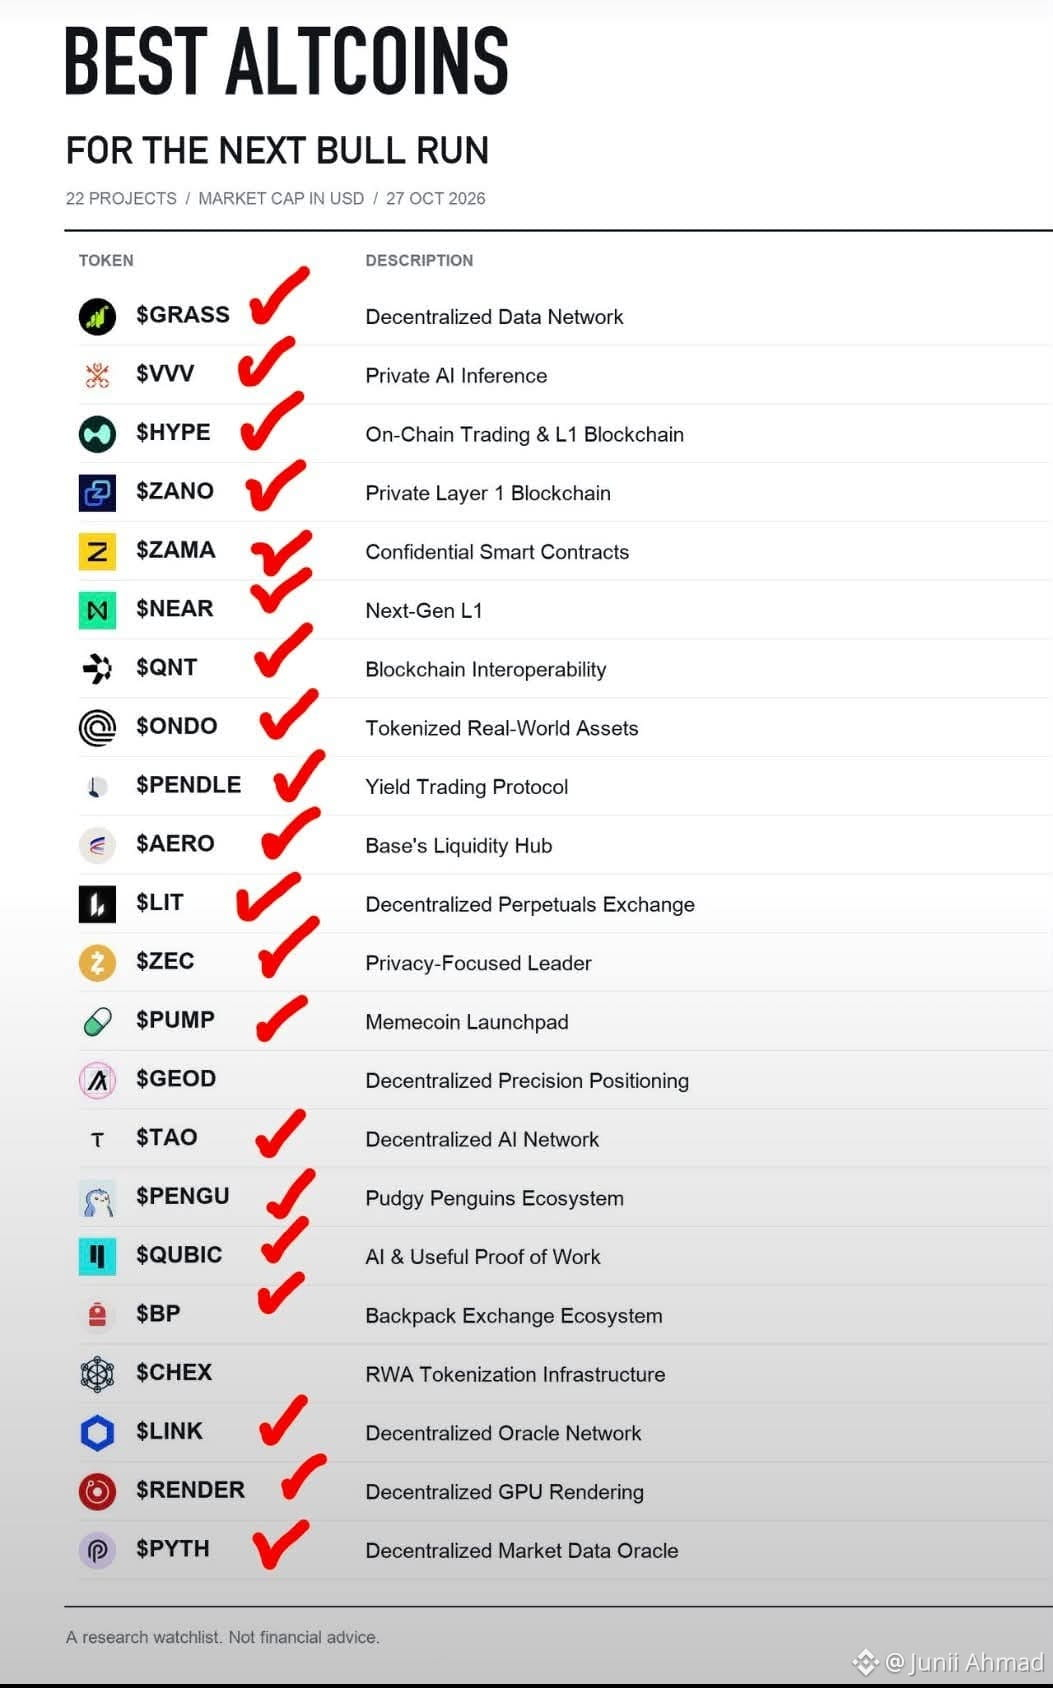
3
1k
Log in to explore more content
Join global crypto users on Binance Square
⚡️ Get latest and useful information about crypto.
💬 Trusted by the world’s largest crypto exchange.
👍 Discover real insights from verified creators.
Email / Phone number
Trending Topics
WhoWillSucceedJensenHuangatNvidia?
34,469 views
491 Discussing
Nvidia Says No CEO Talks Underway as "Stand With Jensen" Petition Tops 77,900 Signatures
Binance News
·14 Likes
·16.7k views
WhatWillDriveCryptoandStocks’NextRebound?
344,061 views
2,459 Discussing
USPPIMissMayEaseBTCPressure
156,527 views
1,719 Discussing