
#analysis
analysis
7.8M views
14,237 Discussing
Hot
Latest

$ Technical Analysis | BABYUSDT
The pair has been trading within a clear ascending channel since rebounding off the lowest level at 0.01027. Price managed to break through several consecutive resistance levels to reach a local peak at 0.01197 before a corrective wave began.
🔹 Key Technical Levels
• First Resistance: 0.01197 — Local peak, strong selling zone
• First Support: 0.01120 — Uptrend line; price is currently trading above it
• Crucial Support: 0.01027 — The lowest recorded price; breaking it invalidates the uptrend
🔹 Relative Strength Index (RSI 14)
Current value: 61.74
Positive momentum is still dominant, but weak bearish divergence is warning of the possibility of buyer power getting exhausted. The RSI moving average (51.25) is trending upward, which supports the continuation of the trend as long as support is not broken.
🔹 Technical Read
Price is currently testing a critical support area at 0.01120. The most likely possibilities:
Positive scenario: A rebound from 0.01120 with good trading volume targeting a retest of 0.01197.
Negative scenario: A break below 0.01120 with a 1-hour close opens the door to testing 0.01080, then 0.01027.
⚠️ Risk Management:
In such setups, it is preferable to wait until the rebound from support is confirmed or support is clearly broken before making any decision. Unmanaged risk near highs is always costly.
This analysis is for educational purposes only and is not investment advice. 📊$BABY #analysis #BTC
The pair has been trading within a clear ascending channel since rebounding off the lowest level at 0.01027. Price managed to break through several consecutive resistance levels to reach a local peak at 0.01197 before a corrective wave began.
🔹 Key Technical Levels
• First Resistance: 0.01197 — Local peak, strong selling zone
• First Support: 0.01120 — Uptrend line; price is currently trading above it
• Crucial Support: 0.01027 — The lowest recorded price; breaking it invalidates the uptrend
🔹 Relative Strength Index (RSI 14)
Current value: 61.74
Positive momentum is still dominant, but weak bearish divergence is warning of the possibility of buyer power getting exhausted. The RSI moving average (51.25) is trending upward, which supports the continuation of the trend as long as support is not broken.
🔹 Technical Read
Price is currently testing a critical support area at 0.01120. The most likely possibilities:
Positive scenario: A rebound from 0.01120 with good trading volume targeting a retest of 0.01197.
Negative scenario: A break below 0.01120 with a 1-hour close opens the door to testing 0.01080, then 0.01027.
⚠️ Risk Management:
In such setups, it is preferable to wait until the rebound from support is confirmed or support is clearly broken before making any decision. Unmanaged risk near highs is always costly.
This analysis is for educational purposes only and is not investment advice. 📊$BABY #analysis #BTC

😁😁😁😁 $SOL
🔜 MARKET SETUP
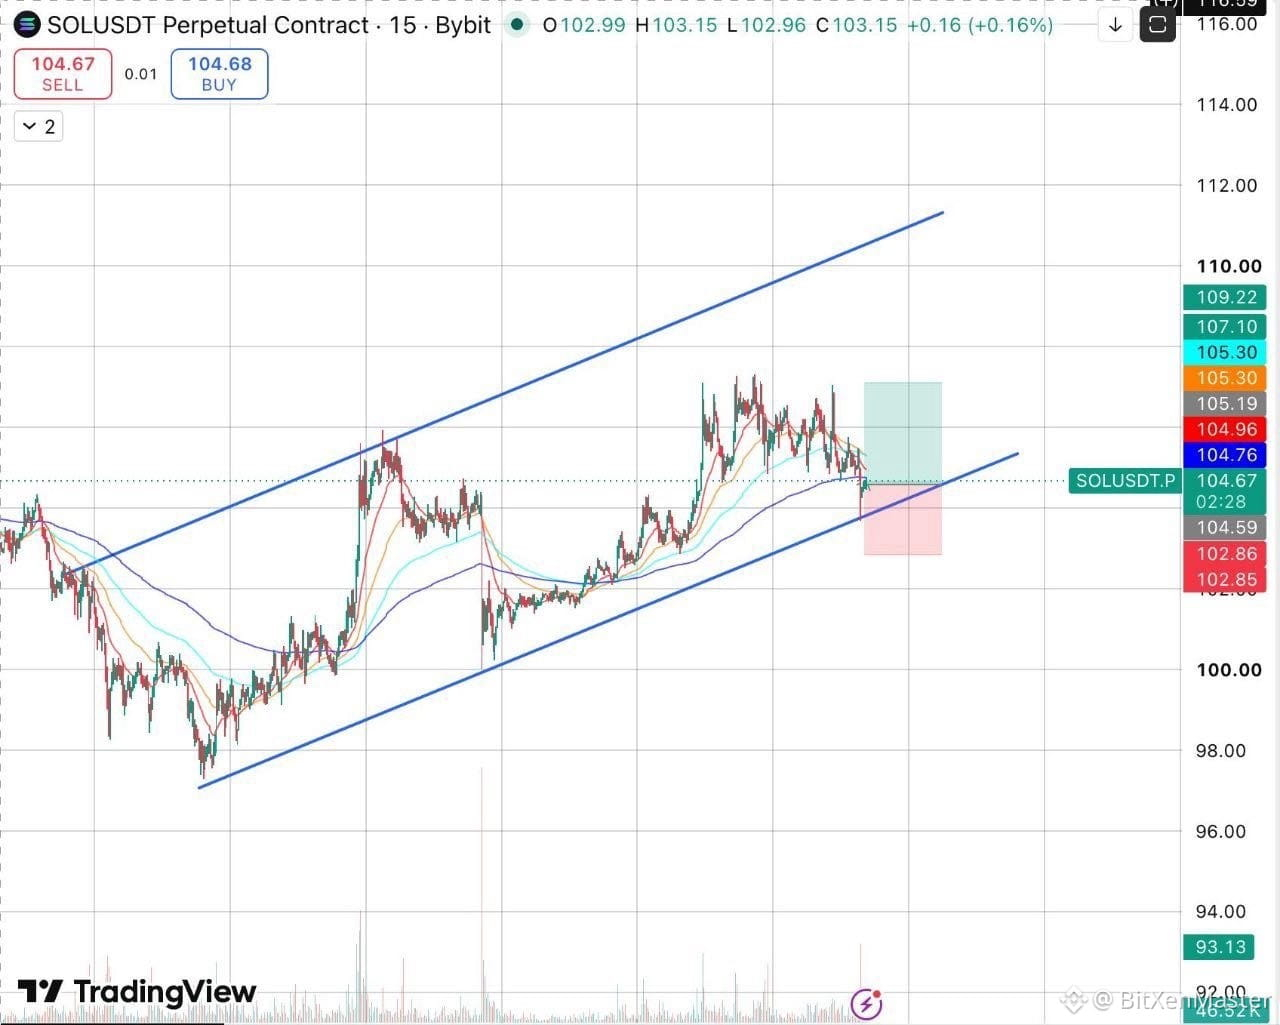
ℹ Entry: 104.65
⚠ SL: 102.8
💵 TP: 107.1
⚠ Capital: 3% max
⭐ REASON FOR SOL ORDER
- SOL continues to maintain a bullish structure within the M15 ascending channel.
- The $104.6 entry provides confluence between the lower trendline and the EMA200.
- Price swept below support and quickly formed a lower wick, showing that buying pressure has emerged. $SOL #update #analysis
🔜 MARKET SETUP
ℹ Entry: 104.65
⚠ SL: 102.8
💵 TP: 107.1
⚠ Capital: 3% max
⭐ REASON FOR SOL ORDER
- SOL continues to maintain a bullish structure within the M15 ascending channel.
- The $104.6 entry provides confluence between the lower trendline and the EMA200.
- Price swept below support and quickly formed a lower wick, showing that buying pressure has emerged. $SOL #update #analysis


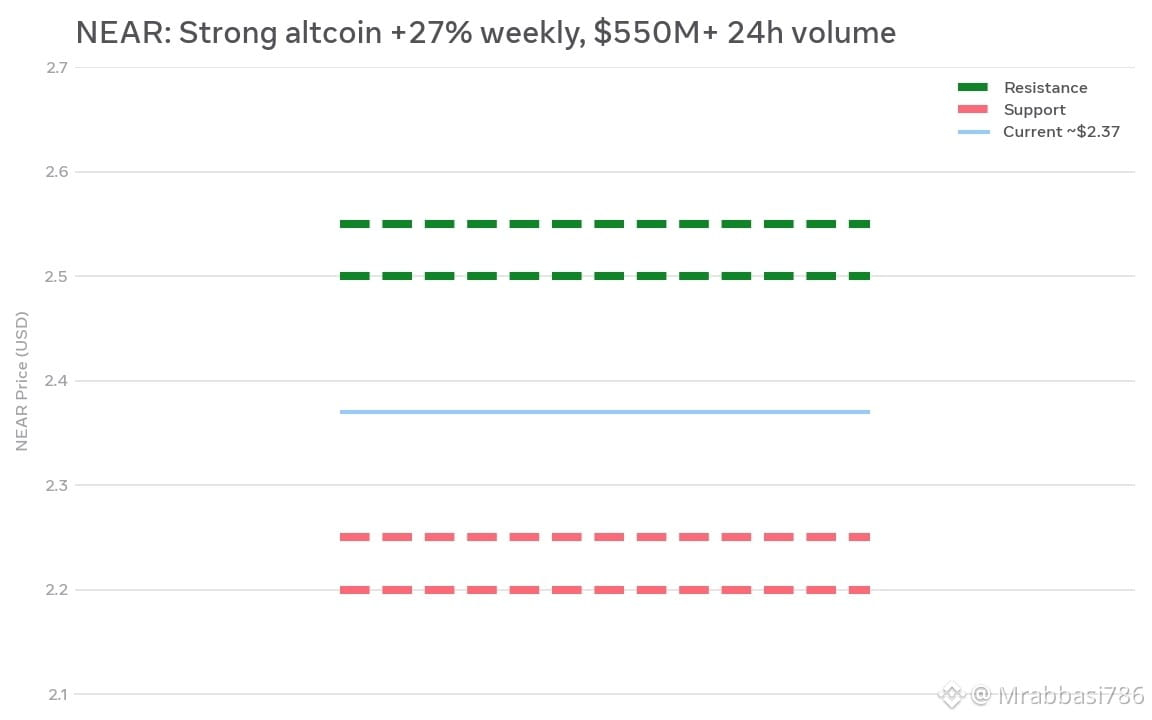
$NEAR has been one of the stronger altcoins recently. It’s around $2.35–$2.40, with roughly 27% gains over the past week and more than $550M in 24-hour volume. �
CoinGecko
The interesting part is that volume is rising with the price. That usually means the move has more participation behind it rather than being a completely dead-market pump.
From here, I’m watching $2.50–$2.55. A clean break and hold above that area could keep the momentum going. If buyers fail there, a pullback toward $2.20–$2.25 wouldn't be surprising.
#NEAR🚀🚀🚀 #Square #crypto #analysis
CoinGecko
The interesting part is that volume is rising with the price. That usually means the move has more participation behind it rather than being a completely dead-market pump.
From here, I’m watching $2.50–$2.55. A clean break and hold above that area could keep the momentum going. If buyers fail there, a pullback toward $2.20–$2.25 wouldn't be surprising.
#NEAR🚀🚀🚀 #Square #crypto #analysis
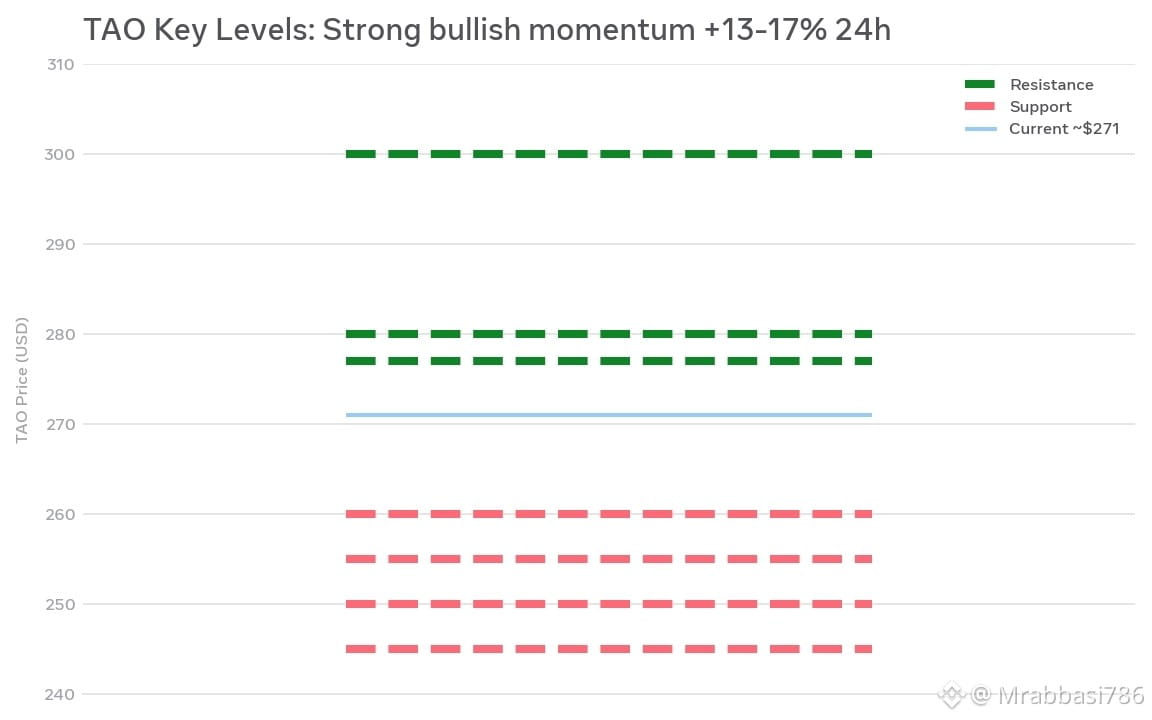
$TAO is showing strong bullish momentum today, trading around $268–$274, up roughly 13–17% over 24 hours. �
CoinMarketCap +1
Key levels:
🟢 Resistance: $277–$280
🟢 Breakout target: $290–$300
🔵 Support: $255–$260
🔵 Major support: $245–$250
Market view: Momentum is clearly bullish, but after such a sharp move, chasing the price at the top carries higher pullback risk. A hold above $260 would keep the short-term bullish structure intact. A clean break above $280 with strong volume could open the way toward $300.
Recent Bittensor protocol upgrades around subnet emissions, staking and rewards are also providing a broader fundamental backdrop. �
CryptoRank +1
Trading idea: Better risk/reward may come from waiting for a pullback toward $255–260 rather than entering after the large pump. Not financial advice.#TAO #update #market #analysis
CoinMarketCap +1
Key levels:
🟢 Resistance: $277–$280
🟢 Breakout target: $290–$300
🔵 Support: $255–$260
🔵 Major support: $245–$250
Market view: Momentum is clearly bullish, but after such a sharp move, chasing the price at the top carries higher pullback risk. A hold above $260 would keep the short-term bullish structure intact. A clean break above $280 with strong volume could open the way toward $300.
Recent Bittensor protocol upgrades around subnet emissions, staking and rewards are also providing a broader fundamental backdrop. �
CryptoRank +1
Trading idea: Better risk/reward may come from waiting for a pullback toward $255–260 rather than entering after the large pump. Not financial advice.#TAO #update #market #analysis
$BTC as a Feature vs. Bitcoin as a Product
Bitcoin can be viewed in two ways.
As a feature, it’s a technology that enables borderless, peer-to-peer value transfer without a central intermediary.
As a product, Bitcoin itself becomes the asset people buy, hold, trade, and use as a store of value.
The interesting part is that Bitcoin can serve both roles at the same time.
Simple takeaway: The network is the feature. **BTC is the product people own.**
#Bitcoin #analysis #update
Bitcoin can be viewed in two ways.
As a feature, it’s a technology that enables borderless, peer-to-peer value transfer without a central intermediary.
As a product, Bitcoin itself becomes the asset people buy, hold, trade, and use as a store of value.
The interesting part is that Bitcoin can serve both roles at the same time.
Simple takeaway: The network is the feature. **BTC is the product people own.**
#Bitcoin #analysis #update


📊 Market Median / September 7, 2026
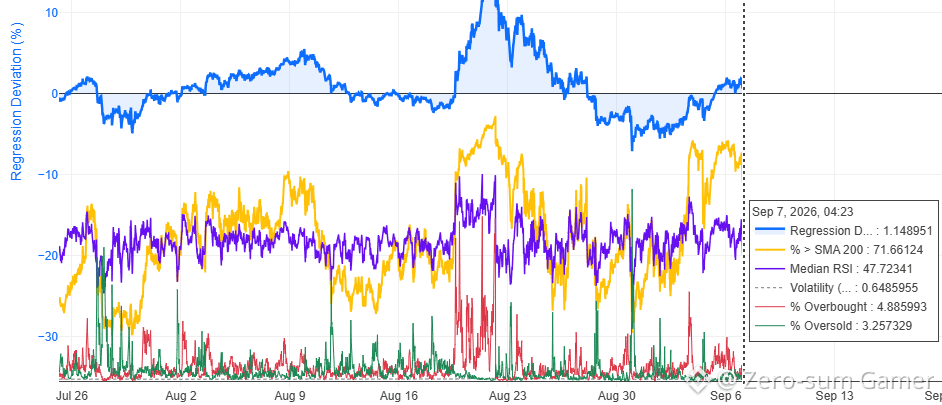
📌 30m slice: RegDev +1.15%, above SMA200 71.66%, Median RSI 47.72.
Yesterday’s long setup strengthened, but today the impulse cooled. RSI fell from 51.67 to 47.72, breadth slipped from 81.05% to 71.66%, and RegDev eased from +1.32% to +1.15%. Breadth is still strong, but RSI confirmation is gone.
📊 The market remains broad, but there is no clean long signal right now. More than 71% of coins are still above SMA200 and RegDev remains positive. At the same time, RSI is back below 50, with overbought at 4.89% and oversold at 3.26%. Signals are mixed here.
Trade plan: longs need RSI back above 50 while breadth stays above 60% and RegDev remains positive. Shorts become more interesting if breadth loses 60% and RegDev moves toward zero or negative.
⚠️ Common mistake: treating strong breadth as automatic continuation while RSI has already cooled.
#MarketSentimentToday #analysis $DOOD $XAN $NAORIS
📌 30m slice: RegDev +1.15%, above SMA200 71.66%, Median RSI 47.72.
Yesterday’s long setup strengthened, but today the impulse cooled. RSI fell from 51.67 to 47.72, breadth slipped from 81.05% to 71.66%, and RegDev eased from +1.32% to +1.15%. Breadth is still strong, but RSI confirmation is gone.
📊 The market remains broad, but there is no clean long signal right now. More than 71% of coins are still above SMA200 and RegDev remains positive. At the same time, RSI is back below 50, with overbought at 4.89% and oversold at 3.26%. Signals are mixed here.
Trade plan: longs need RSI back above 50 while breadth stays above 60% and RegDev remains positive. Shorts become more interesting if breadth loses 60% and RegDev moves toward zero or negative.
⚠️ Common mistake: treating strong breadth as automatic continuation while RSI has already cooled.
#MarketSentimentToday #analysis $DOOD $XAN $NAORIS
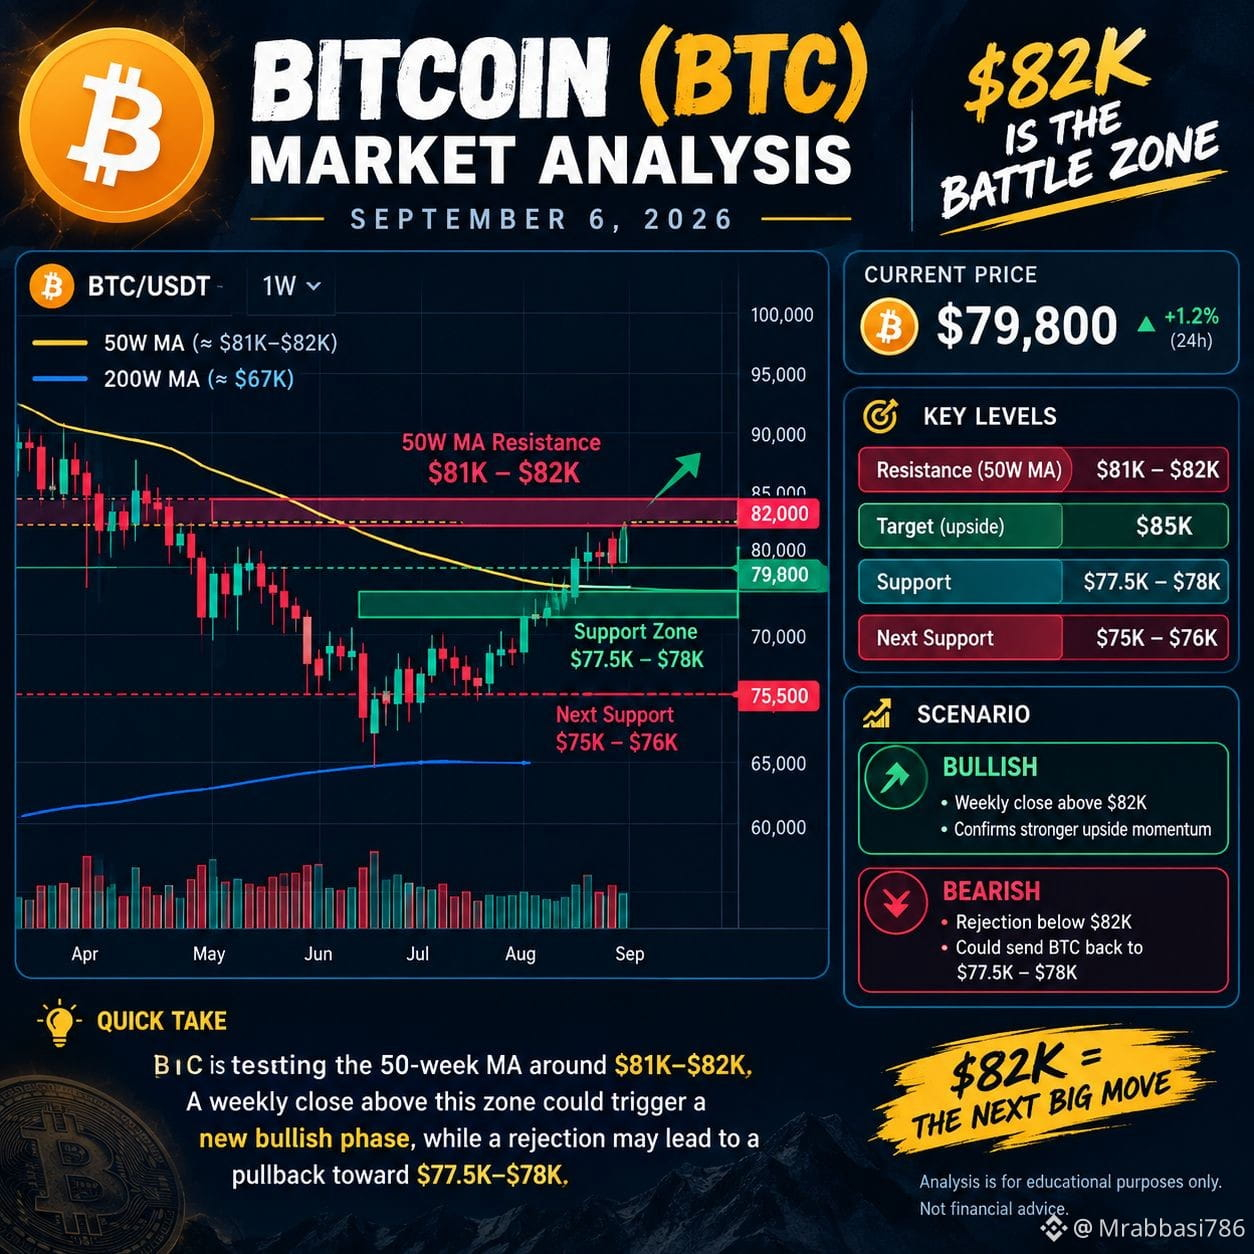
$BTC is hovering around $80K, with the 50-week moving average near $81K–$82K acting as a major resistance zone. �
CryptoRank +1
📈 Bullish: Weekly close above $82K could confirm stronger upside momentum.
📉 Bearish: Rejection below this zone could send BTC back toward $77.5K–$78K.
🎯 Key level: $82K — the next major battle.
#bitcoin #update #analysis
CryptoRank +1
📈 Bullish: Weekly close above $82K could confirm stronger upside momentum.
📉 Bearish: Rejection below this zone could send BTC back toward $77.5K–$78K.
🎯 Key level: $82K — the next major battle.
#bitcoin #update #analysis
$BTC — Today’s Analysis | September 6, 2026
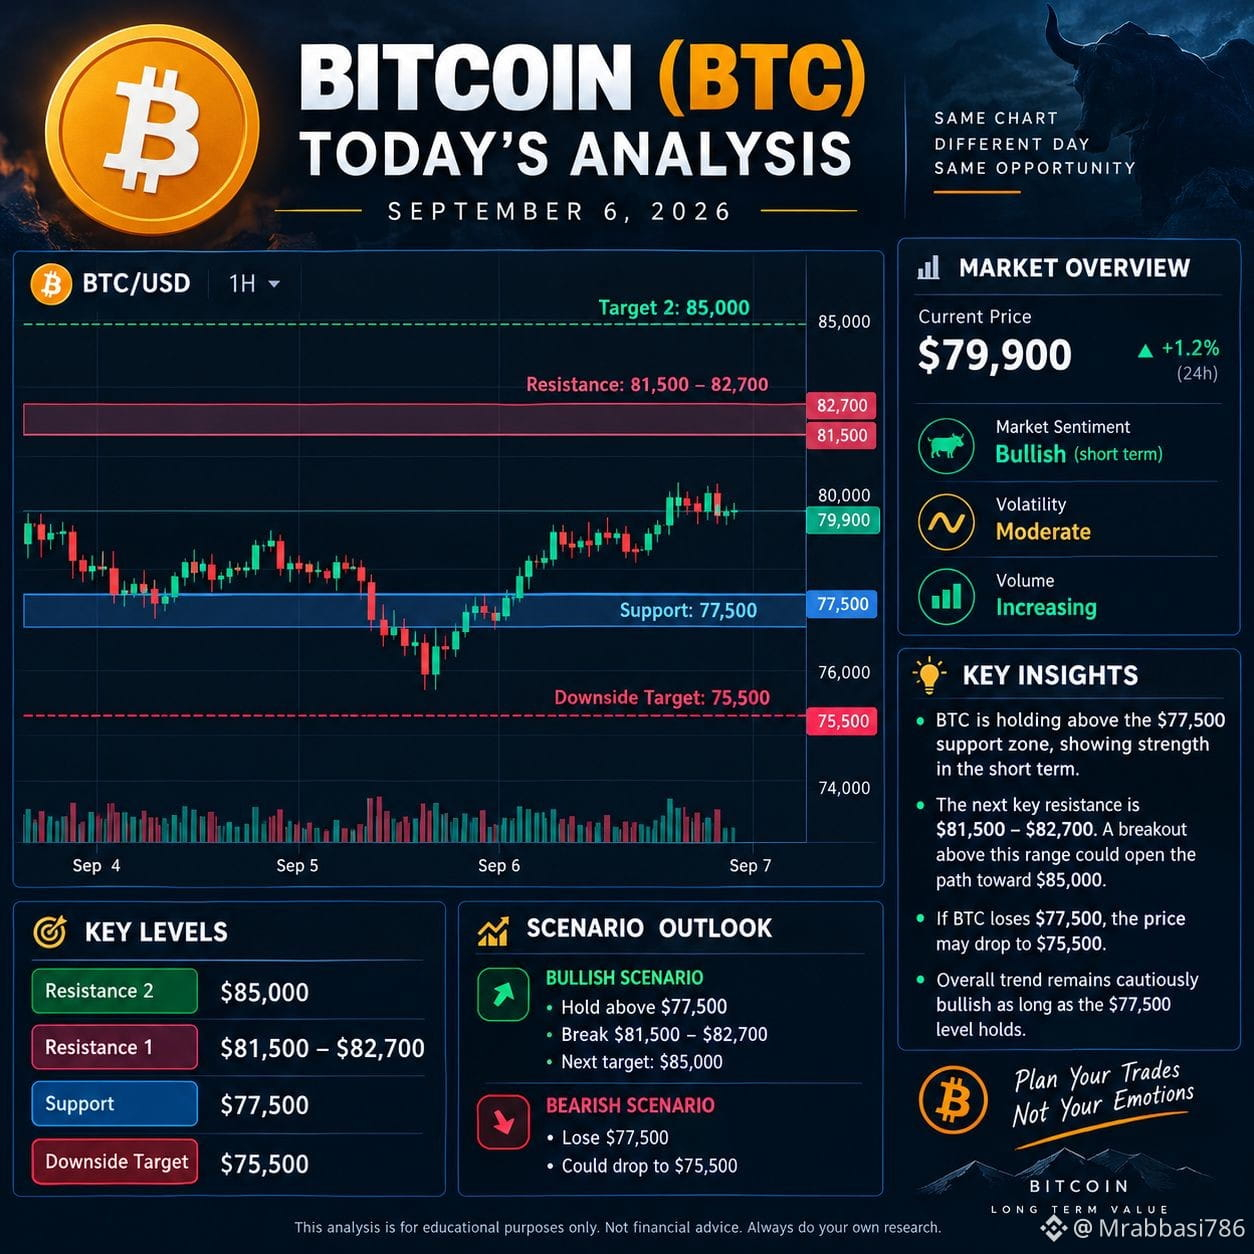
BTC is trading around $79.9K today. �
CoinGecko +1
📈 Bullish scenario:
A strong breakout above $81.5K–$82.7K could open the way toward $85K.
📉 Bearish scenario:
If BTC loses $77.5K, the next important downside area is around $75.5K.
🎯 Key levels:
Resistance: $81.5K–$82.7K
Target: $85K
Support: $77.5K
Downside: $75.5K
Short-term bias: Cautiously bullish while BTC holds $77.5K. �
cryptonews.net +1
*Educational analysis, not financial advice.*
#bitcoin #analysis #update
BTC is trading around $79.9K today. �
CoinGecko +1
📈 Bullish scenario:
A strong breakout above $81.5K–$82.7K could open the way toward $85K.
📉 Bearish scenario:
If BTC loses $77.5K, the next important downside area is around $75.5K.
🎯 Key levels:
Resistance: $81.5K–$82.7K
Target: $85K
Support: $77.5K
Downside: $75.5K
Short-term bias: Cautiously bullish while BTC holds $77.5K. �
cryptonews.net +1
*Educational analysis, not financial advice.*
#bitcoin #analysis #update
📊 Market Median / September 6, 2026
📌 30m slice: RegDev +1.32%, above SMA200 81.05%, Median RSI 51.67.
Yesterday’s long setup needed RegDev to turn positive. It did: RegDev rose from −0.55% to +1.32%, while breadth expanded from 73.10% to 81.05%. RSI eased from 53.33 to 51.67, but remains above 50.
📈 The long setup strengthened. More than 80% of coins are above SMA200 and RegDev is now positive. Overbought is only 7.02%, so broad overheating is still limited.
Trade plan: selective longs on pullbacks. As long as RSI stays above 50, breadth holds above 60–70%, and RegDev remains positive, buyers keep the edge. Shorts need a break of those conditions.
⚠️ Common mistake: chasing the move just because breadth is already above 80%.
#MarketSentimentToday #analysis $ARB $FLOCK $IOST
📌 30m slice: RegDev +1.32%, above SMA200 81.05%, Median RSI 51.67.
Yesterday’s long setup needed RegDev to turn positive. It did: RegDev rose from −0.55% to +1.32%, while breadth expanded from 73.10% to 81.05%. RSI eased from 53.33 to 51.67, but remains above 50.
📈 The long setup strengthened. More than 80% of coins are above SMA200 and RegDev is now positive. Overbought is only 7.02%, so broad overheating is still limited.
Trade plan: selective longs on pullbacks. As long as RSI stays above 50, breadth holds above 60–70%, and RegDev remains positive, buyers keep the edge. Shorts need a break of those conditions.
⚠️ Common mistake: chasing the move just because breadth is already above 80%.
#MarketSentimentToday #analysis $ARB $FLOCK $IOST

$BTC is sitting just under the 24‑hour midpoint, around $79,986, with the recent low at $79,545 and the high capped at $80,200. The price has been nudging the upper half of the range, suggesting buyers are defending the $80k barrier while sellers keep the floor near the low‑mid $79.5k zone. Volume on Binance’s spot market has been modest, indicating a pause rather than a decisive breakout. This pattern often reflects a market waiting for clearer macro cues – the latest headlines on regulatory moves and institutional interest in stablecoins are keeping sentiment cautious.
Both assets are respecting their recent swing points, a classic sign of a consolidation phase. As the market digests regulatory news and funding trends, do you think the next move will be a breakout above $80,200 for $BTC or a deeper test of the $79,500 support?
#crypto #trading #analysis #GAMERXERO
Both assets are respecting their recent swing points, a classic sign of a consolidation phase. As the market digests regulatory news and funding trends, do you think the next move will be a breakout above $80,200 for $BTC or a deeper test of the $79,500 support?
#crypto #trading #analysis #GAMERXERO


Why is $NEAR trading sideways instead of showing clear direction?
$NEAR is stuck in a tight 24-hour range, but the current position suggests more than just consolidation. The price is hovering near the midpoint of this range, which often signals indecision among traders. The 24-hour change of 0.5% further indicates a lack of strong momentum in either direction.
What traders should watch next is whether $NEAR can break out of this range or if it will continue to trade sideways. If the price moves significantly above or below the current range, it could signal the start of a new trend.
What are you watching on $NEAR right now?
Current read: $NEAR , spot tape.
If you're active: tap $NEAR , pull up NEAR/USDT, set alerts.
#near #crypto #trading #analysis
$NEAR is stuck in a tight 24-hour range, but the current position suggests more than just consolidation. The price is hovering near the midpoint of this range, which often signals indecision among traders. The 24-hour change of 0.5% further indicates a lack of strong momentum in either direction.
What traders should watch next is whether $NEAR can break out of this range or if it will continue to trade sideways. If the price moves significantly above or below the current range, it could signal the start of a new trend.
What are you watching on $NEAR right now?
Current read: $NEAR , spot tape.
If you're active: tap $NEAR , pull up NEAR/USDT, set alerts.
#near #crypto #trading #analysis

$NEAR — 1D Chart Analysis
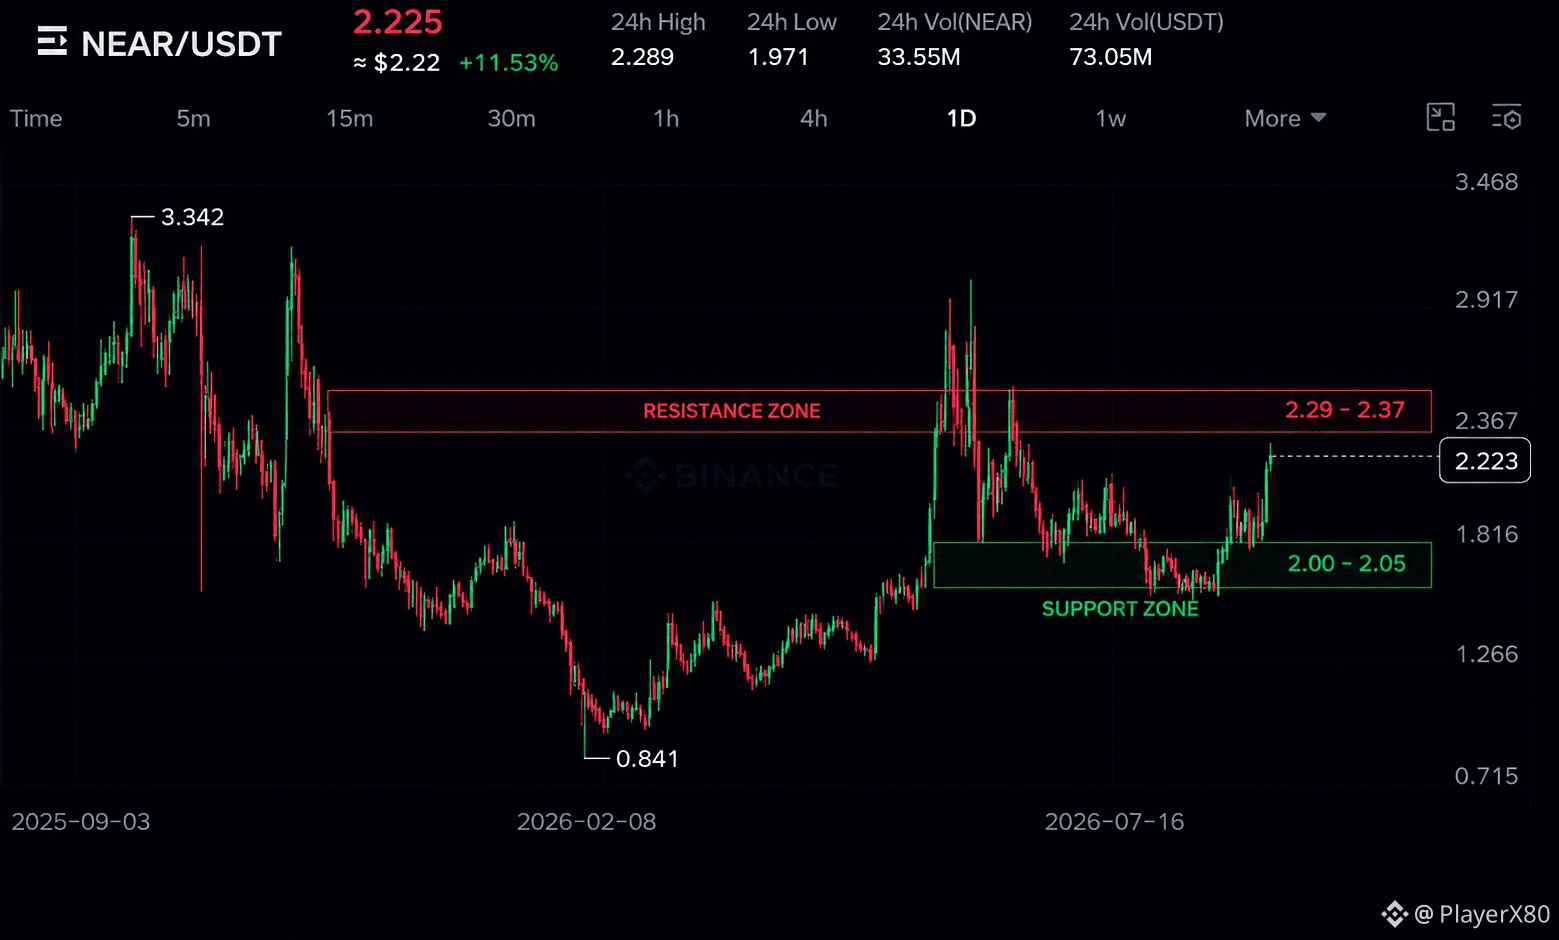
NEAR is starting to look interesting again, because after months of weakness, the chart is finally showing a move that could change the short-term structure. Price is now back around $2.22 and is pushing toward the $2.29 area, which is where the current move really starts to get tested.
Looking at the bigger picture, NEAR fell from around $3.34 all the way down to $0.84 before spending months building a base and slowly recovering. What matters now is that the price has moved back above the $2.00 area and is making higher lows instead of continuing the old downtrend.
That brings $2.29–$2.37 into focus. The $2.29 level is the current high, while $2.37 lines up with the next important area on the chart. If NEAR can break through and actually hold above that region, the recovery could extend toward $2.60–$2.75 next. I’d want to see the breakout hold rather than just one strong candle pushing through it.
On the other hand, if price gets rejected here, I’d be watching $2.00–$2.05 first. That area is important because holding it would keep the recent recovery structure intact. If NEAR loses it, the next meaningful area I'd watch is around $1.80–$1.85.
Volume is also worth watching here. Around $73M in USDT has traded over the last 24 hours, while NEAR is up 11.53%. That gives the current move some real participation, but the important part is whether that volume stays strong if price attempts to break the $2.29–$2.37 area.
So right now, I’m interested but not chasing it. NEAR has definitely improved compared with the long decline, but the reaction around $2.29–$2.37 should tell us whether this is becoming a proper recovery or just another bounce.
Current Price: $2.225
24H Change: +11.53%
24H High: $2.289
24H Low: $1.971
24H Volume: $73.05M USDT
Timeframe: 1D
Spot only. DYOR, not financial advice.
#near #analysis #spot
NEAR is starting to look interesting again, because after months of weakness, the chart is finally showing a move that could change the short-term structure. Price is now back around $2.22 and is pushing toward the $2.29 area, which is where the current move really starts to get tested.
Looking at the bigger picture, NEAR fell from around $3.34 all the way down to $0.84 before spending months building a base and slowly recovering. What matters now is that the price has moved back above the $2.00 area and is making higher lows instead of continuing the old downtrend.
That brings $2.29–$2.37 into focus. The $2.29 level is the current high, while $2.37 lines up with the next important area on the chart. If NEAR can break through and actually hold above that region, the recovery could extend toward $2.60–$2.75 next. I’d want to see the breakout hold rather than just one strong candle pushing through it.
On the other hand, if price gets rejected here, I’d be watching $2.00–$2.05 first. That area is important because holding it would keep the recent recovery structure intact. If NEAR loses it, the next meaningful area I'd watch is around $1.80–$1.85.
Volume is also worth watching here. Around $73M in USDT has traded over the last 24 hours, while NEAR is up 11.53%. That gives the current move some real participation, but the important part is whether that volume stays strong if price attempts to break the $2.29–$2.37 area.
So right now, I’m interested but not chasing it. NEAR has definitely improved compared with the long decline, but the reaction around $2.29–$2.37 should tell us whether this is becoming a proper recovery or just another bounce.
Current Price: $2.225
24H Change: +11.53%
24H High: $2.289
24H Low: $1.971
24H Volume: $73.05M USDT
Timeframe: 1D
Spot only. DYOR, not financial advice.
#near #analysis #spot
📊 Market Median / September 5, 2026
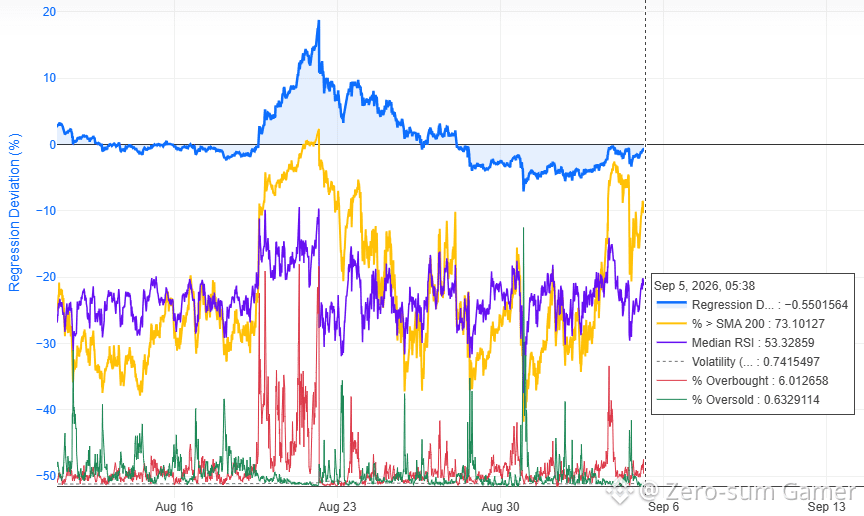
📌 30m slice: RegDev −0.55%, above SMA200 73.10%, Median RSI 53.33.
Yesterday, longs needed RSI back above 50 while breadth held above 60%. That setup is now active: RSI rose from 44.51 to 53.33, breadth remains strong at 73.10%, and RegDev improved from −2.02% to −0.55%.
📈 The long setup is back. Most coins remain above SMA200, RSI reclaimed 50, and RegDev is close to zero. Overbought is only 6.01%, so broad overheating is still limited.
Trade plan: selective longs on pullbacks. The setup gets stronger if RegDev turns positive. Shorts need RSI below 50, breadth losing 60%, and RegDev rolling over again.
⚠️ Common mistake: chasing green candles after the long setup has already confirmed instead of waiting for a pullback.
#MarketSentimentToday #analysis $ACX $DASH $NOM
📌 30m slice: RegDev −0.55%, above SMA200 73.10%, Median RSI 53.33.
Yesterday, longs needed RSI back above 50 while breadth held above 60%. That setup is now active: RSI rose from 44.51 to 53.33, breadth remains strong at 73.10%, and RegDev improved from −2.02% to −0.55%.
📈 The long setup is back. Most coins remain above SMA200, RSI reclaimed 50, and RegDev is close to zero. Overbought is only 6.01%, so broad overheating is still limited.
Trade plan: selective longs on pullbacks. The setup gets stronger if RegDev turns positive. Shorts need RSI below 50, breadth losing 60%, and RegDev rolling over again.
⚠️ Common mistake: chasing green candles after the long setup has already confirmed instead of waiting for a pullback.
#MarketSentimentToday #analysis $ACX $DASH $NOM

#analysis $USELESS
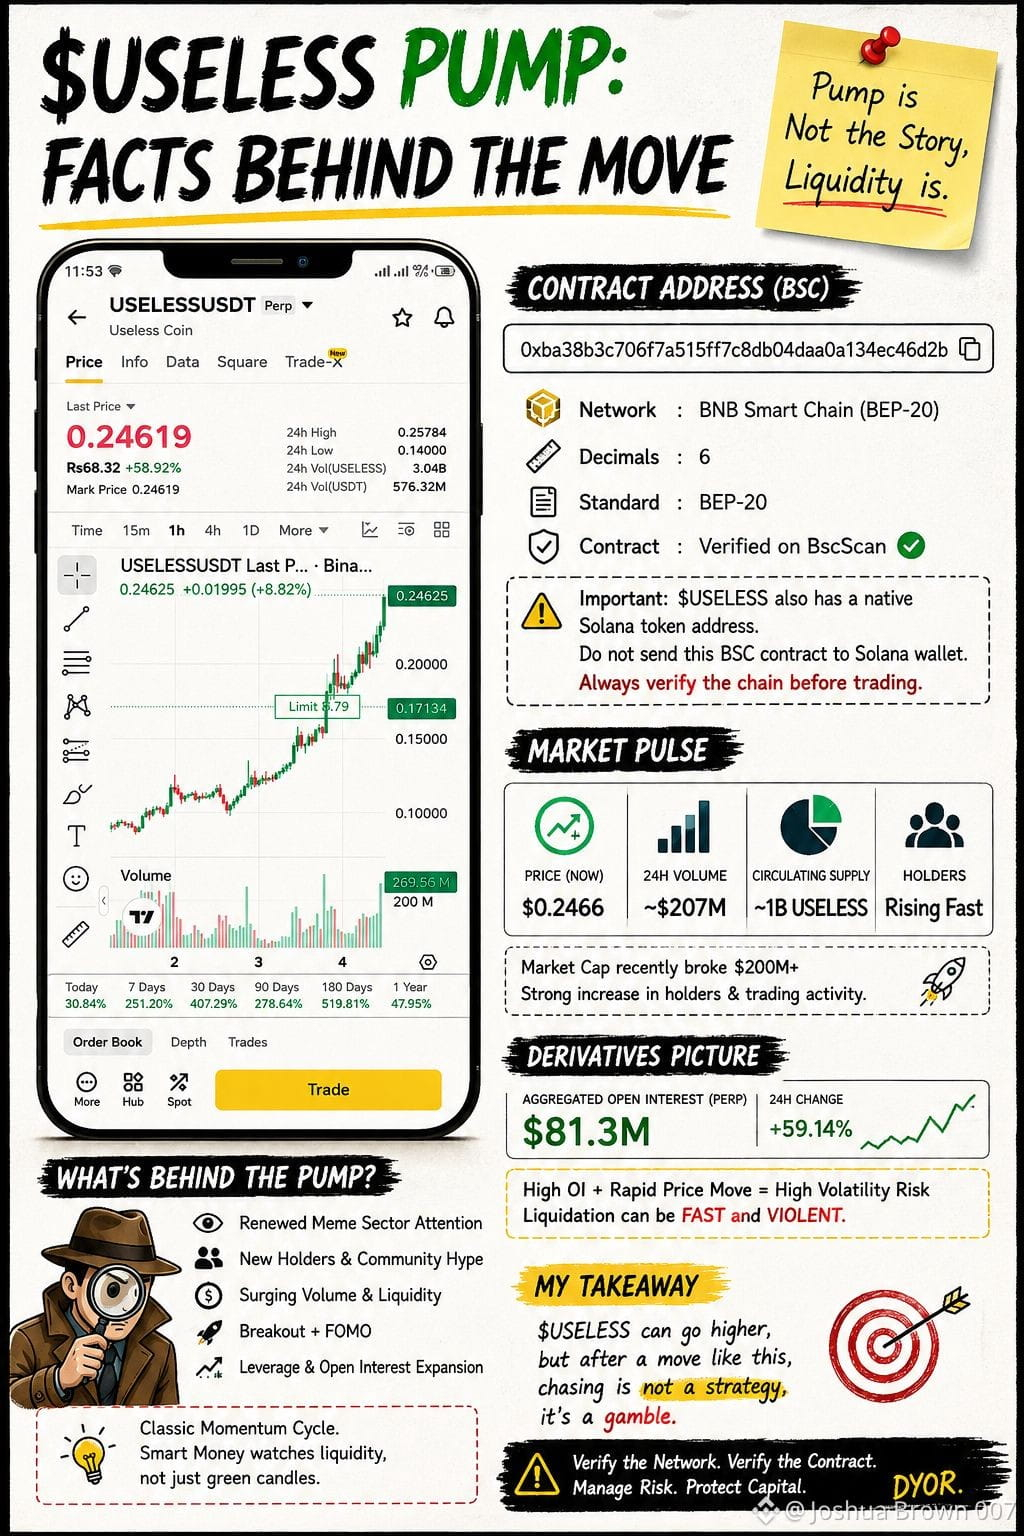
Maybe the Pump Is Not the Real Story.
Look at the chart…
+58% in 24H
+251% in 7D
And volume is exploding alongside price.
But the real question isn't:
“Why is $USELESS pumping?”
The better question is:
“Where is the liquidity and attention behind this move coming from?”
The contract is as under:
0xba38b3c706f7a515ff7c8db04daa0a134ec46d2b
This is the BNB Smart Chain BEP-20 representation, not the Solana mint address. The contract uses 6 decimals, so traders should verify the chain before interacting with it.
And this is where it gets interesting.
$USELESS has seen a massive expansion in trading activity, while the price has moved hundreds of percent in just days.
To me, this looks less like a simple pump and more like:
Narrative → Volume → Breakout → FOMO → Leverage
That is usually the stage where experienced traders start watching liquidity, holder concentration, volume quality and open interest not just the green candles.
Because chasing a pump is easy.
Understanding what is actually powering the pump is the real edge.
Always verify the network + contract address before trading.
DYOR.
Maybe the Pump Is Not the Real Story.
Look at the chart…
+58% in 24H
+251% in 7D
And volume is exploding alongside price.
But the real question isn't:
“Why is $USELESS pumping?”
The better question is:
“Where is the liquidity and attention behind this move coming from?”
The contract is as under:
0xba38b3c706f7a515ff7c8db04daa0a134ec46d2b
This is the BNB Smart Chain BEP-20 representation, not the Solana mint address. The contract uses 6 decimals, so traders should verify the chain before interacting with it.
And this is where it gets interesting.
$USELESS has seen a massive expansion in trading activity, while the price has moved hundreds of percent in just days.
To me, this looks less like a simple pump and more like:
Narrative → Volume → Breakout → FOMO → Leverage
That is usually the stage where experienced traders start watching liquidity, holder concentration, volume quality and open interest not just the green candles.
Because chasing a pump is easy.
Understanding what is actually powering the pump is the real edge.
Always verify the network + contract address before trading.
DYOR.
📊 Market Median / September 4, 2026
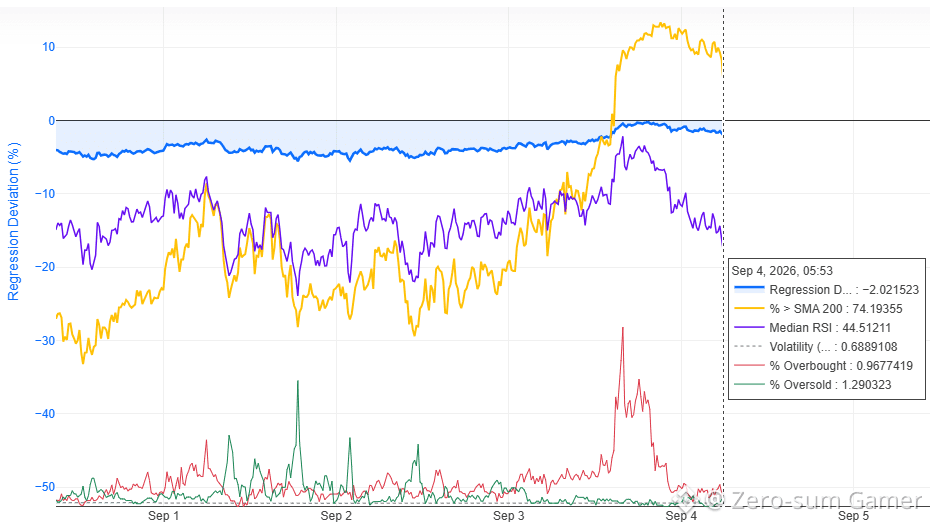
📌 30m slice: RegDev −2.02%, above SMA200 74.19%, Median RSI 44.51.
Yesterday we had a long scenario, and it played out: the market pumped in the evening and overbought reached 35% at the peak. By the current snapshot, that impulse has cooled off: RSI fell from 55.88 to 44.51, RegDev improved from −3.10% to −2.02%, while breadth expanded from 51.34% to 74.19%.
📊 Breadth is strong, but the impulse has already faded. Overbought is now just 0.97%, with oversold at 1.29%. The evening squeeze has already cleared its heat. Signals are mixed here, with no broad setup.
Trade plan: longs only if RSI gets back above 50 while breadth holds above 60%. Shorts only after a bounce, and only if breadth starts losing 60% and RegDev turns lower again.
⚠️ Common mistake: treating strong breadth after a pump as automatic continuation without a pullback and without RSI confirmation.
#MarketSentimentToday #analysis $USELESS $CHIP $EDGE
📌 30m slice: RegDev −2.02%, above SMA200 74.19%, Median RSI 44.51.
Yesterday we had a long scenario, and it played out: the market pumped in the evening and overbought reached 35% at the peak. By the current snapshot, that impulse has cooled off: RSI fell from 55.88 to 44.51, RegDev improved from −3.10% to −2.02%, while breadth expanded from 51.34% to 74.19%.
📊 Breadth is strong, but the impulse has already faded. Overbought is now just 0.97%, with oversold at 1.29%. The evening squeeze has already cleared its heat. Signals are mixed here, with no broad setup.
Trade plan: longs only if RSI gets back above 50 while breadth holds above 60%. Shorts only after a bounce, and only if breadth starts losing 60% and RegDev turns lower again.
⚠️ Common mistake: treating strong breadth after a pump as automatic continuation without a pullback and without RSI confirmation.
#MarketSentimentToday #analysis $USELESS $CHIP $EDGE

"Is $NEAR just waiting for a spark, or is something else going on?"
Right now, $NEAR is sitting right in the middle of its 24-hour range, neither climbing nor falling. The 24-hour change is flat, and the volume is low. This neutral position suggests traders are taking a breather, unsure of the next direction.
The current setup is a classic case of consolidation. It’s neither a strong breakout nor a clear capitulation. Traders are waiting to see if $NEAR can find momentum or if it will stay stuck in this mid-range limbo.
What traders should watch next is whether $NEAR can break out of this consolidation. If it can, we might see a clearer trend. If not, we could be looking at more range-bound action.
What’s your take on $NEAR right now? Is it just consolidating, or is something else happening?
Watching $NEAR vs this range.
Tap $NEAR to open NEAR/USDT and set alerts.
#near #crypto #trading #analysis
Right now, $NEAR is sitting right in the middle of its 24-hour range, neither climbing nor falling. The 24-hour change is flat, and the volume is low. This neutral position suggests traders are taking a breather, unsure of the next direction.
The current setup is a classic case of consolidation. It’s neither a strong breakout nor a clear capitulation. Traders are waiting to see if $NEAR can find momentum or if it will stay stuck in this mid-range limbo.
What traders should watch next is whether $NEAR can break out of this consolidation. If it can, we might see a clearer trend. If not, we could be looking at more range-bound action.
What’s your take on $NEAR right now? Is it just consolidating, or is something else happening?
Watching $NEAR vs this range.
Tap $NEAR to open NEAR/USDT and set alerts.
#near #crypto #trading #analysis

The Fear and Greed index sits at 74, but the tape feels like neutral ground. That gap matters. Spot volumes are moving, yet the market lacks that euphoric bid. It looks like a steady climb rather than a desperate sprint.
BTC is up 4.7% in 24 hours with dominance holding at 59.3%. ETH follows closely at 5.0%. The takeaway is that capital is rotating into Bitcoin first, then spilling into large caps. Altcoins are still waiting for the baton pass. If dominance stays this high, the current move remains top-heavy.
CHIP stands out with a 41.7% surge. Single-day spikes that size usually carry a narrative, a listing, or fresh leverage. Without follow-through, the move stays isolated. Watch if the momentum spreads to other tokens or stays contained.
The neutral sentiment reading alongside a greed score at 74 is the most interesting mismatch. Either the index lags the actual mood or traders are cautious in a way that historically precedes a bigger push. A decisive break above this range could flip that neutrality into full risk-on. A failure could turn the greed score into resistance.
Is this a pre-rally pause or a distribution phase dressed up as momentum? The next 48 hours will tell.
Like if this was helpful
#Analysis #Prediction #CryptoNews #Ethereum #Web3
📱 Follow @PoorCryptoMan
BTC is up 4.7% in 24 hours with dominance holding at 59.3%. ETH follows closely at 5.0%. The takeaway is that capital is rotating into Bitcoin first, then spilling into large caps. Altcoins are still waiting for the baton pass. If dominance stays this high, the current move remains top-heavy.
CHIP stands out with a 41.7% surge. Single-day spikes that size usually carry a narrative, a listing, or fresh leverage. Without follow-through, the move stays isolated. Watch if the momentum spreads to other tokens or stays contained.
The neutral sentiment reading alongside a greed score at 74 is the most interesting mismatch. Either the index lags the actual mood or traders are cautious in a way that historically precedes a bigger push. A decisive break above this range could flip that neutrality into full risk-on. A failure could turn the greed score into resistance.
Is this a pre-rally pause or a distribution phase dressed up as momentum? The next 48 hours will tell.
Like if this was helpful
#Analysis #Prediction #CryptoNews #Ethereum #Web3
📱 Follow @PoorCryptoMan

$TIA is medium-term BULLISH, maintaining a higher structure
Thesis: 24h volume 24.6M, funding is rotating, and money flow is clearly shifting.
Near support 0.34037, resistance 0.37195.
A break of 0.32283 is the invalidation, do not hold the position.
Risk: enter with 0.5-1% of the account, SL below support.
$TIA $BTC
#Analysis #Binance #Futures
Thesis: 24h volume 24.6M, funding is rotating, and money flow is clearly shifting.
Near support 0.34037, resistance 0.37195.
A break of 0.32283 is the invalidation, do not hold the position.
Risk: enter with 0.5-1% of the account, SL below support.
$TIA $BTC
#Analysis #Binance #Futures
$T is BULLISH with the momentum, lower timeframe is holding
Thesis: OI is opening up, long/short ratio is skewed, one side is about to get squeezed.
Agreement zone 0.004169 → 0.004556, only after a break will the direction be clear.
Break below 0.003954 is the invalidation, do not hold the position.
Risk: enter with 0.5-1% of the account, SL below support.
$T $BTC
#Analysis #Binance #Futures
Thesis: OI is opening up, long/short ratio is skewed, one side is about to get squeezed.
Agreement zone 0.004169 → 0.004556, only after a break will the direction be clear.
Break below 0.003954 is the invalidation, do not hold the position.
Risk: enter with 0.5-1% of the account, SL below support.
$T $BTC
#Analysis #Binance #Futures
Log in to explore more content