

煌道高倍激进
417 Posts

煌道高倍激进
Report
Block User
Twitter:煌道|交易之道
币安实盘:煌道量化

BNB Holder
High-Frequency Trader
8.4 Years
12 Following
1.7K+ Followers
13.5K+ Liked
Posts
All
Quotes
Videos
·
--
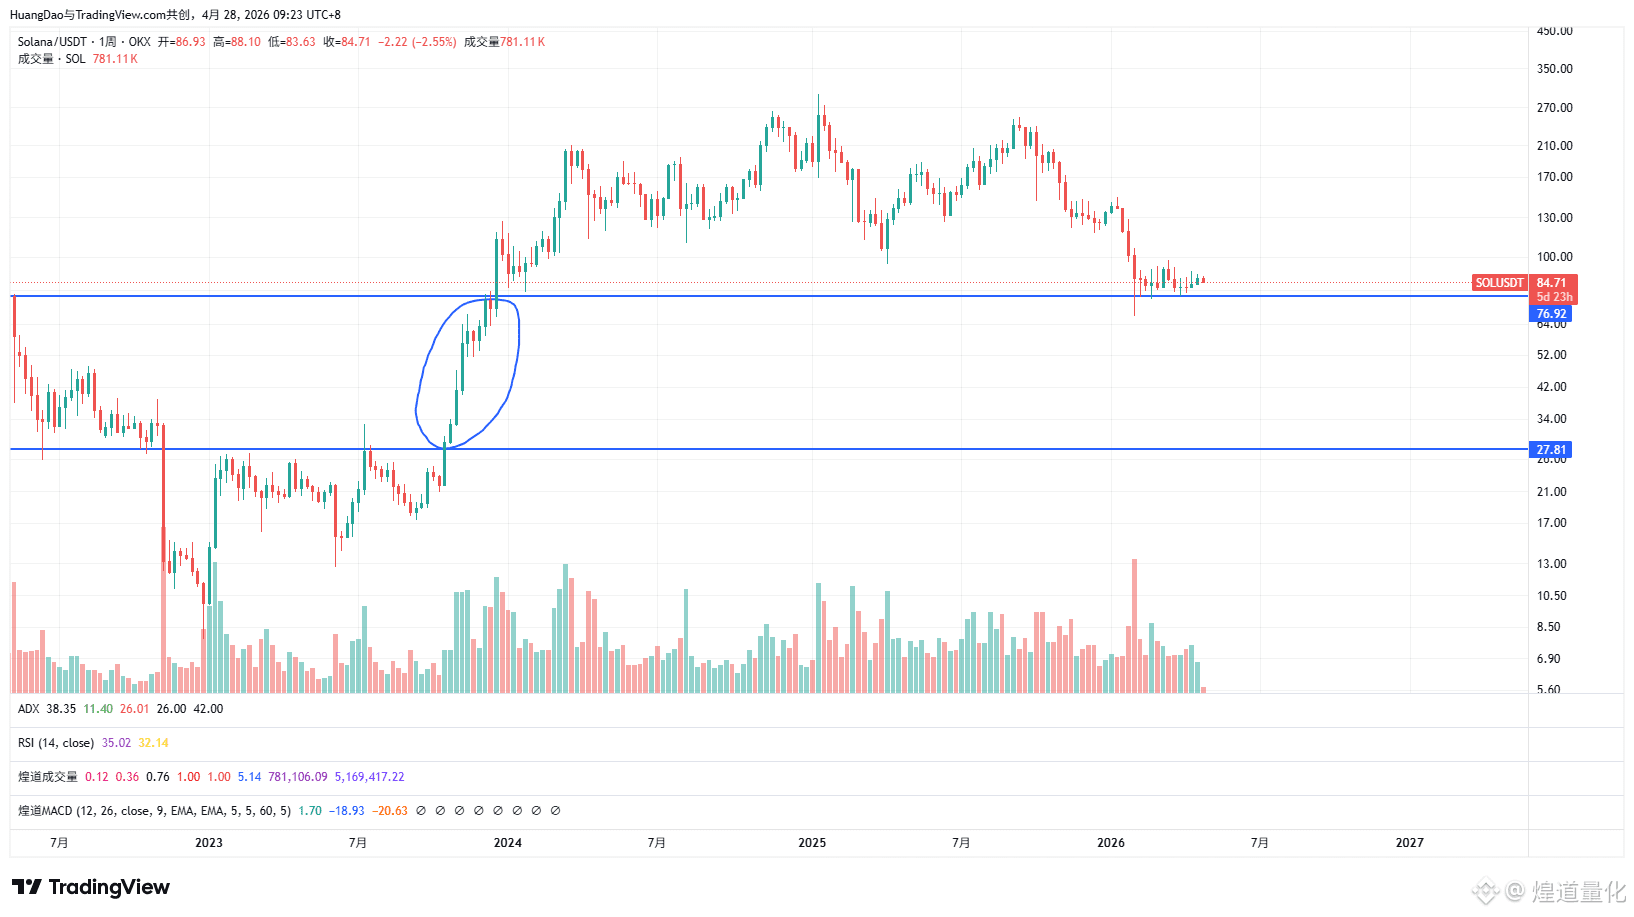
SOL could still drop 70%
1. This bounce for SOL is weak, it's basically just a sideways consolidation, not pushing up when it should, and when it’s time to drop, it’ll tank hard.
2. The range between SOL 28-77 saw some quick pumps, but there hasn't been enough accumulation. Once it effectively breaks below 77, it’ll slide smoothly, heading straight for 28.
SOL could still drop 70%
1. This bounce for SOL is weak, it's basically just a sideways consolidation, not pushing up when it should, and when it’s time to drop, it’ll tank hard.
2. The range between SOL 28-77 saw some quick pumps, but there hasn't been enough accumulation. Once it effectively breaks below 77, it’ll slide smoothly, heading straight for 28.
1. This bounce for SOL is weak, it's basically just a sideways consolidation, not pushing up when it should, and when it’s time to drop, it’ll tank hard.
2. The range between SOL 28-77 saw some quick pumps, but there hasn't been enough accumulation. Once it effectively breaks below 77, it’ll slide smoothly, heading straight for 28.
1
1k
·
--
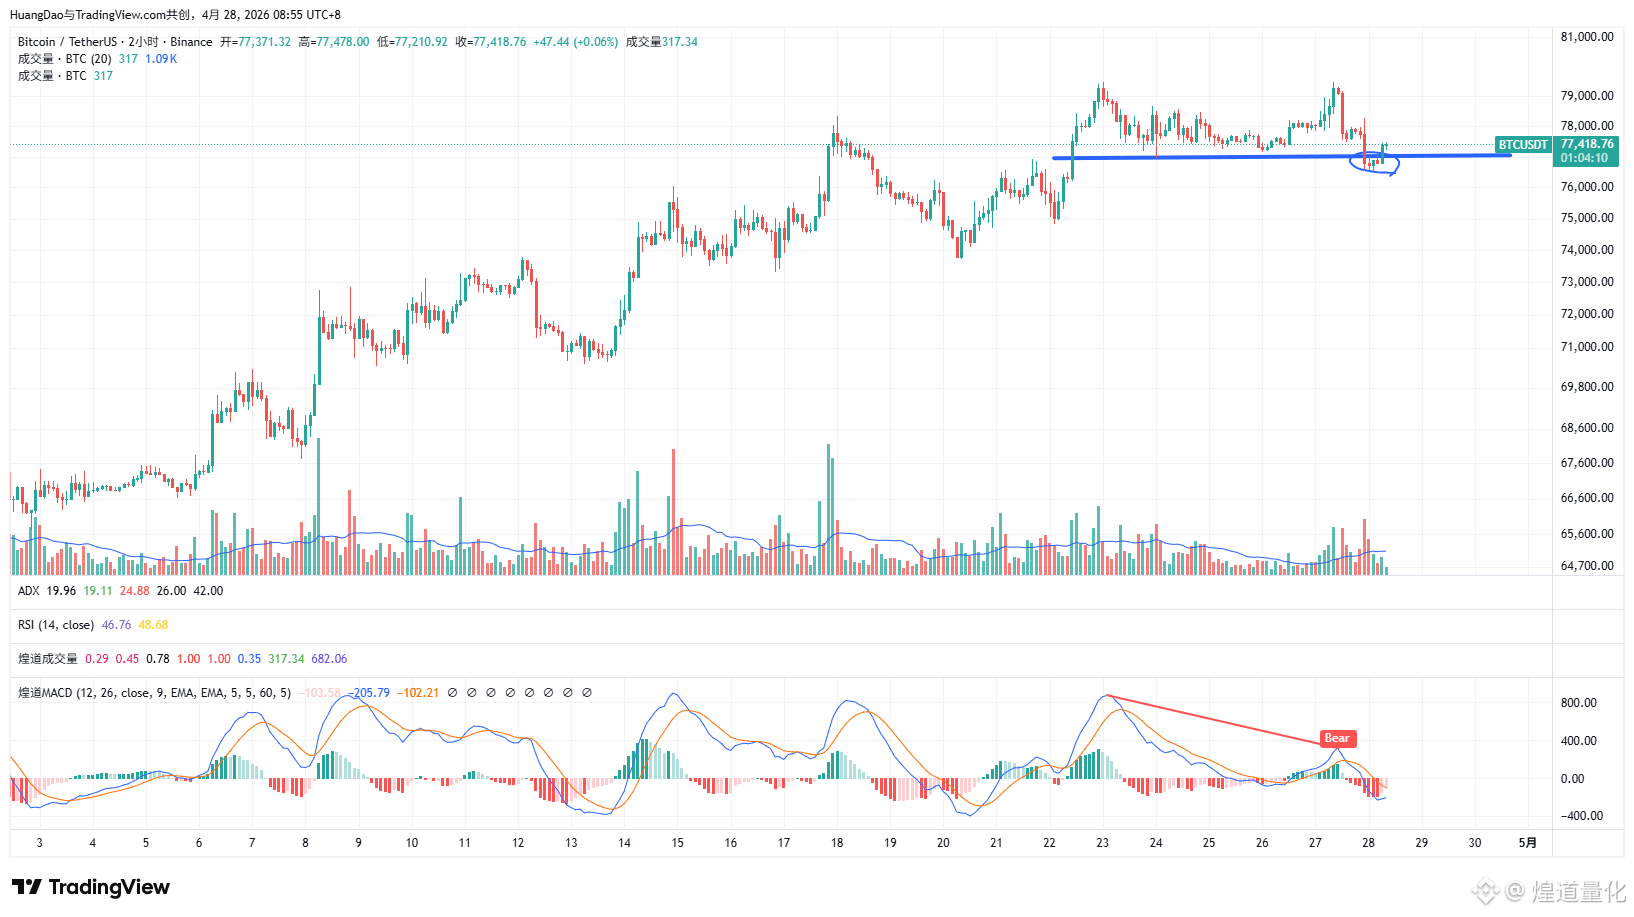
4.28 It's time to clear out all risky assets!\n1. The Nasdaq has surged 20% in the last 28 days, a rare occurrence in history, usually indicating a major top or bottom;\n2. The Buffett Indicator (total market cap of US stocks / GDP) has hit 227%, a historical high. Buffett himself said anything over 200% is playing with fire—this is a bubble of historic proportions.\n3. BTC spiked yesterday but pulled back, with increased volume, and the hourly bullish structure has broken down; this current rally might be coming to an end.\n4. US stocks are at historical peak levels, and BTC is nearing the end of its rebound; it's the right time to cash out all risky assets.
4.28 It's time to clear out all risky assets!\n1. The Nasdaq has surged 20% in the last 28 days, a rare occurrence in history, usually indicating a major top or bottom;\n2. The Buffett Indicator (total market cap of US stocks / GDP) has hit 227%, a historical high. Buffett himself said anything over 200% is playing with fire—this is a bubble of historic proportions.\n3. BTC spiked yesterday but pulled back, with increased volume, and the hourly bullish structure has broken down; this current rally might be coming to an end.\n4. US stocks are at historical peak levels, and BTC is nearing the end of its rebound; it's the right time to cash out all risky assets.
1
1.1k
·
--
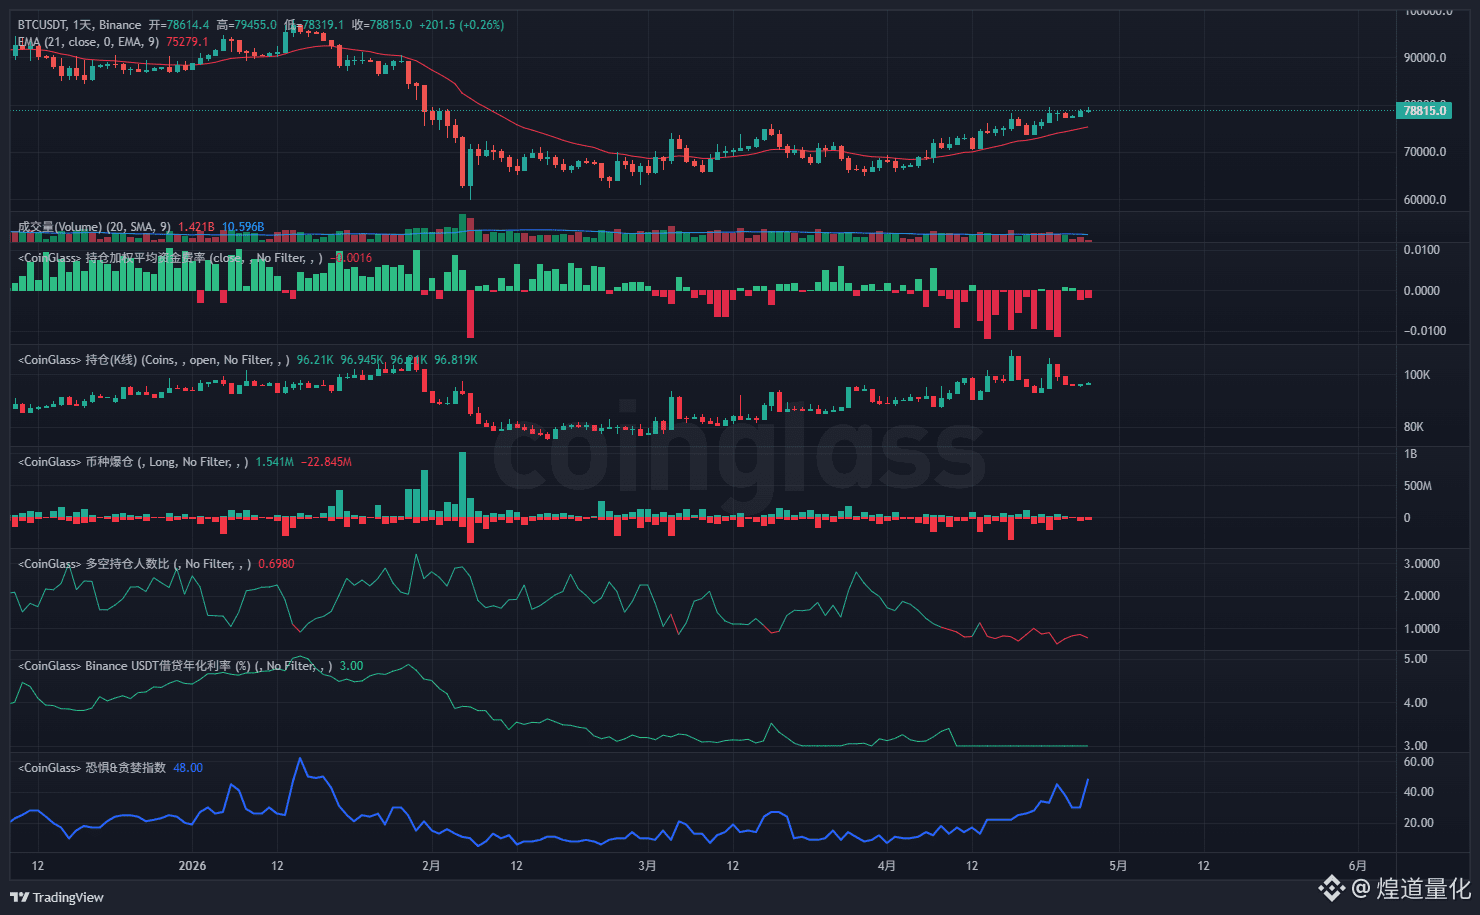
4.27 The Coming Month Might See a Bull-Bear Flip
1. BTC has been on a continuous bounce for four weeks, now entering the 80k-86k resistance zone
2. Funding rates have shifted from significantly negative to slightly negative, while the fear and greed index has moved from extreme fear to neutral
3. The HYPE wallet retail positions have shifted from bearish to slightly bullish, while the whales have transitioned from bullish to hesitant
4. Market sentiment has shifted from overly bearish to neutral; we just need one more surge to ignite the market, which will also mark the end of the rebound trend
4.27 The Coming Month Might See a Bull-Bear Flip
1. BTC has been on a continuous bounce for four weeks, now entering the 80k-86k resistance zone
2. Funding rates have shifted from significantly negative to slightly negative, while the fear and greed index has moved from extreme fear to neutral
3. The HYPE wallet retail positions have shifted from bearish to slightly bullish, while the whales have transitioned from bullish to hesitant
4. Market sentiment has shifted from overly bearish to neutral; we just need one more surge to ignite the market, which will also mark the end of the rebound trend
1. BTC has been on a continuous bounce for four weeks, now entering the 80k-86k resistance zone
2. Funding rates have shifted from significantly negative to slightly negative, while the fear and greed index has moved from extreme fear to neutral
3. The HYPE wallet retail positions have shifted from bearish to slightly bullish, while the whales have transitioned from bullish to hesitant
4. Market sentiment has shifted from overly bearish to neutral; we just need one more surge to ignite the market, which will also mark the end of the rebound trend
501
·
--
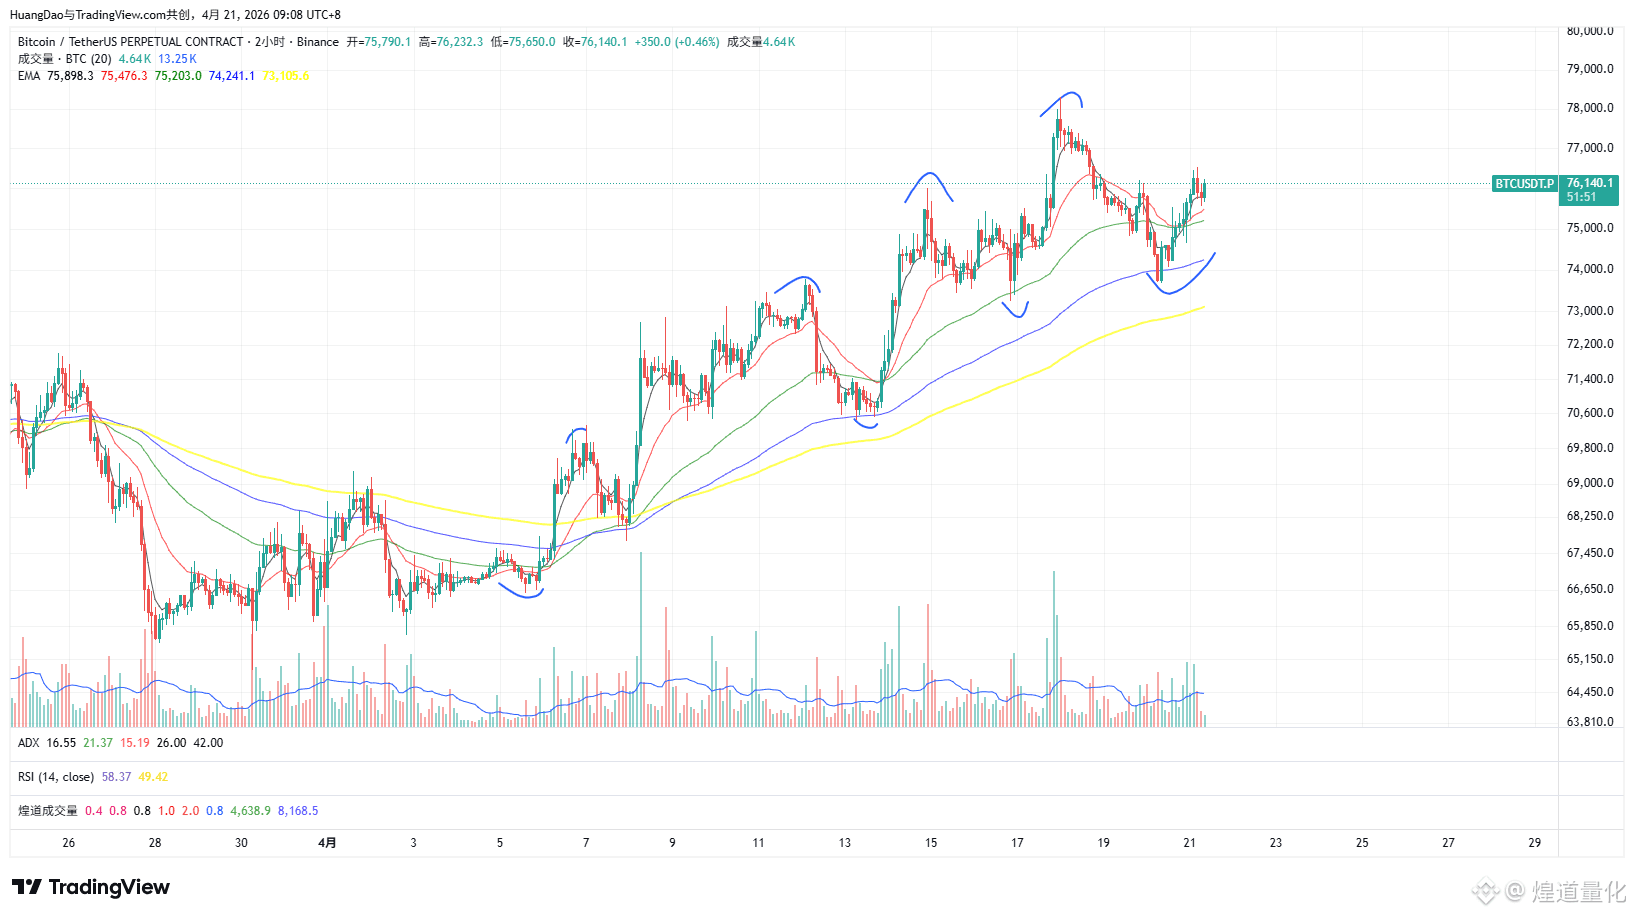
4.21 The shorts that seek to carve a boat to find a sword will be crushed
1. From the market perspective, the hourly level remains a complete bullish structure with constantly rising highs and lows, and has not accelerated in growth yet
2. From the sentiment perspective, the continuous negative funding rate, the overwhelming discourse of carving a boat to find a sword, and the comments on the false breakout at 78000
3. From the market perspective, the US stock market has continued to decline for 2 months, BTC has not fallen below 60000, and now the US stock market is reaching new highs
These shorts, who follow the crowd and echo others, will be crushed, and BTC will return above 80000
4.21 The shorts that seek to carve a boat to find a sword will be crushed
1. From the market perspective, the hourly level remains a complete bullish structure with constantly rising highs and lows, and has not accelerated in growth yet
2. From the sentiment perspective, the continuous negative funding rate, the overwhelming discourse of carving a boat to find a sword, and the comments on the false breakout at 78000
3. From the market perspective, the US stock market has continued to decline for 2 months, BTC has not fallen below 60000, and now the US stock market is reaching new highs
These shorts, who follow the crowd and echo others, will be crushed, and BTC will return above 80000
1. From the market perspective, the hourly level remains a complete bullish structure with constantly rising highs and lows, and has not accelerated in growth yet
2. From the sentiment perspective, the continuous negative funding rate, the overwhelming discourse of carving a boat to find a sword, and the comments on the false breakout at 78000
3. From the market perspective, the US stock market has continued to decline for 2 months, BTC has not fallen below 60000, and now the US stock market is reaching new highs
These shorts, who follow the crowd and echo others, will be crushed, and BTC will return above 80000
1
1
345
·
--
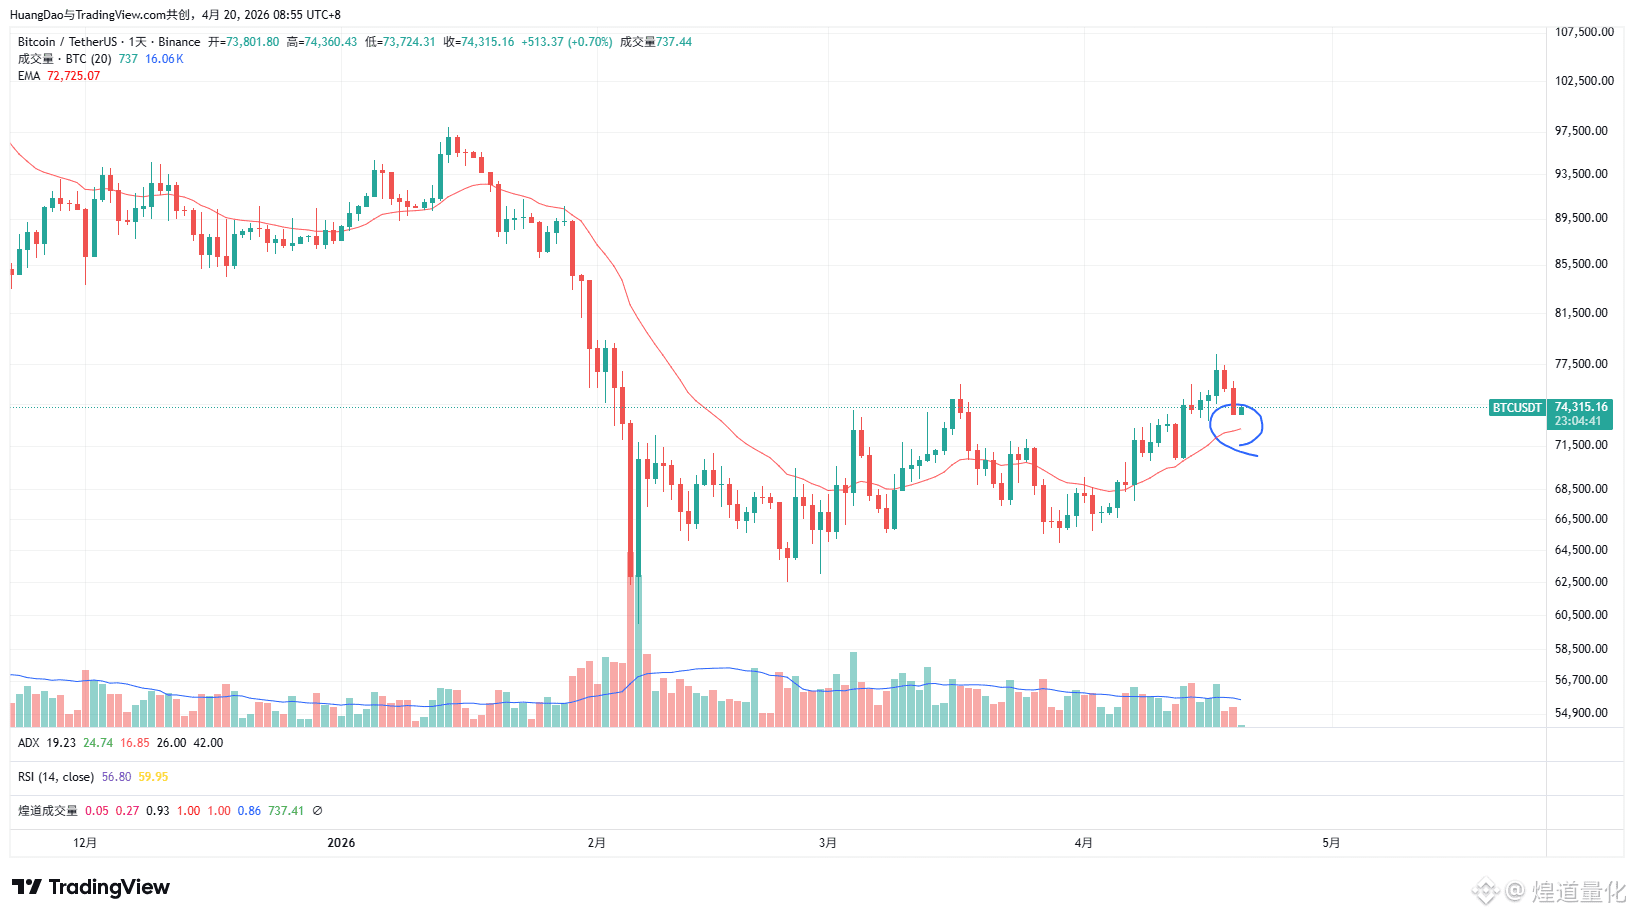
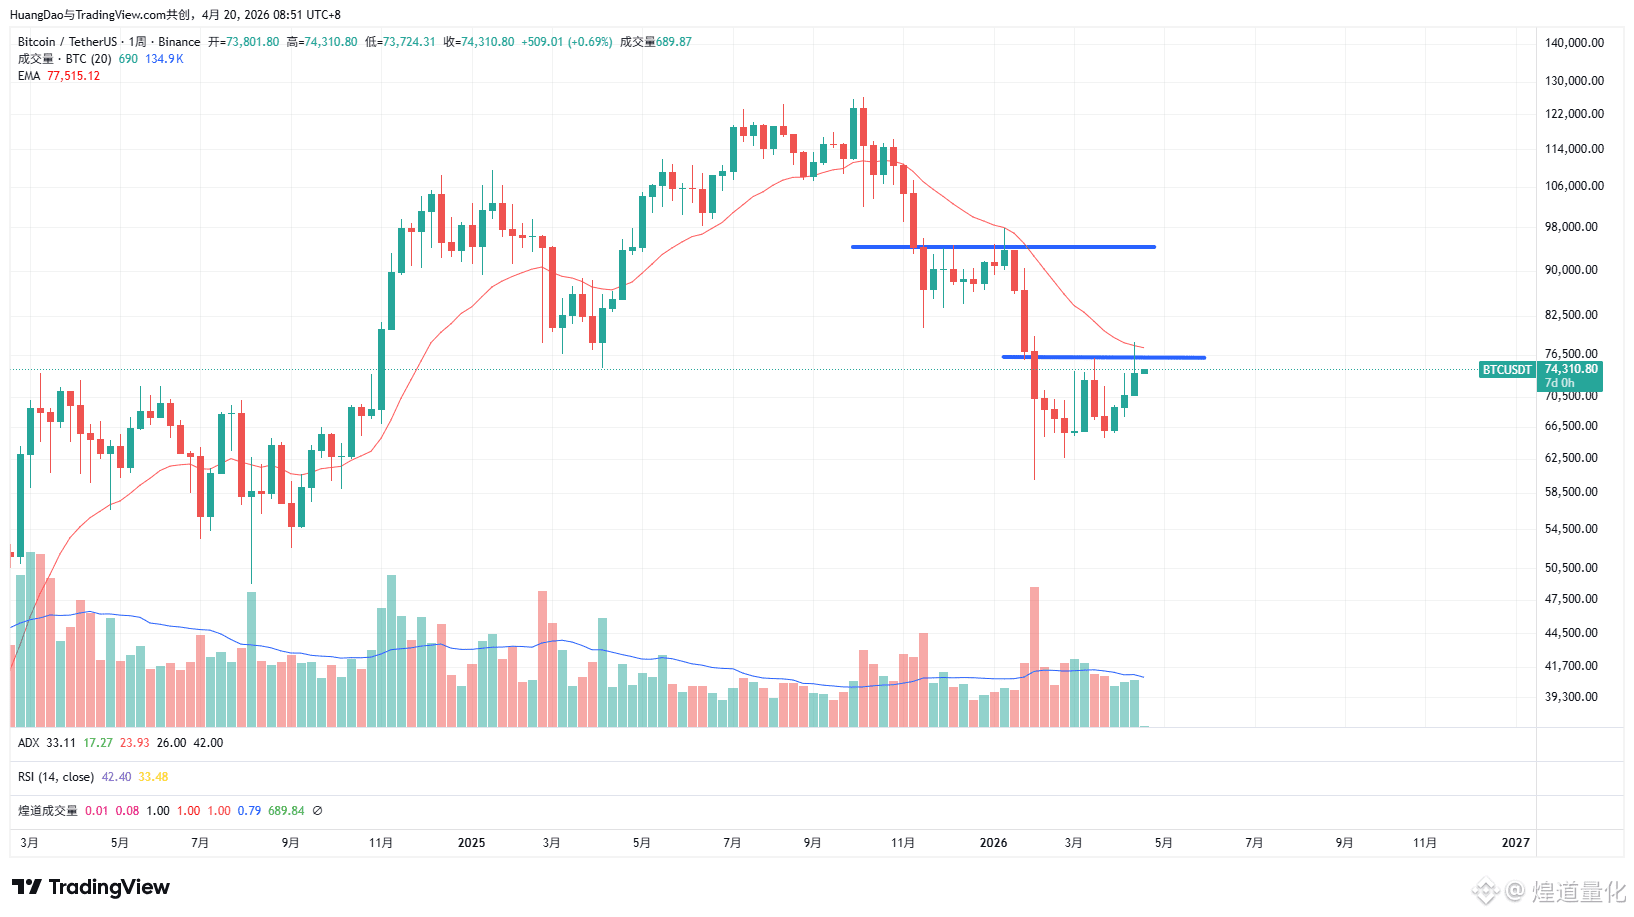
4.20 History Repeating or Something Else?
1. BTC surged last week and had a slight pullback, similar to the wave in January at 98000, also breaking out of the consolidation zone before rising to the EMA20 position of the weekly chart and starting to pull back.
2. However, history does not simply repeat itself. Although BTC has reached the minimum value of 78000 that I expected for this rebound, it still appears to be ongoing.
3. My standard for measuring the end of the rebound is an effective daily K line break below the EMA20.
4.20 History Repeating or Something Else?
1. BTC surged last week and had a slight pullback, similar to the wave in January at 98000, also breaking out of the consolidation zone before rising to the EMA20 position of the weekly chart and starting to pull back.
2. However, history does not simply repeat itself. Although BTC has reached the minimum value of 78000 that I expected for this rebound, it still appears to be ongoing.
3. My standard for measuring the end of the rebound is an effective daily K line break below the EMA20.
1. BTC surged last week and had a slight pullback, similar to the wave in January at 98000, also breaking out of the consolidation zone before rising to the EMA20 position of the weekly chart and starting to pull back.
2. However, history does not simply repeat itself. Although BTC has reached the minimum value of 78000 that I expected for this rebound, it still appears to be ongoing.
3. My standard for measuring the end of the rebound is an effective daily K line break below the EMA20.
309
·
--
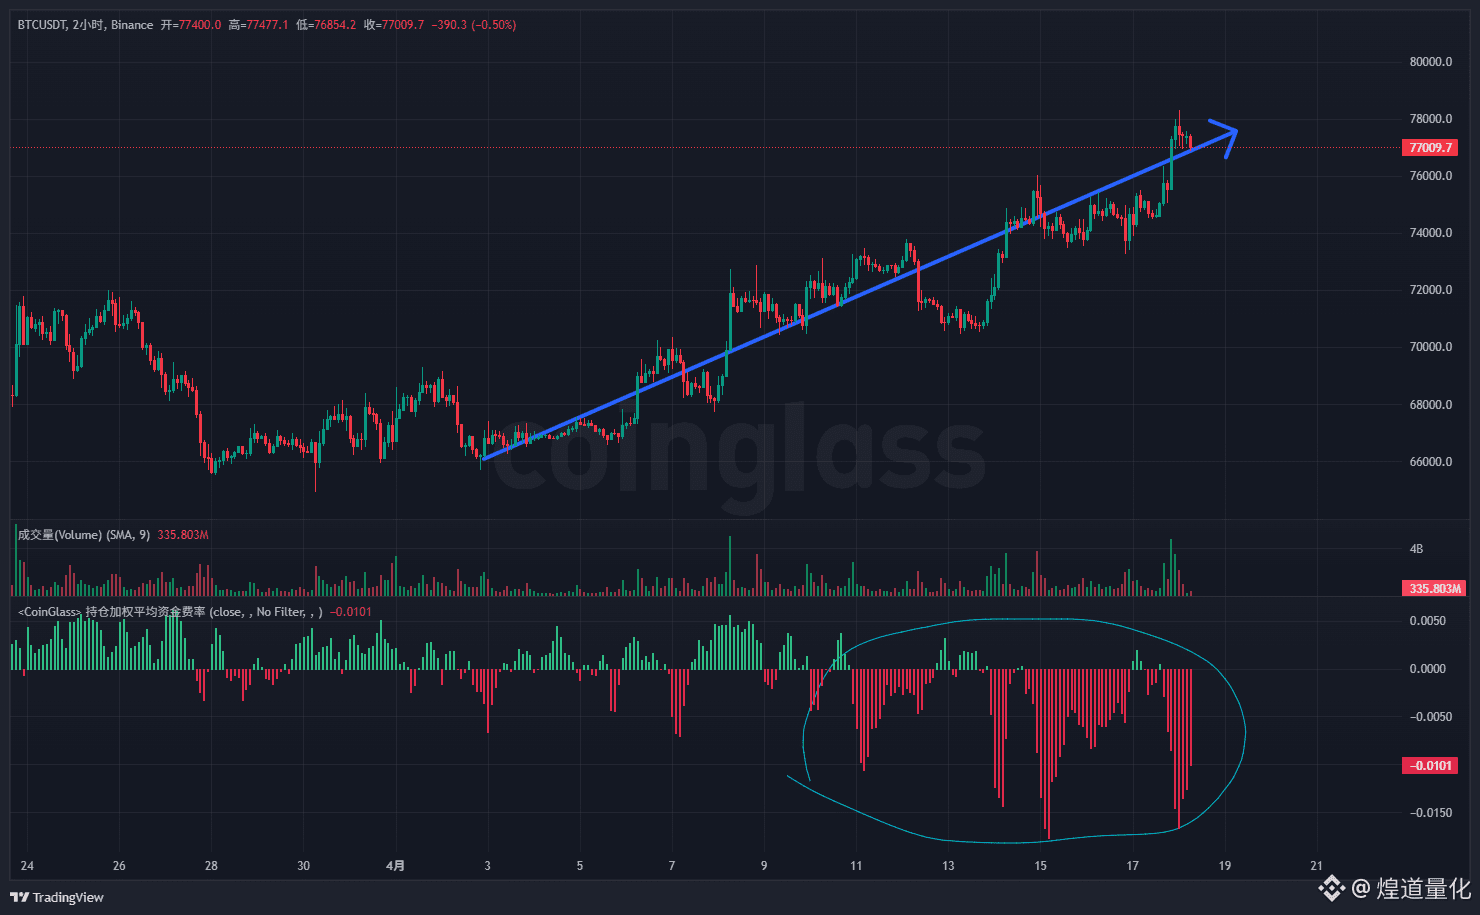
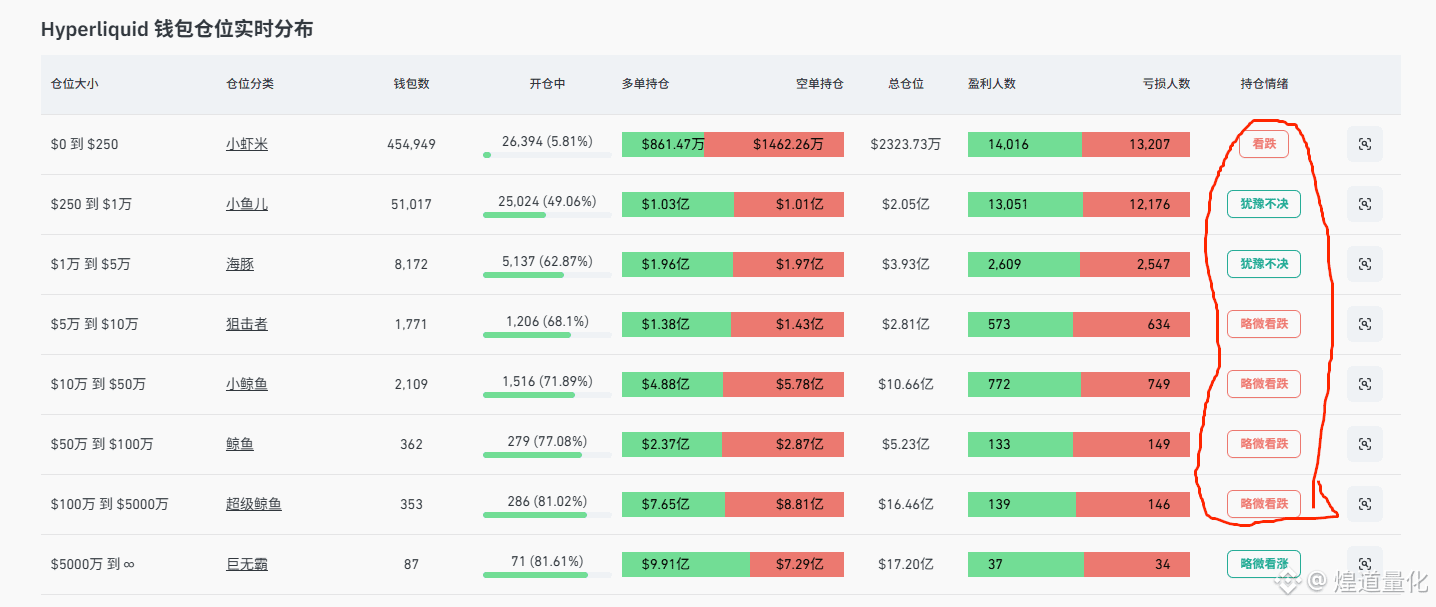
BTC has been rising all the way, but the funding rate is increasingly negative
The small shrimp accounts with the most participants starting at 70,000 are continuously shorting and losing money
Accounts with medium positions starting at 74,000 have joined the shorting army
Only the giant accounts have been going long all the way, and are still increasing their long positions
Various retail investors are rushing to short, either believing they have reached a resistance level or mistakenly thinking it is a false breakout
The truth is that as long as this group of shorts is not wiped out, the rebound will not stop
BTC has been rising all the way, but the funding rate is increasingly negative
The small shrimp accounts with the most participants starting at 70,000 are continuously shorting and losing money
Accounts with medium positions starting at 74,000 have joined the shorting army
Only the giant accounts have been going long all the way, and are still increasing their long positions
Various retail investors are rushing to short, either believing they have reached a resistance level or mistakenly thinking it is a false breakout
The truth is that as long as this group of shorts is not wiped out, the rebound will not stop
The small shrimp accounts with the most participants starting at 70,000 are continuously shorting and losing money
Accounts with medium positions starting at 74,000 have joined the shorting army
Only the giant accounts have been going long all the way, and are still increasing their long positions
Various retail investors are rushing to short, either believing they have reached a resistance level or mistakenly thinking it is a false breakout
The truth is that as long as this group of shorts is not wiped out, the rebound will not stop
440
·
--

Article
[Crypto Morning Report] April 18, 2026 07:04 HKT (Saturday)1. Important Market Information
BTC $77,250 (+3.06% 🚀)|24H High $78,348 / Low $74,531
ETH / SOL / BNB / XRP real-time interface limited today, reference yesterday's close: ETH ~$2,342|SOL ~$89|BNB ~$633|XRP ~$1.45
Today's biggest catalyst: Trump announces Iran's commitment to open the Strait of Hormuz 🔓
BTC surged from $74,500 to a high of $78,348 in a single day, close to breaking the key resistance of $79K—this is the largest single-day increase in the past month. Oil prices have also dropped significantly, and the core source of inflation pressure has suddenly eased, with the market fully pricing in a risk-on mode and expectations of a ceasefire.
[Crypto Morning Report] April 18, 2026 07:04 HKT (Saturday)
1. Important Market Information
BTC $77,250 (+3.06% 🚀)|24H High $78,348 / Low $74,531
ETH / SOL / BNB / XRP real-time interface limited today, reference yesterday's close: ETH ~$2,342|SOL ~$89|BNB ~$633|XRP ~$1.45
Today's biggest catalyst: Trump announces Iran's commitment to open the Strait of Hormuz 🔓
BTC surged from $74,500 to a high of $78,348 in a single day, close to breaking the key resistance of $79K—this is the largest single-day increase in the past month. Oil prices have also dropped significantly, and the core source of inflation pressure has suddenly eased, with the market fully pricing in a risk-on mode and expectations of a ceasefire.
BTC $77,250 (+3.06% 🚀)|24H High $78,348 / Low $74,531
ETH / SOL / BNB / XRP real-time interface limited today, reference yesterday's close: ETH ~$2,342|SOL ~$89|BNB ~$633|XRP ~$1.45
Today's biggest catalyst: Trump announces Iran's commitment to open the Strait of Hormuz 🔓
BTC surged from $74,500 to a high of $78,348 in a single day, close to breaking the key resistance of $79K—this is the largest single-day increase in the past month. Oil prices have also dropped significantly, and the core source of inflation pressure has suddenly eased, with the market fully pricing in a risk-on mode and expectations of a ceasefire.
41
·
--
4.18 Views and Operations for the Market Ahead
1. Selling more as BTC rises above 78000 after the previous bottom fishing; this is the strongest rebound in this bear market, but it is merely a rebound.
2. The rebound is not over yet; in the next two to three weeks, focus on observing the 80000-85000 trend, especially around 83000, to capture a long-term short opportunity.
4.18 Views and Operations for the Market Ahead
1. Selling more as BTC rises above 78000 after the previous bottom fishing; this is the strongest rebound in this bear market, but it is merely a rebound.
2. The rebound is not over yet; in the next two to three weeks, focus on observing the 80000-85000 trend, especially around 83000, to capture a long-term short opportunity.
1. Selling more as BTC rises above 78000 after the previous bottom fishing; this is the strongest rebound in this bear market, but it is merely a rebound.
2. The rebound is not over yet; in the next two to three weeks, focus on observing the 80000-85000 trend, especially around 83000, to capture a long-term short opportunity.
317
·
--

Article
[Crypto Morning Report] April 17, 2026────────────
1. Important Market Information
BTC $74,924 (-0.09% ↔) | 24H High $75,535 / Low $73,285
ETH $2,342 (-1.15% 🔴) | SOL $89.01 (+4.57% 🟢) | BNB $633 (+1.30% 🟢) | XRP $1.45 (+3.73% 🟢)
BTC is consolidating in the $74-75K range, with SOL and XRP showing significant outperformance today (+4.57% / +3.73%), indicating a clear rotation of funds. ETH is slightly down against the trend, with news of core researchers leaving putting pressure (see below). BTC fell back again after reaching $75,535 yesterday, with clear resistance still above $75K.
────────────
[Crypto Morning Report] April 17, 2026
────────────
1. Important Market Information
BTC $74,924 (-0.09% ↔) | 24H High $75,535 / Low $73,285
ETH $2,342 (-1.15% 🔴) | SOL $89.01 (+4.57% 🟢) | BNB $633 (+1.30% 🟢) | XRP $1.45 (+3.73% 🟢)
BTC is consolidating in the $74-75K range, with SOL and XRP showing significant outperformance today (+4.57% / +3.73%), indicating a clear rotation of funds. ETH is slightly down against the trend, with news of core researchers leaving putting pressure (see below). BTC fell back again after reaching $75,535 yesterday, with clear resistance still above $75K.
────────────
1. Important Market Information
BTC $74,924 (-0.09% ↔) | 24H High $75,535 / Low $73,285
ETH $2,342 (-1.15% 🔴) | SOL $89.01 (+4.57% 🟢) | BNB $633 (+1.30% 🟢) | XRP $1.45 (+3.73% 🟢)
BTC is consolidating in the $74-75K range, with SOL and XRP showing significant outperformance today (+4.57% / +3.73%), indicating a clear rotation of funds. ETH is slightly down against the trend, with news of core researchers leaving putting pressure (see below). BTC fell back again after reaching $75,535 yesterday, with clear resistance still above $75K.
────────────
75
·
--
4.17 Shanzhai Demons Dance
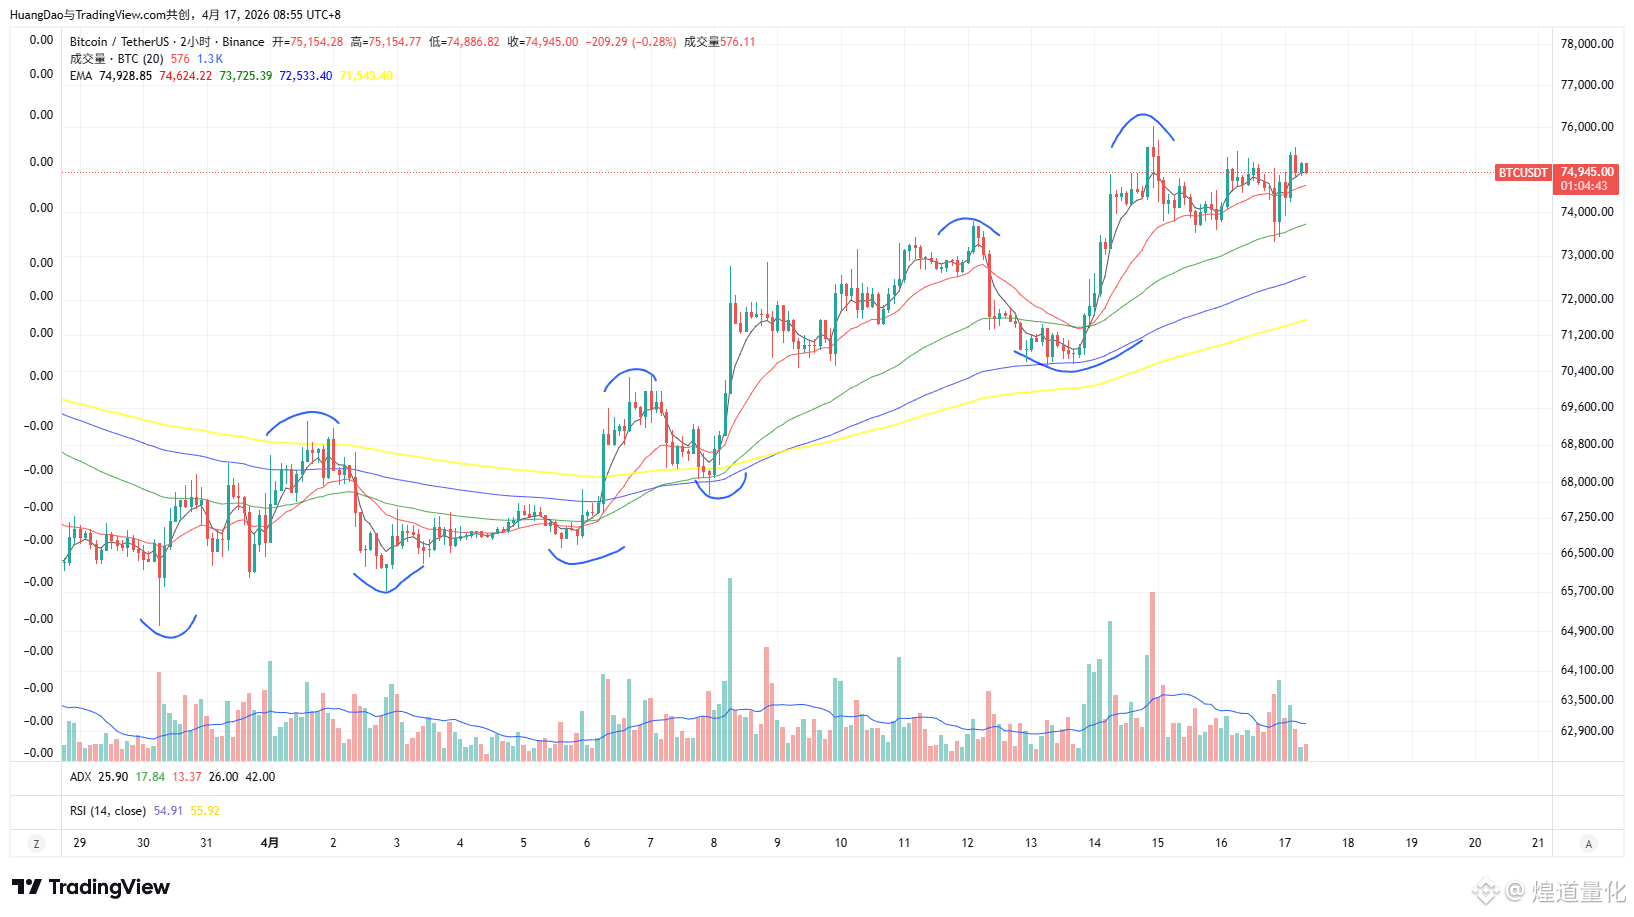
1. Shanzhai Explosion, the MEME section is in chaos, ORDI, siren, based doubling in a day, the dog farm starts to take advantage of the situation
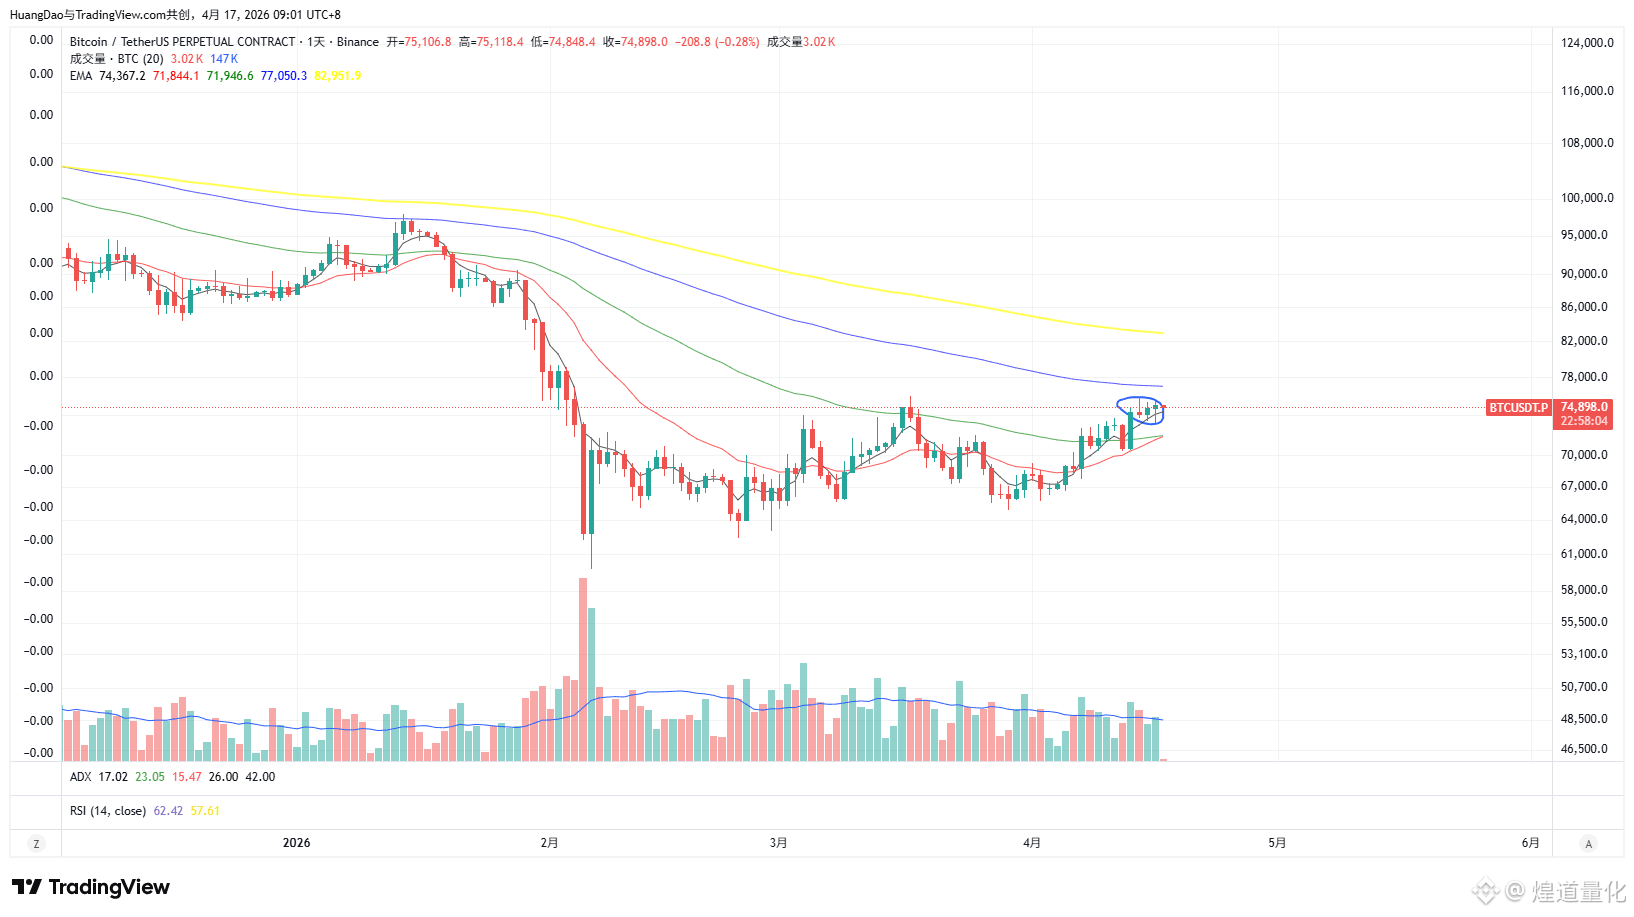
2. Emotionally, BTC is still dominated by retail bears, with a sustained negative funding rate and an imbalance long-short ratio of 0.76
3. On the chart, the hourly level still shows a continuation of the bullish trend, and yesterday's daily line closed with a long lower shadow and pierced the lows of the previous two days, which is a bullish signal. It is expected that 76000 will be broken at any time.
4.17 Shanzhai Demons Dance
1. Shanzhai Explosion, the MEME section is in chaos, ORDI, siren, based doubling in a day, the dog farm starts to take advantage of the situation
2. Emotionally, BTC is still dominated by retail bears, with a sustained negative funding rate and an imbalance long-short ratio of 0.76
3. On the chart, the hourly level still shows a continuation of the bullish trend, and yesterday's daily line closed with a long lower shadow and pierced the lows of the previous two days, which is a bullish signal. It is expected that 76000 will be broken at any time.
1. Shanzhai Explosion, the MEME section is in chaos, ORDI, siren, based doubling in a day, the dog farm starts to take advantage of the situation
2. Emotionally, BTC is still dominated by retail bears, with a sustained negative funding rate and an imbalance long-short ratio of 0.76
3. On the chart, the hourly level still shows a continuation of the bullish trend, and yesterday's daily line closed with a long lower shadow and pierced the lows of the previous two days, which is a bullish signal. It is expected that 76000 will be broken at any time.
94
·
--
3 charts tell you why the bears will still be heavily punished
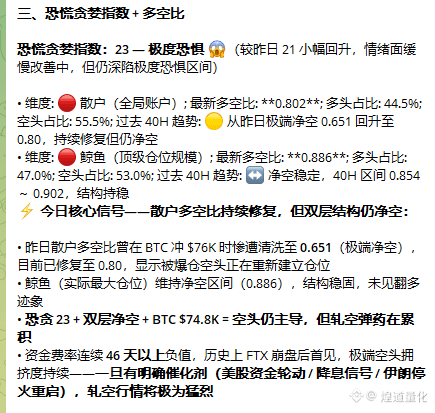
1. Funding rate: continuously negative, and the Binance USDT lending rate has dropped to an annualized floor price of 3%, with no interest in lending, retail sentiment is low
2. Long-short ratio AI monitoring: when BTC broke 76000, the long-short ratio dropped to 0.65, extreme net short, retail investors suffered heavy losses, now it has recovered to 0.8, still leaning bearish
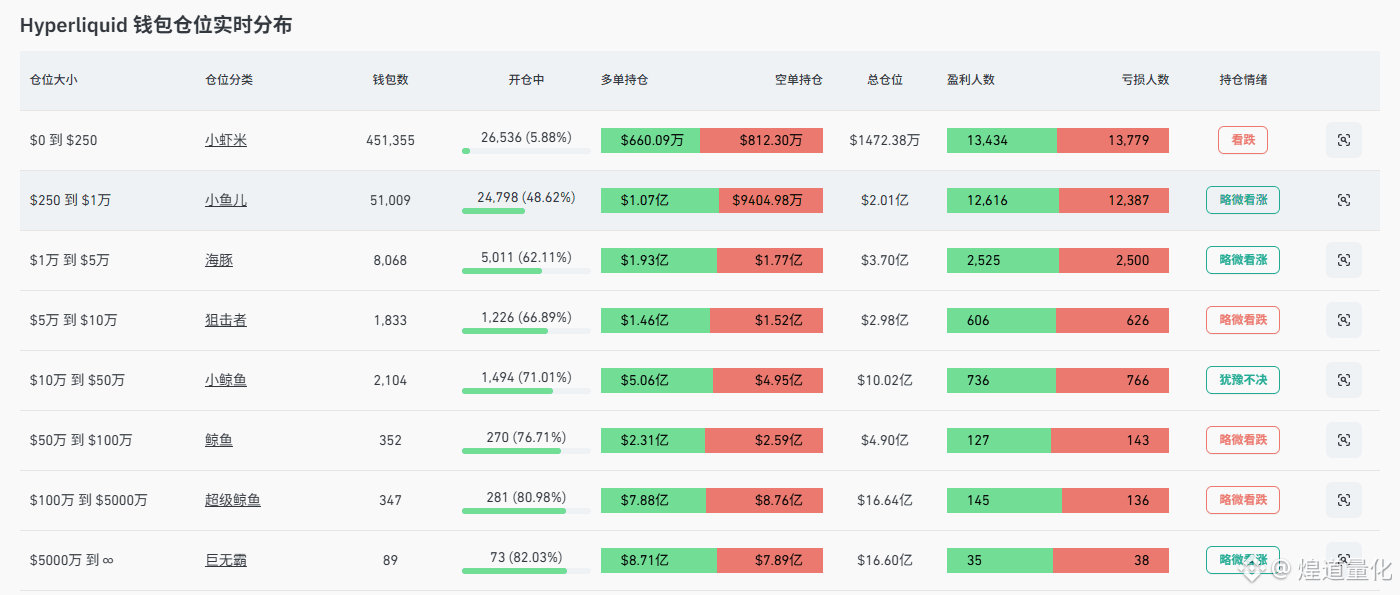
3. Hyperliquid wallet: small players are still short, while giants have taken profits on some long positions but remain bullish
3 charts tell you why the bears will still be heavily punished
1. Funding rate: continuously negative, and the Binance USDT lending rate has dropped to an annualized floor price of 3%, with no interest in lending, retail sentiment is low
2. Long-short ratio AI monitoring: when BTC broke 76000, the long-short ratio dropped to 0.65, extreme net short, retail investors suffered heavy losses, now it has recovered to 0.8, still leaning bearish
3. Hyperliquid wallet: small players are still short, while giants have taken profits on some long positions but remain bullish
1. Funding rate: continuously negative, and the Binance USDT lending rate has dropped to an annualized floor price of 3%, with no interest in lending, retail sentiment is low
2. Long-short ratio AI monitoring: when BTC broke 76000, the long-short ratio dropped to 0.65, extreme net short, retail investors suffered heavy losses, now it has recovered to 0.8, still leaning bearish
3. Hyperliquid wallet: small players are still short, while giants have taken profits on some long positions but remain bullish
39
·
--
3 charts tell you why the bears will still be hit hard
1. Funding rate: continuously negative, and Binance USDT lending rate has dropped to an annualized floor price of 3%, lending is ignored, retail sentiment is low
2. Long-short ratio AI monitoring: When BTC broke 76000, the long-short ratio dropped to 0.65, extreme net short, retail investors were severely liquidated, now it has recovered to 0.8, still leaning bearish
3. Hyperliquid wallet: small players are still short, giants have taken profits on some long positions but still bullish
3 charts tell you why the bears will still be hit hard
1. Funding rate: continuously negative, and Binance USDT lending rate has dropped to an annualized floor price of 3%, lending is ignored, retail sentiment is low
2. Long-short ratio AI monitoring: When BTC broke 76000, the long-short ratio dropped to 0.65, extreme net short, retail investors were severely liquidated, now it has recovered to 0.8, still leaning bearish
3. Hyperliquid wallet: small players are still short, giants have taken profits on some long positions but still bullish
1. Funding rate: continuously negative, and Binance USDT lending rate has dropped to an annualized floor price of 3%, lending is ignored, retail sentiment is low
2. Long-short ratio AI monitoring: When BTC broke 76000, the long-short ratio dropped to 0.65, extreme net short, retail investors were severely liquidated, now it has recovered to 0.8, still leaning bearish
3. Hyperliquid wallet: small players are still short, giants have taken profits on some long positions but still bullish
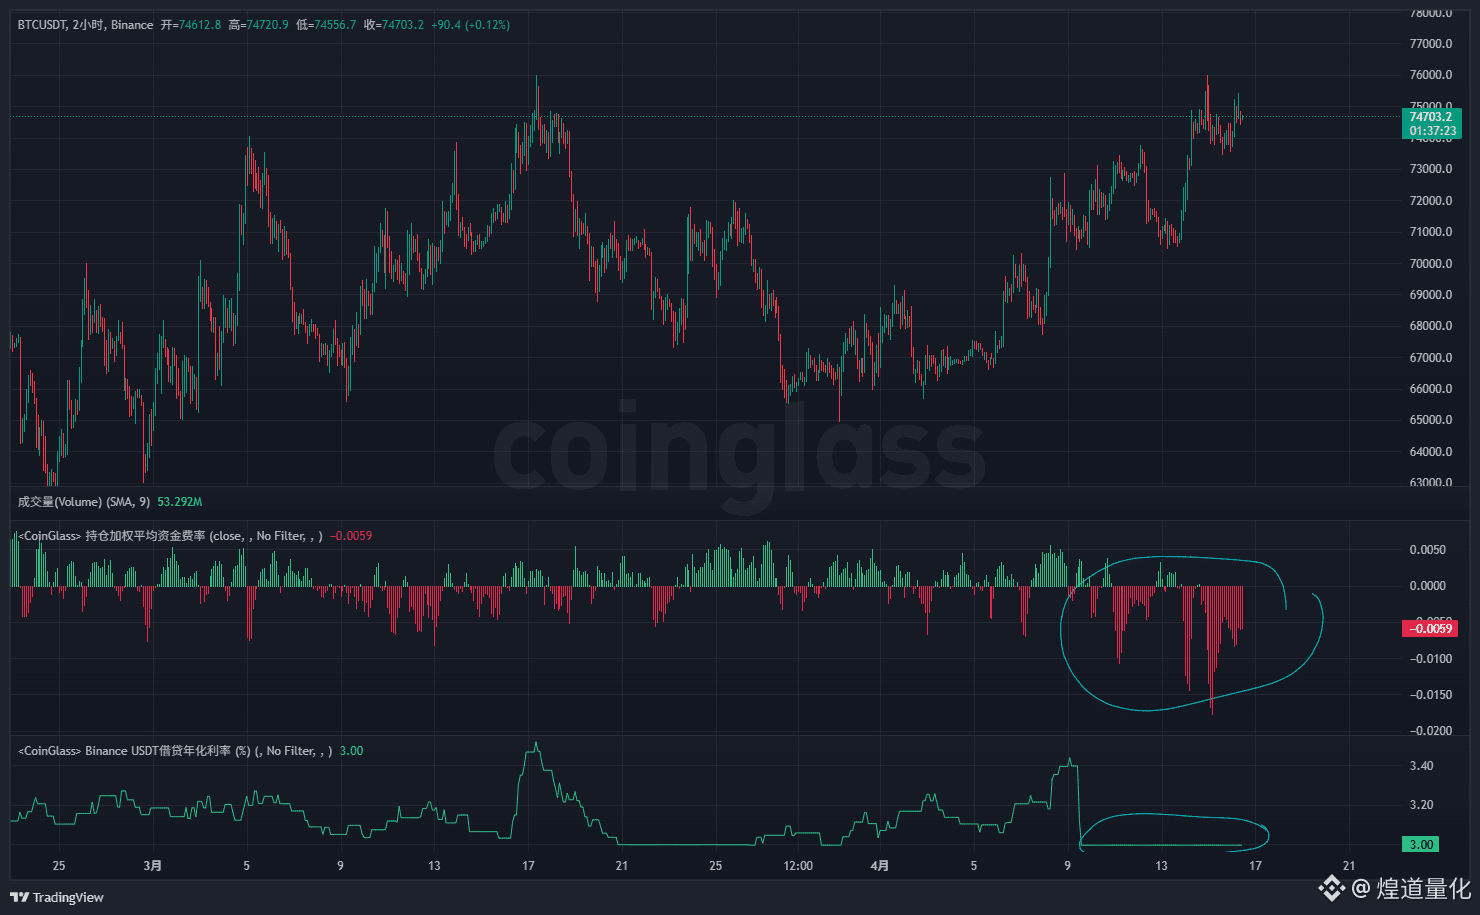
147
·
--
4.16 Short positions will be completely wiped out
1. BTC has been volatile for 2 months, causing retail investors to habitually short at the upper edge of the volatility range, thinking each breakout is a false breakout. This wave will completely wipe out these habitual short positions.
2. The Nasdaq has recovered its losses and reached a new high in just 3 weeks, completely ignoring the US-Iran war, showing signs of the last madness of a bull market. Meanwhile, BTC, after 2 months of accumulation, will also make the strongest rebound out of the bear market, targeting the 80000-85000 range.
4.16 Short positions will be completely wiped out
1. BTC has been volatile for 2 months, causing retail investors to habitually short at the upper edge of the volatility range, thinking each breakout is a false breakout. This wave will completely wipe out these habitual short positions.
2. The Nasdaq has recovered its losses and reached a new high in just 3 weeks, completely ignoring the US-Iran war, showing signs of the last madness of a bull market. Meanwhile, BTC, after 2 months of accumulation, will also make the strongest rebound out of the bear market, targeting the 80000-85000 range.
1. BTC has been volatile for 2 months, causing retail investors to habitually short at the upper edge of the volatility range, thinking each breakout is a false breakout. This wave will completely wipe out these habitual short positions.
2. The Nasdaq has recovered its losses and reached a new high in just 3 weeks, completely ignoring the US-Iran war, showing signs of the last madness of a bull market. Meanwhile, BTC, after 2 months of accumulation, will also make the strongest rebound out of the bear market, targeting the 80000-85000 range.
220
·
--

Article
[Crypto Morning Report] April 16, 2026 07:02 HKT (Wednesday)[Crypto Morning Report]🗓 April 16, 2026 07:02 HKT (Wednesday)
────────────
1. Important Market Information
BTC $74,780 (+0.94% 🟢)|24H range: $73,489 — $75,432
ETH / SOL / BNB / XRP real-time interface is restricted today, reference yesterday's closing: ETH ~$2,348|SOL ~$86|BNB ~$615|XRP ~$1.37
Yesterday's biggest technical event: BTC surged to $76,033 before pulling back, with strong profit-taking by short-term bulls - On-chain data shows that 63,000 BTC profits were realized yesterday, which is the direct reason for suppressing BTC's breakthrough above $75K+. Meanwhile, Nasdaq and S&P 500 both hit all-time highs on the same day, with U.S. stocks ignoring the Middle East conflict and continuing to be strong, while the crypto market is consolidating.
[Crypto Morning Report] April 16, 2026 07:02 HKT (Wednesday)
[Crypto Morning Report]🗓 April 16, 2026 07:02 HKT (Wednesday)
────────────
1. Important Market Information
BTC $74,780 (+0.94% 🟢)|24H range: $73,489 — $75,432
ETH / SOL / BNB / XRP real-time interface is restricted today, reference yesterday's closing: ETH ~$2,348|SOL ~$86|BNB ~$615|XRP ~$1.37
Yesterday's biggest technical event: BTC surged to $76,033 before pulling back, with strong profit-taking by short-term bulls - On-chain data shows that 63,000 BTC profits were realized yesterday, which is the direct reason for suppressing BTC's breakthrough above $75K+. Meanwhile, Nasdaq and S&P 500 both hit all-time highs on the same day, with U.S. stocks ignoring the Middle East conflict and continuing to be strong, while the crypto market is consolidating.
────────────
1. Important Market Information
BTC $74,780 (+0.94% 🟢)|24H range: $73,489 — $75,432
ETH / SOL / BNB / XRP real-time interface is restricted today, reference yesterday's closing: ETH ~$2,348|SOL ~$86|BNB ~$615|XRP ~$1.37
Yesterday's biggest technical event: BTC surged to $76,033 before pulling back, with strong profit-taking by short-term bulls - On-chain data shows that 63,000 BTC profits were realized yesterday, which is the direct reason for suppressing BTC's breakthrough above $75K+. Meanwhile, Nasdaq and S&P 500 both hit all-time highs on the same day, with U.S. stocks ignoring the Middle East conflict and continuing to be strong, while the crypto market is consolidating.
1
280
·
--
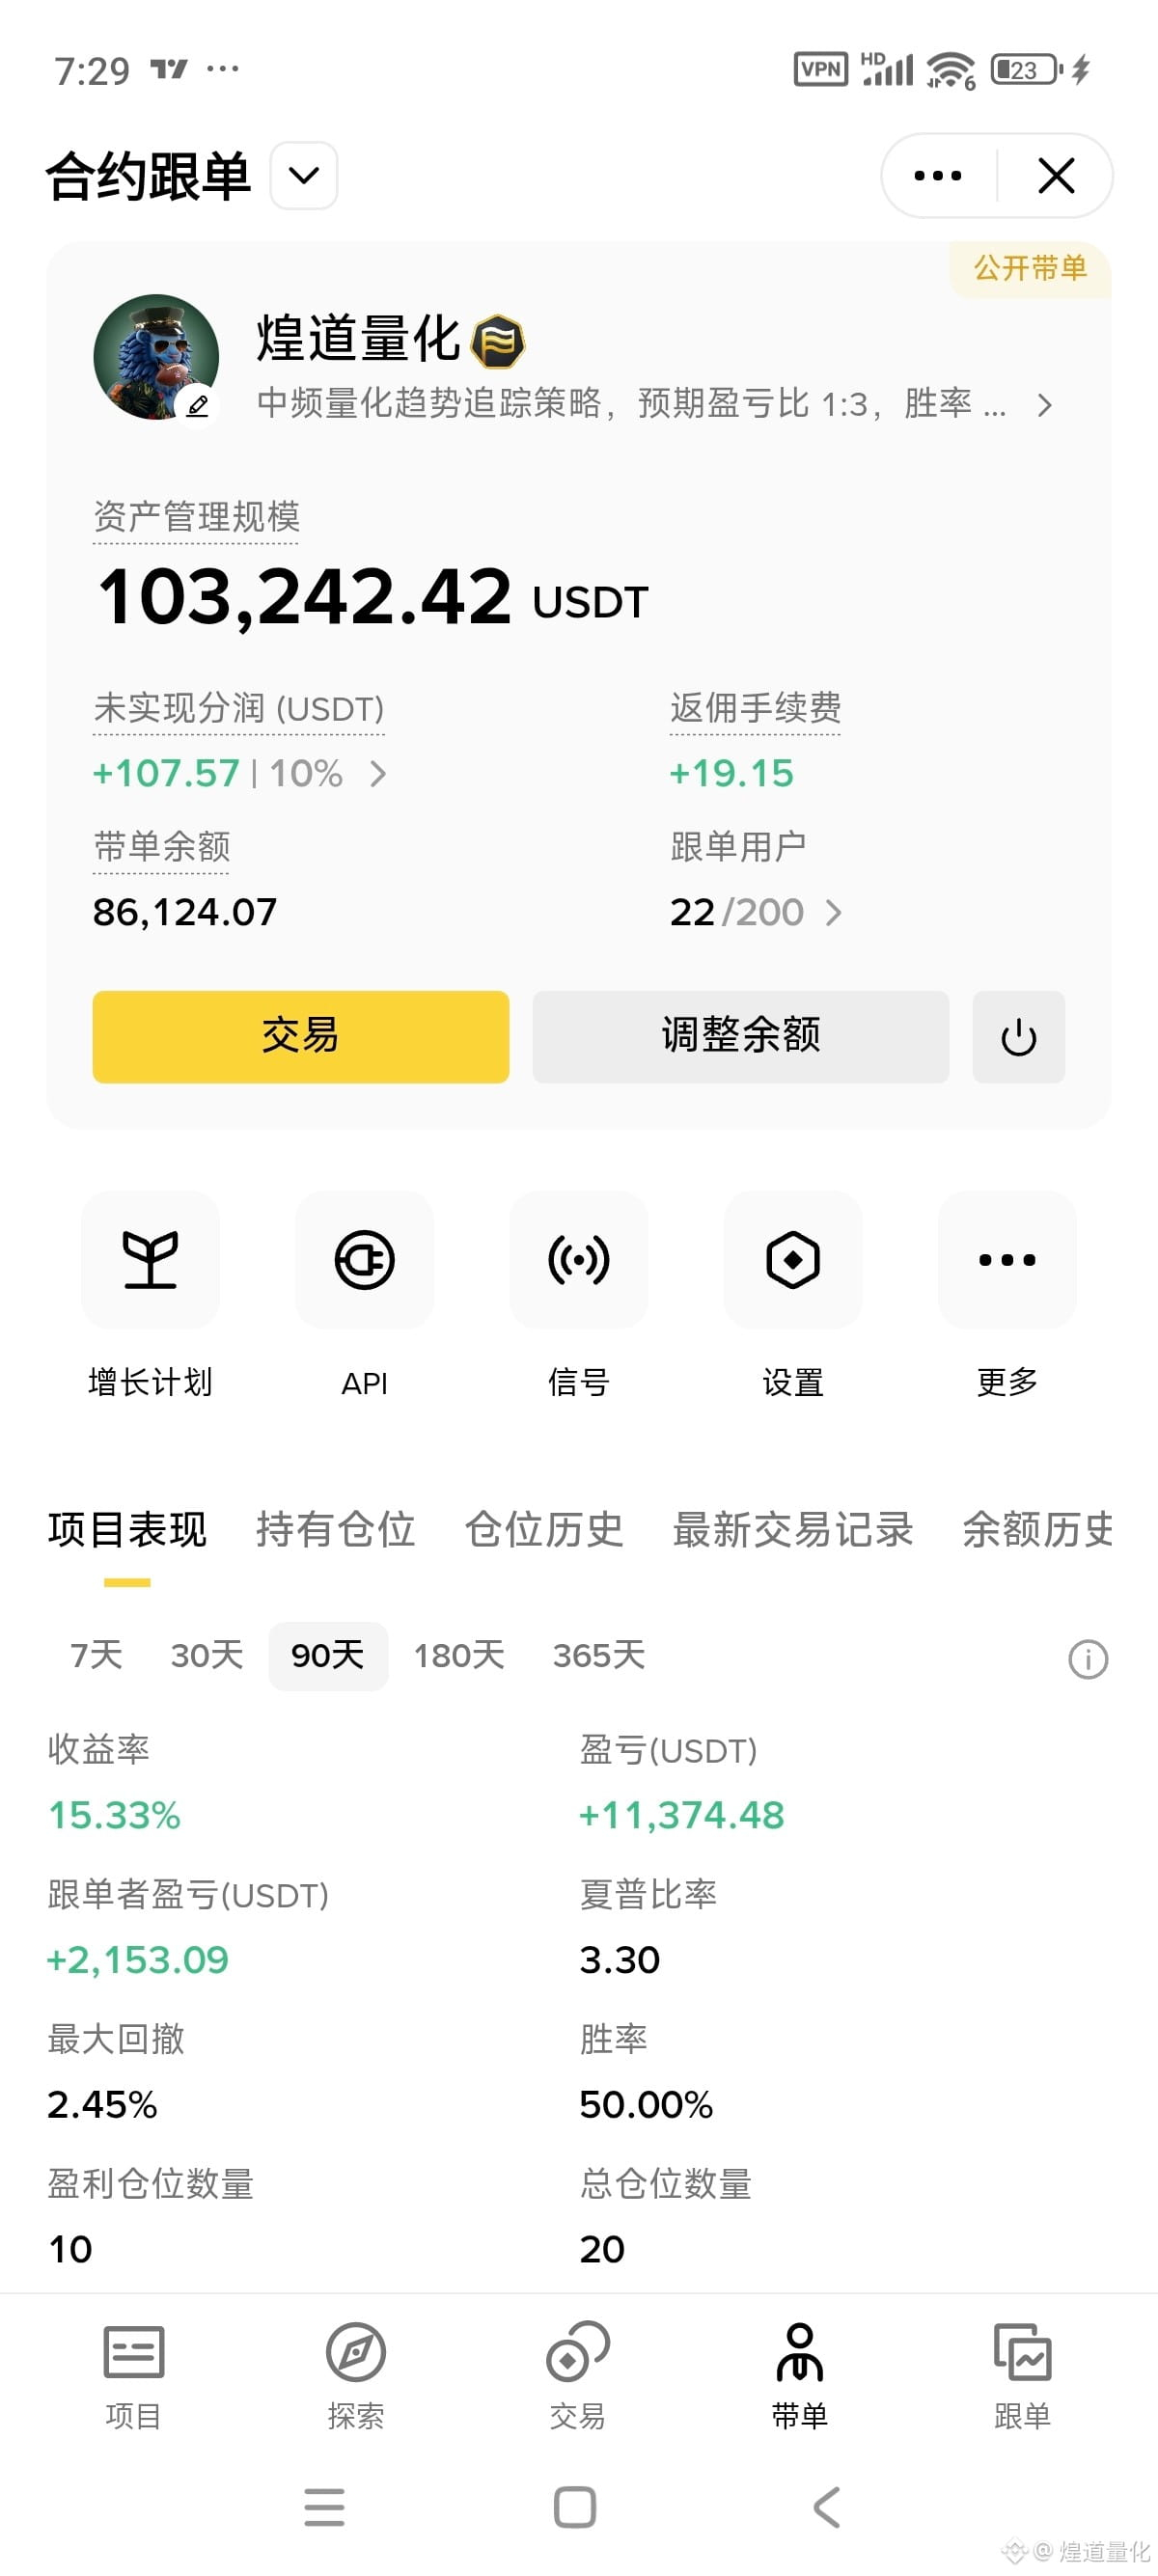
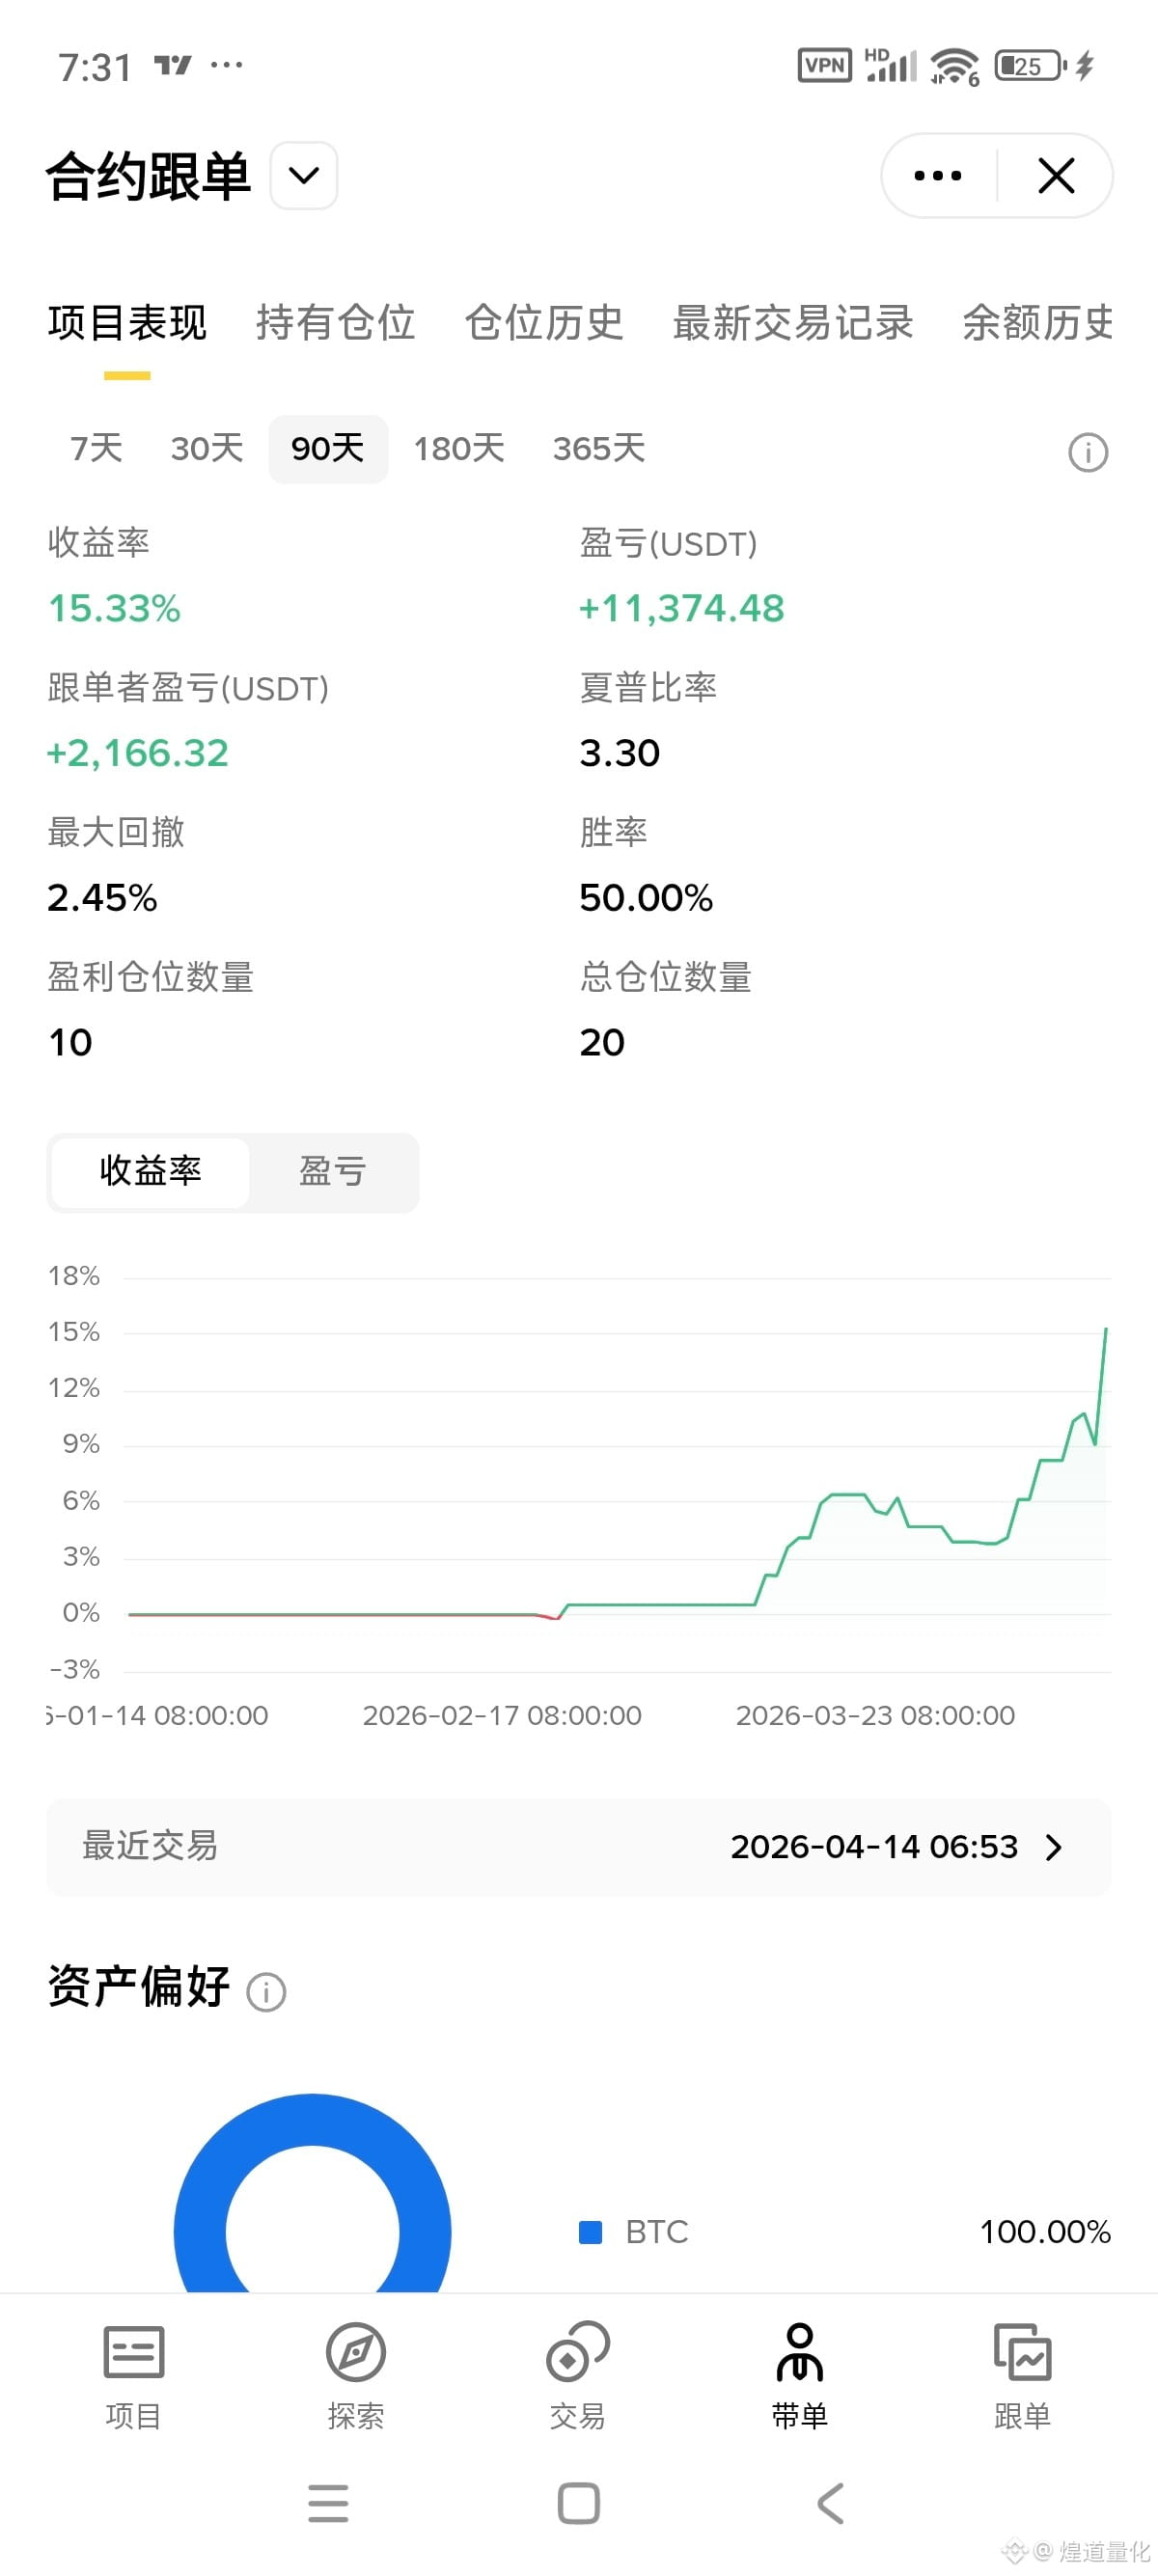
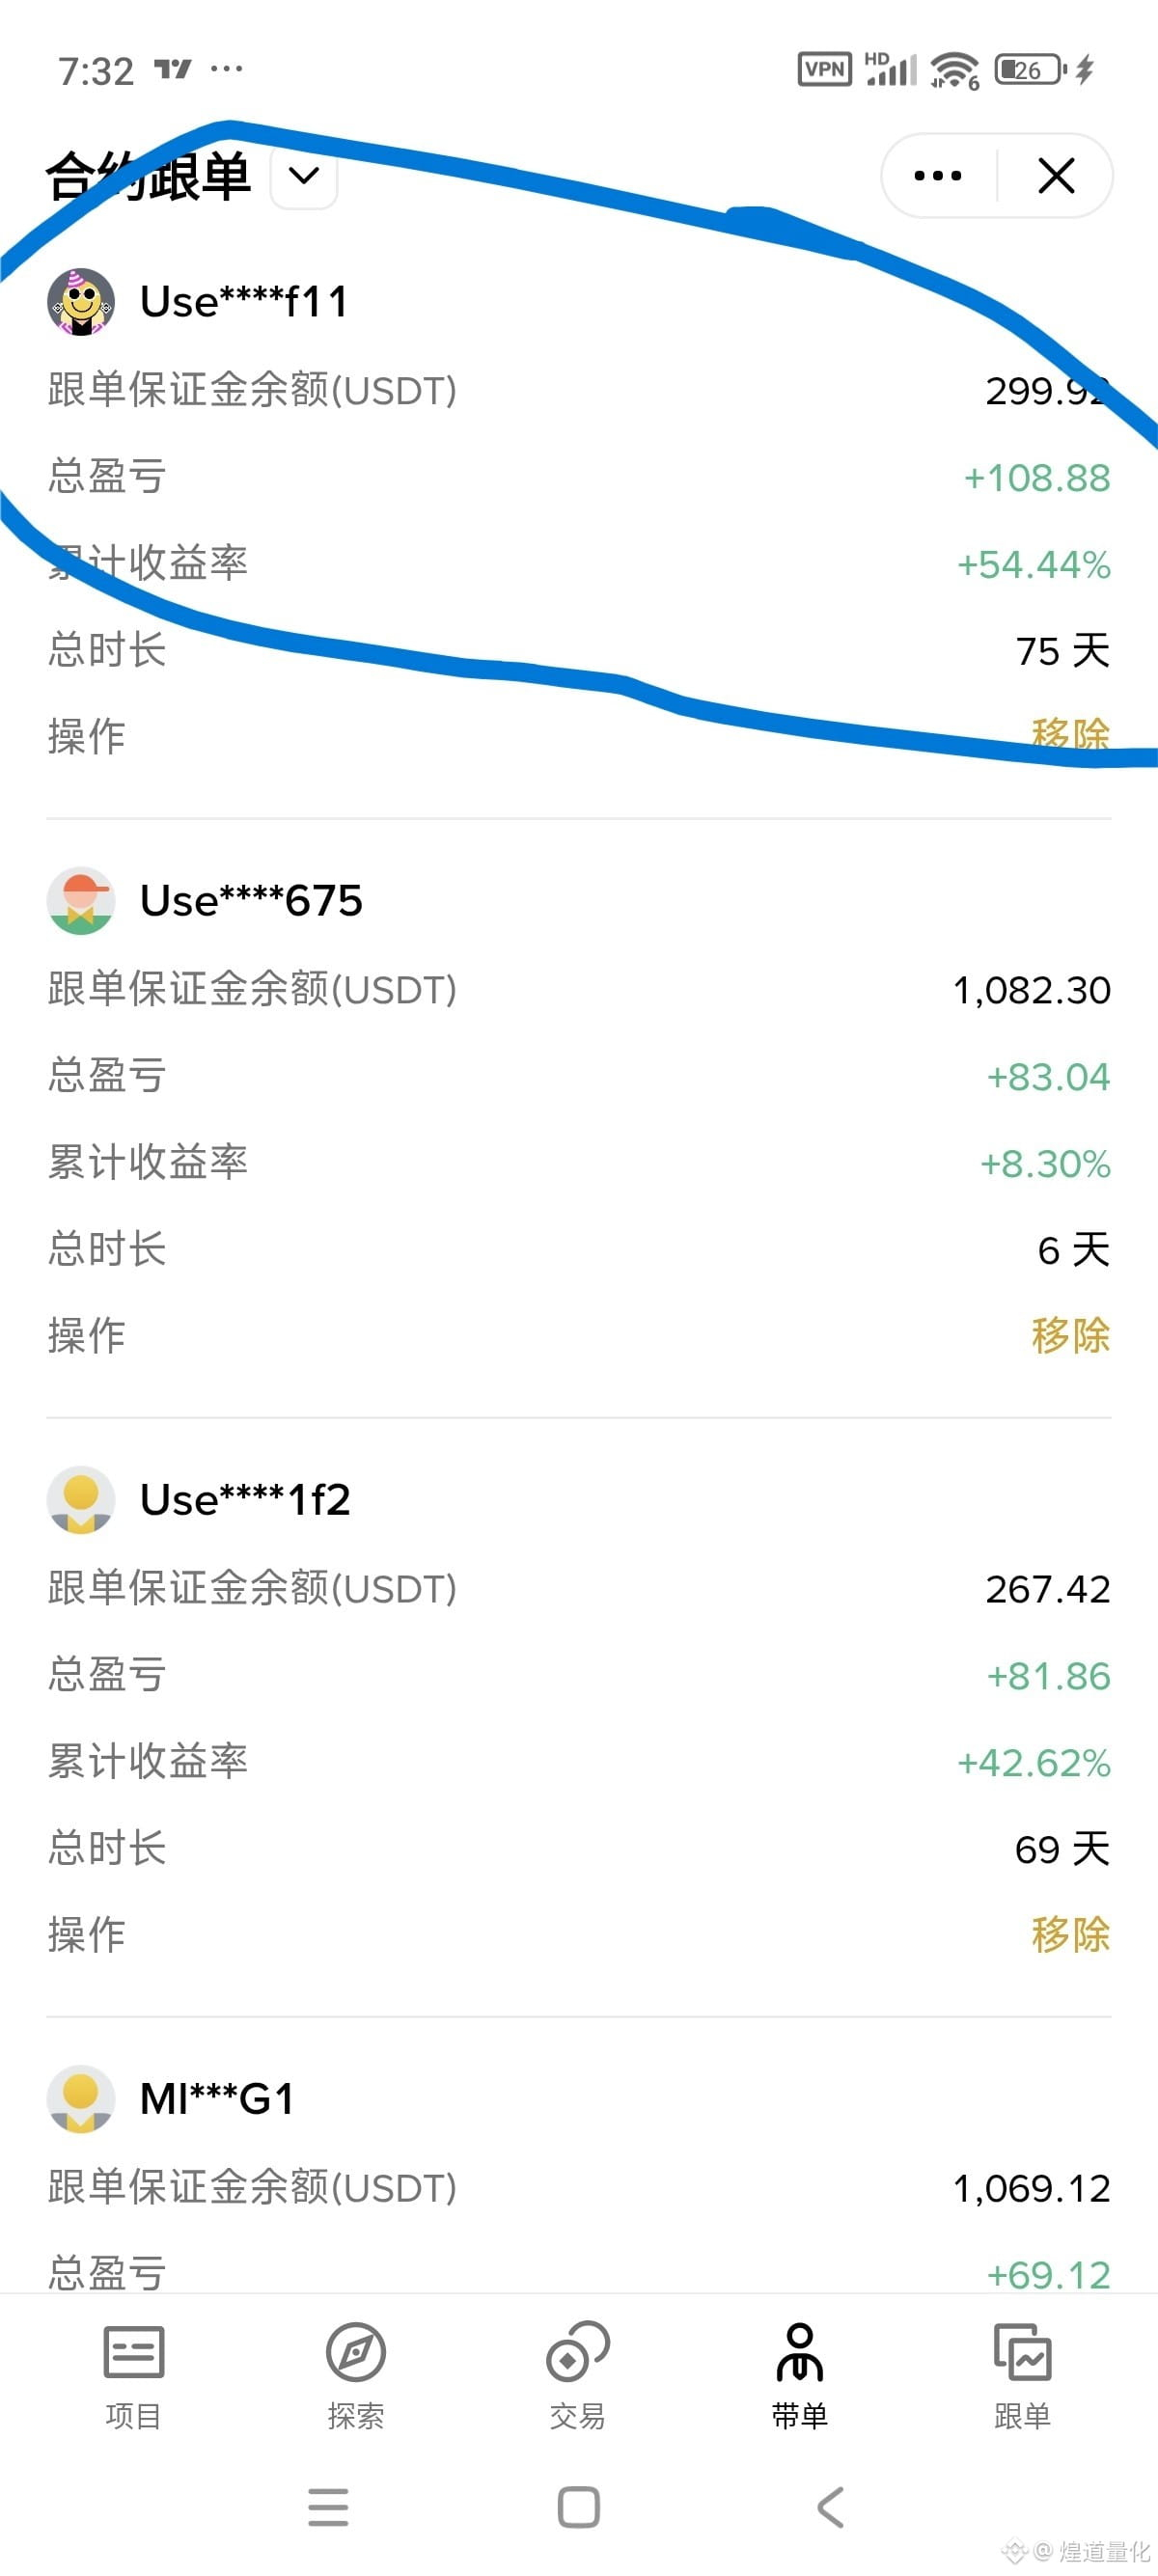
After waking up, my AI quantitative strategy captured last night's significant fluctuations again, with profits continuing to reach new highs. The actual trading yield has reached 54% over more than 2 months (the additional margin caused the displayed yield to decrease), with a maximum drawdown of 9% and a profit-to-drawdown ratio of 6 times; balanced long and short positions, win rate of 50%, and a profit-loss ratio of 1:3; all followers are profitable. The strategy has undergone multiple iterations and currently performs excellently in terms of yield, risk control, stability, and balance between long and short positions.
After waking up, my AI quantitative strategy captured last night's significant fluctuations again, with profits continuing to reach new highs. The actual trading yield has reached 54% over more than 2 months (the additional margin caused the displayed yield to decrease), with a maximum drawdown of 9% and a profit-to-drawdown ratio of 6 times; balanced long and short positions, win rate of 50%, and a profit-loss ratio of 1:3; all followers are profitable. The strategy has undergone multiple iterations and currently performs excellently in terms of yield, risk control, stability, and balance between long and short positions.
2
2
198
·
--
My AI quantitative strategy perfectly captured last night's volatility and correctly opened a long position. It has been online for over a month, with a return rate of nearly 40%, a maximum drawdown of less than 10%, and a steady growth of the capital curve under the premise of controllable drawdown.
My AI quantitative strategy perfectly captured last night's volatility and correctly opened a long position. It has been online for over a month, with a return rate of nearly 40%, a maximum drawdown of less than 10%, and a steady growth of the capital curve under the premise of controllable drawdown.

118
·
--
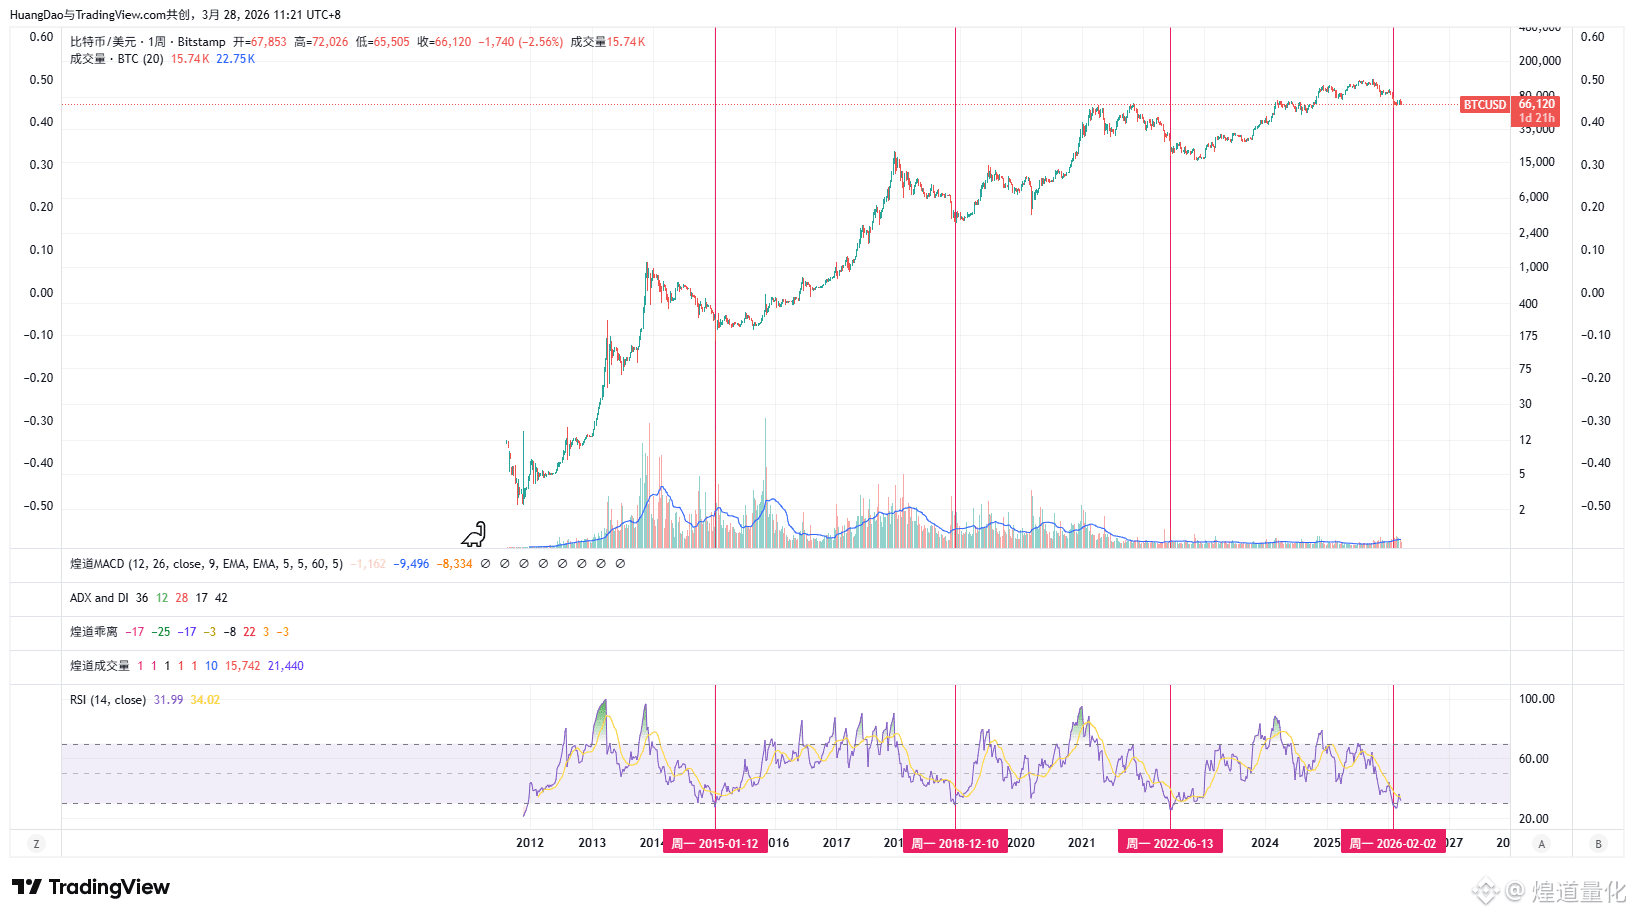
3.28 BTC Bear Market Bottom and the Relationship with RSI
1. All historical BTC bear markets have occurred when the weekly RSI was below 30, indicating significant overselling.
2. The weekly RSI for BTC in 2015 and 2018 was below 30, marking the bear market bottom; in 2022, it was 17000, which was close to the bottom but not quite there.
3. Each round of BTC bear markets is becoming stronger, while bull markets are weakening, leading to an increase in the duration and frequency of RSI being below 30.
4. I do not believe that this round of BTC at 60,000 is the bear market bottom, but it is clear that the rebound extent goes beyond this.
3.28 BTC Bear Market Bottom and the Relationship with RSI
1. All historical BTC bear markets have occurred when the weekly RSI was below 30, indicating significant overselling.
2. The weekly RSI for BTC in 2015 and 2018 was below 30, marking the bear market bottom; in 2022, it was 17000, which was close to the bottom but not quite there.
3. Each round of BTC bear markets is becoming stronger, while bull markets are weakening, leading to an increase in the duration and frequency of RSI being below 30.
4. I do not believe that this round of BTC at 60,000 is the bear market bottom, but it is clear that the rebound extent goes beyond this.
1. All historical BTC bear markets have occurred when the weekly RSI was below 30, indicating significant overselling.
2. The weekly RSI for BTC in 2015 and 2018 was below 30, marking the bear market bottom; in 2022, it was 17000, which was close to the bottom but not quite there.
3. Each round of BTC bear markets is becoming stronger, while bull markets are weakening, leading to an increase in the duration and frequency of RSI being below 30.
4. I do not believe that this round of BTC at 60,000 is the bear market bottom, but it is clear that the rebound extent goes beyond this.
317
·
--
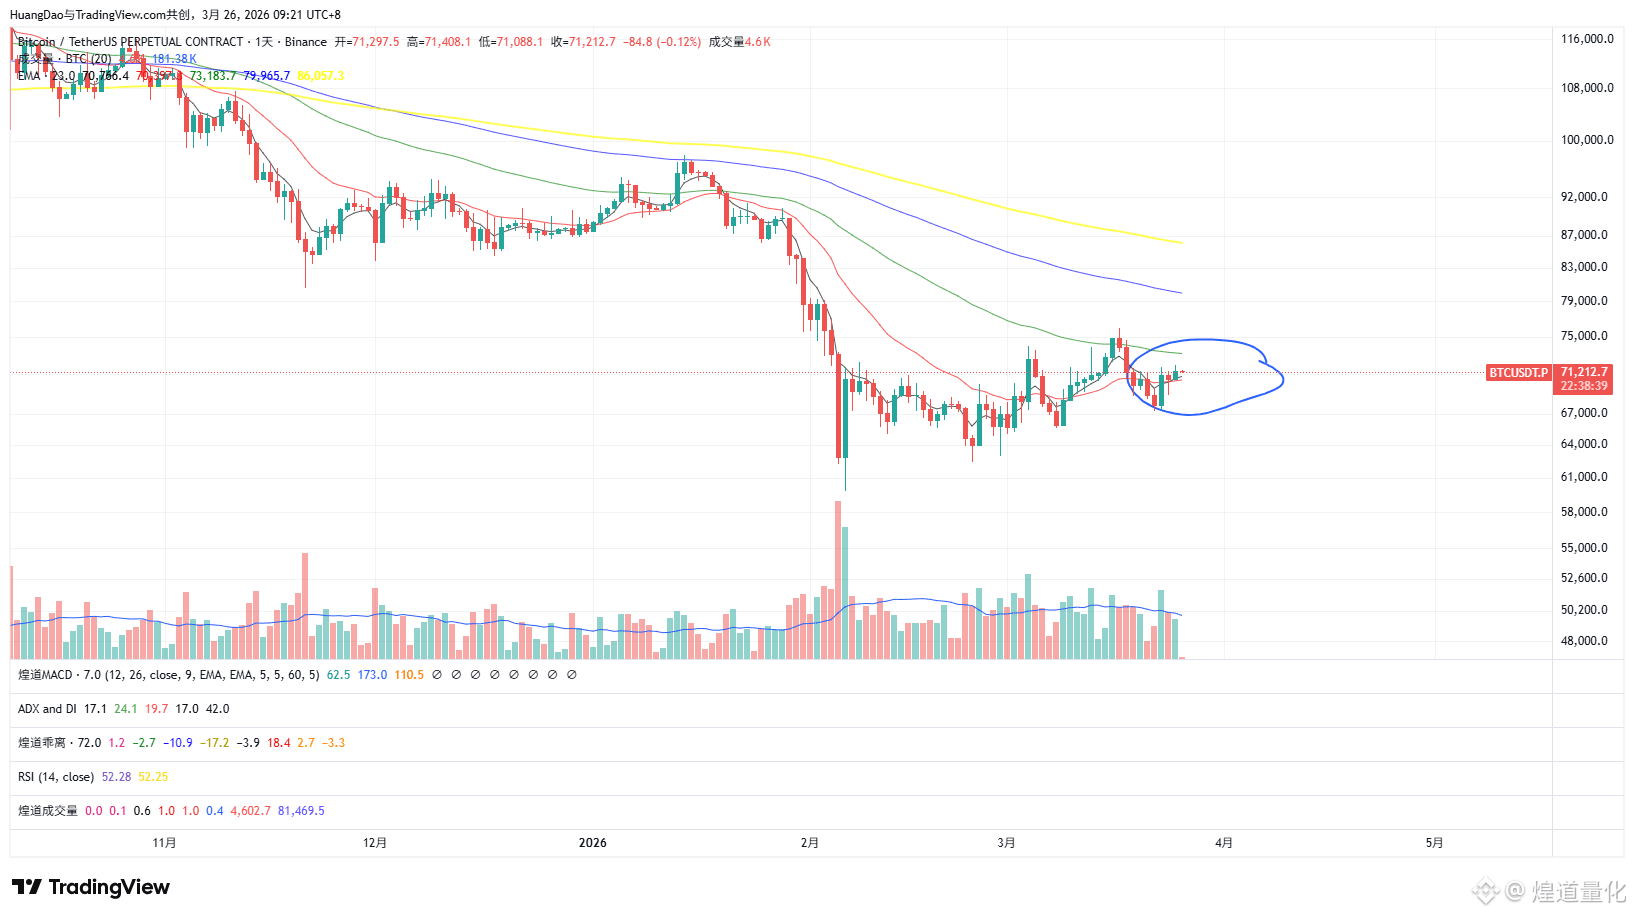
3.26 A major fluctuation is about to arrive
1. BTC and ETH short-term moving averages have flattened out and are approaching the medium-term moving averages, with prices starting to form small candlesticks with reduced volume above EMA20, which is the final preparation for an explosion.
2. The market will start within two weeks and will eventually experience a significant fluctuation of 10%-20%, with BTC targets of 80,000-85,000 and ETH targets of 2,600-3,000.
3.26 A major fluctuation is about to arrive
1. BTC and ETH short-term moving averages have flattened out and are approaching the medium-term moving averages, with prices starting to form small candlesticks with reduced volume above EMA20, which is the final preparation for an explosion.
2. The market will start within two weeks and will eventually experience a significant fluctuation of 10%-20%, with BTC targets of 80,000-85,000 and ETH targets of 2,600-3,000.
1. BTC and ETH short-term moving averages have flattened out and are approaching the medium-term moving averages, with prices starting to form small candlesticks with reduced volume above EMA20, which is the final preparation for an explosion.
2. The market will start within two weeks and will eventually experience a significant fluctuation of 10%-20%, with BTC targets of 80,000-85,000 and ETH targets of 2,600-3,000.
1
583
·
--
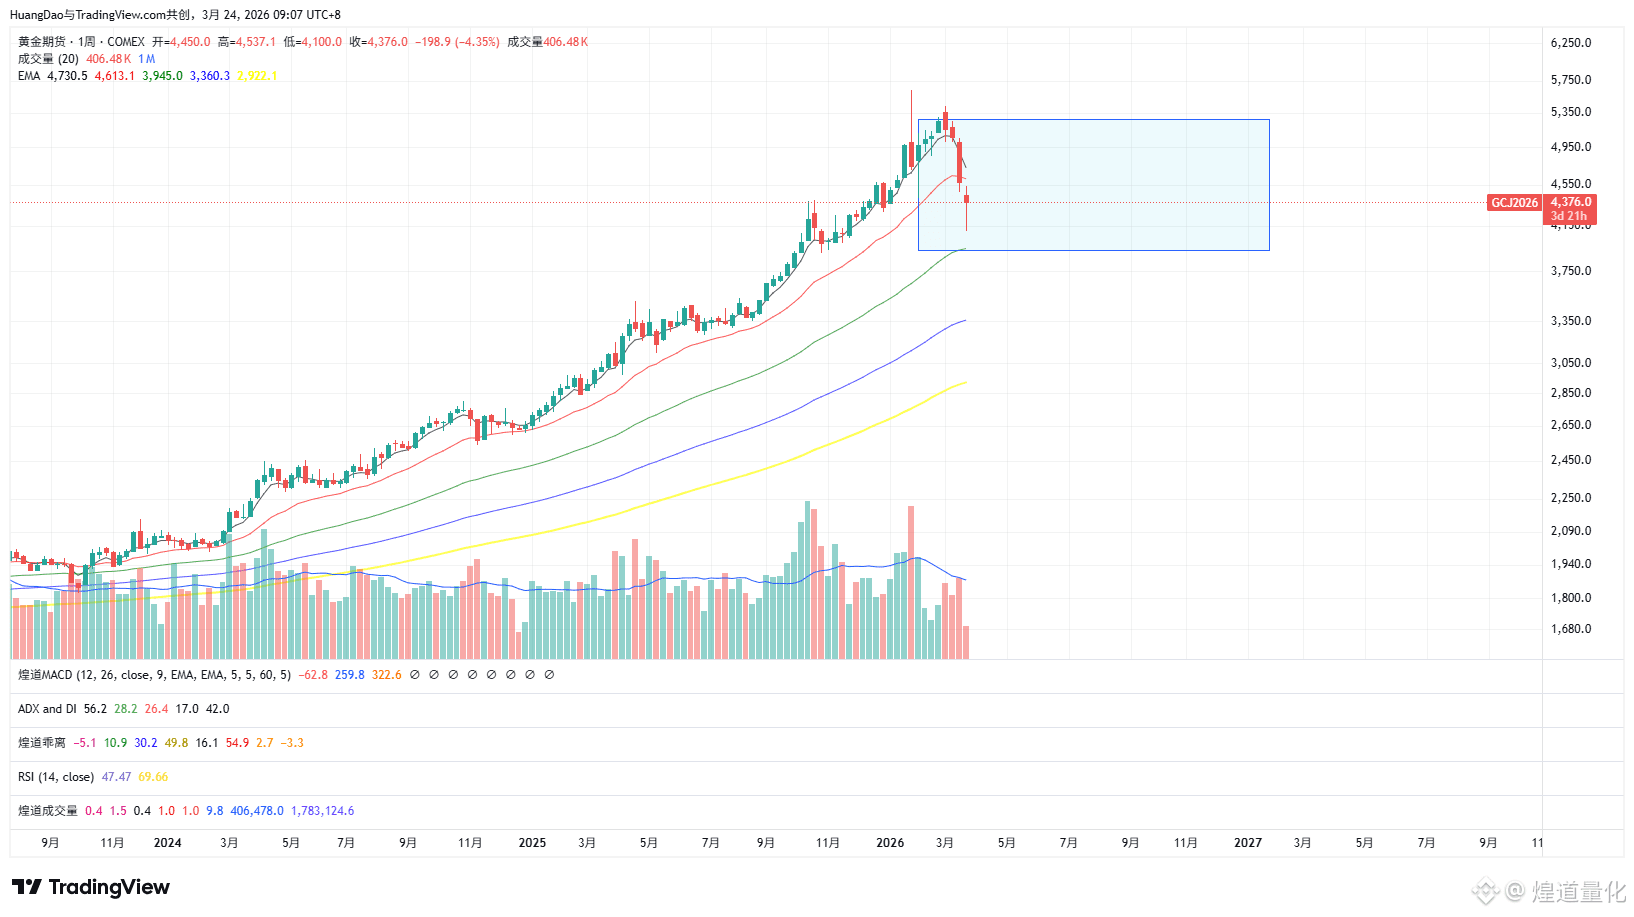
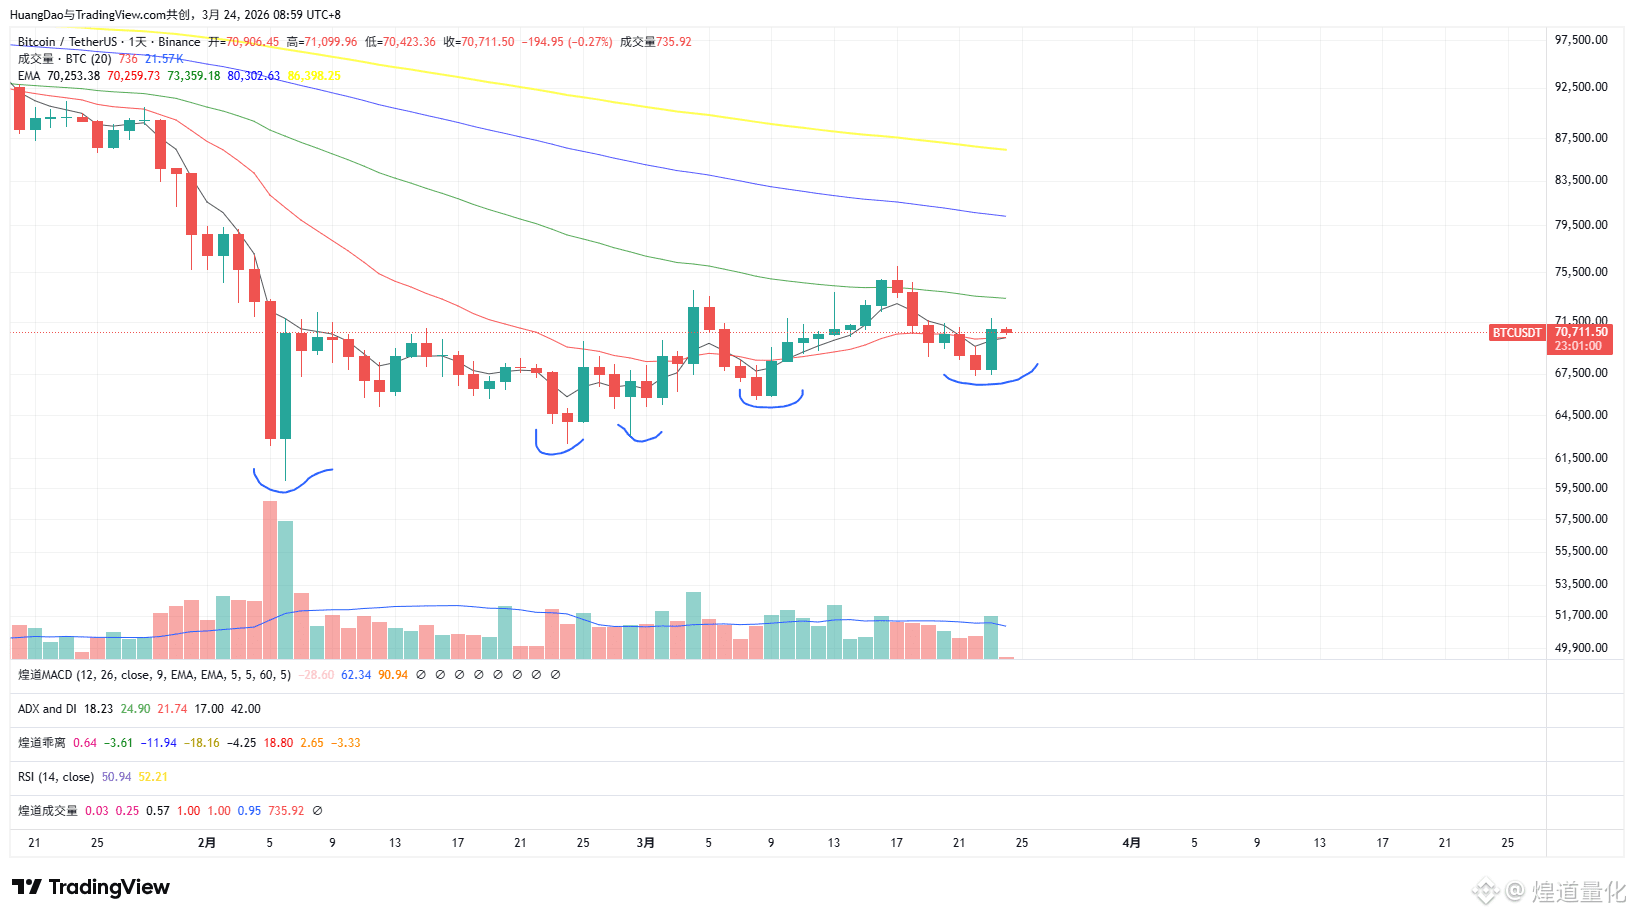
3.24 The cryptocurrency market will welcome the largest rebound in a bear market
1. After consolidating for a month and a half, BTC's bottom is rising steadily and is capable of a significant rebound, weakly reaching 80,000 and strongly reaching 85,000, ETH returning to 2,600
2. The stock market has turned from bull to bear, and the market has realized expectations of economic recession and even interest rate hikes, making it very difficult to return to the bull market support level
3. Gold has peaked, and this level of peak will not happen overnight; it will form several months of wide fluctuations between 3,900 and 5,300
3.24 The cryptocurrency market will welcome the largest rebound in a bear market
1. After consolidating for a month and a half, BTC's bottom is rising steadily and is capable of a significant rebound, weakly reaching 80,000 and strongly reaching 85,000, ETH returning to 2,600
2. The stock market has turned from bull to bear, and the market has realized expectations of economic recession and even interest rate hikes, making it very difficult to return to the bull market support level
3. Gold has peaked, and this level of peak will not happen overnight; it will form several months of wide fluctuations between 3,900 and 5,300
1. After consolidating for a month and a half, BTC's bottom is rising steadily and is capable of a significant rebound, weakly reaching 80,000 and strongly reaching 85,000, ETH returning to 2,600
2. The stock market has turned from bull to bear, and the market has realized expectations of economic recession and even interest rate hikes, making it very difficult to return to the bull market support level
3. Gold has peaked, and this level of peak will not happen overnight; it will form several months of wide fluctuations between 3,900 and 5,300
1
465
·
--
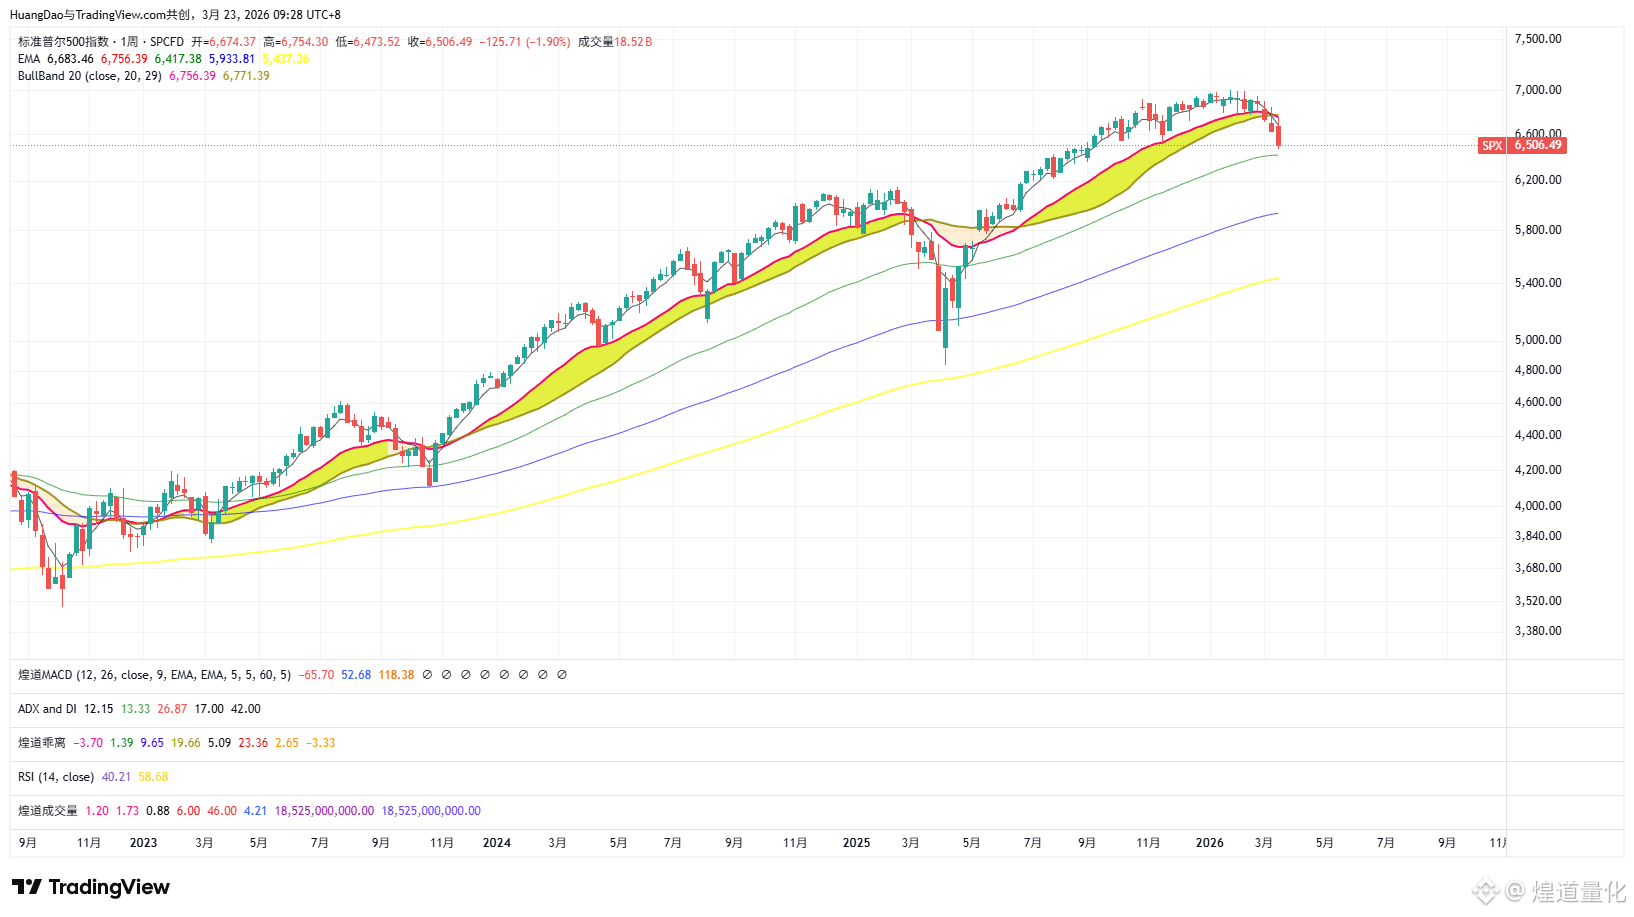
The S&P index moved from bullish to bearish as expected last week, with a large weekly candlestick breaking below the bullish support zone and the upper consolidation range.
1. The US stock market has entered a bear market, with indices down by more than 20% and individual stocks down by more than 50%.
2. BTC topped earlier than the US stock market, but the bottom typically aligns with the US stock market. BTC at 60,000 is similar to 30,000 in the previous cycle, and it is still far from the bottom.
The S&P index moved from bullish to bearish as expected last week, with a large weekly candlestick breaking below the bullish support zone and the upper consolidation range.
1. The US stock market has entered a bear market, with indices down by more than 20% and individual stocks down by more than 50%.
2. BTC topped earlier than the US stock market, but the bottom typically aligns with the US stock market. BTC at 60,000 is similar to 30,000 in the previous cycle, and it is still far from the bottom.
1. The US stock market has entered a bear market, with indices down by more than 20% and individual stocks down by more than 50%.
2. BTC topped earlier than the US stock market, but the bottom typically aligns with the US stock market. BTC at 60,000 is similar to 30,000 in the previous cycle, and it is still far from the bottom.
1
362
Log in to explore more content
Join global crypto users on Binance Square
⚡️ Get latest and useful information about crypto.
💬 Trusted by the world’s largest crypto exchange.
👍 Discover real insights from verified creators.
Email / Phone number
Trending Topics
EtherGains70.9%InQ3
105,245 views
970 Discussing
One of the best third quarters in history 💰
September closed out last night, and with it, the quarter. For the quarter, BTC is up 42%—the second-best Q3 on record. ETH had a record-breaking Q3 overall, up 70%.
Looking at the chart, things are still looking good: we’re holding support, but we’re testing it more and more often. Plus, ETF momentum is weakening — inflows are gradually declining, and yesterday saw outflows for the first time in a long while.
Yes, historically, October has been a good month for crypto — it’s not called “Uptober” for nothing. But it’s also one of the most volatile months. Last year, for example, we managed to hit a new all-time high (ATH) and experience a flash crash.
🚀 High Accuracy Trades.
$BTC
$ETH
$SOL
#EtherGains70.9%InQ3 #DollarIndexHitsHighestSinceMay2025 #CFTCSubmitsTwoEventContractRulesToWhiteHouse #MicronBeatsEarningsLiftsGuidance
Knowledge is Power
·0 Likes
·191 views
TreasuryLetsStatesFileStablecoinCertificationsEarly
5,627 views
64 Discussing
US10YearYieldNears5.3%
124,485 views
1,015 Discussing