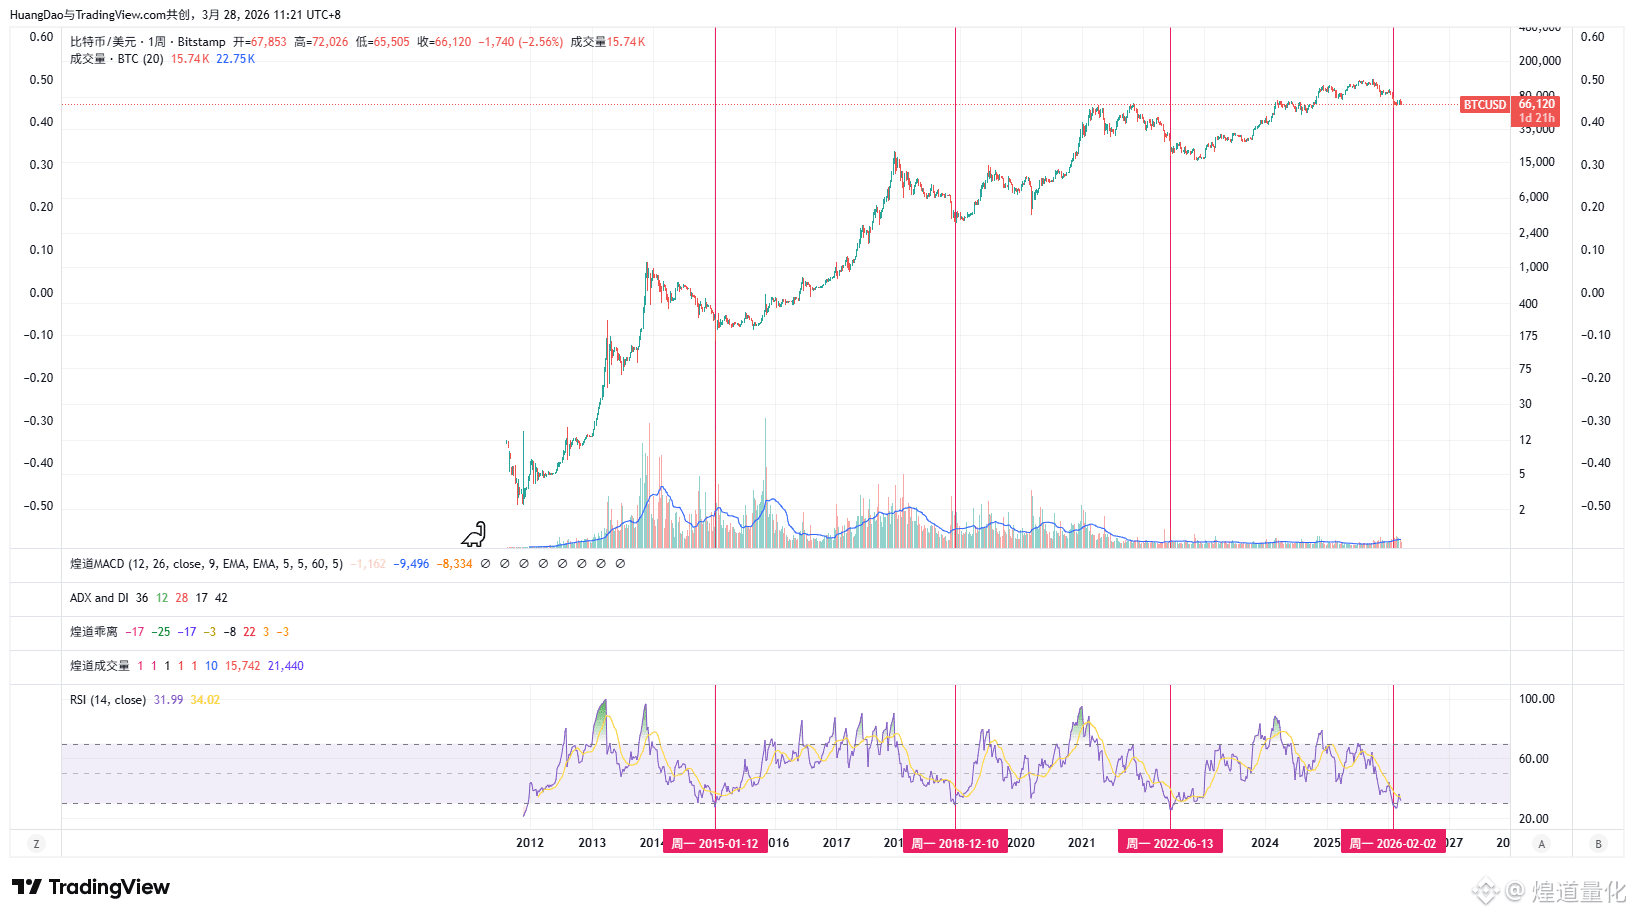
3.28 BTC Bear Market Bottom and the Relationship with RSI
1. All historical BTC bear markets have occurred when the weekly RSI was below 30, indicating significant overselling.
2. The weekly RSI for BTC in 2015 and 2018 was below 30, marking the bear market bottom; in 2022, it was 17000, which was close to the bottom but not quite there.
3. Each round of BTC bear markets is becoming stronger, while bull markets are weakening, leading to an increase in the duration and frequency of RSI being below 30.
4. I do not believe that this round of BTC at 60,000 is the bear market bottom, but it is clear that the rebound extent goes beyond this.
1. All historical BTC bear markets have occurred when the weekly RSI was below 30, indicating significant overselling.
2. The weekly RSI for BTC in 2015 and 2018 was below 30, marking the bear market bottom; in 2022, it was 17000, which was close to the bottom but not quite there.
3. Each round of BTC bear markets is becoming stronger, while bull markets are weakening, leading to an increase in the duration and frequency of RSI being below 30.
4. I do not believe that this round of BTC at 60,000 is the bear market bottom, but it is clear that the rebound extent goes beyond this.