4.20 History Repeating or Something Else?
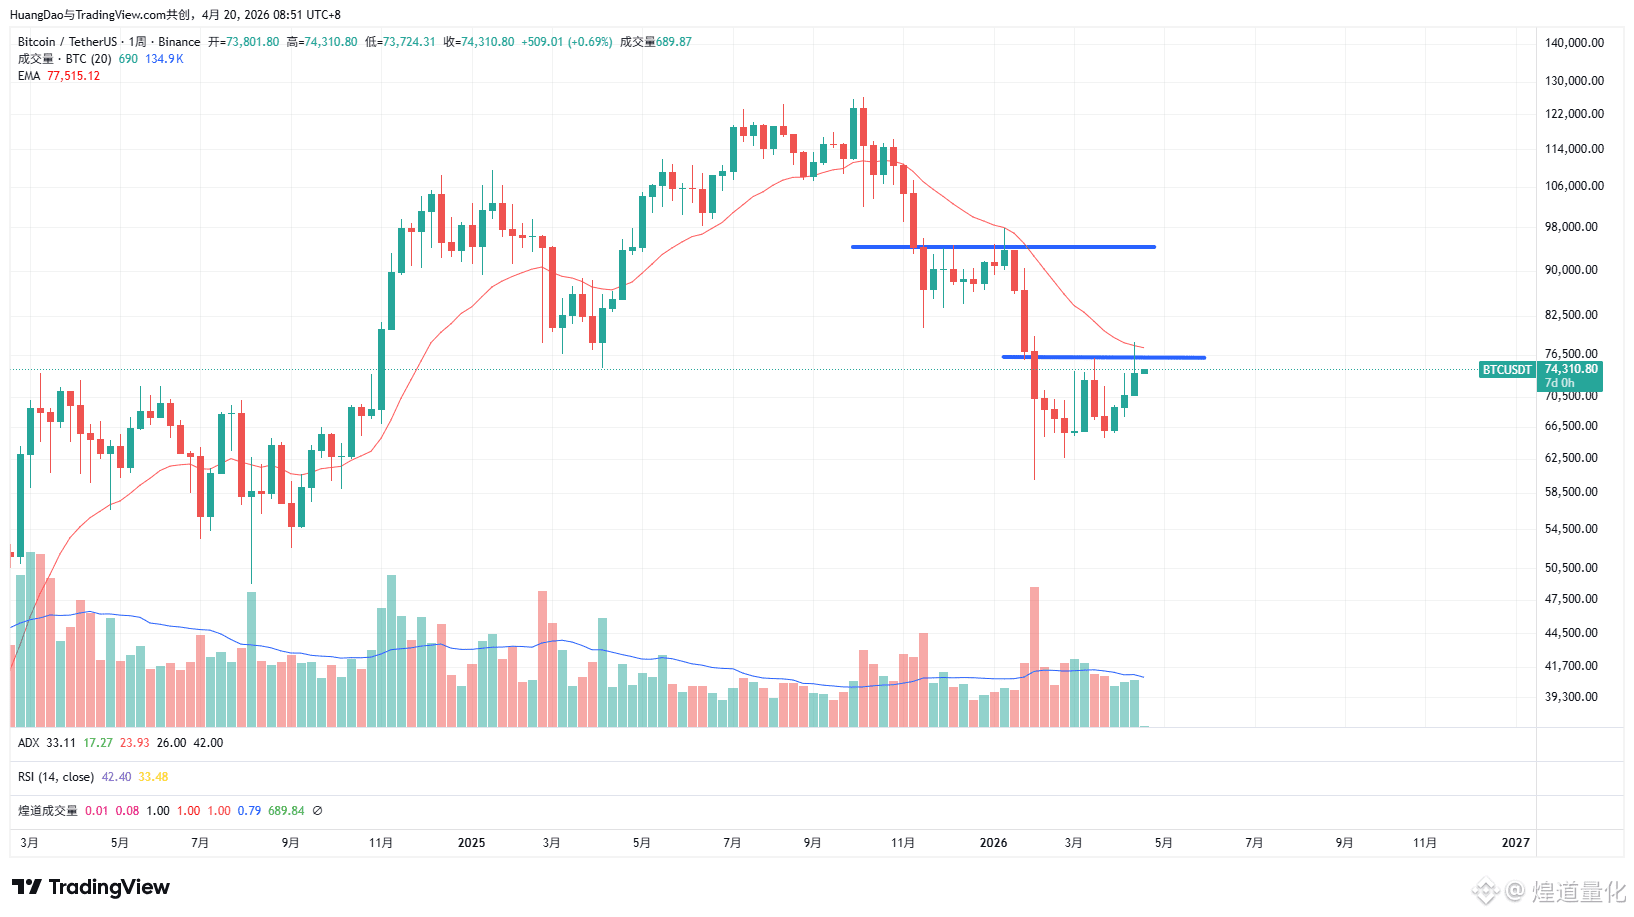
1. BTC surged last week and had a slight pullback, similar to the wave in January at 98000, also breaking out of the consolidation zone before rising to the EMA20 position of the weekly chart and starting to pull back.
2. However, history does not simply repeat itself. Although BTC has reached the minimum value of 78000 that I expected for this rebound, it still appears to be ongoing.
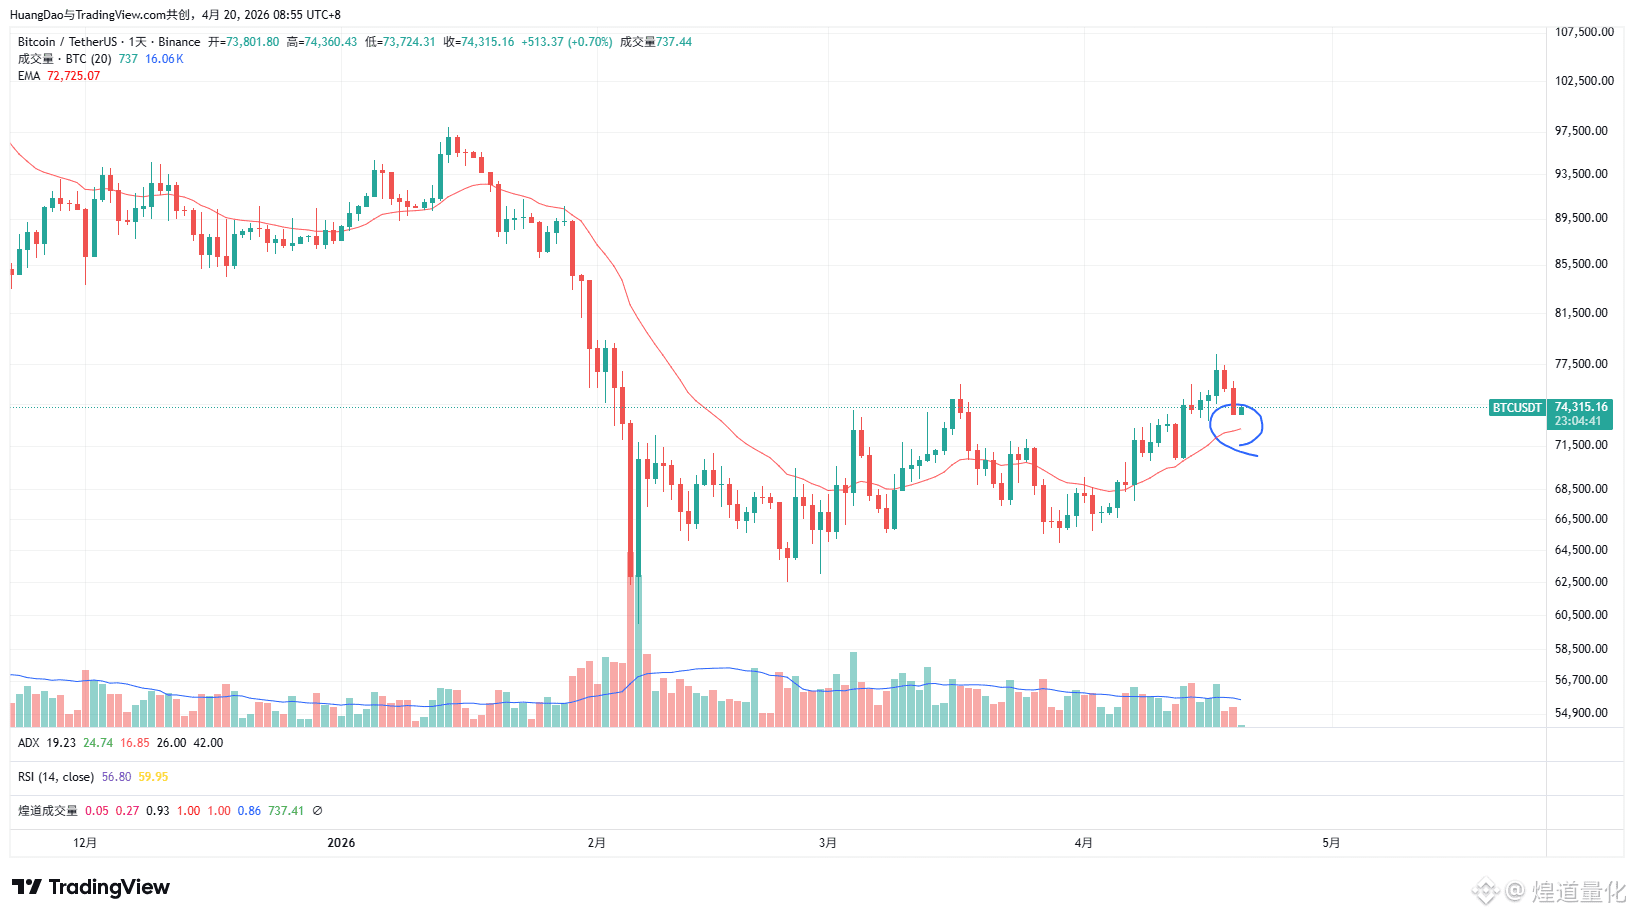
3. My standard for measuring the end of the rebound is an effective daily K line break below the EMA20.
1. BTC surged last week and had a slight pullback, similar to the wave in January at 98000, also breaking out of the consolidation zone before rising to the EMA20 position of the weekly chart and starting to pull back.
2. However, history does not simply repeat itself. Although BTC has reached the minimum value of 78000 that I expected for this rebound, it still appears to be ongoing.
3. My standard for measuring the end of the rebound is an effective daily K line break below the EMA20.