
IFAZ TASIR CHOWDHURY SIAM
10 Posts

IFAZ TASIR CHOWDHURY SIAM
Report
Block User
Open Trade
Occasional Trader
3 Years
0 Following
13 Followers
21 Liked
Posts
Portfolio
Article
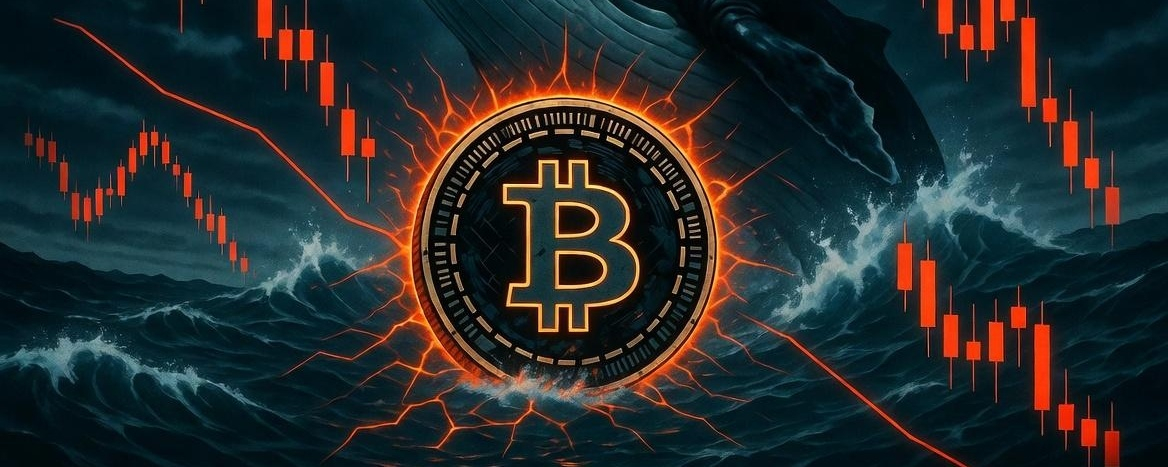
🐋 Bitcoin's $1 Billion Liquidation Shock – Is BTC Preparing for Its Next Big Move?$BTC Bitcoin is sending a serious warning to the crypto market.
On November 6, BTC is trading around $75,400, after losing more than 6% in the last 24 hours.
But there's something more interesting happening behind this price movement.
⚡ The $1 Billion Liquidation Event
More than $1 billion in leveraged crypto positions were liquidated during the recent market downturn. Most of these were long positions, meaning traders who expected Bitcoin to rise were forced out of the market.
This creates an important question:
Are we witnessing the beginning of a deeper bear market, or simply a major market reset?
🐋 What Are Bitcoin Whales Doing?
Large investors and institutional traders can influence short-term market movements through significant buying and selling activity.
During periods of extreme volatility, experienced investors often watch:
- Exchange inflows and outflows.
- Large wallet transactions.
- Institutional ETF investment flows.
- Bitcoin futures open interest.
These indicators can help traders understand whether selling pressure is increasing or weakening.
📊 Three Possible Scenarios for BTC
1. Bullish Recovery 🚀
If buyers defend the $75,000 region, Bitcoin could attempt a recovery towards $78,000 and eventually $80,000.
2. Sideways Consolidation ⚖️
BTC could trade between $75,000 and $78,000 while the market waits for stronger buying or selling pressure.
3. Further Correction 📉
If Bitcoin loses the $75,000 support level, traders may start watching $73,000 and lower levels.
🧠 My Personal Take
I think the most important thing right now is not predicting the exact bottom.
The market needs to demonstrate genuine buying strength before a recovery can be trusted.
Heavy liquidations can remove excessive leverage, but they do not automatically mean a bullish reversal is coming.
Patience and risk management are more important than chasing every price movement.
🔥 One Question for the Community
If you had $1,000 today, what would you do?
- Buy Bitcoin at the current price?
- Wait for a drop towards $73,000?
- Hold USDT until the market becomes stable?
Let's discuss in the comments!
#Bitcoin #BTC #BinanceSquare #BitcoinAnalysis #CryptoMarket
🐋 Bitcoin's $1 Billion Liquidation Shock – Is BTC Preparing for Its Next Big Move?
$BTC Bitcoin is sending a serious warning to the crypto market.
On November 6, BTC is trading around $75,400, after losing more than 6% in the last 24 hours.
But there's something more interesting happening behind this price movement.
⚡ The $1 Billion Liquidation Event
More than $1 billion in leveraged crypto positions were liquidated during the recent market downturn. Most of these were long positions, meaning traders who expected Bitcoin to rise were forced out of the market.
This creates an important question:
Are we witnessing the beginning of a deeper bear market, or simply a major market reset?
🐋 What Are Bitcoin Whales Doing?
Large investors and institutional traders can influence short-term market movements through significant buying and selling activity.
During periods of extreme volatility, experienced investors often watch:
- Exchange inflows and outflows.
- Large wallet transactions.
- Institutional ETF investment flows.
- Bitcoin futures open interest.
These indicators can help traders understand whether selling pressure is increasing or weakening.
📊 Three Possible Scenarios for BTC
1. Bullish Recovery 🚀
If buyers defend the $75,000 region, Bitcoin could attempt a recovery towards $78,000 and eventually $80,000.
2. Sideways Consolidation ⚖️
BTC could trade between $75,000 and $78,000 while the market waits for stronger buying or selling pressure.
3. Further Correction 📉
If Bitcoin loses the $75,000 support level, traders may start watching $73,000 and lower levels.
🧠 My Personal Take
I think the most important thing right now is not predicting the exact bottom.
The market needs to demonstrate genuine buying strength before a recovery can be trusted.
Heavy liquidations can remove excessive leverage, but they do not automatically mean a bullish reversal is coming.
Patience and risk management are more important than chasing every price movement.
🔥 One Question for the Community
If you had $1,000 today, what would you do?
- Buy Bitcoin at the current price?
- Wait for a drop towards $73,000?
- Hold USDT until the market becomes stable?
Let's discuss in the comments!
#Bitcoin #BTC #BinanceSquare #BitcoinAnalysis #CryptoMarket
On November 6, BTC is trading around $75,400, after losing more than 6% in the last 24 hours.
But there's something more interesting happening behind this price movement.
⚡ The $1 Billion Liquidation Event
More than $1 billion in leveraged crypto positions were liquidated during the recent market downturn. Most of these were long positions, meaning traders who expected Bitcoin to rise were forced out of the market.
This creates an important question:
Are we witnessing the beginning of a deeper bear market, or simply a major market reset?
🐋 What Are Bitcoin Whales Doing?
Large investors and institutional traders can influence short-term market movements through significant buying and selling activity.
During periods of extreme volatility, experienced investors often watch:
- Exchange inflows and outflows.
- Large wallet transactions.
- Institutional ETF investment flows.
- Bitcoin futures open interest.
These indicators can help traders understand whether selling pressure is increasing or weakening.
📊 Three Possible Scenarios for BTC
1. Bullish Recovery 🚀
If buyers defend the $75,000 region, Bitcoin could attempt a recovery towards $78,000 and eventually $80,000.
2. Sideways Consolidation ⚖️
BTC could trade between $75,000 and $78,000 while the market waits for stronger buying or selling pressure.
3. Further Correction 📉
If Bitcoin loses the $75,000 support level, traders may start watching $73,000 and lower levels.
🧠 My Personal Take
I think the most important thing right now is not predicting the exact bottom.
The market needs to demonstrate genuine buying strength before a recovery can be trusted.
Heavy liquidations can remove excessive leverage, but they do not automatically mean a bullish reversal is coming.
Patience and risk management are more important than chasing every price movement.
🔥 One Question for the Community
If you had $1,000 today, what would you do?
- Buy Bitcoin at the current price?
- Wait for a drop towards $73,000?
- Hold USDT until the market becomes stable?
Let's discuss in the comments!
#Bitcoin #BTC #BinanceSquare #BitcoinAnalysis #CryptoMarket
1
56
Article
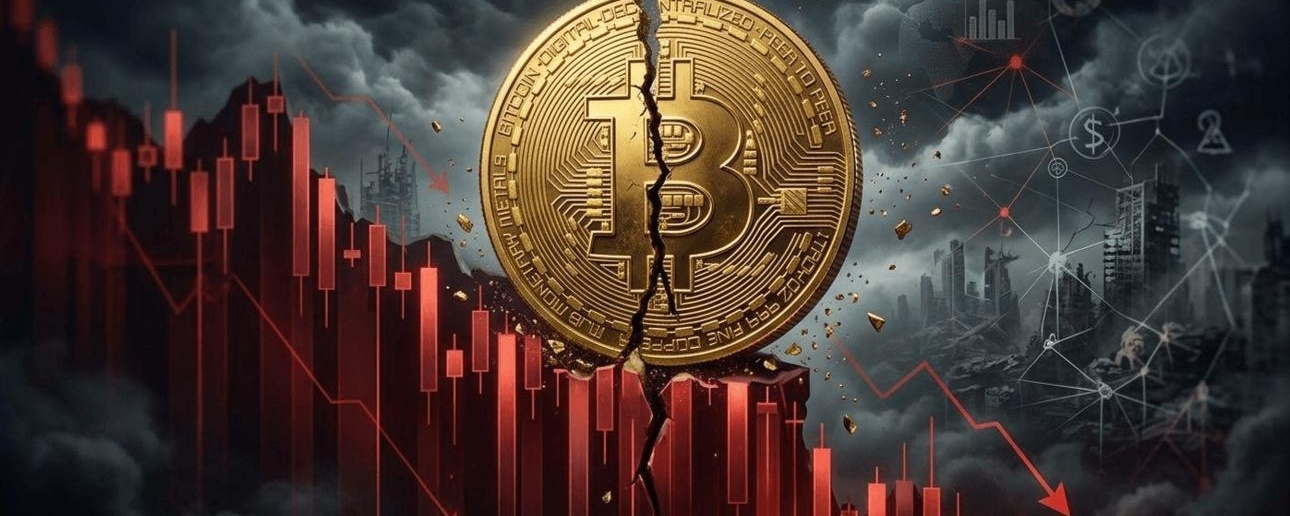
🚨 Bitcoin (BTC) Market Update – November 6, 2026: Is This a Buying Opportunity or the Start of Anot$BTC Bitcoin is facing renewed selling pressure as the cryptocurrency market experiences a significant correction. BTC has dropped towards the $75,000–$76,000 range, losing more than 5% in 24 hours.
But what is happening, and what should investors watch next?
📉 Why Is Bitcoin Falling?
Several factors are putting pressure on Bitcoin:
Stock market weakness: A major sell-off in US technology stocks has affected investor confidence across risk assets.
Massive liquidations: More than $1 billion in leveraged crypto positions have reportedly been liquidated.
ETF outflows: Institutional investment flows have weakened, adding pressure to Bitcoin.
Market uncertainty: Investors are becoming more cautious ahead of important US economic data.
🎯 Important BTC Price Levels
Here are some important levels traders should monitor:
🟢 Support levels:
$75,700 – Immediate support zone
$73,200 – Important technical support
🔴 Resistance levels:
$78,700 – First recovery target
$80,000 – Psychological resistance
$81,300 – Important trend-recovery level
🔮 What Could Happen Next?
Bullish Scenario 🟢
If Bitcoin manages to hold above $75,700 and buying pressure returns, BTC could recover towards $78,700–$80,000.
Bearish Scenario 🔴
If BTC breaks below $75,000 with strong selling volume, the next major support could be around $73,200.
💡 My Market Perspective
I believe this is a crucial moment for Bitcoin. The current correction creates uncertainty, but it may also present opportunities for long-term investors.
Instead of buying emotionally during a sudden dip, traders should watch support levels, trading volume, ETF flows and overall market sentiment.
Remember: A falling market does not automatically mean a buying opportunity.
🚀 Final Thoughts
Bitcoin remains one of the most important assets in the cryptocurrency market. The next few trading sessions could determine whether BTC starts recovering or experiences another downward move.
Are you buying BTC at $75K, or waiting for $73K?
Share your thoughts in the comments! 👇
#Bitcoin #BTC #BitcoinAnalysis #BTCUpdate #CryptoNews
🚨 Bitcoin (BTC) Market Update – November 6, 2026: Is This a Buying Opportunity or the Start of Anot
$BTC Bitcoin is facing renewed selling pressure as the cryptocurrency market experiences a significant correction. BTC has dropped towards the $75,000–$76,000 range, losing more than 5% in 24 hours.
But what is happening, and what should investors watch next?
📉 Why Is Bitcoin Falling?
Several factors are putting pressure on Bitcoin:
Stock market weakness: A major sell-off in US technology stocks has affected investor confidence across risk assets.
Massive liquidations: More than $1 billion in leveraged crypto positions have reportedly been liquidated.
ETF outflows: Institutional investment flows have weakened, adding pressure to Bitcoin.
Market uncertainty: Investors are becoming more cautious ahead of important US economic data.
🎯 Important BTC Price Levels
Here are some important levels traders should monitor:
🟢 Support levels:
$75,700 – Immediate support zone
$73,200 – Important technical support
🔴 Resistance levels:
$78,700 – First recovery target
$80,000 – Psychological resistance
$81,300 – Important trend-recovery level
🔮 What Could Happen Next?
Bullish Scenario 🟢
If Bitcoin manages to hold above $75,700 and buying pressure returns, BTC could recover towards $78,700–$80,000.
Bearish Scenario 🔴
If BTC breaks below $75,000 with strong selling volume, the next major support could be around $73,200.
💡 My Market Perspective
I believe this is a crucial moment for Bitcoin. The current correction creates uncertainty, but it may also present opportunities for long-term investors.
Instead of buying emotionally during a sudden dip, traders should watch support levels, trading volume, ETF flows and overall market sentiment.
Remember: A falling market does not automatically mean a buying opportunity.
🚀 Final Thoughts
Bitcoin remains one of the most important assets in the cryptocurrency market. The next few trading sessions could determine whether BTC starts recovering or experiences another downward move.
Are you buying BTC at $75K, or waiting for $73K?
Share your thoughts in the comments! 👇
#Bitcoin #BTC #BitcoinAnalysis #BTCUpdate #CryptoNews
But what is happening, and what should investors watch next?
📉 Why Is Bitcoin Falling?
Several factors are putting pressure on Bitcoin:
Stock market weakness: A major sell-off in US technology stocks has affected investor confidence across risk assets.
Massive liquidations: More than $1 billion in leveraged crypto positions have reportedly been liquidated.
ETF outflows: Institutional investment flows have weakened, adding pressure to Bitcoin.
Market uncertainty: Investors are becoming more cautious ahead of important US economic data.
🎯 Important BTC Price Levels
Here are some important levels traders should monitor:
🟢 Support levels:
$75,700 – Immediate support zone
$73,200 – Important technical support
🔴 Resistance levels:
$78,700 – First recovery target
$80,000 – Psychological resistance
$81,300 – Important trend-recovery level
🔮 What Could Happen Next?
Bullish Scenario 🟢
If Bitcoin manages to hold above $75,700 and buying pressure returns, BTC could recover towards $78,700–$80,000.
Bearish Scenario 🔴
If BTC breaks below $75,000 with strong selling volume, the next major support could be around $73,200.
💡 My Market Perspective
I believe this is a crucial moment for Bitcoin. The current correction creates uncertainty, but it may also present opportunities for long-term investors.
Instead of buying emotionally during a sudden dip, traders should watch support levels, trading volume, ETF flows and overall market sentiment.
Remember: A falling market does not automatically mean a buying opportunity.
🚀 Final Thoughts
Bitcoin remains one of the most important assets in the cryptocurrency market. The next few trading sessions could determine whether BTC starts recovering or experiences another downward move.
Are you buying BTC at $75K, or waiting for $73K?
Share your thoughts in the comments! 👇
#Bitcoin #BTC #BitcoinAnalysis #BTCUpdate #CryptoNews
1
71

Article
ETHEREUM (ETH): THE NEXT BIG CRYPTO OPPORTUNITY IN 2026?🚀 ETHEREUM (ETH): THE NEXT BIG CRYPTO OPPORTUNITY IN 2026?
Ethereum is more than just another cryptocurrency. It is one of the most important blockchain ecosystems in the world, powering DeFi, smart contracts, NFTs, stablecoins and thousands of decentralized applications.
But the big question is: Could ETH become one of the strongest investment opportunities before the end of 2026?
🔥 Why I'm Watching Ethereum
1. Strong Blockchain Ecosystem
Ethereum remains a major platform for decentralized finance, smart contracts and tokenized assets. Its real-world utility gives it an important advantage over many speculative cryptocurrencies.
2. Upcoming Network Developments
Ethereum's planned Fusaka upgrade in December 2026 is attracting attention. Improvements to network capacity, efficiency and scalability could strengthen its long-term competitiveness.
3. Institutional Interest
Institutional investors continue to monitor Ethereum as an important digital asset. ETF flows and corporate ETH holdings are worth watching for signs of stronger demand.
4. Potential Recovery Opportunity
ETH has recently faced selling pressure. However, market corrections can create opportunities for investors who understand the risks and avoid chasing sudden price movements.
📊 What Should Investors Watch?
- $2,170–$2,240: Important support area.
- $2,300: Potential recovery signal.
- $2,440–$2,450: Resistance area.
- $2,800: Possible upside target if momentum returns.
These are market reference levels, not guaranteed price targets.
💎 My Personal View
I believe Ethereum deserves a place on the 2026 crypto watchlist.
I would prefer gradual accumulation rather than investing everything at once. If network development, institutional demand and market sentiment improve, ETH could have room for recovery.
However, further declines are possible, so risk management is essential.
🤔 What Do You Think?
Can Ethereum reach $3,000 before the end of 2026?
Are you buying ETH, holding it, or waiting for a better entry?
Share your thoughts below! 👇
#Ethereum! #ETH🔥🔥🔥🔥🔥🔥 #BinanceSquare #CryptoTrading #Crypto2026DECEMBER
ETHEREUM (ETH): THE NEXT BIG CRYPTO OPPORTUNITY IN 2026?
🚀 ETHEREUM (ETH): THE NEXT BIG CRYPTO OPPORTUNITY IN 2026?
Ethereum is more than just another cryptocurrency. It is one of the most important blockchain ecosystems in the world, powering DeFi, smart contracts, NFTs, stablecoins and thousands of decentralized applications.
But the big question is: Could ETH become one of the strongest investment opportunities before the end of 2026?
🔥 Why I'm Watching Ethereum
1. Strong Blockchain Ecosystem
Ethereum remains a major platform for decentralized finance, smart contracts and tokenized assets. Its real-world utility gives it an important advantage over many speculative cryptocurrencies.
2. Upcoming Network Developments
Ethereum's planned Fusaka upgrade in December 2026 is attracting attention. Improvements to network capacity, efficiency and scalability could strengthen its long-term competitiveness.
3. Institutional Interest
Institutional investors continue to monitor Ethereum as an important digital asset. ETF flows and corporate ETH holdings are worth watching for signs of stronger demand.
4. Potential Recovery Opportunity
ETH has recently faced selling pressure. However, market corrections can create opportunities for investors who understand the risks and avoid chasing sudden price movements.
📊 What Should Investors Watch?
- $2,170–$2,240: Important support area.
- $2,300: Potential recovery signal.
- $2,440–$2,450: Resistance area.
- $2,800: Possible upside target if momentum returns.
These are market reference levels, not guaranteed price targets.
💎 My Personal View
I believe Ethereum deserves a place on the 2026 crypto watchlist.
I would prefer gradual accumulation rather than investing everything at once. If network development, institutional demand and market sentiment improve, ETH could have room for recovery.
However, further declines are possible, so risk management is essential.
🤔 What Do You Think?
Can Ethereum reach $3,000 before the end of 2026?
Are you buying ETH, holding it, or waiting for a better entry?
Share your thoughts below! 👇
#Ethereum! #ETH🔥🔥🔥🔥🔥🔥 #BinanceSquare #CryptoTrading #Crypto2026DECEMBER
Ethereum is more than just another cryptocurrency. It is one of the most important blockchain ecosystems in the world, powering DeFi, smart contracts, NFTs, stablecoins and thousands of decentralized applications.
But the big question is: Could ETH become one of the strongest investment opportunities before the end of 2026?
🔥 Why I'm Watching Ethereum
1. Strong Blockchain Ecosystem
Ethereum remains a major platform for decentralized finance, smart contracts and tokenized assets. Its real-world utility gives it an important advantage over many speculative cryptocurrencies.
2. Upcoming Network Developments
Ethereum's planned Fusaka upgrade in December 2026 is attracting attention. Improvements to network capacity, efficiency and scalability could strengthen its long-term competitiveness.
3. Institutional Interest
Institutional investors continue to monitor Ethereum as an important digital asset. ETF flows and corporate ETH holdings are worth watching for signs of stronger demand.
4. Potential Recovery Opportunity
ETH has recently faced selling pressure. However, market corrections can create opportunities for investors who understand the risks and avoid chasing sudden price movements.
📊 What Should Investors Watch?
- $2,170–$2,240: Important support area.
- $2,300: Potential recovery signal.
- $2,440–$2,450: Resistance area.
- $2,800: Possible upside target if momentum returns.
These are market reference levels, not guaranteed price targets.
💎 My Personal View
I believe Ethereum deserves a place on the 2026 crypto watchlist.
I would prefer gradual accumulation rather than investing everything at once. If network development, institutional demand and market sentiment improve, ETH could have room for recovery.
However, further declines are possible, so risk management is essential.
🤔 What Do You Think?
Can Ethereum reach $3,000 before the end of 2026?
Are you buying ETH, holding it, or waiting for a better entry?
Share your thoughts below! 👇
#Ethereum! #ETH🔥🔥🔥🔥🔥🔥 #BinanceSquare #CryptoTrading #Crypto2026DECEMBER
1
80
Click here to invest :$TIA 🚀 CELESTIA (TIA): Is This Sleeping Giant Ready to Wake Up?
Celestia ($TIA) is one of the most interesting projects in the modular blockchain ecosystem. As blockchain adoption continues to evolve, Celestia aims to solve one of the industry's biggest challenges: data availability.
🔥 Why Is Celestia Worth Watching?
🔹 Modular blockchain architecture. 🔹 Scalable data availability technology. 🔹 Supports developers building independent blockchains and rollups. 🔹 Growing relevance in the Web3 ecosystem. 🔹 Potential opportunities as modular blockchain adoption expands.
📊 Market Snapshot – November 6, 2026
Price: Approximately $0.42
Market Cap: Approximately $417 million
24H Trading Volume: Approximately $42 million
24H Change: Around -8%
💡 My Market Perspective
TIA is currently facing selling pressure, but its underlying technology makes it an interesting project to follow.
A recovery in market sentiment, combined with stronger network adoption, could bring renewed attention to Celestia.
The big question is: Are investors overlooking TIA at these levels?
🚀 Could Celestia become a major player in the next blockchain cycle?
Share your thoughts and price predictions below!
#celestia #TIA #Crypto #BinanceSquare #Web3
Click here to invest :$TIA 🚀 CELESTIA (TIA): Is This Sleeping Giant Ready to Wake Up?
Celestia ($TIA ) is one of the most interesting projects in the modular blockchain ecosystem. As blockchain adoption continues to evolve, Celestia aims to solve one of the industry's biggest challenges: data availability.
🔥 Why Is Celestia Worth Watching?
🔹 Modular blockchain architecture. 🔹 Scalable data availability technology. 🔹 Supports developers building independent blockchains and rollups. 🔹 Growing relevance in the Web3 ecosystem. 🔹 Potential opportunities as modular blockchain adoption expands.
📊 Market Snapshot – November 6, 2026
Price: Approximately $0.42
Market Cap: Approximately $417 million
24H Trading Volume: Approximately $42 million
24H Change: Around -8%
💡 My Market Perspective
TIA is currently facing selling pressure, but its underlying technology makes it an interesting project to follow.
A recovery in market sentiment, combined with stronger network adoption, could bring renewed attention to Celestia.
The big question is: Are investors overlooking TIA at these levels?
🚀 Could Celestia become a major player in the next blockchain cycle?
Share your thoughts and price predictions below!
#celestia #TIA #Crypto #BinanceSquare #Web3
Celestia ($TIA ) is one of the most interesting projects in the modular blockchain ecosystem. As blockchain adoption continues to evolve, Celestia aims to solve one of the industry's biggest challenges: data availability.
🔥 Why Is Celestia Worth Watching?
🔹 Modular blockchain architecture. 🔹 Scalable data availability technology. 🔹 Supports developers building independent blockchains and rollups. 🔹 Growing relevance in the Web3 ecosystem. 🔹 Potential opportunities as modular blockchain adoption expands.
📊 Market Snapshot – November 6, 2026
Price: Approximately $0.42
Market Cap: Approximately $417 million
24H Trading Volume: Approximately $42 million
24H Change: Around -8%
💡 My Market Perspective
TIA is currently facing selling pressure, but its underlying technology makes it an interesting project to follow.
A recovery in market sentiment, combined with stronger network adoption, could bring renewed attention to Celestia.
The big question is: Are investors overlooking TIA at these levels?
🚀 Could Celestia become a major player in the next blockchain cycle?
Share your thoughts and price predictions below!
#celestia #TIA #Crypto #BinanceSquare #Web3

2
352
Click here to invest : $STRK 🚀 STARKNET (STRK): Is a Major Comeback on the Horizon?
Starknet ($STRK) is attracting attention in the crypto market as investors look for opportunities in Ethereum Layer-2 technology.
Built to improve Ethereum's scalability, Starknet uses advanced STARK cryptographic proofs to make transactions faster, more efficient, and potentially cheaper.
🔥 Why Is Starknet Worth Watching?
Ethereum Layer-2 scaling technology.
Advanced STARK proof technology.
Cairo programming language for developers.
Growing ecosystem of decentralised applications.
Potential opportunities as Ethereum adoption expands.
📊 Market Perspective
STRK has experienced significant volatility. Its long-term potential depends on network adoption, developer activity, token supply, and overall market sentiment.
💡 My Take
Starknet is an interesting infrastructure project worth keeping on the watchlist. If adoption increases and market sentiment improves, STRK could attract renewed investor interest.
Could STRK become one of the next major Layer-2 recovery stories?
What is your prediction for Starknet?
#strk #cryptouniverseofficial #Ethereum✅ #BinanceSquare #Altcoins
Click here to invest : $STRK 🚀 STARKNET (STRK): Is a Major Comeback on the Horizon?
Starknet ($STRK ) is attracting attention in the crypto market as investors look for opportunities in Ethereum Layer-2 technology.
Built to improve Ethereum's scalability, Starknet uses advanced STARK cryptographic proofs to make transactions faster, more efficient, and potentially cheaper.
🔥 Why Is Starknet Worth Watching?
Ethereum Layer-2 scaling technology.
Advanced STARK proof technology.
Cairo programming language for developers.
Growing ecosystem of decentralised applications.
Potential opportunities as Ethereum adoption expands.
📊 Market Perspective
STRK has experienced significant volatility. Its long-term potential depends on network adoption, developer activity, token supply, and overall market sentiment.
💡 My Take
Starknet is an interesting infrastructure project worth keeping on the watchlist. If adoption increases and market sentiment improves, STRK could attract renewed investor interest.
Could STRK become one of the next major Layer-2 recovery stories?
What is your prediction for Starknet?
#strk #cryptouniverseofficial #Ethereum✅ #BinanceSquare #Altcoins
Starknet ($STRK ) is attracting attention in the crypto market as investors look for opportunities in Ethereum Layer-2 technology.
Built to improve Ethereum's scalability, Starknet uses advanced STARK cryptographic proofs to make transactions faster, more efficient, and potentially cheaper.
🔥 Why Is Starknet Worth Watching?
Ethereum Layer-2 scaling technology.
Advanced STARK proof technology.
Cairo programming language for developers.
Growing ecosystem of decentralised applications.
Potential opportunities as Ethereum adoption expands.
📊 Market Perspective
STRK has experienced significant volatility. Its long-term potential depends on network adoption, developer activity, token supply, and overall market sentiment.
💡 My Take
Starknet is an interesting infrastructure project worth keeping on the watchlist. If adoption increases and market sentiment improves, STRK could attract renewed investor interest.
Could STRK become one of the next major Layer-2 recovery stories?
What is your prediction for Starknet?
#strk #cryptouniverseofficial #Ethereum✅ #BinanceSquare #Altcoins

3
542

6
12
1
35
Article
BITCOIN → Why did it drop to 60K? When do we expect 75K?
by thesharkke
Updated May 15
271.8K
BINANCE:BTCUSDT has been showing bullish prospects all week and has been consolidating above key zones, preparing to go higher, but on Friday the market changed to bearish and there is a reason for that. BTC lost 3.3% on Friday and is currently painting a bearish picture. There are two reasons
Long
by RLinda
Updated 21 minutes ago
41205
🅱️ Expert Confirms: Bitcoin Set To Crash Below 30KSignals are available everywhere... And new data is coming in all of the timing. The market is great. Even though we get confirmation after confirmation, doubts still creeps in. Even though we see the market moving just as we would expect it to move based on the cycle, sentiment and chart signals;
by AlanSantana
Updated 18 hours ago
4371
🅱️ Bitcoin 4X SHORT (151% Profits Potential)➖ Last week Bitcoin produced what appears to be a bullish candlestick pattern, which is good. This week, a negation happens and prices move to trade and close below EMA10. ➖ The rejection (bearish close) right after the recovery (bullish close) results in a "failed signal," these failed signals are
Short
by AlanSantana
Updated 18 hours ago
3477
How To Trade Triangles Like A Pro?Welcome, traders and investors, to our educational post on ascending and descending triangles! In the fast-paced world of financial markets, understanding chart patterns like these is crucial for making informed trading decisions. Ascending and descending triangles are powerful tools that prov
EDITORS' PICKS
Education
by RocketBomb
Updated May 15
26636
I'm Back - Bitcoin - Long for the 90'sBitcoin continues to hold the 60k levels, and by the weekly candles, any and all dips are being bought up. However the market does not feel over exuberant and so in my opinion there is room to run here. The next level of importance is around 92-95k, so for me I am slowly stepping in for the nex
Long
by goldbug1
May 13
1967
BITCOIN Another 1D MA50 rejection. More bleeding ahead?Bitcoin (BTCUSD) broke again below the 1D MA100 (green trend-line) after the 3rd rejection on the 1D MA50 (blue trend-line) in almost 1 month (since the April 13 bearish break-out). If it stays unbroken, it is a far from ideal development as the 1-year price action has shown us that such a pattern r
by TradingShot
May 11
1183
[BTCUSD] - the most important resistance in 1D chartin 1D chart BTC is still consolidating in falling wedge pattern...breaking out the upper side make btc trading above the green rectangular and it's just a matter of time to habben. Green rectangular is a most important zone in this chart...it represents a neck line of the inverse H&S pattern , 0.5
Long
by ceciliones
Updated May 15
1833
New Volume Footprint option on TradingViewHi all, This is the first (stream replacement) educational video with a very quick overview of volume. Tradingview just released the new Footprint Beta tool. It's something I asked them for a long time ago, so I am glad it's finally here! In this video I cover the time-price-opportunity tool as
EDITORS' PICKS
Education
18:17
by Mayfair_Ventures
May 14
7154
Fib Retracement questions smart money SPOOFING!Fib Retracement with an interesting smart money contraction. Trend line points parallel upwards to wear the smart money contraction, horizontal red dotted line. If there’s a breakout then the 2MO TF BEARS loose. Stoch RSI will confirm it by bull trend must cross the bear trend making a curve to the
Long
by The_ForexX_Mindset
Updated 17 hours ago
2823
See all ideas
News
21 minutes agoNewsBTC
The Hidden Forces Behind Bitcoin Price: Latest Insights From On-Chain Data
2 hours agoCointelegraph
Bitcoin analysis mostly ‘noise,’ a $70K breakout is what matters
2 hours agoBeincrypto
Market Awaits $2.1 Billion BTC and ETH Options Expiry Post-US CPI Release
3 hours agoNewsBTC
Is Dogecoin About to Take Off? Indicators Suggest Upward Momentum Ahead
3 hours agoNewsBTC
Bitcoin Still Has “A Lot Of Room To Run Before Reversal,” Says Top Analyst
Keep reading
Technicals
Summarizing what the indicators are suggesting.
Oscillators
Neutral
SellBuy
Strong sellStrong buy
Strong sellSellNeutralBuyStrong buy
Summary
Neutral
SellBuy
Strong sellStrong buy
Strong sellSellNeutralBuyStrong buy
Moving Averages
Neutral
SellBuy
Strong sellStrong buy
Strong sellSellNeutralBuyStrong buy
Crypto brokers
Binance
4.7
Learn more
Sparks
Curated watchlists where BTCUSD is featured.
Gen 1 crypto: from little acorns grow
16NO. OF SYMBOLS
Proof of Work: Embracing the crunch
27NO. OF SYMBOLS
See all sparks
Related symbols
BTCEUR
Bitcoin / Euro
60891.30EUR
+1.45%
BTCJPY
Bitcoin / Japanese Yen
10309539JPY
+1.44%
ETHBTC
Ethereum / Bitcoin
0.04562BTC
+1.06%
BTCGBP
Bitcoin / British Pound
52232.10GBP
+1.48%
BTC1!D
Bitcoin CME Futures
66415USD
+1.48%
BTCAUD
Bitcoin / Australian Dollar
99308.0AUD
+1.59%
IBIT
iShares Bitcoin Trust
37.15USD
−1.38%
Frequently Asked Questions
What is Bitcoin price today?
What is Bitcoin market cap?
What is the daily trading volume of Bitcoin?
How Bitcoin price changed over time?
What is Bitcoin highest price ever?
What is Bitcoin lowest price ever?
What is Bitcoin circulating supply?
What is Bitcoin's max supply?
How to buy Bitcoin?
Should I buy Bitcoin?
Is it safe to invest in Bitcoin?
What do traders think of Bitcoin?
Love in every
#TradingView
60M+
Traders and investors use our platform.
#1
Top website in the world when it comes to all things investing.
1.5M+
Mobile reviews with 4.9 average rating. No other fintech apps are more loved.
10M+
Custom scripts and ideas shared by our users.
@trade_with_georgef
@mytradingsetup
@zuko_carmona
@isra3l_vergara
@jimnakmtl
@anna_mcmorrin_
@bradfairbridge
@agagata.j
@sethsickness
@johnny_muffet
@french_trader
@ketory_fx
@nbuevich
@Crypto Melih🥷
@johndollery
@ya_tu_sabes_1983
@johndollery
@price_action_guru
Whatever the trade
Here's why
English
Products
SuperchartsPine Script™Stock ScreenerETF ScreenerForex ScreenerCrypto Coins ScreenerCrypto Pairs ScreenerDEX Pairs ScreenerStock HeatmapETF HeatmapCrypto HeatmapEconomic CalendarEarnings CalendarSparksNewsTradingView DesktopMobile appCME Group futuresEurex futuresUS stocks bundle
Company
AboutFeaturesPricingSocial networkWall of LoveAthletesManifestoCareersBlogSecurity vulnerabilityStatus pageTerms of useDisclaimerPrivacy policyCookies policyMedia kitAccessibility statementTarot cards for traders
Community
Refer a friendIdeasScriptsHouse rulesModeratorsPine Script™ WizardsChat
For business
WidgetsAdvertisingCharting librariesLightweight Charts™Advanced ChartsTrading PlatformBrokerage integrationPartner programEducation program
Select market data provided by ICE Data Services© 2024 TradingView, Inc.
Close
News//The Hidden Forces Behind Bitcoin Price: Latest Insights From On-C…
The Hidden Forces Behind Bitcoin Price: Latest Insights From On-Chain Data
May 17, 202413:30 GMT+6
BTCUSD+1.42%
Leading on-chain analyst James Check, popularly known as Checkmatey, has recently delved into the intricacies of Bitcoin’s market dynamics, offering a detailed on-chain data analysis that sheds light on the forces driving Bitcoin prices. His latest insights highlight a period he describes as “Quiet and Trending,” suggesting a robust underpinning despite significant sell-side pressures and shifts in volatility.
Bitcoin Follows The Stair-Stepping Rally-Consolidation-Rally Pattern
Since December, Bitcoin has experienced substantial sell-side pressure, with over 1.5 million BTC being sold. “Around 30% of this came out of GBTC, but the rest of it was good old fashioned profit taking,” Check explains. Despite such substantial market sales, Bitcoin has demonstrated resilience with a relatively modest price correction of just -20%. This suggests that the foundational support levels for Bitcoin are stronger than what surface-level market movements might imply.
A striking aspect of Check’s analysis is the transformation in Bitcoin’s volatility profile. “The overall realized volatility profile for Bitcoin is half what it was in 2021, and 3x smaller than 2017,” states Check. This trend indicates a growing maturity within the Bitcoin market, reflecting its evolution into a more stable asset over time compared to its early years.
Check counters the typical narrative surrounding Bitcoin’s volatility: “What a lot of people forget however is that Bitcoin is volatile to the upside. Volatility to the upside is good!” He posits that the current increment in volatility is moderate and suggests that the market is still in the early phases of a bull run, rather than nearing its end.
A critical tool in Check’s analysis is the Short-Term Holder MVRV (STH-MVRV) Ratio, which he uses to gauge market sentiment and phases. According to Check, this ratio consistently finds support at 1.0 and resistance at 1.4 during stable uptrends. Stability is maintained as long as the ratio remains within these bounds. “Only when it breaks above this ceiling do things become unstable,” Check notes, which could signal a transition to bearish conditions.
Despite the sell-off that brought Bitcoin down to $57k, Check observes that this has not significantly dented the profitability of short-term holders. “The magnitude of Unrealised Loss was very much in line with bull market corrections, calming fears of a top-heavy market.”
He further highlights that several of the local top buyers panic sold their Bitcoin at the lows, an action he interprets as beneficial for the correction phase, serving to stabilize the market by shaking out weak hands.
Expanding his analysis, Check refutes the criticism that Bitcoin’s volatility makes it a less viable asset. He points to a chart comparison of Bitcoin’s 30-day volatility against top-performing US stocks, showing that Bitcoin’s volatility is well within a manageable range.
Furthermore, he discusses the lower realized volatility of the SPY index, attributing it to the “out sized performance of the Magnificent-7,” which is counterbalanced by the poorer performance of the other components.
By highlighting the structural aspects of the current “Quiet and Trending” market phase, Check offers a refined perspective on how Bitcoin is navigating its maturation pathway, balancing between its speculative origins and its potential as a mainstream financial asset.
He concludes, “Overall, the Bitcoin uptrend in 2023-24 looks fairly structured, following stair-stepping rally-consolidation-rally pattern. However, as the charts above show, volatility tends to pick up during a consolidation, and that can lead to instability.”
At press time, BTC traded at $66,288.
#bitcoin #Binance #USDT #Web3
BITCOIN → Why did it drop to 60K? When do we expect 75K?
by thesharkke
Updated May 15
271.8K
BINANCE:BTCUSDT has been showing bullish prospects all week and has been consolidating above key zones, preparing to go higher, but on Friday the market changed to bearish and there is a reason for that. BTC lost 3.3% on Friday and is currently painting a bearish picture. There are two reasons
Long
by RLinda
Updated 21 minutes ago
41205
🅱️ Expert Confirms: Bitcoin Set To Crash Below 30KSignals are available everywhere... And new data is coming in all of the timing. The market is great. Even though we get confirmation after confirmation, doubts still creeps in. Even though we see the market moving just as we would expect it to move based on the cycle, sentiment and chart signals;
by AlanSantana
Updated 18 hours ago
4371
🅱️ Bitcoin 4X SHORT (151% Profits Potential)➖ Last week Bitcoin produced what appears to be a bullish candlestick pattern, which is good. This week, a negation happens and prices move to trade and close below EMA10. ➖ The rejection (bearish close) right after the recovery (bullish close) results in a "failed signal," these failed signals are
Short
by AlanSantana
Updated 18 hours ago
3477
How To Trade Triangles Like A Pro?Welcome, traders and investors, to our educational post on ascending and descending triangles! In the fast-paced world of financial markets, understanding chart patterns like these is crucial for making informed trading decisions. Ascending and descending triangles are powerful tools that prov
EDITORS' PICKS
Education
by RocketBomb
Updated May 15
26636
I'm Back - Bitcoin - Long for the 90'sBitcoin continues to hold the 60k levels, and by the weekly candles, any and all dips are being bought up. However the market does not feel over exuberant and so in my opinion there is room to run here. The next level of importance is around 92-95k, so for me I am slowly stepping in for the nex
Long
by goldbug1
May 13
1967
BITCOIN Another 1D MA50 rejection. More bleeding ahead?Bitcoin (BTCUSD) broke again below the 1D MA100 (green trend-line) after the 3rd rejection on the 1D MA50 (blue trend-line) in almost 1 month (since the April 13 bearish break-out). If it stays unbroken, it is a far from ideal development as the 1-year price action has shown us that such a pattern r
by TradingShot
May 11
1183
[BTCUSD] - the most important resistance in 1D chartin 1D chart BTC is still consolidating in falling wedge pattern...breaking out the upper side make btc trading above the green rectangular and it's just a matter of time to habben. Green rectangular is a most important zone in this chart...it represents a neck line of the inverse H&S pattern , 0.5
Long
by ceciliones
Updated May 15
1833
New Volume Footprint option on TradingViewHi all, This is the first (stream replacement) educational video with a very quick overview of volume. Tradingview just released the new Footprint Beta tool. It's something I asked them for a long time ago, so I am glad it's finally here! In this video I cover the time-price-opportunity tool as
EDITORS' PICKS
Education
18:17
by Mayfair_Ventures
May 14
7154
Fib Retracement questions smart money SPOOFING!Fib Retracement with an interesting smart money contraction. Trend line points parallel upwards to wear the smart money contraction, horizontal red dotted line. If there’s a breakout then the 2MO TF BEARS loose. Stoch RSI will confirm it by bull trend must cross the bear trend making a curve to the
Long
by The_ForexX_Mindset
Updated 17 hours ago
2823
See all ideas
News
21 minutes agoNewsBTC
The Hidden Forces Behind Bitcoin Price: Latest Insights From On-Chain Data
2 hours agoCointelegraph
Bitcoin analysis mostly ‘noise,’ a $70K breakout is what matters
2 hours agoBeincrypto
Market Awaits $2.1 Billion BTC and ETH Options Expiry Post-US CPI Release
3 hours agoNewsBTC
Is Dogecoin About to Take Off? Indicators Suggest Upward Momentum Ahead
3 hours agoNewsBTC
Bitcoin Still Has “A Lot Of Room To Run Before Reversal,” Says Top Analyst
Keep reading
Technicals
Summarizing what the indicators are suggesting.
Oscillators
Neutral
SellBuy
Strong sellStrong buy
Strong sellSellNeutralBuyStrong buy
Summary
Neutral
SellBuy
Strong sellStrong buy
Strong sellSellNeutralBuyStrong buy
Moving Averages
Neutral
SellBuy
Strong sellStrong buy
Strong sellSellNeutralBuyStrong buy
Crypto brokers
Binance
4.7
Learn more
Sparks
Curated watchlists where BTCUSD is featured.
Gen 1 crypto: from little acorns grow
16NO. OF SYMBOLS
Proof of Work: Embracing the crunch
27NO. OF SYMBOLS
See all sparks
Related symbols
BTCEUR
Bitcoin / Euro
60891.30EUR
+1.45%
BTCJPY
Bitcoin / Japanese Yen
10309539JPY
+1.44%
ETHBTC
Ethereum / Bitcoin
0.04562BTC
+1.06%
BTCGBP
Bitcoin / British Pound
52232.10GBP
+1.48%
BTC1!D
Bitcoin CME Futures
66415USD
+1.48%
BTCAUD
Bitcoin / Australian Dollar
99308.0AUD
+1.59%
IBIT
iShares Bitcoin Trust
37.15USD
−1.38%
Frequently Asked Questions
What is Bitcoin price today?
What is Bitcoin market cap?
What is the daily trading volume of Bitcoin?
How Bitcoin price changed over time?
What is Bitcoin highest price ever?
What is Bitcoin lowest price ever?
What is Bitcoin circulating supply?
What is Bitcoin's max supply?
How to buy Bitcoin?
Should I buy Bitcoin?
Is it safe to invest in Bitcoin?
What do traders think of Bitcoin?
Love in every
#TradingView
60M+
Traders and investors use our platform.
#1
Top website in the world when it comes to all things investing.
1.5M+
Mobile reviews with 4.9 average rating. No other fintech apps are more loved.
10M+
Custom scripts and ideas shared by our users.
@trade_with_georgef
@mytradingsetup
@zuko_carmona
@isra3l_vergara
@jimnakmtl
@anna_mcmorrin_
@bradfairbridge
@agagata.j
@sethsickness
@johnny_muffet
@french_trader
@ketory_fx
@nbuevich
@Crypto Melih🥷
@johndollery
@ya_tu_sabes_1983
@johndollery
@price_action_guru
Whatever the trade
Here's why
English
Products
SuperchartsPine Script™Stock ScreenerETF ScreenerForex ScreenerCrypto Coins ScreenerCrypto Pairs ScreenerDEX Pairs ScreenerStock HeatmapETF HeatmapCrypto HeatmapEconomic CalendarEarnings CalendarSparksNewsTradingView DesktopMobile appCME Group futuresEurex futuresUS stocks bundle
Company
AboutFeaturesPricingSocial networkWall of LoveAthletesManifestoCareersBlogSecurity vulnerabilityStatus pageTerms of useDisclaimerPrivacy policyCookies policyMedia kitAccessibility statementTarot cards for traders
Community
Refer a friendIdeasScriptsHouse rulesModeratorsPine Script™ WizardsChat
For business
WidgetsAdvertisingCharting librariesLightweight Charts™Advanced ChartsTrading PlatformBrokerage integrationPartner programEducation program
Select market data provided by ICE Data Services© 2024 TradingView, Inc.
Close
News//The Hidden Forces Behind Bitcoin Price: Latest Insights From On-C…
The Hidden Forces Behind Bitcoin Price: Latest Insights From On-Chain Data
May 17, 202413:30 GMT+6
BTCUSD+1.42%
Leading on-chain analyst James Check, popularly known as Checkmatey, has recently delved into the intricacies of Bitcoin’s market dynamics, offering a detailed on-chain data analysis that sheds light on the forces driving Bitcoin prices. His latest insights highlight a period he describes as “Quiet and Trending,” suggesting a robust underpinning despite significant sell-side pressures and shifts in volatility.
Bitcoin Follows The Stair-Stepping Rally-Consolidation-Rally Pattern
Since December, Bitcoin has experienced substantial sell-side pressure, with over 1.5 million BTC being sold. “Around 30% of this came out of GBTC, but the rest of it was good old fashioned profit taking,” Check explains. Despite such substantial market sales, Bitcoin has demonstrated resilience with a relatively modest price correction of just -20%. This suggests that the foundational support levels for Bitcoin are stronger than what surface-level market movements might imply.
A striking aspect of Check’s analysis is the transformation in Bitcoin’s volatility profile. “The overall realized volatility profile for Bitcoin is half what it was in 2021, and 3x smaller than 2017,” states Check. This trend indicates a growing maturity within the Bitcoin market, reflecting its evolution into a more stable asset over time compared to its early years.
Check counters the typical narrative surrounding Bitcoin’s volatility: “What a lot of people forget however is that Bitcoin is volatile to the upside. Volatility to the upside is good!” He posits that the current increment in volatility is moderate and suggests that the market is still in the early phases of a bull run, rather than nearing its end.
A critical tool in Check’s analysis is the Short-Term Holder MVRV (STH-MVRV) Ratio, which he uses to gauge market sentiment and phases. According to Check, this ratio consistently finds support at 1.0 and resistance at 1.4 during stable uptrends. Stability is maintained as long as the ratio remains within these bounds. “Only when it breaks above this ceiling do things become unstable,” Check notes, which could signal a transition to bearish conditions.
Despite the sell-off that brought Bitcoin down to $57k, Check observes that this has not significantly dented the profitability of short-term holders. “The magnitude of Unrealised Loss was very much in line with bull market corrections, calming fears of a top-heavy market.”
He further highlights that several of the local top buyers panic sold their Bitcoin at the lows, an action he interprets as beneficial for the correction phase, serving to stabilize the market by shaking out weak hands.
Expanding his analysis, Check refutes the criticism that Bitcoin’s volatility makes it a less viable asset. He points to a chart comparison of Bitcoin’s 30-day volatility against top-performing US stocks, showing that Bitcoin’s volatility is well within a manageable range.
Furthermore, he discusses the lower realized volatility of the SPY index, attributing it to the “out sized performance of the Magnificent-7,” which is counterbalanced by the poorer performance of the other components.
By highlighting the structural aspects of the current “Quiet and Trending” market phase, Check offers a refined perspective on how Bitcoin is navigating its maturation pathway, balancing between its speculative origins and its potential as a mainstream financial asset.
He concludes, “Overall, the Bitcoin uptrend in 2023-24 looks fairly structured, following stair-stepping rally-consolidation-rally pattern. However, as the charts above show, volatility tends to pick up during a consolidation, and that can lead to instability.”
At press time, BTC traded at $66,288.
#bitcoin #Binance #USDT #Web3
Updated May 15
271.8K
BINANCE:BTCUSDT has been showing bullish prospects all week and has been consolidating above key zones, preparing to go higher, but on Friday the market changed to bearish and there is a reason for that. BTC lost 3.3% on Friday and is currently painting a bearish picture. There are two reasons
Long
by RLinda
Updated 21 minutes ago
41205
🅱️ Expert Confirms: Bitcoin Set To Crash Below 30KSignals are available everywhere... And new data is coming in all of the timing. The market is great. Even though we get confirmation after confirmation, doubts still creeps in. Even though we see the market moving just as we would expect it to move based on the cycle, sentiment and chart signals;
by AlanSantana
Updated 18 hours ago
4371
🅱️ Bitcoin 4X SHORT (151% Profits Potential)➖ Last week Bitcoin produced what appears to be a bullish candlestick pattern, which is good. This week, a negation happens and prices move to trade and close below EMA10. ➖ The rejection (bearish close) right after the recovery (bullish close) results in a "failed signal," these failed signals are
Short
by AlanSantana
Updated 18 hours ago
3477
How To Trade Triangles Like A Pro?Welcome, traders and investors, to our educational post on ascending and descending triangles! In the fast-paced world of financial markets, understanding chart patterns like these is crucial for making informed trading decisions. Ascending and descending triangles are powerful tools that prov
EDITORS' PICKS
Education
by RocketBomb
Updated May 15
26636
I'm Back - Bitcoin - Long for the 90'sBitcoin continues to hold the 60k levels, and by the weekly candles, any and all dips are being bought up. However the market does not feel over exuberant and so in my opinion there is room to run here. The next level of importance is around 92-95k, so for me I am slowly stepping in for the nex
Long
by goldbug1
May 13
1967
BITCOIN Another 1D MA50 rejection. More bleeding ahead?Bitcoin (BTCUSD) broke again below the 1D MA100 (green trend-line) after the 3rd rejection on the 1D MA50 (blue trend-line) in almost 1 month (since the April 13 bearish break-out). If it stays unbroken, it is a far from ideal development as the 1-year price action has shown us that such a pattern r
by TradingShot
May 11
1183
[BTCUSD] - the most important resistance in 1D chartin 1D chart BTC is still consolidating in falling wedge pattern...breaking out the upper side make btc trading above the green rectangular and it's just a matter of time to habben. Green rectangular is a most important zone in this chart...it represents a neck line of the inverse H&S pattern , 0.5
Long
by ceciliones
Updated May 15
1833
New Volume Footprint option on TradingViewHi all, This is the first (stream replacement) educational video with a very quick overview of volume. Tradingview just released the new Footprint Beta tool. It's something I asked them for a long time ago, so I am glad it's finally here! In this video I cover the time-price-opportunity tool as
EDITORS' PICKS
Education
18:17
by Mayfair_Ventures
May 14
7154
Fib Retracement questions smart money SPOOFING!Fib Retracement with an interesting smart money contraction. Trend line points parallel upwards to wear the smart money contraction, horizontal red dotted line. If there’s a breakout then the 2MO TF BEARS loose. Stoch RSI will confirm it by bull trend must cross the bear trend making a curve to the
Long
by The_ForexX_Mindset
Updated 17 hours ago
2823
See all ideas
News
21 minutes agoNewsBTC
The Hidden Forces Behind Bitcoin Price: Latest Insights From On-Chain Data
2 hours agoCointelegraph
Bitcoin analysis mostly ‘noise,’ a $70K breakout is what matters
2 hours agoBeincrypto
Market Awaits $2.1 Billion BTC and ETH Options Expiry Post-US CPI Release
3 hours agoNewsBTC
Is Dogecoin About to Take Off? Indicators Suggest Upward Momentum Ahead
3 hours agoNewsBTC
Bitcoin Still Has “A Lot Of Room To Run Before Reversal,” Says Top Analyst
Keep reading
Technicals
Summarizing what the indicators are suggesting.
Oscillators
Neutral
SellBuy
Strong sellStrong buy
Strong sellSellNeutralBuyStrong buy
Summary
Neutral
SellBuy
Strong sellStrong buy
Strong sellSellNeutralBuyStrong buy
Moving Averages
Neutral
SellBuy
Strong sellStrong buy
Strong sellSellNeutralBuyStrong buy
Crypto brokers
Binance
4.7
Learn more
Sparks
Curated watchlists where BTCUSD is featured.
Gen 1 crypto: from little acorns grow
16NO. OF SYMBOLS
Proof of Work: Embracing the crunch
27NO. OF SYMBOLS
See all sparks
Related symbols
BTCEUR
Bitcoin / Euro
60891.30EUR
+1.45%
BTCJPY
Bitcoin / Japanese Yen
10309539JPY
+1.44%
ETHBTC
Ethereum / Bitcoin
0.04562BTC
+1.06%
BTCGBP
Bitcoin / British Pound
52232.10GBP
+1.48%
BTC1!D
Bitcoin CME Futures
66415USD
+1.48%
BTCAUD
Bitcoin / Australian Dollar
99308.0AUD
+1.59%
IBIT
iShares Bitcoin Trust
37.15USD
−1.38%
Frequently Asked Questions
What is Bitcoin price today?
What is Bitcoin market cap?
What is the daily trading volume of Bitcoin?
How Bitcoin price changed over time?
What is Bitcoin highest price ever?
What is Bitcoin lowest price ever?
What is Bitcoin circulating supply?
What is Bitcoin's max supply?
How to buy Bitcoin?
Should I buy Bitcoin?
Is it safe to invest in Bitcoin?
What do traders think of Bitcoin?
Love in every
#TradingView
60M+
Traders and investors use our platform.
#1
Top website in the world when it comes to all things investing.
1.5M+
Mobile reviews with 4.9 average rating. No other fintech apps are more loved.
10M+
Custom scripts and ideas shared by our users.
@trade_with_georgef
@mytradingsetup
@zuko_carmona
@isra3l_vergara
@jimnakmtl
@anna_mcmorrin_
@bradfairbridge
@agagata.j
@sethsickness
@johnny_muffet
@french_trader
@ketory_fx
@nbuevich
@Crypto Melih🥷
@johndollery
@ya_tu_sabes_1983
@johndollery
@price_action_guru
Whatever the trade
Here's why
English
Products
SuperchartsPine Script™Stock ScreenerETF ScreenerForex ScreenerCrypto Coins ScreenerCrypto Pairs ScreenerDEX Pairs ScreenerStock HeatmapETF HeatmapCrypto HeatmapEconomic CalendarEarnings CalendarSparksNewsTradingView DesktopMobile appCME Group futuresEurex futuresUS stocks bundle
Company
AboutFeaturesPricingSocial networkWall of LoveAthletesManifestoCareersBlogSecurity vulnerabilityStatus pageTerms of useDisclaimerPrivacy policyCookies policyMedia kitAccessibility statementTarot cards for traders
Community
Refer a friendIdeasScriptsHouse rulesModeratorsPine Script™ WizardsChat
For business
WidgetsAdvertisingCharting librariesLightweight Charts™Advanced ChartsTrading PlatformBrokerage integrationPartner programEducation program
Select market data provided by ICE Data Services© 2024 TradingView, Inc.
Close
News//The Hidden Forces Behind Bitcoin Price: Latest Insights From On-C…
The Hidden Forces Behind Bitcoin Price: Latest Insights From On-Chain Data
May 17, 202413:30 GMT+6
BTCUSD+1.42%
Leading on-chain analyst James Check, popularly known as Checkmatey, has recently delved into the intricacies of Bitcoin’s market dynamics, offering a detailed on-chain data analysis that sheds light on the forces driving Bitcoin prices. His latest insights highlight a period he describes as “Quiet and Trending,” suggesting a robust underpinning despite significant sell-side pressures and shifts in volatility.
Bitcoin Follows The Stair-Stepping Rally-Consolidation-Rally Pattern
Since December, Bitcoin has experienced substantial sell-side pressure, with over 1.5 million BTC being sold. “Around 30% of this came out of GBTC, but the rest of it was good old fashioned profit taking,” Check explains. Despite such substantial market sales, Bitcoin has demonstrated resilience with a relatively modest price correction of just -20%. This suggests that the foundational support levels for Bitcoin are stronger than what surface-level market movements might imply.
A striking aspect of Check’s analysis is the transformation in Bitcoin’s volatility profile. “The overall realized volatility profile for Bitcoin is half what it was in 2021, and 3x smaller than 2017,” states Check. This trend indicates a growing maturity within the Bitcoin market, reflecting its evolution into a more stable asset over time compared to its early years.
Check counters the typical narrative surrounding Bitcoin’s volatility: “What a lot of people forget however is that Bitcoin is volatile to the upside. Volatility to the upside is good!” He posits that the current increment in volatility is moderate and suggests that the market is still in the early phases of a bull run, rather than nearing its end.
A critical tool in Check’s analysis is the Short-Term Holder MVRV (STH-MVRV) Ratio, which he uses to gauge market sentiment and phases. According to Check, this ratio consistently finds support at 1.0 and resistance at 1.4 during stable uptrends. Stability is maintained as long as the ratio remains within these bounds. “Only when it breaks above this ceiling do things become unstable,” Check notes, which could signal a transition to bearish conditions.
Despite the sell-off that brought Bitcoin down to $57k, Check observes that this has not significantly dented the profitability of short-term holders. “The magnitude of Unrealised Loss was very much in line with bull market corrections, calming fears of a top-heavy market.”
He further highlights that several of the local top buyers panic sold their Bitcoin at the lows, an action he interprets as beneficial for the correction phase, serving to stabilize the market by shaking out weak hands.
Expanding his analysis, Check refutes the criticism that Bitcoin’s volatility makes it a less viable asset. He points to a chart comparison of Bitcoin’s 30-day volatility against top-performing US stocks, showing that Bitcoin’s volatility is well within a manageable range.
Furthermore, he discusses the lower realized volatility of the SPY index, attributing it to the “out sized performance of the Magnificent-7,” which is counterbalanced by the poorer performance of the other components.
By highlighting the structural aspects of the current “Quiet and Trending” market phase, Check offers a refined perspective on how Bitcoin is navigating its maturation pathway, balancing between its speculative origins and its potential as a mainstream financial asset.
He concludes, “Overall, the Bitcoin uptrend in 2023-24 looks fairly structured, following stair-stepping rally-consolidation-rally pattern. However, as the charts above show, volatility tends to pick up during a consolidation, and that can lead to instability.”
At press time, BTC traded at $66,288.
#bitcoin #Binance #USDT #Web3
6
6
Which one is batter ?
Which one is batter ?
PEPE
0%
SHIB
100%
1 votes • Voting closed
3

Log in to explore more content
Join global crypto users on Binance Square
⚡️ Get latest and useful information about crypto.
💬 Trusted by the world’s largest crypto exchange.
👍 Discover real insights from verified creators.
Email / Phone number
Trending Topics
BinanceReopensWithdrawalsForMoreAssets
1.1M views
5,976 Discussing
Recovery Update #9: Withdrawals for More Assets to Reopen (2026-11-06)
Binance Announcement
·207 Likes
·824.4k views
$2TWipedOutHedgeFundsFaceLiquidation
2,437 views
38 Discussing
AnthropicIPOValuationDoubts
20,886 views
458 Discussing