
K线派飞哥
3.4k Posts

K线派飞哥
公众号:k线人生飞哥 推特和X:@TT520btc 币安手续费返佣邀请码:ZO25P9WZ
Occasional Trader
3.4 Years
34 Following
13.9K+ Followers
13.8K+ Liked
Posts
All
Quotes
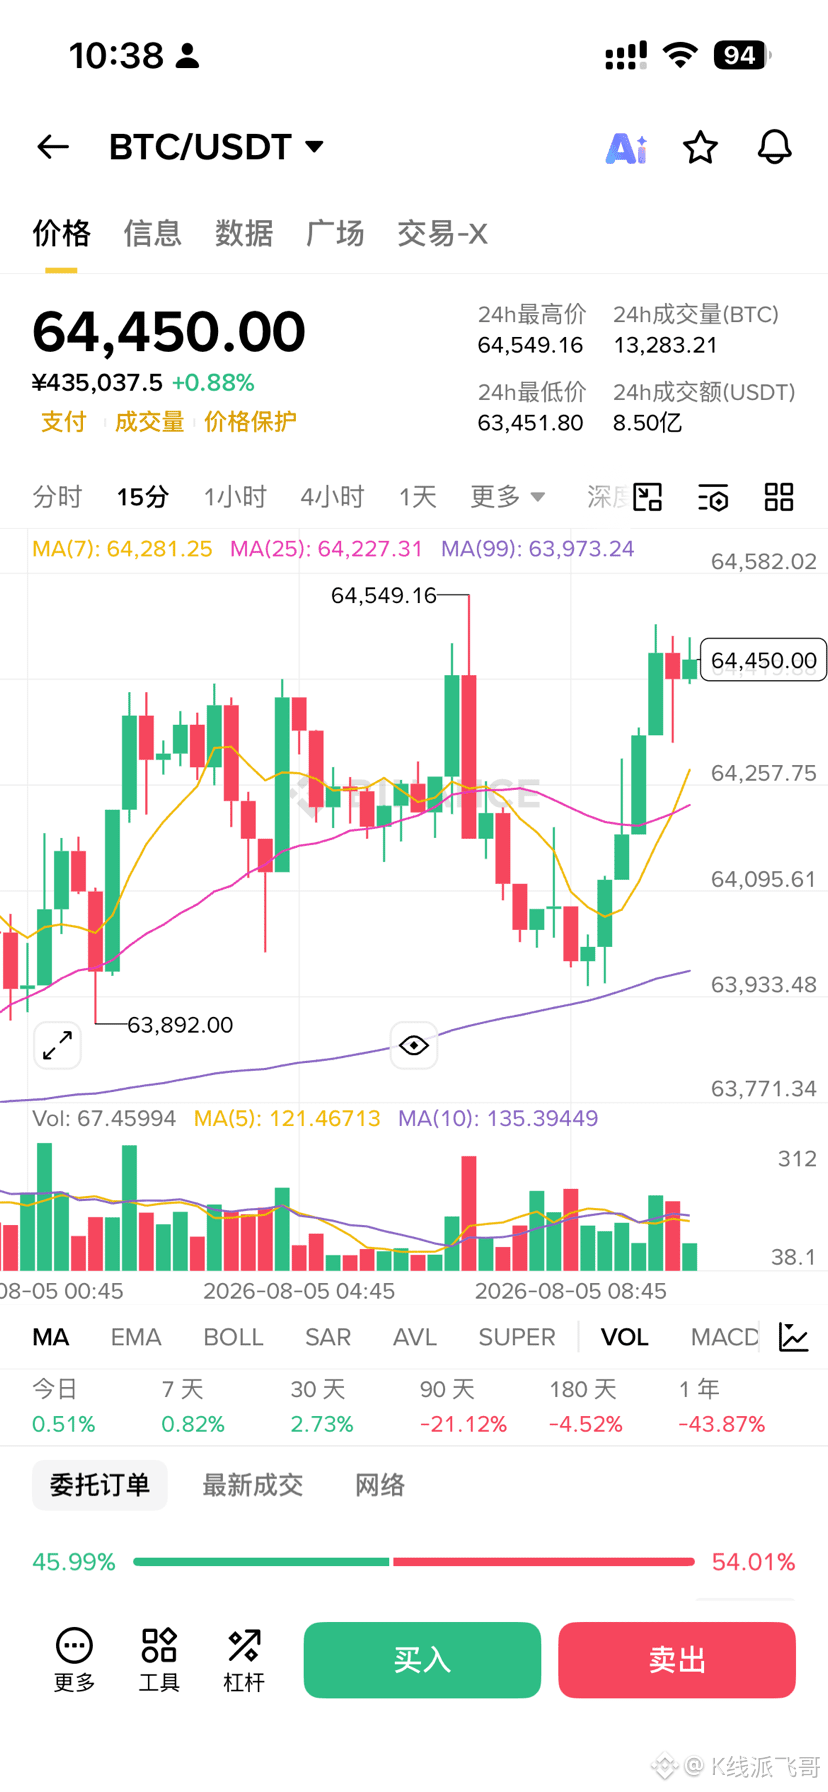
$BTC Short-term trading should still have another push higher. On the smaller timeframe, there are currently no clear signs of a reversal weakening. Combined with relatively strong performance in the U.S. stock market, for the short term we should continue to handle it using a rebound approach.
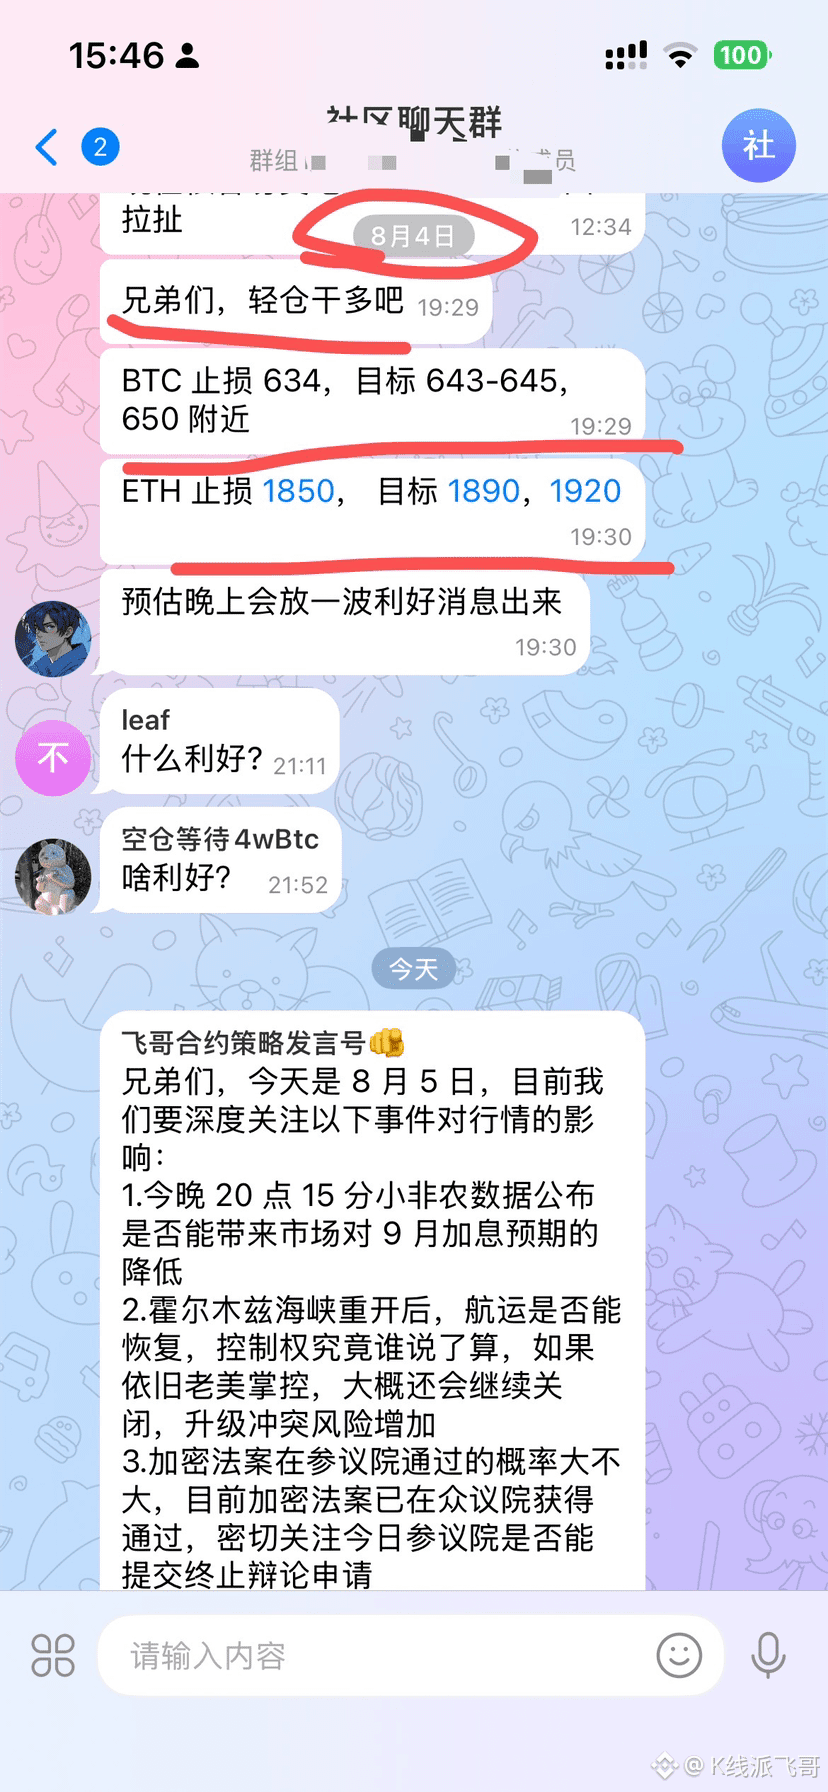
Yesterday, in the community, I asked everyone to go long around 63,600, with a target of 64,500. Today we successfully reached that target and took profit. At this stage, the direction and levels are working as expected, but for now I’m still defining it as a rebound rather than a reversal.
For the bigger picture, we should keep an eye on two key levels: 66,500 and 67,200. If later price can surge above 67,200 and form a convincing fake breakout, that would be an ideal medium-term short opportunity. However, whether the market has enough momentum to reach there still needs to be assessed step by step.
For now, the overall range is expected to remain choppy between 66,500 and 62,000. Only after a break from this range will we choose a new direction. In the short term, keep observing the rebound strength, and pay special attention to the liquidity around 67,000.
Today I won’t provide specific trade entry points. The market is in a transition phase between long and short, and when there isn’t a clear advantage, it’s actually a better choice to wait patiently and observe.
Yesterday, in the community, I asked everyone to go long around 63,600, with a target of 64,500. Today we successfully reached that target and took profit. At this stage, the direction and levels are working as expected, but for now I’m still defining it as a rebound rather than a reversal.
For the bigger picture, we should keep an eye on two key levels: 66,500 and 67,200. If later price can surge above 67,200 and form a convincing fake breakout, that would be an ideal medium-term short opportunity. However, whether the market has enough momentum to reach there still needs to be assessed step by step.
For now, the overall range is expected to remain choppy between 66,500 and 62,000. Only after a break from this range will we choose a new direction. In the short term, keep observing the rebound strength, and pay special attention to the liquidity around 67,000.
Today I won’t provide specific trade entry points. The market is in a transition phase between long and short, and when there isn’t a clear advantage, it’s actually a better choice to wait patiently and observe.
Some thoughts on investing in $BTC through regular contributions
Regarding my view on dollar-cost averaging, many people always think about waiting for a pullback—because I myself am a seasoned patient of “waiting for a pullback.”
In 2018, I felt that the US stocks had risen too much, so I decided to get in when they dropped -15%. As a result, in 2019 the S&P 500 rose by nearly 30%—and I just watched. Finally, in March 2020, the circuit breaker came. Four circuit breakers in ten days. Buffett said it took him 89 years to see a scene like that. I waited—and I waited for something much worse than -15%. Guess what? When it really arrived, everything on the screen was full of “this time is different” and “the US is over.” My hands were shaking, and in the end I could only buy half of the planned position. The other half later never got used at that price again.
After that, I came to understand one thing: people who wait for pullbacks are not really waiting for the price. They are waiting for a feeling of “comfort.” When has the market ever given you a comfortable good price? Was the price in March 2020 good? It came with lockdowns, unemployment, and doomsday talk everywhere. When a good price appears, it always comes with a sky full of bad news—and with your body’s instinctive unwillingness to buy. Whether you dare to buy once the price arrives is the core issue, and most people have never rehearsed that question.
Another point: that episode made me realize that position sizing matters more than judgment. My judgment in 2018 was actually correct—US stocks did crash later. But what does it matter if you were right and your position size didn’t follow? Being right without enough position is still pointless.
So instead of asking, “Will BTC go below 50,000?” change the rule from a price to an action. Don’t set $BTC to “go all-in and wipe at 45,000.” Set it to “when it drops 10%, add one more tranche.” After that, lie flat. If it breaks through some level, recognize the error and exit.
Now write it down clearly: what you will buy, how much you will buy, and which money you will use. After you buy, how long will you hold. Do you keep a portion of your position permanently inside the market, so you hold even when it rises?
Answer these questions right now, and write them down—specifically. Be specific: which coin, how many tranches, what price triggers the buy, and where you will admit you’re wrong after it drops and exit. Once written, place it somewhere you can access and flip to anytime. Because when that day truly comes, with bad news everywhere, your brain can’t be relied on.
I’ve tried it.
#比特币收复6.4万美元关口
Regarding my view on dollar-cost averaging, many people always think about waiting for a pullback—because I myself am a seasoned patient of “waiting for a pullback.”
In 2018, I felt that the US stocks had risen too much, so I decided to get in when they dropped -15%. As a result, in 2019 the S&P 500 rose by nearly 30%—and I just watched. Finally, in March 2020, the circuit breaker came. Four circuit breakers in ten days. Buffett said it took him 89 years to see a scene like that. I waited—and I waited for something much worse than -15%. Guess what? When it really arrived, everything on the screen was full of “this time is different” and “the US is over.” My hands were shaking, and in the end I could only buy half of the planned position. The other half later never got used at that price again.
After that, I came to understand one thing: people who wait for pullbacks are not really waiting for the price. They are waiting for a feeling of “comfort.” When has the market ever given you a comfortable good price? Was the price in March 2020 good? It came with lockdowns, unemployment, and doomsday talk everywhere. When a good price appears, it always comes with a sky full of bad news—and with your body’s instinctive unwillingness to buy. Whether you dare to buy once the price arrives is the core issue, and most people have never rehearsed that question.
Another point: that episode made me realize that position sizing matters more than judgment. My judgment in 2018 was actually correct—US stocks did crash later. But what does it matter if you were right and your position size didn’t follow? Being right without enough position is still pointless.
So instead of asking, “Will BTC go below 50,000?” change the rule from a price to an action. Don’t set $BTC to “go all-in and wipe at 45,000.” Set it to “when it drops 10%, add one more tranche.” After that, lie flat. If it breaks through some level, recognize the error and exit.
Now write it down clearly: what you will buy, how much you will buy, and which money you will use. After you buy, how long will you hold. Do you keep a portion of your position permanently inside the market, so you hold even when it rises?
Answer these questions right now, and write them down—specifically. Be specific: which coin, how many tranches, what price triggers the buy, and where you will admit you’re wrong after it drops and exit. Once written, place it somewhere you can access and flip to anytime. Because when that day truly comes, with bad news everywhere, your brain can’t be relied on.
I’ve tried it.
#比特币收复6.4万美元关口
The Bitcoin four-year cycle investment logic is actually very simple
Set aside some money you don’t need, buy BTC 500 days before each halving, then sell it 500 days after the halving.
Repeat this, and your assets can grow about 5x every four years.
Don’t look down on this 5x—compared with real-life physical industries, it’s already pretty great.
$BTC
Set aside some money you don’t need, buy BTC 500 days before each halving, then sell it 500 days after the halving.
Repeat this, and your assets can grow about 5x every four years.
Don’t look down on this 5x—compared with real-life physical industries, it’s already pretty great.
$BTC
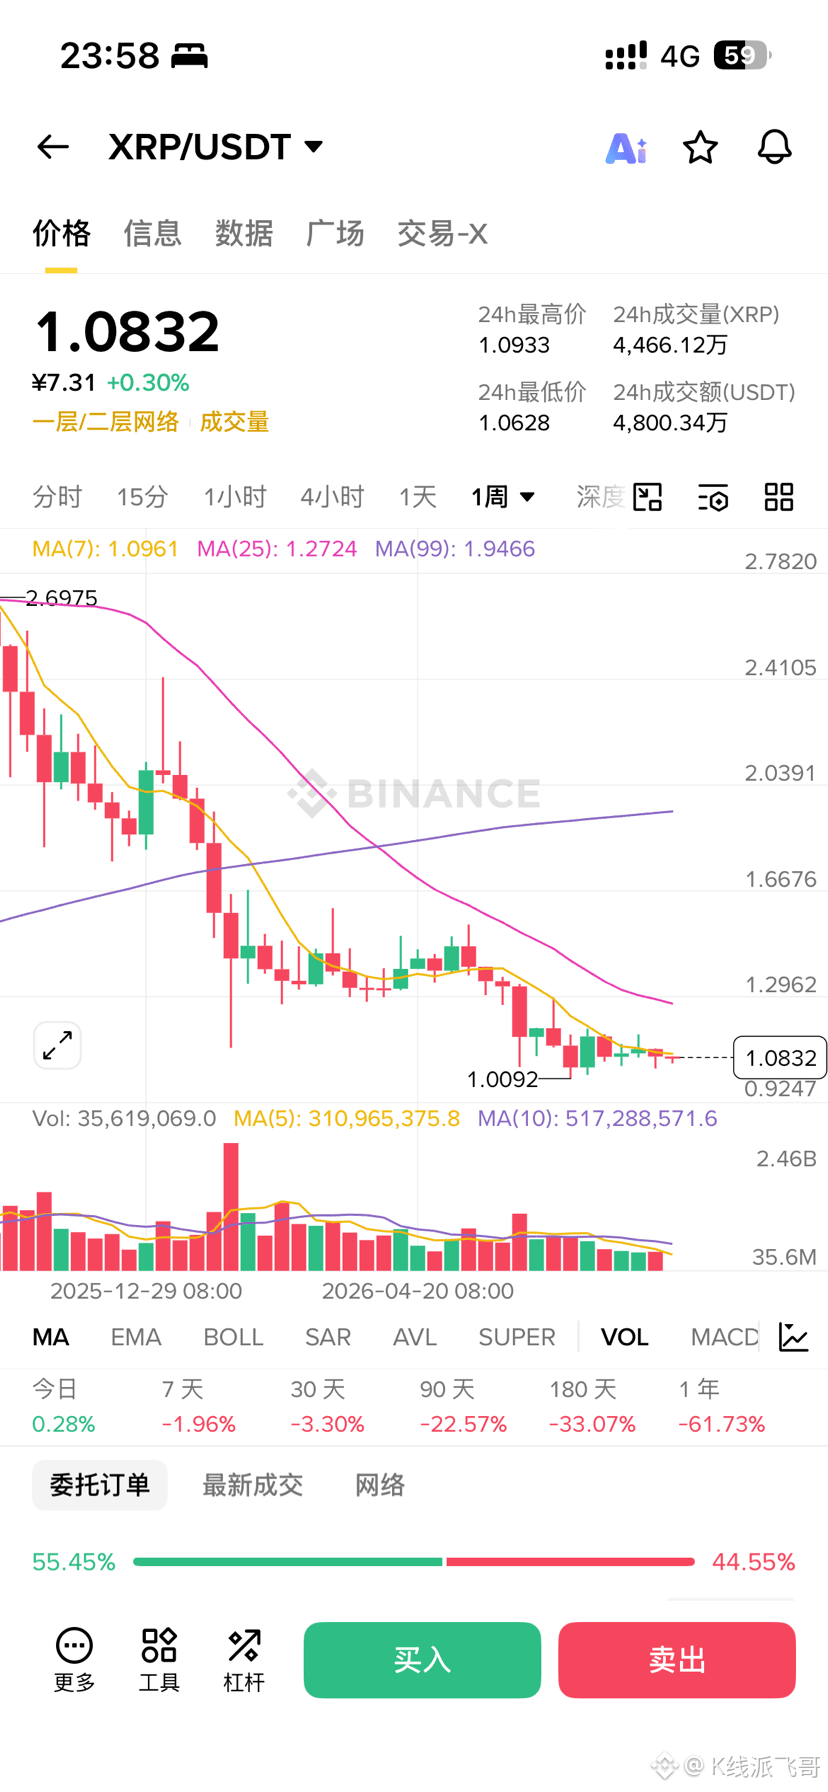
$XRP Ripple coin is today at 1.08, and this coin has also entered the bottom consolidation zone. Its previous bottom range was 0.3–0.4; this round it has been hovering around 1.0–1.1.
The bottom-buy zone I’m aiming for is the 0.8–0.9 range—just don’t know whether we’ll get the chance. If you have plenty of funds and are optimistic about it, you can start building a position.
XRP is a leader in the payments sector. In the future, the crypto market will become more and more like a professional mainstream force, and XRP—just like CRCL—are both infrastructure assets, which tend to be favored by large institutions.
The bottom-buy zone I’m aiming for is the 0.8–0.9 range—just don’t know whether we’ll get the chance. If you have plenty of funds and are optimistic about it, you can start building a position.
XRP is a leader in the payments sector. In the future, the crypto market will become more and more like a professional mainstream force, and XRP—just like CRCL—are both infrastructure assets, which tend to be favored by large institutions.
The 2026 bear market 🐻. As someone in the crypto space, steer clear of the current hottest “high-narrative meme chain” or “ultra-high TPS chain.” Focus your efforts on researching “real-world asset on-chain + autonomous machine trading” (RWA and AI Agent economics). Pay more attention to sectors that depend on enterprise partnerships and the regulatory environment—areas that can deliver long-term benefits to the real world. Don’t chase on-chain speculation hype.
You can’t take the casino’s profits with you, but you can take the profits from high-quality companies (stocks). It’s not easy to make money in a day or a week, but it becomes much easier over a year or even 10 years.
Looking forward to seeing you stand out in the next bull market in crypto.
You can’t take the casino’s profits with you, but you can take the profits from high-quality companies (stocks). It’s not easy to make money in a day or a week, but it becomes much easier over a year or even 10 years.
Looking forward to seeing you stand out in the next bull market in crypto.
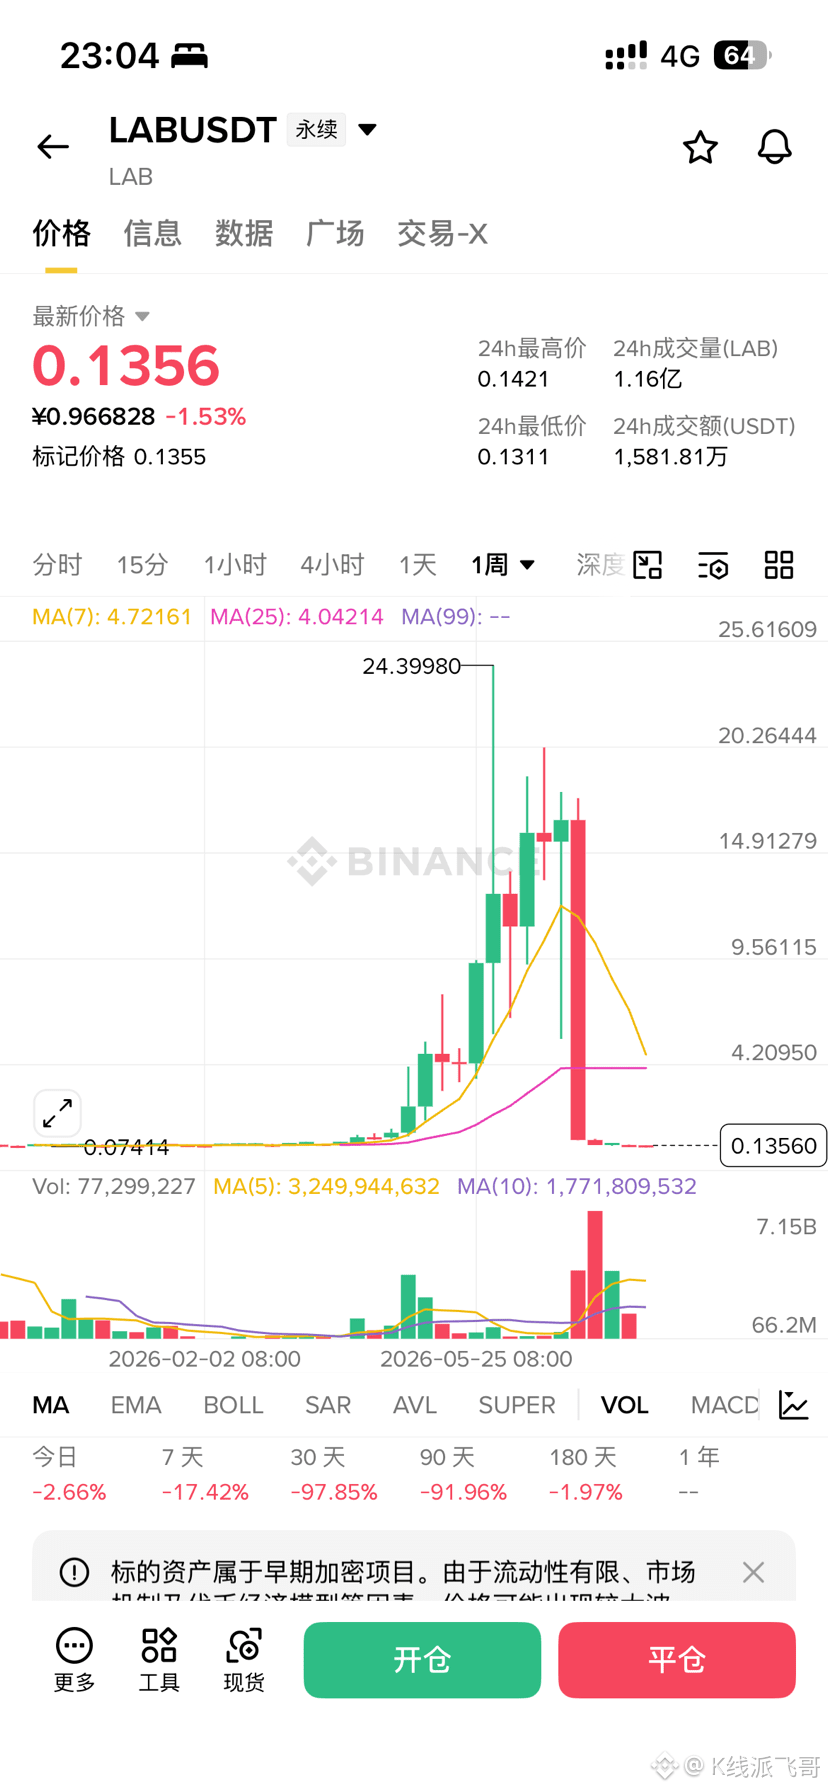
Like a fake stock “resembling $LAB ,” once the hype has died down and it turns into mess everywhere—why does it still attract a group of retail investors who are so fixated, believing it can once again return to 10? 20? Or even break past 30 to a new high? Don’t dream. The main fund has only just managed to trap a large number of longs and shorts at a high level, and you still expect the main fund to personally bail you out. There’s also a one-character prefix before the main fund’s nickname: 🐶 Main Fund. Don’t you still not get it?
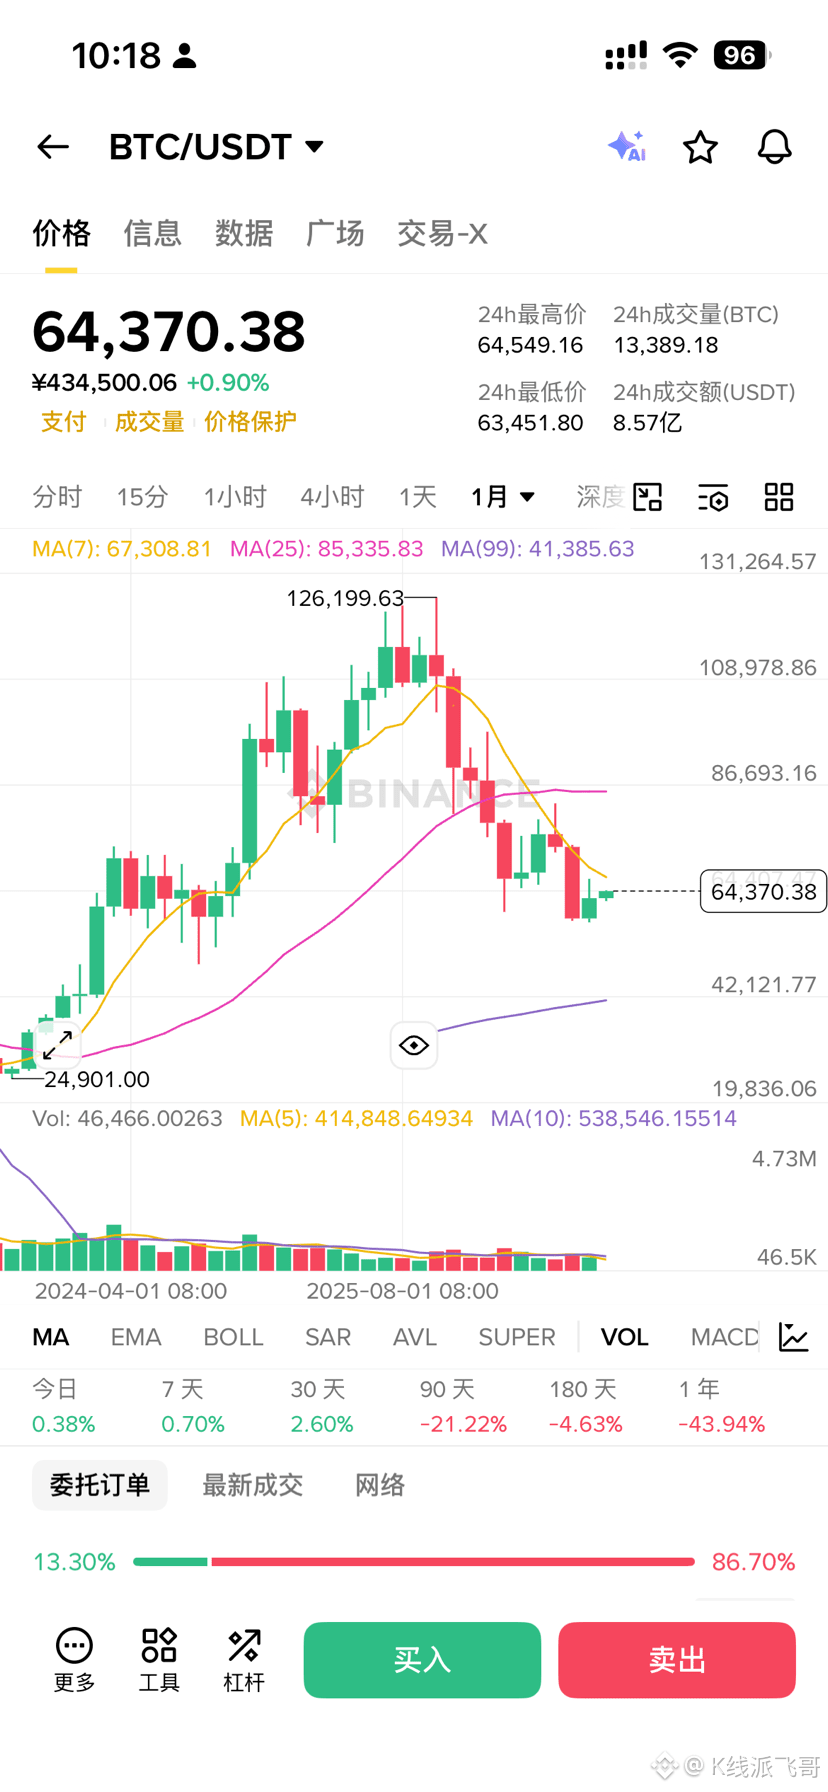
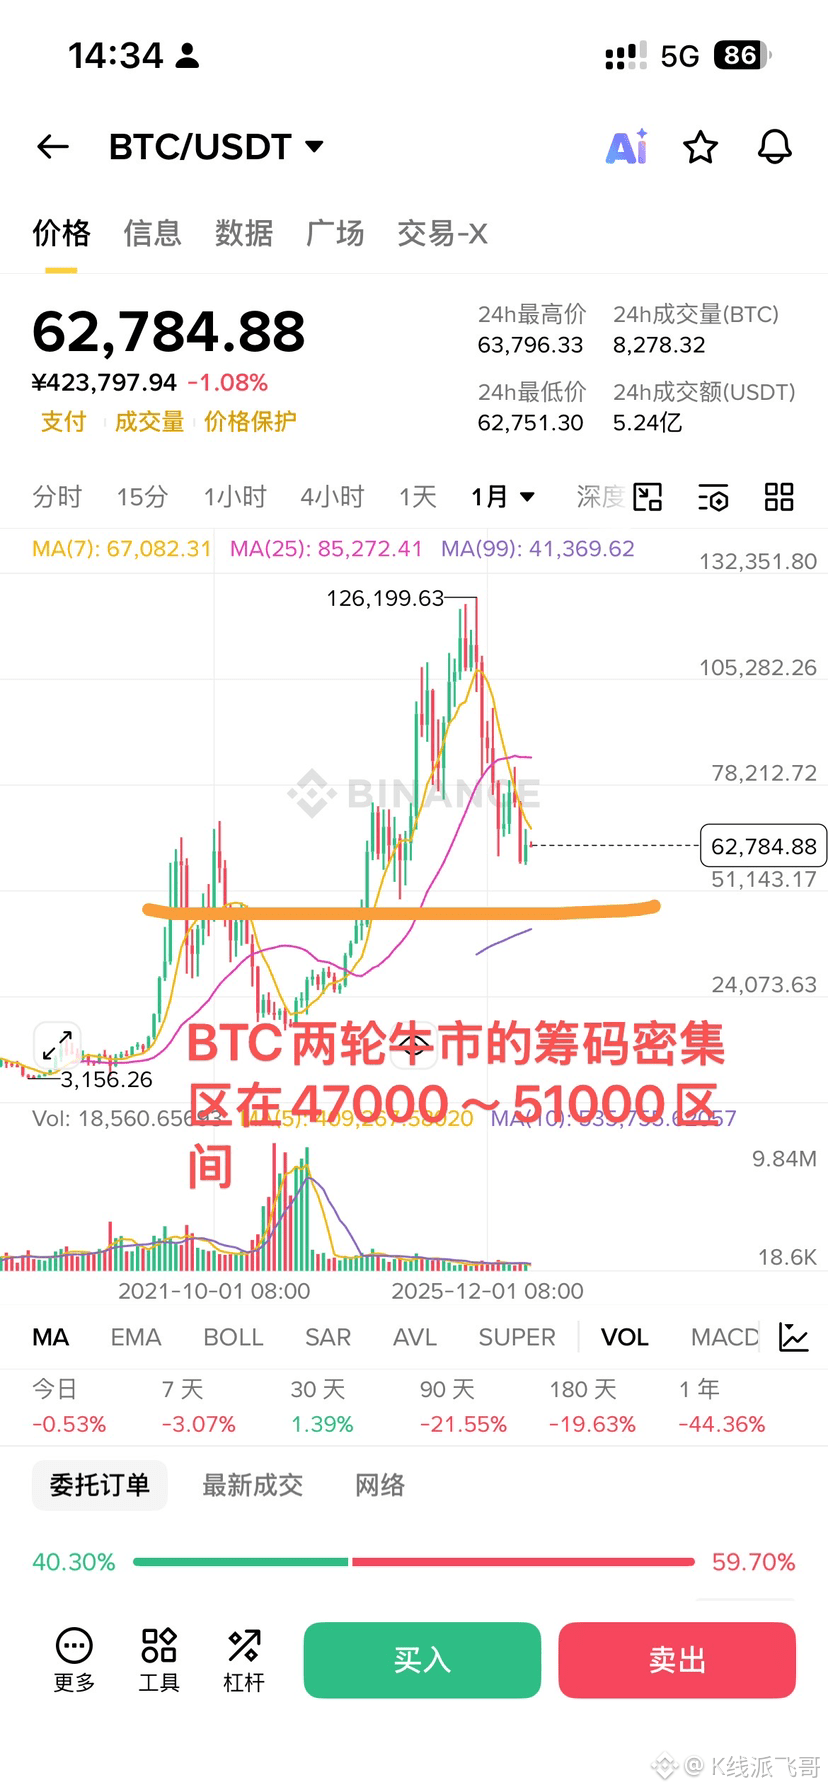
After a sequence of $BTC months of continuous decline, this is the first time the price touched the lower Bollinger Band and rebounded. I’m still defining this as a “rebound” rather than a “reversal,” because I haven’t seen signals of large-scale institutional accumulation at the bottom yet. The rebound strength is limited, and the liquidity at the bottom may be tested again.
In a bear market, bottoming usually happens in two ways: (1) long-term sideways consolidation that slowly wears down the market and absorbs orders, for example the 2018 BTC bear market, which traded around the 3000 level for about half a year. (2) a sudden liquidation-style crash that clears liquidity at the weekly level, forming a panic bottom. Look at BTC’s走势 after May 19, 2021—after that, given the current situation, a single test of the monthly lower band isn’t enough to confirm a reversal. Personally, I’m more focused on the 51,000–47,000 zone. This area is also the zone where BTC’s concentrated turnover of holdings occurred during these two bull-market cycles.
For short-term trading, watch support around 62,000. If it breaks down, it could test 60,000. For rebound targets, watch the 64,000 area for potential short setups; place a stop loss above 64,800 and target the 61,000 region. A true bottom requires seeing panic sell-off dissipate and the price stop making new lows. At least for now, I haven’t seen that signal.
In a bear market, bottoming usually happens in two ways: (1) long-term sideways consolidation that slowly wears down the market and absorbs orders, for example the 2018 BTC bear market, which traded around the 3000 level for about half a year. (2) a sudden liquidation-style crash that clears liquidity at the weekly level, forming a panic bottom. Look at BTC’s走势 after May 19, 2021—after that, given the current situation, a single test of the monthly lower band isn’t enough to confirm a reversal. Personally, I’m more focused on the 51,000–47,000 zone. This area is also the zone where BTC’s concentrated turnover of holdings occurred during these two bull-market cycles.
For short-term trading, watch support around 62,000. If it breaks down, it could test 60,000. For rebound targets, watch the 64,000 area for potential short setups; place a stop loss above 64,800 and target the 61,000 region. A true bottom requires seeing panic sell-off dissipate and the price stop making new lows. At least for now, I haven’t seen that signal.
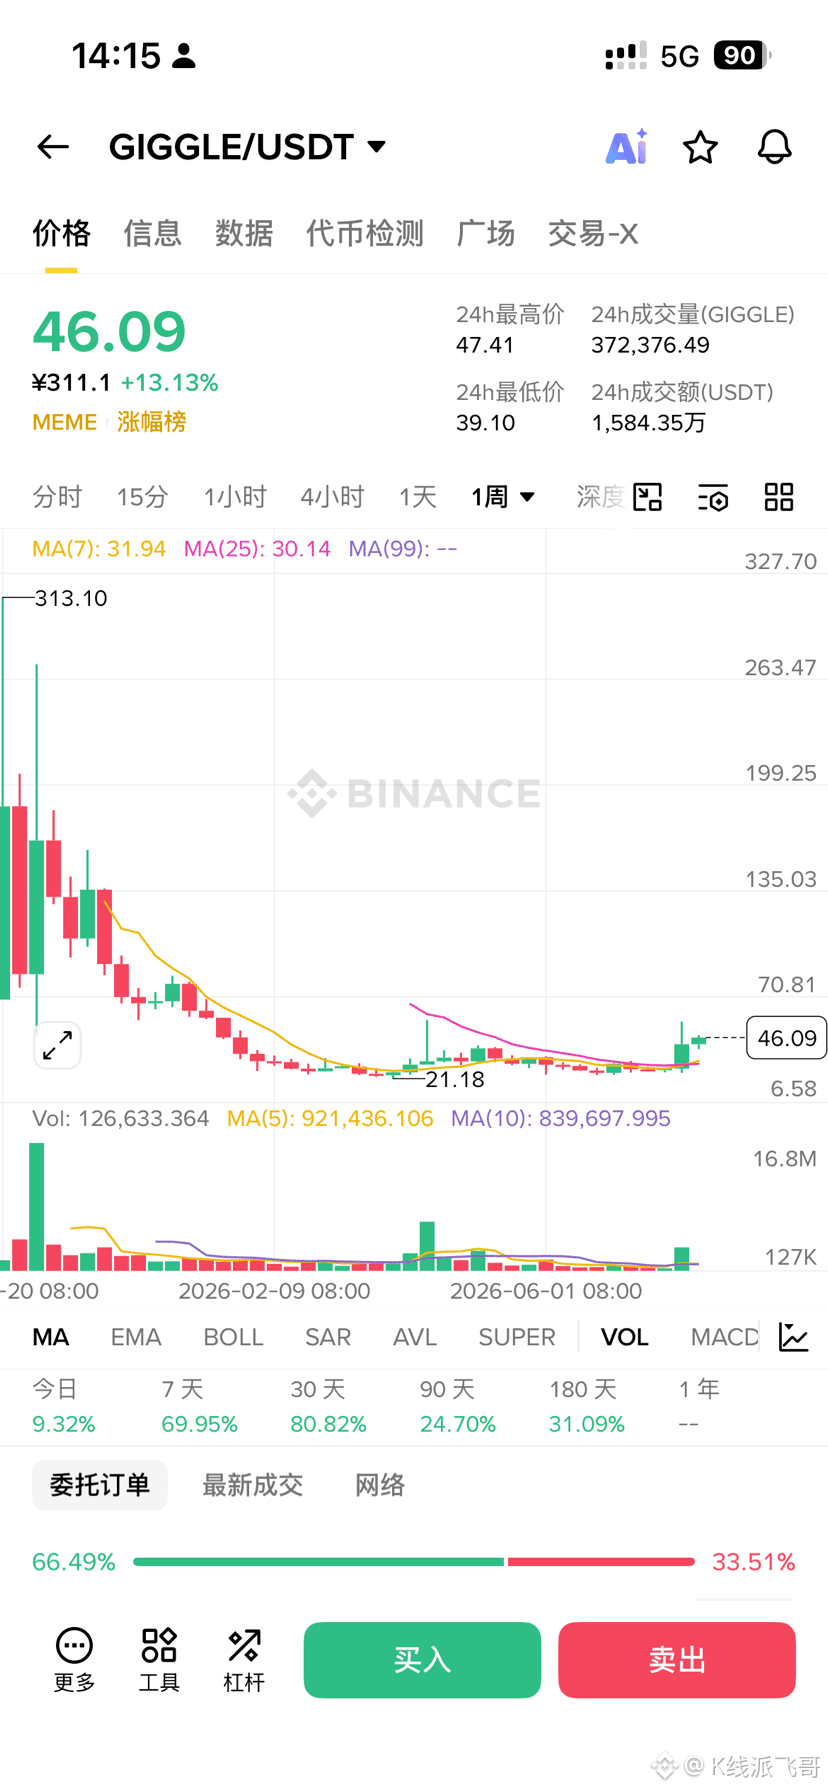
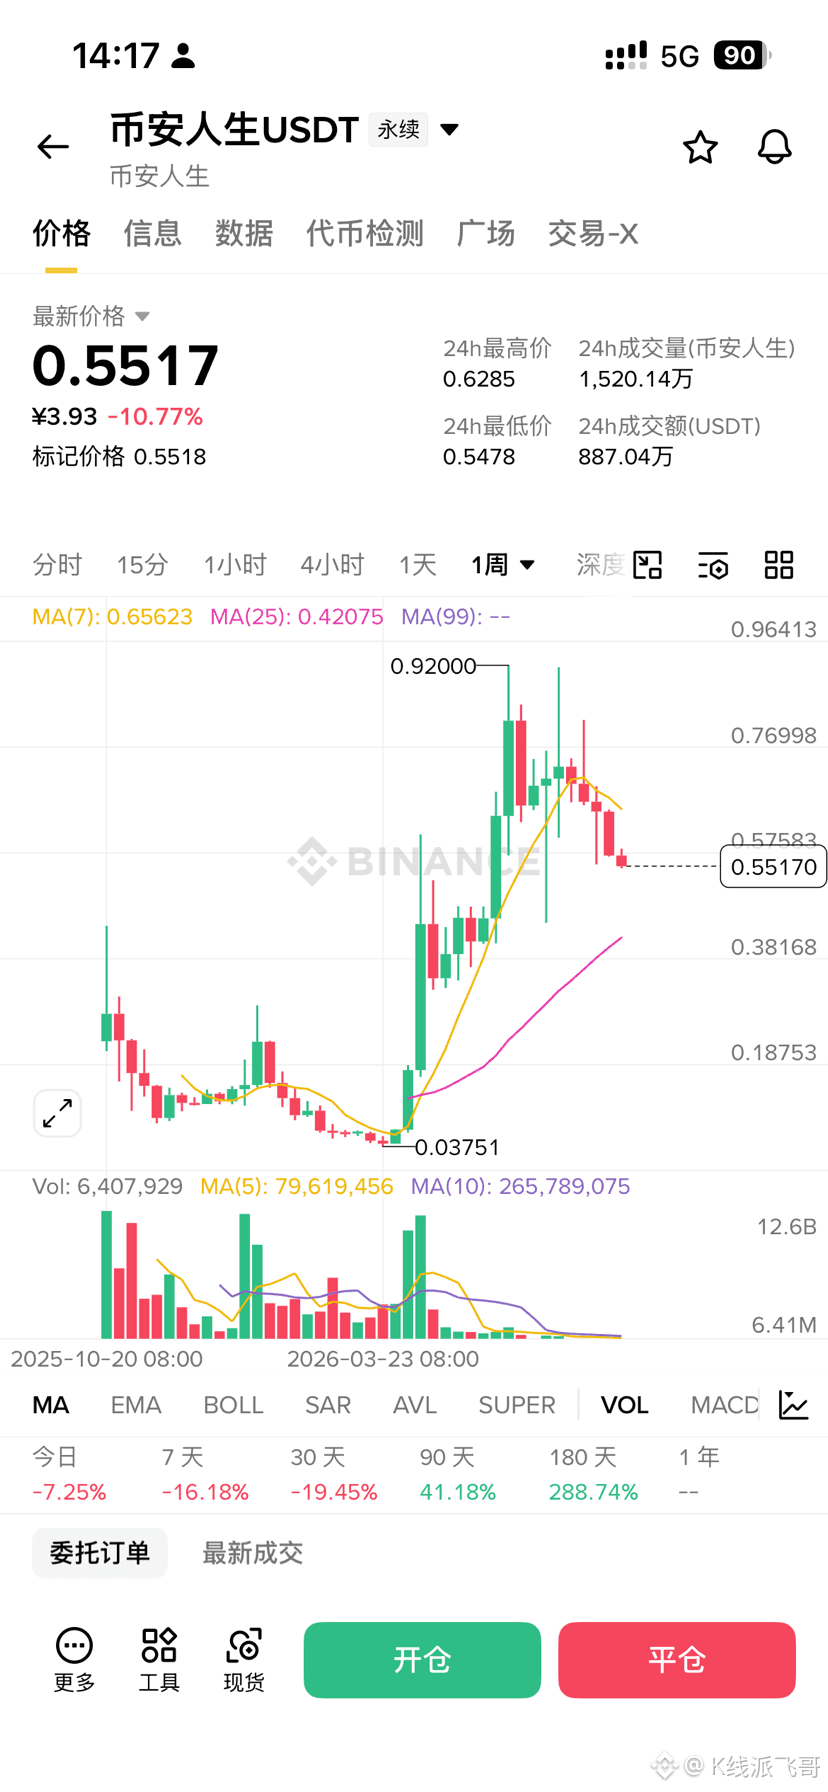
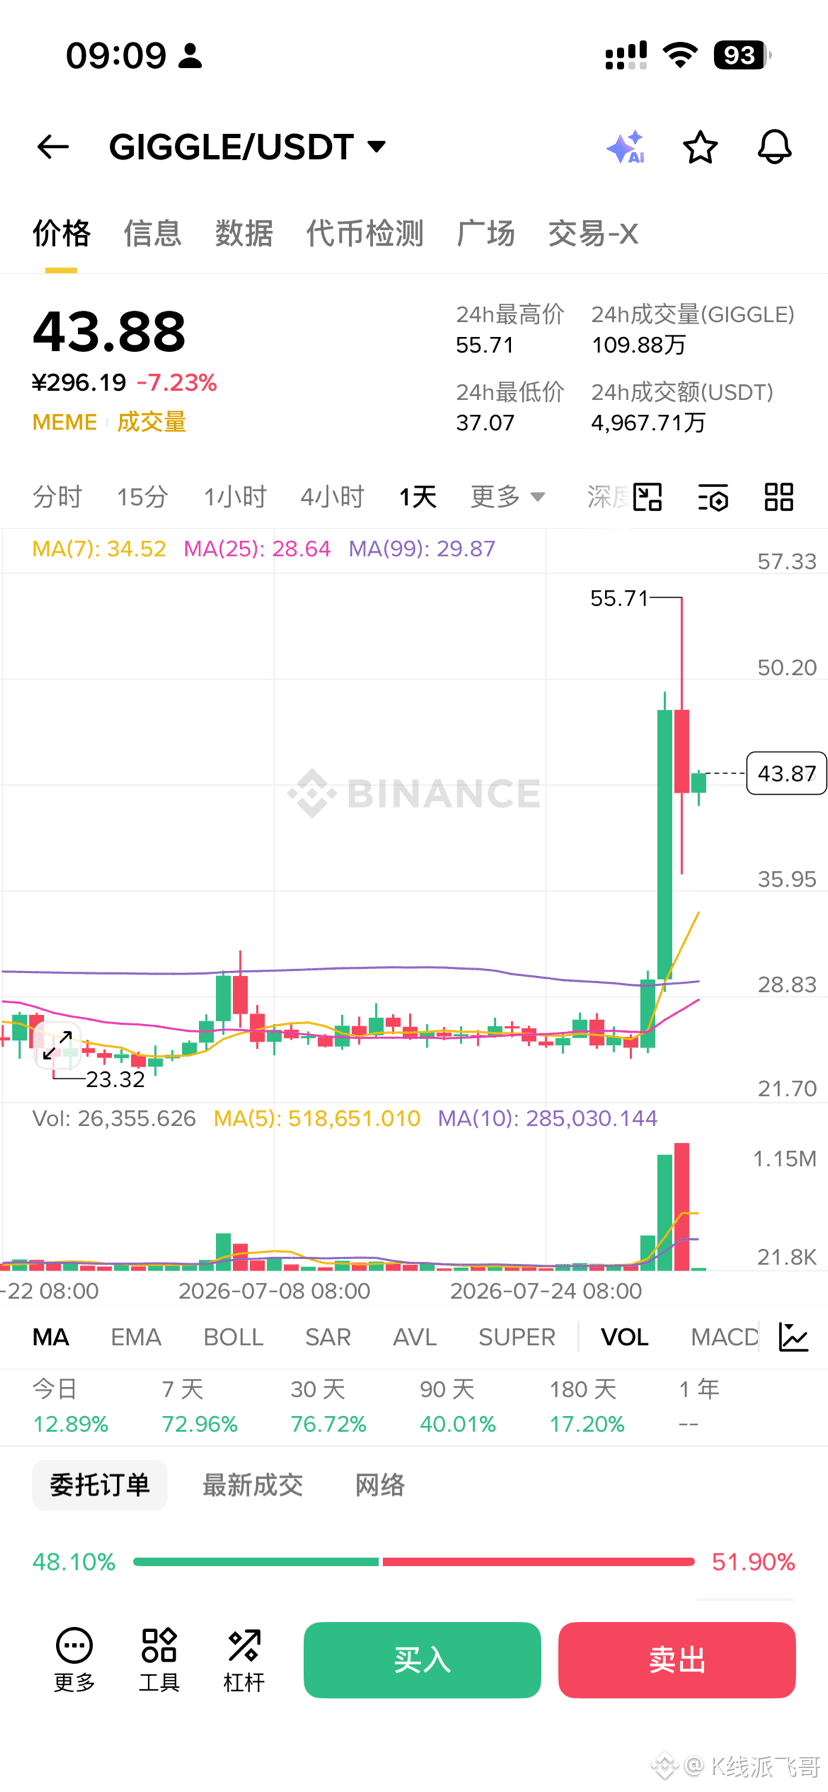
$GIGGLE is the second $币安人生 . For Binance Life’s historical mission, it has already been completed. If BSC wants to create some hype, the only option is to pump GIGGLE. During the previous livestream, we already said that the two MEME coins with the highest BSC heat are: one is Binance Life—the first Chinese coin to be listed on Binance’s spot market—and the other is GIGGLE. GIGGLE is tied to the charity concept, which has always been aligned with CZ’s longstanding charitable direction.
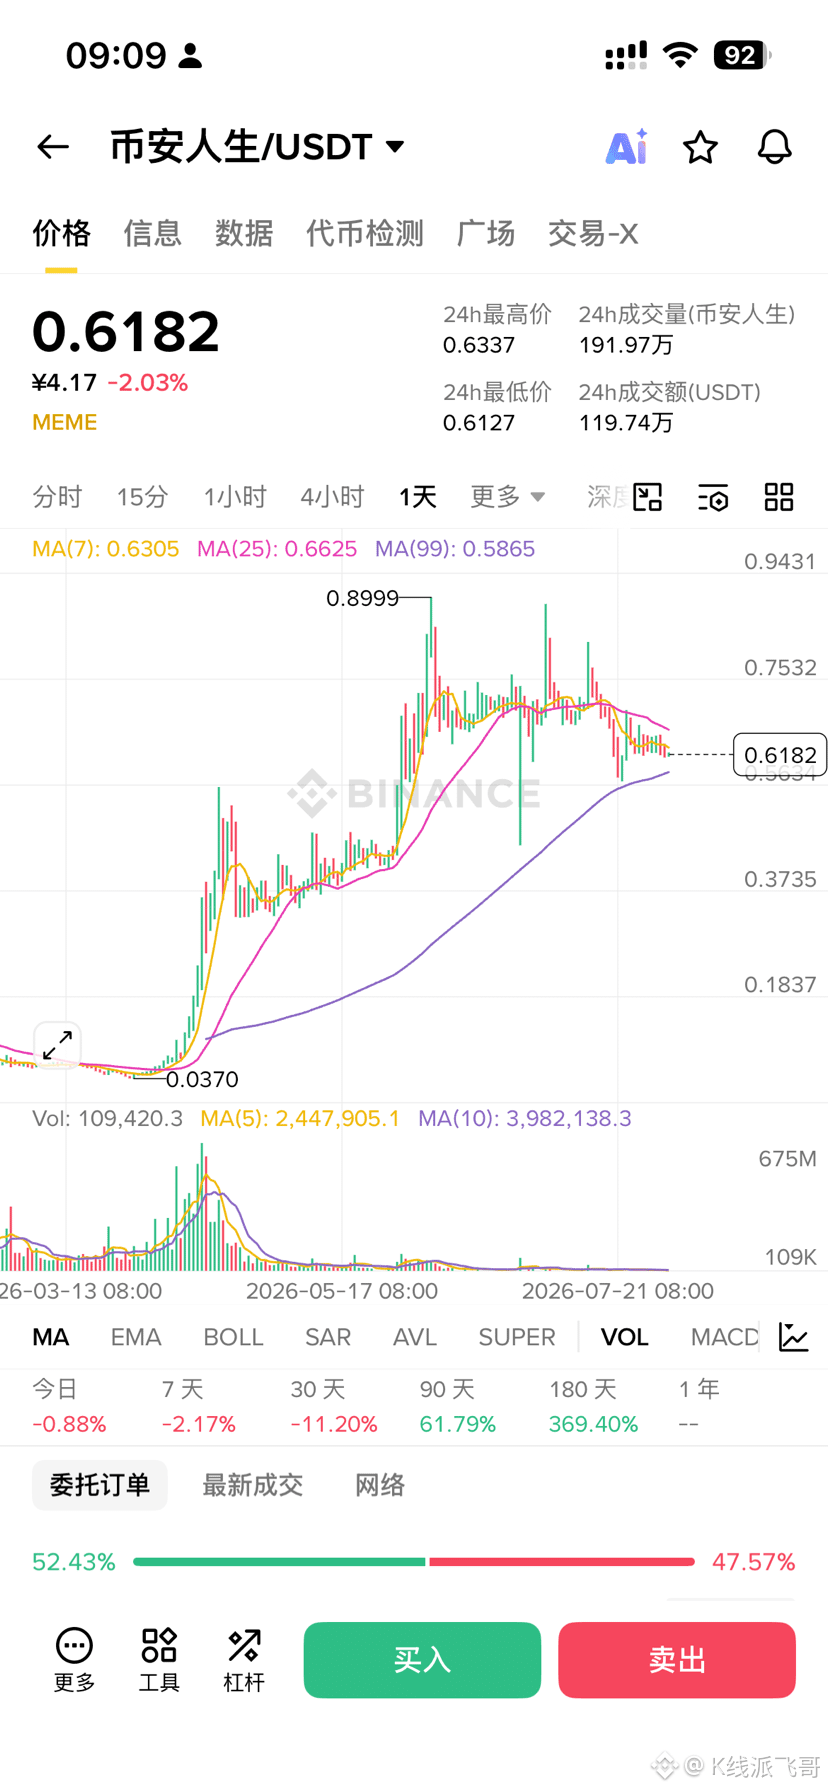
Before that, Binance Life had been falling across the weekly timeframe, then later it pumped by more than ten times. GIGGLE’s consolidation and shakeout lasted longer—both in amplitude and in time—than Binance Life did. Binance Life’s peak moment refers to a period when it was close to 1 billion. But currently, GIGGLE’s market cap is only around 43 million. In the short term, the market trend probably hasn’t ended yet. As for the other test coins like TUT and TST—those are the test meme coins from BSC’s first wave; the chances of a big pump are low. The focus should still be on GIGGLE.
Before that, Binance Life had been falling across the weekly timeframe, then later it pumped by more than ten times. GIGGLE’s consolidation and shakeout lasted longer—both in amplitude and in time—than Binance Life did. Binance Life’s peak moment refers to a period when it was close to 1 billion. But currently, GIGGLE’s market cap is only around 43 million. In the short term, the market trend probably hasn’t ended yet. As for the other test coins like TUT and TST—those are the test meme coins from BSC’s first wave; the chances of a big pump are low. The focus should still be on GIGGLE.
K线派飞哥
·
--
The price movement reference for $GIGGLE : just follow the movement of the pump before $币安人生 . Anyway, it’s the same trader. After the bottom doubles, they start consolidating for a while and then begin the second wave of pumping. That directly becomes a tenfold coin. I don’t know whether GIGGLE can pump tenfold, but in the short term, the market trend definitely isn’t over yet.
To prevent missing out on gold, I bought a little.
Although I believe gold will reach $3,500, to avoid completely missing out, I still need to buy some.
I can’t really wait until the absolute limit to buy.
Is my $3,500 scenario entirely correct? What if gold doesn’t follow my plan?
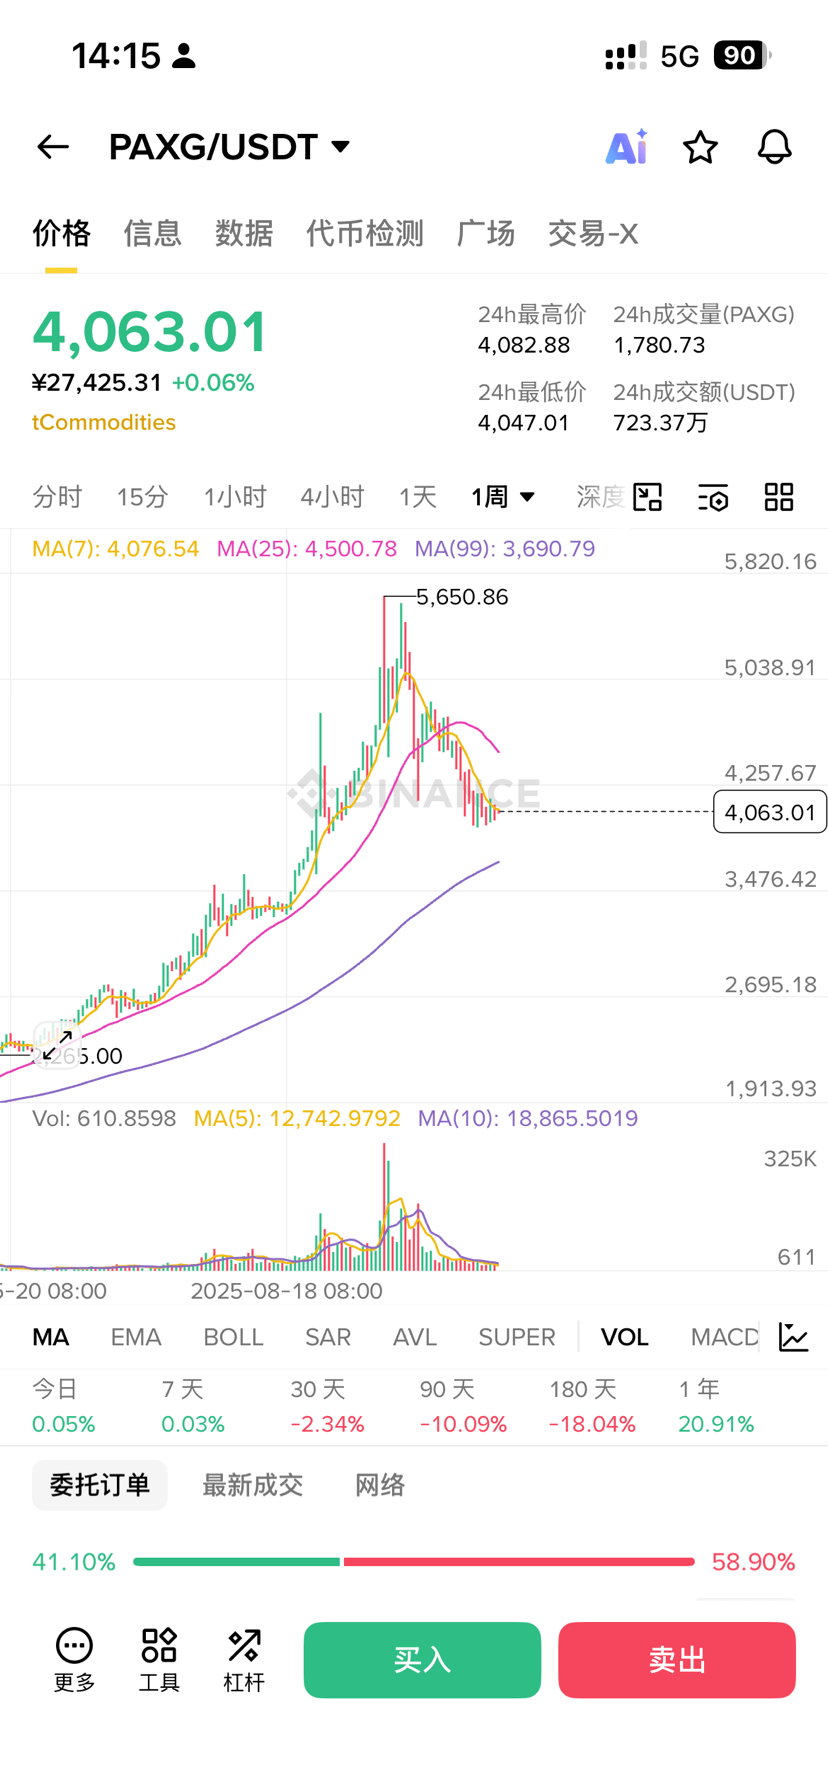
Also, the pullback has already been 30%, and the pullback time has lasted 6 months. It has been consolidating for more than a month around the $4,000 level. In terms of candlestick patterns, you could say gold is forming a bottom, though only barely.
It has been more than a month since the new Fed chair took office. There have already been many rounds of hawkish remarks, and the current gold price should already be pricing in expectations of rate hikes.
Even if there is a rate hike, there’s still only about $500 to $600 of downside room. This loss—I can still accept it.
As for whether to buy a little or not, I’ve been thinking about it from yesterday to today. I bought last night and then closed the position, and tonight I’ve decided to buy a bit again.
I’ve kept telling myself over and over: the best catcher in Wall Street can only be right 50% of the time.
I need to free myself from needing to be absolutely right. Being relatively right is also acceptable.
$XAU $XAUT $PAXG
Although I believe gold will reach $3,500, to avoid completely missing out, I still need to buy some.
I can’t really wait until the absolute limit to buy.
Is my $3,500 scenario entirely correct? What if gold doesn’t follow my plan?
Also, the pullback has already been 30%, and the pullback time has lasted 6 months. It has been consolidating for more than a month around the $4,000 level. In terms of candlestick patterns, you could say gold is forming a bottom, though only barely.
It has been more than a month since the new Fed chair took office. There have already been many rounds of hawkish remarks, and the current gold price should already be pricing in expectations of rate hikes.
Even if there is a rate hike, there’s still only about $500 to $600 of downside room. This loss—I can still accept it.
As for whether to buy a little or not, I’ve been thinking about it from yesterday to today. I bought last night and then closed the position, and tonight I’ve decided to buy a bit again.
I’ve kept telling myself over and over: the best catcher in Wall Street can only be right 50% of the time.
I need to free myself from needing to be absolutely right. Being relatively right is also acceptable.
$XAU $XAUT $PAXG
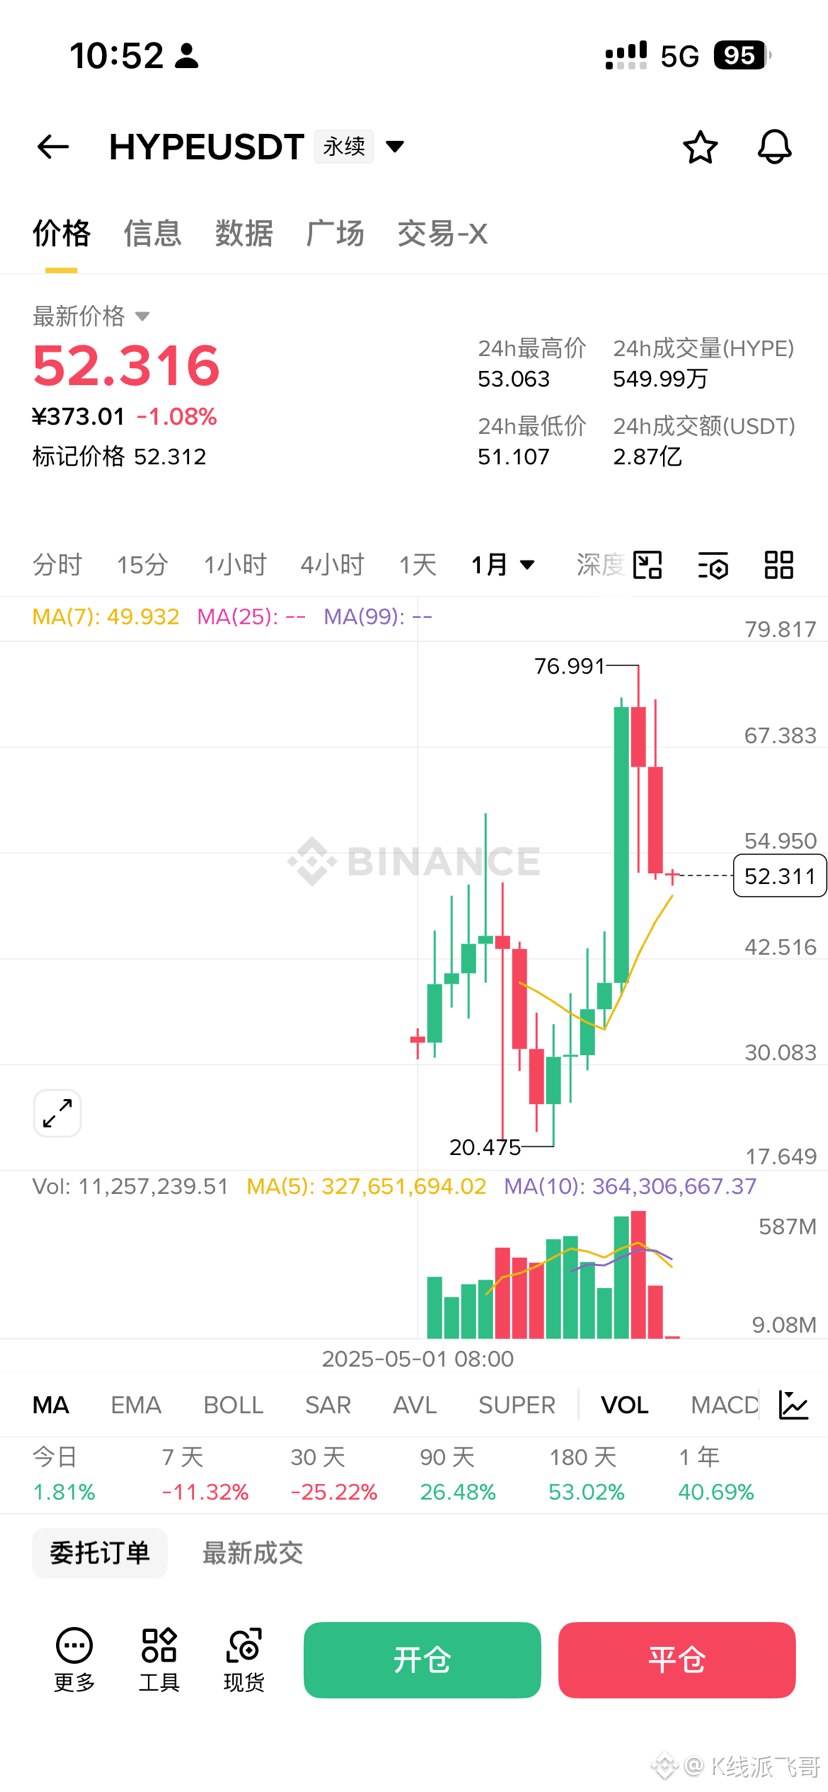
I cleared at around $70 before $HYPE . After the pump, the sideways/downtrend should be the team unlocking their shares and the earlier profit-takers cashing out. The latest price is $52. There was a consolidation range around $42 previously; if it drops near $42, I’ll consider buying the dip.
The price movement reference for $GIGGLE : just follow the movement of the pump before $币安人生 . Anyway, it’s the same trader. After the bottom doubles, they start consolidating for a while and then begin the second wave of pumping. That directly becomes a tenfold coin. I don’t know whether GIGGLE can pump tenfold, but in the short term, the market trend definitely isn’t over yet.
CZ: Support all Meme coins. In the coming weeks, we may buy or sell one or two Meme coins for testing.
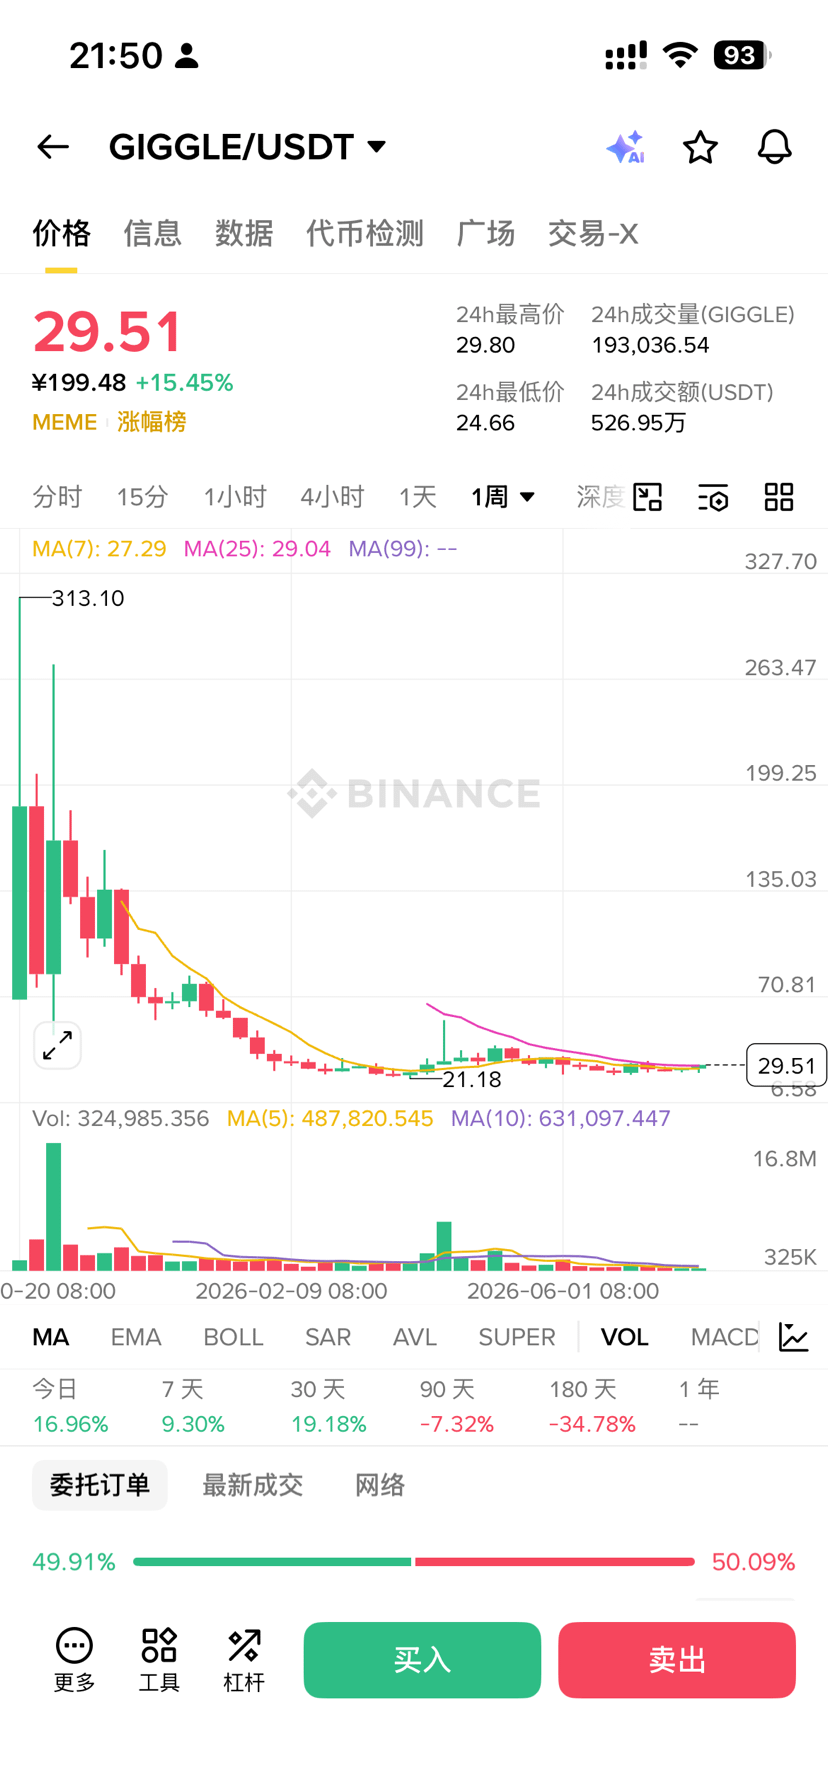
Earlier, the Binance Life coin I was watching on the plaza has risen tenfold—unfortunately I didn’t hold onto it. Next, I’ll continue to be bullish on GIGGLE. Its current market cap is still below 30 million, so getting a tenfold increase is pretty easy. The bottom should be around 20, as indicated by $GIGGLE . After $币安人生 supposedly topped out in the short term, $GIGGLE somehow didn’t fall back the way it used to—according to our previous chart, GIGGLE would have dumped sharply. I’ll stick with my earlier view: in the future, GIGGLE will replicate Binance Life’s trajectory. Although it’s impossible in the short run, the long run is fine. The charity concept ➕ the burn mechanism—just depends on when the dog-whale operator has collected enough chips.
Earlier, the Binance Life coin I was watching on the plaza has risen tenfold—unfortunately I didn’t hold onto it. Next, I’ll continue to be bullish on GIGGLE. Its current market cap is still below 30 million, so getting a tenfold increase is pretty easy. The bottom should be around 20, as indicated by $GIGGLE . After $币安人生 supposedly topped out in the short term, $GIGGLE somehow didn’t fall back the way it used to—according to our previous chart, GIGGLE would have dumped sharply. I’ll stick with my earlier view: in the future, GIGGLE will replicate Binance Life’s trajectory. Although it’s impossible in the short run, the long run is fine. The charity concept ➕ the burn mechanism—just depends on when the dog-whale operator has collected enough chips.

From a technical perspective, the 200-week MA of $BTC can be simply understood as the intrinsic value of BTC. This value was still 58,000 in February; by late July, it has already reached 63,500—an increase of about 10 percentage points. Does this mean that the risk of missing out on a retracement to 52,000 is increasing? So I suggest that retail investors do systematic investing.
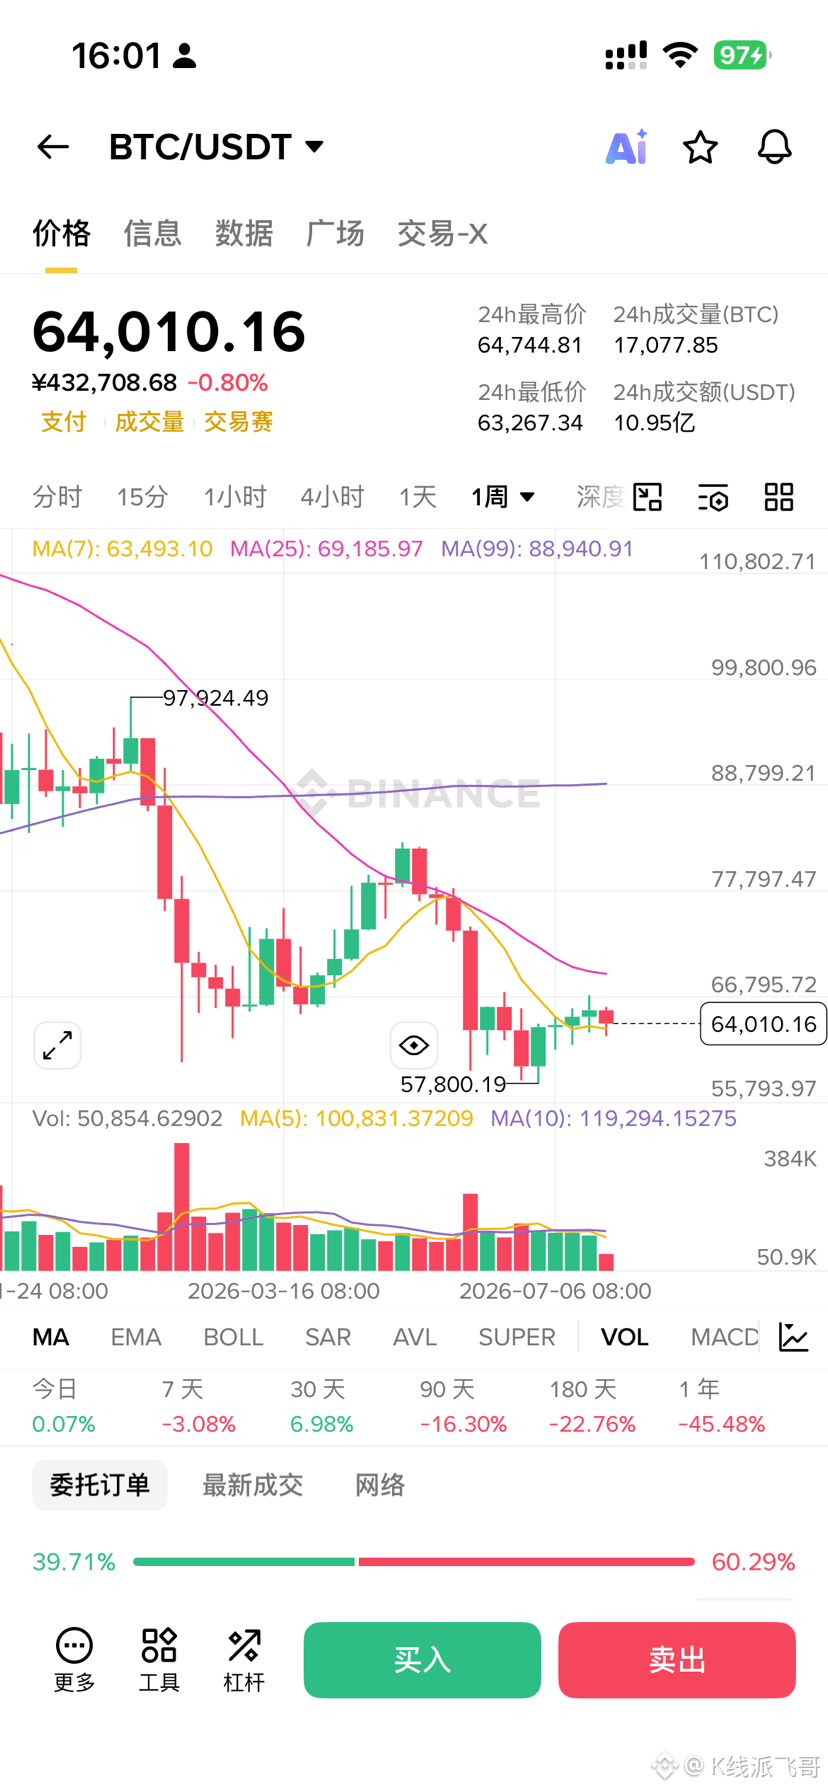
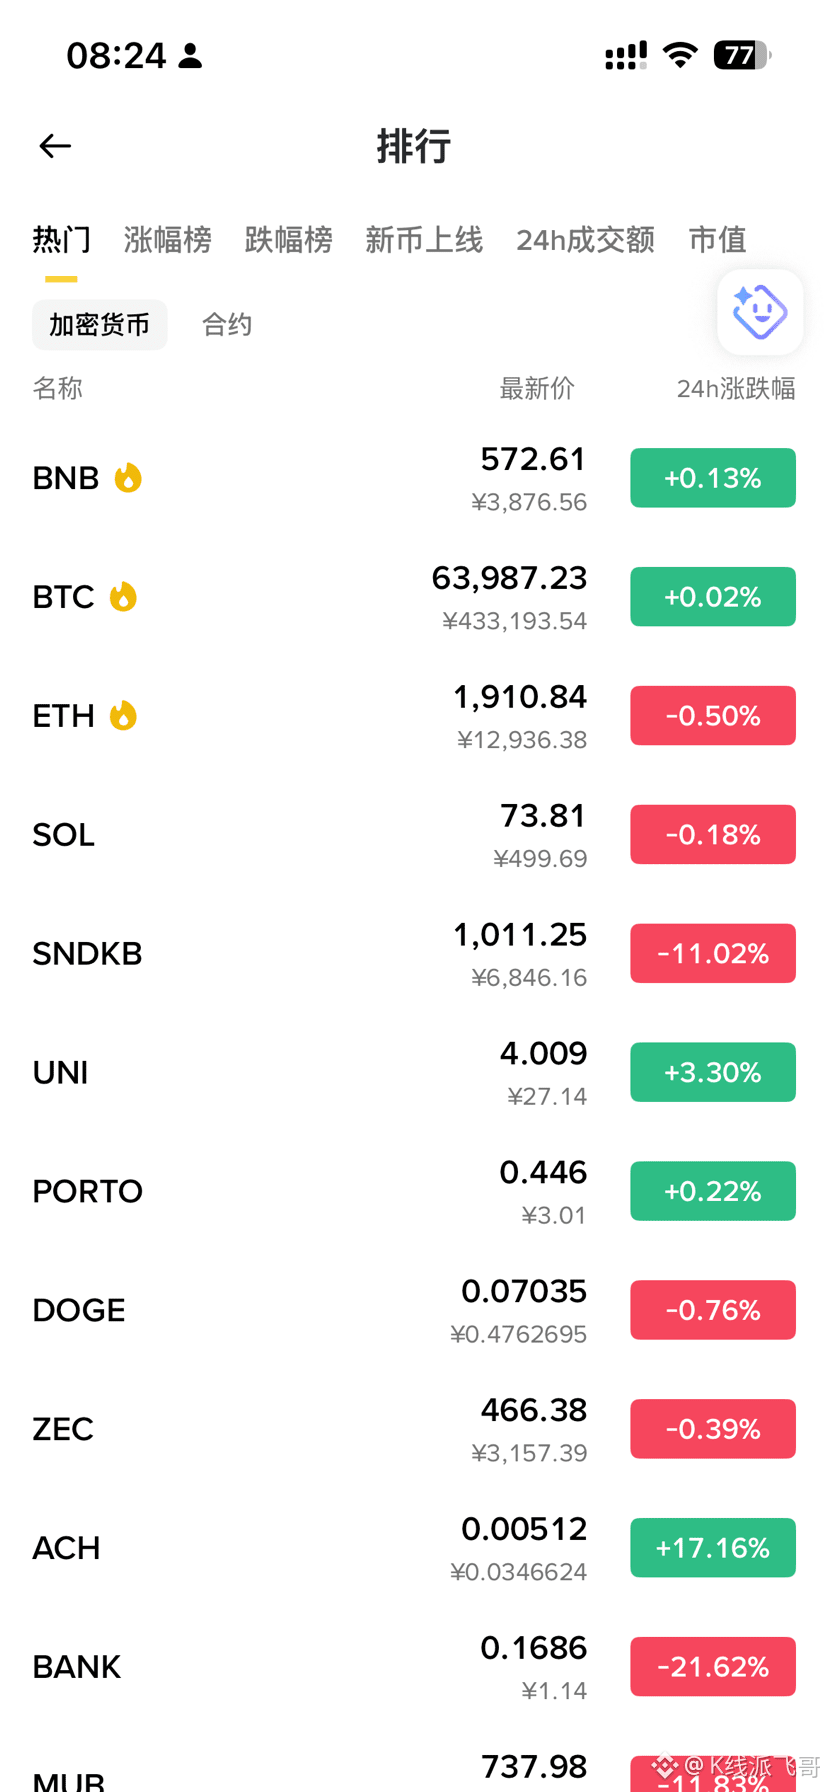
Bitcoin, 268 days down 54%
Silver $XAG , 169 days down 54%
SanDisk $SNDKB , 36 days down 55%
SK Hynix $SKHYNIX , 34 days down 53%
Baijiu, down 50% over 5 years 😅
When you compare them like this, Bitcoin risk doesn’t seem that big either.
Silver $XAG , 169 days down 54%
SanDisk $SNDKB , 36 days down 55%
SK Hynix $SKHYNIX , 34 days down 53%
Baijiu, down 50% over 5 years 😅
When you compare them like this, Bitcoin risk doesn’t seem that big either.
Partly True
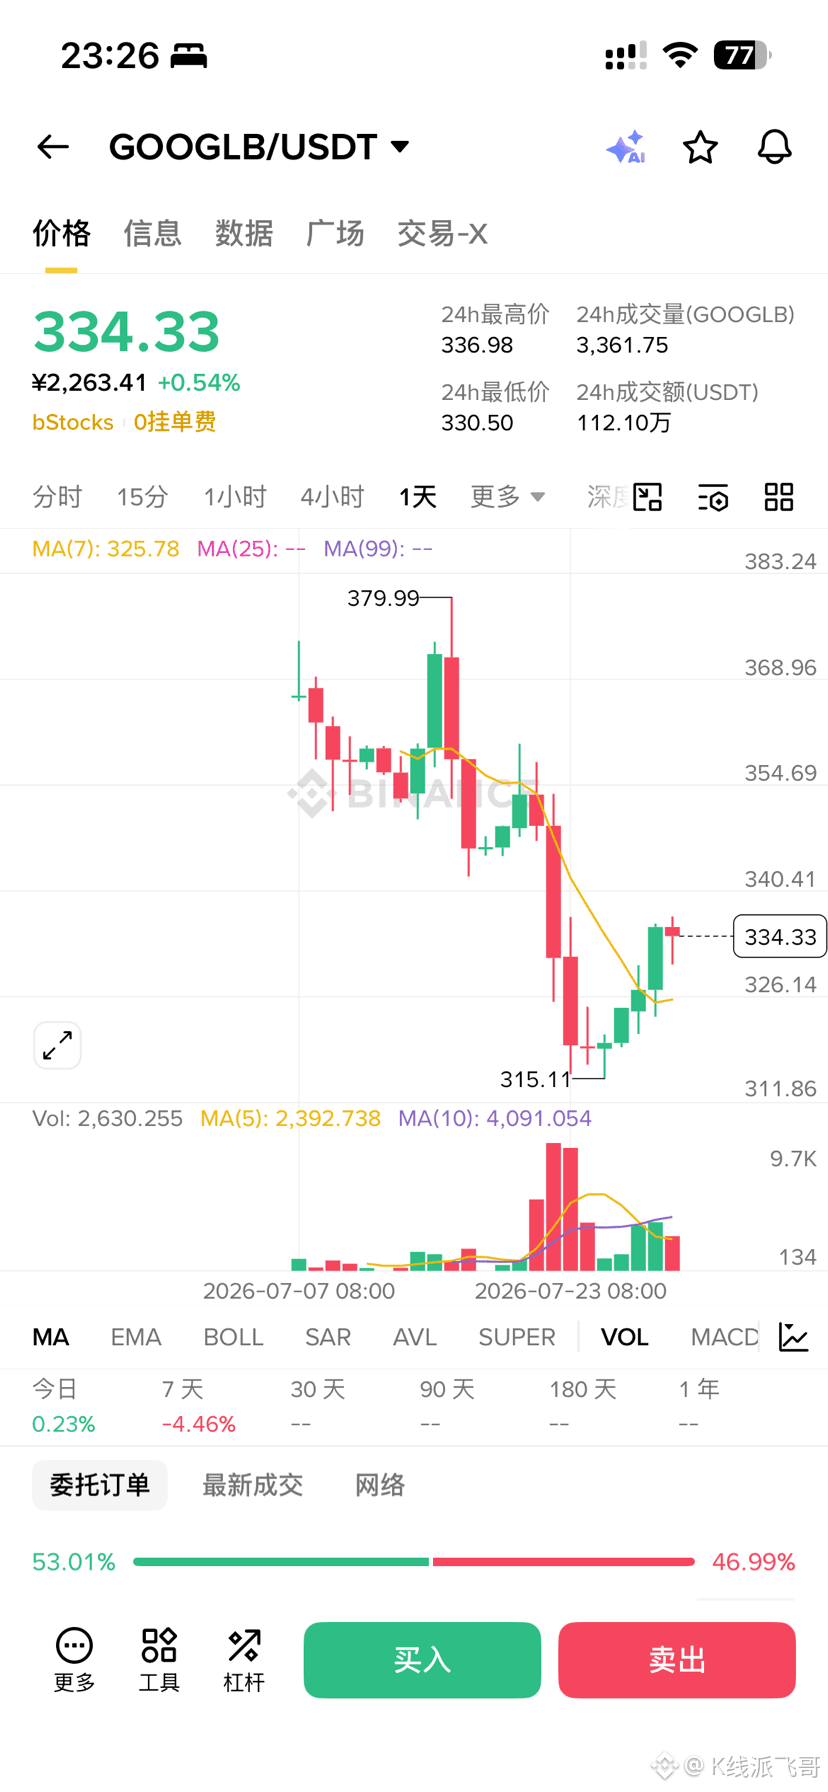
I’ve carefully studied Google’s earnings reports over the past few days. Personally, I think they’re fine—it's just that the profits in the second quarter can’t cover the expenses. But Google’s cash flow is still plentiful and can completely support it burning cash for another few years.
Put another way, if Google’s full-on bet on AI fails, I don’t know who else could succeed. Also, if Google doesn’t go all-in at this time, then that would really mean there’s no future. I even think Google going all-in is a bit late; if it’s any later, it’ll end up at the same table as Tencent. So, I’m continuing to add to my position in Google.
$GOOGL
Put another way, if Google’s full-on bet on AI fails, I don’t know who else could succeed. Also, if Google doesn’t go all-in at this time, then that would really mean there’s no future. I even think Google going all-in is a bit late; if it’s any later, it’ll end up at the same table as Tencent. So, I’m continuing to add to my position in Google.
$GOOGL
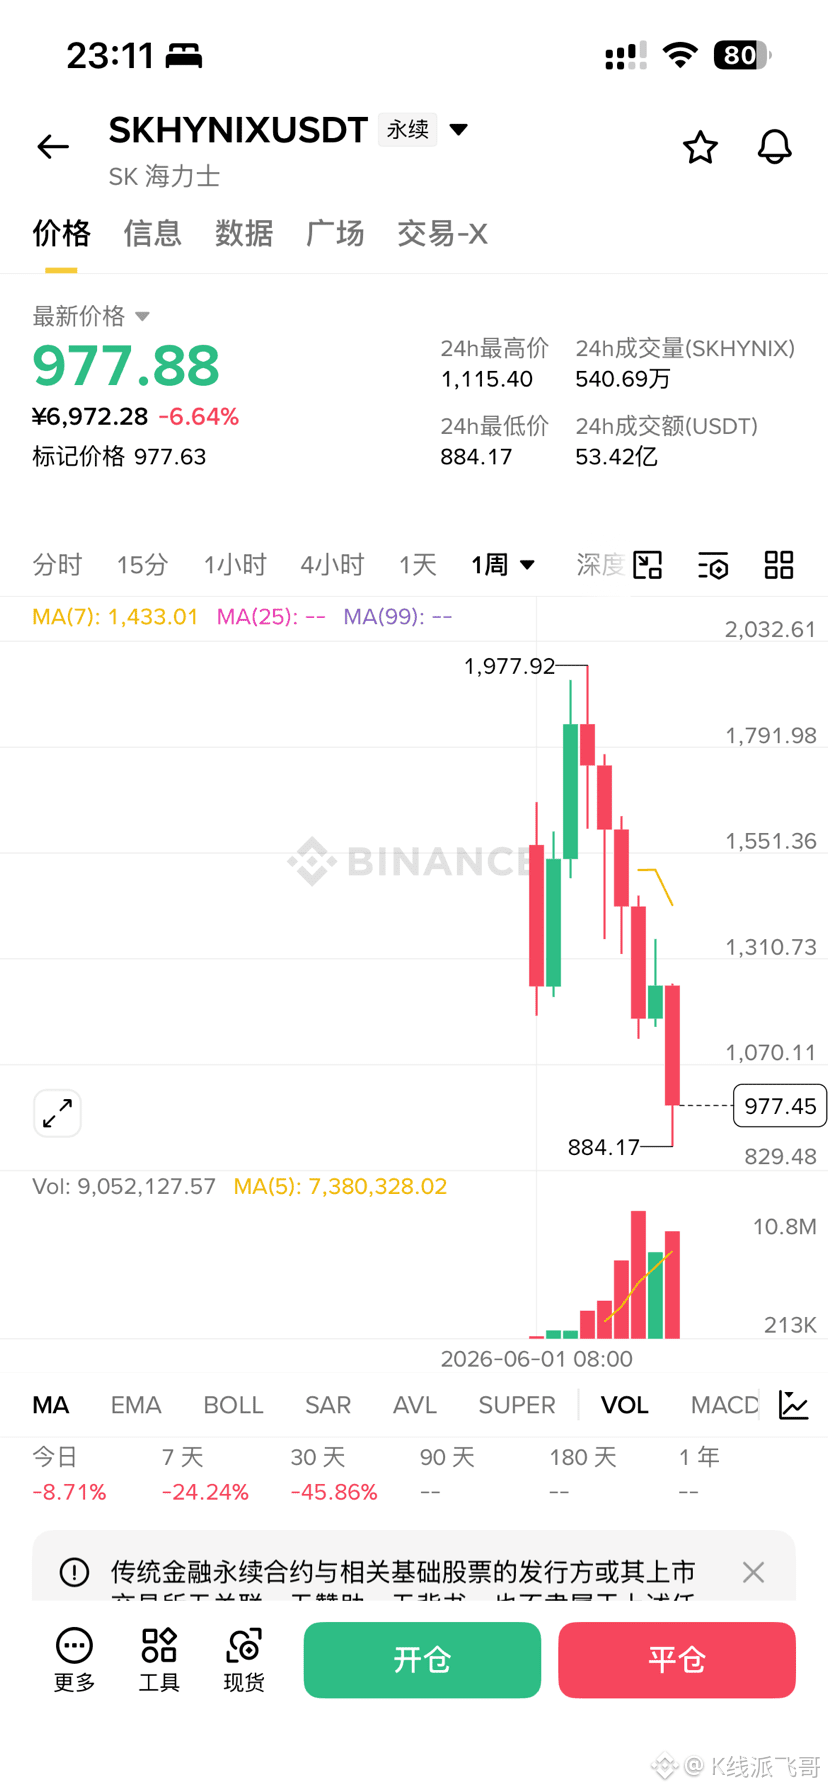
SK Hynix’s short-term bottom is about to appear
As KS expected, Hynix missed its 2026 Q2 earnings report, and then the most brutal sell-off began—at one point down as much as 18%.
After KOSPI touched the low point of the U.S.-Iran war, it started rebounding quickly.
Hynix’s earnings miss was due to DRAM ASP coming in below expectations. More capacity is being allocated to HBM. After the report, the forward P/E ratio is around 3.
So what is the market pricing in now? That the giant’s capex is going to run out within two years—construction abruptly comes to a halt. NVDA is expected to drop by 50%, and storage and most semiconductor companies face bankruptcy.
Is this pricing reasonable? I don’t think so. The most popular argument is that AI can only generate revenue through coding, so it can’t support such high capex. But I believe an important concept we can’t ignore is the “technology explosion.” A year ago, we couldn’t even imagine AI completing large-scale software engineering projects via agents. Back then, when I debugged, I still had to painfully copy and paste code snippets into the web chat window and laboriously describe the context. We shouldn’t underestimate how technical progress accelerates the broader adoption of AI, as well as the revenue potential from pushing down into lower-tier markets to win by volume.
On the other hand, improvements in open-source models have given hyperscalers the power to sell tokens directly—which is a far more lucrative business than renting out compute. O/A is dead—everything follows.
Stock-trading gains come from divergence in opinions. Early in the year, there was debate over whether storage would be a cyclical stock. By the months of April, May, and June, that divergence disappeared, and everyone started believing the growth-stock narrative—so profits vanished too. Now, divergence has returned.
Technically, this kind of large drawdown basically signals that deleveraging has likely run its course. Fundamentally, AI progress and adoption have never stopped. Emotionally, retail investors who got liquidated or sold at a loss no longer have the energy to complain.
I believe the bottom of this pullback isn’t far off; personally, I plan to start accumulating around 800 in batches.
$SKHYNIX
As KS expected, Hynix missed its 2026 Q2 earnings report, and then the most brutal sell-off began—at one point down as much as 18%.
After KOSPI touched the low point of the U.S.-Iran war, it started rebounding quickly.
Hynix’s earnings miss was due to DRAM ASP coming in below expectations. More capacity is being allocated to HBM. After the report, the forward P/E ratio is around 3.
So what is the market pricing in now? That the giant’s capex is going to run out within two years—construction abruptly comes to a halt. NVDA is expected to drop by 50%, and storage and most semiconductor companies face bankruptcy.
Is this pricing reasonable? I don’t think so. The most popular argument is that AI can only generate revenue through coding, so it can’t support such high capex. But I believe an important concept we can’t ignore is the “technology explosion.” A year ago, we couldn’t even imagine AI completing large-scale software engineering projects via agents. Back then, when I debugged, I still had to painfully copy and paste code snippets into the web chat window and laboriously describe the context. We shouldn’t underestimate how technical progress accelerates the broader adoption of AI, as well as the revenue potential from pushing down into lower-tier markets to win by volume.
On the other hand, improvements in open-source models have given hyperscalers the power to sell tokens directly—which is a far more lucrative business than renting out compute. O/A is dead—everything follows.
Stock-trading gains come from divergence in opinions. Early in the year, there was debate over whether storage would be a cyclical stock. By the months of April, May, and June, that divergence disappeared, and everyone started believing the growth-stock narrative—so profits vanished too. Now, divergence has returned.
Technically, this kind of large drawdown basically signals that deleveraging has likely run its course. Fundamentally, AI progress and adoption have never stopped. Emotionally, retail investors who got liquidated or sold at a loss no longer have the energy to complain.
I believe the bottom of this pullback isn’t far off; personally, I plan to start accumulating around 800 in batches.
$SKHYNIX
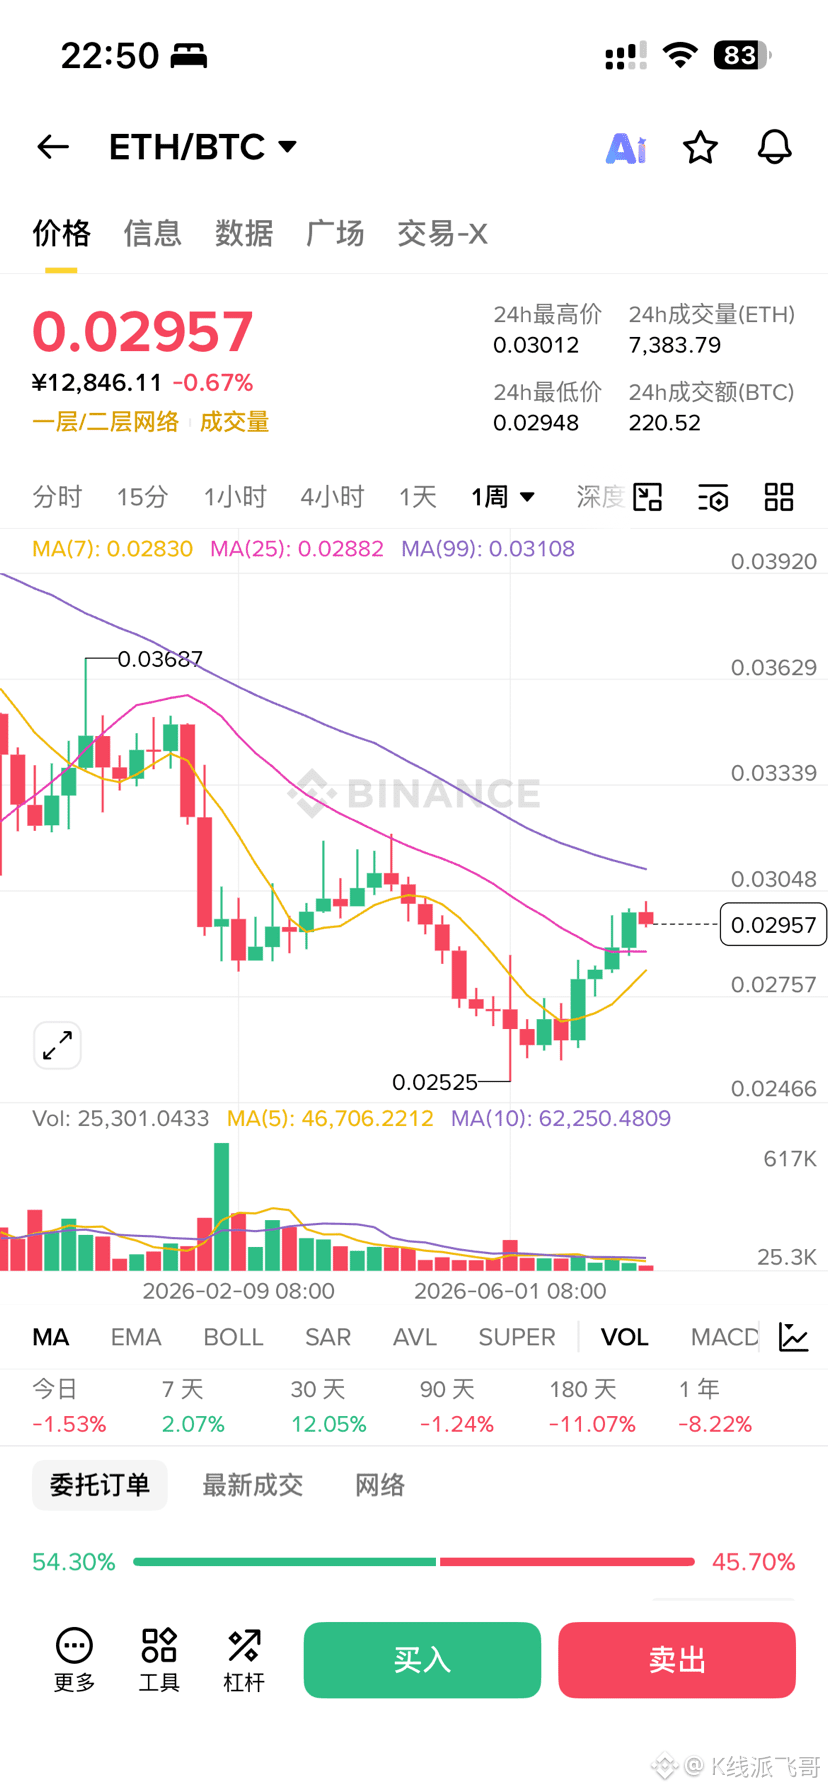
In the next bull market, I believe the upside potential for $ETH is very likely to outperform $BTC .
Although ETH’s long-term performance is still influenced by BTC, during this current bear market, ETH’s drawdown has been noticeably greater than BTC’s. That suggests that once the market enters a new cycle, its rebound resilience may be stronger. Judging from recent fund flows, many institutions—including BlackRock—are continuing to increase their allocation to ETH, indicating that institutional capital is gradually positioning itself.
ETH itself has higher volatility than BTC. Historically, many periods have shown characteristics similar to “2x beta”—it rallies more aggressively in bull markets and falls more sharply in bear markets. So I think the upside for ETH in the next cycle may have a chance to exceed BTC’s.
However, outperforming BTC in terms of upside doesn’t necessarily mean that ETH’s market capitalization will surpass BTC. BTC’s position as “digital gold” and a store of value remains solid, while ETH is more like the infrastructure for on-chain economics. Going forward, it’s likely that both will benefit under different narratives. But in terms of upside elasticity, I still favor ETH more.
Although ETH’s long-term performance is still influenced by BTC, during this current bear market, ETH’s drawdown has been noticeably greater than BTC’s. That suggests that once the market enters a new cycle, its rebound resilience may be stronger. Judging from recent fund flows, many institutions—including BlackRock—are continuing to increase their allocation to ETH, indicating that institutional capital is gradually positioning itself.
ETH itself has higher volatility than BTC. Historically, many periods have shown characteristics similar to “2x beta”—it rallies more aggressively in bull markets and falls more sharply in bear markets. So I think the upside for ETH in the next cycle may have a chance to exceed BTC’s.
However, outperforming BTC in terms of upside doesn’t necessarily mean that ETH’s market capitalization will surpass BTC. BTC’s position as “digital gold” and a store of value remains solid, while ETH is more like the infrastructure for on-chain economics. Going forward, it’s likely that both will benefit under different narratives. But in terms of upside elasticity, I still favor ETH more.
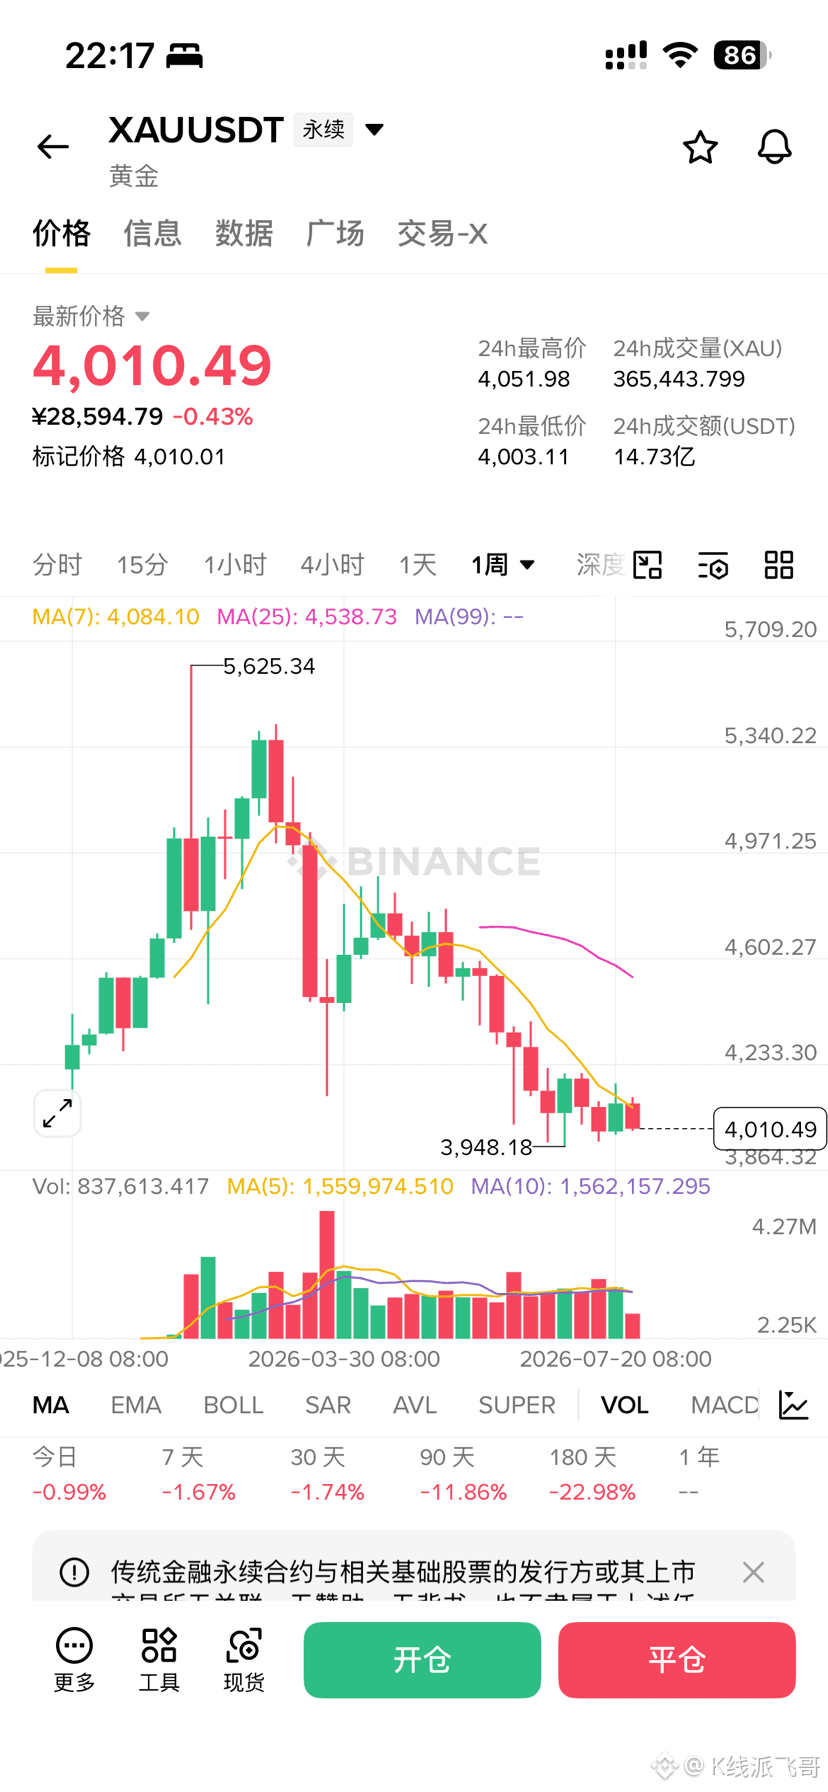
About Gold’s Next Outlook $XAU $XAUT $PAXG
Gold is much more affected by the Federal Reserve than BTC is.
But this is also very good news for value investors,
because if you can use judgments about the Federal Reserve to catch a momentary market low,
then it’s basically no different from picking up money.
You just need a bit of patience.
My current guess is that this kind of low is still around 3600.
Gold is much more affected by the Federal Reserve than BTC is.
But this is also very good news for value investors,
because if you can use judgments about the Federal Reserve to catch a momentary market low,
then it’s basically no different from picking up money.
You just need a bit of patience.
My current guess is that this kind of low is still around 3600.
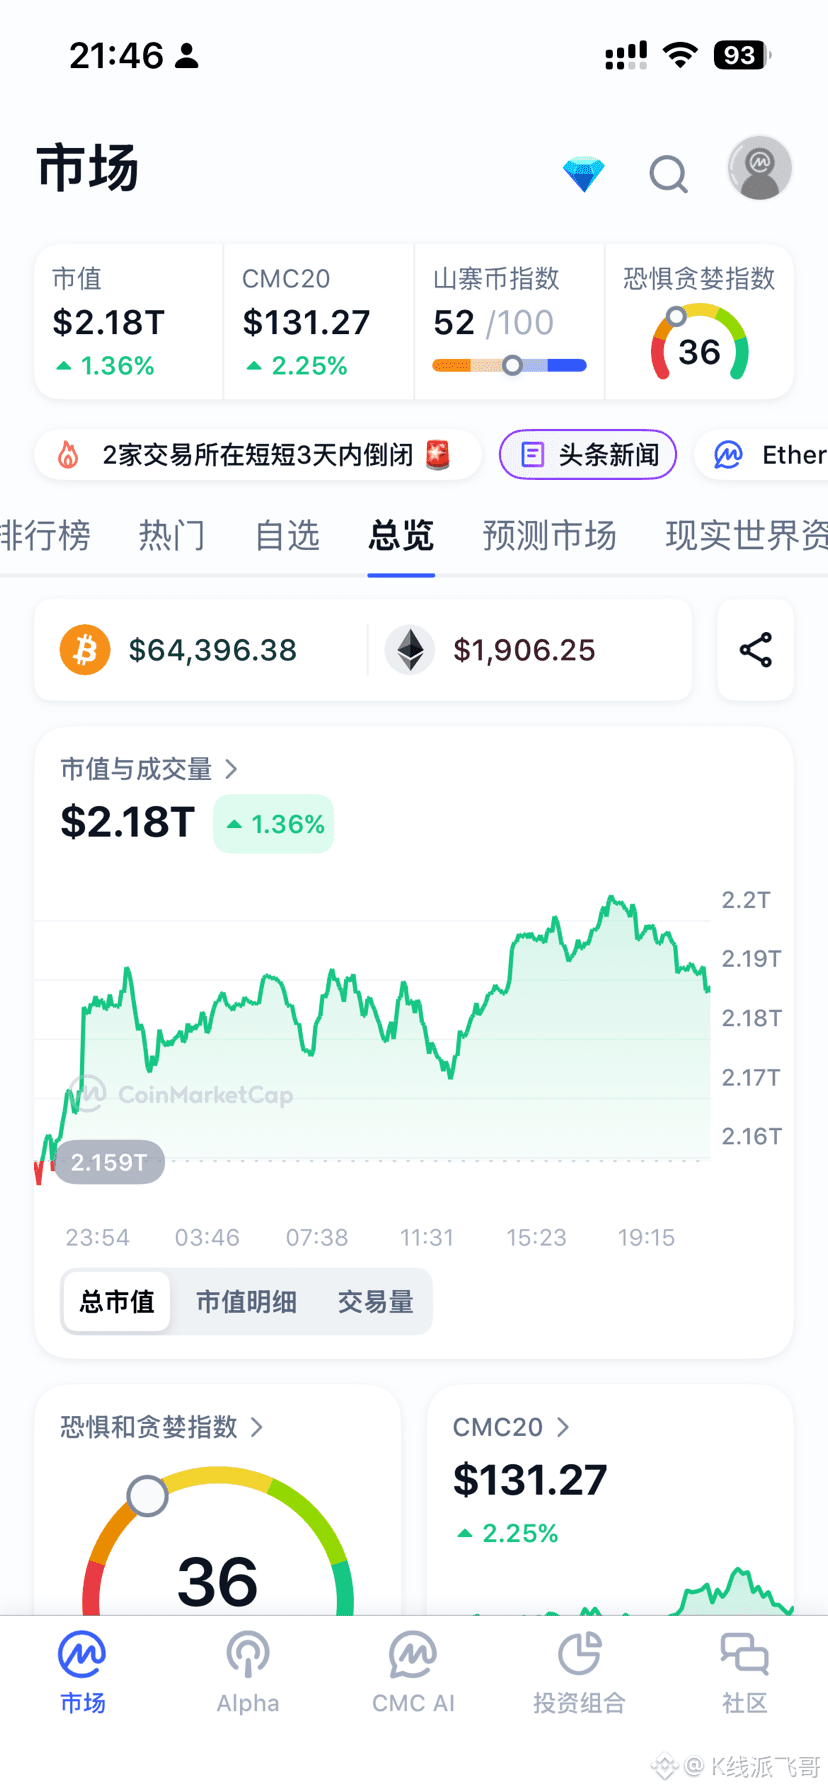
The current global financial market environment is that AI and its related sectors have peaked and are now falling. There are two iconic tops: one is Nvidia peaking in May, and the other is Hynix peaking in June.
It’s very clear that global liquidity will take advantage of an AI pullback to do a major “liquidity squeeze” (large withdrawal).
Across all industries—whether they have already pulled back for half a year, one year, or are about to pull back—future 3–6 months will probably be impossible to avoid a final drop.
Within $BTC hours, on the 1-hour timeframe, there was a trend reversal, but I’m not sure whether this is an early digestion of expectations for the Fed’s rate hikes. For this period of sideways consolidation after the big BTC topping (57000–68000), we still need patience. The final drop may be in August or September.
I’m also continuously monitoring changes in trading volume.
Over the past 4 weeks, trading volume has kept declining, not much more than the deep-bear phase in Q4 2022.
But since BTC has developed for so many years, the trading volume during the deep-bear phase has been declining gradually.
At this time in July, the trading volume is still not low enough.
If I’ve misjudged it, then 57000 is the lowest bottom. I’ll post an update in a timely manner if that’s the case.
It’s very clear that global liquidity will take advantage of an AI pullback to do a major “liquidity squeeze” (large withdrawal).
Across all industries—whether they have already pulled back for half a year, one year, or are about to pull back—future 3–6 months will probably be impossible to avoid a final drop.
Within $BTC hours, on the 1-hour timeframe, there was a trend reversal, but I’m not sure whether this is an early digestion of expectations for the Fed’s rate hikes. For this period of sideways consolidation after the big BTC topping (57000–68000), we still need patience. The final drop may be in August or September.
I’m also continuously monitoring changes in trading volume.
Over the past 4 weeks, trading volume has kept declining, not much more than the deep-bear phase in Q4 2022.
But since BTC has developed for so many years, the trading volume during the deep-bear phase has been declining gradually.
At this time in July, the trading volume is still not low enough.
If I’ve misjudged it, then 57000 is the lowest bottom. I’ll post an update in a timely manner if that’s the case.
Verified
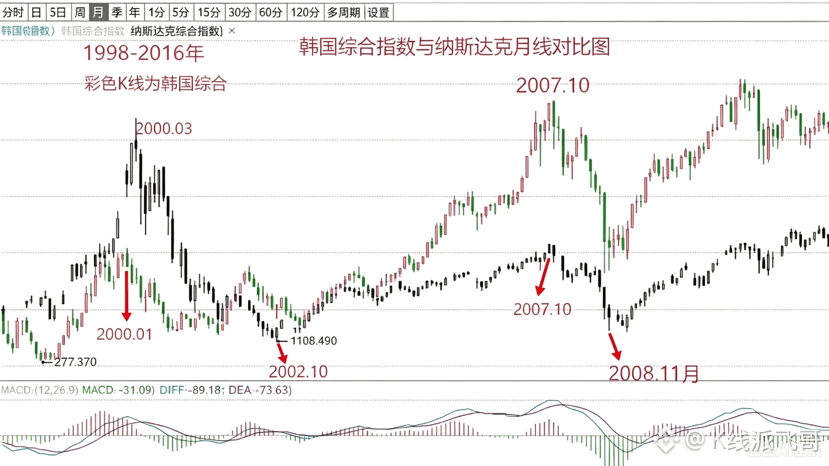
Reviewing the past three decades of history: there have been four times when the monthly chart of the Korea Composite Index topped out. After each top, how long did it take for the Nasdaq Index’s monthly chart to top out?
Only used to speculate about how long it might take for the Nasdaq Index to begin a pullback at the monthly (line-chart) level.
The chart below compares the monthly charts of the Korea Composite Index and the Nasdaq Index from 1998 to 2016. Colored candlesticks represent the Korea Composite; black candlesticks represent Nasdaq.
Figure 1
First: During the 2000 internet bubble period
As shown above, the Korea Composite Index peaked in Jan 2000, then began a monthly-level pullback afterward (from the highest point 1066 down to the lowest point 463).
The Nasdaq Index peaked in Mar 2000, two months later than the Korea Composite, and then began a monthly-level pullback (from the highest point 5130 down to the lowest point 1108).
Second: 2008, the subprime mortgage crisis caused by the bursting of the U.S. real estate bubble
The Korea Composite Index and Nasdaq almost simultaneously peaked and then began a monthly-level pullback. The Korea Composite fell from the highest point 2085 to the lowest point 892; the Nasdaq Index fell from the highest point 2861 to the lowest point 1265.
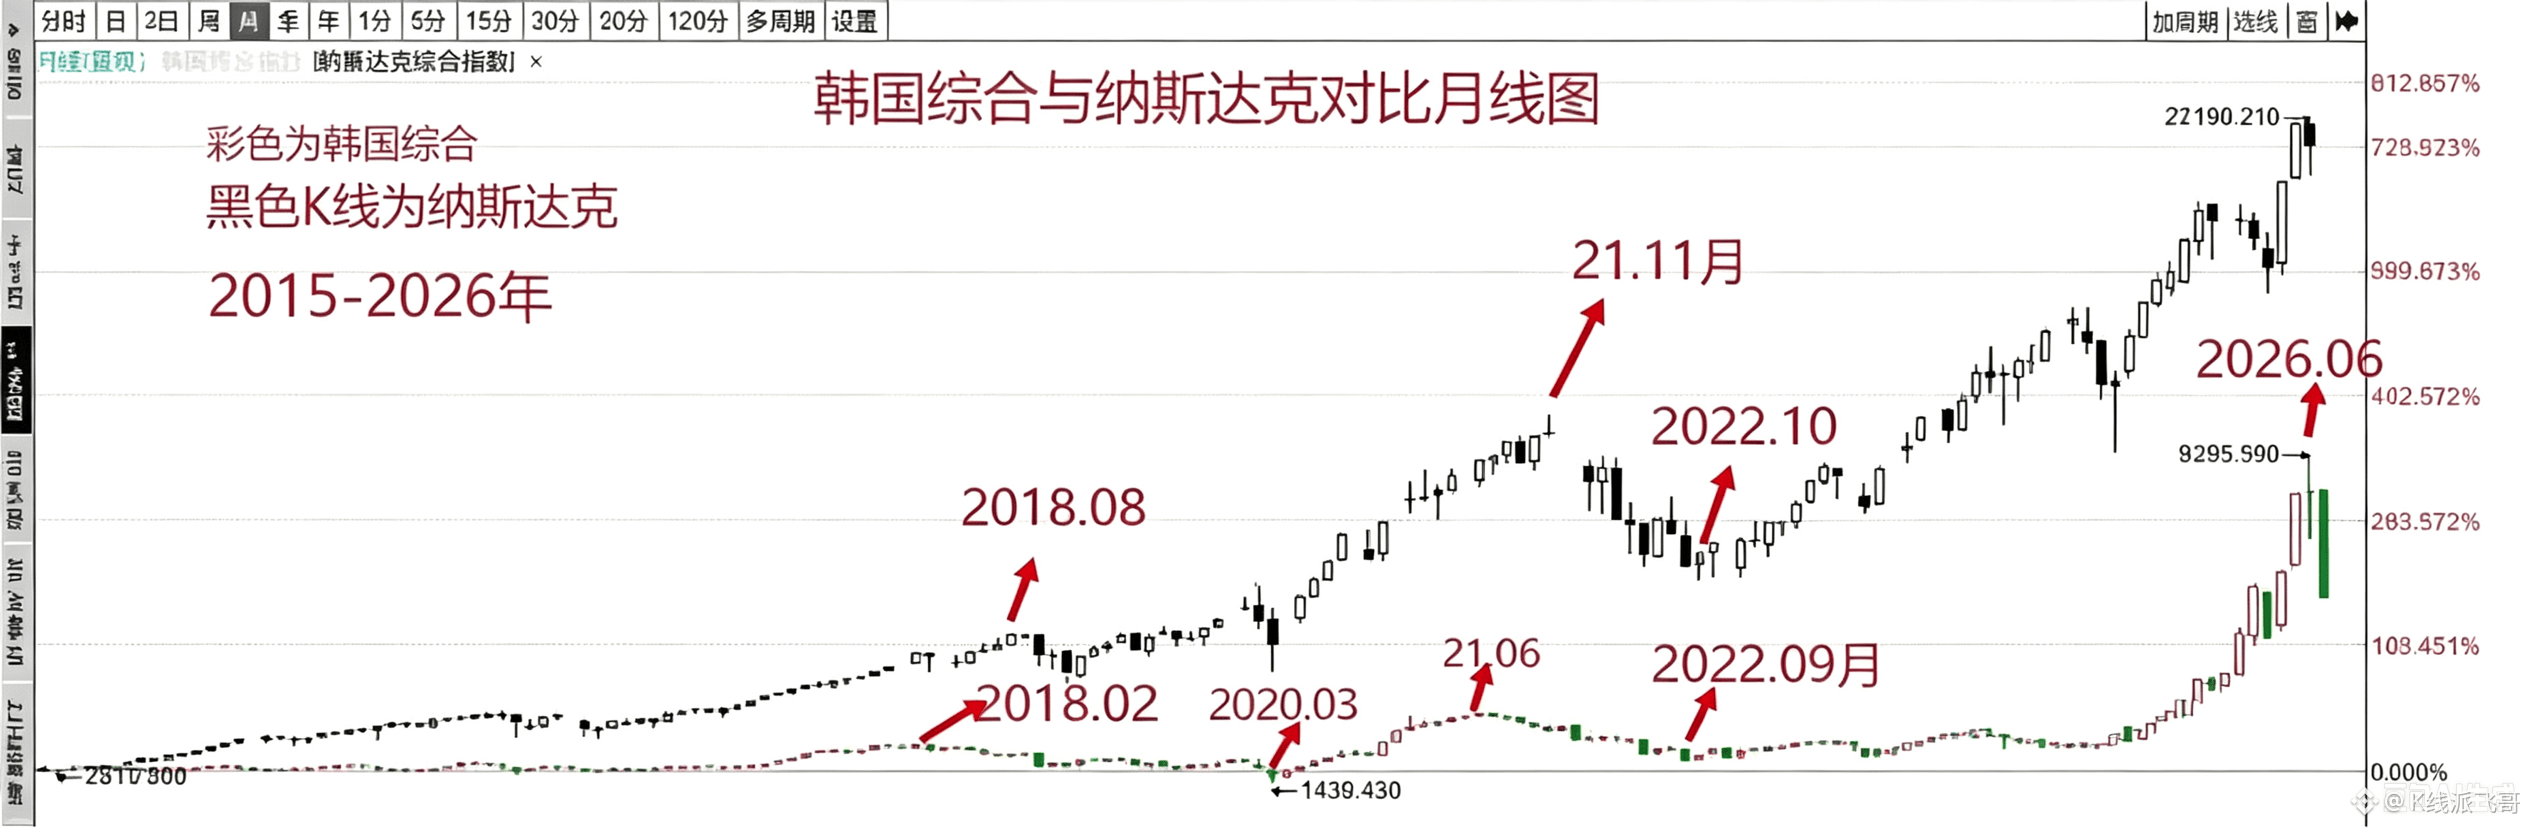
Now let’s look at the monthly chart comparison between the Korea Composite and Nasdaq from 2015 to 2026.
Figure 2
Third: In 2018, the Fed’s rate hikes and balance-sheet reduction tightened global liquidity (4 aggressive rate hikes in 2018)
As shown above, the Korea Composite Index peaked in Feb 2018 and began a monthly-level pullback (from the highest point 2606 down to the lowest point 1439). The Nasdaq Index peaked in Aug of the same year, 6 months later than the Korea Composite, and began a monthly-level pullback (from the highest point 8133 down to the lowest point 6190). However, the pullback magnitude was relatively smaller.
The Korea Composite Index peaked in Jun 2021 and began a monthly-level pullback (from the highest point 3316 down to the lowest point 2134). The Nasdaq Index peaked in Nov 2021, 5 months later than the Korea Composite, and began a monthly-level pullback (from the highest point 16212 down to the lowest point 10088).
From the chart above, it can be seen that the Korea Composite Index saw a bearish cross-like doji combined with a long bearish candle in June 2026, and then a large bearish candle in July. This makes it highly likely that the Korea Composite Index has already topped on the monthly chart and will then begin a major monthly-level drawdown.
So, based on historical speculation, will the Nasdaq (NAsdaq) peak in the coming months and then begin a major monthly-level pullback?
Will the Nasdaq keep rising without a pullback? (I’m ruling this option out for everyone—there is no asset in the world that can keep rising without ever pulling back, even something as “noble” as gold and the Nasdaq.)
Only used to speculate about how long it might take for the Nasdaq Index to begin a pullback at the monthly (line-chart) level.
The chart below compares the monthly charts of the Korea Composite Index and the Nasdaq Index from 1998 to 2016. Colored candlesticks represent the Korea Composite; black candlesticks represent Nasdaq.
Figure 1
First: During the 2000 internet bubble period
As shown above, the Korea Composite Index peaked in Jan 2000, then began a monthly-level pullback afterward (from the highest point 1066 down to the lowest point 463).
The Nasdaq Index peaked in Mar 2000, two months later than the Korea Composite, and then began a monthly-level pullback (from the highest point 5130 down to the lowest point 1108).
Second: 2008, the subprime mortgage crisis caused by the bursting of the U.S. real estate bubble
The Korea Composite Index and Nasdaq almost simultaneously peaked and then began a monthly-level pullback. The Korea Composite fell from the highest point 2085 to the lowest point 892; the Nasdaq Index fell from the highest point 2861 to the lowest point 1265.
Now let’s look at the monthly chart comparison between the Korea Composite and Nasdaq from 2015 to 2026.
Figure 2
Third: In 2018, the Fed’s rate hikes and balance-sheet reduction tightened global liquidity (4 aggressive rate hikes in 2018)
As shown above, the Korea Composite Index peaked in Feb 2018 and began a monthly-level pullback (from the highest point 2606 down to the lowest point 1439). The Nasdaq Index peaked in Aug of the same year, 6 months later than the Korea Composite, and began a monthly-level pullback (from the highest point 8133 down to the lowest point 6190). However, the pullback magnitude was relatively smaller.
The Korea Composite Index peaked in Jun 2021 and began a monthly-level pullback (from the highest point 3316 down to the lowest point 2134). The Nasdaq Index peaked in Nov 2021, 5 months later than the Korea Composite, and began a monthly-level pullback (from the highest point 16212 down to the lowest point 10088).
From the chart above, it can be seen that the Korea Composite Index saw a bearish cross-like doji combined with a long bearish candle in June 2026, and then a large bearish candle in July. This makes it highly likely that the Korea Composite Index has already topped on the monthly chart and will then begin a major monthly-level drawdown.
So, based on historical speculation, will the Nasdaq (NAsdaq) peak in the coming months and then begin a major monthly-level pullback?
Will the Nasdaq keep rising without a pullback? (I’m ruling this option out for everyone—there is no asset in the world that can keep rising without ever pulling back, even something as “noble” as gold and the Nasdaq.)
Log in to explore more content