

Bit-Insight-Hub
2.7k Posts

Bit-Insight-Hub
Report
Block User
Real-time insights, dynamic discussions await. Join us for informed decisions in the ever-evolving world of digital assets. X@bitinsighthub 🚀💬
11 Following
10.7K+ Followers
7.9K+ Liked
Posts
All
Quotes
Videos
PINNED
BitInsightHub is your sanctuary for profound crypto exploration. Delve into Bitcoin, altcoins, and blockchain intricacies. Real-time insights, dynamic discussions await. Join us for informed decisions in the ever-evolving world of digital assets. 🚀💬
#BTC #etf #ETH #DeFiChallenge #BinanceSquare
BitInsightHub is your sanctuary for profound crypto exploration. Delve into Bitcoin, altcoins, and blockchain intricacies. Real-time insights, dynamic discussions await. Join us for informed decisions in the ever-evolving world of digital assets. 🚀💬
#BTC #etf #ETH #DeFiChallenge #BinanceSquare
#BTC #etf #ETH #DeFiChallenge #BinanceSquare
20
29
154

Article
🚨 BANK OF ISRAEL REJECTS CRYPTO AS A WAY TO BYPASS POTENTIAL SANCTIONS🚨 BANK OF ISRAEL REJECTS CRYPTO AS A WAY TO BYPASS POTENTIAL SANCTIONS
🌍 Can Cryptocurrency Protect a Nation From International Financial Restrictions?
A significant debate over the future of digital finance has emerged following reports that the Bank of Israel rejected a proposal to explore cryptocurrencies as a way to circumvent potential international financial sanctions.
According to the report you shared, Prime Minister Benjamin Netanyahu raised concerns about possible international banking restrictions and requested plans to explore alternative financial systems, including blockchain technology and cryptocurrencies.
The Bank of Israel reportedly warned that crypto cannot provide a reliable solution for bypassing sanctions and emphasized the importance of preserving economic relationships with major international trading partners.
🔍 WHY THIS MATTERS FOR THE CRYPTO INDUSTRY
1️⃣ Crypto Is Not Completely Outside the Financial System
Bitcoin and other decentralized cryptocurrencies can operate without traditional banks for certain transactions. However, converting digital assets into national currencies, accessing regulated exchanges, and conducting international business can still involve intermediaries subject to legal and regulatory requirements.
2️⃣ Blockchain Does Not Mean Financial Anonymity
Public blockchains can provide transparency and traceability. Transactions may be analyzed, wallets can be monitored, and regulated platforms may enforce sanctions and compliance rules.
3️⃣ International Trade Still Depends on Trust
Even if a country explores alternative payment infrastructure, international commerce also relies on correspondent banking, trade finance, insurance, liquidity, and confidence among business partners. Cryptocurrency alone cannot replace this entire system.
4️⃣ Governments Are Facing a Digital Finance Dilemma
Blockchain technology offers opportunities for faster settlement, transparent transactions, and new payment infrastructure. At the same time, governments must consider financial stability, regulatory compliance, geopolitical risks, and international cooperation.
📊 WHAT COULD THIS MEAN FOR BITCOIN AND ALTCOINS?
This development should not automatically be interpreted as bullish or bearish for Bitcoin.
Bitcoin (BTC): The debate highlights Bitcoin's potential role as a decentralized asset, while also illustrating the limits of using it as a substitute for the international banking system.
Stablecoins: They can facilitate digital payments, but their issuers and supporting financial infrastructure may remain subject to restrictions.
Blockchain infrastructure: The broader opportunity may lie in legitimate cross-border payments, settlement efficiency, and transparent financial systems.
Crypto regulation: Geopolitical tensions could intensify discussions about compliance, sanctions enforcement, and the responsibilities of digital-asset platforms.
🧠 THE BIGGER PICTURE
The key question is not simply whether cryptocurrency can move value without a traditional bank. It is whether a country can maintain the liquidity, international acceptance, and commercial relationships needed to sustain its economy when facing financial restrictions.
Blockchain can transform parts of the financial system, but technology alone cannot eliminate geopolitical and economic consequences.
🎯 FINAL TAKEAWAY
Crypto is becoming part of the global debate about financial independence. However, decentralization does not guarantee immunity from sanctions, and blockchain adoption does not automatically replace access to international markets.
The future of digital finance will depend on technology, regulation, market trust, and global economic cooperation.
💬 What do you think? Could decentralized finance eventually reduce countries' dependence on traditional banking networks, or will international financial regulation remain the decisive factor?
#bitcoin #CryptoNews #blockchain #BTC走势分析 #cryptocurrency $BTC
🚨 BANK OF ISRAEL REJECTS CRYPTO AS A WAY TO BYPASS POTENTIAL SANCTIONS
🚨 BANK OF ISRAEL REJECTS CRYPTO AS A WAY TO BYPASS POTENTIAL SANCTIONS
🌍 Can Cryptocurrency Protect a Nation From International Financial Restrictions?
A significant debate over the future of digital finance has emerged following reports that the Bank of Israel rejected a proposal to explore cryptocurrencies as a way to circumvent potential international financial sanctions.
According to the report you shared, Prime Minister Benjamin Netanyahu raised concerns about possible international banking restrictions and requested plans to explore alternative financial systems, including blockchain technology and cryptocurrencies.
The Bank of Israel reportedly warned that crypto cannot provide a reliable solution for bypassing sanctions and emphasized the importance of preserving economic relationships with major international trading partners.
🔍 WHY THIS MATTERS FOR THE CRYPTO INDUSTRY
1️⃣ Crypto Is Not Completely Outside the Financial System
Bitcoin and other decentralized cryptocurrencies can operate without traditional banks for certain transactions. However, converting digital assets into national currencies, accessing regulated exchanges, and conducting international business can still involve intermediaries subject to legal and regulatory requirements.
2️⃣ Blockchain Does Not Mean Financial Anonymity
Public blockchains can provide transparency and traceability. Transactions may be analyzed, wallets can be monitored, and regulated platforms may enforce sanctions and compliance rules.
3️⃣ International Trade Still Depends on Trust
Even if a country explores alternative payment infrastructure, international commerce also relies on correspondent banking, trade finance, insurance, liquidity, and confidence among business partners. Cryptocurrency alone cannot replace this entire system.
4️⃣ Governments Are Facing a Digital Finance Dilemma
Blockchain technology offers opportunities for faster settlement, transparent transactions, and new payment infrastructure. At the same time, governments must consider financial stability, regulatory compliance, geopolitical risks, and international cooperation.
📊 WHAT COULD THIS MEAN FOR BITCOIN AND ALTCOINS?
This development should not automatically be interpreted as bullish or bearish for Bitcoin.
Bitcoin (BTC): The debate highlights Bitcoin's potential role as a decentralized asset, while also illustrating the limits of using it as a substitute for the international banking system.
Stablecoins: They can facilitate digital payments, but their issuers and supporting financial infrastructure may remain subject to restrictions.
Blockchain infrastructure: The broader opportunity may lie in legitimate cross-border payments, settlement efficiency, and transparent financial systems.
Crypto regulation: Geopolitical tensions could intensify discussions about compliance, sanctions enforcement, and the responsibilities of digital-asset platforms.
🧠 THE BIGGER PICTURE
The key question is not simply whether cryptocurrency can move value without a traditional bank. It is whether a country can maintain the liquidity, international acceptance, and commercial relationships needed to sustain its economy when facing financial restrictions.
Blockchain can transform parts of the financial system, but technology alone cannot eliminate geopolitical and economic consequences.
🎯 FINAL TAKEAWAY
Crypto is becoming part of the global debate about financial independence. However, decentralization does not guarantee immunity from sanctions, and blockchain adoption does not automatically replace access to international markets.
The future of digital finance will depend on technology, regulation, market trust, and global economic cooperation.
💬 What do you think? Could decentralized finance eventually reduce countries' dependence on traditional banking networks, or will international financial regulation remain the decisive factor?
#bitcoin #CryptoNews #blockchain #BTC走势分析 #cryptocurrency $BTC
194
Article
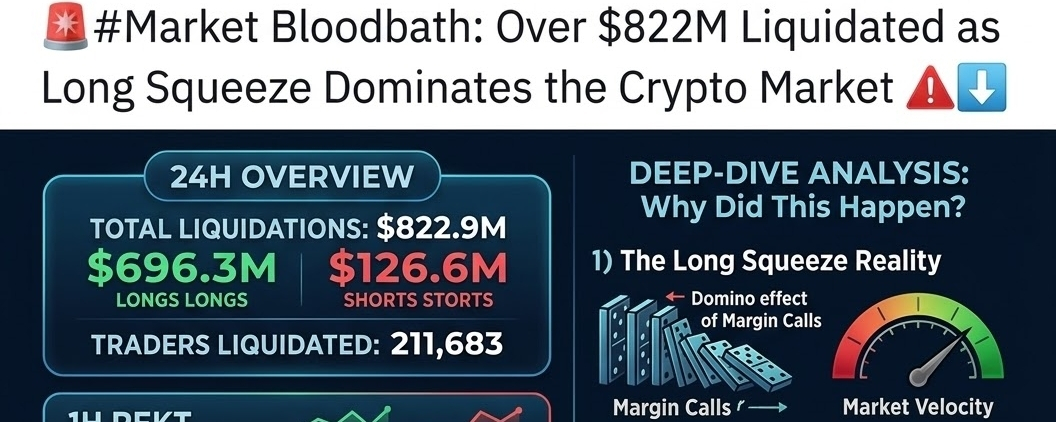
Market Bloodbath: Over $822M Liquidated as Long Squeeze Dominates the Crypto Market 🚨📉Market Bloodbath: Over $822M Liquidated as Long Squeeze Dominates the Crypto Market 🚨📉
The cryptocurrency market has just experienced a severe volatility wave, resulting in a staggering wave of forced liquidations across major derivatives exchanges. Market structures have faced intense downward pressure, catching over-leveraged traders completely off guard.
Here is a deep-dive breakdown of the liquidation data and what it signals for current market dynamics.
📊 Liquidation Metrics Breakdown (24-Hour Overview)
According to the latest data from across the derivatives landscape, the magnitude of the flush is heavily skewed toward aggressive bullish positioning:
Total 24-Hour Liquidations: $822.9M wiped out across the board.
Total Traders Wiped Out: 211,683 traders liquidated in a single 24-hour cycle.
Long Positions (The Bulls): $696.3M liquidated (accounting for ~84.6% of total liquidations).
Short Positions (The Bears): $126.6M liquidated.
Timeframe Progression:
1-Hour Rekt: $5.6M ($2.4M Longs vs. $3.2M Shorts) — Short-term consolidation battling local support/resistance.
4-Hour Rekt: $430.2M ($404.1M Longs vs. $26.1M Shorts) — The primary cascade event where structural support levels failed.
12-Hour Rekt: $485.5M ($450.8M Longs vs. $34.7M Shorts) — Sustained selling pressure chewing through late buyers.
24-Hour Rekt: $822.9M ($696.3M Longs vs. $126.6M Shorts) — The overarching aggregate wash-out.
🔍 Deep-Dive Analysis: Why Did This Happen?
The Long Squeeze Reality: When the market experiences a sudden downward correction, over-leveraged long positions relying on thin margins face cascading stop-outs. As prices slide, exchange automated margin calls trigger market sell orders, compounding the downward velocity. The massive disparity ($696.3M in long liquidations vs. just $126.6M in shorts) highlights that the market was heavily over-exposed to upside continuation bets.
Cascading Timeframes: Notice how the 4-hour liquidations ($430.2M) make up the lion's share of the 12-hour and 24-hour totals. This points to a sharp, aggressive impulse move rather than a slow bleed—classic behavior of an engineered liquidity sweep targeting high-density order blocks or local support clusters.
Psychological & Market Impact: With over 211,000 retail and institutional traders rekt within 24 hours, market sentiment has instantly pivoted from FOMO to extreme caution. Funding rates are likely resetting, and open interest (OI) is purging rapidly, which—while painful in the short term—is a necessary healthy mechanism to clear out excessive leverage before any sustainable trend resumption can occur.
💡 Trader Takeaway & Risk Management Notes
Beware of High Leverage: Volatility cuts both ways. High-leverage setups ($20x–$50x+) during macro uncertainty act as magnets for market makers looking for liquidity pools.
Watch the Open Interest & Funding Rates: Use these liquidation flushes as a gauge to spot when the market is overly lopsided. A cleared-out leverage book often sets the stage for a local bottom, but patience and strict risk management are non-negotiable.
Stay safe out there, manage your risk, and never trade without a stop-loss! 🛡️📉
Market Bloodbath: Over $822M Liquidated as Long Squeeze Dominates the Crypto Market 🚨📉
Market Bloodbath: Over $822M Liquidated as Long Squeeze Dominates the Crypto Market 🚨📉
The cryptocurrency market has just experienced a severe volatility wave, resulting in a staggering wave of forced liquidations across major derivatives exchanges. Market structures have faced intense downward pressure, catching over-leveraged traders completely off guard.
Here is a deep-dive breakdown of the liquidation data and what it signals for current market dynamics.
📊 Liquidation Metrics Breakdown (24-Hour Overview)
According to the latest data from across the derivatives landscape, the magnitude of the flush is heavily skewed toward aggressive bullish positioning:
Total 24-Hour Liquidations: $822.9M wiped out across the board.
Total Traders Wiped Out: 211,683 traders liquidated in a single 24-hour cycle.
Long Positions (The Bulls): $696.3M liquidated (accounting for ~84.6% of total liquidations).
Short Positions (The Bears): $126.6M liquidated.
Timeframe Progression:
1-Hour Rekt: $5.6M ($2.4M Longs vs. $3.2M Shorts) — Short-term consolidation battling local support/resistance.
4-Hour Rekt: $430.2M ($404.1M Longs vs. $26.1M Shorts) — The primary cascade event where structural support levels failed.
12-Hour Rekt: $485.5M ($450.8M Longs vs. $34.7M Shorts) — Sustained selling pressure chewing through late buyers.
24-Hour Rekt: $822.9M ($696.3M Longs vs. $126.6M Shorts) — The overarching aggregate wash-out.
🔍 Deep-Dive Analysis: Why Did This Happen?
The Long Squeeze Reality: When the market experiences a sudden downward correction, over-leveraged long positions relying on thin margins face cascading stop-outs. As prices slide, exchange automated margin calls trigger market sell orders, compounding the downward velocity. The massive disparity ($696.3M in long liquidations vs. just $126.6M in shorts) highlights that the market was heavily over-exposed to upside continuation bets.
Cascading Timeframes: Notice how the 4-hour liquidations ($430.2M) make up the lion's share of the 12-hour and 24-hour totals. This points to a sharp, aggressive impulse move rather than a slow bleed—classic behavior of an engineered liquidity sweep targeting high-density order blocks or local support clusters.
Psychological & Market Impact: With over 211,000 retail and institutional traders rekt within 24 hours, market sentiment has instantly pivoted from FOMO to extreme caution. Funding rates are likely resetting, and open interest (OI) is purging rapidly, which—while painful in the short term—is a necessary healthy mechanism to clear out excessive leverage before any sustainable trend resumption can occur.
💡 Trader Takeaway & Risk Management Notes
Beware of High Leverage: Volatility cuts both ways. High-leverage setups ($20x–$50x+) during macro uncertainty act as magnets for market makers looking for liquidity pools.
Watch the Open Interest & Funding Rates: Use these liquidation flushes as a gauge to spot when the market is overly lopsided. A cleared-out leverage book often sets the stage for a local bottom, but patience and strict risk management are non-negotiable.
Stay safe out there, manage your risk, and never trade without a stop-loss! 🛡️📉
2
2.1k
#BTCUSDT 4h | Long-Term
Short Entry Zone: 80696.8-82904.2
Signal Details:
Target 1: 78425.2
Target 2: 76153.6
Target 3: 73890.0
Target 4: 67267.0
Stop-Loss: 86016.9
#signaladvisor #Signal🚥. #signal #BTC走势分析 #BTC $BTC
{spot}(BTCUSDT)
#BTCUSDT 4h | Long-Term
Short Entry Zone: 80696.8-82904.2
Signal Details:
Target 1: 78425.2
Target 2: 76153.6
Target 3: 73890.0
Target 4: 67267.0
Stop-Loss: 86016.9
#signaladvisor #Signal🚥. #signal #BTC走势分析 #BTC $BTC
Short Entry Zone: 80696.8-82904.2
Signal Details:
Target 1: 78425.2
Target 2: 76153.6
Target 3: 73890.0
Target 4: 67267.0
Stop-Loss: 86016.9
#signaladvisor #Signal🚥. #signal #BTC走势分析 #BTC $BTC
1
265
Article
Unmasking the Playbook: Standard Bitcoin ($BTC) Scare Tactics vs. Technical RealitiesUnmasking the Playbook: Standard Bitcoin ($BTC) Scare Tactics vs. Technical Realities
The cryptocurrency market—and Bitcoin ($BTC) in particular—is often a theatre of psychological warfare where price action is leveraged to manipulate retail sentiment. As seen in recent price movements, standard "scare tactics" frequently precede major bullish reversals. A purely emotion-driven response—selling Bitcoin out of fear—is precisely what institutional players and market makers count on.
Decoding Bitcoin ($BTC) Market Manipulation on the Charts
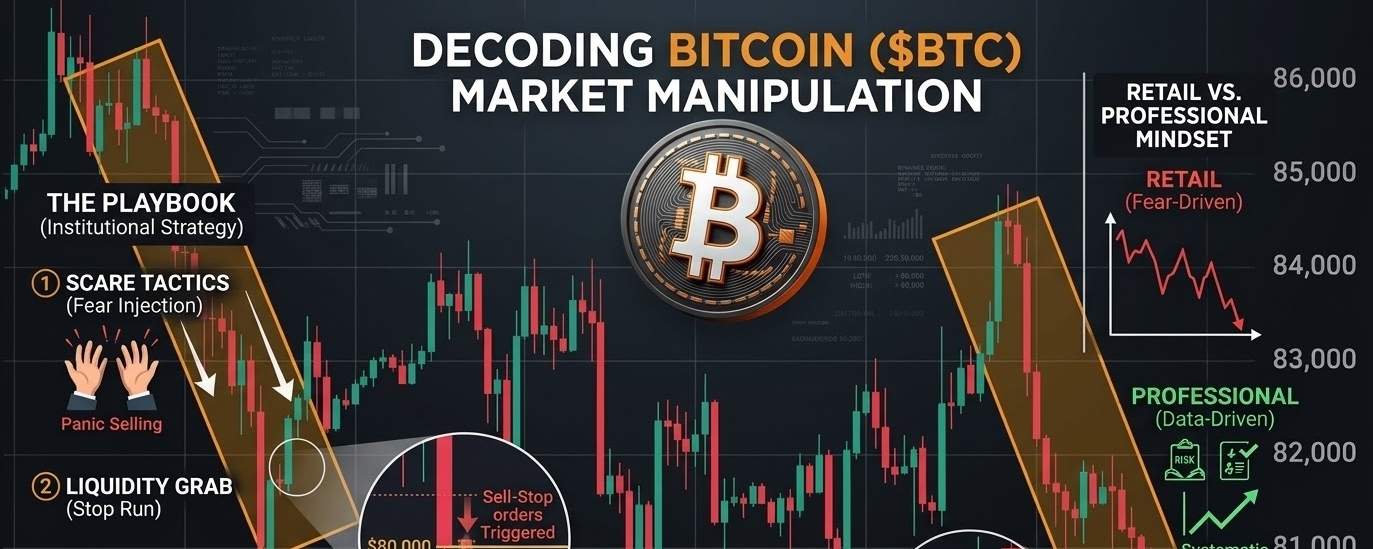
Let's break down the technical setup of Bitcoin ($BTC) to understand the real-time order flow forces at play. We are looking at a crucial re-test of key support levels, characterized by three distinct phases of market manipulation:
1. The "Scare Tactics" Retracement
Referencing the chart structure, Bitcoin underwent a sharp retracement contained within two distinct downward parallel channels. These structured sell-offs are engineered to trigger panic, shake out "weak hands," and force liquidations from high-leverage long positions. Market makers use these artificial sell pressures to accumulate $BTC at lower price levels.
2. The Liquidity Grab
Following the fear-induced selling, Bitcoin's price dipped slightly below key horizontal support levels with a swift "Wick Down" (briefly breaching $80,000 to touch around $79,774). Institutions and whales monitor where retail stop-loss orders concentrate. By briefly pushing $BTC below these visible swing lows, they execute those sell-stops, generating massive liquidity to fill their institutional buy orders at a discount.
3. Strategic Institutional Re-Entry
Once the liquidity grab completes and retail sentiment reaches maximum panic, large buyers step in. This is marked by immediate buying pressure and bullish candle wicks right at the major psychological zone of $79,000–$80,000, confirming an Institutional Buy Zone.
The Psychological War: Do You Have "Weak Hands"?
Market structure in Bitcoin is fundamentally designed to transfer wealth from the impatient to the patient.
The "weak hands" phenomenon is a concrete market strategy:
* Manufacture Fear: Media narratives and sudden red candles induce panic.
* Trigger Stop-Losses: Volatile drops sweep liquidity below obvious support levels.
* Accumulate $BTC: Whales absorb the panic-sold supply at discounted rates.
If you panicked and sold your Bitcoin ($BTC) during the initial breakdown through the channel, you likely transferred your position directly to an institutional accumulator.
Strategic Playbook for Professional Bitcoin ($BTC) Traders
* Trade the Level, Not the Sentiment: If your technical analysis identifies strong historical support for Bitcoin around $80,000, short-term volatility wicks (like $79,774) should be evaluated as liquidity sweeps rather than invalidations of your higher-timeframe bias.
* Identify Liquidity Pools: Before placing orders, ask where market makers will look for liquidity. Major swing lows and rounded psychological numbers in Bitcoin are primary targets for stop runs.
* Maintain Higher Timeframe Perspective: A 1% to 3% drop in Bitcoin on a 15-minute or 1-hour chart can look alarming, but on 4-hour or Daily timeframes, it often represents a standard higher-low retest within a broader macro uptrend.
Conclusion
Market manipulators will continue using these exact tactics on Bitcoin ($BTC) because human fear and greed remain consistent. Developing a professional trading mindset requires recognizing these manipulation patterns, managing risk disciplinedly, and executing alongside smart money rather than reacting to panic.
When you see sudden downward spikes in Bitcoin, ask yourself: Are you panic selling into the move, or executing alongside institutional re-entry?
#bitcoin #BinanceSquare #smartmoney #cryptotrading #priceaction $BTC
{spot}(BTCUSDT)
Unmasking the Playbook: Standard Bitcoin ($BTC) Scare Tactics vs. Technical Realities
Unmasking the Playbook: Standard Bitcoin ($BTC ) Scare Tactics vs. Technical Realities
The cryptocurrency market—and Bitcoin ($BTC ) in particular—is often a theatre of psychological warfare where price action is leveraged to manipulate retail sentiment. As seen in recent price movements, standard "scare tactics" frequently precede major bullish reversals. A purely emotion-driven response—selling Bitcoin out of fear—is precisely what institutional players and market makers count on.
Decoding Bitcoin ($BTC ) Market Manipulation on the Charts
Let's break down the technical setup of Bitcoin ($BTC ) to understand the real-time order flow forces at play. We are looking at a crucial re-test of key support levels, characterized by three distinct phases of market manipulation:
1. The "Scare Tactics" Retracement
Referencing the chart structure, Bitcoin underwent a sharp retracement contained within two distinct downward parallel channels. These structured sell-offs are engineered to trigger panic, shake out "weak hands," and force liquidations from high-leverage long positions. Market makers use these artificial sell pressures to accumulate $BTC at lower price levels.
2. The Liquidity Grab
Following the fear-induced selling, Bitcoin's price dipped slightly below key horizontal support levels with a swift "Wick Down" (briefly breaching $80,000 to touch around $79,774). Institutions and whales monitor where retail stop-loss orders concentrate. By briefly pushing $BTC below these visible swing lows, they execute those sell-stops, generating massive liquidity to fill their institutional buy orders at a discount.
3. Strategic Institutional Re-Entry
Once the liquidity grab completes and retail sentiment reaches maximum panic, large buyers step in. This is marked by immediate buying pressure and bullish candle wicks right at the major psychological zone of $79,000–$80,000, confirming an Institutional Buy Zone.
The Psychological War: Do You Have "Weak Hands"?
Market structure in Bitcoin is fundamentally designed to transfer wealth from the impatient to the patient.
The "weak hands" phenomenon is a concrete market strategy:
* Manufacture Fear: Media narratives and sudden red candles induce panic.
* Trigger Stop-Losses: Volatile drops sweep liquidity below obvious support levels.
* Accumulate $BTC : Whales absorb the panic-sold supply at discounted rates.
If you panicked and sold your Bitcoin ($BTC ) during the initial breakdown through the channel, you likely transferred your position directly to an institutional accumulator.
Strategic Playbook for Professional Bitcoin ($BTC ) Traders
* Trade the Level, Not the Sentiment: If your technical analysis identifies strong historical support for Bitcoin around $80,000, short-term volatility wicks (like $79,774) should be evaluated as liquidity sweeps rather than invalidations of your higher-timeframe bias.
* Identify Liquidity Pools: Before placing orders, ask where market makers will look for liquidity. Major swing lows and rounded psychological numbers in Bitcoin are primary targets for stop runs.
* Maintain Higher Timeframe Perspective: A 1% to 3% drop in Bitcoin on a 15-minute or 1-hour chart can look alarming, but on 4-hour or Daily timeframes, it often represents a standard higher-low retest within a broader macro uptrend.
Conclusion
Market manipulators will continue using these exact tactics on Bitcoin ($BTC ) because human fear and greed remain consistent. Developing a professional trading mindset requires recognizing these manipulation patterns, managing risk disciplinedly, and executing alongside smart money rather than reacting to panic.
When you see sudden downward spikes in Bitcoin, ask yourself: Are you panic selling into the move, or executing alongside institutional re-entry?
#bitcoin #BinanceSquare #smartmoney #cryptotrading #priceaction $BTC
222
#BinancePick
🏆 **Think Your Picks Never Miss? Prove It! 🔥**
The ultimate challenge is here! 🎯
💰 **1,000,000 USDC Rewards Pool**
Do you have the skills to predict the market? 📈📉
Make your picks, trust your analysis, and show the community what you've got! Whether the market goes bullish or bearish, every decision is an opportunity to sharpen your trading skills.
🔥 Think smart. Pick wisely. Prove your skills!
Are you ready to take on the challenge? 👇
#BinancePick #Binance #Crypto #MarketPrediction

97
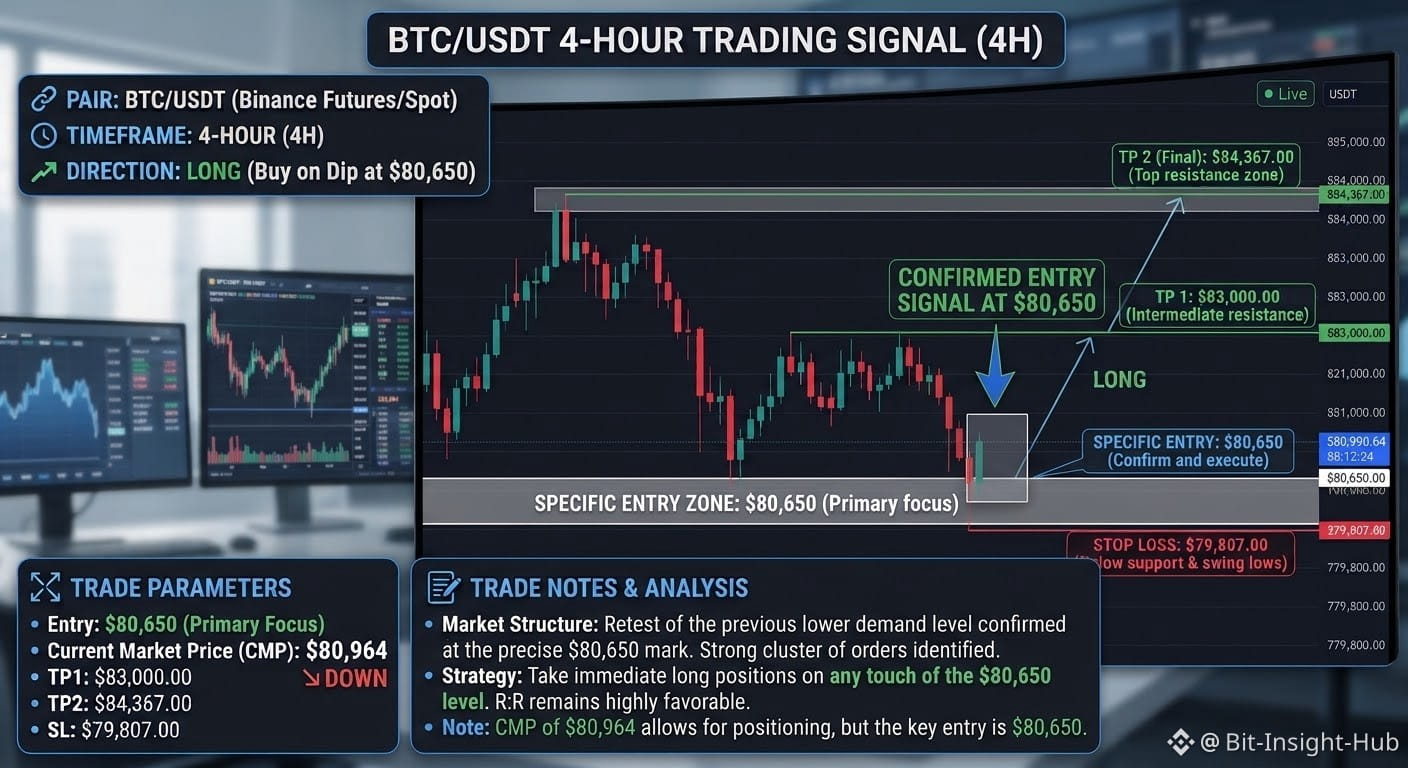
📊 BTC/USDT Trading Signal
Pair: BTC/USDT (Binance Futures / Spot)
Timeframe: 4-Hour (4H)
Direction: LONG (Buy on Dip in Support Zone)
📍 Trade Parameters
Entry Zone: $80,555 (Waiting for a retest of the demand/support zone shaded grey at the bottom)$BTC
Current Market Price (CMP): ~$80755
🎯 Take Profit (TP) Levels
TP 1: $83,000.00 (Intermediate resistance / mid-range key level)
TP 2 (Final Target): $84,367.00 (Top resistance zone / local high targets)
🛑 Stop Loss (SL)
Stop Loss: $79,807.00 (Below the lower grey support zone and recent swing lows to invalidate the setup)
💡 Trade Notes & Analysis
Market Structure: The price is currently range-bound between the $80,650 support zone and the $84,360 resistance zone.
Strategy: Patience is key—wait for the price to drop into the lower demand block around $80,651 before taking long positions for a favorable Risk-to-Reward Ratio.
#Signal #signaladvisor #signals #BTC #Signal🚥. $BTC
2
1
398
Article
⚠️ #BTC Sitting Between Dual Liquidity Pools: Why Entering Now is High Risk 🔴⚠️ #BTC Sitting Between Dual Liquidity Pools: Why Entering Now is High Risk 🔴
Understanding market structure requires looking beyond basic chart patterns and diving straight into where market liquidity is stacked.
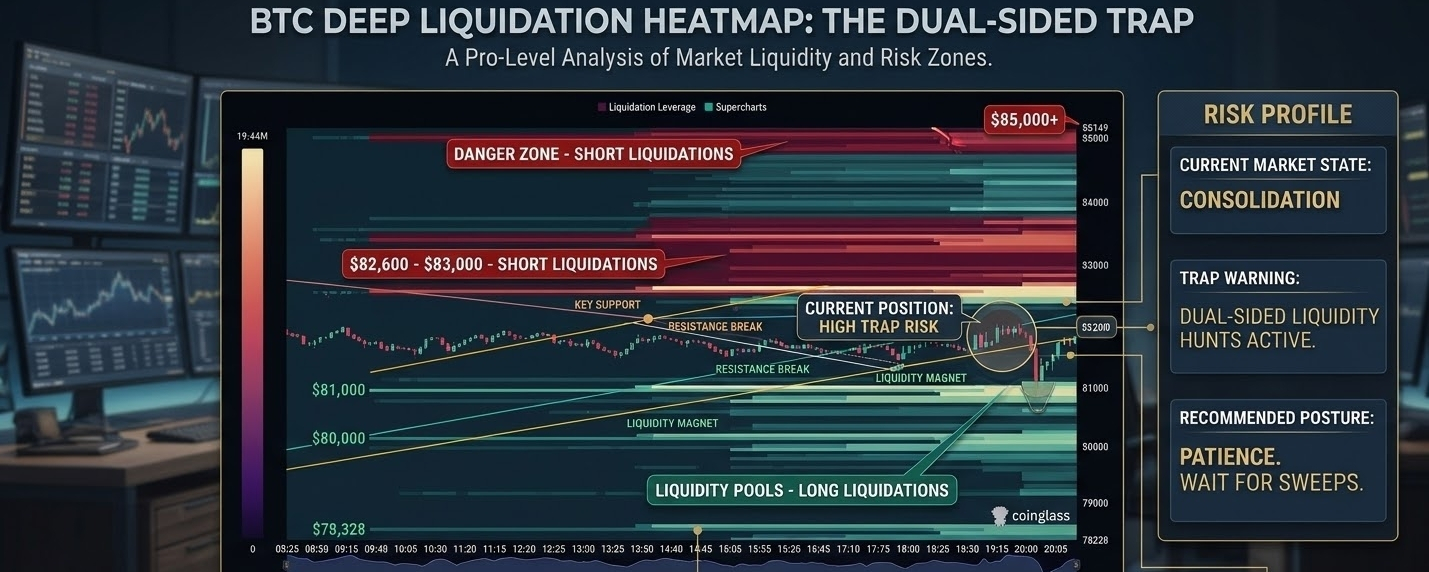
Looking at the latest CoinGlass Liquidation Heatmap for Bitcoin ($BTC) around the $82,000 price area, a clear professional insight emerges: Bitcoin is currently trapped in a high-density, dual-sided liquidity magnet.
📊 Deep-Dive Heatmap Analysis
1. Upper Liquidity (Short Liquidations)
Key Levels: $82,600 – $83,000 and $85,000+
Structure: Bright yellow/orange bands indicate dense, leveraged Short positions stacked closely above the current price.
Impact: A fast break upward toward $83,000 can trigger cascading forced buys (short squeezes), fueling a quick liquidity sweep before institutional sellers potentially step back in.
2. Lower Liquidity (Long Liquidations)
Key Levels: $81,000, $80,000, and $78,300
Structure: Deep pools of Long stop-losses and liquidation levels are sitting right under the recent low around $81,000.
Impact: Market makers and algorithmic traders frequently hunt these clustered long liquidations. A downside sweep below $81,000 could trigger a sharp "flush out" down toward the major psychological level at $80,000.
💡 Why a "No-Trade Zone" Exists Right Now
When liquidation density is concentrated heavily on both sides within a tight price range:
Choppy Whipsaw Volatility: Price tends to act like a ping-pong ball, hunting liquidity first in one direction to flush out early positions, then rapidly reversing to sweep the opposite side.
Poor Risk-to-Reward (R:R): Entering at current levels puts your stop-loss right in the middle of active liquidity clusters—making stop-outs almost inevitable during volatility spikes.
Liquidity Sweeps Over Trend: In these environments, price movement is driven by forced liquidations rather than genuine directional momentum.
🎯 Pro Trader Playbook & Next Steps
🛑 Patience Over Action: Avoid taking leveraged market orders in the middle of these two heavy liquidity pools.
👀 Wait for the Sweep & Confirmation:
Let price sweep either $83,000+ (Shorts) or $81,000/$80,000 (Longs) first.
Look for clear absorption (rejection wicks, volume divergence, or market structure shifts) after the sweep occurs before considering an entry.
🛡️ Capital Preservation First: Cash is a valid position during dual-sided liquidity traps. Protect your capital and let the market reveal its true direction post-liquidation.
📌 Summary: Both sides have heavy liquidity waiting to be cleared. Wait for the sweeps to settle before taking action! 🔴
What’s your plan—are you waiting for $81k to sweep first, or are you looking for an $83k break? Let me know below! 👇
#bitcoin #cryptotrading #LiquidationHeatmap #TechnicalAnalysis #BinanceSquare
$BTC
⚠️ #BTC Sitting Between Dual Liquidity Pools: Why Entering Now is High Risk 🔴
⚠️ #BTC Sitting Between Dual Liquidity Pools: Why Entering Now is High Risk 🔴
Understanding market structure requires looking beyond basic chart patterns and diving straight into where market liquidity is stacked.
Looking at the latest CoinGlass Liquidation Heatmap for Bitcoin ($BTC ) around the $82,000 price area, a clear professional insight emerges: Bitcoin is currently trapped in a high-density, dual-sided liquidity magnet.
📊 Deep-Dive Heatmap Analysis
1. Upper Liquidity (Short Liquidations)
Key Levels: $82,600 – $83,000 and $85,000+
Structure: Bright yellow/orange bands indicate dense, leveraged Short positions stacked closely above the current price.
Impact: A fast break upward toward $83,000 can trigger cascading forced buys (short squeezes), fueling a quick liquidity sweep before institutional sellers potentially step back in.
2. Lower Liquidity (Long Liquidations)
Key Levels: $81,000, $80,000, and $78,300
Structure: Deep pools of Long stop-losses and liquidation levels are sitting right under the recent low around $81,000.
Impact: Market makers and algorithmic traders frequently hunt these clustered long liquidations. A downside sweep below $81,000 could trigger a sharp "flush out" down toward the major psychological level at $80,000.
💡 Why a "No-Trade Zone" Exists Right Now
When liquidation density is concentrated heavily on both sides within a tight price range:
Choppy Whipsaw Volatility: Price tends to act like a ping-pong ball, hunting liquidity first in one direction to flush out early positions, then rapidly reversing to sweep the opposite side.
Poor Risk-to-Reward (R:R): Entering at current levels puts your stop-loss right in the middle of active liquidity clusters—making stop-outs almost inevitable during volatility spikes.
Liquidity Sweeps Over Trend: In these environments, price movement is driven by forced liquidations rather than genuine directional momentum.
🎯 Pro Trader Playbook & Next Steps
🛑 Patience Over Action: Avoid taking leveraged market orders in the middle of these two heavy liquidity pools.
👀 Wait for the Sweep & Confirmation:
Let price sweep either $83,000+ (Shorts) or $81,000/$80,000 (Longs) first.
Look for clear absorption (rejection wicks, volume divergence, or market structure shifts) after the sweep occurs before considering an entry.
🛡️ Capital Preservation First: Cash is a valid position during dual-sided liquidity traps. Protect your capital and let the market reveal its true direction post-liquidation.
📌 Summary: Both sides have heavy liquidity waiting to be cleared. Wait for the sweeps to settle before taking action! 🔴
What’s your plan—are you waiting for $81k to sweep first, or are you looking for an $83k break? Let me know below! 👇
#bitcoin #cryptotrading #LiquidationHeatmap #TechnicalAnalysis #BinanceSquare
$BTC
142
Article
🚨 BITCOIN ($BTC): HIGHER LOWS — IS A BULLISH REVERSAL FORMING? 🚀🚨 BITCOIN ($BTC): HIGHER LOWS — IS A BULLISH REVERSAL FORMING? 🚀
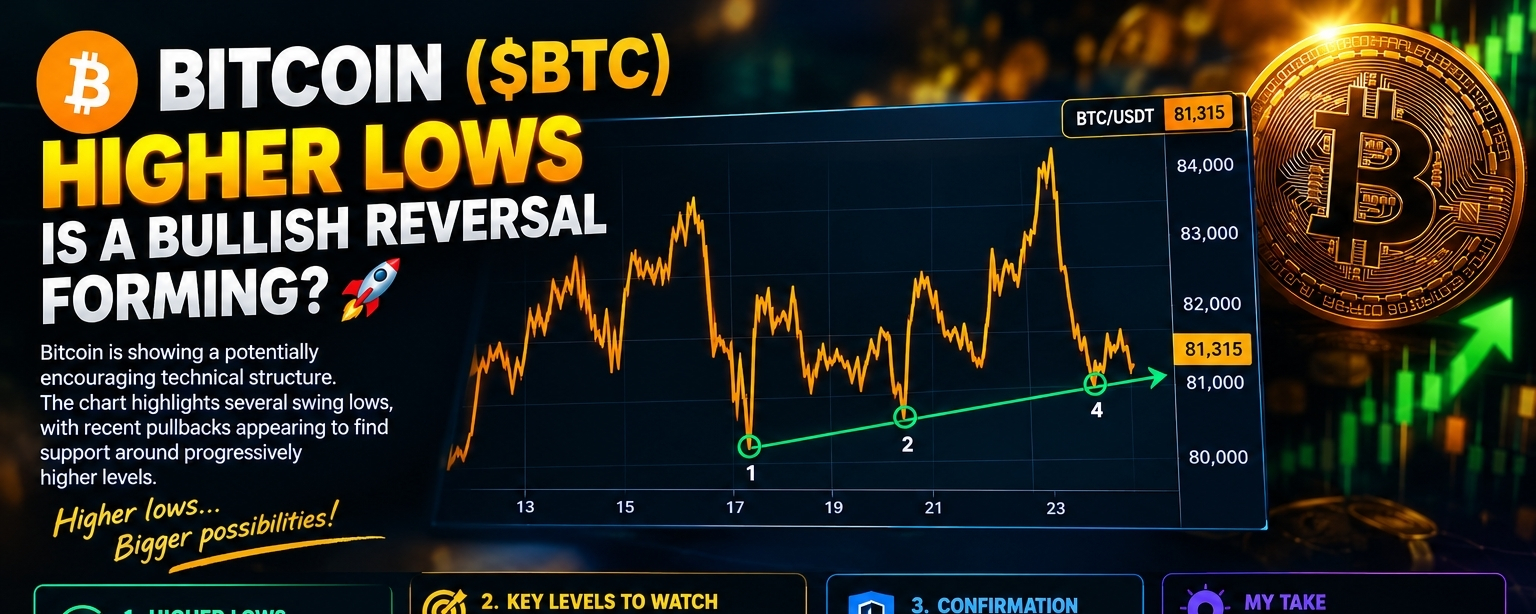
Bitcoin is showing a potentially encouraging technical structure. The chart highlights several swing lows, with recent pullbacks appearing to find support around progressively higher levels.
But is this the beginning of the next bullish move? Let’s break it down. 👇
📊 1. HIGHER LOWS SIGNAL BUYER INTEREST
When Bitcoin forms higher lows, it suggests buyers are stepping in at increasingly higher prices. This can indicate improving short-term market structure and a potential shift in momentum from sellers to buyers.
🔥 2. KEY LEVELS TO WATCH
Based on the provided chart, BTC is trading near $81,315.
🟢 BULLISH SCENARIO:
If BTC continues defending the $81,000–$81,300 area and breaks above nearby resistance around $82,000, bullish momentum could strengthen. A reclaim of $83,000 would be another important sign of recovery.
🔴 BEARISH SCENARIO:
If BTC loses the $81,000 support zone, the higher-low structure could weaken. A break below the previous swing low near $80,000 would invalidate this short-term bullish interpretation.
⚠️ 3. CONFIRMATION IS EVERYTHING
Higher lows alone do not guarantee a breakout. Traders should watch for a confirmed resistance break, stronger buying volume, and sustained price action above reclaimed levels.
🎯 MY TAKE:
Bitcoin’s developing swing structure offers a reason for cautious optimism, but bulls still need to prove their strength. The next support test and resistance breakout could determine the direction of the next move.
Higher lows are a signal. A confirmed breakout is the trigger. 📈
What do you think — is BTC preparing for another rally, or will sellers take control again? 👀
This analysis is based on the supplied chart and is for educational purposes only, not financial advice.
#bitcoin #BTC走势分析 #CryptoAnalysis #TechnicalAnalysis #BinanceSquare
🚨 BITCOIN ($BTC): HIGHER LOWS — IS A BULLISH REVERSAL FORMING? 🚀
🚨 BITCOIN ($BTC): HIGHER LOWS — IS A BULLISH REVERSAL FORMING? 🚀
Bitcoin is showing a potentially encouraging technical structure. The chart highlights several swing lows, with recent pullbacks appearing to find support around progressively higher levels.
But is this the beginning of the next bullish move? Let’s break it down. 👇
📊 1. HIGHER LOWS SIGNAL BUYER INTEREST
When Bitcoin forms higher lows, it suggests buyers are stepping in at increasingly higher prices. This can indicate improving short-term market structure and a potential shift in momentum from sellers to buyers.
🔥 2. KEY LEVELS TO WATCH
Based on the provided chart, BTC is trading near $81,315.
🟢 BULLISH SCENARIO:
If BTC continues defending the $81,000–$81,300 area and breaks above nearby resistance around $82,000, bullish momentum could strengthen. A reclaim of $83,000 would be another important sign of recovery.
🔴 BEARISH SCENARIO:
If BTC loses the $81,000 support zone, the higher-low structure could weaken. A break below the previous swing low near $80,000 would invalidate this short-term bullish interpretation.
⚠️ 3. CONFIRMATION IS EVERYTHING
Higher lows alone do not guarantee a breakout. Traders should watch for a confirmed resistance break, stronger buying volume, and sustained price action above reclaimed levels.
🎯 MY TAKE:
Bitcoin’s developing swing structure offers a reason for cautious optimism, but bulls still need to prove their strength. The next support test and resistance breakout could determine the direction of the next move.
Higher lows are a signal. A confirmed breakout is the trigger. 📈
What do you think — is BTC preparing for another rally, or will sellers take control again? 👀
This analysis is based on the supplied chart and is for educational purposes only, not financial advice.
#bitcoin #BTC走势分析 #CryptoAnalysis #TechnicalAnalysis #BinanceSquare
1
402
Article
🚨 $BTC: BITCOIN HAS BEEN CONSOLIDATING FOR 16 DAYS AND 12 HOURS! 📊🚨 $BTC: BITCOIN HAS BEEN CONSOLIDATING FOR 16 DAYS AND 12 HOURS! 📊
Is Bitcoin preparing for a major breakout, or is another rejection coming? 👀
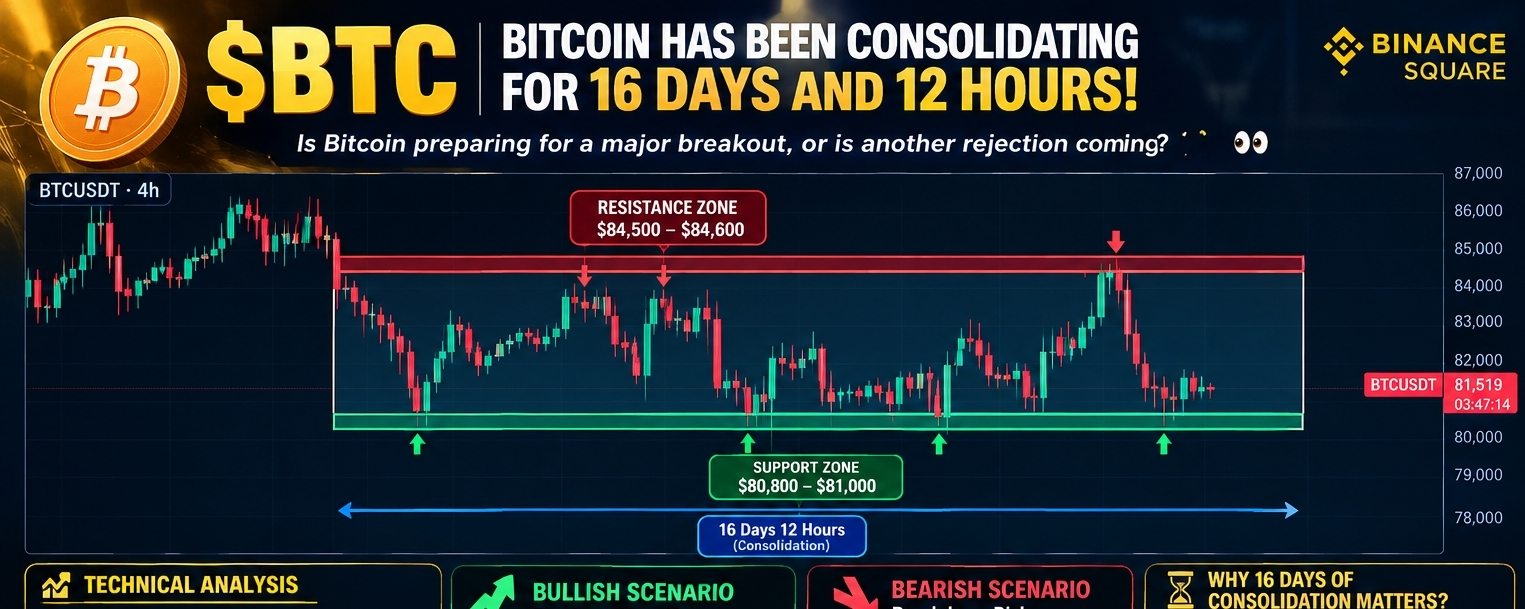
Bitcoin ($BTC) has been trading inside a clearly defined range for approximately 16 days and 12 hours on the 4-hour chart. Despite several attempts to move higher, BTC has struggled to sustain momentum above resistance, while buyers continue defending the lower boundary of the range.
After another rejection near the upper resistance zone, BTC has returned toward the middle-to-lower part of the range. The next major move could depend on which side wins this battle.
🔍 1. BTC Technical Analysis
Based on the chart provided:
🔴 Resistance Zone: $84,500–$84,600
Sellers have previously stepped in around this area.
A breakout without strong follow-through could turn into another false breakout.
BTC needs a decisive 4H candle close above resistance to strengthen the bullish case.
🟢 Support Zone: $80,800–$81,000
Buyers have repeatedly defended this region.
A successful bounce could send BTC back toward the middle and upper portions of the range.
A breakdown below support could expose lower price levels.
📊 Current Price in the Screenshot: Approximately $81,519.
🐂 2. Bullish Scenario — Breakout Ahead?
If BTC successfully reclaims the $82,000–$82,500 area and builds upward momentum, the market could attempt another move toward $83,800–$84,600.
Bullish confirmation:
Strong 4H close above $84,600.
Increased trading volume during the breakout.
Successful retest of the broken resistance as support.
If these conditions align, BTC could enter a new upward expansion phase. However, a breakout alone does not guarantee continuation.
🐻 3. Bearish Scenario — Breakdown Risk
If BTC loses the $80,800 support zone and closes decisively below it on the 4H chart, selling pressure could increase.
Potential downside areas to monitor:
$80,200 — nearby downside reference.
$79,600 — next major level highlighted beneath the range.
$78,500–$78,000 — a possible extended downside zone if bearish momentum accelerates.
These are potential levels to watch, not guaranteed targets.
⏳ 4. Why Does 16 Days of Consolidation Matter?
Extended consolidation reflects a market searching for direction. Buyers and sellers are repeatedly testing the same boundaries, while neither side has established sustained control.
A longer consolidation can precede a strong directional move, but it does not tell us whether that move will be bullish or bearish.
The key factors to watch are:
✅ Breakout or breakdown confirmation
✅ Trading volume expansion
✅ Strong candle closes outside the range
✅ Retests of the broken level
✅ Broader market sentiment and liquidity
🎯 Final Verdict
BTC is approaching a critical decision point.
As long as price remains between approximately $80,800 and $84,600, the market remains range-bound on the chart.
🚀 BULLISH: A confirmed breakout above $84,600 could open the door to further upside.
📉 BEARISH: A confirmed breakdown below $80,800 could expose $80,200 and $79,600.
⚠️ NEUTRAL: Until one of these boundaries breaks with confirmation, avoid assuming the next direction.
Patience is a strategy. Let price confirm the move before taking a position.
💬 What do you think comes next — BTC BREAKOUT 🚀 or BREAKDOWN 📉?
#bitcoin #BTC走势分析 #CryptoAnalysis #TechnicalAnalysis #BTCUSDTAnalysis $BTC
🚨 $BTC: BITCOIN HAS BEEN CONSOLIDATING FOR 16 DAYS AND 12 HOURS! 📊
🚨 $BTC : BITCOIN HAS BEEN CONSOLIDATING FOR 16 DAYS AND 12 HOURS! 📊
Is Bitcoin preparing for a major breakout, or is another rejection coming? 👀
Bitcoin ($BTC ) has been trading inside a clearly defined range for approximately 16 days and 12 hours on the 4-hour chart. Despite several attempts to move higher, BTC has struggled to sustain momentum above resistance, while buyers continue defending the lower boundary of the range.
After another rejection near the upper resistance zone, BTC has returned toward the middle-to-lower part of the range. The next major move could depend on which side wins this battle.
🔍 1. BTC Technical Analysis
Based on the chart provided:
🔴 Resistance Zone: $84,500–$84,600
Sellers have previously stepped in around this area.
A breakout without strong follow-through could turn into another false breakout.
BTC needs a decisive 4H candle close above resistance to strengthen the bullish case.
🟢 Support Zone: $80,800–$81,000
Buyers have repeatedly defended this region.
A successful bounce could send BTC back toward the middle and upper portions of the range.
A breakdown below support could expose lower price levels.
📊 Current Price in the Screenshot: Approximately $81,519.
🐂 2. Bullish Scenario — Breakout Ahead?
If BTC successfully reclaims the $82,000–$82,500 area and builds upward momentum, the market could attempt another move toward $83,800–$84,600.
Bullish confirmation:
Strong 4H close above $84,600.
Increased trading volume during the breakout.
Successful retest of the broken resistance as support.
If these conditions align, BTC could enter a new upward expansion phase. However, a breakout alone does not guarantee continuation.
🐻 3. Bearish Scenario — Breakdown Risk
If BTC loses the $80,800 support zone and closes decisively below it on the 4H chart, selling pressure could increase.
Potential downside areas to monitor:
$80,200 — nearby downside reference.
$79,600 — next major level highlighted beneath the range.
$78,500–$78,000 — a possible extended downside zone if bearish momentum accelerates.
These are potential levels to watch, not guaranteed targets.
⏳ 4. Why Does 16 Days of Consolidation Matter?
Extended consolidation reflects a market searching for direction. Buyers and sellers are repeatedly testing the same boundaries, while neither side has established sustained control.
A longer consolidation can precede a strong directional move, but it does not tell us whether that move will be bullish or bearish.
The key factors to watch are:
✅ Breakout or breakdown confirmation
✅ Trading volume expansion
✅ Strong candle closes outside the range
✅ Retests of the broken level
✅ Broader market sentiment and liquidity
🎯 Final Verdict
BTC is approaching a critical decision point.
As long as price remains between approximately $80,800 and $84,600, the market remains range-bound on the chart.
🚀 BULLISH: A confirmed breakout above $84,600 could open the door to further upside.
📉 BEARISH: A confirmed breakdown below $80,800 could expose $80,200 and $79,600.
⚠️ NEUTRAL: Until one of these boundaries breaks with confirmation, avoid assuming the next direction.
Patience is a strategy. Let price confirm the move before taking a position.
💬 What do you think comes next — BTC BREAKOUT 🚀 or BREAKDOWN 📉?
#bitcoin #BTC走势分析 #CryptoAnalysis #TechnicalAnalysis #BTCUSDTAnalysis $BTC
283
🚀 MILESTONE: El Salvador Overtakes the United States in Satoshis Per Capita!
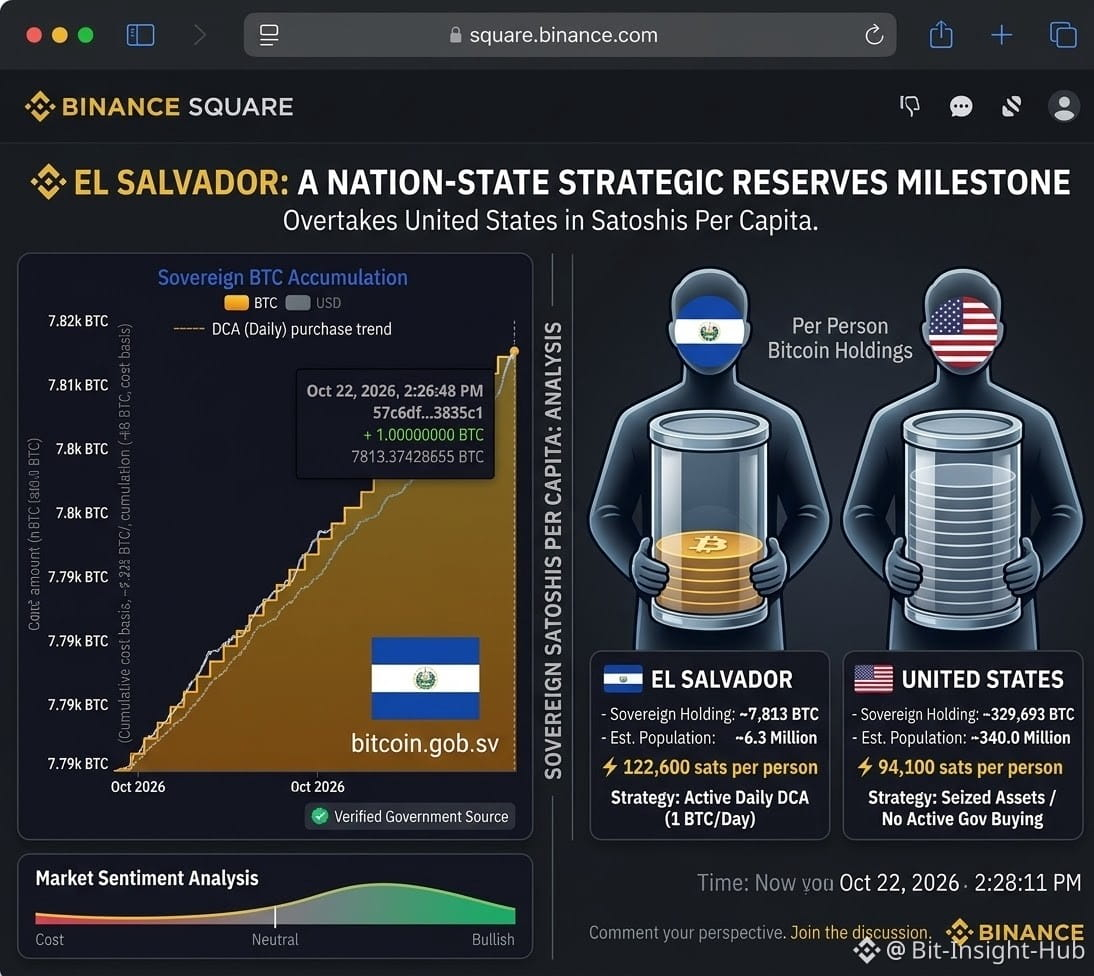
In a massive structural shift for sovereign Bitcoin adoption, El Salvador has officially surpassed the United States in sovereign Bitcoin allocation per citizen!
While the total nation-state holdings tilt heavily toward the U.S. due to size, the per-capita breakdown reveals a fundamentally different commitment strategy:
📊 The Per-Capita Breakdown
* 🇸🇻 El Salvador
* Holdings: ~7,813 BTC
* Per Capita: ~122,600 Satoshis per person
* 🇺🇸 United States
* Holdings: ~329,693 BTC
* Per Capita: ~94,100 Satoshis per person
💡 Key Takeaways for Investors & Analysts
* Dollar-Cost Averaging (DCA) at State Level:
El Salvador’s official treasury tracking (bitcoin.gob.sv) confirms that the nation continues its disciplined strategy of accumulating 1 BTC daily, regardless of market volatility.
* Sovereign Strategic Reserve Benchmark:
While the U.S. government holds significant reserves primarily through law enforcement forfeitures and seizures, El Salvador is actively accumulating BTC as a deliberate central bank treasury allocation and long-term monetary strategy.
* Demographic Leverage:
With a population of approximately 6.3 million compared to 340+ million in the U.S., El Salvador’s ongoing DCA program concentrates significant strategic monetary value into every single citizen's nation-state balance sheet over time.
🔮 What This Means for the Crypto Market
As global debt levels surge and fiat currencies continue to experience long-term purchasing power degradation, El Salvador's sovereign experiment is setting a precedent for nation-states worldwide.
Will larger economies follow suit with formal Strategic Bitcoin Reserves?
👇 What’s your take?
Is sovereign DCA the ultimate game-changer for central bank reserves, or will traditional seized-asset holds remain the primary way large nations acquire BTC? Let us know in the comments!
#bitcoin #ElSalvador #CryptoNews #BinanceSquare #BTC $BTC
{spot}(BTCUSDT)
🚀 MILESTONE: El Salvador Overtakes the United States in Satoshis Per Capita!
In a massive structural shift for sovereign Bitcoin adoption, El Salvador has officially surpassed the United States in sovereign Bitcoin allocation per citizen!
While the total nation-state holdings tilt heavily toward the U.S. due to size, the per-capita breakdown reveals a fundamentally different commitment strategy:
📊 The Per-Capita Breakdown
* 🇸🇻 El Salvador
* Holdings: ~7,813 BTC
* Per Capita: ~122,600 Satoshis per person
* 🇺🇸 United States
* Holdings: ~329,693 BTC
* Per Capita: ~94,100 Satoshis per person
💡 Key Takeaways for Investors & Analysts
* Dollar-Cost Averaging (DCA) at State Level:
El Salvador’s official treasury tracking (bitcoin.gob.sv) confirms that the nation continues its disciplined strategy of accumulating 1 BTC daily, regardless of market volatility.
* Sovereign Strategic Reserve Benchmark:
While the U.S. government holds significant reserves primarily through law enforcement forfeitures and seizures, El Salvador is actively accumulating BTC as a deliberate central bank treasury allocation and long-term monetary strategy.
* Demographic Leverage:
With a population of approximately 6.3 million compared to 340+ million in the U.S., El Salvador’s ongoing DCA program concentrates significant strategic monetary value into every single citizen's nation-state balance sheet over time.
🔮 What This Means for the Crypto Market
As global debt levels surge and fiat currencies continue to experience long-term purchasing power degradation, El Salvador's sovereign experiment is setting a precedent for nation-states worldwide.
Will larger economies follow suit with formal Strategic Bitcoin Reserves?
👇 What’s your take?
Is sovereign DCA the ultimate game-changer for central bank reserves, or will traditional seized-asset holds remain the primary way large nations acquire BTC? Let us know in the comments!
#bitcoin #ElSalvador #CryptoNews #BinanceSquare #BTC $BTC
82
Verified

Article
$BNB ANALYSIS: HISTORY, BINANCE TEAM, TOKEN BURNS & PRICE TARGETS — HOW HIGH CAN BNB GO? 🚀$BNB ANALYSIS: HISTORY, BINANCE TEAM, TOKEN BURNS & PRICE TARGETS — HOW HIGH CAN BNB GO? 🚀
BNB is more than an exchange token. It is the native asset of the BNB Chain ecosystem, connecting Binance-related utility, blockchain transactions, decentralized finance (DeFi), and a growing Web3 infrastructure.
But the big question for investors is this: Can BNB reclaim its all-time high, move toward $1,500, or even reach $2,000 in a future bull market?
Let's examine BNB's history, tokenomics, team influence, future developments, and important price levels for holders.
1. BNB's Historical Journey: From $0.10 to a Major Crypto Asset
BNB launched in July 2017 through Binance's initial coin offering (ICO), with an initial total supply of 200 million tokens. Its original role was to provide utility within the Binance ecosystem, including trading-fee discounts.
Over time, BNB expanded beyond the exchange and became the native asset of BNB Chain.
Major historical milestones:
2017 — Launch: BNB entered the market at an ICO price equivalent to approximately $0.10 per token, establishing its original exchange-utility model.2019 — Blockchain expansion: BNB Chain's mainnet launched, and BNB migrated from Ethereum to Binance's own blockchain ecosystem.2021 — Bull-market expansion: Growing crypto adoption, Binance's popularity, DeFi activity, and speculative demand helped BNB experience a major price rally.2022 — Market stress: The wider crypto downturn and concerns surrounding centralized crypto platforms increased volatility and investor uncertainty.2023–2024 — Regulatory and leadership changes: Binance faced significant regulatory challenges, while the exchange worked through leadership and compliance changes.2025 — New price milestone: BNB reached a new all-time high, with market-data providers recording a peak around $1,370.October 2026 — Supply reduction continues: BNB Chain announced its 37th quarterly token burn, removing approximately 1.646 million BNB from supply.
Historical performance demonstrates BNB's ability to grow substantially, but it also shows that even established cryptocurrencies can experience deep corrections.
2. The Binance Team: Why Leadership Matters
BNB's future is closely connected to the execution of Binance and the development of BNB Chain, although BNB is not a share in Binance and does not give holders a claim on company profits.
Three factors deserve particular attention:
Changpeng Zhao (CZ): Binance's founder played an important role in building the exchange's original ecosystem and expanding BNB's utility. His public statements and involvement can influence investor sentiment, but community enthusiasm alone cannot guarantee sustainable price appreciation.
Richard Teng and Binance's leadership: Richard Teng succeeded CZ as Binance CEO in November 2023. Leadership's ability to maintain regulatory compliance, strengthen institutional relationships, protect users, and expand global access can influence confidence in the wider Binance ecosystem.
BNB Chain's developers and ecosystem teams: Their work on network speed, reliability, lower transaction costs, security, and developer adoption is crucial. A stronger blockchain ecosystem can create more practical reasons to use BNB beyond speculation.
How can the team affect BNB's price?
Positive developments could include successful technical upgrades, more decentralized applications, growing stablecoin activity, institutional adoption, and clearer regulatory conditions.
Negative developments could include security incidents, regulatory restrictions, weak ecosystem growth, technical failures, or a loss of confidence in Binance.
The important distinction is that strong leadership can support adoption, but the market ultimately determines BNB's price.
3. Token Burns: A Major Part of BNB Tokenomics
BNB started with a supply of 200 million tokens. Its burn mechanisms are designed to reduce the supply toward a long-term target of 100 million BNB.
According to BNB Chain's announcement on October 19, 2026, the 37th quarterly burn removed:
BNB burned: 1,646,196.44Approximate announced value: $1.197 billionRemaining total supply reported: 131,512,085 BNB
BNB uses quarterly Auto-Burns, real-time gas-fee burns, and the Pioneer Burn Program.
Why does this matter?
If available supply decreases while demand remains strong or increases, the resulting scarcity can support the price. However, a burn does not automatically cause a rally. The actual effect depends on demand, market liquidity, investor expectations, and broader economic conditions.
For holders, it is more useful to monitor the number of tokens burned, the remaining supply, and actual network usage than to focus only on the dollar value attached to a burn announcement.
4. BNB Chain's Technology and Future Growth
BNB Chain's development roadmap for the second half of 2026 emphasizes higher throughput, faster execution, network stability, and infrastructure for applications involving AI agents, payments, and other Web3 use cases.
These improvements could strengthen BNB's long-term investment case if they lead to measurable adoption.
Investors should monitor:
Growth in active users and transactions.DeFi total value locked and decentralized exchange volume.Stablecoin activity and real-world asset applications.Developer activity and successful new applications.Network security, reliability, and competitive positioning.Whether technical improvements translate into sustainable demand for BNB.
A roadmap is not the same as a delivered product. Holders should distinguish completed upgrades from future targets and assess whether the ecosystem is generating meaningful economic activity.
5. BNB Price Outlook: What Should Holders Watch?
Recent market-data snapshots around October 22–23, 2026, place BNB approximately in the $730–$750 region. Its recorded all-time high is around $1,370, although the exact figure varies slightly across exchanges and data providers.
The following levels are scenario-based reference points, not verified technical support or resistance levels.
Important price milestones
$700–$750 — Current reference zone
This is the approximate area of recent trading. Holders should watch whether BNB maintains this region during market weakness and whether buyers return with meaningful volume.
$800 — First upside milestone
A sustained move above $800 could improve short-term sentiment. A brief move above this level without strong volume would be less convincing.
$1,000 — Major psychological milestone
Reaching $1,000 would require BNB to rise approximately 33%–37% from the recent $730–$750 reference range. A sustained breakout would likely require broader crypto-market strength and continued BNB demand.
$1,200 — Higher recovery target
This level would represent a stronger recovery toward the previous peak. Investors should watch whether buying activity supports the move rather than assuming price will rise simply because supply is decreasing.
$1,370 — Previous all-time-high area
Reclaiming the previous peak would be an important milestone. A convincing breakout above it would require fresh demand and could open the door to price discovery.
$1,500–$1,800 — Speculative bullish scenario
These are possible future scenario levels, not confirmed targets. Reaching them would require strong market conditions, sustained ecosystem growth, continued investor demand, and a successful move beyond the previous high.
$2,000 — Long-term, high-risk scenario
BNB reaching $2,000 would be a significant move from current levels. It should be treated as an ambitious possibility rather than a base-case forecast. Market capitalization, competing networks, liquidity, regulation, and the overall crypto cycle would all matter.
6. Bearish Scenario: What If BNB Falls?
Professional analysis must consider the downside as well.
If BNB loses the recent trading region and broader market conditions deteriorate, lower price areas such as $650 or $600 could become scenario levels to monitor. These are not confirmed support zones.
A sustained decline in Binance-related confidence, a sharp Bitcoin correction, weaker network activity, or adverse regulatory developments could place additional pressure on BNB.
Holders should decide in advance how much volatility they can tolerate. Avoid using borrowed money or investing funds needed for essential expenses.
7. What Is a Reasonable Holding Strategy for BNB Investors?
There is no single price at which every holder should sell. The right decision depends on entry price, investment horizon, financial needs, and risk tolerance.
A structured approach may help:
Long-term holders: Review network adoption, tokenomics, regulatory developments, and the investment thesis periodically.Short-term traders: Use confirmed price action, volume, and a predefined invalidation level instead of relying on predictions.Investors in profit: Consider taking partial profits at predetermined milestones while retaining an allocation consistent with their risk tolerance.Investors at a loss: Reassess the original investment thesis rather than holding indefinitely just to recover the entry price.New buyers: Consider staged entries rather than committing the entire amount at once, while remembering that averaging down can increase losses.
No holding period or price target guarantees a profit. Even high-quality crypto assets can decline sharply.
8. Final Verdict: Is BNB Worth Watching?
BNB has three important strengths: an established ecosystem, practical utility across exchange and blockchain services, and a continuing supply-reduction mechanism.
Its future opportunity depends on whether Binance maintains trust and regulatory access, whether BNB Chain delivers its technical roadmap, and whether real user demand grows faster than the market's expectations.
The bullish case is built on adoption, utility, supply reduction, and sustained demand—not token burns alone.
My key levels to watch: $800, $1,000, $1,200, and the previous high near $1,370. Above the previous high, $1,500–$1,800 becomes a speculative bullish scenario. On the downside, the $650–$600 region is worth monitoring if market conditions weaken.
The most important lesson for BNB holders is simple: follow the data, respect the downside, and never confuse a price target with a guarantee.
What do you think? Can $BNB reclaim $1,370 and move toward $1,500–$2,000 in the next major bull market, or will market risks limit its upside?
Share your view below. 👇
#bnb #BNBChain #CryptoAnalysis #CryptoMarket #altcoins
Research references
BNB Chain's [37th quarterly BNB burn announcement](https://www.bnbchain.org/en/blog/37th-bnb-burn?utm_source=chatgpt.com).BNB Chain's [second-half 2026 technology roadmap](https://www.bnbchain.org/en/blog/bnb-chain-h2-2026-tech-roadmap-doubling-down-on-speed?utm_source=chatgpt.com).Binance's [BNB Auto-Burn explanation](https://www.binance.com/en/academy/articles/what-is-bnb-auto-burn?utm_source=chatgpt.com).Binance's [BNB market and price page](https://www.binance.com/en/price/bnb?utm_source=chatgpt.com).Binance's [Richard Teng leadership biography](https://www.binance.com/en/square/post/389687653217?utm_source=chatgpt.com).
$BNB
$BNB ANALYSIS: HISTORY, BINANCE TEAM, TOKEN BURNS & PRICE TARGETS — HOW HIGH CAN BNB GO? 🚀
$BNB ANALYSIS: HISTORY, BINANCE TEAM, TOKEN BURNS & PRICE TARGETS — HOW HIGH CAN BNB GO? 🚀
BNB is more than an exchange token. It is the native asset of the BNB Chain ecosystem, connecting Binance-related utility, blockchain transactions, decentralized finance (DeFi), and a growing Web3 infrastructure.
But the big question for investors is this: Can BNB reclaim its all-time high, move toward $1,500, or even reach $2,000 in a future bull market?
Let's examine BNB's history, tokenomics, team influence, future developments, and important price levels for holders.
1. BNB's Historical Journey: From $0.10 to a Major Crypto Asset
BNB launched in July 2017 through Binance's initial coin offering (ICO), with an initial total supply of 200 million tokens. Its original role was to provide utility within the Binance ecosystem, including trading-fee discounts.
Over time, BNB expanded beyond the exchange and became the native asset of BNB Chain.
Major historical milestones:
2017 — Launch: BNB entered the market at an ICO price equivalent to approximately $0.10 per token, establishing its original exchange-utility model.2019 — Blockchain expansion: BNB Chain's mainnet launched, and BNB migrated from Ethereum to Binance's own blockchain ecosystem.2021 — Bull-market expansion: Growing crypto adoption, Binance's popularity, DeFi activity, and speculative demand helped BNB experience a major price rally.2022 — Market stress: The wider crypto downturn and concerns surrounding centralized crypto platforms increased volatility and investor uncertainty.2023–2024 — Regulatory and leadership changes: Binance faced significant regulatory challenges, while the exchange worked through leadership and compliance changes.2025 — New price milestone: BNB reached a new all-time high, with market-data providers recording a peak around $1,370.October 2026 — Supply reduction continues: BNB Chain announced its 37th quarterly token burn, removing approximately 1.646 million BNB from supply.
Historical performance demonstrates BNB's ability to grow substantially, but it also shows that even established cryptocurrencies can experience deep corrections.
2. The Binance Team: Why Leadership Matters
BNB's future is closely connected to the execution of Binance and the development of BNB Chain, although BNB is not a share in Binance and does not give holders a claim on company profits.
Three factors deserve particular attention:
Changpeng Zhao (CZ): Binance's founder played an important role in building the exchange's original ecosystem and expanding BNB's utility. His public statements and involvement can influence investor sentiment, but community enthusiasm alone cannot guarantee sustainable price appreciation.
Richard Teng and Binance's leadership: Richard Teng succeeded CZ as Binance CEO in November 2023. Leadership's ability to maintain regulatory compliance, strengthen institutional relationships, protect users, and expand global access can influence confidence in the wider Binance ecosystem.
BNB Chain's developers and ecosystem teams: Their work on network speed, reliability, lower transaction costs, security, and developer adoption is crucial. A stronger blockchain ecosystem can create more practical reasons to use BNB beyond speculation.
How can the team affect BNB's price?
Positive developments could include successful technical upgrades, more decentralized applications, growing stablecoin activity, institutional adoption, and clearer regulatory conditions.
Negative developments could include security incidents, regulatory restrictions, weak ecosystem growth, technical failures, or a loss of confidence in Binance.
The important distinction is that strong leadership can support adoption, but the market ultimately determines BNB's price.
3. Token Burns: A Major Part of BNB Tokenomics
BNB started with a supply of 200 million tokens. Its burn mechanisms are designed to reduce the supply toward a long-term target of 100 million BNB.
According to BNB Chain's announcement on October 19, 2026, the 37th quarterly burn removed:
BNB burned: 1,646,196.44Approximate announced value: $1.197 billionRemaining total supply reported: 131,512,085 BNB
BNB uses quarterly Auto-Burns, real-time gas-fee burns, and the Pioneer Burn Program.
Why does this matter?
If available supply decreases while demand remains strong or increases, the resulting scarcity can support the price. However, a burn does not automatically cause a rally. The actual effect depends on demand, market liquidity, investor expectations, and broader economic conditions.
For holders, it is more useful to monitor the number of tokens burned, the remaining supply, and actual network usage than to focus only on the dollar value attached to a burn announcement.
4. BNB Chain's Technology and Future Growth
BNB Chain's development roadmap for the second half of 2026 emphasizes higher throughput, faster execution, network stability, and infrastructure for applications involving AI agents, payments, and other Web3 use cases.
These improvements could strengthen BNB's long-term investment case if they lead to measurable adoption.
Investors should monitor:
Growth in active users and transactions.DeFi total value locked and decentralized exchange volume.Stablecoin activity and real-world asset applications.Developer activity and successful new applications.Network security, reliability, and competitive positioning.Whether technical improvements translate into sustainable demand for BNB.
A roadmap is not the same as a delivered product. Holders should distinguish completed upgrades from future targets and assess whether the ecosystem is generating meaningful economic activity.
5. BNB Price Outlook: What Should Holders Watch?
Recent market-data snapshots around October 22–23, 2026, place BNB approximately in the $730–$750 region. Its recorded all-time high is around $1,370, although the exact figure varies slightly across exchanges and data providers.
The following levels are scenario-based reference points, not verified technical support or resistance levels.
Important price milestones
$700–$750 — Current reference zone
This is the approximate area of recent trading. Holders should watch whether BNB maintains this region during market weakness and whether buyers return with meaningful volume.
$800 — First upside milestone
A sustained move above $800 could improve short-term sentiment. A brief move above this level without strong volume would be less convincing.
$1,000 — Major psychological milestone
Reaching $1,000 would require BNB to rise approximately 33%–37% from the recent $730–$750 reference range. A sustained breakout would likely require broader crypto-market strength and continued BNB demand.
$1,200 — Higher recovery target
This level would represent a stronger recovery toward the previous peak. Investors should watch whether buying activity supports the move rather than assuming price will rise simply because supply is decreasing.
$1,370 — Previous all-time-high area
Reclaiming the previous peak would be an important milestone. A convincing breakout above it would require fresh demand and could open the door to price discovery.
$1,500–$1,800 — Speculative bullish scenario
These are possible future scenario levels, not confirmed targets. Reaching them would require strong market conditions, sustained ecosystem growth, continued investor demand, and a successful move beyond the previous high.
$2,000 — Long-term, high-risk scenario
BNB reaching $2,000 would be a significant move from current levels. It should be treated as an ambitious possibility rather than a base-case forecast. Market capitalization, competing networks, liquidity, regulation, and the overall crypto cycle would all matter.
6. Bearish Scenario: What If BNB Falls?
Professional analysis must consider the downside as well.
If BNB loses the recent trading region and broader market conditions deteriorate, lower price areas such as $650 or $600 could become scenario levels to monitor. These are not confirmed support zones.
A sustained decline in Binance-related confidence, a sharp Bitcoin correction, weaker network activity, or adverse regulatory developments could place additional pressure on BNB.
Holders should decide in advance how much volatility they can tolerate. Avoid using borrowed money or investing funds needed for essential expenses.
7. What Is a Reasonable Holding Strategy for BNB Investors?
There is no single price at which every holder should sell. The right decision depends on entry price, investment horizon, financial needs, and risk tolerance.
A structured approach may help:
Long-term holders: Review network adoption, tokenomics, regulatory developments, and the investment thesis periodically.Short-term traders: Use confirmed price action, volume, and a predefined invalidation level instead of relying on predictions.Investors in profit: Consider taking partial profits at predetermined milestones while retaining an allocation consistent with their risk tolerance.Investors at a loss: Reassess the original investment thesis rather than holding indefinitely just to recover the entry price.New buyers: Consider staged entries rather than committing the entire amount at once, while remembering that averaging down can increase losses.
No holding period or price target guarantees a profit. Even high-quality crypto assets can decline sharply.
8. Final Verdict: Is BNB Worth Watching?
BNB has three important strengths: an established ecosystem, practical utility across exchange and blockchain services, and a continuing supply-reduction mechanism.
Its future opportunity depends on whether Binance maintains trust and regulatory access, whether BNB Chain delivers its technical roadmap, and whether real user demand grows faster than the market's expectations.
The bullish case is built on adoption, utility, supply reduction, and sustained demand—not token burns alone.
My key levels to watch: $800, $1,000, $1,200, and the previous high near $1,370. Above the previous high, $1,500–$1,800 becomes a speculative bullish scenario. On the downside, the $650–$600 region is worth monitoring if market conditions weaken.
The most important lesson for BNB holders is simple: follow the data, respect the downside, and never confuse a price target with a guarantee.
What do you think? Can $BNB reclaim $1,370 and move toward $1,500–$2,000 in the next major bull market, or will market risks limit its upside?
Share your view below. 👇
#bnb #BNBChain #CryptoAnalysis #CryptoMarket #altcoins
Research references
BNB Chain's 37th quarterly BNB burn announcement.BNB Chain's second-half 2026 technology roadmap.Binance's BNB Auto-Burn explanation.Binance's BNB market and price page.Binance's Richard Teng leadership biography.
$BNB
136
🟢 $XRP / USDT — LONG SETUP
Market Context:
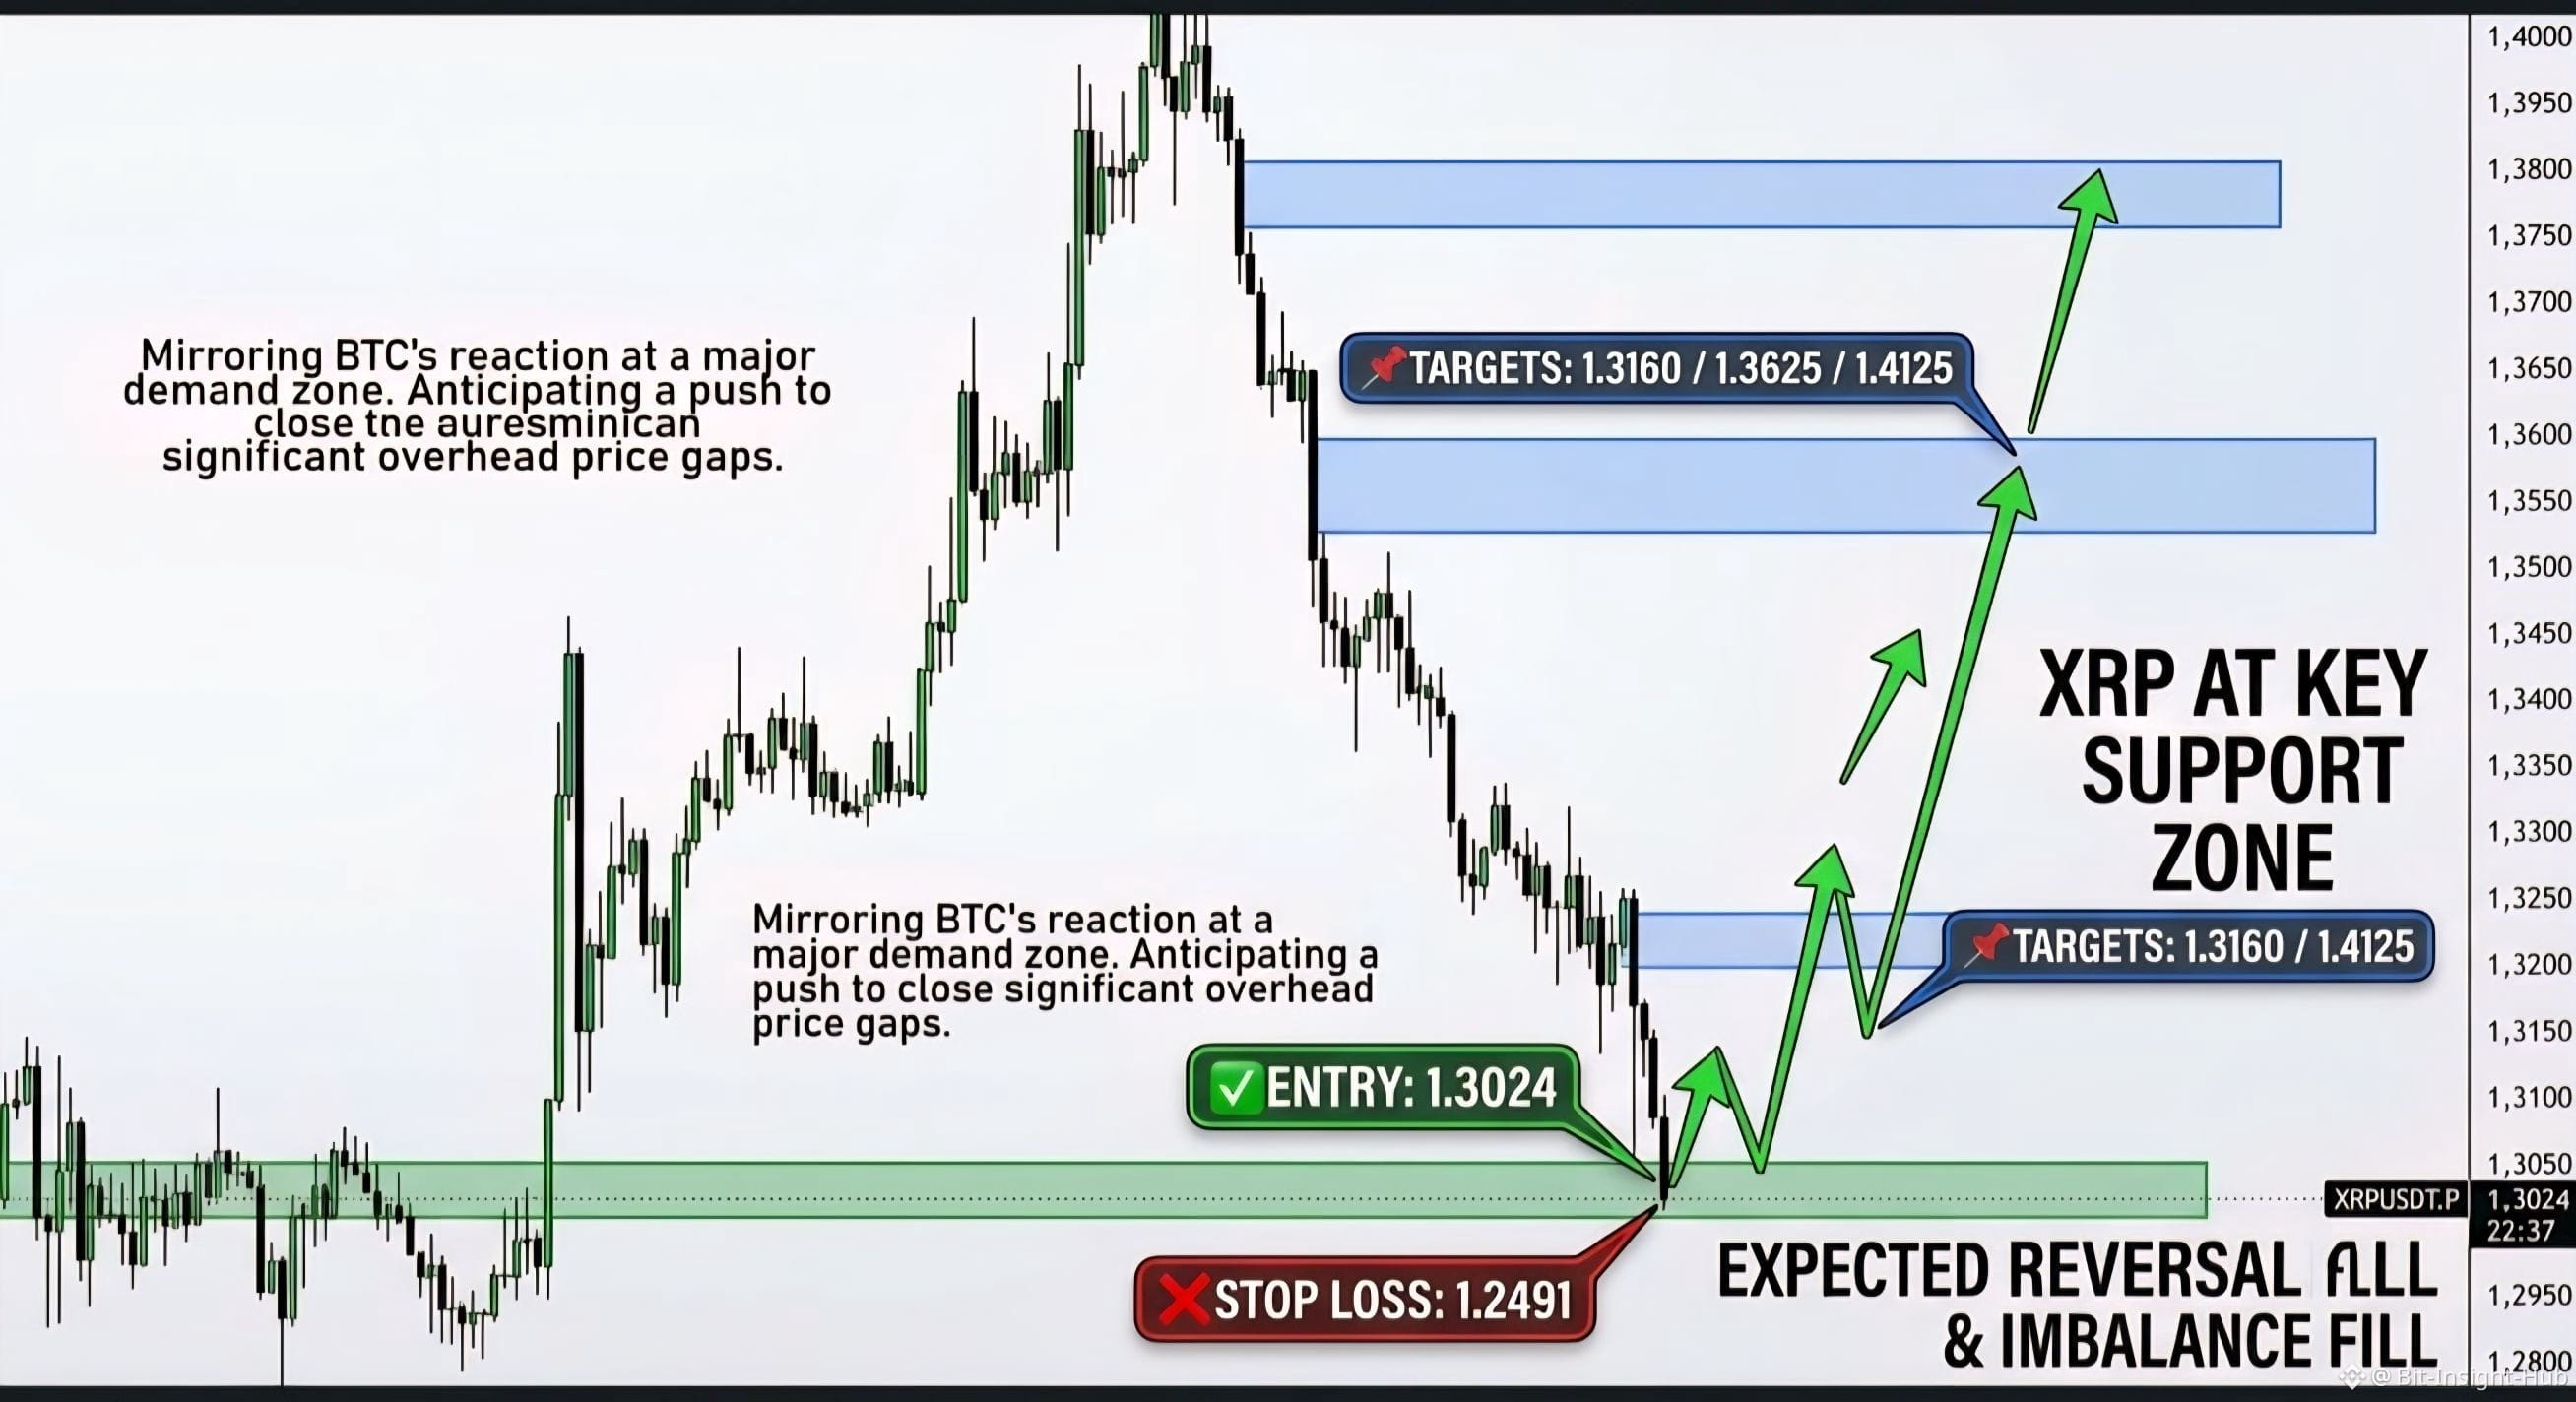
$XRP has swept local liquidity and tapped directly into a key higher-timeframe demand/support zone around 1.3000 – 1.3050. Similar to Bitcoin's structural reaction, we are anticipating a bullish reversal from this level to fill the fair value gaps (FVG) and overhead supply imbalances.
📌 Trade Parameters:
* Direction: Long 🟢
* Entry Zone: 1.3024
* Stop Loss: 1.2491 (-4.09%)
🎯 Take Profit Targets:
* TP1: 1.3160 (+1.04%)
* TP2: 1.3625 (+4.61%)
* TP3: 1.4125 (+8.45%)
⚖️ Risk / Reward Ratio: 2.07 (to TP3)
🧠 Technical Breakdown:
* Support Hold: Price respected the demand block at 1.3024, showing initial absorption of selling pressure.
* Imbalance Magnet: Significant sell-side imbalances (FVGs) remain unfilled between 1.3520 – 1.3800 and higher up toward 1.4100, acting as strong price magnets.
* Invalidation: A clean close below 1.2491 invalidates the bullish reversal structure.
⚠️ Risk Management Notice:
Use appropriate leverage (5x–10x recommended for futures) and manage risk strict to your capital rules. Always move Stop Loss to breakeven once TP1 is hit.
#xrp #CryptoTrading #BinanceSquare #TechnicalAnalysis #signals
Would you like me to adjust the risk-to-reward parameters or add specific leverage recommendations for this setup?
4
915
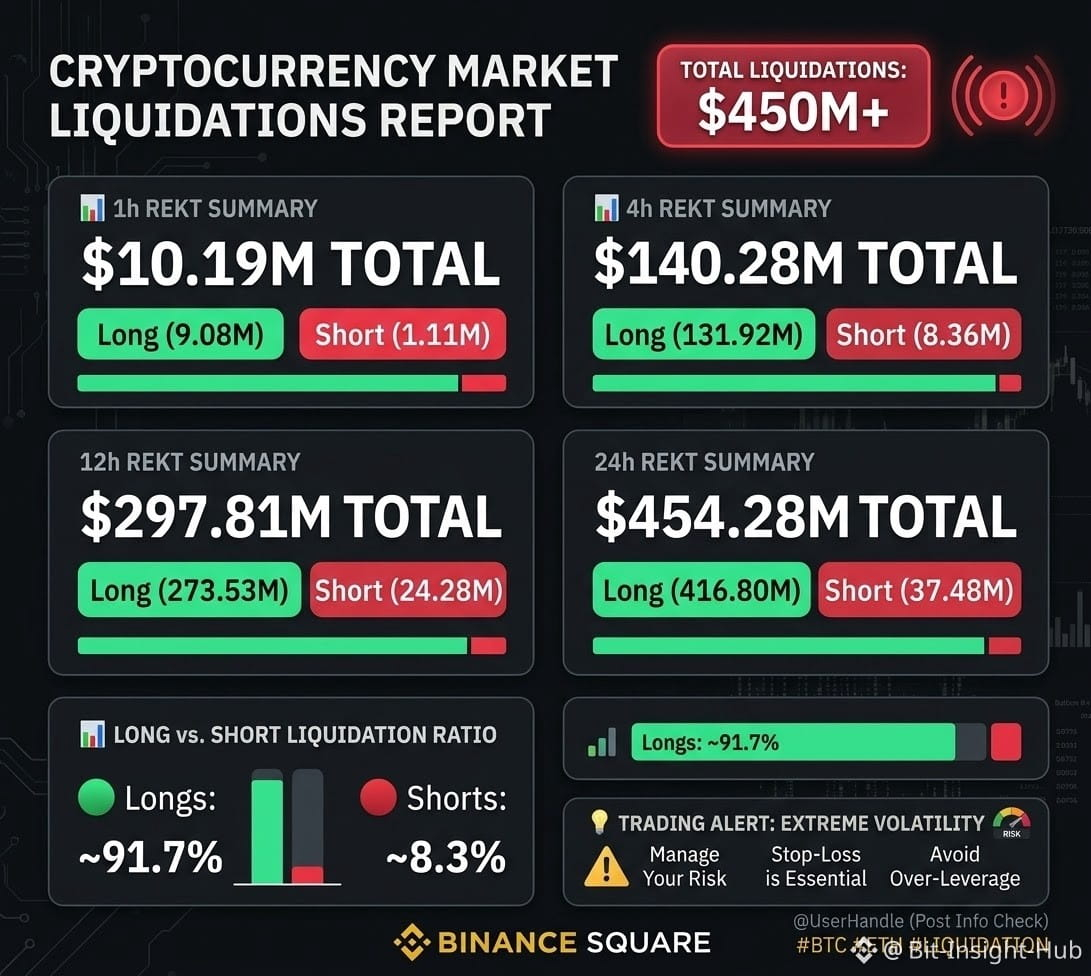
🚨 OVER $450 MILLION LIQUIDATED IN THE LAST 24 HOURS! 🚨
The crypto market just witnessed a massive flush, wiping out over $454 Million in leveraged positions within 24 hours! 📉🔥
Here is the complete breakdown of the liquidation data:
📊 24-Hour Overview:
* Total Liquidations: $454.28 Million
* 🟢 Longs Wiped Out: $416.80 Million (~91.7%)
* 🔴 Shorts Liquidated: $37.48 Million (~8.3%)
⏱️ Timeframe Breakdown:
* 1 Hour: $10.19M Total ($9.08M Longs / $1.11M Shorts)
* 4 Hours: $140.28M Total ($131.92M Longs / $8.36M Shorts)
* 12 Hours: $297.81M Total ($273.53M Longs / $24.28M Shorts)
💡 Key Takeaways & Market Insight:
Over 91% of the liquidated positions were bullish Longs, proving once again how dangerous high leverage can be during sharp market pullbacks. Late long entries got aggressive pain points as the market swept lower liquidity pools.
📌 Trading Advice:
* Avoid over-leveraging in volatile conditions.
* Always stick to strict Stop Loss (SL) risk management.
* Let the market settle before jumping back into leverage.
Are you buying this dip, or waiting for more clarity? Drop your thoughts below! 👇
#Crypto #Liquidations #Bitcoin #BinanceSquare #RiskManagement $BTC
226

Article
₿ SECURE YOUR FUTURE. STACK BITCOIN! 🚀₿ SECURE YOUR FUTURE. STACK BITCOIN! 🚀
Imagine selling an entire Bitcoin for less than the price of a house. Today, that thought makes people wonder: What could the next 10 years bring?
Bitcoin has taught the market one important lesson: opportunities often look insignificant before the world recognizes their value.
🏠 BITCOIN VS. REAL ESTATE: TWO DIFFERENT ASSETS
Real estate provides shelter, rental income, and tangible utility. Bitcoin offers a different proposition: a digitally scarce asset with a maximum supply of 21 million coins.
Unlike traditional currencies, Bitcoin's supply cannot simply be increased by a central bank. Its issuance follows a predetermined protocol, making scarcity a central part of its investment thesis.
₿ WHY PEOPLE STACK BITCOIN
🔹 Fixed supply: Bitcoin's maximum supply is capped at 21 million BTC under its current consensus rules.
🔹 Long-term perspective: Bitcoin has experienced multiple dramatic rallies and devastating drawdowns. Investors who focus only on short-term price movements may miss the bigger picture—or underestimate the risks.
🔹 Self-custody: Bitcoin can be held in a wallet controlled by its owner, provided the private keys are secured properly. Responsibility for security also rests with the holder.
🔹 Global accessibility: Bitcoin can be transferred across borders without relying on the traditional banking system for every transaction, although fees, regulations, and exchange restrictions still matter.
🔹 A different portfolio asset: Some investors use Bitcoin as a long-term speculative allocation, hoping its adoption and demand will grow over time.
📈 THE REAL STRATEGY: CONSISTENCY OVER FOMO
You don't need to buy one whole Bitcoin to participate. Bitcoin is divisible into 100 million satoshis per BTC.
Instead of chasing every pump, consider a disciplined approach:
✅ Invest only money you can afford to leave untouched for years.
✅ Consider small, regular purchases rather than trying to predict the perfect entry.
✅ Never borrow money or use leverage just to accumulate Bitcoin.
✅ Keep an emergency fund and handle high-interest debt first.
✅ Protect your wallet, never share your seed phrase, and beware of fake investment schemes.
⚠️ THE RISK NOBODY SHOULD IGNORE
Bitcoin is not a guaranteed path to wealth. Its price can fall sharply, remain depressed for extended periods, and potentially result in substantial or total loss. Past performance does not guarantee future returns.
The goal isn't to become rich overnight. It's to make informed decisions, manage risk, and avoid investing money needed for essential expenses.
🔥 THE BIG QUESTION
Years from now, will people look back at today's Bitcoin prices and say, "I wish I had started earlier"?
Nobody knows the future price of BTC. But one thing is clear: understanding an asset before investing is far more valuable than buying it because of hype.
Secure your future. Think long term. Stack responsibly. ₿
What do you think: Will Bitcoin become a major long-term store of value, or will its volatility remain its biggest obstacle?
👇 Share your opinion in the comments!
#Bitcoin #BTC走势分析 #crypto #Investing #BitcoinStrategy
₿ SECURE YOUR FUTURE. STACK BITCOIN! 🚀
₿ SECURE YOUR FUTURE. STACK BITCOIN! 🚀
Imagine selling an entire Bitcoin for less than the price of a house. Today, that thought makes people wonder: What could the next 10 years bring?
Bitcoin has taught the market one important lesson: opportunities often look insignificant before the world recognizes their value.
🏠 BITCOIN VS. REAL ESTATE: TWO DIFFERENT ASSETS
Real estate provides shelter, rental income, and tangible utility. Bitcoin offers a different proposition: a digitally scarce asset with a maximum supply of 21 million coins.
Unlike traditional currencies, Bitcoin's supply cannot simply be increased by a central bank. Its issuance follows a predetermined protocol, making scarcity a central part of its investment thesis.
₿ WHY PEOPLE STACK BITCOIN
🔹 Fixed supply: Bitcoin's maximum supply is capped at 21 million BTC under its current consensus rules.
🔹 Long-term perspective: Bitcoin has experienced multiple dramatic rallies and devastating drawdowns. Investors who focus only on short-term price movements may miss the bigger picture—or underestimate the risks.
🔹 Self-custody: Bitcoin can be held in a wallet controlled by its owner, provided the private keys are secured properly. Responsibility for security also rests with the holder.
🔹 Global accessibility: Bitcoin can be transferred across borders without relying on the traditional banking system for every transaction, although fees, regulations, and exchange restrictions still matter.
🔹 A different portfolio asset: Some investors use Bitcoin as a long-term speculative allocation, hoping its adoption and demand will grow over time.
📈 THE REAL STRATEGY: CONSISTENCY OVER FOMO
You don't need to buy one whole Bitcoin to participate. Bitcoin is divisible into 100 million satoshis per BTC.
Instead of chasing every pump, consider a disciplined approach:
✅ Invest only money you can afford to leave untouched for years.
✅ Consider small, regular purchases rather than trying to predict the perfect entry.
✅ Never borrow money or use leverage just to accumulate Bitcoin.
✅ Keep an emergency fund and handle high-interest debt first.
✅ Protect your wallet, never share your seed phrase, and beware of fake investment schemes.
⚠️ THE RISK NOBODY SHOULD IGNORE
Bitcoin is not a guaranteed path to wealth. Its price can fall sharply, remain depressed for extended periods, and potentially result in substantial or total loss. Past performance does not guarantee future returns.
The goal isn't to become rich overnight. It's to make informed decisions, manage risk, and avoid investing money needed for essential expenses.
🔥 THE BIG QUESTION
Years from now, will people look back at today's Bitcoin prices and say, "I wish I had started earlier"?
Nobody knows the future price of BTC. But one thing is clear: understanding an asset before investing is far more valuable than buying it because of hype.
Secure your future. Think long term. Stack responsibly. ₿
What do you think: Will Bitcoin become a major long-term store of value, or will its volatility remain its biggest obstacle?
👇 Share your opinion in the comments!
#Bitcoin #BTC走势分析 #crypto #Investing #BitcoinStrategy
161
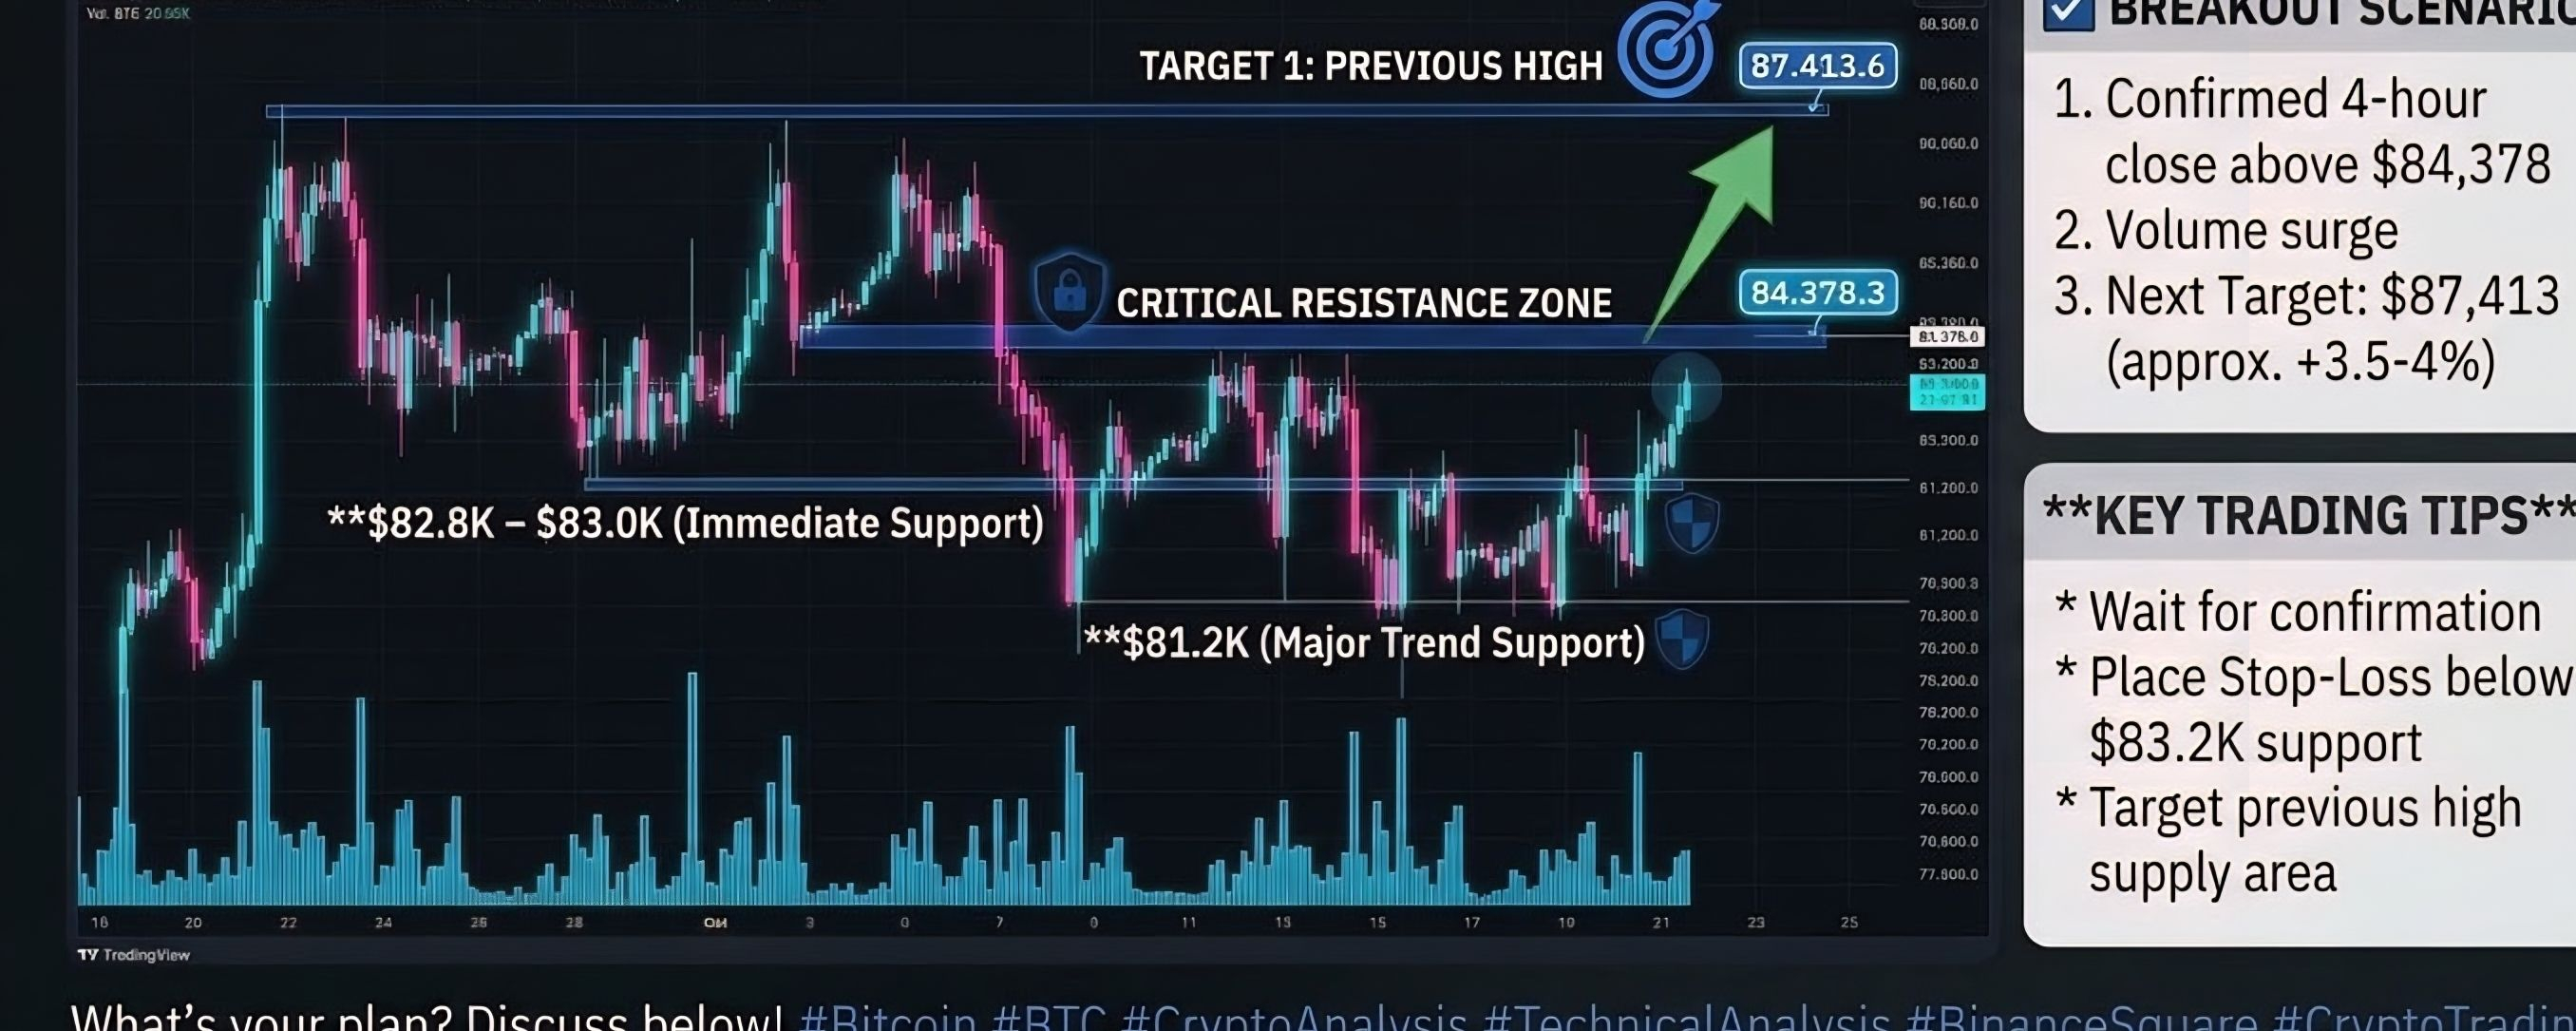
Article
🚀 $BTC Update: Critical Resistance Test Ahead — Is $87.4K Next?🚀 $BTC Update: Critical Resistance Test Ahead — Is $87.4K Next?
Bitcoin ($BTC) is approaching a crucial juncture on the 4-hour chart as price action pushes back into a major resistance zone.
📊 Technical Overview:
* Immediate Resistance ($84,378 – $84.4K Zone):
* $BTC is currently testing the local high near $84.38K (highlighted in the yellow circle).
* A clean 4-hour candle close above this level with strong volume will confirm a bullish breakout from the consolidation phase.
* Next Target ($87,413 – $87.4K Zone):
* If bulls successfully flip $84.4K into support, the path clears toward the previous swing high supply area around $87.4K.
* This represents a potential 3.5%–4% move from the breakout level.
* Key Support Levels:
* $82.8K – $83.0K: First line of defense on any short-term pullback.
* $81.2K: Major higher-low structure holding the current uptrend intact.
💡 Trading Strategy & Key Takeaways:
* Breakout Traders: Wait for a confirmed 4-hour close above $84,378 before entering long, targeting $87.4K.
* Risk Management: Always set tight stop-losses below local support (around $83.2K) to protect against false breakouts or sudden volatility spikes.
📌 What’s your plan? Are you betting on a clean breakout to $87.4K, or expecting a rejection back to $82K first? Drop your thoughts in the comments below! 👇
#bitcoin #BTC走势分析 #CryptoAnalysis #TechnicalAnalysis #BinanceSquare $BTC
🚀 $BTC Update: Critical Resistance Test Ahead — Is $87.4K Next?
🚀 $BTC Update: Critical Resistance Test Ahead — Is $87.4K Next?
Bitcoin ($BTC ) is approaching a crucial juncture on the 4-hour chart as price action pushes back into a major resistance zone.
📊 Technical Overview:
* Immediate Resistance ($84,378 – $84.4K Zone):
* $BTC is currently testing the local high near $84.38K (highlighted in the yellow circle).
* A clean 4-hour candle close above this level with strong volume will confirm a bullish breakout from the consolidation phase.
* Next Target ($87,413 – $87.4K Zone):
* If bulls successfully flip $84.4K into support, the path clears toward the previous swing high supply area around $87.4K.
* This represents a potential 3.5%–4% move from the breakout level.
* Key Support Levels:
* $82.8K – $83.0K: First line of defense on any short-term pullback.
* $81.2K: Major higher-low structure holding the current uptrend intact.
💡 Trading Strategy & Key Takeaways:
* Breakout Traders: Wait for a confirmed 4-hour close above $84,378 before entering long, targeting $87.4K.
* Risk Management: Always set tight stop-losses below local support (around $83.2K) to protect against false breakouts or sudden volatility spikes.
📌 What’s your plan? Are you betting on a clean breakout to $87.4K, or expecting a rejection back to $82K first? Drop your thoughts in the comments below! 👇
#bitcoin #BTC走势分析 #CryptoAnalysis #TechnicalAnalysis #BinanceSquare $BTC
1
516
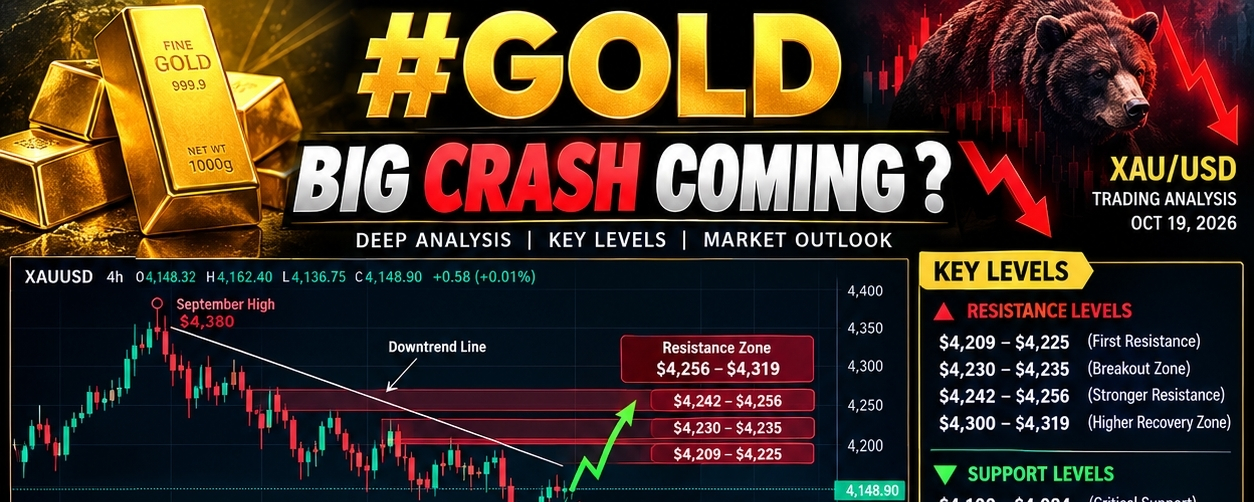
Article
GOLD ⚠️ BIG CRASH COMING? 📉 | XAU/USD DEEP ANALYSIS#GOLD ⚠️ BIG CRASH COMING? 📉 | XAU/USD DEEP ANALYSIS
🚨 GOLD IS AT A CRITICAL TURNING POINT — WILL SELLERS TAKE CONTROL AGAIN?
Gold traders, pay attention! After a sharp correction from September highs, GOLD is struggling to establish a convincing recovery. The big question is whether this is the beginning of another bearish leg or a temporary pullback before buyers return.
Let's break down the key levels, market fundamentals, and both possible scenarios. 👇
📊 1. MARKET STRUCTURE: BEARS HAVE AN ADVANTAGE
Gold has experienced a significant correction, with the price remaining below important resistance zones. Recent recovery attempts have not yet confirmed a sustained bullish reversal.
The short-term outlook remains cautious to bearish while sellers defend overhead resistance. However, momentum divergence suggests selling pressure could be losing strength, so a sudden recovery cannot be ruled out.
🔴 2. KEY SUPPORT LEVELS TO WATCH
Here are the important downside zones based on recent technical analysis:
• $4,100–$4,084: Critical support zone
• $4,080–$4,070: Next potential support
• $4,060–$4,040: Further downside area
• $4,010–$3,995: Major psychological support zone
• $3,950: Deeper bearish extension scenario
⚠️ These are technical zones to monitor, not guaranteed targets. A confirmed breakdown below support, followed by a failed retest, would strengthen the bearish case.
🟢 3. BULLISH RECOVERY LEVELS
Buyers still have an opportunity to change the short-term outlook.
• $4,209–$4,225: First major resistance
• $4,230–$4,235: Important breakout zone
• $4,242–$4,256: Stronger resistance area
• $4,300–$4,319: Higher recovery zone if bullish momentum strengthens
A sustained breakout above these levels could invalidate the immediate bearish setup and open the door to a stronger recovery.
🌎 4. WHY IS GOLD UNDER PRESSURE?
Three major factors deserve attention:
🔹 US Dollar: A stronger dollar makes gold more expensive for holders of other currencies and can reduce demand.
🔹 Treasury Yields: Higher yields increase the opportunity cost of holding gold, which does not pay interest.
🔹 Federal Reserve Expectations: If inflation remains persistent and markets expect tighter monetary policy, gold could face additional selling pressure.
However, gold also benefits from safe-haven demand, central-bank purchases, and uncertainty about global economic conditions. These forces could limit the downside.
📉 5. MY TWO SCENARIOS FOR GOLD
BEARISH SCENARIO 🐻
If GOLD loses $4,084–$4,100 decisively and fails to reclaim that zone, sellers could target $4,070, followed by $4,040–$4,060. Further weakness could bring $4,000 into focus.
BULLISH SCENARIO 🐂
If buyers defend the support zone and reclaim $4,209–$4,235, bearish momentum could weaken. A sustained break above $4,256 would provide stronger evidence that a recovery is developing.
🎯 MY FINAL VERDICT
The possibility of another gold sell-off is real, but calling a massive crash before support breaks would be premature.
For now, I am watching the $4,084–$4,100 zone very closely. A confirmed breakdown could create further downside opportunities, while a strong recovery above resistance could trap late sellers.
💬 WHAT DO YOU THINK?
Will GOLD crash toward $4,000, or will buyers defend support and push the price back above $4,235?
Comment your analysis below! 👇
🔔 Follow BitInsightHub for more market analysis and trading setups.
#GOLD #XAUUSD #goldanalysis #trading #MarketOutlook $XAUT
GOLD ⚠️ BIG CRASH COMING? 📉 | XAU/USD DEEP ANALYSIS
#GOLD ⚠️ BIG CRASH COMING? 📉 | XAU/USD DEEP ANALYSIS
🚨 GOLD IS AT A CRITICAL TURNING POINT — WILL SELLERS TAKE CONTROL AGAIN?
Gold traders, pay attention! After a sharp correction from September highs, GOLD is struggling to establish a convincing recovery. The big question is whether this is the beginning of another bearish leg or a temporary pullback before buyers return.
Let's break down the key levels, market fundamentals, and both possible scenarios. 👇
📊 1. MARKET STRUCTURE: BEARS HAVE AN ADVANTAGE
Gold has experienced a significant correction, with the price remaining below important resistance zones. Recent recovery attempts have not yet confirmed a sustained bullish reversal.
The short-term outlook remains cautious to bearish while sellers defend overhead resistance. However, momentum divergence suggests selling pressure could be losing strength, so a sudden recovery cannot be ruled out.
🔴 2. KEY SUPPORT LEVELS TO WATCH
Here are the important downside zones based on recent technical analysis:
• $4,100–$4,084: Critical support zone
• $4,080–$4,070: Next potential support
• $4,060–$4,040: Further downside area
• $4,010–$3,995: Major psychological support zone
• $3,950: Deeper bearish extension scenario
⚠️ These are technical zones to monitor, not guaranteed targets. A confirmed breakdown below support, followed by a failed retest, would strengthen the bearish case.
🟢 3. BULLISH RECOVERY LEVELS
Buyers still have an opportunity to change the short-term outlook.
• $4,209–$4,225: First major resistance
• $4,230–$4,235: Important breakout zone
• $4,242–$4,256: Stronger resistance area
• $4,300–$4,319: Higher recovery zone if bullish momentum strengthens
A sustained breakout above these levels could invalidate the immediate bearish setup and open the door to a stronger recovery.
🌎 4. WHY IS GOLD UNDER PRESSURE?
Three major factors deserve attention:
🔹 US Dollar: A stronger dollar makes gold more expensive for holders of other currencies and can reduce demand.
🔹 Treasury Yields: Higher yields increase the opportunity cost of holding gold, which does not pay interest.
🔹 Federal Reserve Expectations: If inflation remains persistent and markets expect tighter monetary policy, gold could face additional selling pressure.
However, gold also benefits from safe-haven demand, central-bank purchases, and uncertainty about global economic conditions. These forces could limit the downside.
📉 5. MY TWO SCENARIOS FOR GOLD
BEARISH SCENARIO 🐻
If GOLD loses $4,084–$4,100 decisively and fails to reclaim that zone, sellers could target $4,070, followed by $4,040–$4,060. Further weakness could bring $4,000 into focus.
BULLISH SCENARIO 🐂
If buyers defend the support zone and reclaim $4,209–$4,235, bearish momentum could weaken. A sustained break above $4,256 would provide stronger evidence that a recovery is developing.
🎯 MY FINAL VERDICT
The possibility of another gold sell-off is real, but calling a massive crash before support breaks would be premature.
For now, I am watching the $4,084–$4,100 zone very closely. A confirmed breakdown could create further downside opportunities, while a strong recovery above resistance could trap late sellers.
💬 WHAT DO YOU THINK?
Will GOLD crash toward $4,000, or will buyers defend support and push the price back above $4,235?
Comment your analysis below! 👇
🔔 Follow BitInsightHub for more market analysis and trading setups.
#GOLD #XAUUSD #goldanalysis #trading #MarketOutlook $XAUT
463
$ETH LONG SETUP 🔥
Pair: ETH/USDT (Binance) Timeframe: 1H Entry | 4H Confirmation
ETH is testing a major ascending trendline around $2364. Bulls have defended this level before, making it a high-probability bounce zone if support holds.
Trade Setup
Entry: $2362 – $2368
Take Profit 1: $2395
Take Profit 2: $2425
Take Profit 3: $2450
Stop Loss: $2336
Invalidation ❌
INVALID IF 4H CANDLE CLOSES BELOW THE ASCENDING TRENDLINE.
Trade Idea
Trendline support is being retested.
Risk-to-reward is favorable (around 1:2.5).
A reclaim above $2380 could accelerate momentum toward $2425+.
#ETH #signaladvisor #Signal🚥. #Signal. #signalsfutures $ETH
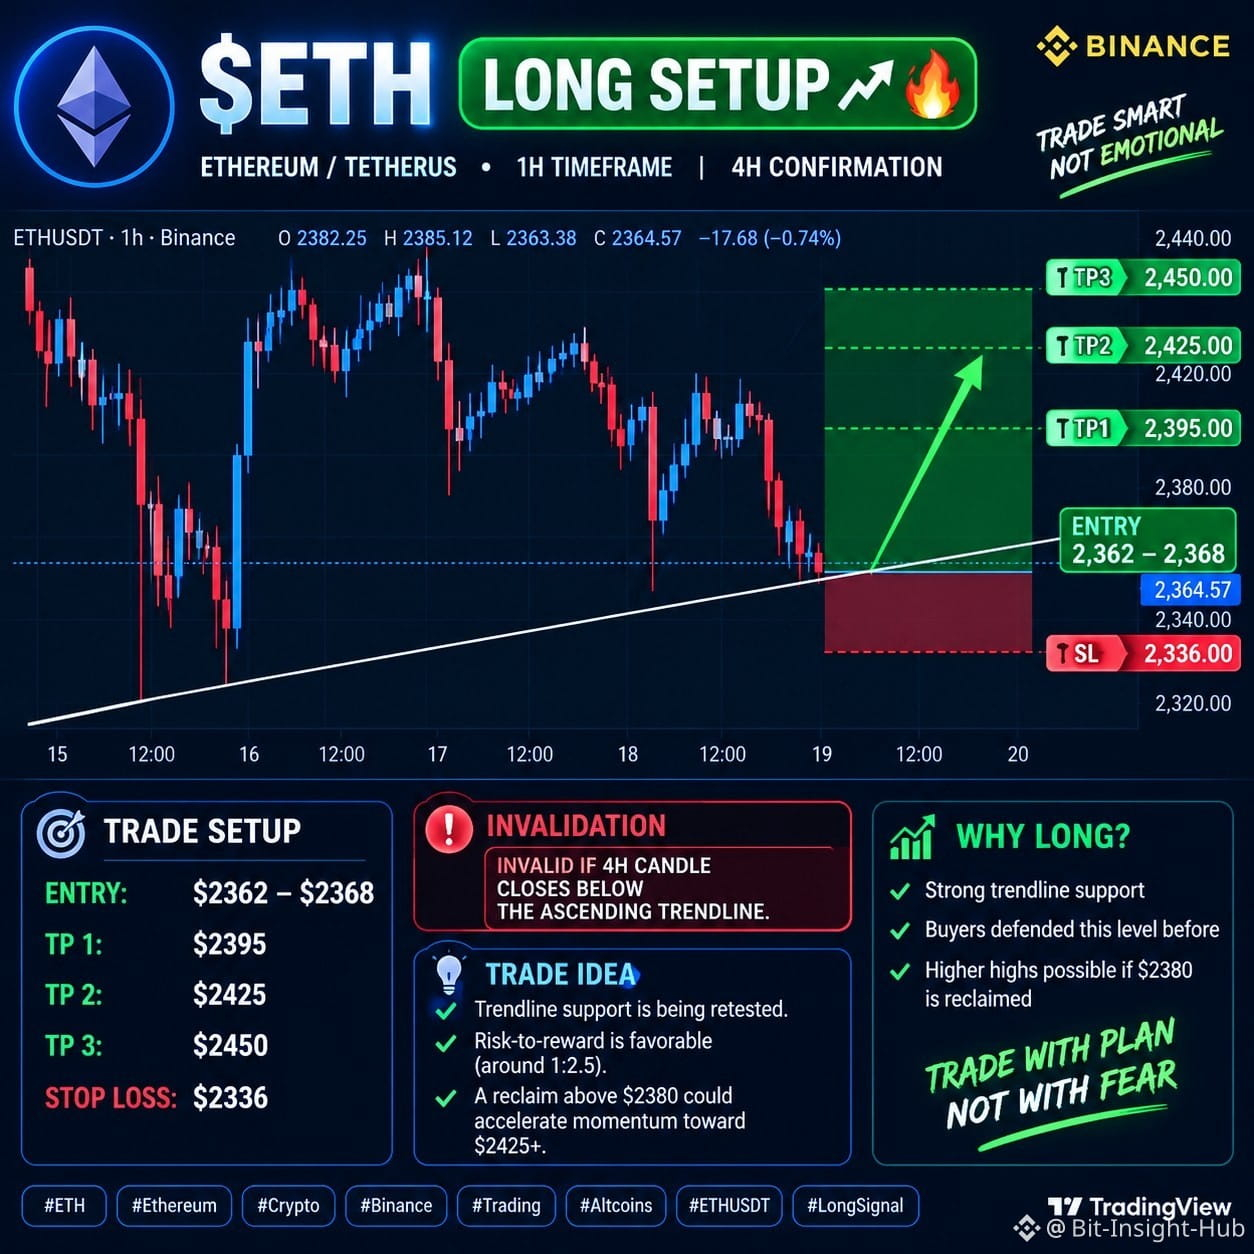
2
695
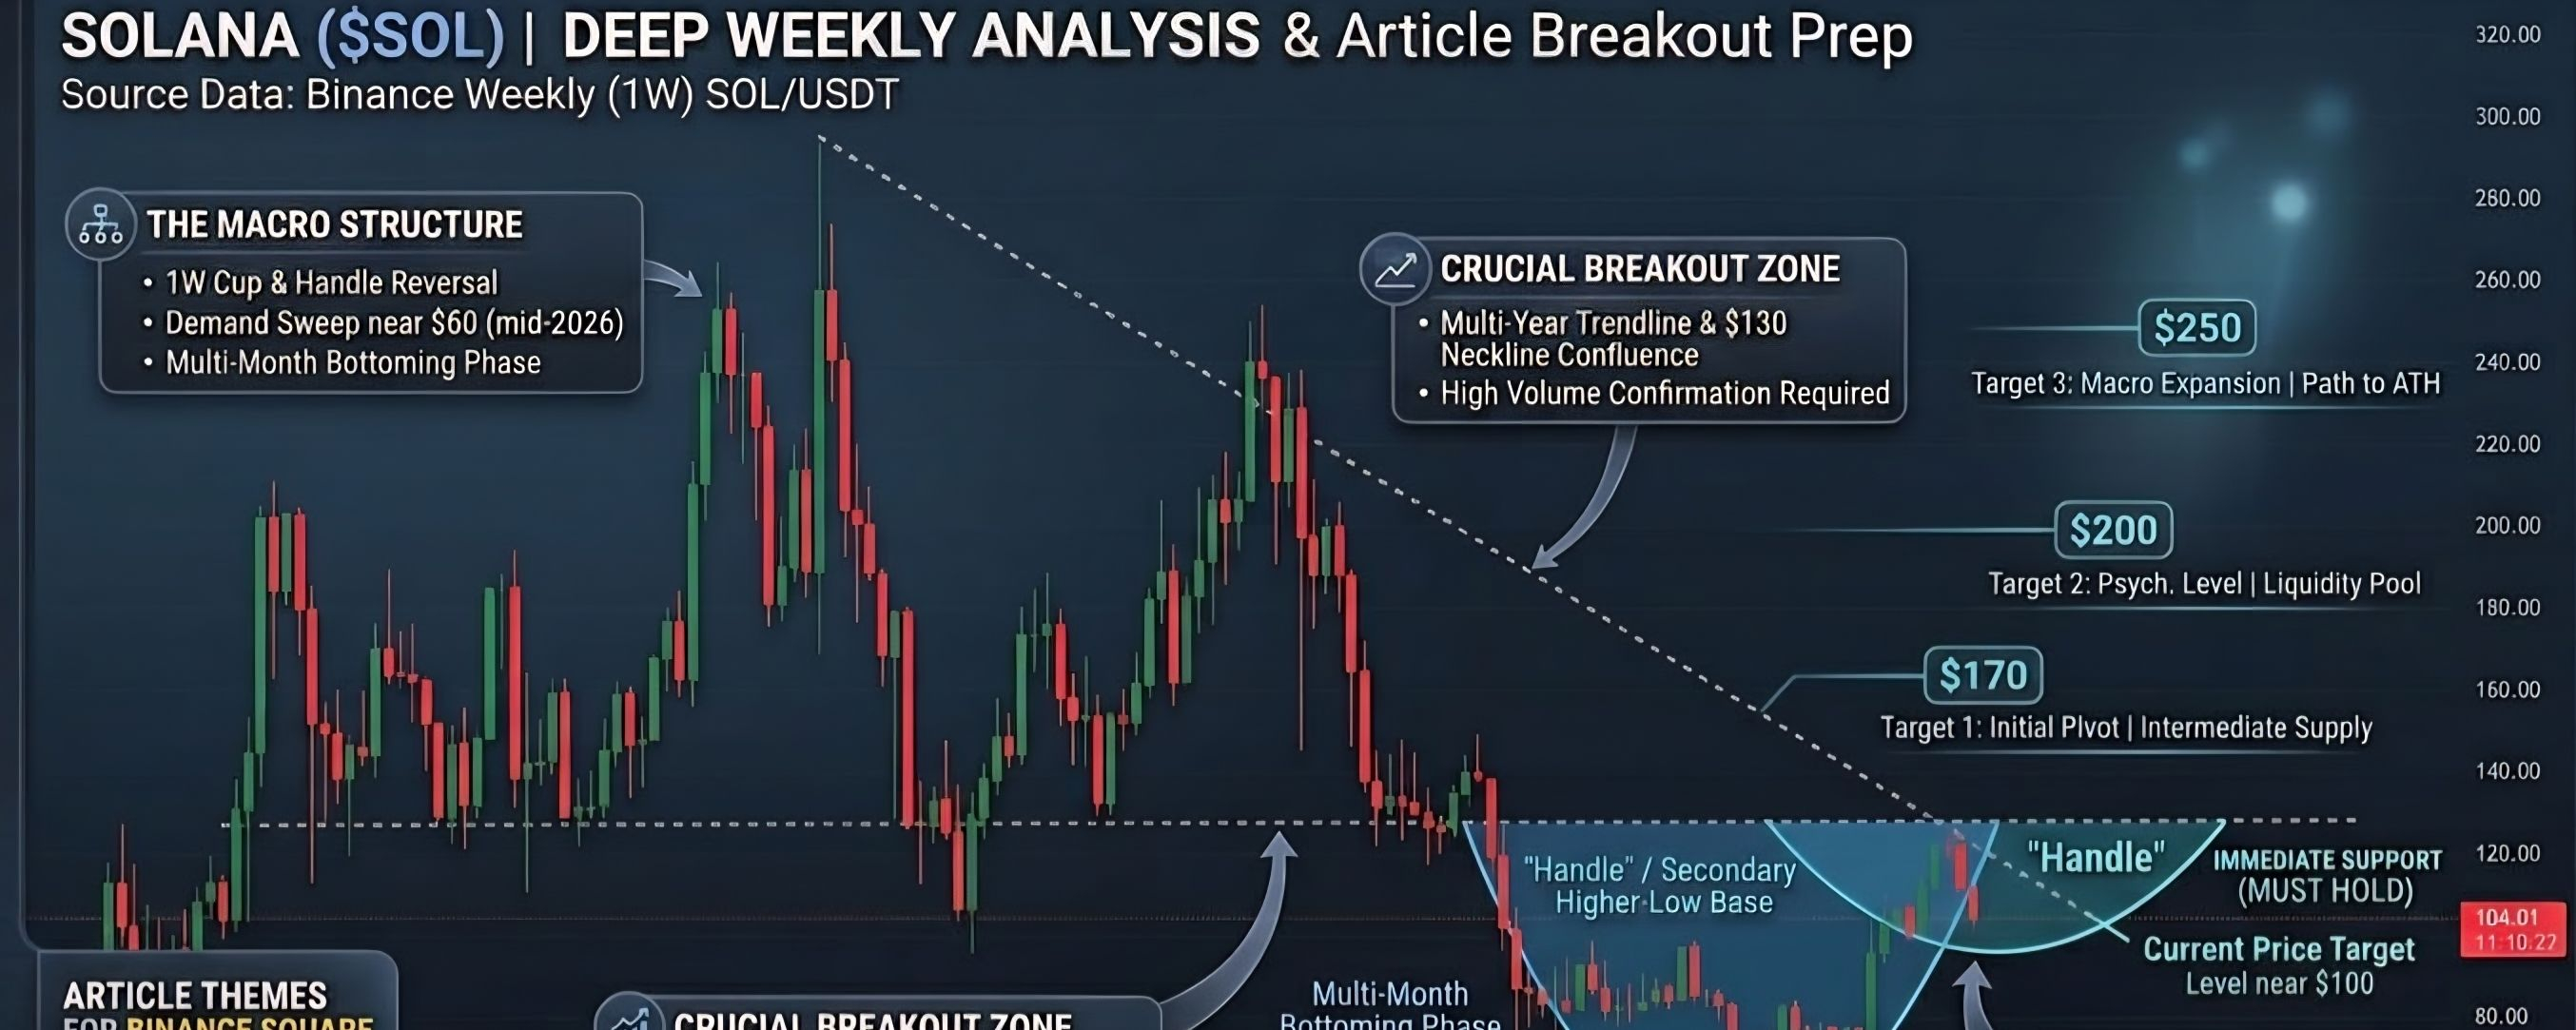
Article
🚀 $SOL Preparing for a Massive Breakout? Cup & Handle Target Set at $250! 📈🚀 $SOL Preparing for a Massive Breakout? Cup & Handle Target Set at $250! 📈
Is Solana ($SOL) gearing up for its next major parabolic leg? A detailed analysis of the 1-Weekly Chart (Binance) reveals a massive structural setup currently unfolding.
📌 Key Technical Takeaways
1. The Macro Cup & Handle Formation
The Cup: Following its peak near $295 in early 2025, $SOL completed a macro rounding bottom from late 2025 through mid-2026, finding strong baseline demand in the $50–$60 zone before sweeping liquidity and staging a strong recovery.
The Handle: Right now, price action is constructing a secondary higher-low base (the "Handle") around the $100 – $104 region.
2. Multi-Year Trendline & Baseline Confluence
Resistance Boundary: A horizontal structural resistance near $130 coincides directly with the multi-year descending trendline coming down from the $295 ATH.
The Breakout Trigger: A strong weekly close above $128–$130 will officially validate the Cup & Handle pattern, opening the floodgates for momentum buyers.
🎯 Bullish Targets & Execution Levels
Once $SOL breaks out of the $130 confluence resistance, projected expansion targets are:
🎯 Target 1: $170 (Previous major swing-high & intermediate supply level)
🎯 Target 2: $200 (Psychological round number & liquidity pool)
🎯 Target 3: $250 (Macro expansion target leading toward ATHs)
🛡️ Support & Invalidation Levels
Immediate Support Zone: $97.50 – $100.00 (Crucial demand pocket)
Pattern Invalidation: A sustained weekly close below $85 breaks the handle structure and risks retesting deeper demand down near $65.
💡 Summary Strategy
$SOL is currently consolidating within a high-conviction base-building phase between $100 and $130. Watch for high spot volume and a clean weekly candle closure above $130 to confirm the move toward $170+!
💬 Community Poll: What's your outlook on $SOL?
🚀 Bullish - Breaking $130 soon and heading to $200+
🔄 Ranging - Staying stuck between $100 and $130 for now
📉 Bearish - Dropping back below $90
Let me know your thoughts and trade setups in the comments below! 👇
#solana #sol #BinanceSquare #cryptotrading #TechnicalAnalysis $SOL
(Disclaimer: This analysis is for educational purposes only and does not constitute financial advice. Always manage your risk and do your own research before placing trades.)
🚀 $SOL Preparing for a Massive Breakout? Cup & Handle Target Set at $250! 📈
🚀 $SOL Preparing for a Massive Breakout? Cup & Handle Target Set at $250! 📈
Is Solana ($SOL ) gearing up for its next major parabolic leg? A detailed analysis of the 1-Weekly Chart (Binance) reveals a massive structural setup currently unfolding.
📌 Key Technical Takeaways
1. The Macro Cup & Handle Formation
The Cup: Following its peak near $295 in early 2025, $SOL completed a macro rounding bottom from late 2025 through mid-2026, finding strong baseline demand in the $50–$60 zone before sweeping liquidity and staging a strong recovery.
The Handle: Right now, price action is constructing a secondary higher-low base (the "Handle") around the $100 – $104 region.
2. Multi-Year Trendline & Baseline Confluence
Resistance Boundary: A horizontal structural resistance near $130 coincides directly with the multi-year descending trendline coming down from the $295 ATH.
The Breakout Trigger: A strong weekly close above $128–$130 will officially validate the Cup & Handle pattern, opening the floodgates for momentum buyers.
🎯 Bullish Targets & Execution Levels
Once $SOL breaks out of the $130 confluence resistance, projected expansion targets are:
🎯 Target 1: $170 (Previous major swing-high & intermediate supply level)
🎯 Target 2: $200 (Psychological round number & liquidity pool)
🎯 Target 3: $250 (Macro expansion target leading toward ATHs)
🛡️ Support & Invalidation Levels
Immediate Support Zone: $97.50 – $100.00 (Crucial demand pocket)
Pattern Invalidation: A sustained weekly close below $85 breaks the handle structure and risks retesting deeper demand down near $65.
💡 Summary Strategy
$SOL is currently consolidating within a high-conviction base-building phase between $100 and $130. Watch for high spot volume and a clean weekly candle closure above $130 to confirm the move toward $170+!
💬 Community Poll: What's your outlook on $SOL ?
🚀 Bullish - Breaking $130 soon and heading to $200+
🔄 Ranging - Staying stuck between $100 and $130 for now
📉 Bearish - Dropping back below $90
Let me know your thoughts and trade setups in the comments below! 👇
#solana #sol #BinanceSquare #cryptotrading #TechnicalAnalysis $SOL
(Disclaimer: This analysis is for educational purposes only and does not constitute financial advice. Always manage your risk and do your own research before placing trades.)
251
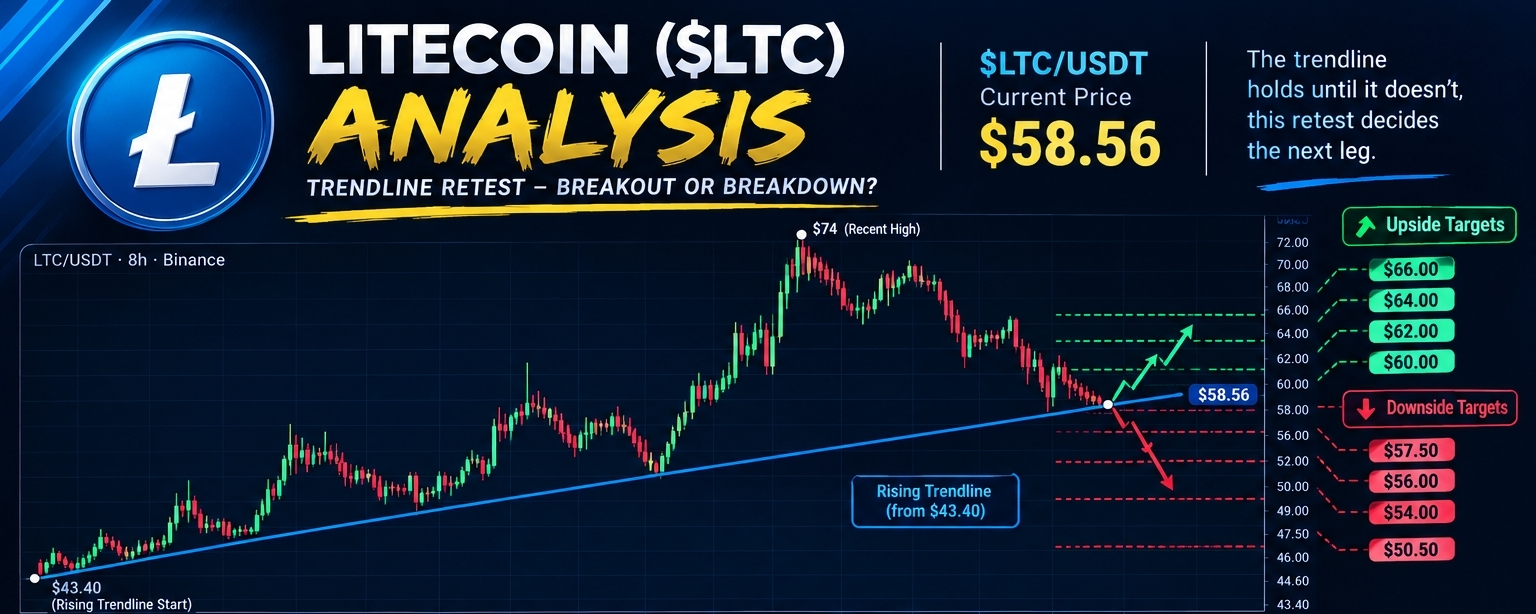
Article
🚨 **LITECOIN ($LTC) ANALYSIS: THE MOST IMPORTANT TRENDLINE TEST IS HERE! 📉📈**🚨 **LITECOIN ($LTC) ANALYSIS: THE MOST IMPORTANT TRENDLINE TEST IS HERE! 📉📈**
$LTC/USDT is trading around **$58.56**, and the 8-hour chart is showing a critical battle between buyers and sellers. After a strong rally from $43.40 toward $74, Litecoin has entered a correction phase, and price is now testing a major rising trendline that has supported the uptrend since August.
**Will buyers defend the trendline, or are we about to see another breakdown?** 👀
🔍 **1. MARKET STRUCTURE: WHAT DOES THE CHART TELL US?**
Looking at the 8H chart, Litecoin experienced a powerful rally from approximately $43.40, climbing above $50, $60, and eventually reaching the $73–$74 region.
However, sellers took control near the highs. Since then, price has formed lower highs and moved downward toward the rising trendline.
This tells us three important things:
• The broader rally created a significant ascending support structure.
• Short-term momentum has weakened as sellers continue to pressure price.
• The current trendline retest could determine whether buyers can preserve the bullish structure.
⚠️ Remember: An ascending trendline can provide support, but it is not a guarantee that price will bounce.
🔵 **2. THE RISING TRENDLINE: THE KEY BATTLE ZONE**
The blue trendline connects important swing lows beginning near $43.40. It has previously supported price during pullbacks, including the September correction.
On October 15, buyers defended the area with a sharp wick toward $57.20. Now, LTC is approaching the same region again, trading around $58.56.
Repeated tests of support can produce a bounce, but they can also weaken the level if buyers fail to respond strongly.
The next 8-hour candles are especially important. Watch for a strong rejection wick, a bullish recovery, and a reclaim of nearby resistance before assuming the trendline will hold.
🟢 **3. BULLISH SCENARIO — CAN LTC RECOVER $60?**
If buyers successfully defend the $57.50–$58.00 region and reclaim $60, the short-term outlook could improve.
🎯 **Key upside levels:**
• **$60.00:** First resistance and bullish reclaim level.
• **$62.00:** Next resistance and potential upside target.
• **$64.00:** A stronger recovery target if buying momentum continues.
• **$66.00:** An extended target if LTC breaks through $64 with sustained strength.
A move above $60 alone does not confirm a full trend reversal. Buyers would need to demonstrate continued strength through the $62 and $64 resistance zones.
📈 **Bullish confirmation:** A convincing 8H close above $60, followed by a successful retest, would strengthen the recovery scenario.
🔴 **4. BEARISH SCENARIO — WHAT IF $57.50 BREAKS?**
The downside risk increases if Litecoin loses the rising trendline and fails to recover it.
📉 **Key downside levels:**
• **$57.50:** Critical support threshold.
• **$56.00:** First potential downside target.
• **$54.00:** Next important support zone.
• **$50.50:** A deeper support area if selling pressure accelerates.
A brief wick below $57.50 is not necessarily a confirmed breakdown. Traders should watch for an 8-hour candle closing below support and whether price fails to reclaim the broken trendline.
If that happens, the bullish structure could weaken considerably, with $56 and $54 becoming important areas to monitor.
⚖️ **5. THE MOST IMPORTANT LEVELS TO WATCH**
🟢 Bullish trigger: Reclaim $60
🎯 Upside targets: $62 → $64 → $66
🔴 Bearish trigger: Confirmed breakdown below $57.50
🎯 Downside targets: $56 → $54 → $50.50
📌 Current price: Approximately $58.56
📌 Timeframe: 8-hour chart
📌 Main decision zone: $57.50–$60.00
These are technical reference levels based on the supplied chart, not guaranteed price destinations.
🧠 **6. MY FINAL MARKET VIEW**
Litecoin is sitting at a crucial point. The longer-term ascending trendline remains visible, but the recent sequence of lower highs shows that sellers currently have short-term momentum.
I would watch the reaction around $57.50–$58.00 before taking a directional view.
If buyers defend support and reclaim $60, a recovery toward $62–$64 becomes a reasonable scenario. However, if the trendline breaks decisively, the market could move toward $56 and $54.
**The key is confirmation, not prediction.** Let the 8H candle structure show which side is gaining control instead of entering based on the trendline alone.
💬 **YOUR TURN: What is your prediction for Litecoin?**
🚀 BULLISH — LTC bounces toward $62–$64
🐻 BEARISH — LTC breaks $57.50 and drops toward $54
⏳ WAIT — No trade until the breakout or breakdown is confirmed
Drop your view in the comments! 👇
⚠️ **Risk Disclaimer:** This analysis is for educational purposes only and is based on the chart and price levels provided. Cryptocurrency markets are volatile. Always manage risk and do your own research before trading.
#LTC #Litecoin #CryptoAnalysis #TechnicalAnalysis #BinanceSquare $LTC
🚨 **LITECOIN ($LTC) ANALYSIS: THE MOST IMPORTANT TRENDLINE TEST IS HERE! 📉📈**
🚨 **LITECOIN ($LTC ) ANALYSIS: THE MOST IMPORTANT TRENDLINE TEST IS HERE! 📉📈**
$LTC /USDT is trading around **$58.56**, and the 8-hour chart is showing a critical battle between buyers and sellers. After a strong rally from $43.40 toward $74, Litecoin has entered a correction phase, and price is now testing a major rising trendline that has supported the uptrend since August.
**Will buyers defend the trendline, or are we about to see another breakdown?** 👀
🔍 **1. MARKET STRUCTURE: WHAT DOES THE CHART TELL US?**
Looking at the 8H chart, Litecoin experienced a powerful rally from approximately $43.40, climbing above $50, $60, and eventually reaching the $73–$74 region.
However, sellers took control near the highs. Since then, price has formed lower highs and moved downward toward the rising trendline.
This tells us three important things:
• The broader rally created a significant ascending support structure.
• Short-term momentum has weakened as sellers continue to pressure price.
• The current trendline retest could determine whether buyers can preserve the bullish structure.
⚠️ Remember: An ascending trendline can provide support, but it is not a guarantee that price will bounce.
🔵 **2. THE RISING TRENDLINE: THE KEY BATTLE ZONE**
The blue trendline connects important swing lows beginning near $43.40. It has previously supported price during pullbacks, including the September correction.
On October 15, buyers defended the area with a sharp wick toward $57.20. Now, LTC is approaching the same region again, trading around $58.56.
Repeated tests of support can produce a bounce, but they can also weaken the level if buyers fail to respond strongly.
The next 8-hour candles are especially important. Watch for a strong rejection wick, a bullish recovery, and a reclaim of nearby resistance before assuming the trendline will hold.
🟢 **3. BULLISH SCENARIO — CAN LTC RECOVER $60?**
If buyers successfully defend the $57.50–$58.00 region and reclaim $60, the short-term outlook could improve.
🎯 **Key upside levels:**
• **$60.00:** First resistance and bullish reclaim level.
• **$62.00:** Next resistance and potential upside target.
• **$64.00:** A stronger recovery target if buying momentum continues.
• **$66.00:** An extended target if LTC breaks through $64 with sustained strength.
A move above $60 alone does not confirm a full trend reversal. Buyers would need to demonstrate continued strength through the $62 and $64 resistance zones.
📈 **Bullish confirmation:** A convincing 8H close above $60, followed by a successful retest, would strengthen the recovery scenario.
🔴 **4. BEARISH SCENARIO — WHAT IF $57.50 BREAKS?**
The downside risk increases if Litecoin loses the rising trendline and fails to recover it.
📉 **Key downside levels:**
• **$57.50:** Critical support threshold.
• **$56.00:** First potential downside target.
• **$54.00:** Next important support zone.
• **$50.50:** A deeper support area if selling pressure accelerates.
A brief wick below $57.50 is not necessarily a confirmed breakdown. Traders should watch for an 8-hour candle closing below support and whether price fails to reclaim the broken trendline.
If that happens, the bullish structure could weaken considerably, with $56 and $54 becoming important areas to monitor.
⚖️ **5. THE MOST IMPORTANT LEVELS TO WATCH**
🟢 Bullish trigger: Reclaim $60
🎯 Upside targets: $62 → $64 → $66
🔴 Bearish trigger: Confirmed breakdown below $57.50
🎯 Downside targets: $56 → $54 → $50.50
📌 Current price: Approximately $58.56
📌 Timeframe: 8-hour chart
📌 Main decision zone: $57.50–$60.00
These are technical reference levels based on the supplied chart, not guaranteed price destinations.
🧠 **6. MY FINAL MARKET VIEW**
Litecoin is sitting at a crucial point. The longer-term ascending trendline remains visible, but the recent sequence of lower highs shows that sellers currently have short-term momentum.
I would watch the reaction around $57.50–$58.00 before taking a directional view.
If buyers defend support and reclaim $60, a recovery toward $62–$64 becomes a reasonable scenario. However, if the trendline breaks decisively, the market could move toward $56 and $54.
**The key is confirmation, not prediction.** Let the 8H candle structure show which side is gaining control instead of entering based on the trendline alone.
💬 **YOUR TURN: What is your prediction for Litecoin?**
🚀 BULLISH — LTC bounces toward $62–$64
🐻 BEARISH — LTC breaks $57.50 and drops toward $54
⏳ WAIT — No trade until the breakout or breakdown is confirmed
Drop your view in the comments! 👇
⚠️ **Risk Disclaimer:** This analysis is for educational purposes only and is based on the chart and price levels provided. Cryptocurrency markets are volatile. Always manage risk and do your own research before trading.
#LTC #Litecoin #CryptoAnalysis #TechnicalAnalysis #BinanceSquare $LTC
278
Log in to explore more content
Join global crypto users on Binance Square
⚡️ Get latest and useful information about crypto.
💬 Trusted by the world’s largest crypto exchange.
👍 Discover real insights from verified creators.
Email / Phone number