

鸡父
918 Posts

鸡父
Report
Block User
接币安手续费合规8折 邀请码QWUG67GX 知乎同名/B站 鸡父大人
Open Trade

BTC Holder
Frequent Trader
2.4 Years
106 Following
28.1K+ Followers
26.3K+ Liked
Posts
Portfolio
All
Quotes
Videos
Live
PINNED
·
--
《Dad's Shady Spot Trading Plan》
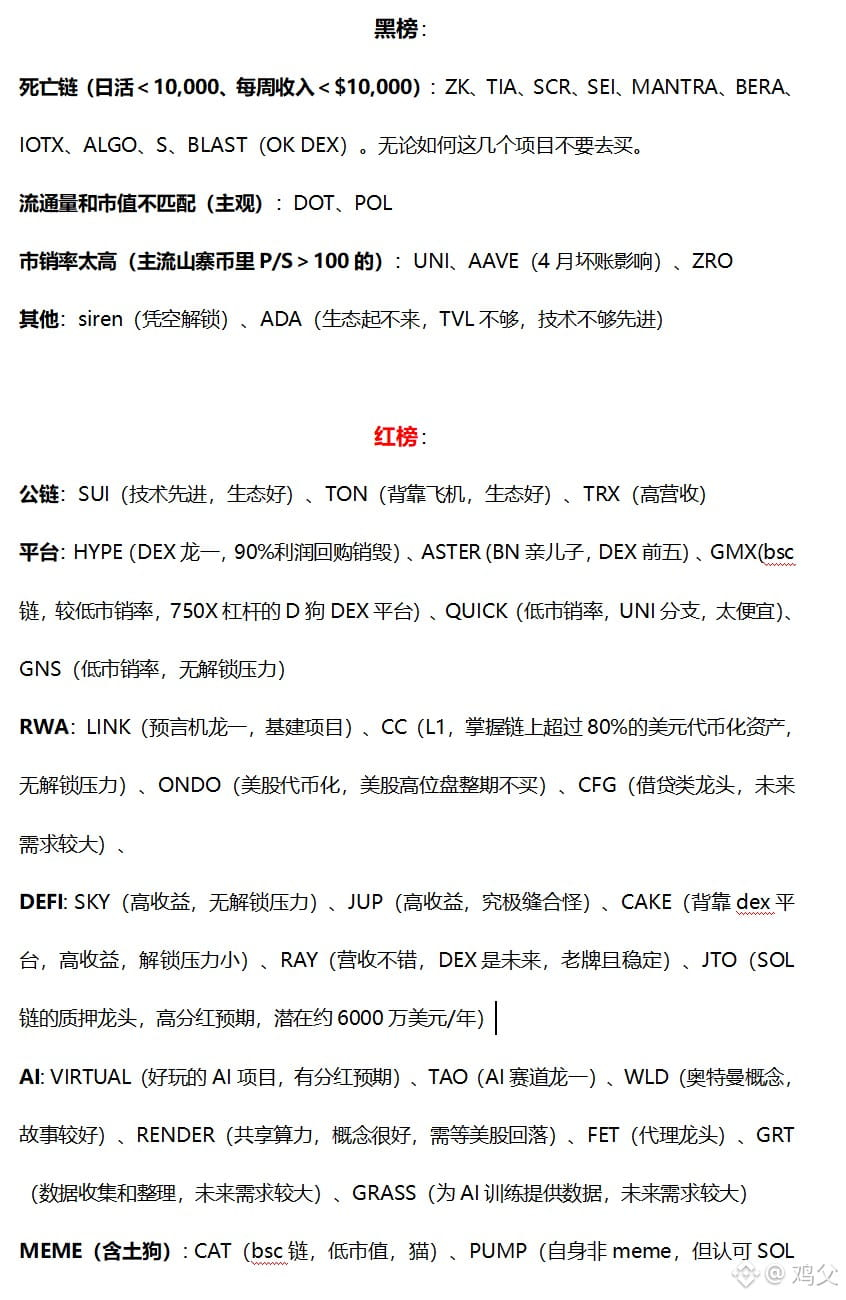
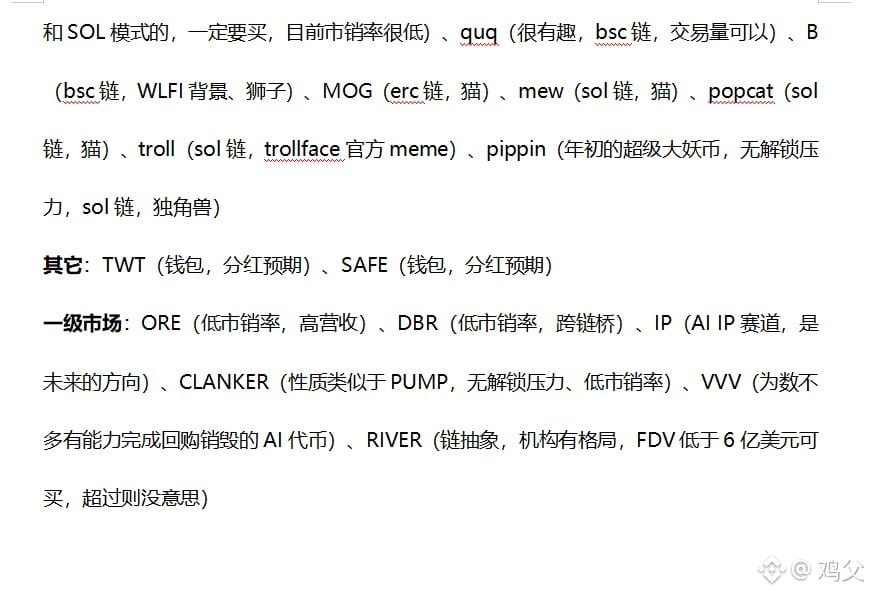
Check out the small image for specifics. Initially, I was going to write a detailed piece, but then I thought, if I write a few hundred words for every coin, first off, you guys won't have time to read it, and secondly, I won't have time to write it. Most importantly, since late April, I've been waiting for Bitcoin to pull back and break the previous low before executing my spot buying plan. Currently, $BTC has hit a low of 64000, close to breaking that previous low, so I’ll keep it relatively brief.
Summary:
1. I'm not too bullish on Ethereum's future, so I don't recommend coins too heavily tied to Ethereum (like $LDO , ENS, etc.). Sure, some projects are on the ERC chain, but coins that don't have a strong correlation with Ethereum itself (like Virtual) remain unaffected. Some tokens (like SAFE) have intricate ties with Ethereum, but the projects can completely detach from Ethereum in the future, so I’m listing those as well.
2. Investment has its phases. For instance, US stocks are still riding the AI wave, and tech stocks are relatively high, so bottom-fishing in 2026 shouldn't focus on the AI sector. The only exception is $VVV , which has revenue-generating capabilities and continues to buy back and burn tokens. For meme coins, aside from the early movers (the '土狗'), investing in memes should primarily be done in 2027; 2026 isn't a good year to invest heavily. As for platform tokens, aside from monsters like hype that use 90% of profits for buybacks and burns, most platform tokens should be focused on in 2028/29 since they typically surge during the final dance of a bull market. As a bonus, considering the high possibility of a DEX explosion in the next bull market, platform tokens in that cycle should mainly be DEX-related.
3. With institutions getting involved, the wealth-generating capability of memes may diminish, giving way to projects that can truly bring wealth effects. Among these, the clear revenue-generating capabilities lie within DeFi and exchanges, so investment should focus on these two sectors. Additionally, LINK’s income is actually decent, though the correlation between the token and the project is a bit weak.
《Dad's Shady Spot Trading Plan》
Check out the small image for specifics. Initially, I was going to write a detailed piece, but then I thought, if I write a few hundred words for every coin, first off, you guys won't have time to read it, and secondly, I won't have time to write it. Most importantly, since late April, I've been waiting for Bitcoin to pull back and break the previous low before executing my spot buying plan. Currently, $BTC has hit a low of 64000, close to breaking that previous low, so I’ll keep it relatively brief.
Summary:
1. I'm not too bullish on Ethereum's future, so I don't recommend coins too heavily tied to Ethereum (like $LDO , ENS, etc.). Sure, some projects are on the ERC chain, but coins that don't have a strong correlation with Ethereum itself (like Virtual) remain unaffected. Some tokens (like SAFE) have intricate ties with Ethereum, but the projects can completely detach from Ethereum in the future, so I’m listing those as well.
2. Investment has its phases. For instance, US stocks are still riding the AI wave, and tech stocks are relatively high, so bottom-fishing in 2026 shouldn't focus on the AI sector. The only exception is $VVV , which has revenue-generating capabilities and continues to buy back and burn tokens. For meme coins, aside from the early movers (the '土狗'), investing in memes should primarily be done in 2027; 2026 isn't a good year to invest heavily. As for platform tokens, aside from monsters like hype that use 90% of profits for buybacks and burns, most platform tokens should be focused on in 2028/29 since they typically surge during the final dance of a bull market. As a bonus, considering the high possibility of a DEX explosion in the next bull market, platform tokens in that cycle should mainly be DEX-related.
3. With institutions getting involved, the wealth-generating capability of memes may diminish, giving way to projects that can truly bring wealth effects. Among these, the clear revenue-generating capabilities lie within DeFi and exchanges, so investment should focus on these two sectors. Additionally, LINK’s income is actually decent, though the correlation between the token and the project is a bit weak.
Check out the small image for specifics. Initially, I was going to write a detailed piece, but then I thought, if I write a few hundred words for every coin, first off, you guys won't have time to read it, and secondly, I won't have time to write it. Most importantly, since late April, I've been waiting for Bitcoin to pull back and break the previous low before executing my spot buying plan. Currently, $BTC has hit a low of 64000, close to breaking that previous low, so I’ll keep it relatively brief.
Summary:
1. I'm not too bullish on Ethereum's future, so I don't recommend coins too heavily tied to Ethereum (like $LDO , ENS, etc.). Sure, some projects are on the ERC chain, but coins that don't have a strong correlation with Ethereum itself (like Virtual) remain unaffected. Some tokens (like SAFE) have intricate ties with Ethereum, but the projects can completely detach from Ethereum in the future, so I’m listing those as well.
2. Investment has its phases. For instance, US stocks are still riding the AI wave, and tech stocks are relatively high, so bottom-fishing in 2026 shouldn't focus on the AI sector. The only exception is $VVV , which has revenue-generating capabilities and continues to buy back and burn tokens. For meme coins, aside from the early movers (the '土狗'), investing in memes should primarily be done in 2027; 2026 isn't a good year to invest heavily. As for platform tokens, aside from monsters like hype that use 90% of profits for buybacks and burns, most platform tokens should be focused on in 2028/29 since they typically surge during the final dance of a bull market. As a bonus, considering the high possibility of a DEX explosion in the next bull market, platform tokens in that cycle should mainly be DEX-related.
3. With institutions getting involved, the wealth-generating capability of memes may diminish, giving way to projects that can truly bring wealth effects. Among these, the clear revenue-generating capabilities lie within DeFi and exchanges, so investment should focus on these two sectors. Additionally, LINK’s income is actually decent, though the correlation between the token and the project is a bit weak.
92
9
285
111.5k
PINNED
·
--

Article
What to buy in the next cycle?I still remember the losses I encountered when I first entered the circle, which I've mentioned a few times to everyone. Under the leadership of Wang from wb and someone named BTC Little Miner on Tieba (can't remember the exact name), I lost almost 90% of my funds on the coin $A . At that time, it was still called EOS.
But in fact, I am still quite grateful to them, after all, it was because of them that I got into the crypto world. On the night EOS was first launched, my account increased by 10%. Although my account has never returned to that high point since then, I still remember the excitement and joy at that moment. That feeling is one of the important reasons why I am willing to stay in this circle.
What to buy in the next cycle?
I still remember the losses I encountered when I first entered the circle, which I've mentioned a few times to everyone. Under the leadership of Wang from wb and someone named BTC Little Miner on Tieba (can't remember the exact name), I lost almost 90% of my funds on the coin $A . At that time, it was still called EOS.
But in fact, I am still quite grateful to them, after all, it was because of them that I got into the crypto world. On the night EOS was first launched, my account increased by 10%. Although my account has never returned to that high point since then, I still remember the excitement and joy at that moment. That feeling is one of the important reasons why I am willing to stay in this circle.
But in fact, I am still quite grateful to them, after all, it was because of them that I got into the crypto world. On the night EOS was first launched, my account increased by 10%. Although my account has never returned to that high point since then, I still remember the excitement and joy at that moment. That feeling is one of the important reasons why I am willing to stay in this circle.
16
4
65
19k
·
--
Crypto Market Monthly Analysis (09.30)
Summary:
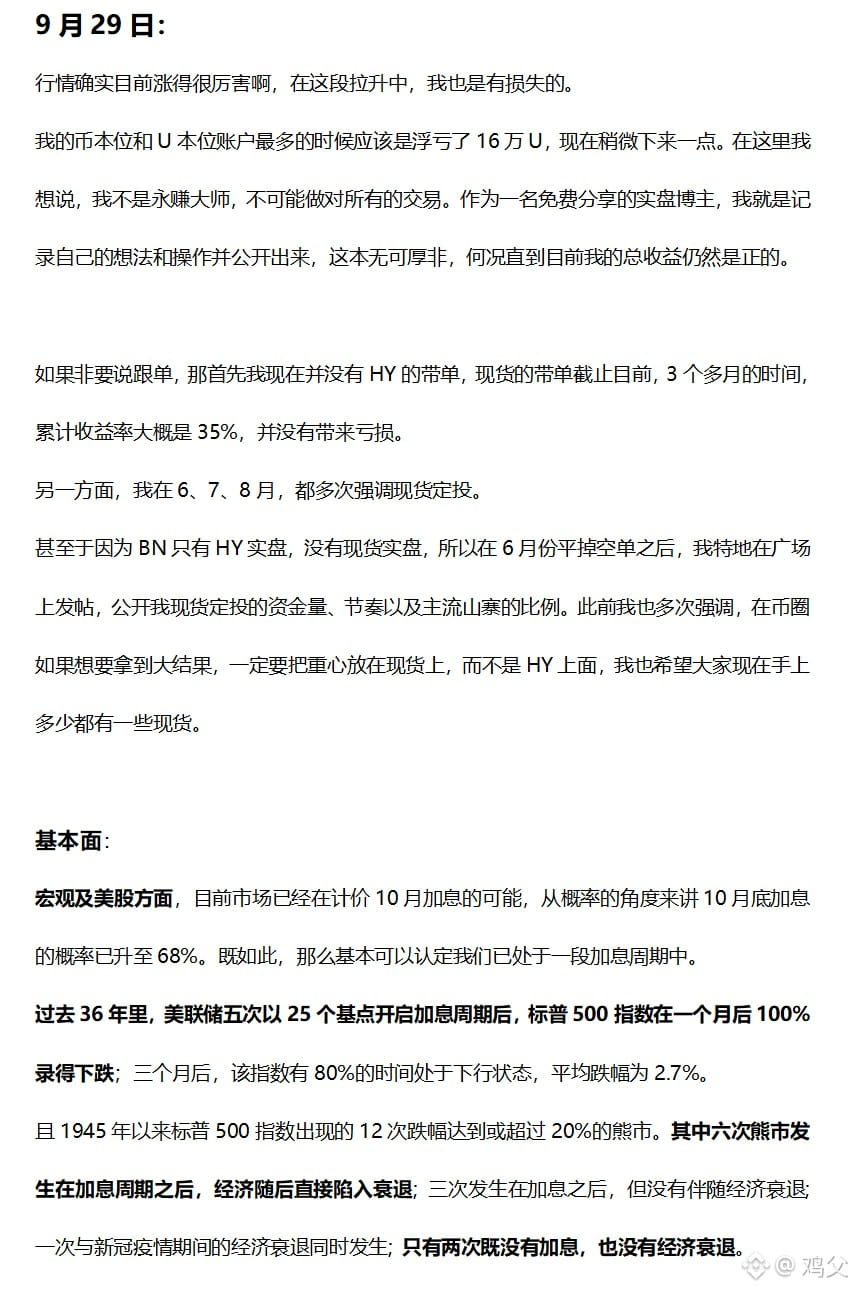
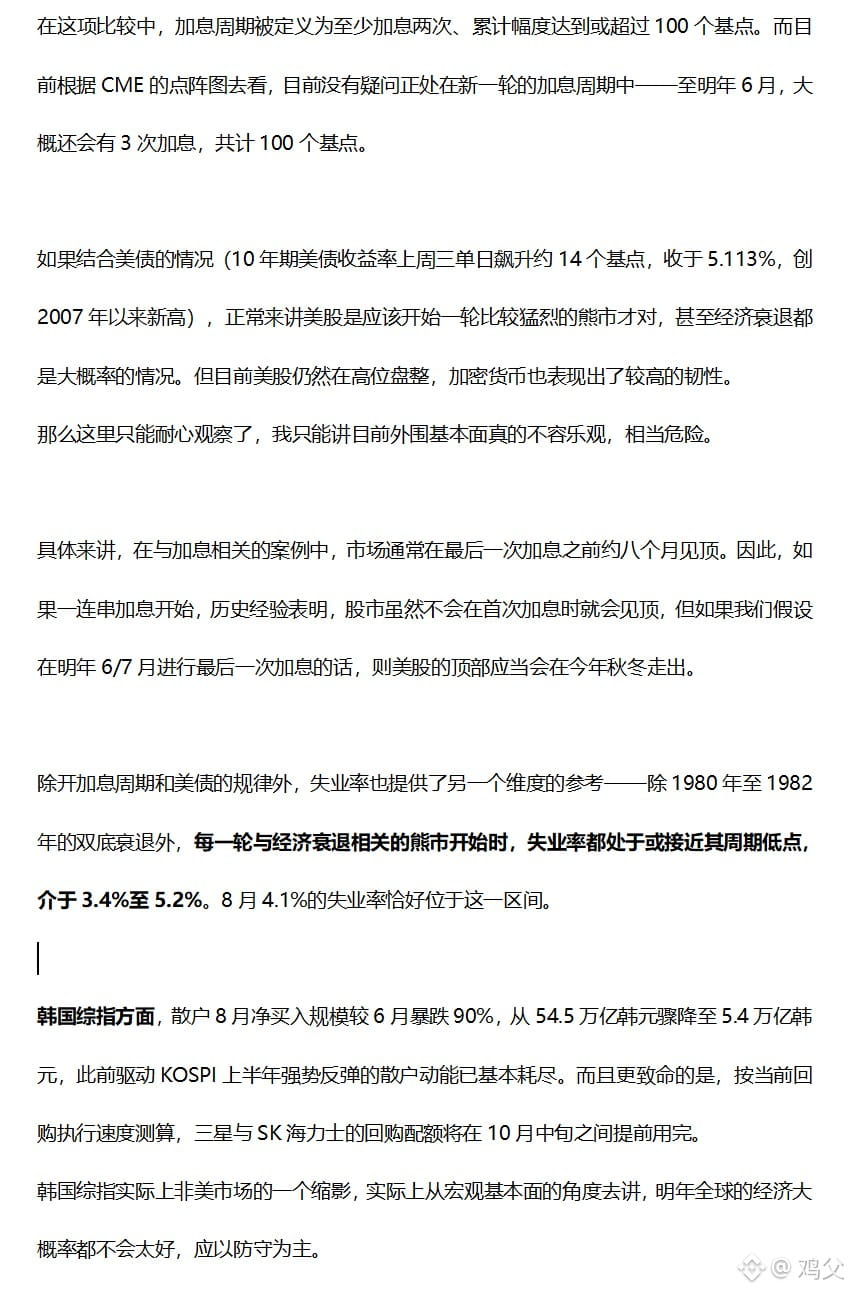
1. Under October rate hikes and the risk-asset price patterns during the rate-hike cycle.
2. U.S. Treasury liquidity extraction, with the unemployment rate at a cyclical low. The conditions for the U.S. stock market to top are almost already in place.
3. The Korean composite index that nobody cares about anymore.
4. Big BTC is very likely in the early stage of a bull market, but it’s still missing a daily-level pullback.
5. Be patient and wait for the first weekly-level “second buy” to emerge during the bull market.
6. The probability of making new lows is extremely low, but it’s still not recommended to use too much leverage—always watch out for downside.
Trading plan:
1) $BTC short position is being held; close the short at 69333 and open a long.
2) $ETH short position is being held; close the short at 2050 and open a long.
3) $SOL short position is being held; close the short at 90 and open a long.
4) Every month do DCA: 3wu worth of BTC and 1wu worth of SOL at month-end.
My main spot portfolio is currently in a “buy only, never sell” state. For the altcoin spot: half was sold on August 30th, and the other half was sold on September 29th—so my altcoin holdings are fully cleared right now.
My spot that I manage was created in June. In three months it only grew by about 35%, which is relatively low. But that’s also reasonable—altcoin booms usually concentrate in the latter half of the bull market, meaning from late 2027 through end of 2028, when altcoins will finally see a broad-based surge.
By then, it will be common to see gains of 10x or 20x. Before that, getting an overall doubling would already be pretty good.
As for time cycles: if the 4-year cycle truly doesn’t exist anymore, is that good news or bad news for retail investors? Specifically, if a bear market that normally takes a year only finishes in 8 months, then would a bull market that normally takes three years finish in two years? Or would the bull market extend to 3.5 years?
No one can say for sure. For the “coin hoarders,” that means days won’t be easy.
Similarly, the bull-market tops were: 2013 at 1240, 2017 at 19000, 2021 at 69000, and 2025 at 126000. The multiples were 15x, 3.6x, and 1.8x respectively—each cycle’s rally amplitude keeps shrinking. If we assume this cycle’s peak is 1.5 times the previous cycle’s peak, then the top of this bull market would be only 189000 (in reality, reaching 180k would already be quite difficult).
Then if the 4-year cycle still holds: if BTC reaches around 180k by 2029, what do you think the highs in 2028 and 2027 would be?
In short, try not to buy at the beginning-of-8 positions. Of course, DCA is a different logic.
Crypto Market Monthly Analysis (09.30)
Summary:
1. Under October rate hikes and the risk-asset price patterns during the rate-hike cycle.
2. U.S. Treasury liquidity extraction, with the unemployment rate at a cyclical low. The conditions for the U.S. stock market to top are almost already in place.
3. The Korean composite index that nobody cares about anymore.
4. Big BTC is very likely in the early stage of a bull market, but it’s still missing a daily-level pullback.
5. Be patient and wait for the first weekly-level “second buy” to emerge during the bull market.
6. The probability of making new lows is extremely low, but it’s still not recommended to use too much leverage—always watch out for downside.
Trading plan:
1) $BTC short position is being held; close the short at 69333 and open a long.
2) $ETH short position is being held; close the short at 2050 and open a long.
3) $SOL short position is being held; close the short at 90 and open a long.
4) Every month do DCA: 3wu worth of BTC and 1wu worth of SOL at month-end.
My main spot portfolio is currently in a “buy only, never sell” state. For the altcoin spot: half was sold on August 30th, and the other half was sold on September 29th—so my altcoin holdings are fully cleared right now.
My spot that I manage was created in June. In three months it only grew by about 35%, which is relatively low. But that’s also reasonable—altcoin booms usually concentrate in the latter half of the bull market, meaning from late 2027 through end of 2028, when altcoins will finally see a broad-based surge.
By then, it will be common to see gains of 10x or 20x. Before that, getting an overall doubling would already be pretty good.
As for time cycles: if the 4-year cycle truly doesn’t exist anymore, is that good news or bad news for retail investors? Specifically, if a bear market that normally takes a year only finishes in 8 months, then would a bull market that normally takes three years finish in two years? Or would the bull market extend to 3.5 years?
No one can say for sure. For the “coin hoarders,” that means days won’t be easy.
Similarly, the bull-market tops were: 2013 at 1240, 2017 at 19000, 2021 at 69000, and 2025 at 126000. The multiples were 15x, 3.6x, and 1.8x respectively—each cycle’s rally amplitude keeps shrinking. If we assume this cycle’s peak is 1.5 times the previous cycle’s peak, then the top of this bull market would be only 189000 (in reality, reaching 180k would already be quite difficult).
Then if the 4-year cycle still holds: if BTC reaches around 180k by 2029, what do you think the highs in 2028 and 2027 would be?
In short, try not to buy at the beginning-of-8 positions. Of course, DCA is a different logic.
Summary:
1. Under October rate hikes and the risk-asset price patterns during the rate-hike cycle.
2. U.S. Treasury liquidity extraction, with the unemployment rate at a cyclical low. The conditions for the U.S. stock market to top are almost already in place.
3. The Korean composite index that nobody cares about anymore.
4. Big BTC is very likely in the early stage of a bull market, but it’s still missing a daily-level pullback.
5. Be patient and wait for the first weekly-level “second buy” to emerge during the bull market.
6. The probability of making new lows is extremely low, but it’s still not recommended to use too much leverage—always watch out for downside.
Trading plan:
1) $BTC short position is being held; close the short at 69333 and open a long.
2) $ETH short position is being held; close the short at 2050 and open a long.
3) $SOL short position is being held; close the short at 90 and open a long.
4) Every month do DCA: 3wu worth of BTC and 1wu worth of SOL at month-end.
My main spot portfolio is currently in a “buy only, never sell” state. For the altcoin spot: half was sold on August 30th, and the other half was sold on September 29th—so my altcoin holdings are fully cleared right now.
My spot that I manage was created in June. In three months it only grew by about 35%, which is relatively low. But that’s also reasonable—altcoin booms usually concentrate in the latter half of the bull market, meaning from late 2027 through end of 2028, when altcoins will finally see a broad-based surge.
By then, it will be common to see gains of 10x or 20x. Before that, getting an overall doubling would already be pretty good.
As for time cycles: if the 4-year cycle truly doesn’t exist anymore, is that good news or bad news for retail investors? Specifically, if a bear market that normally takes a year only finishes in 8 months, then would a bull market that normally takes three years finish in two years? Or would the bull market extend to 3.5 years?
No one can say for sure. For the “coin hoarders,” that means days won’t be easy.
Similarly, the bull-market tops were: 2013 at 1240, 2017 at 19000, 2021 at 69000, and 2025 at 126000. The multiples were 15x, 3.6x, and 1.8x respectively—each cycle’s rally amplitude keeps shrinking. If we assume this cycle’s peak is 1.5 times the previous cycle’s peak, then the top of this bull market would be only 189000 (in reality, reaching 180k would already be quite difficult).
Then if the 4-year cycle still holds: if BTC reaches around 180k by 2029, what do you think the highs in 2028 and 2027 would be?
In short, try not to buy at the beginning-of-8 positions. Of course, DCA is a different logic.
19
55
20.8k
·
--
Verified
Crypto markets monthly chart breakdown (08.30)
Summary:
1. Spend a large section talking about US Treasuries
2. Signals that suggest the US stock market is relatively risky
3. Talk about gold
4. Spot DCA and holding short positions can run in parallel
5. The US stock market performance during the rate-hike cycle
On the actions:
1. Short position $BTC is still being held; take-profit at 56000;
2. Short position $ETH is still being held; take-profit at 1600;
3. Short position $SOL is still being held; take-profit at 65;
4. At the end of every month, DCA 3wu into the big pie and 1wu into SOL
First, I want to clarify: holding short positions and spot DCA are not contradictory. But whether the newly bought spot should be transferred into a coin-specific (coin-matching) account—I’ll consider it further.
Then, regarding my spot copy-trading: today I sold half of the position. The reason is that although the altcoin season index is still relatively low, the greed index is already very high—this is something I want to point out to everyone as well.
All in all, my short positions will most likely be held until the end of September. Here are a few reasons:
1. Historically, September has been the worst month for US stocks.
2. Since 1990, the S&P 500 has, in the period from August 18 to October 11 in midterm election years, experienced at least a 7% pullback every year except 2006. But 2006 already recorded a 9% drop in May to July in advance, so in a way it just shifted the adjustment earlier.
3. As mentioned earlier, the probability of the US resuming hikes on September 16 is over 50%.
4. On September 17, Japan is highly likely to raise rates as well. Historically, every time before Japan’s rate hike, the big pie officially starts to decline, and the drop has never been less than 20%.
So no matter what, I will at least hold the short positions until the end of September, but latest I shouldn’t hold them beyond mid-October.
BTW, 2027 might be a year where US stocks continue to trend bearish, while the big pie trades in a range but strengthens.
Also, there’s another thing: a while back I mentioned liking a video account’s group-broadcast host. Her name is Jiu Jiu. These days she just so happens to be competing in the month赛 in the live room of the Dream-Building Cup event. I hope everyone has time to go support her—she’s truly very hardworking.
Crypto markets monthly chart breakdown (08.30)
Summary:
1. Spend a large section talking about US Treasuries
2. Signals that suggest the US stock market is relatively risky
3. Talk about gold
4. Spot DCA and holding short positions can run in parallel
5. The US stock market performance during the rate-hike cycle
On the actions:
1. Short position $BTC is still being held; take-profit at 56000;
2. Short position $ETH is still being held; take-profit at 1600;
3. Short position $SOL is still being held; take-profit at 65;
4. At the end of every month, DCA 3wu into the big pie and 1wu into SOL
First, I want to clarify: holding short positions and spot DCA are not contradictory. But whether the newly bought spot should be transferred into a coin-specific (coin-matching) account—I’ll consider it further.
Then, regarding my spot copy-trading: today I sold half of the position. The reason is that although the altcoin season index is still relatively low, the greed index is already very high—this is something I want to point out to everyone as well.
All in all, my short positions will most likely be held until the end of September. Here are a few reasons:
1. Historically, September has been the worst month for US stocks.
2. Since 1990, the S&P 500 has, in the period from August 18 to October 11 in midterm election years, experienced at least a 7% pullback every year except 2006. But 2006 already recorded a 9% drop in May to July in advance, so in a way it just shifted the adjustment earlier.
3. As mentioned earlier, the probability of the US resuming hikes on September 16 is over 50%.
4. On September 17, Japan is highly likely to raise rates as well. Historically, every time before Japan’s rate hike, the big pie officially starts to decline, and the drop has never been less than 20%.
So no matter what, I will at least hold the short positions until the end of September, but latest I shouldn’t hold them beyond mid-October.
BTW, 2027 might be a year where US stocks continue to trend bearish, while the big pie trades in a range but strengthens.
Also, there’s another thing: a while back I mentioned liking a video account’s group-broadcast host. Her name is Jiu Jiu. These days she just so happens to be competing in the month赛 in the live room of the Dream-Building Cup event. I hope everyone has time to go support her—she’s truly very hardworking.
Summary:
1. Spend a large section talking about US Treasuries
2. Signals that suggest the US stock market is relatively risky
3. Talk about gold
4. Spot DCA and holding short positions can run in parallel
5. The US stock market performance during the rate-hike cycle
On the actions:
1. Short position $BTC is still being held; take-profit at 56000;
2. Short position $ETH is still being held; take-profit at 1600;
3. Short position $SOL is still being held; take-profit at 65;
4. At the end of every month, DCA 3wu into the big pie and 1wu into SOL
First, I want to clarify: holding short positions and spot DCA are not contradictory. But whether the newly bought spot should be transferred into a coin-specific (coin-matching) account—I’ll consider it further.
Then, regarding my spot copy-trading: today I sold half of the position. The reason is that although the altcoin season index is still relatively low, the greed index is already very high—this is something I want to point out to everyone as well.
All in all, my short positions will most likely be held until the end of September. Here are a few reasons:
1. Historically, September has been the worst month for US stocks.
2. Since 1990, the S&P 500 has, in the period from August 18 to October 11 in midterm election years, experienced at least a 7% pullback every year except 2006. But 2006 already recorded a 9% drop in May to July in advance, so in a way it just shifted the adjustment earlier.
3. As mentioned earlier, the probability of the US resuming hikes on September 16 is over 50%.
4. On September 17, Japan is highly likely to raise rates as well. Historically, every time before Japan’s rate hike, the big pie officially starts to decline, and the drop has never been less than 20%.
So no matter what, I will at least hold the short positions until the end of September, but latest I shouldn’t hold them beyond mid-October.
BTW, 2027 might be a year where US stocks continue to trend bearish, while the big pie trades in a range but strengthens.
Also, there’s another thing: a while back I mentioned liking a video account’s group-broadcast host. Her name is Jiu Jiu. These days she just so happens to be competing in the month赛 in the live room of the Dream-Building Cup event. I hope everyone has time to go support her—she’s truly very hardworking.

101
5
136
65.5k
·
--
The long position in the gold from $XAU was just closed. I originally had it set at 4600, but I didn’t have much patience, so I changed it to 4500. That means I held it for more than two months to make less than 70,000.
But the rebound probably isn’t over yet—it can still go up more, and reaching 5000+ again is completely normal. It’s just that for levels above 4600, I’m still considering adding to the short position I currently hold at better prices. After all, I never intended to take this long position all the way to the maximum.
I’ll still share the market analysis, but I’ll wait until I’m a bit lighter on shorts. I’ve been quite busy lately. But honestly, whether I post a market analysis or not doesn’t seem to matter much—very few people can actually follow my trades… For example, with this gold long position, I held it for a little over two months. For me, that cycle is quite normal, but for 99% of people, it seems like a very long cycle.
My gold short position average price is 5000+. That means I’ll hold it even longer—the holding period for that short is probably around two and a half years. I feel like very few people currently hold gold short positions with an average price above 5000… even the partners who joined me later at the time…
Finally, I wish everyone a happy Qixi Festival. I’ve had so many bad-romance situations lately, and I’m a bit tired. But recently I started following a female streamer in a group broadcast—she’s really kind. It’s basically a good piece of news regarding relationships. Before the month’s competition, I’ll tell you all the details, and I hope you can support her. She dances really well and works hard.
The long position in the gold from $XAU was just closed. I originally had it set at 4600, but I didn’t have much patience, so I changed it to 4500. That means I held it for more than two months to make less than 70,000.
But the rebound probably isn’t over yet—it can still go up more, and reaching 5000+ again is completely normal. It’s just that for levels above 4600, I’m still considering adding to the short position I currently hold at better prices. After all, I never intended to take this long position all the way to the maximum.
I’ll still share the market analysis, but I’ll wait until I’m a bit lighter on shorts. I’ve been quite busy lately. But honestly, whether I post a market analysis or not doesn’t seem to matter much—very few people can actually follow my trades… For example, with this gold long position, I held it for a little over two months. For me, that cycle is quite normal, but for 99% of people, it seems like a very long cycle.
My gold short position average price is 5000+. That means I’ll hold it even longer—the holding period for that short is probably around two and a half years. I feel like very few people currently hold gold short positions with an average price above 5000… even the partners who joined me later at the time…
Finally, I wish everyone a happy Qixi Festival. I’ve had so many bad-romance situations lately, and I’m a bit tired. But recently I started following a female streamer in a group broadcast—she’s really kind. It’s basically a good piece of news regarding relationships. Before the month’s competition, I’ll tell you all the details, and I hope you can support her. She dances really well and works hard.
But the rebound probably isn’t over yet—it can still go up more, and reaching 5000+ again is completely normal. It’s just that for levels above 4600, I’m still considering adding to the short position I currently hold at better prices. After all, I never intended to take this long position all the way to the maximum.
I’ll still share the market analysis, but I’ll wait until I’m a bit lighter on shorts. I’ve been quite busy lately. But honestly, whether I post a market analysis or not doesn’t seem to matter much—very few people can actually follow my trades… For example, with this gold long position, I held it for a little over two months. For me, that cycle is quite normal, but for 99% of people, it seems like a very long cycle.
My gold short position average price is 5000+. That means I’ll hold it even longer—the holding period for that short is probably around two and a half years. I feel like very few people currently hold gold short positions with an average price above 5000… even the partners who joined me later at the time…
Finally, I wish everyone a happy Qixi Festival. I’ve had so many bad-romance situations lately, and I’m a bit tired. But recently I started following a female streamer in a group broadcast—she’s really kind. It’s basically a good piece of news regarding relationships. Before the month’s competition, I’ll tell you all the details, and I hope you can support her. She dances really well and works hard.


69
30
48.5k
·
--
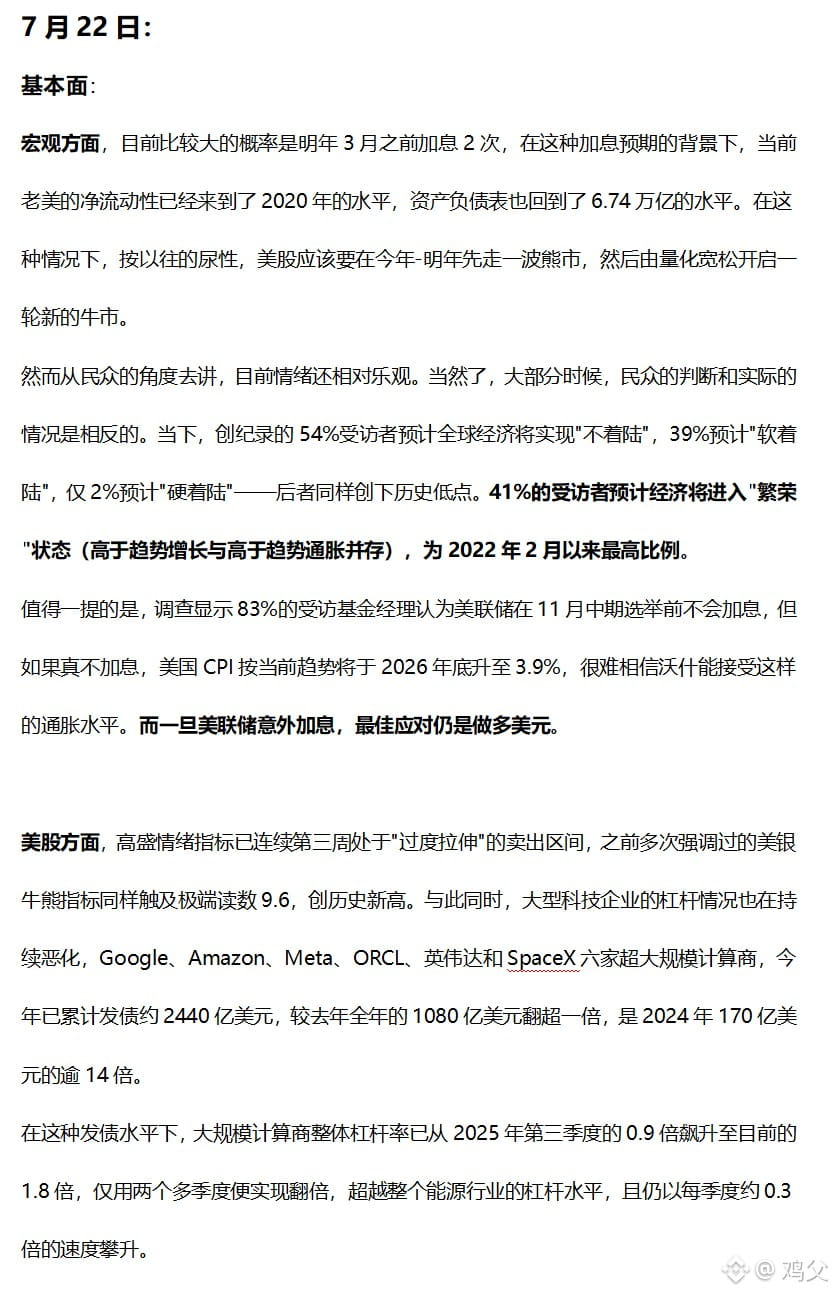
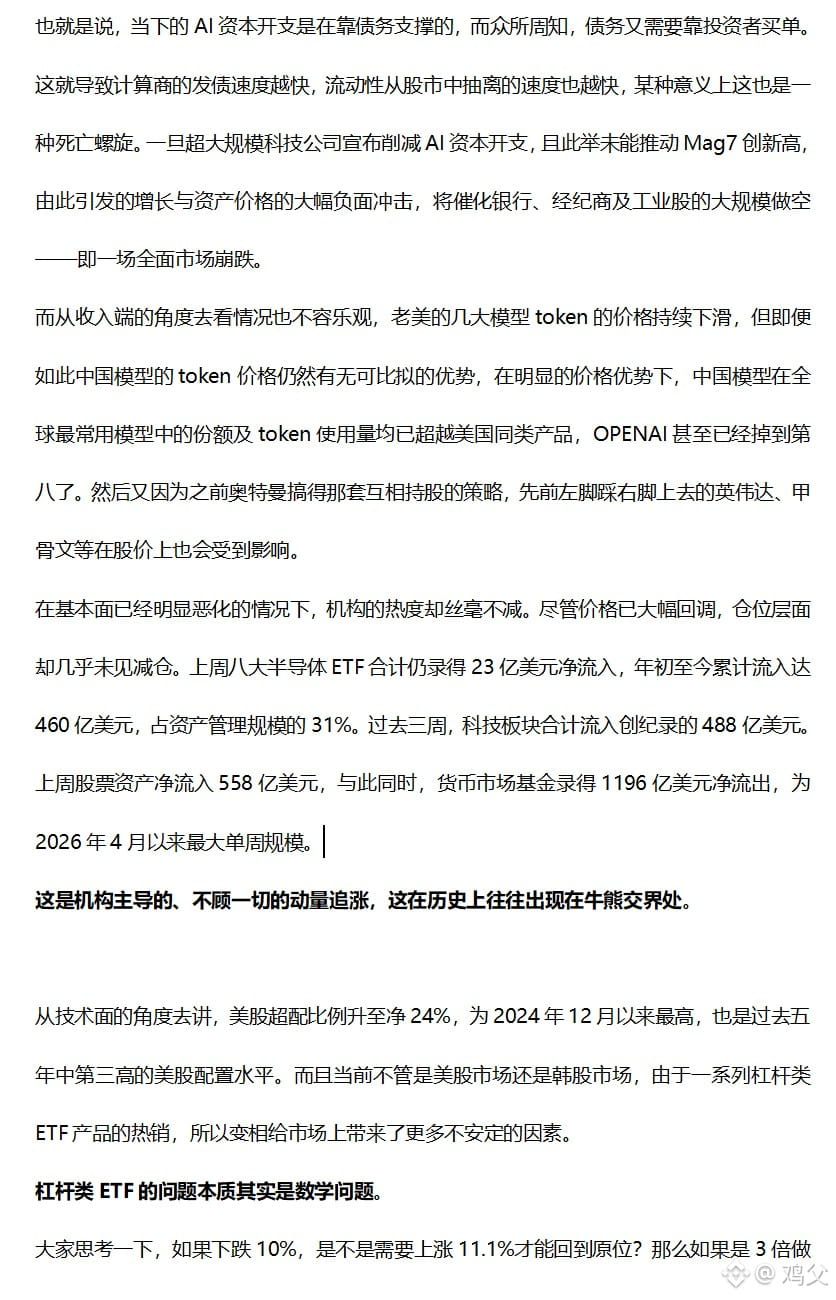
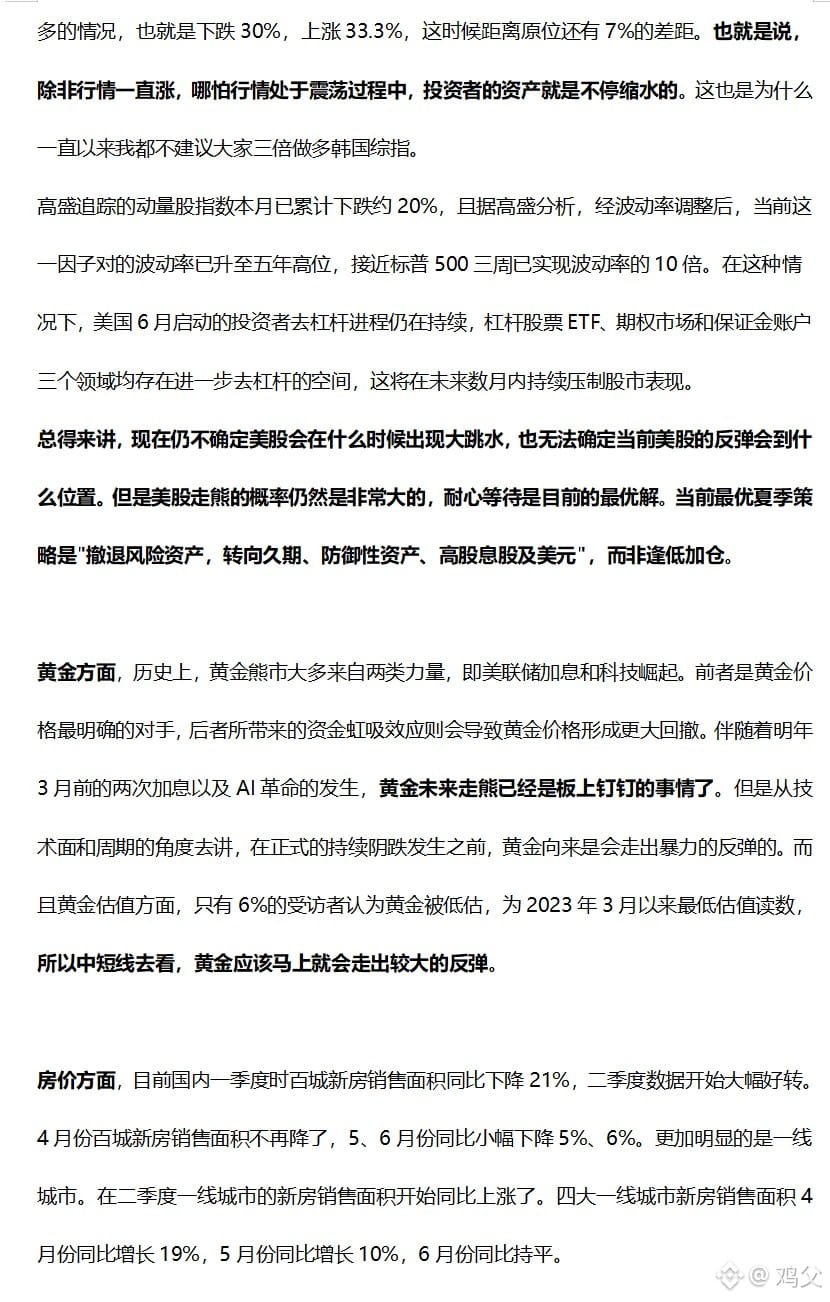
Crypto market monthly review and analysis (07.22)
Summary:
1. The pace of Federal Reserve rate hikes.
2. The stock market being overbought and the precarious situation of leveraged traders.
3. The essence of leveraged ETFs is a mathematical problem.
4. Gold: long-term bearish and short-term bullish.
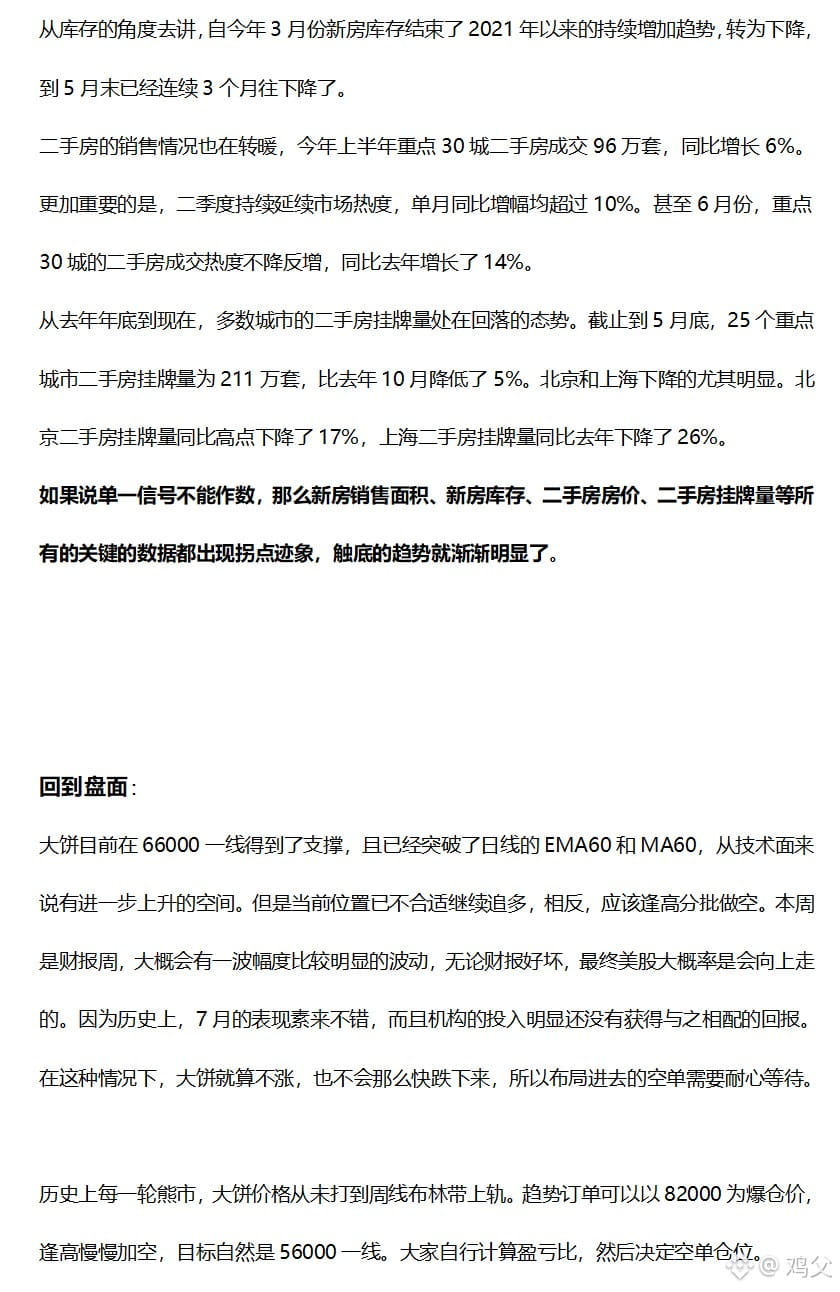
5. Let’s talk about the real estate market.
6. The rebound isn’t over yet—go short first.
In terms of operations:
1) $BTC : build short positions in batches in the 66,000–71,000 range. Liquidation price above 80,000; take profit at 56,000.
2) $ETH : build short positions in batches in the 1,950–2,150 range. Liquidation price above 2,400; take profit at 1,350.
3) $SOL : build short positions in batches in the 78.5–85 range. Stop loss above 95; take profit at 55.
4) Monthly: DCA 3wu worth of BTC and 1wu worth of SOL at the end of each month.
Because I really don’t believe that BTC at 66,800 is the peak of this rebound, and the altcoin season index is currently around 55 and hasn’t touched above 75. So the altcoin spot I bought earlier will still be held a bit longer, but at the latest by mid-August I will sell the altcoins and wait for a lower level to buy back.
For ETH and SOL, their exact price points are somewhat unclear. It’s not out of the question that 0.025 and 0.001 are the lowest points of their respective BTC exchange rates during this bear market. In trading, overall ETH and SOL should still follow BTC—don’t overthink the precise levels.
There are many reasons why I think there will be a high point, yet I set up short positions early. First, for coin-denominated shorts: a 1x short will not be liquidated, so going short early is effectively just hedging; you can earn funding fees too—no matter how you look at it, it’s not a losing trade. Also during a bear market, try not to guess the top—sometimes the market can suddenly drop big on you. And for the U.S. stock market, August is generally not a great month, so the chance that BTC tops in August is relatively high as well. So it makes sense to establish a bottom-position early and then gradually add over the next 2–3 weeks, from a time-cycle perspective.
I will continue holding the U.S. stock shorts—at least until the Nasdaq reaches around 22,000. From the timing perspective, it’s roughly near the MA125 on the weekly chart. At that point, I’ll close half of the U.S. stock short positions and secure it at break-even. Until then, just be patient and hold. In fact, the funding fees for my individual shorts have already exceeded my margin; so regardless, it won’t turn into a loss.
Crypto market monthly review and analysis (07.22)
Summary:
1. The pace of Federal Reserve rate hikes.
2. The stock market being overbought and the precarious situation of leveraged traders.
3. The essence of leveraged ETFs is a mathematical problem.
4. Gold: long-term bearish and short-term bullish.
5. Let’s talk about the real estate market.
6. The rebound isn’t over yet—go short first.
In terms of operations:
1) $BTC : build short positions in batches in the 66,000–71,000 range. Liquidation price above 80,000; take profit at 56,000.
2) $ETH : build short positions in batches in the 1,950–2,150 range. Liquidation price above 2,400; take profit at 1,350.
3) $SOL : build short positions in batches in the 78.5–85 range. Stop loss above 95; take profit at 55.
4) Monthly: DCA 3wu worth of BTC and 1wu worth of SOL at the end of each month.
Because I really don’t believe that BTC at 66,800 is the peak of this rebound, and the altcoin season index is currently around 55 and hasn’t touched above 75. So the altcoin spot I bought earlier will still be held a bit longer, but at the latest by mid-August I will sell the altcoins and wait for a lower level to buy back.
For ETH and SOL, their exact price points are somewhat unclear. It’s not out of the question that 0.025 and 0.001 are the lowest points of their respective BTC exchange rates during this bear market. In trading, overall ETH and SOL should still follow BTC—don’t overthink the precise levels.
There are many reasons why I think there will be a high point, yet I set up short positions early. First, for coin-denominated shorts: a 1x short will not be liquidated, so going short early is effectively just hedging; you can earn funding fees too—no matter how you look at it, it’s not a losing trade. Also during a bear market, try not to guess the top—sometimes the market can suddenly drop big on you. And for the U.S. stock market, August is generally not a great month, so the chance that BTC tops in August is relatively high as well. So it makes sense to establish a bottom-position early and then gradually add over the next 2–3 weeks, from a time-cycle perspective.
I will continue holding the U.S. stock shorts—at least until the Nasdaq reaches around 22,000. From the timing perspective, it’s roughly near the MA125 on the weekly chart. At that point, I’ll close half of the U.S. stock short positions and secure it at break-even. Until then, just be patient and hold. In fact, the funding fees for my individual shorts have already exceeded my margin; so regardless, it won’t turn into a loss.
Summary:
1. The pace of Federal Reserve rate hikes.
2. The stock market being overbought and the precarious situation of leveraged traders.
3. The essence of leveraged ETFs is a mathematical problem.
4. Gold: long-term bearish and short-term bullish.
5. Let’s talk about the real estate market.
6. The rebound isn’t over yet—go short first.
In terms of operations:
1) $BTC : build short positions in batches in the 66,000–71,000 range. Liquidation price above 80,000; take profit at 56,000.
2) $ETH : build short positions in batches in the 1,950–2,150 range. Liquidation price above 2,400; take profit at 1,350.
3) $SOL : build short positions in batches in the 78.5–85 range. Stop loss above 95; take profit at 55.
4) Monthly: DCA 3wu worth of BTC and 1wu worth of SOL at the end of each month.
Because I really don’t believe that BTC at 66,800 is the peak of this rebound, and the altcoin season index is currently around 55 and hasn’t touched above 75. So the altcoin spot I bought earlier will still be held a bit longer, but at the latest by mid-August I will sell the altcoins and wait for a lower level to buy back.
For ETH and SOL, their exact price points are somewhat unclear. It’s not out of the question that 0.025 and 0.001 are the lowest points of their respective BTC exchange rates during this bear market. In trading, overall ETH and SOL should still follow BTC—don’t overthink the precise levels.
There are many reasons why I think there will be a high point, yet I set up short positions early. First, for coin-denominated shorts: a 1x short will not be liquidated, so going short early is effectively just hedging; you can earn funding fees too—no matter how you look at it, it’s not a losing trade. Also during a bear market, try not to guess the top—sometimes the market can suddenly drop big on you. And for the U.S. stock market, August is generally not a great month, so the chance that BTC tops in August is relatively high as well. So it makes sense to establish a bottom-position early and then gradually add over the next 2–3 weeks, from a time-cycle perspective.
I will continue holding the U.S. stock shorts—at least until the Nasdaq reaches around 22,000. From the timing perspective, it’s roughly near the MA125 on the weekly chart. At that point, I’ll close half of the U.S. stock short positions and secure it at break-even. Until then, just be patient and hold. In fact, the funding fees for my individual shorts have already exceeded my margin; so regardless, it won’t turn into a loss.
49
4
138
45.8k
·
--
🎙️ The Commonality Between Trading and Falling in Love
End
01 h 00 m 30 s
2.1k
BTC/USDT
Limit/Buy
0%
6
0
·
--
My long short position of $BTC was closed at 57777 this morning, and then I bought 50000u of spot. The long short position of $SOL was closed last night, and then I bought 20000u of spot.
My plan for my spot holdings next is: over the next 6 months, buy 30000u of BTC at the end of every month, and buy 10000u of SOL at the end of every month. In addition, for altcoins (including shitcoins), I’ve allocated a total budget of 50000u (of which 15000u will be placed in a copy-trading account, and the money in that account will not be withdrawn for the next 3 years). In short, the capital I’m using to bottom-pick this bear cycle is about 360,000u.
As for contracts: after I closed my SOL short position yesterday, I also同步(did in parallel) set up a small position in a coin-margined long. But unfortunately, after my BTC short position was closed this morning, I only ended up buying spot, and I didn’t enter the long position before it pumped. That’s on me—I previously had a tiny leftover BTC amount in my coin-margined account, so this morning I thought it had already transferred in, but in reality it hadn’t. I only realized once I opened the long, and by then it was already too late. The position was too small.
Anyway, I’ve currently placed an order around 58000 and I’ll see if I can get filled and benefit from it over the next couple of days.
There are a lot of new followers, so I’ll mention it again: in every trend order of mine, I always reserve at least two opportunities for averaging down—don’t come in and YOLO everything right away.
My long short position of $BTC was closed at 57777 this morning, and then I bought 50000u of spot. The long short position of $SOL was closed last night, and then I bought 20000u of spot.
My plan for my spot holdings next is: over the next 6 months, buy 30000u of BTC at the end of every month, and buy 10000u of SOL at the end of every month. In addition, for altcoins (including shitcoins), I’ve allocated a total budget of 50000u (of which 15000u will be placed in a copy-trading account, and the money in that account will not be withdrawn for the next 3 years). In short, the capital I’m using to bottom-pick this bear cycle is about 360,000u.
As for contracts: after I closed my SOL short position yesterday, I also同步(did in parallel) set up a small position in a coin-margined long. But unfortunately, after my BTC short position was closed this morning, I only ended up buying spot, and I didn’t enter the long position before it pumped. That’s on me—I previously had a tiny leftover BTC amount in my coin-margined account, so this morning I thought it had already transferred in, but in reality it hadn’t. I only realized once I opened the long, and by then it was already too late. The position was too small.
Anyway, I’ve currently placed an order around 58000 and I’ll see if I can get filled and benefit from it over the next couple of days.
There are a lot of new followers, so I’ll mention it again: in every trend order of mine, I always reserve at least two opportunities for averaging down—don’t come in and YOLO everything right away.
My plan for my spot holdings next is: over the next 6 months, buy 30000u of BTC at the end of every month, and buy 10000u of SOL at the end of every month. In addition, for altcoins (including shitcoins), I’ve allocated a total budget of 50000u (of which 15000u will be placed in a copy-trading account, and the money in that account will not be withdrawn for the next 3 years). In short, the capital I’m using to bottom-pick this bear cycle is about 360,000u.
As for contracts: after I closed my SOL short position yesterday, I also同步(did in parallel) set up a small position in a coin-margined long. But unfortunately, after my BTC short position was closed this morning, I only ended up buying spot, and I didn’t enter the long position before it pumped. That’s on me—I previously had a tiny leftover BTC amount in my coin-margined account, so this morning I thought it had already transferred in, but in reality it hadn’t. I only realized once I opened the long, and by then it was already too late. The position was too small.
Anyway, I’ve currently placed an order around 58000 and I’ll see if I can get filled and benefit from it over the next couple of days.
There are a lot of new followers, so I’ll mention it again: in every trend order of mine, I always reserve at least two opportunities for averaging down—don’t come in and YOLO everything right away.

181
10
452
376.9k
·
--
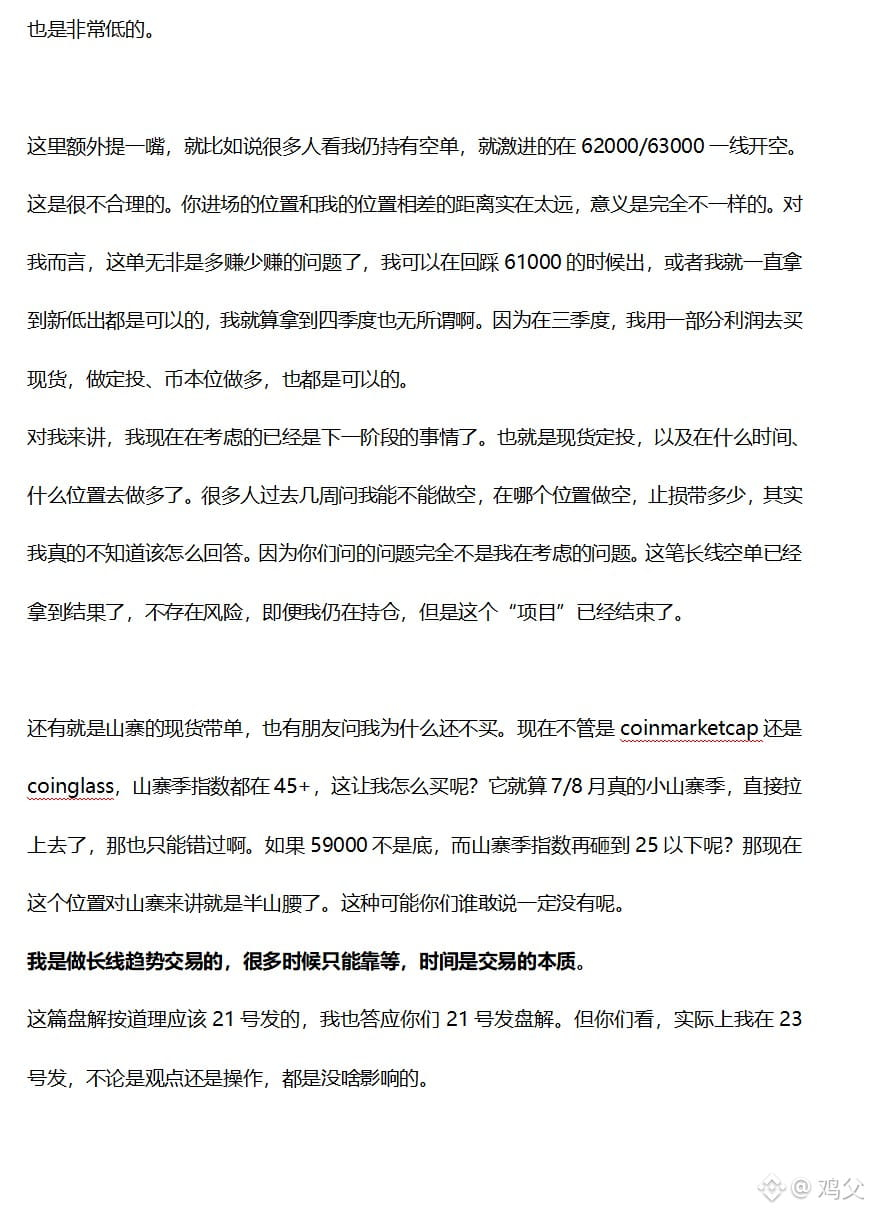
Monthly Market Analysis in Crypto (2026.06)
Summary:
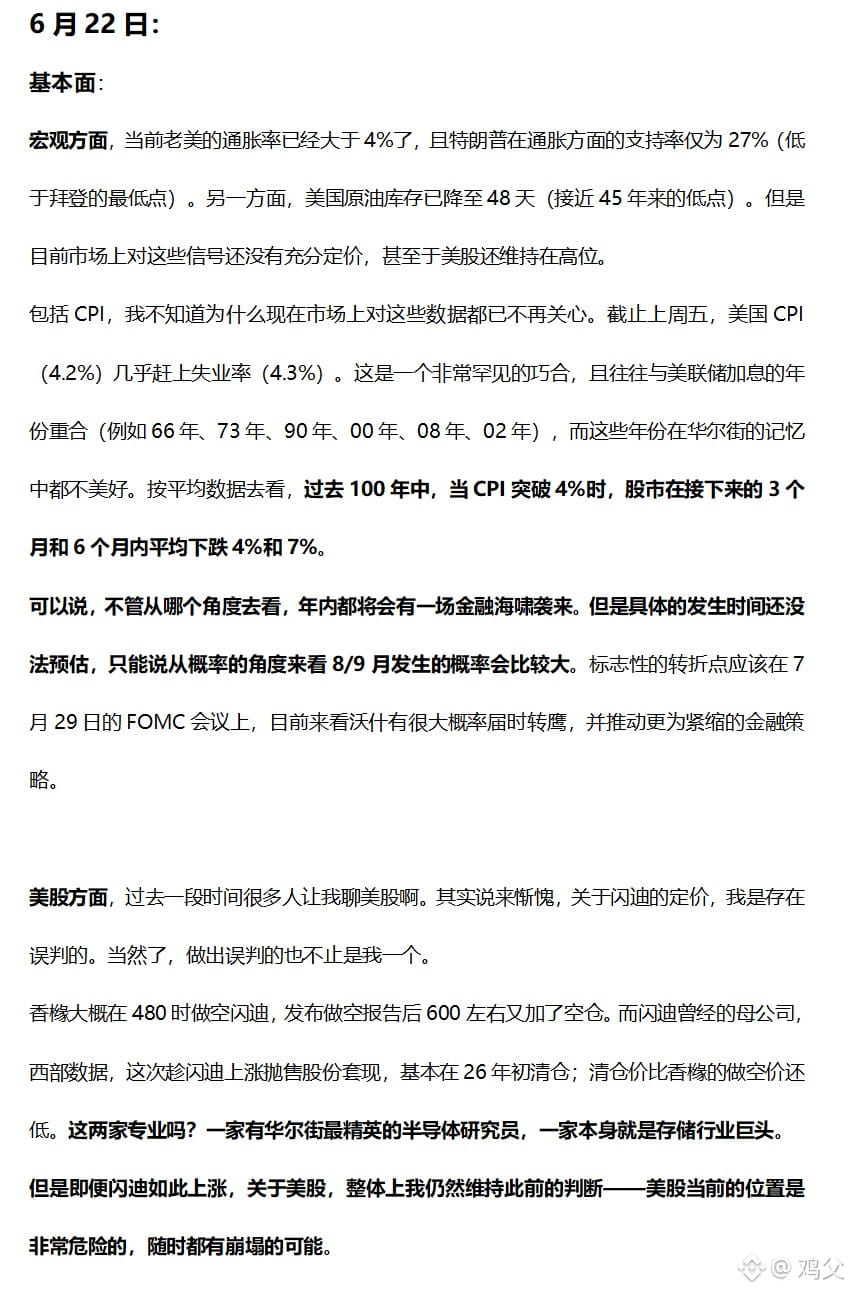
1. CPI, crude oil inventories, and unemployment rates reflect the fundamentals.
2. The financial tsunami is expected to occur around July 29 after the FOMC meeting.
3. From SanDisk to U.S. stocks.
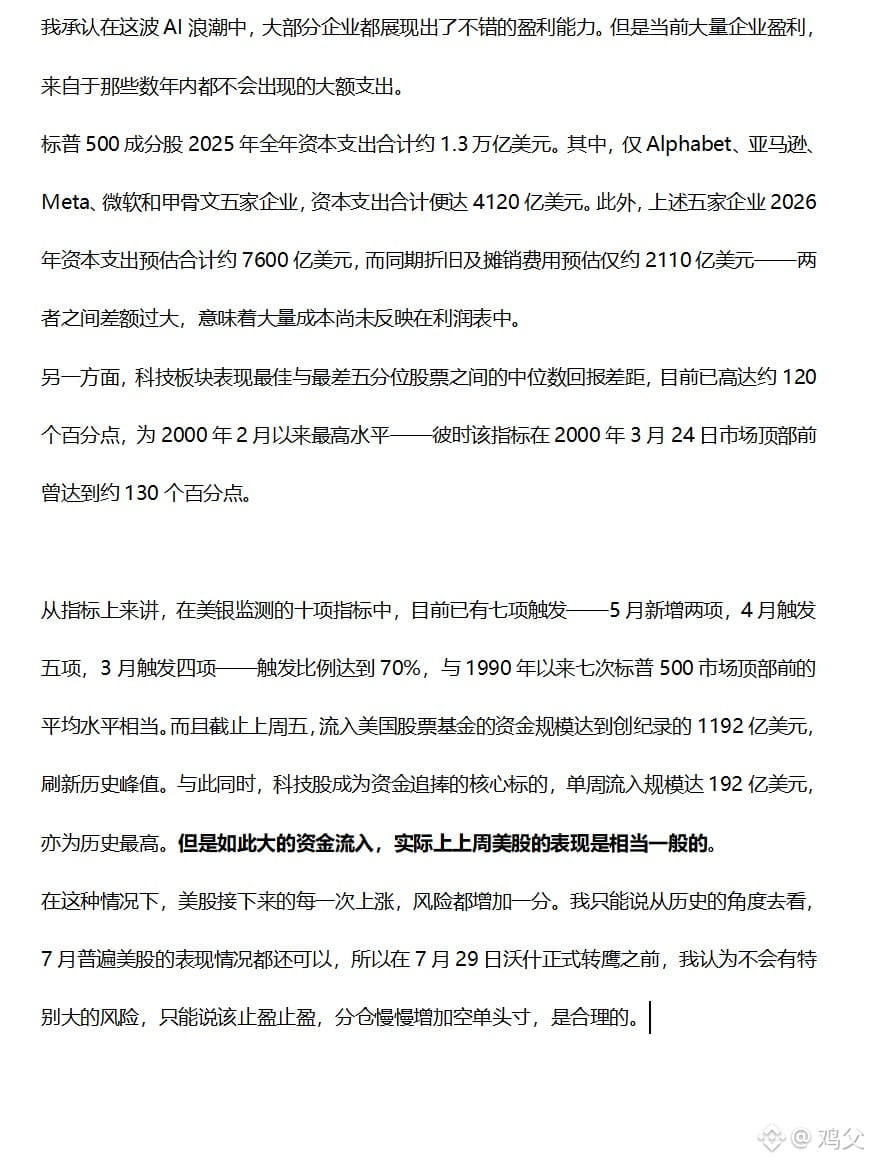
4. Major expenditures from tech companies have yet to be priced in.
5. Structural risks in U.S. equities.
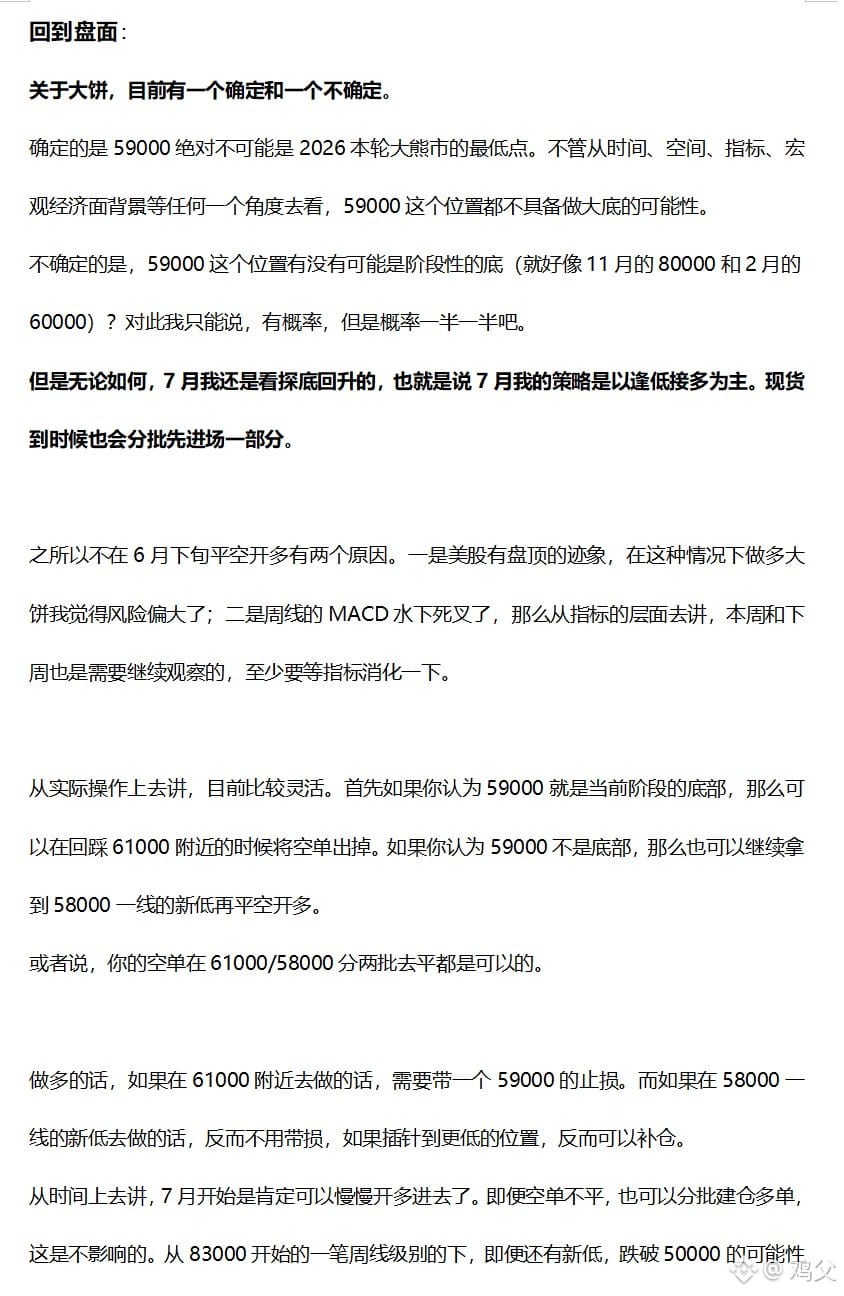
6. The certainties and uncertainties of Bitcoin.
7. Reasons for bullish sentiment in July but not going long in late June.
8. How to view the 59000 level?
9. Some personal thoughts.
Operations:
1. Holding a short position on $BTC with a take profit at 58000 (can take half profit at 61000);
2. Holding a short position on $SOL with a take profit at 60;
3. Gradually accumulating longs in the 58000-53000 range, stop loss at 49000, take profit at 73000;
4. Looking at short-term, there's a long opportunity at 61000 for $BTC (needs a stop loss at 59000).
Adding to altcoin positions gradually, there's a good chance for a small altcoin season in July/August, but in case it doesn't happen, be prepared to hold spot until 2027.
Historically, gold tops have lasted over six months, so the probability of gold rising in July/August is also high. While holding high-position shorts, it's still possible to enter longs. However, after August, avoid going long on gold as it could enter a prolonged downtrend at any time, making it more rational to add to shorts at highs, potentially holding them until the end of Bitcoin's bull market (Q3 2029).
Monthly Market Analysis in Crypto (2026.06)
Summary:
1. CPI, crude oil inventories, and unemployment rates reflect the fundamentals.
2. The financial tsunami is expected to occur around July 29 after the FOMC meeting.
3. From SanDisk to U.S. stocks.
4. Major expenditures from tech companies have yet to be priced in.
5. Structural risks in U.S. equities.
6. The certainties and uncertainties of Bitcoin.
7. Reasons for bullish sentiment in July but not going long in late June.
8. How to view the 59000 level?
9. Some personal thoughts.
Operations:
1. Holding a short position on $BTC with a take profit at 58000 (can take half profit at 61000);
2. Holding a short position on $SOL with a take profit at 60;
3. Gradually accumulating longs in the 58000-53000 range, stop loss at 49000, take profit at 73000;
4. Looking at short-term, there's a long opportunity at 61000 for $BTC (needs a stop loss at 59000).
Adding to altcoin positions gradually, there's a good chance for a small altcoin season in July/August, but in case it doesn't happen, be prepared to hold spot until 2027.
Historically, gold tops have lasted over six months, so the probability of gold rising in July/August is also high. While holding high-position shorts, it's still possible to enter longs. However, after August, avoid going long on gold as it could enter a prolonged downtrend at any time, making it more rational to add to shorts at highs, potentially holding them until the end of Bitcoin's bull market (Q3 2029).
Summary:
1. CPI, crude oil inventories, and unemployment rates reflect the fundamentals.
2. The financial tsunami is expected to occur around July 29 after the FOMC meeting.
3. From SanDisk to U.S. stocks.
4. Major expenditures from tech companies have yet to be priced in.
5. Structural risks in U.S. equities.
6. The certainties and uncertainties of Bitcoin.
7. Reasons for bullish sentiment in July but not going long in late June.
8. How to view the 59000 level?
9. Some personal thoughts.
Operations:
1. Holding a short position on $BTC with a take profit at 58000 (can take half profit at 61000);
2. Holding a short position on $SOL with a take profit at 60;
3. Gradually accumulating longs in the 58000-53000 range, stop loss at 49000, take profit at 73000;
4. Looking at short-term, there's a long opportunity at 61000 for $BTC (needs a stop loss at 59000).
Adding to altcoin positions gradually, there's a good chance for a small altcoin season in July/August, but in case it doesn't happen, be prepared to hold spot until 2027.
Historically, gold tops have lasted over six months, so the probability of gold rising in July/August is also high. While holding high-position shorts, it's still possible to enter longs. However, after August, avoid going long on gold as it could enter a prolonged downtrend at any time, making it more rational to add to shorts at highs, potentially holding them until the end of Bitcoin's bull market (Q3 2029).
87
5
132
70.9k
·
--
I opened a spot trading signal, and this isn't something for you all to follow blindly; it's more for you to observe.
A few days ago, I posted a list of altcoin spot trades (see pinned post), and some friends told me that just looking at this list doesn't really help them understand how to buy specifically. There were also friends in the chatroom who mentioned they didn't know the exact position ratios for each altcoin or the entry prices.
So, I came up with this idea. In this signal, I will share the position ratios of my personal spot account (excluding $BTC , $ETH , $SOL , and BNB). In short, all information will be public, which can provide you with some reference.
The main issue is that currently, there are only contract trades available, no spot trades, so we have to take a roundabout way for now. Please bear with me.
Of course, following along is fine too. Let me briefly explain how I plan to execute this signal.
Bull Market Period:
The cryptocurrencies will primarily be those listed in my list. I will buy when market sentiment is fearful + altcoin season index < 25, go full position when extreme fear + altcoin season index < 20, sell half when greedy + altcoin season index > 75, and go all out when extreme greed + altcoin season index > 80. The data will be taken from the average values of coinmarketcap and coinglass.
Bear Market Period:
Conditions will be slightly relaxed (it's tough to be greedy in a bear market), but the overall trading logic remains the same.
It's worth mentioning, either don't follow or if you do, try to stick to 1000u or more. My funds are spread out, so I might not be able to buy into some coins.
I opened a spot trading signal, and this isn't something for you all to follow blindly; it's more for you to observe.
A few days ago, I posted a list of altcoin spot trades (see pinned post), and some friends told me that just looking at this list doesn't really help them understand how to buy specifically. There were also friends in the chatroom who mentioned they didn't know the exact position ratios for each altcoin or the entry prices.
So, I came up with this idea. In this signal, I will share the position ratios of my personal spot account (excluding $BTC , $ETH , $SOL , and BNB). In short, all information will be public, which can provide you with some reference.
The main issue is that currently, there are only contract trades available, no spot trades, so we have to take a roundabout way for now. Please bear with me.
Of course, following along is fine too. Let me briefly explain how I plan to execute this signal.
Bull Market Period:
The cryptocurrencies will primarily be those listed in my list. I will buy when market sentiment is fearful + altcoin season index < 25, go full position when extreme fear + altcoin season index < 20, sell half when greedy + altcoin season index > 75, and go all out when extreme greed + altcoin season index > 80. The data will be taken from the average values of coinmarketcap and coinglass.
Bear Market Period:
Conditions will be slightly relaxed (it's tough to be greedy in a bear market), but the overall trading logic remains the same.
It's worth mentioning, either don't follow or if you do, try to stick to 1000u or more. My funds are spread out, so I might not be able to buy into some coins.
A few days ago, I posted a list of altcoin spot trades (see pinned post), and some friends told me that just looking at this list doesn't really help them understand how to buy specifically. There were also friends in the chatroom who mentioned they didn't know the exact position ratios for each altcoin or the entry prices.
So, I came up with this idea. In this signal, I will share the position ratios of my personal spot account (excluding $BTC , $ETH , $SOL , and BNB). In short, all information will be public, which can provide you with some reference.
The main issue is that currently, there are only contract trades available, no spot trades, so we have to take a roundabout way for now. Please bear with me.
Of course, following along is fine too. Let me briefly explain how I plan to execute this signal.
Bull Market Period:
The cryptocurrencies will primarily be those listed in my list. I will buy when market sentiment is fearful + altcoin season index < 25, go full position when extreme fear + altcoin season index < 20, sell half when greedy + altcoin season index > 75, and go all out when extreme greed + altcoin season index > 80. The data will be taken from the average values of coinmarketcap and coinglass.
Bear Market Period:
Conditions will be slightly relaxed (it's tough to be greedy in a bear market), but the overall trading logic remains the same.
It's worth mentioning, either don't follow or if you do, try to stick to 1000u or more. My funds are spread out, so I might not be able to buy into some coins.

55
9
248
77.3k
·
--
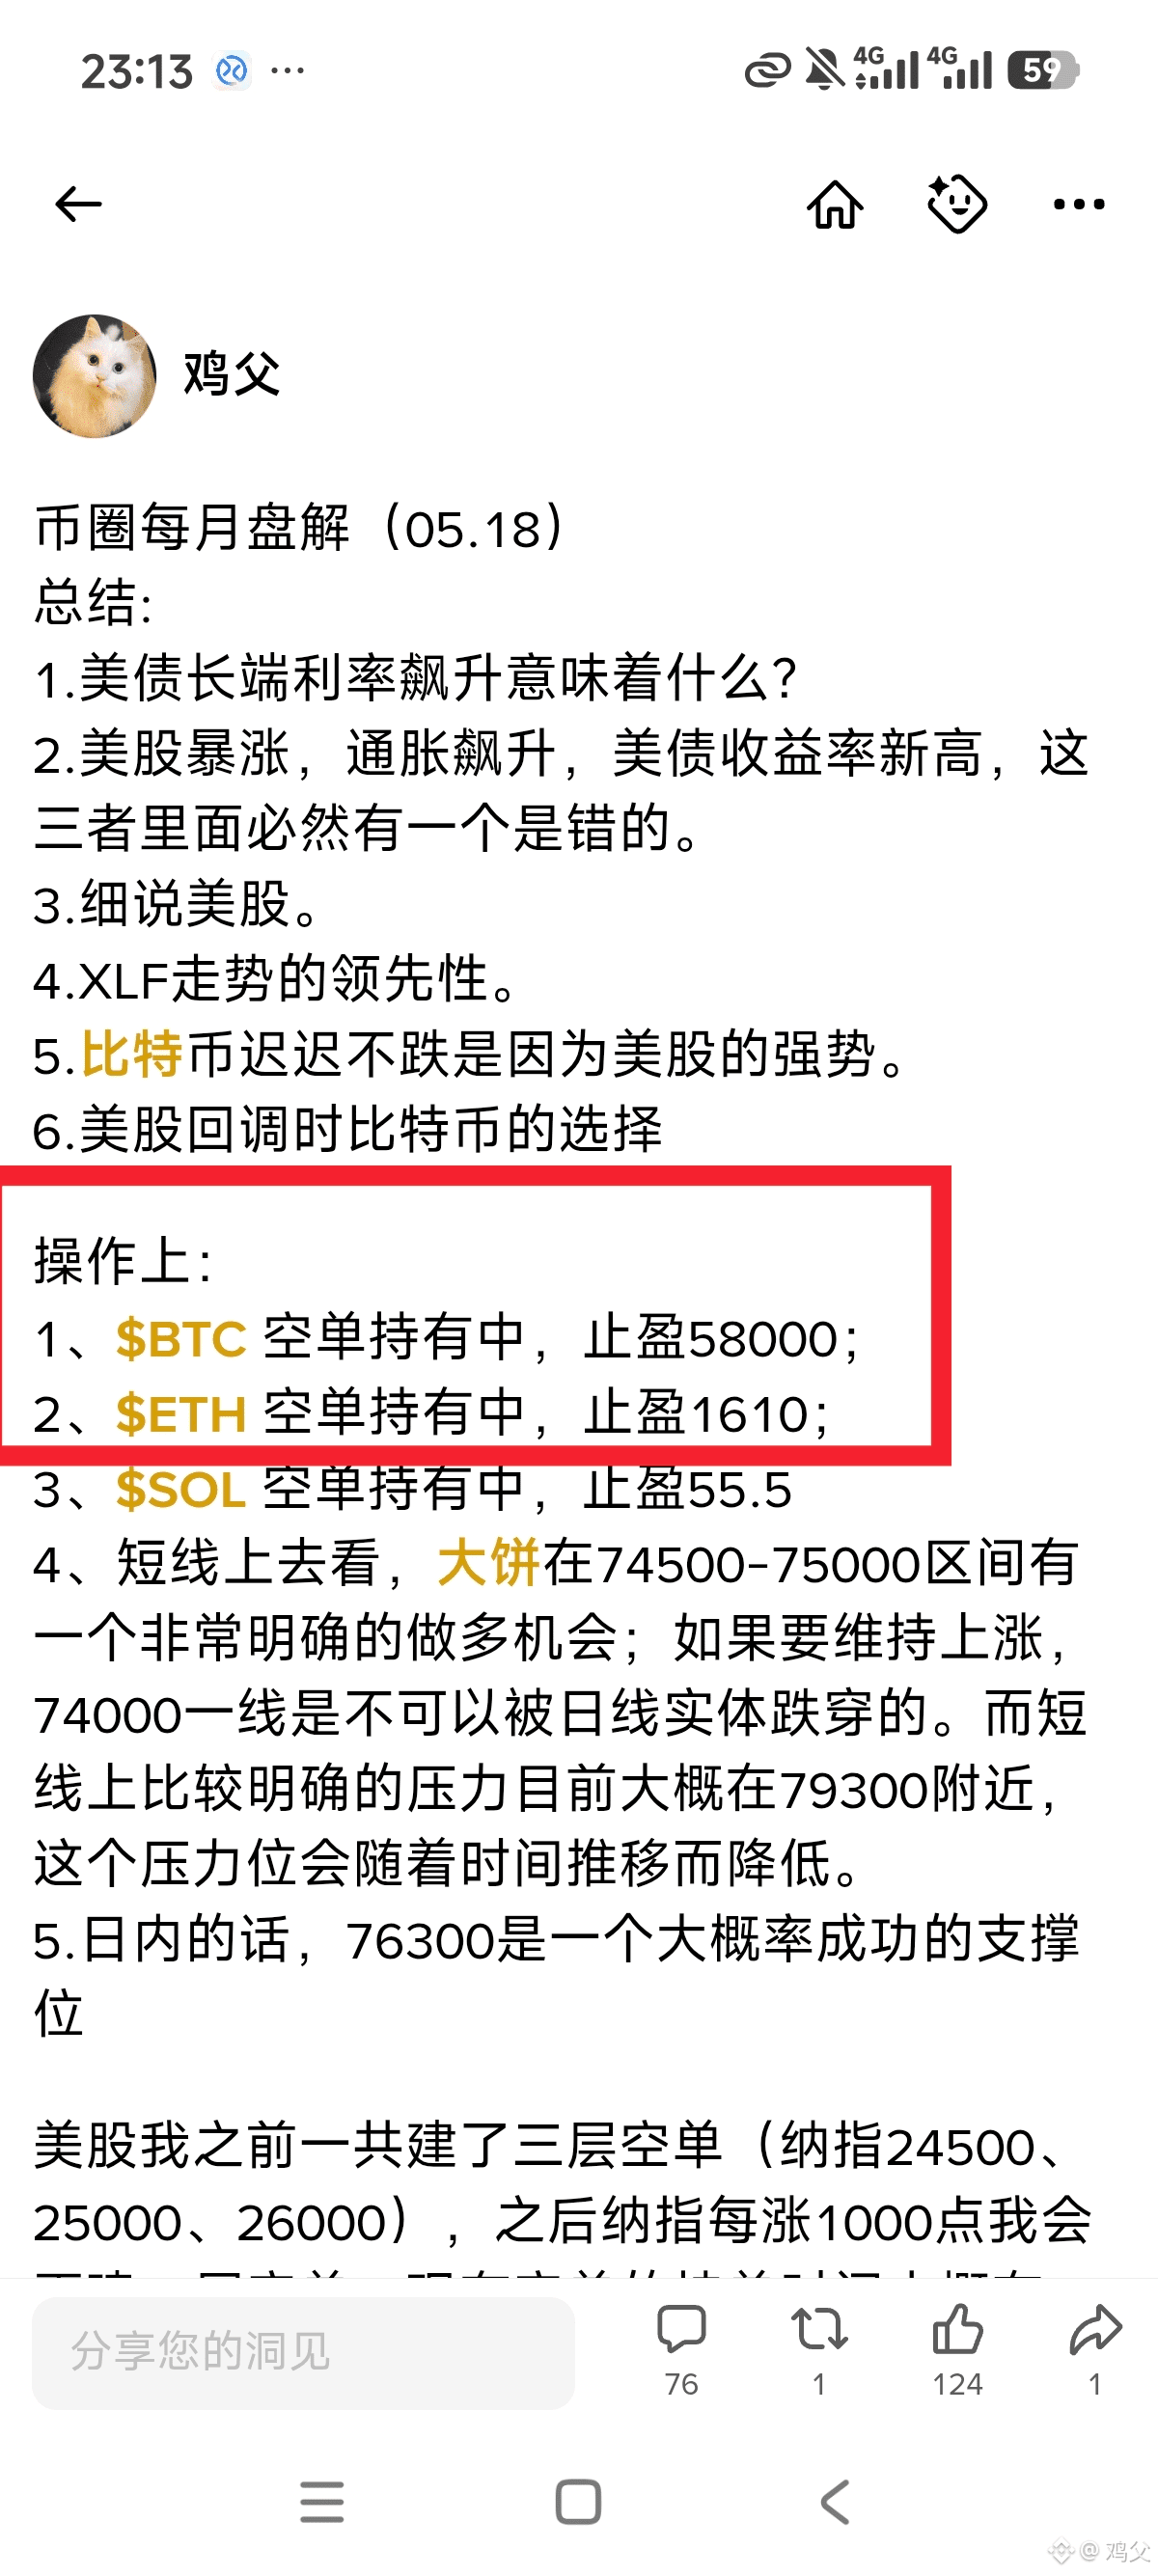
My $ETH just hit take profit, bagging around 750 points. Back on May 18th in the market analysis (the article was written on the 17th), I clearly mentioned that $BTC would see 58000, and Ethereum would hit 1600, while Bitcoin was still hovering around 77000.
Including in my June 1st post (written on May 31st), I also stressed that from June 1st to June 7th, we would kick off the main downtrend.
You could say anyone who listened to me should have made some gains (including myself).
I’m not posting this to pat myself on the back; if I wanted to do that, I’d be day trading every day and telling you all how I made 800 points on longs today and 1000 points on shorts yesterday, pocketing your commissions.
But something not-so-pleasant happened in the chat today, and I won’t get into details. I just want to say that I acknowledge both right and wrong; since joining bn, I’ve written three self-reflective notes. But the reality is, overall, I’ve made the right calls more often, which is why I’m profitable in real trading. If you have your own ideas, don’t blame your wrong trades on others, thanks.
My $ETH just hit take profit, bagging around 750 points. Back on May 18th in the market analysis (the article was written on the 17th), I clearly mentioned that $BTC would see 58000, and Ethereum would hit 1600, while Bitcoin was still hovering around 77000.
Including in my June 1st post (written on May 31st), I also stressed that from June 1st to June 7th, we would kick off the main downtrend.
You could say anyone who listened to me should have made some gains (including myself).
I’m not posting this to pat myself on the back; if I wanted to do that, I’d be day trading every day and telling you all how I made 800 points on longs today and 1000 points on shorts yesterday, pocketing your commissions.
But something not-so-pleasant happened in the chat today, and I won’t get into details. I just want to say that I acknowledge both right and wrong; since joining bn, I’ve written three self-reflective notes. But the reality is, overall, I’ve made the right calls more often, which is why I’m profitable in real trading. If you have your own ideas, don’t blame your wrong trades on others, thanks.
Including in my June 1st post (written on May 31st), I also stressed that from June 1st to June 7th, we would kick off the main downtrend.
You could say anyone who listened to me should have made some gains (including myself).
I’m not posting this to pat myself on the back; if I wanted to do that, I’d be day trading every day and telling you all how I made 800 points on longs today and 1000 points on shorts yesterday, pocketing your commissions.
But something not-so-pleasant happened in the chat today, and I won’t get into details. I just want to say that I acknowledge both right and wrong; since joining bn, I’ve written three self-reflective notes. But the reality is, overall, I’ve made the right calls more often, which is why I’m profitable in real trading. If you have your own ideas, don’t blame your wrong trades on others, thanks.
97
5
344
156.3k
·
--
If we absolutely have to buy, what should we get?
Summary:
1. Why is the US stock market at its peak right now?
2. The predictability of global inflation.
3. Wealth-making opportunities with sugar and rubber.
4. If you must buy US stocks, focus on defensive sectors first.
5. Is the main downtrend starting next week? $BTC ?
6. Strategies for the World Cup.
(I saw someone asking in the comments before. Don’t rush for the altcoin spot list, I’ll drop it soon. I’m currently on a road trip with my partner, so time is tight. Many coins might have already missed the good entry points.)
If we absolutely have to buy, what should we get?
Summary:
1. Why is the US stock market at its peak right now?
2. The predictability of global inflation.
3. Wealth-making opportunities with sugar and rubber.
4. If you must buy US stocks, focus on defensive sectors first.
5. Is the main downtrend starting next week? $BTC ?
6. Strategies for the World Cup.
(I saw someone asking in the comments before. Don’t rush for the altcoin spot list, I’ll drop it soon. I’m currently on a road trip with my partner, so time is tight. Many coins might have already missed the good entry points.)
Summary:
1. Why is the US stock market at its peak right now?
2. The predictability of global inflation.
3. Wealth-making opportunities with sugar and rubber.
4. If you must buy US stocks, focus on defensive sectors first.
5. Is the main downtrend starting next week? $BTC ?
6. Strategies for the World Cup.
(I saw someone asking in the comments before. Don’t rush for the altcoin spot list, I’ll drop it soon. I’m currently on a road trip with my partner, so time is tight. Many coins might have already missed the good entry points.)


51
70
33.6k
·
--
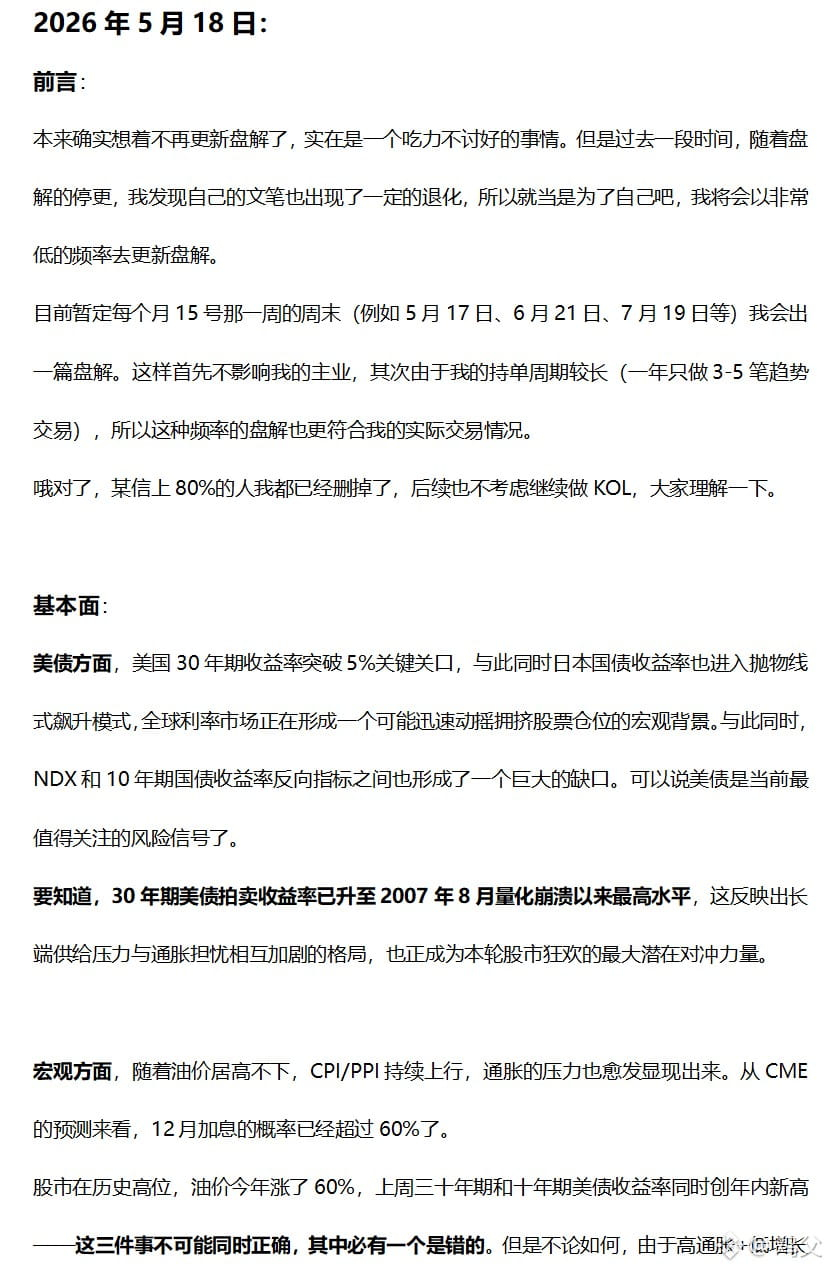
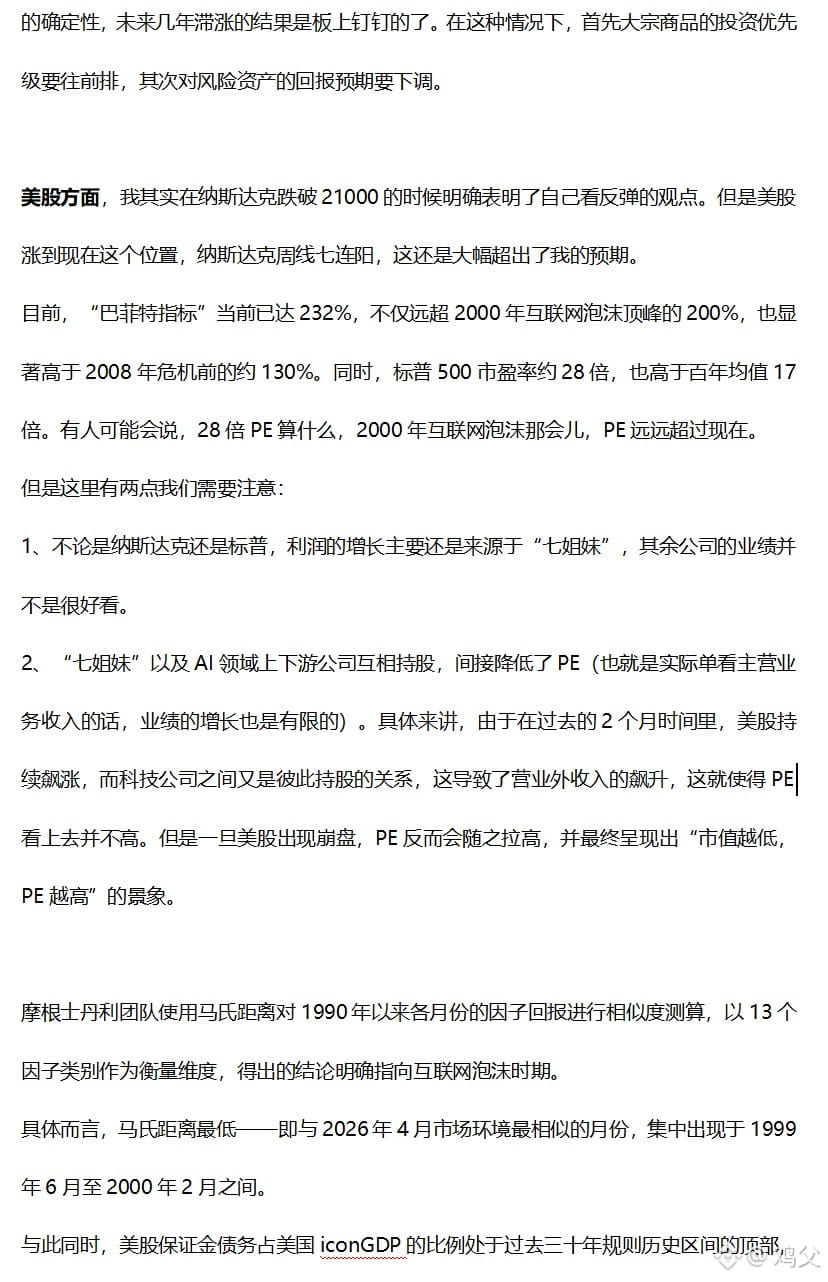
Monthly Crypto Market Review (05.18)
Summary:
1. What does the surge in long-term U.S. Treasury rates mean?
2. U.S. stocks are soaring, inflation is skyrocketing, and Treasury yields are at new highs; one of these must be wrong.
3. Detailed analysis of U.S. stocks.
4. The leading trend of XLF.
5. Bitcoin's sustained strength is due to the bullish U.S. stock market.
6. Bitcoin's options during U.S. stock pullbacks.
Trading Strategy:
1. Holding short position for $BTC , take profit at 58000;
2. Holding short position for $ETH , take profit at 1610;
3. Holding short position for $SOL , take profit at 55.5;
4. On the short term, there’s a clear long opportunity for Bitcoin in the 74500-75000 range; to maintain an uptrend, the 74000 level cannot be breached on a daily candlestick. The current short-term pressure is around 79300, and this resistance will likely decrease over time.
5. For the day, 76300 is a high-probability support level.
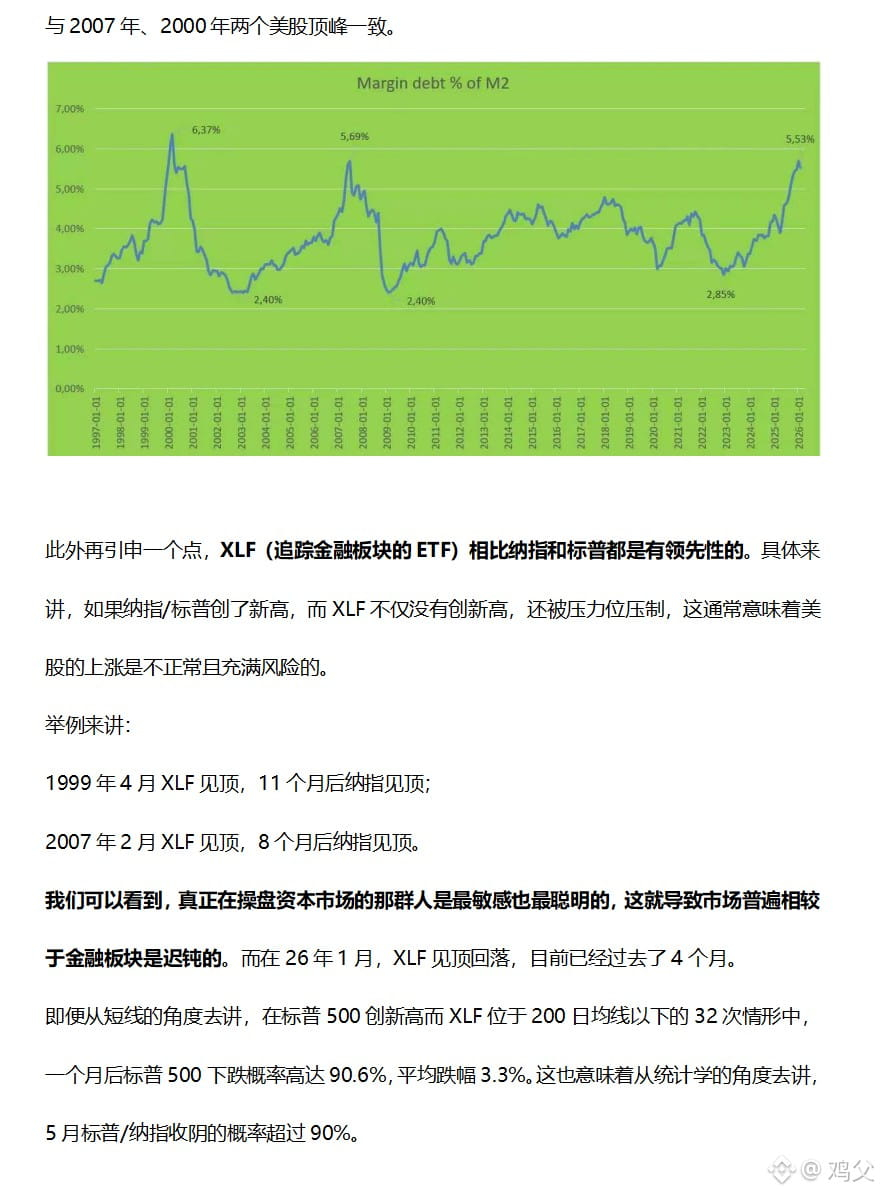
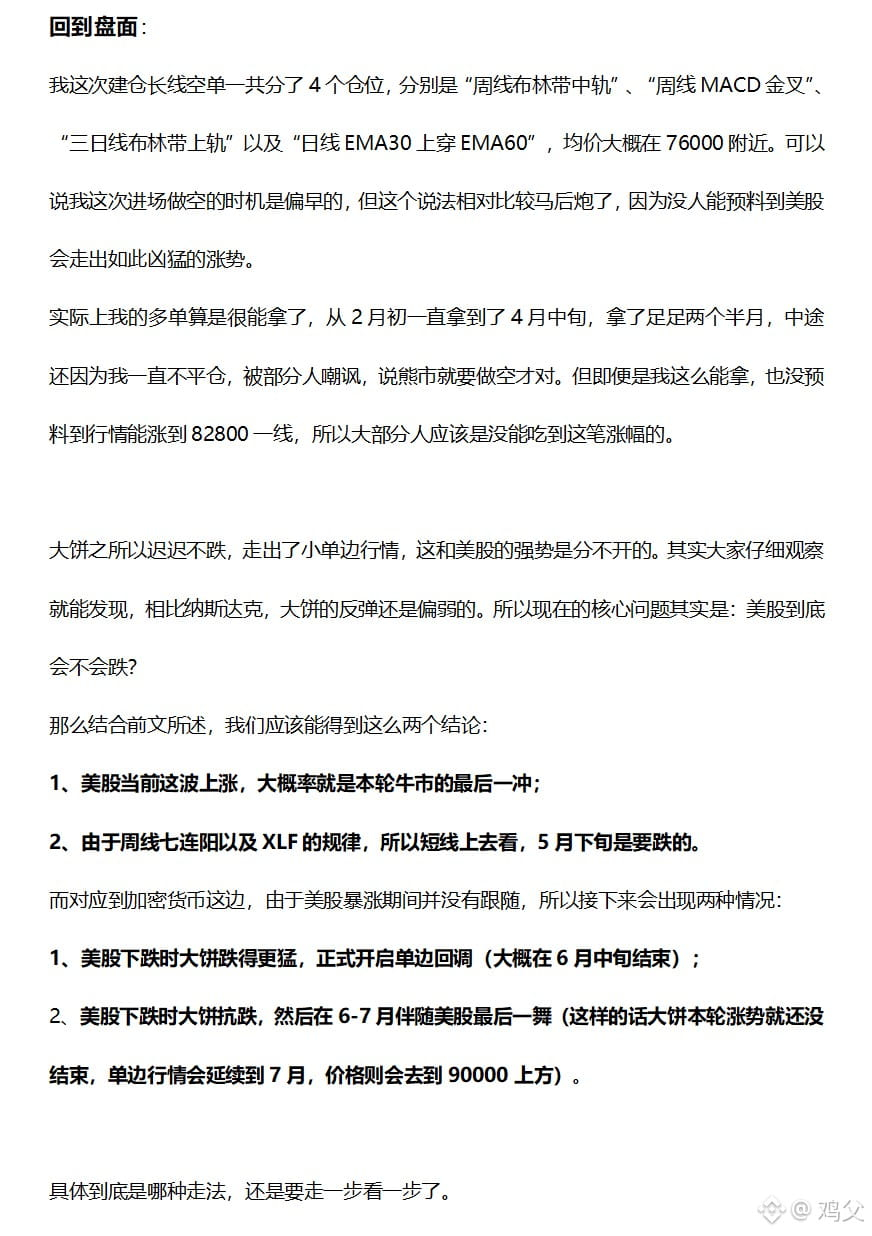
In the U.S. stock market, I've built three layers of shorts (NASDAQ 24500, 25000, 26000). For every 1000-point increase in the NASDAQ, I plan to add another layer of shorts. The current holding period for these shorts is about 12-13 months. Many are anticipating the NASDAQ to break above 30000; if it does, a significant drop is highly probable afterward. However, there is also a chance that around 26500 could be a top for NASDAQ, considering the short-term outlook for a pullback. Historically, after the change of Fed chairs, the stock market tends to see double-digit declines within six months. This implies that the NASDAQ should pull back below 24000 before the year ends. From a cyclical perspective, the strength of the U.S. stock market is unlikely to persist until 2027.
I've maintained my gold position for a long time; historically (whether in 2011, 1996, or 1980), each peak in gold has lasted over six months. This means if gold is set to experience a significant drop, we’ll likely have to wait until at least August, as prior to that, it will be in a high-range consolidation phase. I’ve made several trades in gold; if we see a clear drop before August, theoretically, I could still capture 1-2 more long trades; however, if my long orders don’t get filled before then, I’ll have to cancel the pending orders. The holding period for my shorts has been around 2.5 years, and it appears I’ll need to hold for another 26 months.
In the cryptocurrency space, the probability of a small altcoin season is significantly higher in July-August. If Bitcoin indeed experiences a major drop in May-June, accumulating altcoins is essential.
Monthly Crypto Market Review (05.18)
Summary:
1. What does the surge in long-term U.S. Treasury rates mean?
2. U.S. stocks are soaring, inflation is skyrocketing, and Treasury yields are at new highs; one of these must be wrong.
3. Detailed analysis of U.S. stocks.
4. The leading trend of XLF.
5. Bitcoin's sustained strength is due to the bullish U.S. stock market.
6. Bitcoin's options during U.S. stock pullbacks.
Trading Strategy:
1. Holding short position for $BTC , take profit at 58000;
2. Holding short position for $ETH , take profit at 1610;
3. Holding short position for $SOL , take profit at 55.5;
4. On the short term, there’s a clear long opportunity for Bitcoin in the 74500-75000 range; to maintain an uptrend, the 74000 level cannot be breached on a daily candlestick. The current short-term pressure is around 79300, and this resistance will likely decrease over time.
5. For the day, 76300 is a high-probability support level.
In the U.S. stock market, I've built three layers of shorts (NASDAQ 24500, 25000, 26000). For every 1000-point increase in the NASDAQ, I plan to add another layer of shorts. The current holding period for these shorts is about 12-13 months. Many are anticipating the NASDAQ to break above 30000; if it does, a significant drop is highly probable afterward. However, there is also a chance that around 26500 could be a top for NASDAQ, considering the short-term outlook for a pullback. Historically, after the change of Fed chairs, the stock market tends to see double-digit declines within six months. This implies that the NASDAQ should pull back below 24000 before the year ends. From a cyclical perspective, the strength of the U.S. stock market is unlikely to persist until 2027.
I've maintained my gold position for a long time; historically (whether in 2011, 1996, or 1980), each peak in gold has lasted over six months. This means if gold is set to experience a significant drop, we’ll likely have to wait until at least August, as prior to that, it will be in a high-range consolidation phase. I’ve made several trades in gold; if we see a clear drop before August, theoretically, I could still capture 1-2 more long trades; however, if my long orders don’t get filled before then, I’ll have to cancel the pending orders. The holding period for my shorts has been around 2.5 years, and it appears I’ll need to hold for another 26 months.
In the cryptocurrency space, the probability of a small altcoin season is significantly higher in July-August. If Bitcoin indeed experiences a major drop in May-June, accumulating altcoins is essential.
Summary:
1. What does the surge in long-term U.S. Treasury rates mean?
2. U.S. stocks are soaring, inflation is skyrocketing, and Treasury yields are at new highs; one of these must be wrong.
3. Detailed analysis of U.S. stocks.
4. The leading trend of XLF.
5. Bitcoin's sustained strength is due to the bullish U.S. stock market.
6. Bitcoin's options during U.S. stock pullbacks.
Trading Strategy:
1. Holding short position for $BTC , take profit at 58000;
2. Holding short position for $ETH , take profit at 1610;
3. Holding short position for $SOL , take profit at 55.5;
4. On the short term, there’s a clear long opportunity for Bitcoin in the 74500-75000 range; to maintain an uptrend, the 74000 level cannot be breached on a daily candlestick. The current short-term pressure is around 79300, and this resistance will likely decrease over time.
5. For the day, 76300 is a high-probability support level.
In the U.S. stock market, I've built three layers of shorts (NASDAQ 24500, 25000, 26000). For every 1000-point increase in the NASDAQ, I plan to add another layer of shorts. The current holding period for these shorts is about 12-13 months. Many are anticipating the NASDAQ to break above 30000; if it does, a significant drop is highly probable afterward. However, there is also a chance that around 26500 could be a top for NASDAQ, considering the short-term outlook for a pullback. Historically, after the change of Fed chairs, the stock market tends to see double-digit declines within six months. This implies that the NASDAQ should pull back below 24000 before the year ends. From a cyclical perspective, the strength of the U.S. stock market is unlikely to persist until 2027.
I've maintained my gold position for a long time; historically (whether in 2011, 1996, or 1980), each peak in gold has lasted over six months. This means if gold is set to experience a significant drop, we’ll likely have to wait until at least August, as prior to that, it will be in a high-range consolidation phase. I’ve made several trades in gold; if we see a clear drop before August, theoretically, I could still capture 1-2 more long trades; however, if my long orders don’t get filled before then, I’ll have to cancel the pending orders. The holding period for my shorts has been around 2.5 years, and it appears I’ll need to hold for another 26 months.
In the cryptocurrency space, the probability of a small altcoin season is significantly higher in July-August. If Bitcoin indeed experiences a major drop in May-June, accumulating altcoins is essential.
74
1
126
43.4k
·
--
I took a look, and in the comments section with over 300 people, not a single person noticed that this picture is edited, which shows that there are really very few people doing trend trades in the square.
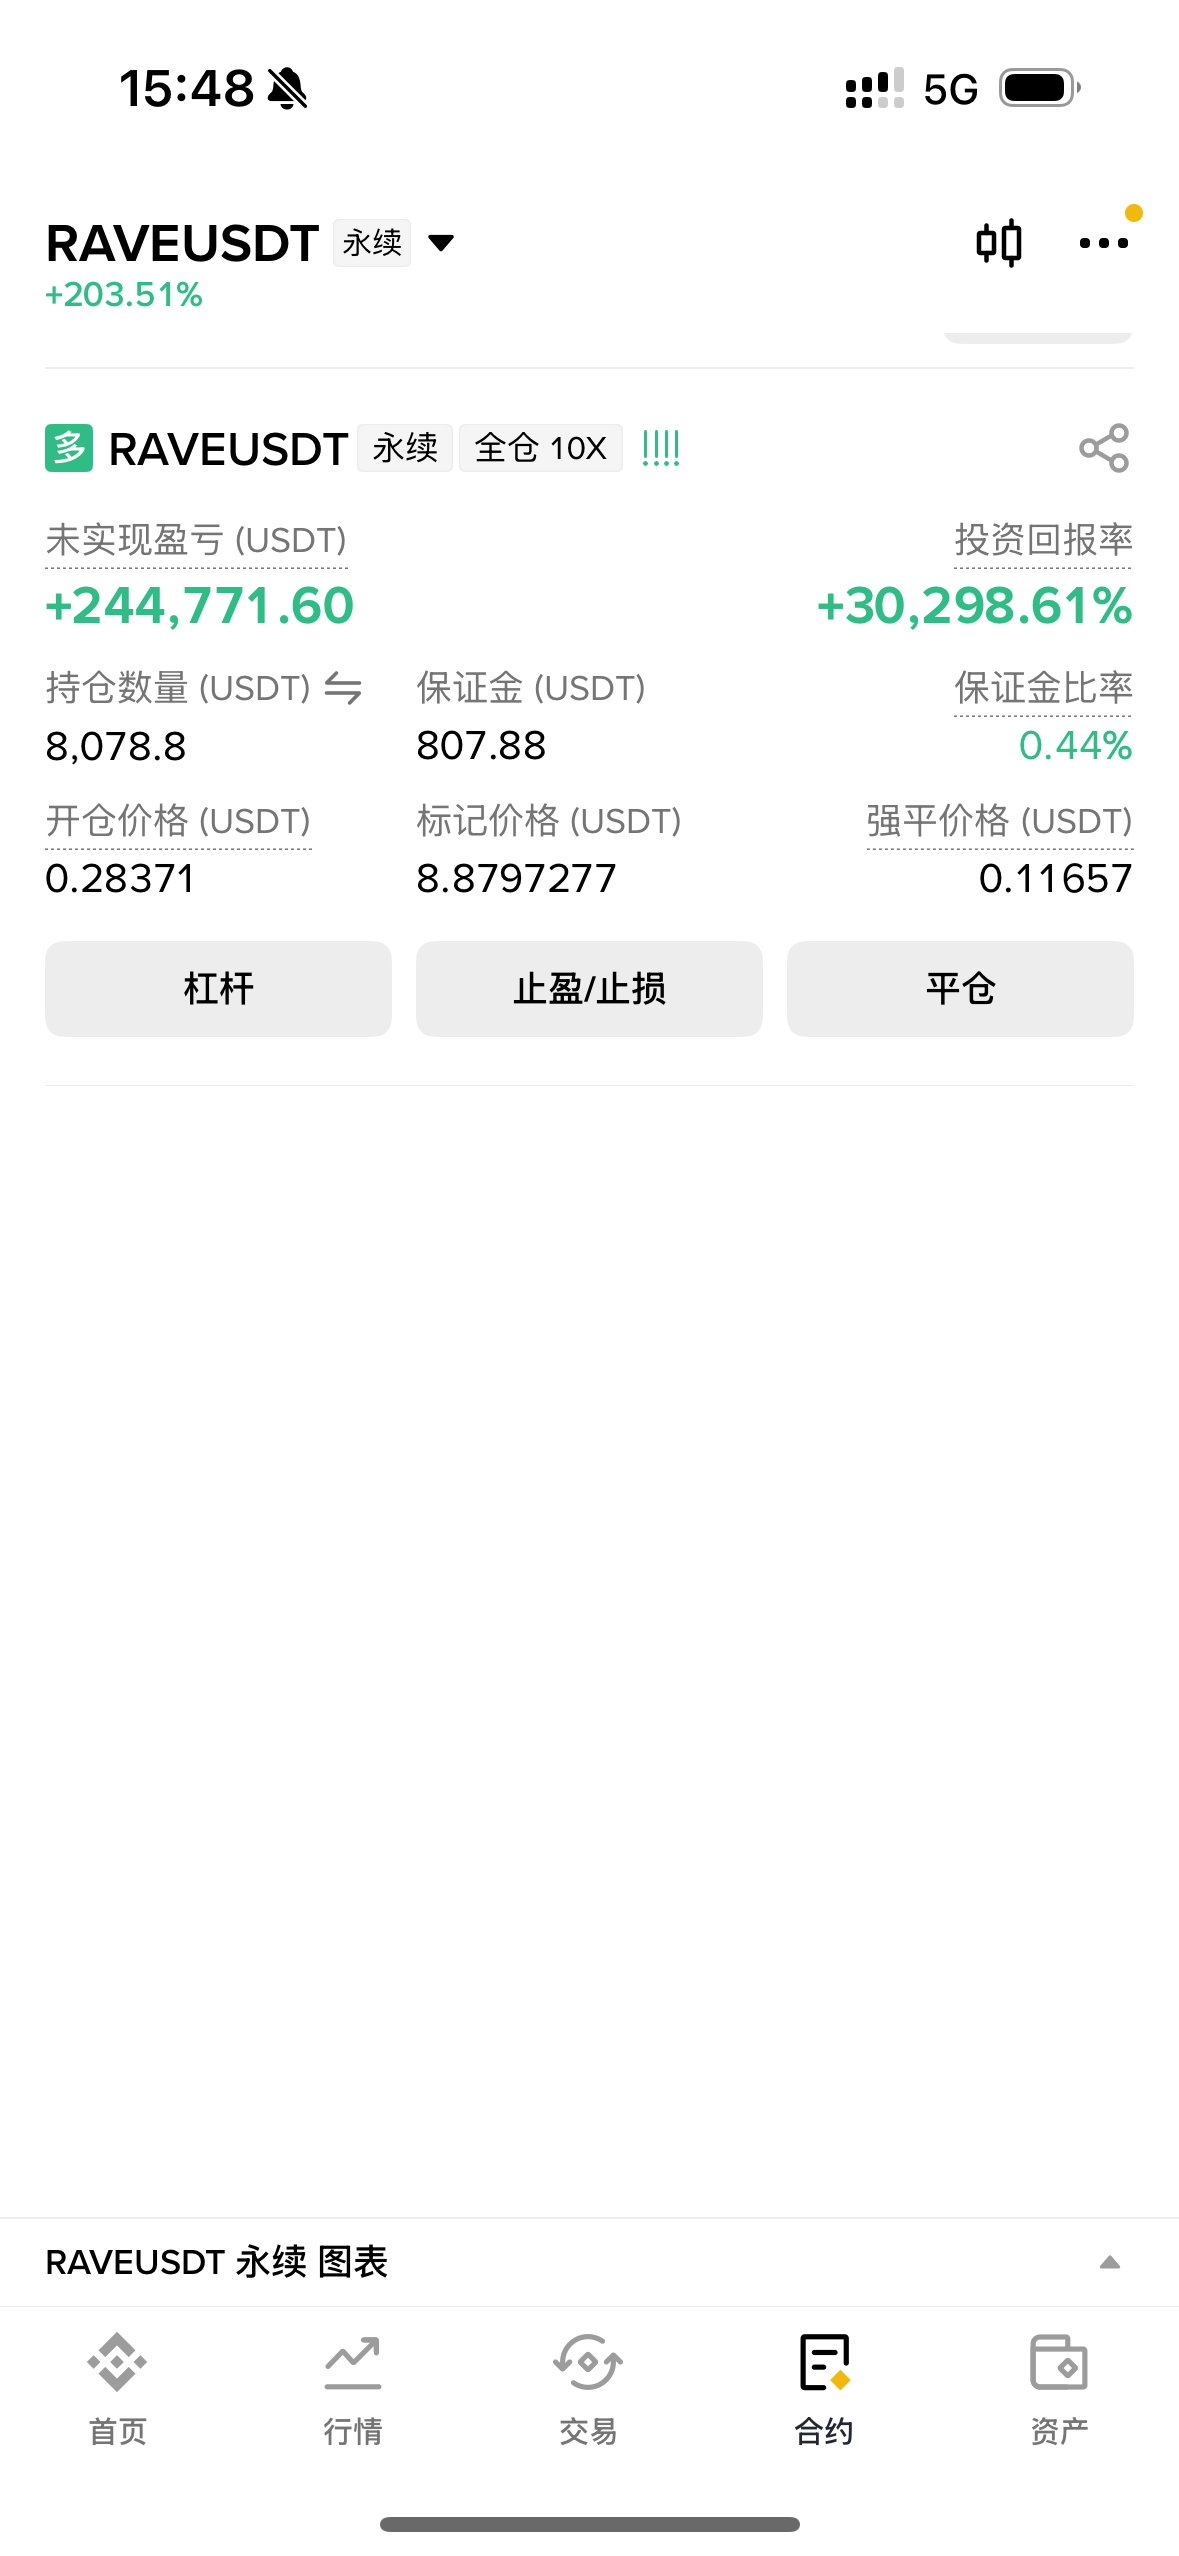
If he really used 800u to open a position, after the price of the coin multiplied by 30, his margin would become 24000u, and the liquidation price would also change (even if he has no other positions, the liquidation price is dynamic, because there are also fees, not to mention he has other positions). But if you look at his past posts, you will find that when the price of $RAVE was over 2 and over 8, his liquidation price was exactly the same to four decimal places.
To put it bluntly, he doesn't even bother to deceive!
He also said he would draw 20 people to give each 100u, which definitely requires editing the picture again. Don't you believe it? @Square-Creator-b9b7843327224 If anyone dares to post their trading card in the post (not asking for public real trading, just posting the trading card in the post). I will publicly apologize and transfer him 100u.
I took a look, and in the comments section with over 300 people, not a single person noticed that this picture is edited, which shows that there are really very few people doing trend trades in the square.
If he really used 800u to open a position, after the price of the coin multiplied by 30, his margin would become 24000u, and the liquidation price would also change (even if he has no other positions, the liquidation price is dynamic, because there are also fees, not to mention he has other positions). But if you look at his past posts, you will find that when the price of $RAVE was over 2 and over 8, his liquidation price was exactly the same to four decimal places.
To put it bluntly, he doesn't even bother to deceive!
He also said he would draw 20 people to give each 100u, which definitely requires editing the picture again. Don't you believe it? @东链大超哥 If anyone dares to post their trading card in the post (not asking for public real trading, just posting the trading card in the post). I will publicly apologize and transfer him 100u.
If he really used 800u to open a position, after the price of the coin multiplied by 30, his margin would become 24000u, and the liquidation price would also change (even if he has no other positions, the liquidation price is dynamic, because there are also fees, not to mention he has other positions). But if you look at his past posts, you will find that when the price of $RAVE was over 2 and over 8, his liquidation price was exactly the same to four decimal places.
To put it bluntly, he doesn't even bother to deceive!
He also said he would draw 20 people to give each 100u, which definitely requires editing the picture again. Don't you believe it? @东链大超哥 If anyone dares to post their trading card in the post (not asking for public real trading, just posting the trading card in the post). I will publicly apologize and transfer him 100u.

东链大超哥
·
--
#rave
RAVE I made 240,000 U with 1,000 dollars. Big Brother Chao is very happy, the lottery continues.
Now the prize pool has upgraded, I have added to 2,000 U, drawing 20 people, each person 100 U. (The comment sections of both posts participate)
I have put the lottery rules at the end of the article.
If it continues to rise, our prize pool will continue to increase, so pay attention to the changes in the prize pool.
Let me talk about my order opening thoughts.
It’s not me who found RAVE, it was told to me by a community buddy.
There was a brother in the group who suddenly sent a message one day: RAVE at this position, someone is building a position.
I went to check the data.
Funding rate, negative.
On-chain data, a big player is secretly buying.
Unlock time is in the front.
I thought it was possible, but I waited for three days.
Waited for it to hold down, waited for it not to rise, waited for those who want to bottom out to be unable to wait.
0.28 U, I went in.
After I went in, the group was full of ridicule: Why did you buy this?
I ignored it.
When it was at 0.5 U, someone asked if I was going to run?
I glanced at the data, didn’t move.
When it was at 1.0 U, the group became even more lively: Look, what did I say?
I still didn’t move.
2.0 U, 3.0 U, 4.0 U……
The group gradually quieted down.
Now it’s 9 U, RAVE is still pulling.?
But this coin will inevitably waterfall sooner or later, must pay attention.
The draw is on April 15, I will post the screenshot.
$RAVE
RAVE I made 240,000 U with 1,000 dollars. Big Brother Chao is very happy, the lottery continues.
Now the prize pool has upgraded, I have added to 2,000 U, drawing 20 people, each person 100 U. (The comment sections of both posts participate)
I have put the lottery rules at the end of the article.
If it continues to rise, our prize pool will continue to increase, so pay attention to the changes in the prize pool.
Let me talk about my order opening thoughts.
It’s not me who found RAVE, it was told to me by a community buddy.
There was a brother in the group who suddenly sent a message one day: RAVE at this position, someone is building a position.
I went to check the data.
Funding rate, negative.
On-chain data, a big player is secretly buying.
Unlock time is in the front.
I thought it was possible, but I waited for three days.
Waited for it to hold down, waited for it not to rise, waited for those who want to bottom out to be unable to wait.
0.28 U, I went in.
After I went in, the group was full of ridicule: Why did you buy this?
I ignored it.
When it was at 0.5 U, someone asked if I was going to run?
I glanced at the data, didn’t move.
When it was at 1.0 U, the group became even more lively: Look, what did I say?
I still didn’t move.
2.0 U, 3.0 U, 4.0 U……
The group gradually quieted down.
Now it’s 9 U, RAVE is still pulling.?
But this coin will inevitably waterfall sooner or later, must pay attention.
The draw is on April 15, I will post the screenshot.
$RAVE
56
3
38
31.5k
·
--

Article
Recent Thoughts (26.04.04)1. The rebound of the US stock market is in line with expectations; this is not hindsight. I also mentioned the expectation of the US stock market rebound in the chat room on Tuesday morning.
From a technical perspective, whether in 2000 or 2008, when the US stock market first touches the weekly MA60 at the beginning of a bear market, there will be a phase of rebound, reflected in the K-line as at least two consecutive weekly gains. The greed index of the US stock market touched around 10 at the end of March, reaching extreme fear. In the NASDAQ 100 index, less than 15% of the constituent stocks are above the daily MA50, a ratio that has historically indicated a relatively clear phase of rebound.
Recent Thoughts (26.04.04)
1. The rebound of the US stock market is in line with expectations; this is not hindsight. I also mentioned the expectation of the US stock market rebound in the chat room on Tuesday morning.
From a technical perspective, whether in 2000 or 2008, when the US stock market first touches the weekly MA60 at the beginning of a bear market, there will be a phase of rebound, reflected in the K-line as at least two consecutive weekly gains. The greed index of the US stock market touched around 10 at the end of March, reaching extreme fear. In the NASDAQ 100 index, less than 15% of the constituent stocks are above the daily MA50, a ratio that has historically indicated a relatively clear phase of rebound.
From a technical perspective, whether in 2000 or 2008, when the US stock market first touches the weekly MA60 at the beginning of a bear market, there will be a phase of rebound, reflected in the K-line as at least two consecutive weekly gains. The greed index of the US stock market touched around 10 at the end of March, reaching extreme fear. In the NASDAQ 100 index, less than 15% of the constituent stocks are above the daily MA50, a ratio that has historically indicated a relatively clear phase of rebound.
26
5
78
18k
·
--
Verified
@oldjiuge Old Nine, don't @ me anymore, I just want to silently like, really don't want to post. Always saying we should gather but haven't yet, it's really a pity. If there's an opportunity this year, we must gather once.
Everyone, don't expect my analysis anymore, the analysis will not be updated, at most I will occasionally share some of my "insights".
I actually organize every day and can share with everyone:
1. The essence of going with the trend is to chase highs and cut losses, which is the biggest scam in the crypto world. Those who recognize "going with the trend" essentially lack the ability to anchor value. Moreover, most of the time in the crypto market is in turbulence, and the probability of false breakouts and false breakdowns is greater than that of true breakouts and true breakdowns, so discussing going with the trend from a trading strategy perspective is also very poor.
2. In the next cycle, the growth space for DEX and RWA will be very large.
3. If the monthly line shows 6 consecutive bearish candles, then in April, we can only maintain a buying strategy. The entry of short positions must wait until the monthly line closes with a bullish candle before looking for positions.
4. The Nasdaq performed better than the S&P last week, indicating a short-term overselling of tech stocks.
5. Last Thursday, the short positions of the US-listed ETFs increased by 10% in a single day, the second-largest single-day increase on record, only behind the 16% increase in early April 2025. After April 2025, a period of violent rise occurred in the market.
6. The reason a rebound is not a reversal: After the tariff hammer in April 2025, retail investors went crazy buying the dip. However, last week, the weekly purchase scale of retail investors suddenly dropped by 30%, and the net inflow of ETFs decreased by 22%. Combined with the bullish leverage situation mentioned in my last article, it can be confirmed that retail investors no longer have extra bullets.
7. The biggest pain point on March 27 is 75000.
8. $RIVER This project is limited by the upper limit of the chain abstraction track, and the coin price should not exceed 50. However, the project team is still reliable; many people have forgotten the activities from 2 years ago, but after 2 years, the project team has still distributed the activity rewards. Such a project team is at least not bad people.
9. $HYPE The current market value is a bit high. But just for the fact that it almost uses all its income for buybacks and has destroyed most of the buybacks, you know this is a good project, and you can feel the determination of the project team.
10. In the past month, the only way to profit from shorting is to do it without losses and without a big picture. And such a trading strategy has a very low cost-performance ratio when viewed in the long run.
11. There have been 20 military conflicts after World War II, and from the start of the conflict to the lowest point, the S&P has averaged a decline of 6%, recovering the decline in an average of 28 days in 19 of the incidents.
@Old九歌 Old Nine, don't @ me anymore, I just want to silently like, really don't want to post. Always saying we should gather but haven't yet, it's really a pity. If there's an opportunity this year, we must gather once.
Everyone, don't expect my analysis anymore, the analysis will not be updated, at most I will occasionally share some of my "insights".
I actually organize every day and can share with everyone:
1. The essence of going with the trend is to chase highs and cut losses, which is the biggest scam in the crypto world. Those who recognize "going with the trend" essentially lack the ability to anchor value. Moreover, most of the time in the crypto market is in turbulence, and the probability of false breakouts and false breakdowns is greater than that of true breakouts and true breakdowns, so discussing going with the trend from a trading strategy perspective is also very poor.
2. In the next cycle, the growth space for DEX and RWA will be very large.
3. If the monthly line shows 6 consecutive bearish candles, then in April, we can only maintain a buying strategy. The entry of short positions must wait until the monthly line closes with a bullish candle before looking for positions.
4. The Nasdaq performed better than the S&P last week, indicating a short-term overselling of tech stocks.
5. Last Thursday, the short positions of the US-listed ETFs increased by 10% in a single day, the second-largest single-day increase on record, only behind the 16% increase in early April 2025. After April 2025, a period of violent rise occurred in the market.
6. The reason a rebound is not a reversal: After the tariff hammer in April 2025, retail investors went crazy buying the dip. However, last week, the weekly purchase scale of retail investors suddenly dropped by 30%, and the net inflow of ETFs decreased by 22%. Combined with the bullish leverage situation mentioned in my last article, it can be confirmed that retail investors no longer have extra bullets.
7. The biggest pain point on March 27 is 75000.
8. $RIVER This project is limited by the upper limit of the chain abstraction track, and the coin price should not exceed 50. However, the project team is still reliable; many people have forgotten the activities from 2 years ago, but after 2 years, the project team has still distributed the activity rewards. Such a project team is at least not bad people.
9. $HYPE The current market value is a bit high. But just for the fact that it almost uses all its income for buybacks and has destroyed most of the buybacks, you know this is a good project, and you can feel the determination of the project team.
10. In the past month, the only way to profit from shorting is to do it without losses and without a big picture. And such a trading strategy has a very low cost-performance ratio when viewed in the long run.
11. There have been 20 military conflicts after World War II, and from the start of the conflict to the lowest point, the S&P has averaged a decline of 6%, recovering the decline in an average of 28 days in 19 of the incidents.
Everyone, don't expect my analysis anymore, the analysis will not be updated, at most I will occasionally share some of my "insights".
I actually organize every day and can share with everyone:
1. The essence of going with the trend is to chase highs and cut losses, which is the biggest scam in the crypto world. Those who recognize "going with the trend" essentially lack the ability to anchor value. Moreover, most of the time in the crypto market is in turbulence, and the probability of false breakouts and false breakdowns is greater than that of true breakouts and true breakdowns, so discussing going with the trend from a trading strategy perspective is also very poor.
2. In the next cycle, the growth space for DEX and RWA will be very large.
3. If the monthly line shows 6 consecutive bearish candles, then in April, we can only maintain a buying strategy. The entry of short positions must wait until the monthly line closes with a bullish candle before looking for positions.
4. The Nasdaq performed better than the S&P last week, indicating a short-term overselling of tech stocks.
5. Last Thursday, the short positions of the US-listed ETFs increased by 10% in a single day, the second-largest single-day increase on record, only behind the 16% increase in early April 2025. After April 2025, a period of violent rise occurred in the market.
6. The reason a rebound is not a reversal: After the tariff hammer in April 2025, retail investors went crazy buying the dip. However, last week, the weekly purchase scale of retail investors suddenly dropped by 30%, and the net inflow of ETFs decreased by 22%. Combined with the bullish leverage situation mentioned in my last article, it can be confirmed that retail investors no longer have extra bullets.
7. The biggest pain point on March 27 is 75000.
8. $RIVER This project is limited by the upper limit of the chain abstraction track, and the coin price should not exceed 50. However, the project team is still reliable; many people have forgotten the activities from 2 years ago, but after 2 years, the project team has still distributed the activity rewards. Such a project team is at least not bad people.
9. $HYPE The current market value is a bit high. But just for the fact that it almost uses all its income for buybacks and has destroyed most of the buybacks, you know this is a good project, and you can feel the determination of the project team.
10. In the past month, the only way to profit from shorting is to do it without losses and without a big picture. And such a trading strategy has a very low cost-performance ratio when viewed in the long run.
11. There have been 20 military conflicts after World War II, and from the start of the conflict to the lowest point, the S&P has averaged a decline of 6%, recovering the decline in an average of 28 days in 19 of the incidents.
83
8
106
53k
·
--
Partly True

Article
Some recent thoughtsFirst, I want to say something off-topic. Just two days ago, someone asked me about the FY issue. Actually, I mentioned it on January 1st, that from now on, FY will be automatically refunded, and the specific details can be found in the fund flow.
I originally thought I wouldn't post anymore, but recently I've had some new insights and thoughts, so I'll just casually write it down like a diary.
First of all, regarding the hoarding operation of altcoins during the bear market, I feel that this round of bear market will have a very different operational logic compared to previous bear markets. These changes in logic may even affect the price trends of ETH and SOL.
Some recent thoughts
First, I want to say something off-topic. Just two days ago, someone asked me about the FY issue. Actually, I mentioned it on January 1st, that from now on, FY will be automatically refunded, and the specific details can be found in the fund flow.
I originally thought I wouldn't post anymore, but recently I've had some new insights and thoughts, so I'll just casually write it down like a diary.
First of all, regarding the hoarding operation of altcoins during the bear market, I feel that this round of bear market will have a very different operational logic compared to previous bear markets. These changes in logic may even affect the price trends of ETH and SOL.
I originally thought I wouldn't post anymore, but recently I've had some new insights and thoughts, so I'll just casually write it down like a diary.
First of all, regarding the hoarding operation of altcoins during the bear market, I feel that this round of bear market will have a very different operational logic compared to previous bear markets. These changes in logic may even affect the price trends of ETH and SOL.
97
8
136
36.4k
·
--

Article
Goodbye, friends.Waking up in the middle of the night, I found the news exploded, so I opened Binance to take a look, and instantly lost all sleepiness.
Not only do we need to close the weekly line, but we also need to close the monthly line. Can we really play like this in the middle of Saturday night? Are we really going straight to 58000?
Incredible, speechless.
My current mood is quite complicated, hard to put into words. If I must say something, it’s disappointment, 30% towards this market and 70% towards myself. I indeed walked into a market I can't understand, and I don't blame anyone or anything; I accept it.
Regarding the issue of margin calls, I was initially puzzled. Careful friends should have noticed that I have been trying my best to ensure the consistency of positions and average prices between my personal account and the margin account, so the liquidation prices of the two accounts are very close.
Goodbye, friends.
Waking up in the middle of the night, I found the news exploded, so I opened Binance to take a look, and instantly lost all sleepiness.
Not only do we need to close the weekly line, but we also need to close the monthly line. Can we really play like this in the middle of Saturday night? Are we really going straight to 58000?
Incredible, speechless.
My current mood is quite complicated, hard to put into words. If I must say something, it’s disappointment, 30% towards this market and 70% towards myself. I indeed walked into a market I can't understand, and I don't blame anyone or anything; I accept it.
Regarding the issue of margin calls, I was initially puzzled. Careful friends should have noticed that I have been trying my best to ensure the consistency of positions and average prices between my personal account and the margin account, so the liquidation prices of the two accounts are very close.
Not only do we need to close the weekly line, but we also need to close the monthly line. Can we really play like this in the middle of Saturday night? Are we really going straight to 58000?
Incredible, speechless.
My current mood is quite complicated, hard to put into words. If I must say something, it’s disappointment, 30% towards this market and 70% towards myself. I indeed walked into a market I can't understand, and I don't blame anyone or anything; I accept it.
Regarding the issue of margin calls, I was initially puzzled. Careful friends should have noticed that I have been trying my best to ensure the consistency of positions and average prices between my personal account and the margin account, so the liquidation prices of the two accounts are very close.
180
56
129
23.9k
Log in to explore more content
Join global crypto users on Binance Square
⚡️ Get latest and useful information about crypto.
💬 Trusted by the world’s largest crypto exchange.
👍 Discover real insights from verified creators.
Email / Phone number
Trending Topics
AltcoinSeasonIndexHoldsAbove60For5Days
0 views
17 Discussing
#AltcoinSeasonIndexHoldsAbove60For5Days ALTCOIN SEASON WATCH 🚨
#AltcoinSeasonIndexHoldsAbove60For5Days 📈🔥
The Altcoin Season Index has stayed above 60 for 5 consecutive days 👀
Could this be a sign that capital is rotating from $BTC into altcoins? 💰⚡
The market is heating up, and altcoin traders are watching closely. 🚀
#Altcoins #Crypto #AltcoinSeason #BTC $ALT
$RARE
$NVDA.US
Crypto_With_Kinza
·0 Likes
·10 views
BitcoinSlipsBelow$84000
408 views
44 Discussing
KospiPostsWorstQuarterSince2020
0 views
11 Discussing