
Crypto_Insider_007
23 Posts

Crypto_Insider_007
Report
Block User
Crypto Trader | Market Analyst Passionate about spotting trends & patterns Let’s grow and learn together in crypto!
22 Following
82 Followers
82 Liked
Posts
All
Quotes
PINNED
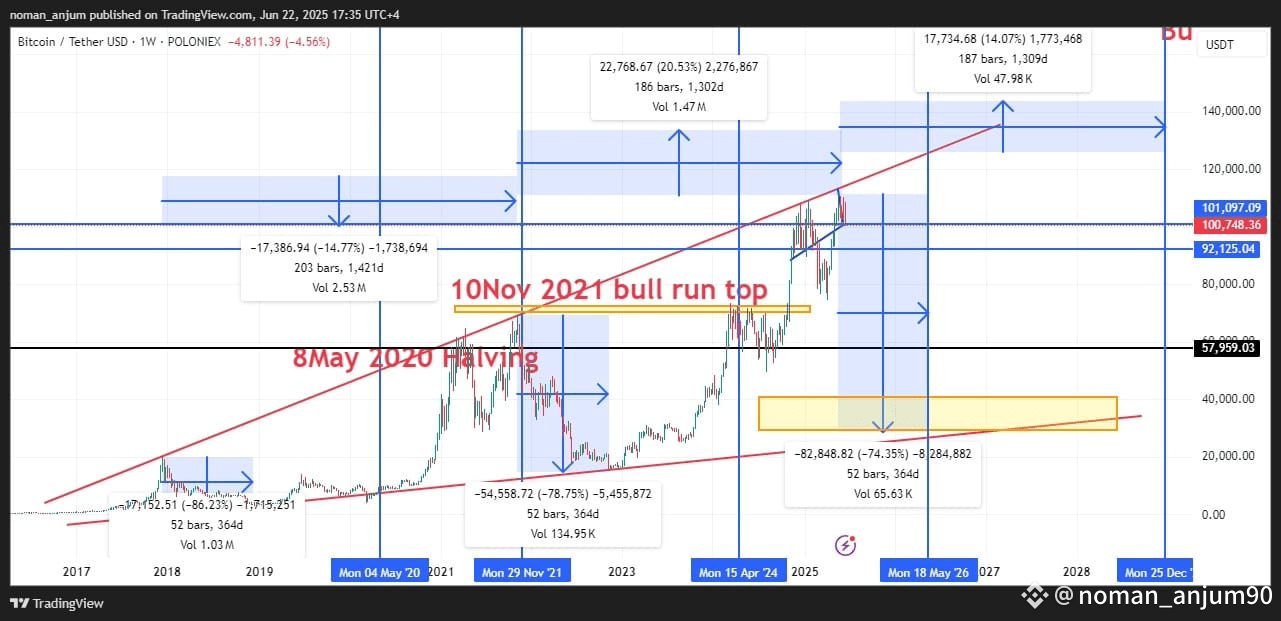
Current Range is a Trap: The market is consolidating to bait retail into longing.
Big Dip Ahead: Anticipated capitulation mirroring past cycles (~70–80% drop).
May 2026 = Cycle Bottom: Historically in sync with ~1.5 years post-halving (Apr 2024).
No Altseason This Cycle: Suggesting dominance stays with BTC; alts won’t see usual hype runs.
🔮 Potential Strategic Implications
Short-Term Traders: May want to stay cautious on longs at current levels.
Investors: Consider planning buys near the projected 2026 bottom zone ($30k–$40k region in your yellow box).
Alts Investors: Rebalance expectations — instead of a broad altseason, focus on strong fundamentals and real-world use cases.
Current Range is a Trap: The market is consolidating to bait retail into longing.
Big Dip Ahead: Anticipated capitulation mirroring past cycles (~70–80% drop).
May 2026 = Cycle Bottom: Historically in sync with ~1.5 years post-halving (Apr 2024).
No Altseason This Cycle: Suggesting dominance stays with BTC; alts won’t see usual hype runs.
🔮 Potential Strategic Implications
Short-Term Traders: May want to stay cautious on longs at current levels.
Investors: Consider planning buys near the projected 2026 bottom zone ($30k–$40k region in your yellow box).
Alts Investors: Rebalance expectations — instead of a broad altseason, focus on strong fundamentals and real-world use cases.
Big Dip Ahead: Anticipated capitulation mirroring past cycles (~70–80% drop).
May 2026 = Cycle Bottom: Historically in sync with ~1.5 years post-halving (Apr 2024).
No Altseason This Cycle: Suggesting dominance stays with BTC; alts won’t see usual hype runs.
🔮 Potential Strategic Implications
Short-Term Traders: May want to stay cautious on longs at current levels.
Investors: Consider planning buys near the projected 2026 bottom zone ($30k–$40k region in your yellow box).
Alts Investors: Rebalance expectations — instead of a broad altseason, focus on strong fundamentals and real-world use cases.
16
12
33
62.1k
·
--
Bearish
atlast it happens :D same
atlast it happens :D same
Crypto_Insider_007
·
--
Current Range is a Trap: The market is consolidating to bait retail into longing.
Big Dip Ahead: Anticipated capitulation mirroring past cycles (~70–80% drop).
May 2026 = Cycle Bottom: Historically in sync with ~1.5 years post-halving (Apr 2024).
No Altseason This Cycle: Suggesting dominance stays with BTC; alts won’t see usual hype runs.
🔮 Potential Strategic Implications
Short-Term Traders: May want to stay cautious on longs at current levels.
Investors: Consider planning buys near the projected 2026 bottom zone ($30k–$40k region in your yellow box).
Alts Investors: Rebalance expectations — instead of a broad altseason, focus on strong fundamentals and real-world use cases.
Big Dip Ahead: Anticipated capitulation mirroring past cycles (~70–80% drop).
May 2026 = Cycle Bottom: Historically in sync with ~1.5 years post-halving (Apr 2024).
No Altseason This Cycle: Suggesting dominance stays with BTC; alts won’t see usual hype runs.
🔮 Potential Strategic Implications
Short-Term Traders: May want to stay cautious on longs at current levels.
Investors: Consider planning buys near the projected 2026 bottom zone ($30k–$40k region in your yellow box).
Alts Investors: Rebalance expectations — instead of a broad altseason, focus on strong fundamentals and real-world use cases.
59
·
--
Bearish
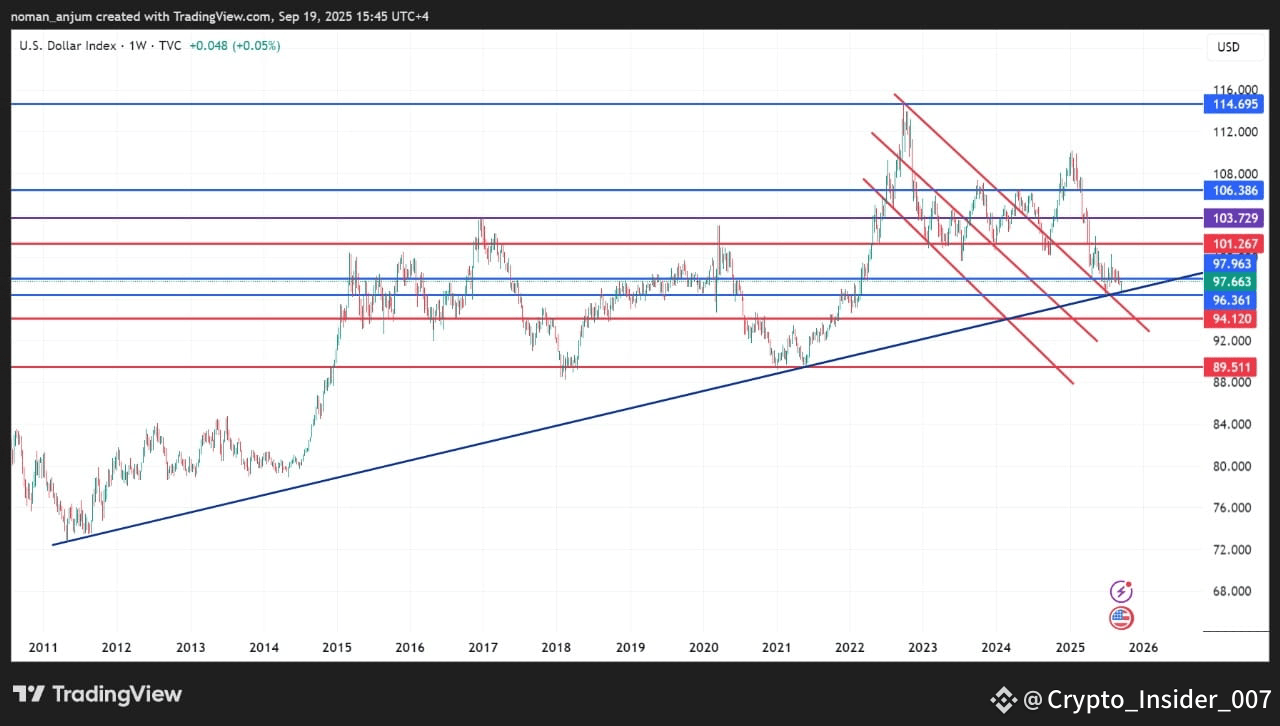
U.S. Dollar Index (DXY) weekly chart with long-term trendlines, horizontal support/resistance levels, and downward channels drawn. Here’s the breakdown:
🔎 Technical Analysis
1. Major Trend
The long-term blue uptrend line (from ~2011) is still intact.
Price is testing this trendline now (~97–98 zone). A break below would be very significant.
2. Support Levels
97.96 – 97.66 → Strong cluster of support (previous structure + trendline confluence).
96.36 → Next strong support.
94.12 → Key downside level if weakness continues.
89.51 → Major long-term support (multi-year base).
3. Resistance Levels
101.26 → Nearest strong resistance above.
103.72 → Major resistance (rejected multiple times).
106.38 → Strong historical resistance.
114.69 → Cycle high resistance.
4. Channels (red lines)
Price is moving within a falling channel, suggesting bearish pressure is dominant since 2022 highs (~114).
Each bounce lower is making weaker highs.
5. Outlook
If 97–98 zone holds, a bounce toward 101–103 is likely.
If it breaks below 97, the index could head toward 96 → 94 → 89.5.
Long-term trend still up unless 89.5 breaks, which would flip macro bias bearish.
---
✅ In short:
Key battleground = 97–98.
Hold = bounce to 101–103.
Break = deeper correction toward 94–89.
U.S. Dollar Index (DXY) weekly chart with long-term trendlines, horizontal support/resistance levels, and downward channels drawn. Here’s the breakdown:
🔎 Technical Analysis
1. Major Trend
The long-term blue uptrend line (from ~2011) is still intact.
Price is testing this trendline now (~97–98 zone). A break below would be very significant.
2. Support Levels
97.96 – 97.66 → Strong cluster of support (previous structure + trendline confluence).
96.36 → Next strong support.
94.12 → Key downside level if weakness continues.
89.51 → Major long-term support (multi-year base).
3. Resistance Levels
101.26 → Nearest strong resistance above.
103.72 → Major resistance (rejected multiple times).
106.38 → Strong historical resistance.
114.69 → Cycle high resistance.
4. Channels (red lines)
Price is moving within a falling channel, suggesting bearish pressure is dominant since 2022 highs (~114).
Each bounce lower is making weaker highs.
5. Outlook
If 97–98 zone holds, a bounce toward 101–103 is likely.
If it breaks below 97, the index could head toward 96 → 94 → 89.5.
Long-term trend still up unless 89.5 breaks, which would flip macro bias bearish.
---
✅ In short:
Key battleground = 97–98.
Hold = bounce to 101–103.
Break = deeper correction toward 94–89.
🔎 Technical Analysis
1. Major Trend
The long-term blue uptrend line (from ~2011) is still intact.
Price is testing this trendline now (~97–98 zone). A break below would be very significant.
2. Support Levels
97.96 – 97.66 → Strong cluster of support (previous structure + trendline confluence).
96.36 → Next strong support.
94.12 → Key downside level if weakness continues.
89.51 → Major long-term support (multi-year base).
3. Resistance Levels
101.26 → Nearest strong resistance above.
103.72 → Major resistance (rejected multiple times).
106.38 → Strong historical resistance.
114.69 → Cycle high resistance.
4. Channels (red lines)
Price is moving within a falling channel, suggesting bearish pressure is dominant since 2022 highs (~114).
Each bounce lower is making weaker highs.
5. Outlook
If 97–98 zone holds, a bounce toward 101–103 is likely.
If it breaks below 97, the index could head toward 96 → 94 → 89.5.
Long-term trend still up unless 89.5 breaks, which would flip macro bias bearish.
---
✅ In short:
Key battleground = 97–98.
Hold = bounce to 101–103.
Break = deeper correction toward 94–89.
47
·
--
Bearish
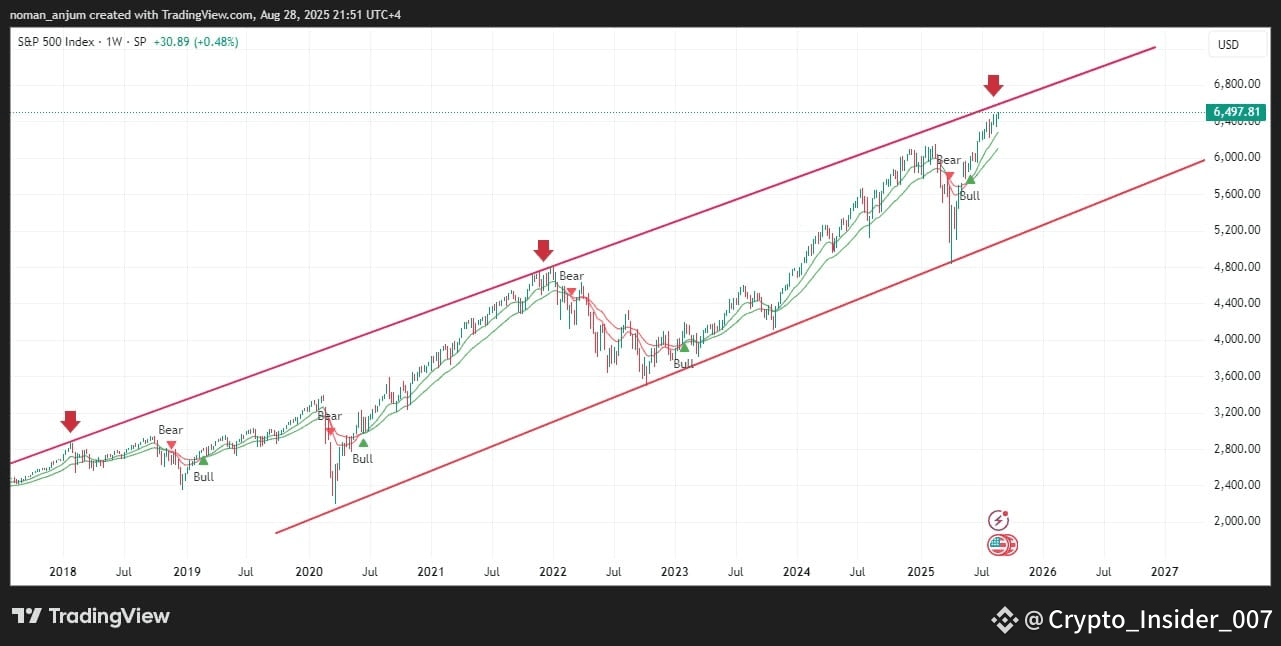
BTC tops have correlated with S&P 500 tops historically. Let’s break it down step by step:
---
1. S&P 500 Major Tops (Recent)
Jan 2018 → Hit channel top (red arrow on your chart)
Dec 2021 / Jan 2022 → Another major peak before correction
Aug 2025 → Currently testing the channel top again
---
2. BTC Behavior at the Same Times
Jan 2018 (S&P top)
BTC had just hit its $20k ATH in Dec 2017
Entered a brutal bear market right after (–85% over 1 year)
Dec 2021 / Jan 2022 (S&P top)
BTC made its $69k ATH in Nov 2021 (a bit earlier)
By Jan 2022, BTC was already rolling over → start of crypto winter
S&P peaked slightly after BTC, but both aligned in topping cycle
Aug 2025 (S&P testing top now)
If history rhymes → BTC could be near or just past a major cycle top.
BTC cycle usually peaks slightly earlier than equities (crypto is higher-beta and leads risk sentiment).
---
3. Correlation Insight
BTC tends to top slightly before or around S&P tops.
After S&P tops → both enter risk-off periods (BTC falls harder, equities correct moderately).
BTC bottoms often align with S&P major lows (e.g., Mar 2020 crash, Nov 2022 lows).
---
4. Implication for Now (Aug 2025)
Since S&P is at resistance → BTC may either:
Already be at/near its cycle top (like Nov 2021 before S&P Jan 2022), or
Could top within the next 1–3 months if S&P confirms reversal.
If S&P rejects at channel → BTC likely heads into next bear phase.
If S&P breaks out strongly → BTC could extend into a supercycle rally (less likely but possible).
---
📌 In short:
BTC cycle tops often precede or coincide with S&P tops. With S&P at resistance now, BTC could be at/near its 2025 macro peak. $BTC
BTC tops have correlated with S&P 500 tops historically. Let’s break it down step by step:
---
1. S&P 500 Major Tops (Recent)
Jan 2018 → Hit channel top (red arrow on your chart)
Dec 2021 / Jan 2022 → Another major peak before correction
Aug 2025 → Currently testing the channel top again
---
2. BTC Behavior at the Same Times
Jan 2018 (S&P top)
BTC had just hit its $20k ATH in Dec 2017
Entered a brutal bear market right after (–85% over 1 year)
Dec 2021 / Jan 2022 (S&P top)
BTC made its $69k ATH in Nov 2021 (a bit earlier)
By Jan 2022, BTC was already rolling over → start of crypto winter
S&P peaked slightly after BTC, but both aligned in topping cycle
Aug 2025 (S&P testing top now)
If history rhymes → BTC could be near or just past a major cycle top.
BTC cycle usually peaks slightly earlier than equities (crypto is higher-beta and leads risk sentiment).
---
3. Correlation Insight
BTC tends to top slightly before or around S&P tops.
After S&P tops → both enter risk-off periods (BTC falls harder, equities correct moderately).
BTC bottoms often align with S&P major lows (e.g., Mar 2020 crash, Nov 2022 lows).
---
4. Implication for Now (Aug 2025)
Since S&P is at resistance → BTC may either:
Already be at/near its cycle top (like Nov 2021 before S&P Jan 2022), or
Could top within the next 1–3 months if S&P confirms reversal.
If S&P rejects at channel → BTC likely heads into next bear phase.
If S&P breaks out strongly → BTC could extend into a supercycle rally (less likely but possible).
---
📌 In short:
BTC cycle tops often precede or coincide with S&P tops. With S&P at resistance now, BTC could be at/near its 2025 macro peak. $BTC
---
1. S&P 500 Major Tops (Recent)
Jan 2018 → Hit channel top (red arrow on your chart)
Dec 2021 / Jan 2022 → Another major peak before correction
Aug 2025 → Currently testing the channel top again
---
2. BTC Behavior at the Same Times
Jan 2018 (S&P top)
BTC had just hit its $20k ATH in Dec 2017
Entered a brutal bear market right after (–85% over 1 year)
Dec 2021 / Jan 2022 (S&P top)
BTC made its $69k ATH in Nov 2021 (a bit earlier)
By Jan 2022, BTC was already rolling over → start of crypto winter
S&P peaked slightly after BTC, but both aligned in topping cycle
Aug 2025 (S&P testing top now)
If history rhymes → BTC could be near or just past a major cycle top.
BTC cycle usually peaks slightly earlier than equities (crypto is higher-beta and leads risk sentiment).
---
3. Correlation Insight
BTC tends to top slightly before or around S&P tops.
After S&P tops → both enter risk-off periods (BTC falls harder, equities correct moderately).
BTC bottoms often align with S&P major lows (e.g., Mar 2020 crash, Nov 2022 lows).
---
4. Implication for Now (Aug 2025)
Since S&P is at resistance → BTC may either:
Already be at/near its cycle top (like Nov 2021 before S&P Jan 2022), or
Could top within the next 1–3 months if S&P confirms reversal.
If S&P rejects at channel → BTC likely heads into next bear phase.
If S&P breaks out strongly → BTC could extend into a supercycle rally (less likely but possible).
---
📌 In short:
BTC cycle tops often precede or coincide with S&P tops. With S&P at resistance now, BTC could be at/near its 2025 macro peak. $BTC
219
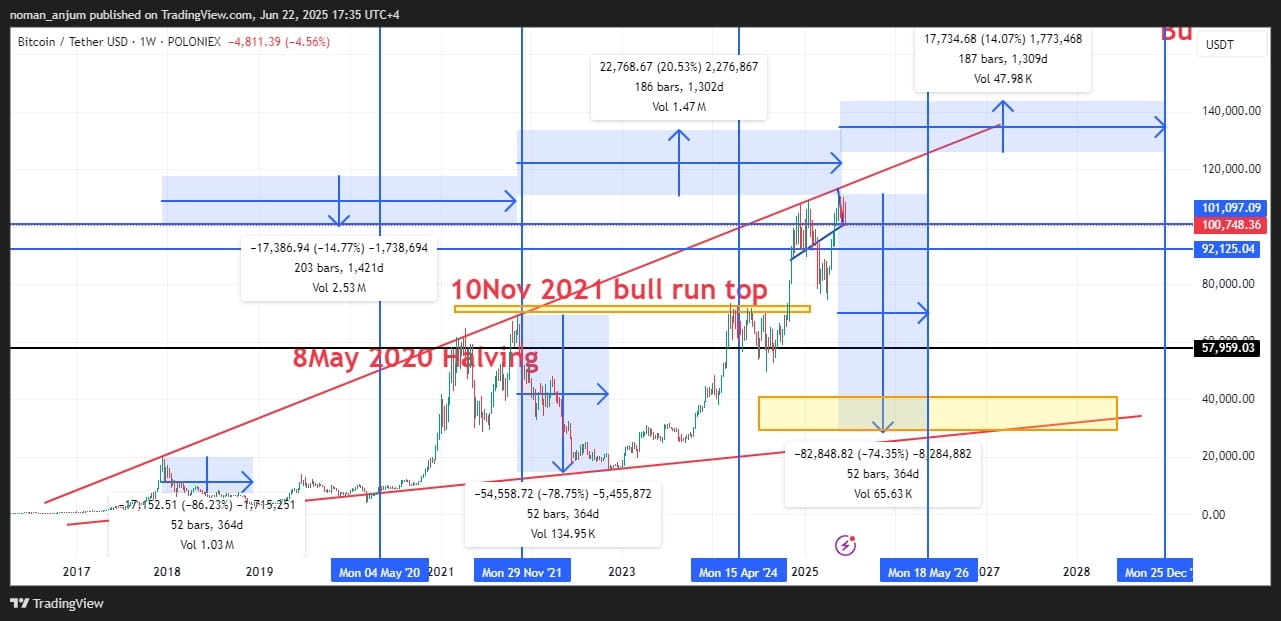
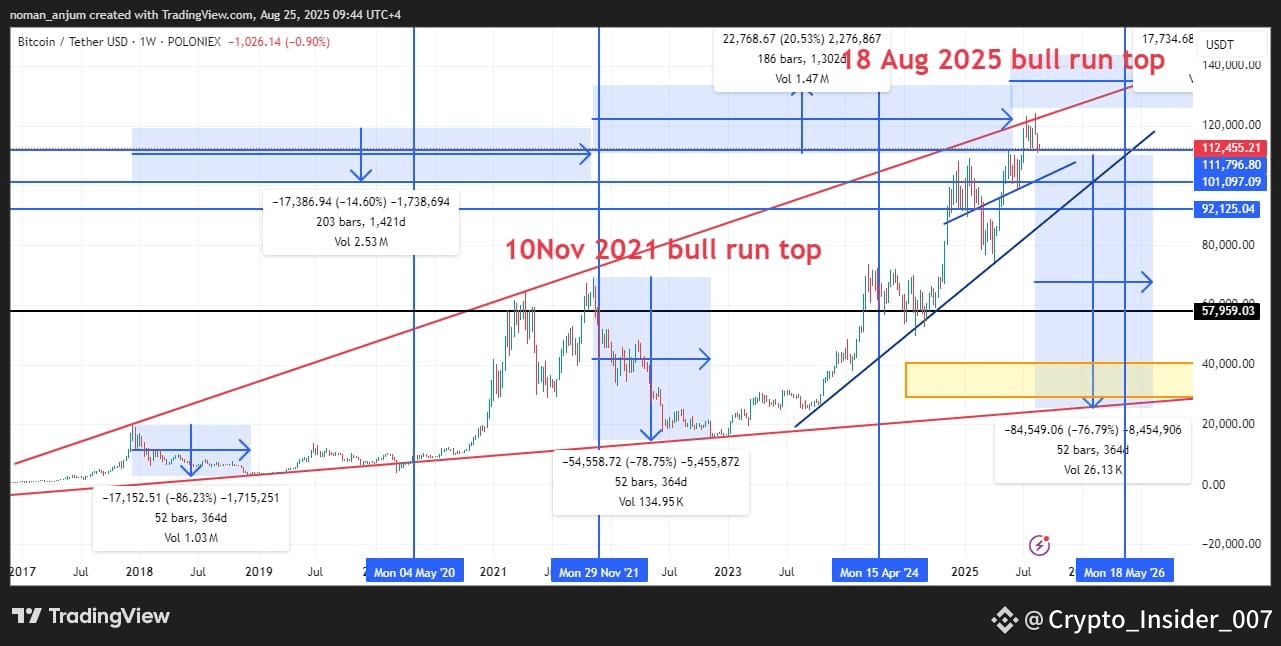
Bull Run Tops Marked: $BTC
10 Nov 2021 → Previous cycle top (~$69K).
18 Aug 2025 → Current projected bull run top (~$112K–$120K zone).
Bear Market Projections (Post-Top):
You’ve highlighted previous bear market drawdowns:
2017 top → ~86% correction.
2021 top → ~78% correction.
Projection for 2025 top suggests another ~76–80% correction, potentially dropping BTC to the $20K–$40K range (highlighted orange box).
Support / Resistance Levels:
Major resistance at $112K–$120K (current top region).
Key support levels:
$92K zone
$57K zone
$20K–$40K retracement zone (big support box, historical bear market bottom range).
Timing Cycles:
Bear markets last roughly ~364 days (1 year) after cycle tops (both 2017 and 2021).
next projected bear market to bottom around May 2026.
Bull Run Tops Marked: $BTC
10 Nov 2021 → Previous cycle top (~$69K).
18 Aug 2025 → Current projected bull run top (~$112K–$120K zone).
Bear Market Projections (Post-Top):
You’ve highlighted previous bear market drawdowns:
2017 top → ~86% correction.
2021 top → ~78% correction.
Projection for 2025 top suggests another ~76–80% correction, potentially dropping BTC to the $20K–$40K range (highlighted orange box).
Support / Resistance Levels:
Major resistance at $112K–$120K (current top region).
Key support levels:
$92K zone
$57K zone
$20K–$40K retracement zone (big support box, historical bear market bottom range).
Timing Cycles:
Bear markets last roughly ~364 days (1 year) after cycle tops (both 2017 and 2021).
next projected bear market to bottom around May 2026.
10 Nov 2021 → Previous cycle top (~$69K).
18 Aug 2025 → Current projected bull run top (~$112K–$120K zone).
Bear Market Projections (Post-Top):
You’ve highlighted previous bear market drawdowns:
2017 top → ~86% correction.
2021 top → ~78% correction.
Projection for 2025 top suggests another ~76–80% correction, potentially dropping BTC to the $20K–$40K range (highlighted orange box).
Support / Resistance Levels:
Major resistance at $112K–$120K (current top region).
Key support levels:
$92K zone
$57K zone
$20K–$40K retracement zone (big support box, historical bear market bottom range).
Timing Cycles:
Bear markets last roughly ~364 days (1 year) after cycle tops (both 2017 and 2021).
next projected bear market to bottom around May 2026.
67
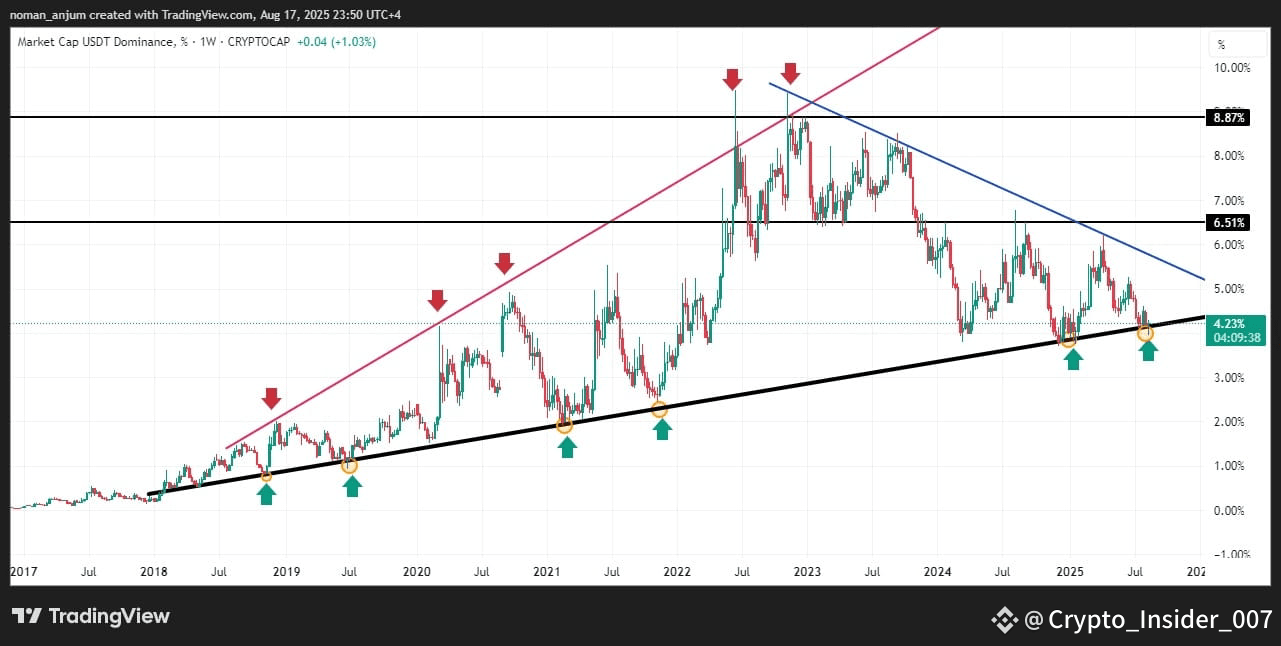
Great chart! Let’s break down the USDT Dominance (USDT.D) Weekly Chart step by step:
🔎 Observations:
1. Long-Term Uptrend Support (Black Line)
Since 2018, USDT dominance has respected this ascending trendline multiple times (green arrows).
Price is currently sitting exactly on this line around 4.2%, which has historically triggered crypto rallies when dominance rejects here.
2. Resistance Levels
6.5% (mid-level resistance): Rejected multiple times (acts as a “pivot zone”).
8.8% (major top): Historical peak, corresponds to strong fear/capital flow into USDT during bear cycles.
3. Falling Trendline (Blue Line)
Since mid-2022, USDT dominance has been in a descending structure.
Lower highs indicate that capital is slowly flowing away from USDT back into risk assets like BTC/Alts.
4. Double/Triple Bottom Zone (2023–2025)
We see repeated touches around 4% dominance (green arrows, orange circles).
This suggests strong support, meaning if it breaks down, altcoins could see a major liquidity inflow.
---
📈 Bullish Crypto Implication:
If USDT.D breaks down below 4%, it means less money is parked in stablecoins → more capital flows into BTC & Alts.
Historically, breakdowns from this level triggered altcoin seasons.
📉 Bearish Crypto Implication:
If the black ascending trendline holds again, dominance could bounce back to 5–6.5%, signaling risk-off sentiment (capital flowing back into USDT, crypto correction).
---
✅ Summary:
Key Support: 4.0% – critical level to watch.
Upside Risk: Bounce could target 5–6.5%.
Downside Potential: A clean weekly close below 4% → likely triggers a strong bull run in BTC/Alts.
This chart is basically at a make-or-break point for the next big crypto move. 🚀🔥
Great chart! Let’s break down the USDT Dominance (USDT.D) Weekly Chart step by step:
🔎 Observations:
1. Long-Term Uptrend Support (Black Line)
Since 2018, USDT dominance has respected this ascending trendline multiple times (green arrows).
Price is currently sitting exactly on this line around 4.2%, which has historically triggered crypto rallies when dominance rejects here.
2. Resistance Levels
6.5% (mid-level resistance): Rejected multiple times (acts as a “pivot zone”).
8.8% (major top): Historical peak, corresponds to strong fear/capital flow into USDT during bear cycles.
3. Falling Trendline (Blue Line)
Since mid-2022, USDT dominance has been in a descending structure.
Lower highs indicate that capital is slowly flowing away from USDT back into risk assets like BTC/Alts.
4. Double/Triple Bottom Zone (2023–2025)
We see repeated touches around 4% dominance (green arrows, orange circles).
This suggests strong support, meaning if it breaks down, altcoins could see a major liquidity inflow.
---
📈 Bullish Crypto Implication:
If USDT.D breaks down below 4%, it means less money is parked in stablecoins → more capital flows into BTC & Alts.
Historically, breakdowns from this level triggered altcoin seasons.
📉 Bearish Crypto Implication:
If the black ascending trendline holds again, dominance could bounce back to 5–6.5%, signaling risk-off sentiment (capital flowing back into USDT, crypto correction).
---
✅ Summary:
Key Support: 4.0% – critical level to watch.
Upside Risk: Bounce could target 5–6.5%.
Downside Potential: A clean weekly close below 4% → likely triggers a strong bull run in BTC/Alts.
This chart is basically at a make-or-break point for the next big crypto move. 🚀🔥
🔎 Observations:
1. Long-Term Uptrend Support (Black Line)
Since 2018, USDT dominance has respected this ascending trendline multiple times (green arrows).
Price is currently sitting exactly on this line around 4.2%, which has historically triggered crypto rallies when dominance rejects here.
2. Resistance Levels
6.5% (mid-level resistance): Rejected multiple times (acts as a “pivot zone”).
8.8% (major top): Historical peak, corresponds to strong fear/capital flow into USDT during bear cycles.
3. Falling Trendline (Blue Line)
Since mid-2022, USDT dominance has been in a descending structure.
Lower highs indicate that capital is slowly flowing away from USDT back into risk assets like BTC/Alts.
4. Double/Triple Bottom Zone (2023–2025)
We see repeated touches around 4% dominance (green arrows, orange circles).
This suggests strong support, meaning if it breaks down, altcoins could see a major liquidity inflow.
---
📈 Bullish Crypto Implication:
If USDT.D breaks down below 4%, it means less money is parked in stablecoins → more capital flows into BTC & Alts.
Historically, breakdowns from this level triggered altcoin seasons.
📉 Bearish Crypto Implication:
If the black ascending trendline holds again, dominance could bounce back to 5–6.5%, signaling risk-off sentiment (capital flowing back into USDT, crypto correction).
---
✅ Summary:
Key Support: 4.0% – critical level to watch.
Upside Risk: Bounce could target 5–6.5%.
Downside Potential: A clean weekly close below 4% → likely triggers a strong bull run in BTC/Alts.
This chart is basically at a make-or-break point for the next big crypto move. 🚀🔥
33
·
--
Bearish
Here’s the latest market snapshot for Bitcoin (BTC):
---
Market Overview & Technical Trends
Current Price & Consolidation:
Bitcoin is trading around $118K, with recent support between $117K–$120K. A sustained breakout above $120K could catalyze a new all-time high, while a drop below $117.2K might signal a bearish pullback.
Short-Term Technical Landscape:
Analysts note strong resistance clustered around the 20-, 50-, and 100-day EMAs (approx. $114.7K–$115.9K), with key support at $112K. ETF outflows (~$333M) and declining institutional buying have introduced near-term uncertainty.
Seeking Alpha highlights weaker structural patterns, though the 50-day EMA at ~$112.8K provided a rebound to ~$114.1K.
Bullish Momentum Signals Add Up:
Some experts forecast a potential 50% rally if key support holds — possibly pushing BTC as high as $140K or even $185K by year-end. A trader from Finbold notes a “Triple Cluster Support” rebound, reinforcing bullish confidence. Additionally, accumulation trends and low sell-side risk could favor a breakout.
Caution: Seasonal Weakness in August:
Historical patterns suggest August is typically one of BTC’s weaker months, averaging a 5%–20% decline.
Market Sentiment & Institutional Behavior:
Institutional shifts continue: many struggling companies are buying Bitcoin to prop up their valuations, raising concerns about systemic risk and the sustainability of such strategies.
Bitcoin dominance in the crypto market has dropped below 60%, implying growing investor interest in altcoins.
Narrative & Sentiment Drivers:
Influential voices on social media are reframing Bitcoin’s role—highlighting its decentralized nature as a response to traditional banking systems. Meanwhile, commentators like Robert Kiyosaki warn of abrupt downturns in August, dubbing it the “August Curse,” even suggesting potential dips.
Here’s the latest market snapshot for Bitcoin (BTC):
---
Market Overview & Technical Trends
Current Price & Consolidation:
Bitcoin is trading around $118K, with recent support between $117K–$120K. A sustained breakout above $120K could catalyze a new all-time high, while a drop below $117.2K might signal a bearish pullback.
Short-Term Technical Landscape:
Analysts note strong resistance clustered around the 20-, 50-, and 100-day EMAs (approx. $114.7K–$115.9K), with key support at $112K. ETF outflows (~$333M) and declining institutional buying have introduced near-term uncertainty.
Seeking Alpha highlights weaker structural patterns, though the 50-day EMA at ~$112.8K provided a rebound to ~$114.1K.
Bullish Momentum Signals Add Up:
Some experts forecast a potential 50% rally if key support holds — possibly pushing BTC as high as $140K or even $185K by year-end. A trader from Finbold notes a “Triple Cluster Support” rebound, reinforcing bullish confidence. Additionally, accumulation trends and low sell-side risk could favor a breakout.
Caution: Seasonal Weakness in August:
Historical patterns suggest August is typically one of BTC’s weaker months, averaging a 5%–20% decline.
Market Sentiment & Institutional Behavior:
Institutional shifts continue: many struggling companies are buying Bitcoin to prop up their valuations, raising concerns about systemic risk and the sustainability of such strategies.
Bitcoin dominance in the crypto market has dropped below 60%, implying growing investor interest in altcoins.
Narrative & Sentiment Drivers:
Influential voices on social media are reframing Bitcoin’s role—highlighting its decentralized nature as a response to traditional banking systems. Meanwhile, commentators like Robert Kiyosaki warn of abrupt downturns in August, dubbing it the “August Curse,” even suggesting potential dips.
---
Market Overview & Technical Trends
Current Price & Consolidation:
Bitcoin is trading around $118K, with recent support between $117K–$120K. A sustained breakout above $120K could catalyze a new all-time high, while a drop below $117.2K might signal a bearish pullback.
Short-Term Technical Landscape:
Analysts note strong resistance clustered around the 20-, 50-, and 100-day EMAs (approx. $114.7K–$115.9K), with key support at $112K. ETF outflows (~$333M) and declining institutional buying have introduced near-term uncertainty.
Seeking Alpha highlights weaker structural patterns, though the 50-day EMA at ~$112.8K provided a rebound to ~$114.1K.
Bullish Momentum Signals Add Up:
Some experts forecast a potential 50% rally if key support holds — possibly pushing BTC as high as $140K or even $185K by year-end. A trader from Finbold notes a “Triple Cluster Support” rebound, reinforcing bullish confidence. Additionally, accumulation trends and low sell-side risk could favor a breakout.
Caution: Seasonal Weakness in August:
Historical patterns suggest August is typically one of BTC’s weaker months, averaging a 5%–20% decline.
Market Sentiment & Institutional Behavior:
Institutional shifts continue: many struggling companies are buying Bitcoin to prop up their valuations, raising concerns about systemic risk and the sustainability of such strategies.
Bitcoin dominance in the crypto market has dropped below 60%, implying growing investor interest in altcoins.
Narrative & Sentiment Drivers:
Influential voices on social media are reframing Bitcoin’s role—highlighting its decentralized nature as a response to traditional banking systems. Meanwhile, commentators like Robert Kiyosaki warn of abrupt downturns in August, dubbing it the “August Curse,” even suggesting potential dips.
1
157
·
--
Bearish
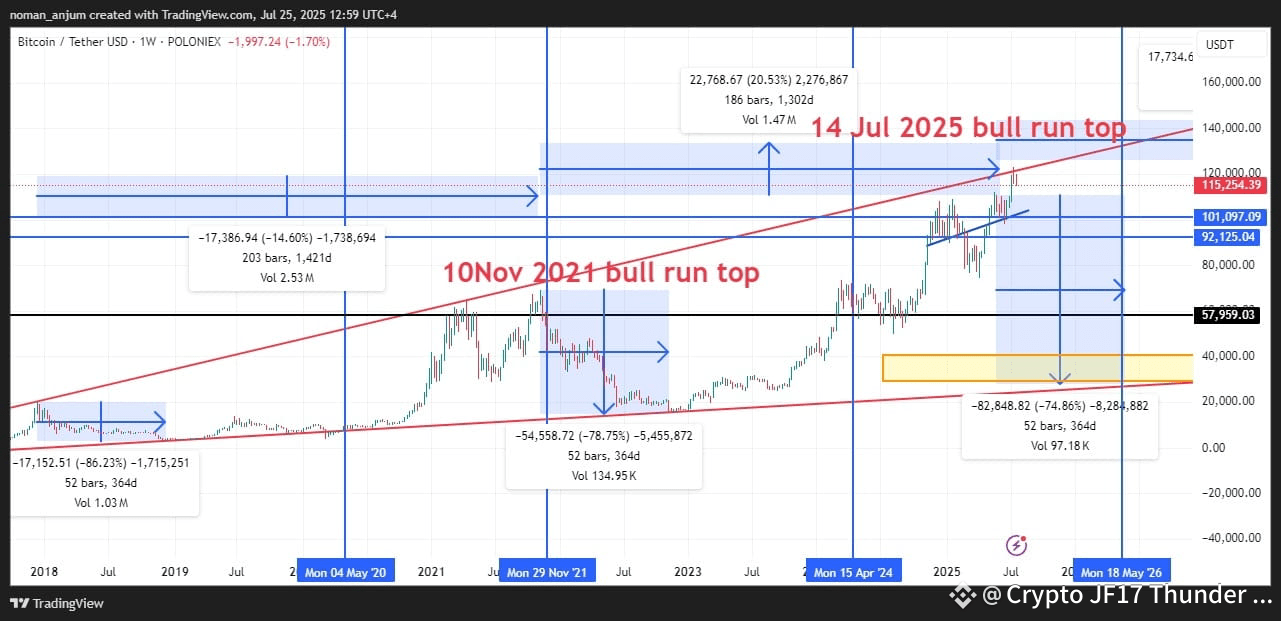
📈 $BTC Summary of Chart Key Points:
✅ Historical Bull Top:
10 Nov 2021 — BTC Top at ~$69K
After that, BTC dropped ~78.75% over 364 days into late 2022.
✅ Projected Bull Top:
14 July 2025 — Projected Bull Run Top
Price target: ~$115K–$120K range
Based on trendline and timing from past cycles
✅ Bear Market Projection:
After 14 July 2025, potential ~75–85% crash (similar to 2018 & 2022)
Projected bottom price: ~$17K–$30K range (yellow box)
Projected bottom date: ~18 May 2026 (52 bars/364 days after top)
---
🔔 Suggested Alerts (based on your chart):
Alert Level Trigger Condition Action/Note
🚨 Take Profit Zone Price enters $115K–$120K area (Jul 2025) Begin profit-taking or hedging
⚠️ Trend Reversal Warning Breakdown from the ascending wedge or fails to hold $101K–$92K Potential start of bear market
🔻 Capitulation Zone Alert BTC enters $40K–$30K (yellow zone) in 2026 Look for long-term entry opportunities
✅ Accumulation Alert BTC reaches $20K–$25K in mid-2026 Strong buy zone based on cycle repeats
---
📌 Insights & Strategy Suggestion:
This projection assumes Bitcoin follows historical halving cycles (peaking ~12-15 months after halving).
If 14 July 2025 is the peak:
Watch for distribution signs (volume divergence, bearish divergences, lower highs)
Prepare for a year-long bear market as in previous cycles.
---
✅ What You Can Do Now:
1. Set TradingView Alerts at key levels:
$115K (watch for top signals)
$92K (trendline support)
$40K, $30K, $20K (for potential buys)
2. Risk Management:
Secure profits as BTC enters top zone.
Don’t go all-in at the top; be ready for a 70–80% drop.
3. Portfolio Prep:
Have a cash position ready for mid-2026 bottom.
Diversify if holding only BTC.
📈 $BTC Summary of Chart Key Points:
✅ Historical Bull Top:
10 Nov 2021 — BTC Top at ~$69K
After that, BTC dropped ~78.75% over 364 days into late 2022.
✅ Projected Bull Top:
14 July 2025 — Projected Bull Run Top
Price target: ~$115K–$120K range
Based on trendline and timing from past cycles
✅ Bear Market Projection:
After 14 July 2025, potential ~75–85% crash (similar to 2018 & 2022)
Projected bottom price: ~$17K–$30K range (yellow box)
Projected bottom date: ~18 May 2026 (52 bars/364 days after top)
---
🔔 Suggested Alerts (based on your chart):
Alert Level Trigger Condition Action/Note
🚨 Take Profit Zone Price enters $115K–$120K area (Jul 2025) Begin profit-taking or hedging
⚠️ Trend Reversal Warning Breakdown from the ascending wedge or fails to hold $101K–$92K Potential start of bear market
🔻 Capitulation Zone Alert BTC enters $40K–$30K (yellow zone) in 2026 Look for long-term entry opportunities
✅ Accumulation Alert BTC reaches $20K–$25K in mid-2026 Strong buy zone based on cycle repeats
---
📌 Insights & Strategy Suggestion:
This projection assumes Bitcoin follows historical halving cycles (peaking ~12-15 months after halving).
If 14 July 2025 is the peak:
Watch for distribution signs (volume divergence, bearish divergences, lower highs)
Prepare for a year-long bear market as in previous cycles.
---
✅ What You Can Do Now:
1. Set TradingView Alerts at key levels:
$115K (watch for top signals)
$92K (trendline support)
$40K, $30K, $20K (for potential buys)
2. Risk Management:
Secure profits as BTC enters top zone.
Don’t go all-in at the top; be ready for a 70–80% drop.
3. Portfolio Prep:
Have a cash position ready for mid-2026 bottom.
Diversify if holding only BTC.
✅ Historical Bull Top:
10 Nov 2021 — BTC Top at ~$69K
After that, BTC dropped ~78.75% over 364 days into late 2022.
✅ Projected Bull Top:
14 July 2025 — Projected Bull Run Top
Price target: ~$115K–$120K range
Based on trendline and timing from past cycles
✅ Bear Market Projection:
After 14 July 2025, potential ~75–85% crash (similar to 2018 & 2022)
Projected bottom price: ~$17K–$30K range (yellow box)
Projected bottom date: ~18 May 2026 (52 bars/364 days after top)
---
🔔 Suggested Alerts (based on your chart):
Alert Level Trigger Condition Action/Note
🚨 Take Profit Zone Price enters $115K–$120K area (Jul 2025) Begin profit-taking or hedging
⚠️ Trend Reversal Warning Breakdown from the ascending wedge or fails to hold $101K–$92K Potential start of bear market
🔻 Capitulation Zone Alert BTC enters $40K–$30K (yellow zone) in 2026 Look for long-term entry opportunities
✅ Accumulation Alert BTC reaches $20K–$25K in mid-2026 Strong buy zone based on cycle repeats
---
📌 Insights & Strategy Suggestion:
This projection assumes Bitcoin follows historical halving cycles (peaking ~12-15 months after halving).
If 14 July 2025 is the peak:
Watch for distribution signs (volume divergence, bearish divergences, lower highs)
Prepare for a year-long bear market as in previous cycles.
---
✅ What You Can Do Now:
1. Set TradingView Alerts at key levels:
$115K (watch for top signals)
$92K (trendline support)
$40K, $30K, $20K (for potential buys)
2. Risk Management:
Secure profits as BTC enters top zone.
Don’t go all-in at the top; be ready for a 70–80% drop.
3. Portfolio Prep:
Have a cash position ready for mid-2026 bottom.
Diversify if holding only BTC.
1
1
1
469

Article
🚨 Has Bitcoin Topped? A Closer Look at the 2025 Bull Run PeakBitcoin has once again captivated the crypto world by reaching astonishing highs in 2025. But seasoned traders know that every bull run has its peak — and its inevitable correction. Based on historical patterns and market cycle symmetry, the evidence strongly suggests that Bitcoin may have already topped on July 14, 2025.
📊 1. History Repeats: The 2021–2022 Crash as a Blueprint
Looking back, Bitcoin peaked on November 10, 2021, followed by a massive correction of -78.75% over 364 days, reaching a low in late 2022. That bear market was brutal — but it laid the foundation for the current bull market.
Now, in 2025, BTC has rallied to around $118,000, and the cycle is showing familiar signs.
🔁 2. Cycle Symmetry: 364 Days Down Again?
Using cycle analysis, we project a similar structure:
🟢 2021 Bull Top → 2022 Bear Bottom:
Drop: -78.75%
Duration: 364 days
🔴 2025 Bull Top (Projected: July 14) → 2026 Bear Bottom (Target: May 18):
Expected Drop: ~-74.86%
Target Range: $35,000–$40,000
That’s right — we may be entering another year-long decline, which could take BTC back to its long-term support zone.
📉 3. Bear Market Target: $35K–$40K Zone
A clear support cluster lies between $35,000 and $40,000, highlighted by:
Prior breakout resistance (now support)
Accumulation volume from 2023–2024
Confluence with macro trendlines
If history rhymes, this range may become the next major accumulation opportunity.
⚠️ 4. What Traders Should Watch
Volatility will spike. Don't be surprised by sharp fake-out rallies.
DCA strategies (dollar-cost averaging) could work well for long-term believers.
Watch the timeline: Mid-May 2026 may offer the deepest discounts before the next cycle starts.
📌 Final Thoughts
Markets are emotional, but cycles are mathematical. By studying past patterns, we can better prepare for what's next.
Whether you're a short-term trader or a long-term HODLer, recognizing where we are in the Bitcoin cycle is crucial. If the July 2025 top holds true, the coming months could offer both danger and opportunity — depending on your perspective and strategy.
🚨 Has Bitcoin Topped? A Closer Look at the 2025 Bull Run Peak
Bitcoin has once again captivated the crypto world by reaching astonishing highs in 2025. But seasoned traders know that every bull run has its peak — and its inevitable correction. Based on historical patterns and market cycle symmetry, the evidence strongly suggests that Bitcoin may have already topped on July 14, 2025.
📊 1. History Repeats: The 2021–2022 Crash as a Blueprint
Looking back, Bitcoin peaked on November 10, 2021, followed by a massive correction of -78.75% over 364 days, reaching a low in late 2022. That bear market was brutal — but it laid the foundation for the current bull market.
Now, in 2025, BTC has rallied to around $118,000, and the cycle is showing familiar signs.
🔁 2. Cycle Symmetry: 364 Days Down Again?
Using cycle analysis, we project a similar structure:
🟢 2021 Bull Top → 2022 Bear Bottom:
Drop: -78.75%
Duration: 364 days
🔴 2025 Bull Top (Projected: July 14) → 2026 Bear Bottom (Target: May 18):
Expected Drop: ~-74.86%
Target Range: $35,000–$40,000
That’s right — we may be entering another year-long decline, which could take BTC back to its long-term support zone.
📉 3. Bear Market Target: $35K–$40K Zone
A clear support cluster lies between $35,000 and $40,000, highlighted by:
Prior breakout resistance (now support)
Accumulation volume from 2023–2024
Confluence with macro trendlines
If history rhymes, this range may become the next major accumulation opportunity.
⚠️ 4. What Traders Should Watch
Volatility will spike. Don't be surprised by sharp fake-out rallies.
DCA strategies (dollar-cost averaging) could work well for long-term believers.
Watch the timeline: Mid-May 2026 may offer the deepest discounts before the next cycle starts.
📌 Final Thoughts
Markets are emotional, but cycles are mathematical. By studying past patterns, we can better prepare for what's next.
Whether you're a short-term trader or a long-term HODLer, recognizing where we are in the Bitcoin cycle is crucial. If the July 2025 top holds true, the coming months could offer both danger and opportunity — depending on your perspective and strategy.
📊 1. History Repeats: The 2021–2022 Crash as a Blueprint
Looking back, Bitcoin peaked on November 10, 2021, followed by a massive correction of -78.75% over 364 days, reaching a low in late 2022. That bear market was brutal — but it laid the foundation for the current bull market.
Now, in 2025, BTC has rallied to around $118,000, and the cycle is showing familiar signs.
🔁 2. Cycle Symmetry: 364 Days Down Again?
Using cycle analysis, we project a similar structure:
🟢 2021 Bull Top → 2022 Bear Bottom:
Drop: -78.75%
Duration: 364 days
🔴 2025 Bull Top (Projected: July 14) → 2026 Bear Bottom (Target: May 18):
Expected Drop: ~-74.86%
Target Range: $35,000–$40,000
That’s right — we may be entering another year-long decline, which could take BTC back to its long-term support zone.
📉 3. Bear Market Target: $35K–$40K Zone
A clear support cluster lies between $35,000 and $40,000, highlighted by:
Prior breakout resistance (now support)
Accumulation volume from 2023–2024
Confluence with macro trendlines
If history rhymes, this range may become the next major accumulation opportunity.
⚠️ 4. What Traders Should Watch
Volatility will spike. Don't be surprised by sharp fake-out rallies.
DCA strategies (dollar-cost averaging) could work well for long-term believers.
Watch the timeline: Mid-May 2026 may offer the deepest discounts before the next cycle starts.
📌 Final Thoughts
Markets are emotional, but cycles are mathematical. By studying past patterns, we can better prepare for what's next.
Whether you're a short-term trader or a long-term HODLer, recognizing where we are in the Bitcoin cycle is crucial. If the July 2025 top holds true, the coming months could offer both danger and opportunity — depending on your perspective and strategy.
47
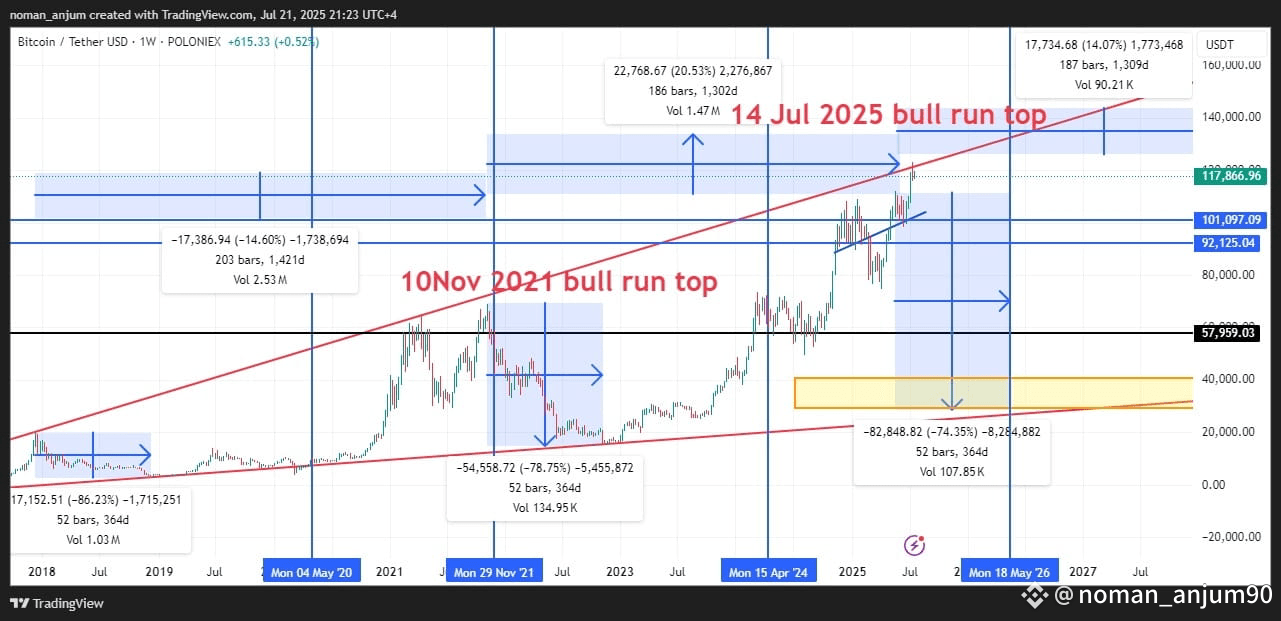
$BTC
🔍 Key Highlights from the Chart
🟢 Bull Market Peaks
10 Nov 2021: Previous cycle top around ~$69,000.
14 Jul 2025 (Projected): Potential new bull market top (approx. $120K–$125K zone based on red trend line projection).
🔴 Bear Market Drops
2021–2022 Crash:
Drop of -78.75% from the 2021 top.
Lasted 52 bars (364 days).
Next Projected Bear Market:
Projected from July 2025 to May 2026.
Expected drawdown: -74.35%, possibly taking BTC down to the $30K–$40K range (orange box support zone).
📉 Correction Zones
Mid-cycle corrections like the one from Apr 2024, showing smaller drops (~20%).
📈 Trend Channel
Red diagonal lines form an ascending channel for bull market tops.
Current price (~$117,872) is nearing upper resistance of this long-term trend channel.
📊 Support/Resistance Levels
$120K & $125K: Horizontal resistance zones.
$57,959: Major historical support (former resistance).
$30K–$40K: Bear market bottom zone based on history and trendline confluence.
⏳ Cycle Timing
Historical cycles span about 4 years:
Peak → bottom → new peak = ~1,300–1,400 days.
This cycle’s timing aligns almost perfectly:
Nov 2021 → Jul 2025 = 1,300+ days (same as past cycles).
Suggests potential top is in or near.
📌 Summary & Outlook
Phase Estimate
Current Price ~$117,872
Projected Top ~$120K–$125K (likely topped 14 Jul 2025)
Next Major Drop -70% to -75% (target: $30K–$40K)
Next Cycle Low Mid 2026 (May–July 2026)
Strong Support Zone $30K–$40K (orange box)
🧭 Strategic Notes
If this chart pattern holds, major profit-taking should already be done or initiated.
Watch for weekly close rejections at trend channel top for confirmation of top formation.
Reentry in mid-2026 would historically offer a high reward/risk zone.
$BTC
🔍 Key Highlights from the Chart
🟢 Bull Market Peaks
10 Nov 2021: Previous cycle top around ~$69,000.
14 Jul 2025 (Projected): Potential new bull market top (approx. $120K–$125K zone based on red trend line projection).
🔴 Bear Market Drops
2021–2022 Crash:
Drop of -78.75% from the 2021 top.
Lasted 52 bars (364 days).
Next Projected Bear Market:
Projected from July 2025 to May 2026.
Expected drawdown: -74.35%, possibly taking BTC down to the $30K–$40K range (orange box support zone).
📉 Correction Zones
Mid-cycle corrections like the one from Apr 2024, showing smaller drops (~20%).
📈 Trend Channel
Red diagonal lines form an ascending channel for bull market tops.
Current price (~$117,872) is nearing upper resistance of this long-term trend channel.
📊 Support/Resistance Levels
$120K & $125K: Horizontal resistance zones.
$57,959: Major historical support (former resistance).
$30K–$40K: Bear market bottom zone based on history and trendline confluence.
⏳ Cycle Timing
Historical cycles span about 4 years:
Peak → bottom → new peak = ~1,300–1,400 days.
This cycle’s timing aligns almost perfectly:
Nov 2021 → Jul 2025 = 1,300+ days (same as past cycles).
Suggests potential top is in or near.
📌 Summary & Outlook
Phase Estimate
Current Price ~$117,872
Projected Top ~$120K–$125K (likely topped 14 Jul 2025)
Next Major Drop -70% to -75% (target: $30K–$40K)
Next Cycle Low Mid 2026 (May–July 2026)
Strong Support Zone $30K–$40K (orange box)
🧭 Strategic Notes
If this chart pattern holds, major profit-taking should already be done or initiated.
Watch for weekly close rejections at trend channel top for confirmation of top formation.
Reentry in mid-2026 would historically offer a high reward/risk zone.
🔍 Key Highlights from the Chart
🟢 Bull Market Peaks
10 Nov 2021: Previous cycle top around ~$69,000.
14 Jul 2025 (Projected): Potential new bull market top (approx. $120K–$125K zone based on red trend line projection).
🔴 Bear Market Drops
2021–2022 Crash:
Drop of -78.75% from the 2021 top.
Lasted 52 bars (364 days).
Next Projected Bear Market:
Projected from July 2025 to May 2026.
Expected drawdown: -74.35%, possibly taking BTC down to the $30K–$40K range (orange box support zone).
📉 Correction Zones
Mid-cycle corrections like the one from Apr 2024, showing smaller drops (~20%).
📈 Trend Channel
Red diagonal lines form an ascending channel for bull market tops.
Current price (~$117,872) is nearing upper resistance of this long-term trend channel.
📊 Support/Resistance Levels
$120K & $125K: Horizontal resistance zones.
$57,959: Major historical support (former resistance).
$30K–$40K: Bear market bottom zone based on history and trendline confluence.
⏳ Cycle Timing
Historical cycles span about 4 years:
Peak → bottom → new peak = ~1,300–1,400 days.
This cycle’s timing aligns almost perfectly:
Nov 2021 → Jul 2025 = 1,300+ days (same as past cycles).
Suggests potential top is in or near.
📌 Summary & Outlook
Phase Estimate
Current Price ~$117,872
Projected Top ~$120K–$125K (likely topped 14 Jul 2025)
Next Major Drop -70% to -75% (target: $30K–$40K)
Next Cycle Low Mid 2026 (May–July 2026)
Strong Support Zone $30K–$40K (orange box)
🧭 Strategic Notes
If this chart pattern holds, major profit-taking should already be done or initiated.
Watch for weekly close rejections at trend channel top for confirmation of top formation.
Reentry in mid-2026 would historically offer a high reward/risk zone.
9
7
23
62.3k
$BTC $ETH
USDT Dominance ( Biggest Market crash is very Near )
Key Observations:
1. Support and Resistance Levels:
Support at ~2.03% and 3.73% (Black & Blue Horizontal Lines).
Resistance at ~6.51% and 8.87%.
The price is currently hovering around 4.19%, testing a confluence of support zones (blue horizontal and rising trendline).
2. Chart Patterns:
Descending Broadening Wedge: The blue downward-sloping lines form a broadening wedge, typically a bullish reversal pattern.
Long-Term Uptrend Line Broken: The red ascending line (broken) shows a long-term trend that has been violated — now resistance.
Horizontal Zone at ~4.21%: Critical zone tested multiple times (marked with green arrows as support and red arrows as resistance).
3. MACD Histogram (Bottom Indicator):
Shows momentum shifts. It appears currently neutral to slightly bearish, as the red bars are decreasing but not yet turning green.
Implications:
Current Zone (4.19% - 4.21%) is Critical:
A bounce here could mean a potential short-term risk-off environment (USDT dominance rises).
A breakdown below 3.73% might signal strong bullish momentum in crypto (money flowing out of stablecoins into coins/tokens).
Upside Resistance Levels:
If dominance rises, next resistance is around 6.51%, then 8.87%.
Downside Risk:
Breakdown could bring USDT dominance towards the 2.03% support, marking a major altseason if sustained.
Conclusion:
This is a make-or-break area for USDT dominance. Traders might watch closely how price behaves around the 4.21% zone. A hold and bounce = caution in altcoins; a breakdown = likely crypto rally.
$BTC $ETH
USDT Dominance ( Biggest Market crash is very Near )
Key Observations:
1. Support and Resistance Levels:
Support at ~2.03% and 3.73% (Black & Blue Horizontal Lines).
Resistance at ~6.51% and 8.87%.
The price is currently hovering around 4.19%, testing a confluence of support zones (blue horizontal and rising trendline).
2. Chart Patterns:
Descending Broadening Wedge: The blue downward-sloping lines form a broadening wedge, typically a bullish reversal pattern.
Long-Term Uptrend Line Broken: The red ascending line (broken) shows a long-term trend that has been violated — now resistance.
Horizontal Zone at ~4.21%: Critical zone tested multiple times (marked with green arrows as support and red arrows as resistance).
3. MACD Histogram (Bottom Indicator):
Shows momentum shifts. It appears currently neutral to slightly bearish, as the red bars are decreasing but not yet turning green.
Implications:
Current Zone (4.19% - 4.21%) is Critical:
A bounce here could mean a potential short-term risk-off environment (USDT dominance rises).
A breakdown below 3.73% might signal strong bullish momentum in crypto (money flowing out of stablecoins into coins/tokens).
Upside Resistance Levels:
If dominance rises, next resistance is around 6.51%, then 8.87%.
Downside Risk:
Breakdown could bring USDT dominance towards the 2.03% support, marking a major altseason if sustained.
Conclusion:
This is a make-or-break area for USDT dominance. Traders might watch closely how price behaves around the 4.21% zone. A hold and bounce = caution in altcoins; a breakdown = likely crypto rally.
USDT Dominance ( Biggest Market crash is very Near )
Key Observations:
1. Support and Resistance Levels:
Support at ~2.03% and 3.73% (Black & Blue Horizontal Lines).
Resistance at ~6.51% and 8.87%.
The price is currently hovering around 4.19%, testing a confluence of support zones (blue horizontal and rising trendline).
2. Chart Patterns:
Descending Broadening Wedge: The blue downward-sloping lines form a broadening wedge, typically a bullish reversal pattern.
Long-Term Uptrend Line Broken: The red ascending line (broken) shows a long-term trend that has been violated — now resistance.
Horizontal Zone at ~4.21%: Critical zone tested multiple times (marked with green arrows as support and red arrows as resistance).
3. MACD Histogram (Bottom Indicator):
Shows momentum shifts. It appears currently neutral to slightly bearish, as the red bars are decreasing but not yet turning green.
Implications:
Current Zone (4.19% - 4.21%) is Critical:
A bounce here could mean a potential short-term risk-off environment (USDT dominance rises).
A breakdown below 3.73% might signal strong bullish momentum in crypto (money flowing out of stablecoins into coins/tokens).
Upside Resistance Levels:
If dominance rises, next resistance is around 6.51%, then 8.87%.
Downside Risk:
Breakdown could bring USDT dominance towards the 2.03% support, marking a major altseason if sustained.
Conclusion:
This is a make-or-break area for USDT dominance. Traders might watch closely how price behaves around the 4.21% zone. A hold and bounce = caution in altcoins; a breakdown = likely crypto rally.
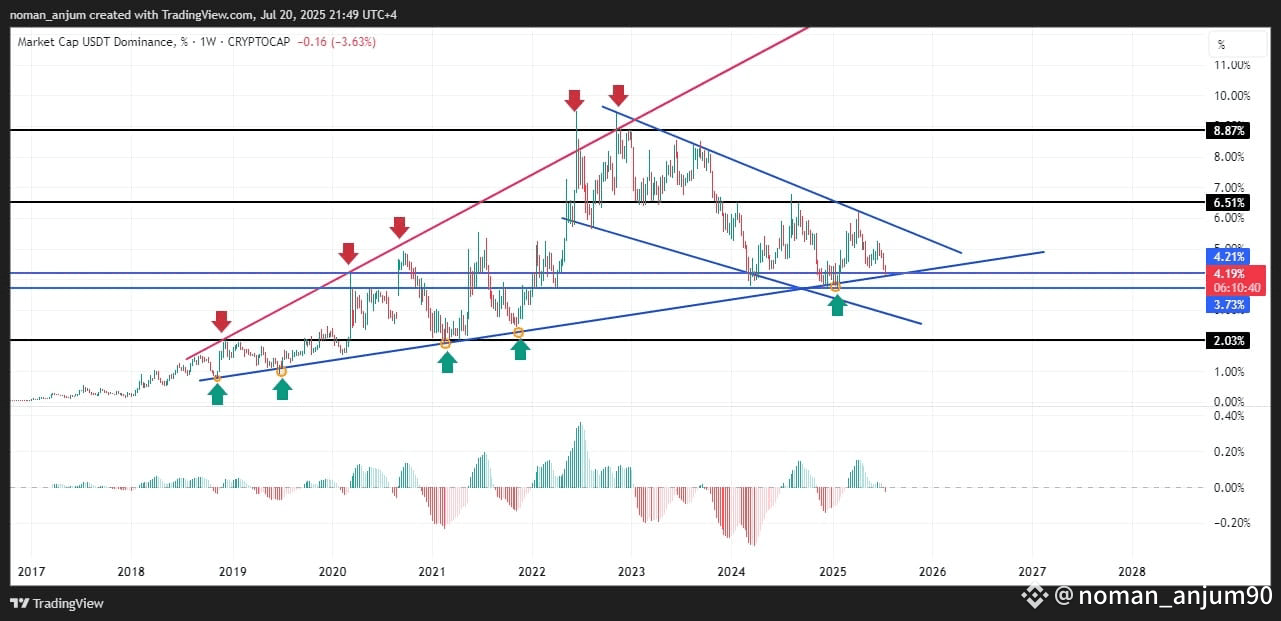
80
🔍 Key Observations:
Current USDT Dominance: ~4.39%
Major Support Level: Around 3.76% (marked by the blue line), which has acted as a strong bottom multiple times since 2022.
Trend: USDT dominance has been forming lower highs, indicating a long-term downtrend, but with frequent bounces from the 3.75% area.
---
📈 Interpretation:
When USDT dominance drops, it usually means money is flowing out of stablecoins into crypto assets like BTC, ETH, and altcoins — typically bullish for the market.
When USDT dominance rises, capital is moving into USDT — a bearish or risk-off signal (traders exiting into safety).
The chart currently shows rejection from the 5% area and moving down toward the 3.76% support.
---
📊 What to Expect Next:
If USDT.D breaks below 3.76%: It could trigger a strong altcoin and BTC rally, as it would indicate capital rotation into riskier crypto assets.
If it bounces from 3.76% again: Market might consolidate or see a pullback in crypto prices.
---
🧠 Trading Insight:
Watch this level closely:
Below 3.76% = bullish breakout (favorable for risk-on crypto trades).
Rebound at 3.76% = caution, potential crypto cooling or correction.
🔍 Key Observations:
Current USDT Dominance: ~4.39%
Major Support Level: Around 3.76% (marked by the blue line), which has acted as a strong bottom multiple times since 2022.
Trend: USDT dominance has been forming lower highs, indicating a long-term downtrend, but with frequent bounces from the 3.75% area.
---
📈 Interpretation:
When USDT dominance drops, it usually means money is flowing out of stablecoins into crypto assets like BTC, ETH, and altcoins — typically bullish for the market.
When USDT dominance rises, capital is moving into USDT — a bearish or risk-off signal (traders exiting into safety).
The chart currently shows rejection from the 5% area and moving down toward the 3.76% support.
---
📊 What to Expect Next:
If USDT.D breaks below 3.76%: It could trigger a strong altcoin and BTC rally, as it would indicate capital rotation into riskier crypto assets.
If it bounces from 3.76% again: Market might consolidate or see a pullback in crypto prices.
---
🧠 Trading Insight:
Watch this level closely:
Below 3.76% = bullish breakout (favorable for risk-on crypto trades).
Rebound at 3.76% = caution, potential crypto cooling or correction.
Current USDT Dominance: ~4.39%
Major Support Level: Around 3.76% (marked by the blue line), which has acted as a strong bottom multiple times since 2022.
Trend: USDT dominance has been forming lower highs, indicating a long-term downtrend, but with frequent bounces from the 3.75% area.
---
📈 Interpretation:
When USDT dominance drops, it usually means money is flowing out of stablecoins into crypto assets like BTC, ETH, and altcoins — typically bullish for the market.
When USDT dominance rises, capital is moving into USDT — a bearish or risk-off signal (traders exiting into safety).
The chart currently shows rejection from the 5% area and moving down toward the 3.76% support.
---
📊 What to Expect Next:
If USDT.D breaks below 3.76%: It could trigger a strong altcoin and BTC rally, as it would indicate capital rotation into riskier crypto assets.
If it bounces from 3.76% again: Market might consolidate or see a pullback in crypto prices.
---
🧠 Trading Insight:
Watch this level closely:
Below 3.76% = bullish breakout (favorable for risk-on crypto trades).
Rebound at 3.76% = caution, potential crypto cooling or correction.
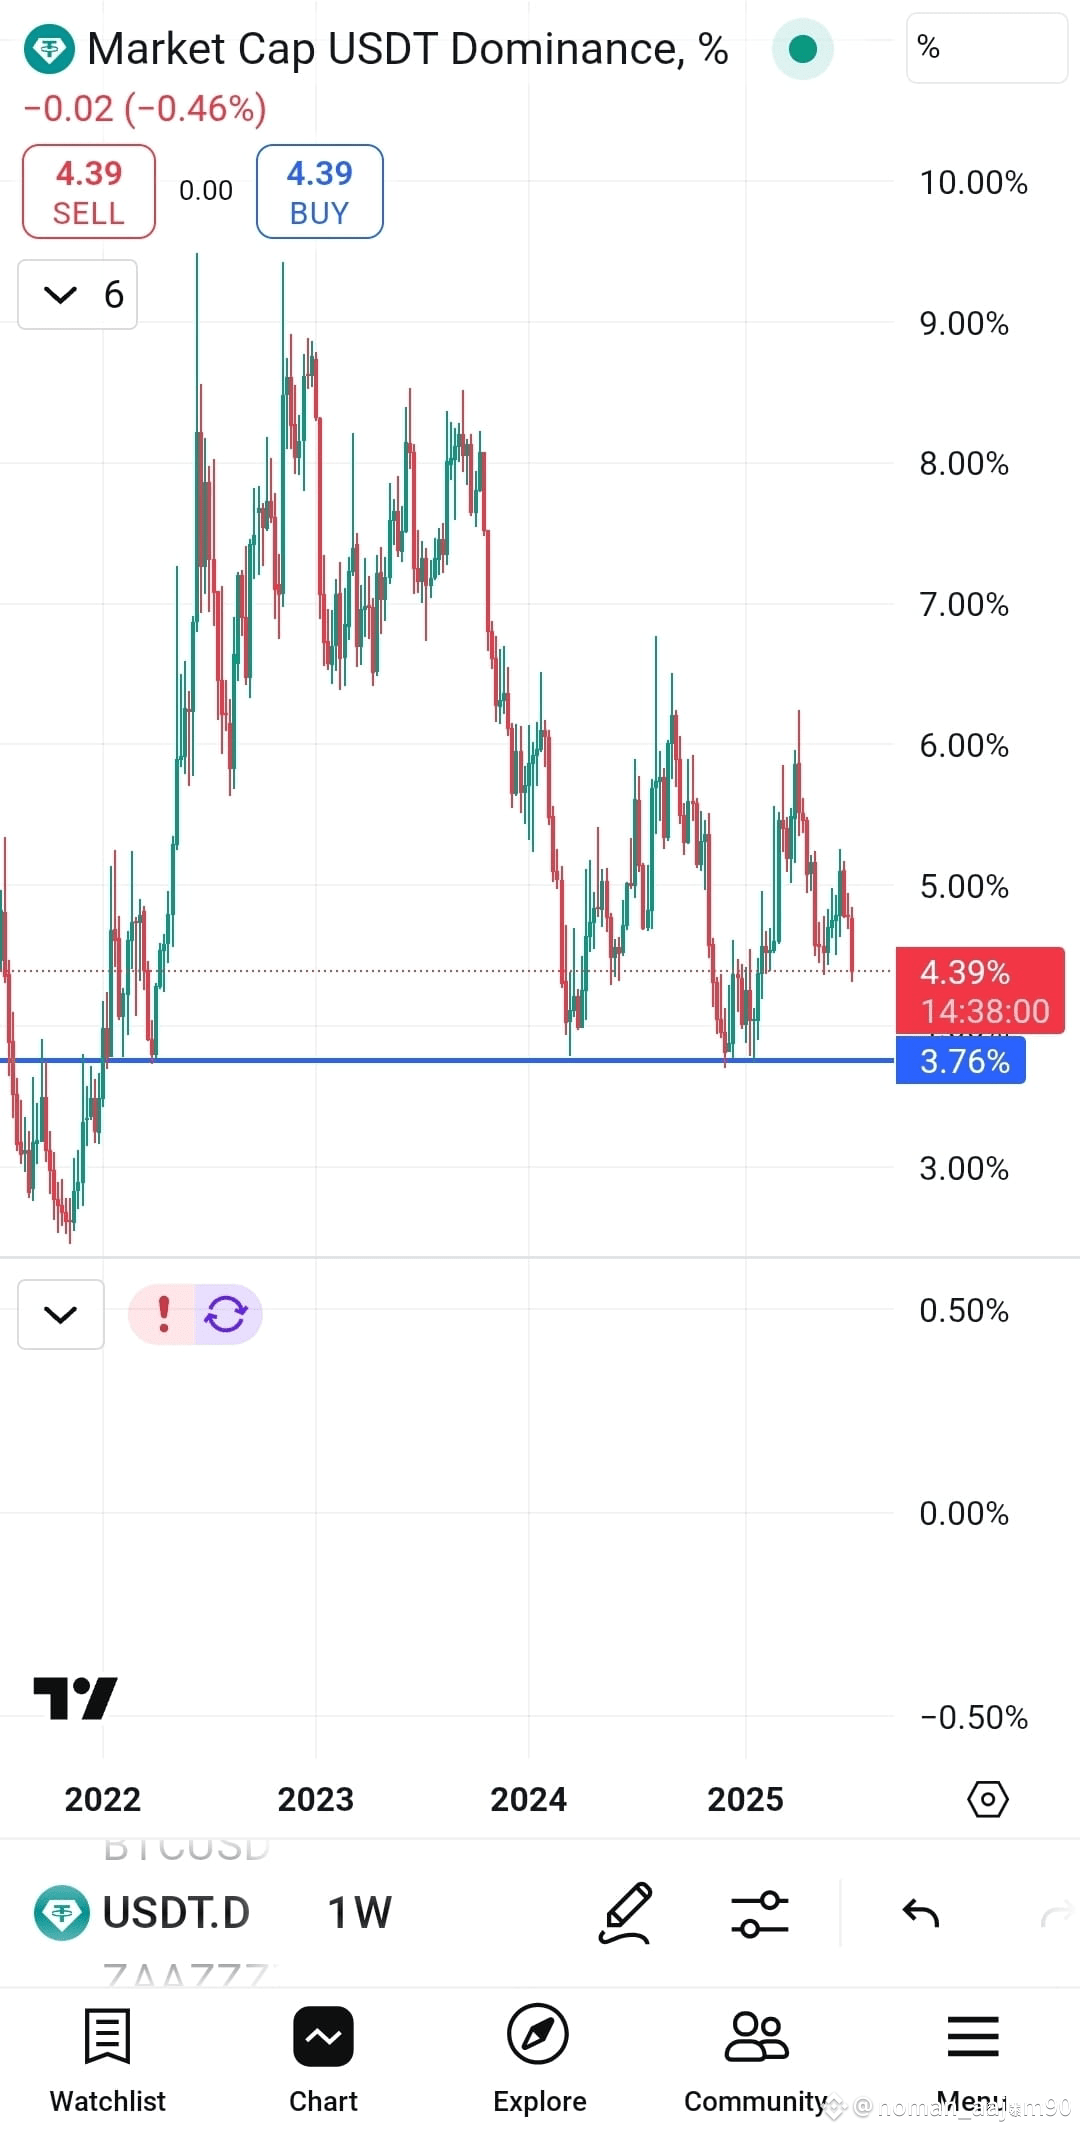
53
📊 Table Columns Explanation $BTC
1. Year – The calendar year.
2. Year Start – Bitcoin price at the start of the year.
3. Year End – Bitcoin price at the end of the year.
4. % Change – The annual percentage gain/loss.
---
🔍 Key Observations
🚀 Biggest Gains
2010: +9900% (early adoption phase, from $0.003 to $0.30)
2013: +5507%
2017: +1331%
2020: +301% (beginning of the post-halving bull run)
2023: +156% (recovery after 2022 bear market)
📉 Biggest Losses
2014: -58% (after 2013 bull run)
2018: -73% (post-2017 bull cycle crash)
2022: -65% (macroeconomic tightening, FTX collapse)
✅ 2025 YTD (Up to now):
Start: $93,300
Current: $116,000
Change: +24%
→ Bitcoin is performing decently in 2025 so far.
---
📈 Cycle Pattern
Bitcoin tends to follow a 4-year cycle:
Year 1: Bottom (e.g., 2015, 2019, 2023)
Year 2: Recovery (e.g., 2016, 2020, 2024)
Year 3: Bull run (e.g., 2017, 2021, 2025?)
Year 4: Crash (e.g., 2018, 2022)
So if this pattern continues, 2025 could be a top year, but we might see volatility increase later in the year.
📊 Table Columns Explanation $BTC
1. Year – The calendar year.
2. Year Start – Bitcoin price at the start of the year.
3. Year End – Bitcoin price at the end of the year.
4. % Change – The annual percentage gain/loss.
---
🔍 Key Observations
🚀 Biggest Gains
2010: +9900% (early adoption phase, from $0.003 to $0.30)
2013: +5507%
2017: +1331%
2020: +301% (beginning of the post-halving bull run)
2023: +156% (recovery after 2022 bear market)
📉 Biggest Losses
2014: -58% (after 2013 bull run)
2018: -73% (post-2017 bull cycle crash)
2022: -65% (macroeconomic tightening, FTX collapse)
✅ 2025 YTD (Up to now):
Start: $93,300
Current: $116,000
Change: +24%
→ Bitcoin is performing decently in 2025 so far.
---
📈 Cycle Pattern
Bitcoin tends to follow a 4-year cycle:
Year 1: Bottom (e.g., 2015, 2019, 2023)
Year 2: Recovery (e.g., 2016, 2020, 2024)
Year 3: Bull run (e.g., 2017, 2021, 2025?)
Year 4: Crash (e.g., 2018, 2022)
So if this pattern continues, 2025 could be a top year, but we might see volatility increase later in the year.
1. Year – The calendar year.
2. Year Start – Bitcoin price at the start of the year.
3. Year End – Bitcoin price at the end of the year.
4. % Change – The annual percentage gain/loss.
---
🔍 Key Observations
🚀 Biggest Gains
2010: +9900% (early adoption phase, from $0.003 to $0.30)
2013: +5507%
2017: +1331%
2020: +301% (beginning of the post-halving bull run)
2023: +156% (recovery after 2022 bear market)
📉 Biggest Losses
2014: -58% (after 2013 bull run)
2018: -73% (post-2017 bull cycle crash)
2022: -65% (macroeconomic tightening, FTX collapse)
✅ 2025 YTD (Up to now):
Start: $93,300
Current: $116,000
Change: +24%
→ Bitcoin is performing decently in 2025 so far.
---
📈 Cycle Pattern
Bitcoin tends to follow a 4-year cycle:
Year 1: Bottom (e.g., 2015, 2019, 2023)
Year 2: Recovery (e.g., 2016, 2020, 2024)
Year 3: Bull run (e.g., 2017, 2021, 2025?)
Year 4: Crash (e.g., 2018, 2022)
So if this pattern continues, 2025 could be a top year, but we might see volatility increase later in the year.
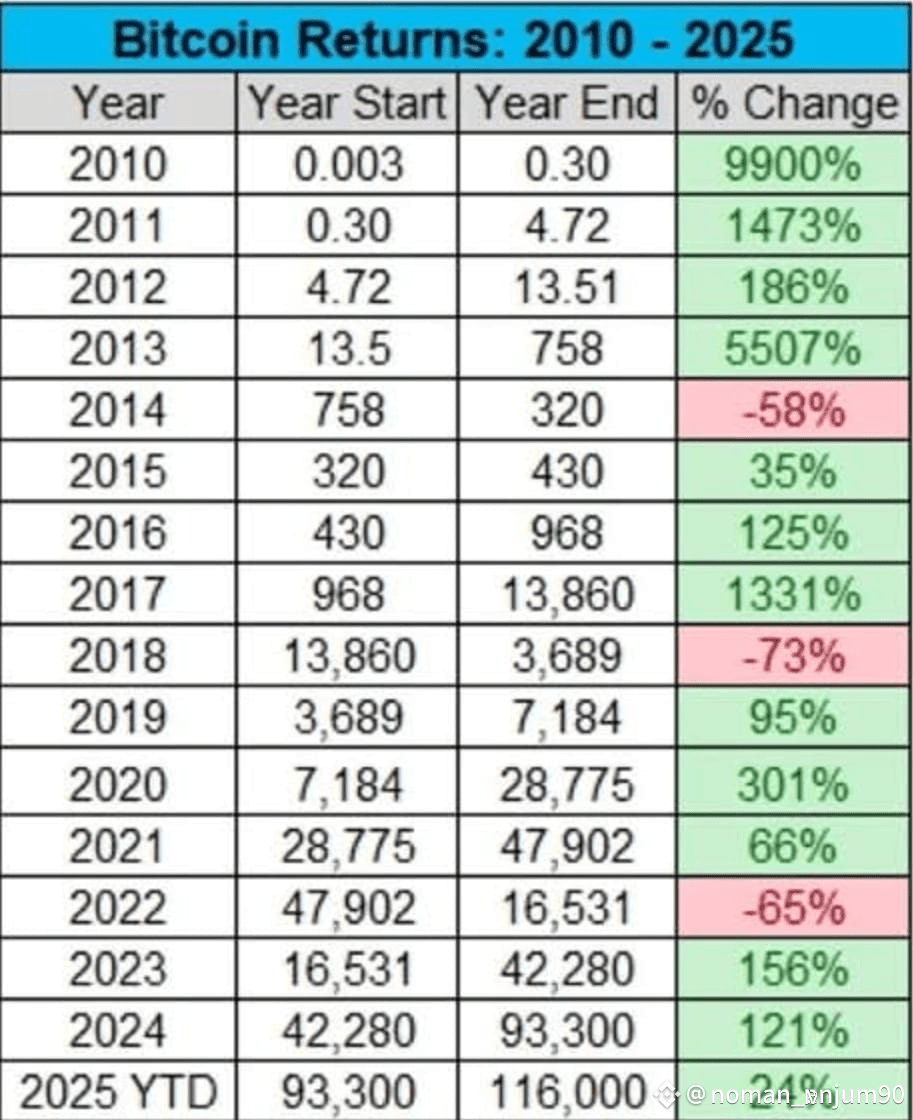
46
#BTCWhaleMovement $BTC
📌 BTCUSDT Short Setup (Rejection at Resistance)
🚨 Trigger Condition:
Price fails to hold above 108,000 and gets rejected by the wedge resistance.
Watch for bearish candle formation (e.g., bearish engulfing or strong red candle near 108K–109K).
✅ Entry:
Entry zone: 107,800 – 108,200 USDT (rejection zone near upper wedge)
🛡️ Stop-Loss:
Above the recent wick high or wedge resistance breakout:
Stop-loss: 110,200 USDT
🎯 Targets:
1. Target 1: 105,500 USDT (minor support)
2. Target 2: 104,000 USDT (major horizontal support)
3. Target 3: 97,700 USDT (macro support & wedge bottom)
---
⚖️ Risk–Reward Ratio (approx.):
Entry: 108,000
Stop: 110,200 (2,200 loss)
Target 1: 105,500 (2,500 gain → 1.1R)
Target 2: 104,000 (4,000 gain → 1.8R)
Target 3: 97,700 (6,300 gain → 2.86R)
---
🔁 Trade Management Tips:
Secure partial profits at 105,500.
Move stop-loss to breakeven.
If momentum is strong, let rest ride to 97,700.
#BTCWhaleMovement $BTC
📌 BTCUSDT Short Setup (Rejection at Resistance)
🚨 Trigger Condition:
Price fails to hold above 108,000 and gets rejected by the wedge resistance.
Watch for bearish candle formation (e.g., bearish engulfing or strong red candle near 108K–109K).
✅ Entry:
Entry zone: 107,800 – 108,200 USDT (rejection zone near upper wedge)
🛡️ Stop-Loss:
Above the recent wick high or wedge resistance breakout:
Stop-loss: 110,200 USDT
🎯 Targets:
1. Target 1: 105,500 USDT (minor support)
2. Target 2: 104,000 USDT (major horizontal support)
3. Target 3: 97,700 USDT (macro support & wedge bottom)
---
⚖️ Risk–Reward Ratio (approx.):
Entry: 108,000
Stop: 110,200 (2,200 loss)
Target 1: 105,500 (2,500 gain → 1.1R)
Target 2: 104,000 (4,000 gain → 1.8R)
Target 3: 97,700 (6,300 gain → 2.86R)
---
🔁 Trade Management Tips:
Secure partial profits at 105,500.
Move stop-loss to breakeven.
If momentum is strong, let rest ride to 97,700.
📌 BTCUSDT Short Setup (Rejection at Resistance)
🚨 Trigger Condition:
Price fails to hold above 108,000 and gets rejected by the wedge resistance.
Watch for bearish candle formation (e.g., bearish engulfing or strong red candle near 108K–109K).
✅ Entry:
Entry zone: 107,800 – 108,200 USDT (rejection zone near upper wedge)
🛡️ Stop-Loss:
Above the recent wick high or wedge resistance breakout:
Stop-loss: 110,200 USDT
🎯 Targets:
1. Target 1: 105,500 USDT (minor support)
2. Target 2: 104,000 USDT (major horizontal support)
3. Target 3: 97,700 USDT (macro support & wedge bottom)
---
⚖️ Risk–Reward Ratio (approx.):
Entry: 108,000
Stop: 110,200 (2,200 loss)
Target 1: 105,500 (2,500 gain → 1.1R)
Target 2: 104,000 (4,000 gain → 1.8R)
Target 3: 97,700 (6,300 gain → 2.86R)
---
🔁 Trade Management Tips:
Secure partial profits at 105,500.
Move stop-loss to breakeven.
If momentum is strong, let rest ride to 97,700.
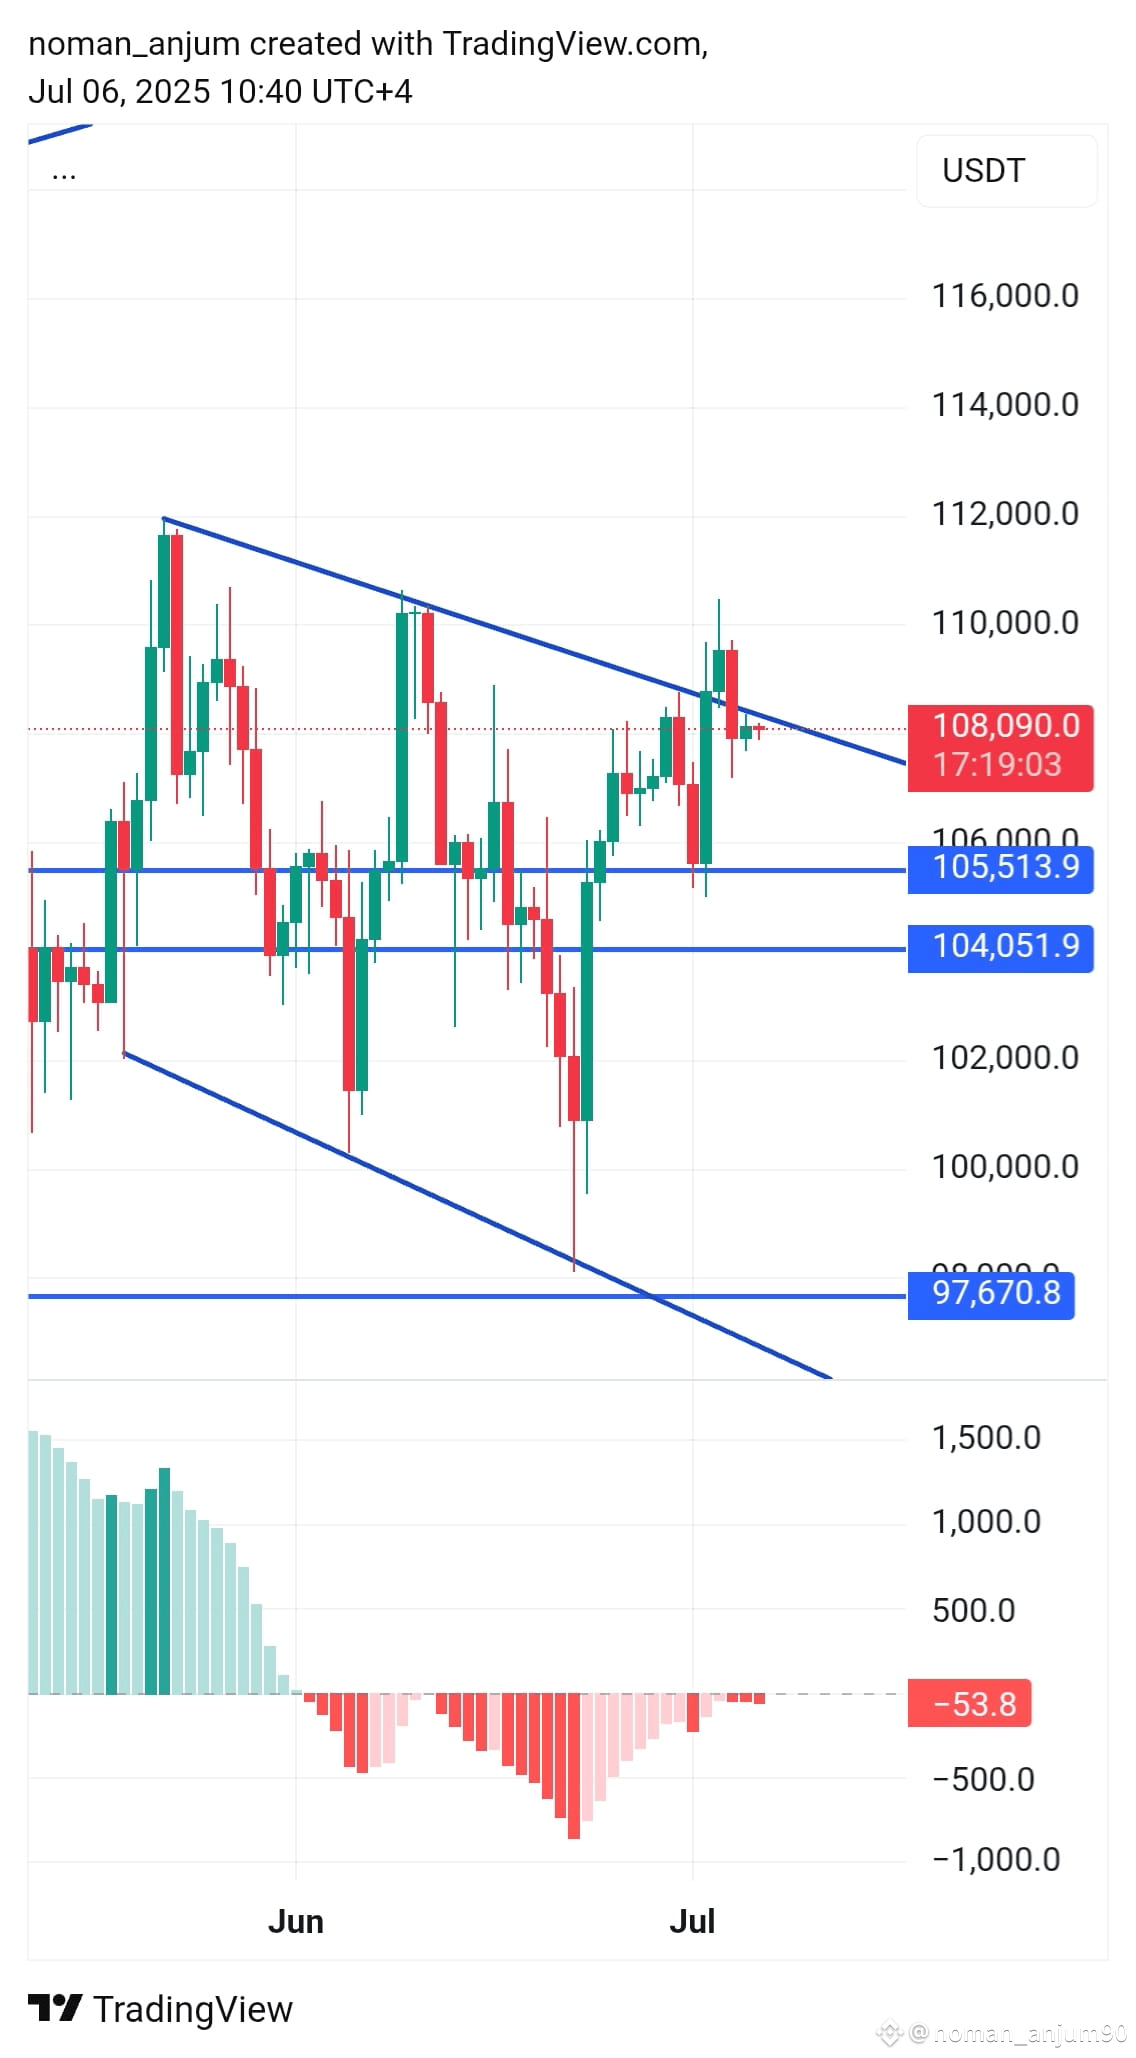
2
5.4k
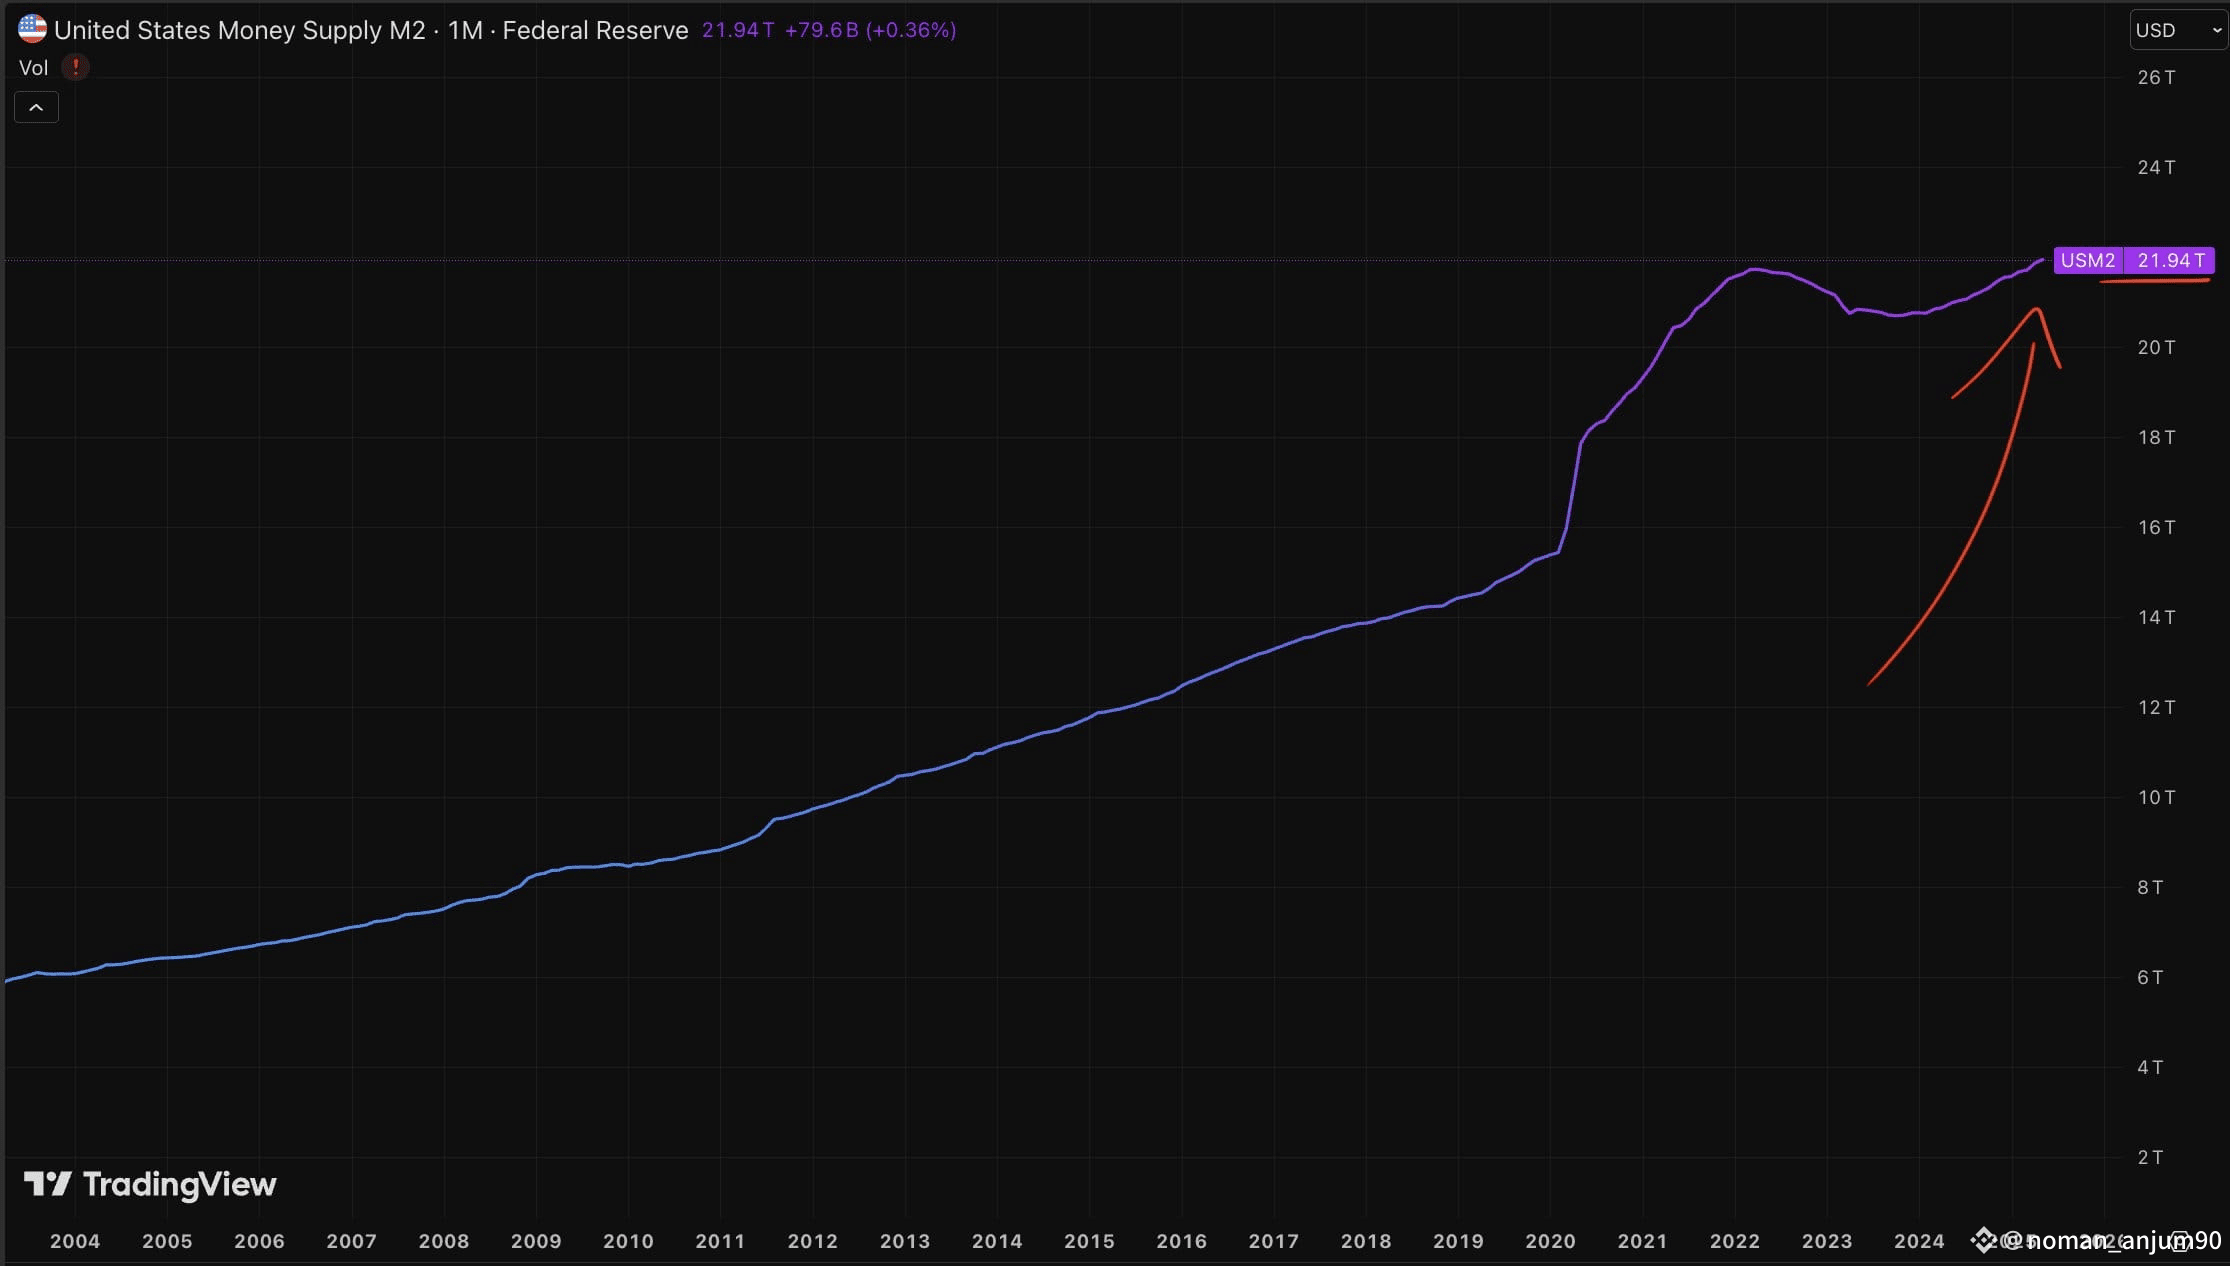
📊 Bitcoin vs. M2: Historical Correlation Analysis
🔹 2010–2019 (Gradual M2 Growth)
M2: Slow, steady growth.
Bitcoin: Early-stage adoption → volatile but upward trend.
Correlation: Loose but developing. BTC reacted more to tech adoption and market cycles than monetary policy.
---
🔹 2020–2021 (M2 Surge During COVID Stimulus)
M2: Exploded from ~$15T to over $21T in just 18 months.
Bitcoin: Rose from ~$5K to $69K (ATH in Nov 2021).
Correlation: Very strong. Bitcoin acted as a hedge against fiat debasement and inflation expectations.
📌 This period cemented Bitcoin's "digital gold" narrative.
---
🔹 2022–2023 (M2 Contraction & Tightening)
M2: Slight decline — rare in U.S. history.
Bitcoin: Fell from $69K to ~$15.5K by Nov 2022.
Correlation: Clear again. Liquidity shrinkage reduced speculation and risk appetite.
---
🔹 2024–2025 (M2 Begins Rising Again)
M2: Recent uptick (as shown in your chart).
Bitcoin: Recovered sharply, reaching above $70K before correcting.
Correlation: BTC tends to rise with liquidity return, especially when markets expect future easing.
---
📈 Summary Table:
Period M2 Trend Bitcoin Reaction Correlation
2010–2019 Gradual rise Volatile growth Weak–Moderate
2020–2021 Massive surge Explosive rally Strong
2022–2023 Slight decline Deep correction Strong
2024–2025 Rising again Recovery & volatility Moderate–Strong
---
📌 Key Takeaways:
Bitcoin thrives in liquidity expansion (rising M2).
Tight monetary policy & M2 contraction = bearish for BTC.
Market perception of future liquidity (not just current M2) is crucial for BTC price action.
📊 Bitcoin vs. M2: Historical Correlation Analysis
🔹 2010–2019 (Gradual M2 Growth)
M2: Slow, steady growth.
Bitcoin: Early-stage adoption → volatile but upward trend.
Correlation: Loose but developing. BTC reacted more to tech adoption and market cycles than monetary policy.
---
🔹 2020–2021 (M2 Surge During COVID Stimulus)
M2: Exploded from ~$15T to over $21T in just 18 months.
Bitcoin: Rose from ~$5K to $69K (ATH in Nov 2021).
Correlation: Very strong. Bitcoin acted as a hedge against fiat debasement and inflation expectations.
📌 This period cemented Bitcoin's "digital gold" narrative.
---
🔹 2022–2023 (M2 Contraction & Tightening)
M2: Slight decline — rare in U.S. history.
Bitcoin: Fell from $69K to ~$15.5K by Nov 2022.
Correlation: Clear again. Liquidity shrinkage reduced speculation and risk appetite.
---
🔹 2024–2025 (M2 Begins Rising Again)
M2: Recent uptick (as shown in your chart).
Bitcoin: Recovered sharply, reaching above $70K before correcting.
Correlation: BTC tends to rise with liquidity return, especially when markets expect future easing.
---
📈 Summary Table:
Period M2 Trend Bitcoin Reaction Correlation
2010–2019 Gradual rise Volatile growth Weak–Moderate
2020–2021 Massive surge Explosive rally Strong
2022–2023 Slight decline Deep correction Strong
2024–2025 Rising again Recovery & volatility Moderate–Strong
---
📌 Key Takeaways:
Bitcoin thrives in liquidity expansion (rising M2).
Tight monetary policy & M2 contraction = bearish for BTC.
Market perception of future liquidity (not just current M2) is crucial for BTC price action.
🔹 2010–2019 (Gradual M2 Growth)
M2: Slow, steady growth.
Bitcoin: Early-stage adoption → volatile but upward trend.
Correlation: Loose but developing. BTC reacted more to tech adoption and market cycles than monetary policy.
---
🔹 2020–2021 (M2 Surge During COVID Stimulus)
M2: Exploded from ~$15T to over $21T in just 18 months.
Bitcoin: Rose from ~$5K to $69K (ATH in Nov 2021).
Correlation: Very strong. Bitcoin acted as a hedge against fiat debasement and inflation expectations.
📌 This period cemented Bitcoin's "digital gold" narrative.
---
🔹 2022–2023 (M2 Contraction & Tightening)
M2: Slight decline — rare in U.S. history.
Bitcoin: Fell from $69K to ~$15.5K by Nov 2022.
Correlation: Clear again. Liquidity shrinkage reduced speculation and risk appetite.
---
🔹 2024–2025 (M2 Begins Rising Again)
M2: Recent uptick (as shown in your chart).
Bitcoin: Recovered sharply, reaching above $70K before correcting.
Correlation: BTC tends to rise with liquidity return, especially when markets expect future easing.
---
📈 Summary Table:
Period M2 Trend Bitcoin Reaction Correlation
2010–2019 Gradual rise Volatile growth Weak–Moderate
2020–2021 Massive surge Explosive rally Strong
2022–2023 Slight decline Deep correction Strong
2024–2025 Rising again Recovery & volatility Moderate–Strong
---
📌 Key Takeaways:
Bitcoin thrives in liquidity expansion (rising M2).
Tight monetary policy & M2 contraction = bearish for BTC.
Market perception of future liquidity (not just current M2) is crucial for BTC price action.
3
61
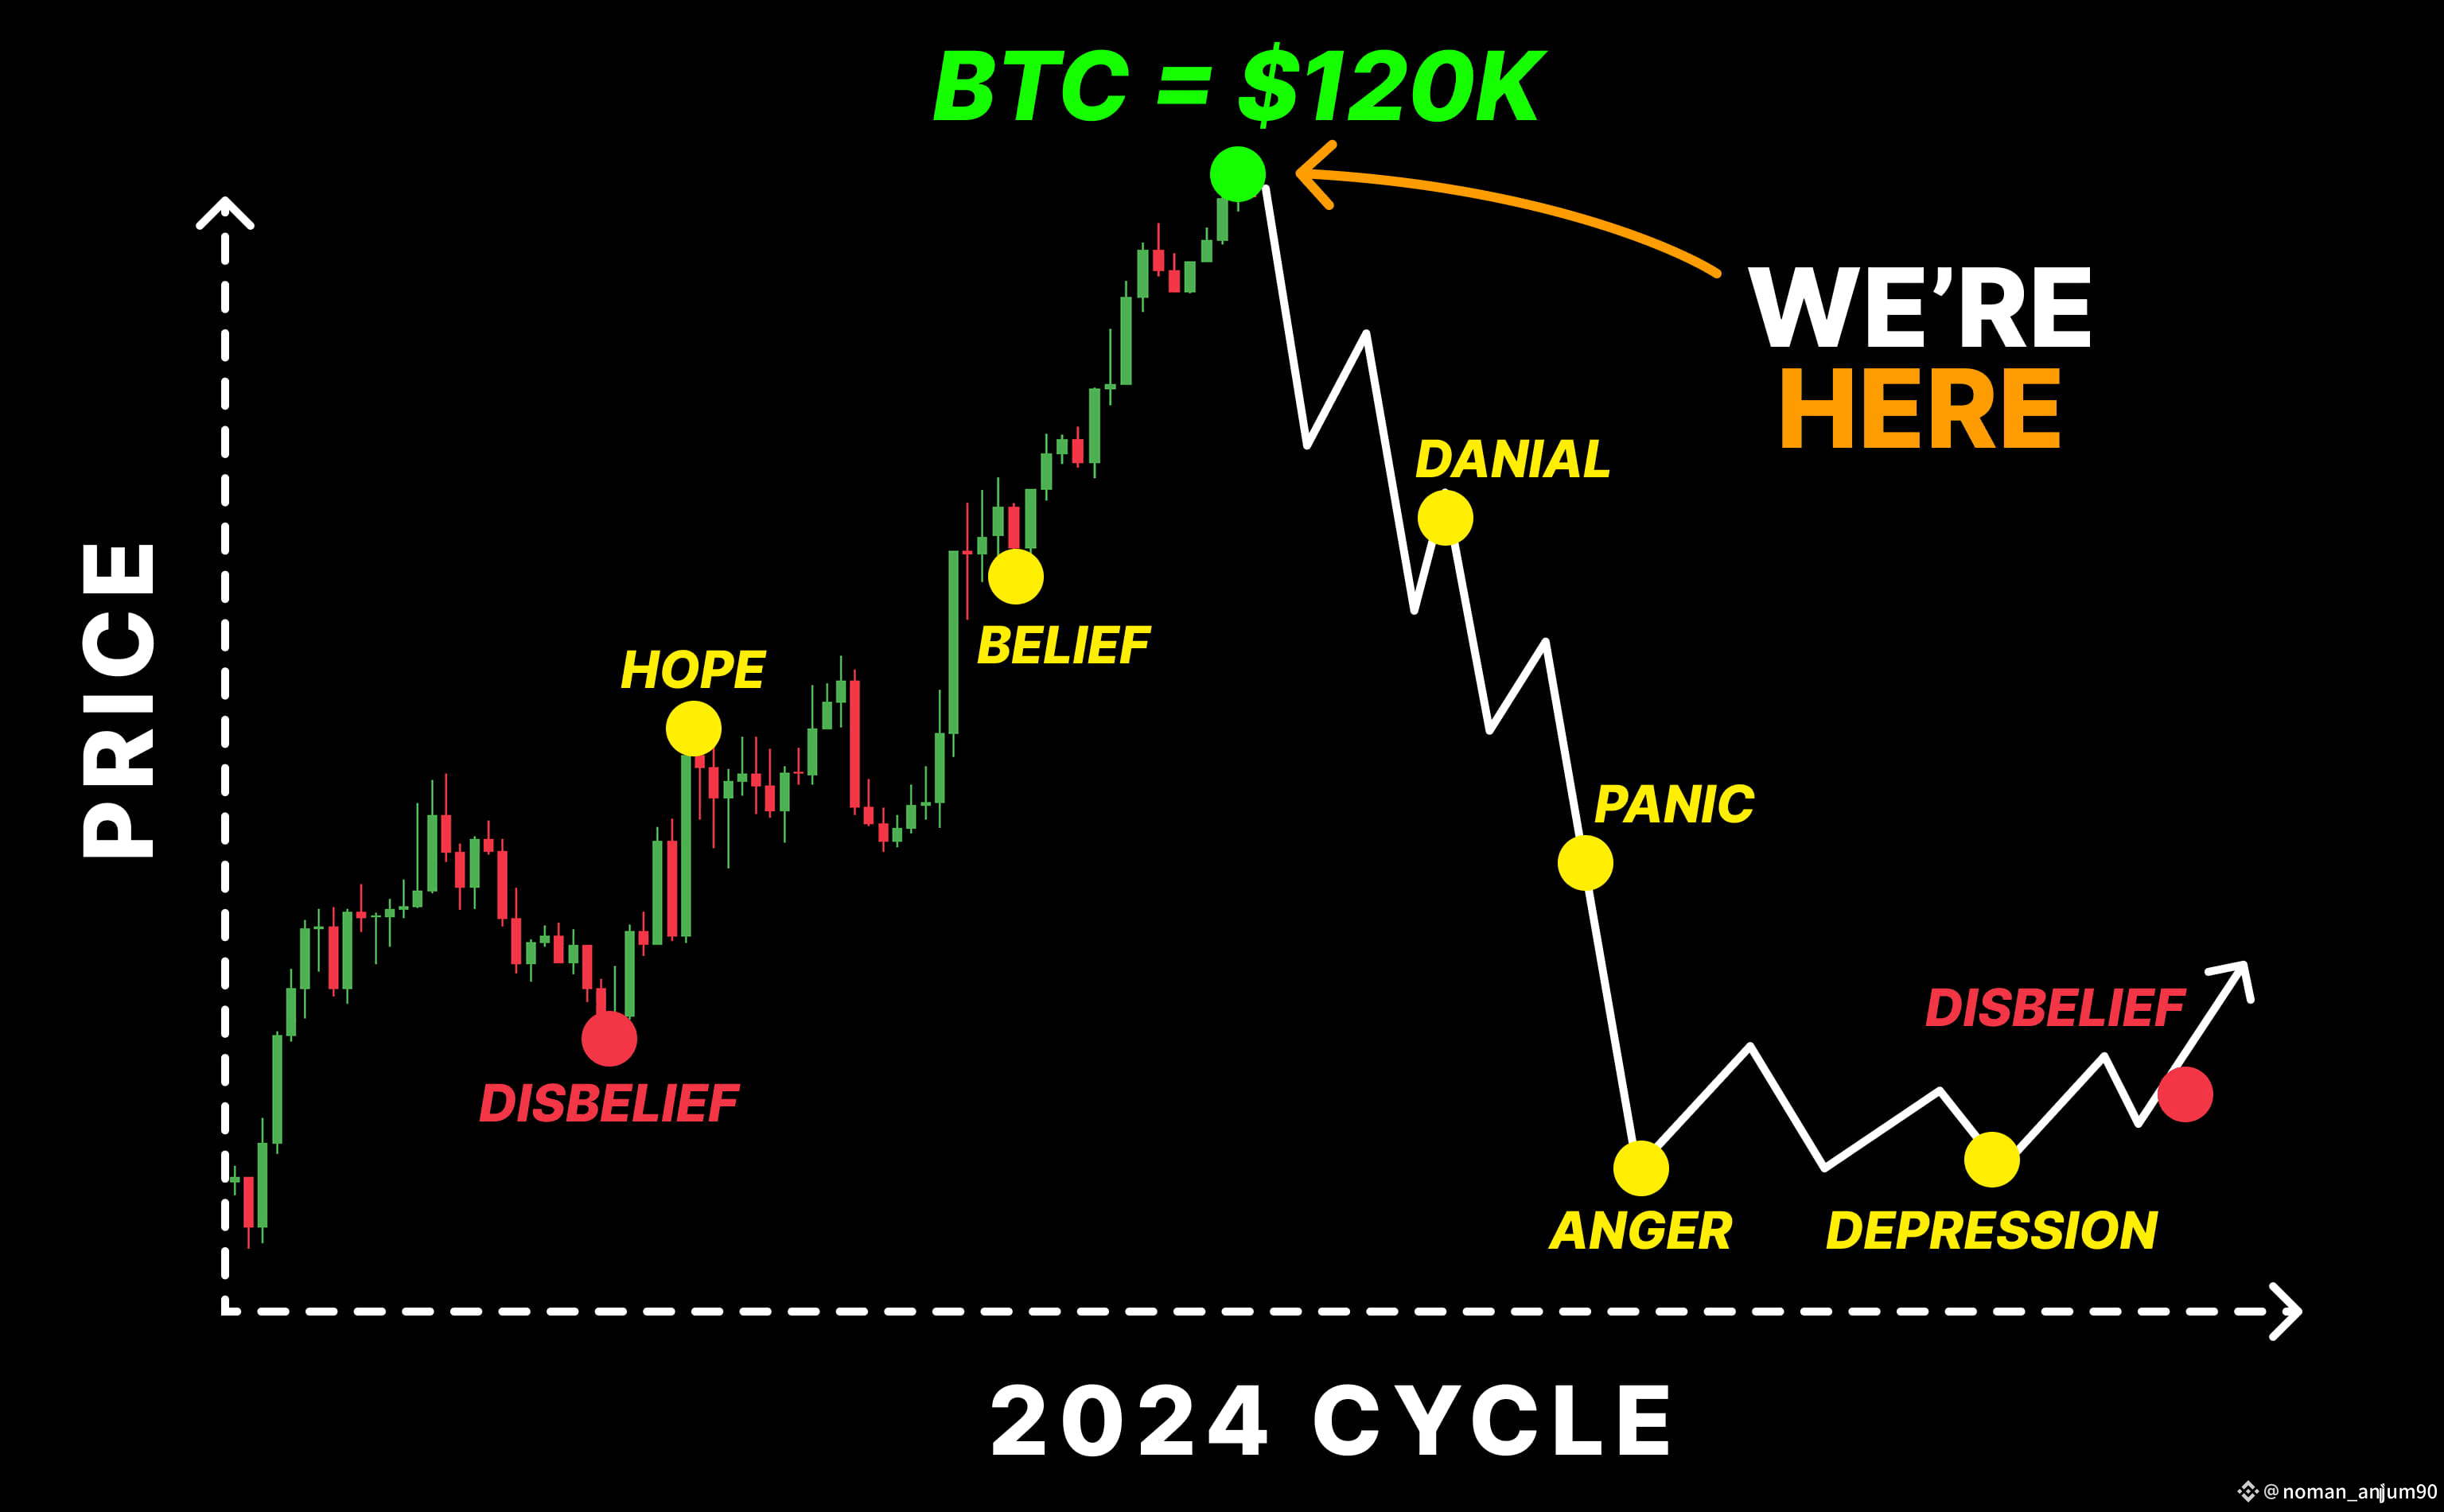
#TrumpVsMusk #BTC110KToday? $BTC This image illustrates a Bitcoin (BTC) market cycle psychology chart for 2024, suggesting that BTC has reached a cycle top at $120K, and the market is now in the “We’re Here” phase — typically associated with euphoria or peak optimism.
Key Phases Highlighted:
Hope → Belief → Euphoria ($120K top)
The next projected stages are:
Denial (misspelled as “Danial” in the image)
Panic
Anger
Depression
Final Disbelief before possible recovery
Interpretation:
The chart implies we are at the peak of the cycle, and a steep decline is expected next.
This matches classic Wall Street psychology cycle patterns, where emotions drive price action.
Key Takeaways:
If this projection is accurate, the worst part of the crash is still ahead.
A recovery and new disbelief phase could follow after a prolonged bear phase.
Investors should prepare for volatility and avoid getting trapped in emotional decisions.
#TrumpVsMusk #BTC110KToday? $BTC This image illustrates a Bitcoin (BTC) market cycle psychology chart for 2024, suggesting that BTC has reached a cycle top at $120K, and the market is now in the “We’re Here” phase — typically associated with euphoria or peak optimism.
Key Phases Highlighted:
Hope → Belief → Euphoria ($120K top)
The next projected stages are:
Denial (misspelled as “Danial” in the image)
Panic
Anger
Depression
Final Disbelief before possible recovery
Interpretation:
The chart implies we are at the peak of the cycle, and a steep decline is expected next.
This matches classic Wall Street psychology cycle patterns, where emotions drive price action.
Key Takeaways:
If this projection is accurate, the worst part of the crash is still ahead.
A recovery and new disbelief phase could follow after a prolonged bear phase.
Investors should prepare for volatility and avoid getting trapped in emotional decisions.
Key Phases Highlighted:
Hope → Belief → Euphoria ($120K top)
The next projected stages are:
Denial (misspelled as “Danial” in the image)
Panic
Anger
Depression
Final Disbelief before possible recovery
Interpretation:
The chart implies we are at the peak of the cycle, and a steep decline is expected next.
This matches classic Wall Street psychology cycle patterns, where emotions drive price action.
Key Takeaways:
If this projection is accurate, the worst part of the crash is still ahead.
A recovery and new disbelief phase could follow after a prolonged bear phase.
Investors should prepare for volatility and avoid getting trapped in emotional decisions.
2
137
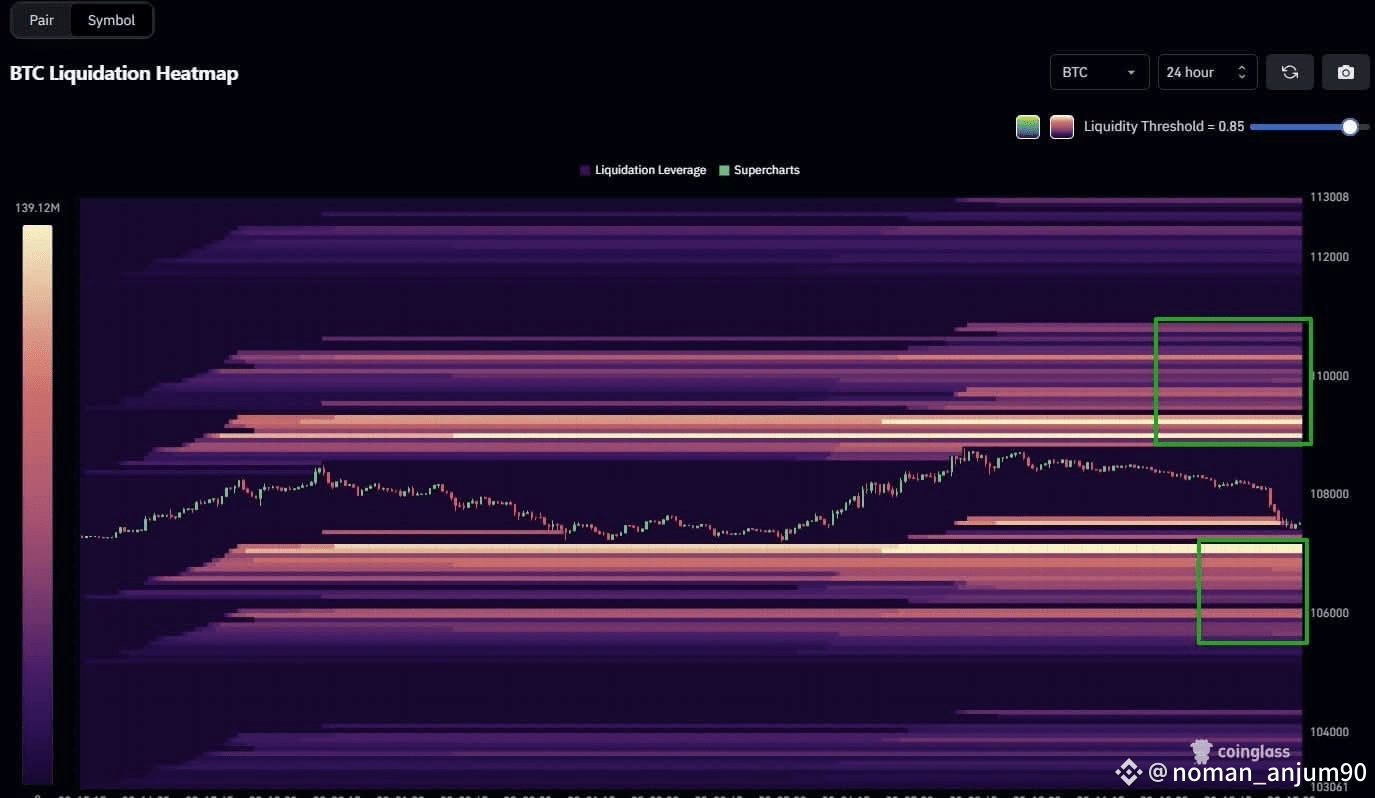
This image is a BTC Liquidation Heatmap from Coinglass, showing potential liquidation zones for leveraged positions over a 24-hour period.
🔍 Key Observations:
1. Heatmap Colors (Purple to Yellow/White):
Lighter colors (yellow/white) = Higher concentration of liquidation levels (more open leveraged positions around that price).
Darker purple = Lower activity/liquidity.
2. Price Levels (Right Axis):
The y-axis shows price levels, ranging roughly from 103,000 to 113,000.
3. Highlighted Zones (Green Boxes):
Upper Zone (~110,000 - 111,000):
Dense cluster of long liquidations. If price moves up, it could trigger a liquidity sweep — a fast wick to liquidate short positions.
Lower Zone (~105,500 - 106,500):
High concentration of long positions' liquidation zones. If price drops, many leveraged longs may get liquidated here.
---
📈 Trading Implications:
If BTC price rises sharply: Expect resistance around 110K–111K where short liquidations could occur.
If BTC dips further: The 105.5K–106.5K zone could act as a magnet, possibly forming a local bottom if many longs are wiped out.
⚠️ Strategy Note:
These heatmaps are often used by institutional players to predict and exploit liquidation liquidity. Watch these zones closely during high volatility periods.
This image is a BTC Liquidation Heatmap from Coinglass, showing potential liquidation zones for leveraged positions over a 24-hour period.
🔍 Key Observations:
1. Heatmap Colors (Purple to Yellow/White):
Lighter colors (yellow/white) = Higher concentration of liquidation levels (more open leveraged positions around that price).
Darker purple = Lower activity/liquidity.
2. Price Levels (Right Axis):
The y-axis shows price levels, ranging roughly from 103,000 to 113,000.
3. Highlighted Zones (Green Boxes):
Upper Zone (~110,000 - 111,000):
Dense cluster of long liquidations. If price moves up, it could trigger a liquidity sweep — a fast wick to liquidate short positions.
Lower Zone (~105,500 - 106,500):
High concentration of long positions' liquidation zones. If price drops, many leveraged longs may get liquidated here.
---
📈 Trading Implications:
If BTC price rises sharply: Expect resistance around 110K–111K where short liquidations could occur.
If BTC dips further: The 105.5K–106.5K zone could act as a magnet, possibly forming a local bottom if many longs are wiped out.
⚠️ Strategy Note:
These heatmaps are often used by institutional players to predict and exploit liquidation liquidity. Watch these zones closely during high volatility periods.
🔍 Key Observations:
1. Heatmap Colors (Purple to Yellow/White):
Lighter colors (yellow/white) = Higher concentration of liquidation levels (more open leveraged positions around that price).
Darker purple = Lower activity/liquidity.
2. Price Levels (Right Axis):
The y-axis shows price levels, ranging roughly from 103,000 to 113,000.
3. Highlighted Zones (Green Boxes):
Upper Zone (~110,000 - 111,000):
Dense cluster of long liquidations. If price moves up, it could trigger a liquidity sweep — a fast wick to liquidate short positions.
Lower Zone (~105,500 - 106,500):
High concentration of long positions' liquidation zones. If price drops, many leveraged longs may get liquidated here.
---
📈 Trading Implications:
If BTC price rises sharply: Expect resistance around 110K–111K where short liquidations could occur.
If BTC dips further: The 105.5K–106.5K zone could act as a magnet, possibly forming a local bottom if many longs are wiped out.
⚠️ Strategy Note:
These heatmaps are often used by institutional players to predict and exploit liquidation liquidity. Watch these zones closely during high volatility periods.
91
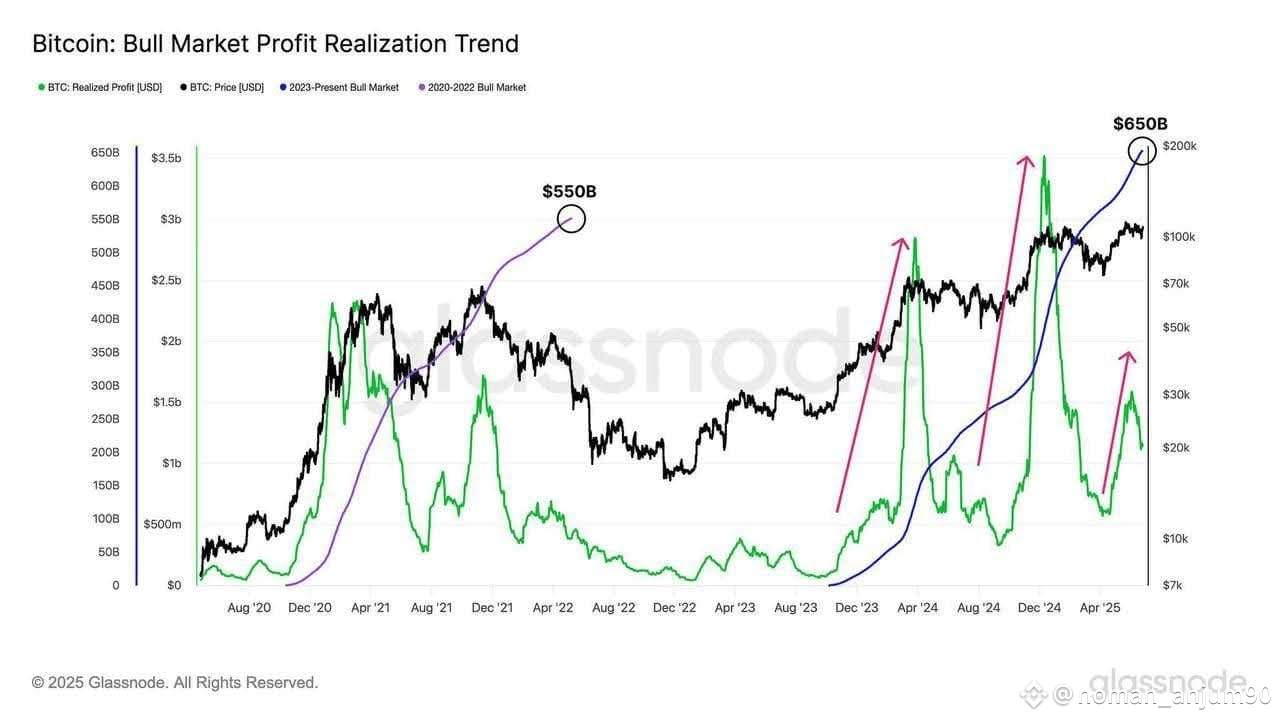
BTC Profits have surpassed $650B more than the entire last cycle. But as the third wave of profit-taking fades, liquidity dries up and momentum dies. This is exactly how Black Swans are born: When everyone thinks the top is safe, the real collapse begins. Stay ready, patience is your only shiel.
#StrategyBTCPurchase #NEWTBinanceHODLer
{future}(BTCUSDT)
BTC Profits have surpassed $650B more than the entire last cycle. But as the third wave of profit-taking fades, liquidity dries up and momentum dies. This is exactly how Black Swans are born: When everyone thinks the top is safe, the real collapse begins. Stay ready, patience is your only shiel.
#StrategyBTCPurchase #NEWTBinanceHODLer
#StrategyBTCPurchase #NEWTBinanceHODLer
70
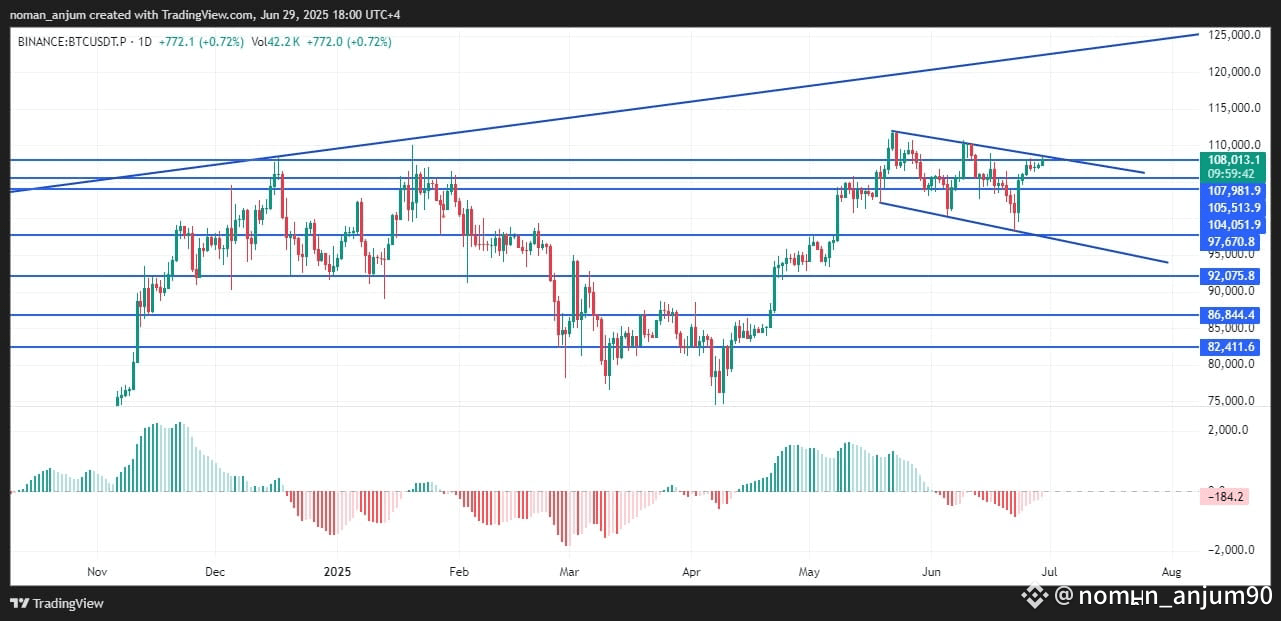
🔍 Key Technical Observations: $BTC
Pattern Formation
Symmetrical Triangle: Price is compressing between lower highs and higher lows — a neutral consolidation pattern.
BTC is currently testing the upper resistance line of the triangle near $108,000–$110,000.
Support Levels
Immediate support: $107,981
Key zones below:
$105,513
$104,051
$97,670
Major support zone at $92,075 and $86,844
Resistance Levels
Immediate resistance: $108,013 (triangle top)
Breakout target: If broken, BTC could retest previous high zones around $115,000 and potentially aim for $120,000–$125,000 region.
Volume & MACD Histogram
The histogram is slightly negative, suggesting bearish momentum has slowed but not yet reversed.
A bullish breakout would need confirmation with increasing volume and histogram flipping green.
---
🔮 Potential Scenarios:
✅ Bullish Breakout
If BTC breaks above $110,000 with strong volume:
Target 1: $115,000
Target 2: $120,000–$125,000
Confirmation: Daily candle close above triangle resistance
❌ Bearish Rejection
If price gets rejected here and breaks below $105,000:
Support retest at $97,670
Further downside to $92,075 or even $86,844 if selling pressure increases
---
📌 Strategy Suggestion:
Aggressive Entry: Buy on breakout + volume above $110K
Conservative Entry: Wait for daily candle close + retest above breakout
Stop-Loss: Below $104,000 (previous swing low)
Short Setup: On rejection at resistance with breakdown below $105K
🔍 Key Technical Observations: $BTC
Pattern Formation
Symmetrical Triangle: Price is compressing between lower highs and higher lows — a neutral consolidation pattern.
BTC is currently testing the upper resistance line of the triangle near $108,000–$110,000.
Support Levels
Immediate support: $107,981
Key zones below:
$105,513
$104,051
$97,670
Major support zone at $92,075 and $86,844
Resistance Levels
Immediate resistance: $108,013 (triangle top)
Breakout target: If broken, BTC could retest previous high zones around $115,000 and potentially aim for $120,000–$125,000 region.
Volume & MACD Histogram
The histogram is slightly negative, suggesting bearish momentum has slowed but not yet reversed.
A bullish breakout would need confirmation with increasing volume and histogram flipping green.
---
🔮 Potential Scenarios:
✅ Bullish Breakout
If BTC breaks above $110,000 with strong volume:
Target 1: $115,000
Target 2: $120,000–$125,000
Confirmation: Daily candle close above triangle resistance
❌ Bearish Rejection
If price gets rejected here and breaks below $105,000:
Support retest at $97,670
Further downside to $92,075 or even $86,844 if selling pressure increases
---
📌 Strategy Suggestion:
Aggressive Entry: Buy on breakout + volume above $110K
Conservative Entry: Wait for daily candle close + retest above breakout
Stop-Loss: Below $104,000 (previous swing low)
Short Setup: On rejection at resistance with breakdown below $105K
Pattern Formation
Symmetrical Triangle: Price is compressing between lower highs and higher lows — a neutral consolidation pattern.
BTC is currently testing the upper resistance line of the triangle near $108,000–$110,000.
Support Levels
Immediate support: $107,981
Key zones below:
$105,513
$104,051
$97,670
Major support zone at $92,075 and $86,844
Resistance Levels
Immediate resistance: $108,013 (triangle top)
Breakout target: If broken, BTC could retest previous high zones around $115,000 and potentially aim for $120,000–$125,000 region.
Volume & MACD Histogram
The histogram is slightly negative, suggesting bearish momentum has slowed but not yet reversed.
A bullish breakout would need confirmation with increasing volume and histogram flipping green.
---
🔮 Potential Scenarios:
✅ Bullish Breakout
If BTC breaks above $110,000 with strong volume:
Target 1: $115,000
Target 2: $120,000–$125,000
Confirmation: Daily candle close above triangle resistance
❌ Bearish Rejection
If price gets rejected here and breaks below $105,000:
Support retest at $97,670
Further downside to $92,075 or even $86,844 if selling pressure increases
---
📌 Strategy Suggestion:
Aggressive Entry: Buy on breakout + volume above $110K
Conservative Entry: Wait for daily candle close + retest above breakout
Stop-Loss: Below $104,000 (previous swing low)
Short Setup: On rejection at resistance with breakdown below $105K
58

Article
Bitcoin (BTC): The Pioneer of Digital CurrencyBitcoin (BTC), the world’s first and most valuable cryptocurrency, has transformed from a niche technological experiment into a global financial asset class. Since its inception in 2009 by the pseudonymous developer Satoshi Nakamoto, Bitcoin has sparked an entire industry centered around blockchain technology, digital assets, and decentralized finance.
What Is Bitcoin?
Bitcoin is a decentralized digital currency that allows peer-to-peer transactions without the need for a central authority like a bank or government. It operates on a technology called blockchain—a public, immutable ledger that records all Bitcoin transactions. This system ensures transparency and security, as every participant in the network has access to the same transaction data.
The total supply of Bitcoin is capped at 21 million coins, making it inherently deflationary. This scarcity is one of the key reasons Bitcoin is often referred to as "digital gold."
Why Is Bitcoin Important?
1. Store of Value: Many investors consider Bitcoin a hedge against inflation and economic instability. Its limited supply and decentralized nature make it attractive as a digital store of value.
2. Financial Inclusion: Bitcoin provides access to financial services for millions of people worldwide who are unbanked or underbanked.
3. Decentralization: It challenges traditional financial systems by allowing people to control their own money without intermediaries.
Bitcoin’s Market Influence
Bitcoin is the largest cryptocurrency by market capitalization and often dictates the overall direction of the crypto market. When BTC moves, altcoins tend to follow. Institutional adoption has grown, with major companies and financial firms integrating Bitcoin into their investment portfolios or accepting it as payment.
Current Trends and Developments
ETFs and Regulation: The approval of Bitcoin Exchange-Traded Funds (ETFs) in several countries has brought BTC closer to traditional finance, increasing accessibility for retail and institutional investors.
Halving Events: Bitcoin's reward halving (occurring roughly every 4 years) reduces the block reward for miners and typically precedes significant price rallies. The next halving is expected in 2028.
Layer 2 Solutions: Technologies like the Lightning Network aim to solve Bitcoin's scalability issues, enabling faster and cheaper transactions.
Challenges
Volatility: Bitcoin’s price can fluctuate wildly, making it a risky short-term investment.
Regulatory Uncertainty: Different countries have different stances on crypto, from full acceptance to outright bans.
Environmental Concerns: Bitcoin mining consumes significant energy, raising questions about its sustainability. However, there's a growing shift toward greener mining practices.
The Future of Bitcoin
Bitcoin is steadily moving from speculation to adoption. As the global economy digitizes, Bitcoin may play a central role in reshaping how we understand money and value. With ongoing technological development, increased regulatory clarity, and broader mainstream awareness, Bitcoin is poised to remain a key player in the financial world for years to come.
$BTC
{spot}(BTCUSDT)
Bitcoin (BTC): The Pioneer of Digital Currency
Bitcoin (BTC), the world’s first and most valuable cryptocurrency, has transformed from a niche technological experiment into a global financial asset class. Since its inception in 2009 by the pseudonymous developer Satoshi Nakamoto, Bitcoin has sparked an entire industry centered around blockchain technology, digital assets, and decentralized finance.
What Is Bitcoin?
Bitcoin is a decentralized digital currency that allows peer-to-peer transactions without the need for a central authority like a bank or government. It operates on a technology called blockchain—a public, immutable ledger that records all Bitcoin transactions. This system ensures transparency and security, as every participant in the network has access to the same transaction data.
The total supply of Bitcoin is capped at 21 million coins, making it inherently deflationary. This scarcity is one of the key reasons Bitcoin is often referred to as "digital gold."
Why Is Bitcoin Important?
1. Store of Value: Many investors consider Bitcoin a hedge against inflation and economic instability. Its limited supply and decentralized nature make it attractive as a digital store of value.
2. Financial Inclusion: Bitcoin provides access to financial services for millions of people worldwide who are unbanked or underbanked.
3. Decentralization: It challenges traditional financial systems by allowing people to control their own money without intermediaries.
Bitcoin’s Market Influence
Bitcoin is the largest cryptocurrency by market capitalization and often dictates the overall direction of the crypto market. When BTC moves, altcoins tend to follow. Institutional adoption has grown, with major companies and financial firms integrating Bitcoin into their investment portfolios or accepting it as payment.
Current Trends and Developments
ETFs and Regulation: The approval of Bitcoin Exchange-Traded Funds (ETFs) in several countries has brought BTC closer to traditional finance, increasing accessibility for retail and institutional investors.
Halving Events: Bitcoin's reward halving (occurring roughly every 4 years) reduces the block reward for miners and typically precedes significant price rallies. The next halving is expected in 2028.
Layer 2 Solutions: Technologies like the Lightning Network aim to solve Bitcoin's scalability issues, enabling faster and cheaper transactions.
Challenges
Volatility: Bitcoin’s price can fluctuate wildly, making it a risky short-term investment.
Regulatory Uncertainty: Different countries have different stances on crypto, from full acceptance to outright bans.
Environmental Concerns: Bitcoin mining consumes significant energy, raising questions about its sustainability. However, there's a growing shift toward greener mining practices.
The Future of Bitcoin
Bitcoin is steadily moving from speculation to adoption. As the global economy digitizes, Bitcoin may play a central role in reshaping how we understand money and value. With ongoing technological development, increased regulatory clarity, and broader mainstream awareness, Bitcoin is poised to remain a key player in the financial world for years to come.
$BTC
What Is Bitcoin?
Bitcoin is a decentralized digital currency that allows peer-to-peer transactions without the need for a central authority like a bank or government. It operates on a technology called blockchain—a public, immutable ledger that records all Bitcoin transactions. This system ensures transparency and security, as every participant in the network has access to the same transaction data.
The total supply of Bitcoin is capped at 21 million coins, making it inherently deflationary. This scarcity is one of the key reasons Bitcoin is often referred to as "digital gold."
Why Is Bitcoin Important?
1. Store of Value: Many investors consider Bitcoin a hedge against inflation and economic instability. Its limited supply and decentralized nature make it attractive as a digital store of value.
2. Financial Inclusion: Bitcoin provides access to financial services for millions of people worldwide who are unbanked or underbanked.
3. Decentralization: It challenges traditional financial systems by allowing people to control their own money without intermediaries.
Bitcoin’s Market Influence
Bitcoin is the largest cryptocurrency by market capitalization and often dictates the overall direction of the crypto market. When BTC moves, altcoins tend to follow. Institutional adoption has grown, with major companies and financial firms integrating Bitcoin into their investment portfolios or accepting it as payment.
Current Trends and Developments
ETFs and Regulation: The approval of Bitcoin Exchange-Traded Funds (ETFs) in several countries has brought BTC closer to traditional finance, increasing accessibility for retail and institutional investors.
Halving Events: Bitcoin's reward halving (occurring roughly every 4 years) reduces the block reward for miners and typically precedes significant price rallies. The next halving is expected in 2028.
Layer 2 Solutions: Technologies like the Lightning Network aim to solve Bitcoin's scalability issues, enabling faster and cheaper transactions.
Challenges
Volatility: Bitcoin’s price can fluctuate wildly, making it a risky short-term investment.
Regulatory Uncertainty: Different countries have different stances on crypto, from full acceptance to outright bans.
Environmental Concerns: Bitcoin mining consumes significant energy, raising questions about its sustainability. However, there's a growing shift toward greener mining practices.
The Future of Bitcoin
Bitcoin is steadily moving from speculation to adoption. As the global economy digitizes, Bitcoin may play a central role in reshaping how we understand money and value. With ongoing technological development, increased regulatory clarity, and broader mainstream awareness, Bitcoin is poised to remain a key player in the financial world for years to come.
$BTC
1
39
Log in to explore more content
Join global crypto users on Binance Square
⚡️ Get latest and useful information about crypto.
💬 Trusted by the world’s largest crypto exchange.
👍 Discover real insights from verified creators.
Email / Phone number
Trending Topics
NEARRisesNearly80%InAWeek
19,943 views
680 Discussing
#nearrisesnearly80%inaweek
🚨 NEAR RALLIES NEARLY 80% IN ONE WEEK
NEAR Protocol’s native token has delivered a major weekly move, gaining roughly 78% over the past seven days and trading around $4.29 on September 21, according to reported CoinGecko data.
📊 WHAT’S DRIVING THE ATTENTION?
• NEAR climbed from roughly $2.20 to above $4.20 within about a week
• NEAR Intents cumulative volume is approaching $30B
• Recent activity around confidential perpetual-futures trading has added another major narrative around the ecosystem
• NEAR’s weekly performance has significantly outpaced the broader crypto market, which gained around 6% over the same period
🔎 WHY IT MATTERS
The rally puts renewed focus on NEAR’s cross-chain liquidity infrastructure, Intents ecosystem and privacy-focused trading developments.
But after such a rapid move, volatility and profit-taking are also important risks to watch. A strong weekly gain does not guarantee that momentum will continue.
📌 WATCH NEXT
Traders may be watching whether NEAR can maintain the recent breakout and whether network activity continues to support the market narrative.
NEAR’s price move is strong — but the next test is whether ecosystem activity can keep pace with the speculation.
$MUBARAK $PHA $NIL
顾清妍
·2 Likes
·1.6k views
MultiversXPlansHardForkRecovery
18,516 views
524 Discussing
CircleLaunchesInstitutionalBTCBackedBorrowing
19,147 views
655 Discussing