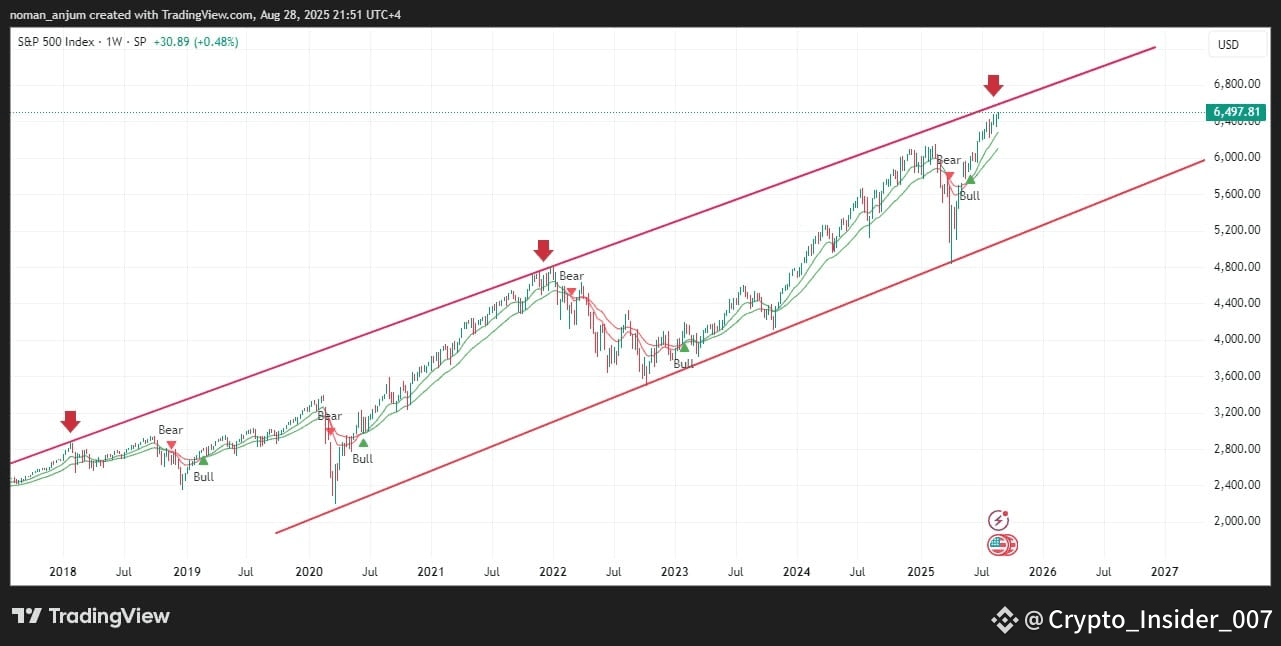
BTC tops have correlated with S&P 500 tops historically. Let’s break it down step by step:
---
1. S&P 500 Major Tops (Recent)
Jan 2018 → Hit channel top (red arrow on your chart)
Dec 2021 / Jan 2022 → Another major peak before correction
Aug 2025 → Currently testing the channel top again
---
2. BTC Behavior at the Same Times
Jan 2018 (S&P top)
BTC had just hit its $20k ATH in Dec 2017
Entered a brutal bear market right after (–85% over 1 year)
Dec 2021 / Jan 2022 (S&P top)
BTC made its $69k ATH in Nov 2021 (a bit earlier)
By Jan 2022, BTC was already rolling over → start of crypto winter
S&P peaked slightly after BTC, but both aligned in topping cycle
Aug 2025 (S&P testing top now)
If history rhymes → BTC could be near or just past a major cycle top.
BTC cycle usually peaks slightly earlier than equities (crypto is higher-beta and leads risk sentiment).
---
3. Correlation Insight
BTC tends to top slightly before or around S&P tops.
After S&P tops → both enter risk-off periods (BTC falls harder, equities correct moderately).
BTC bottoms often align with S&P major lows (e.g., Mar 2020 crash, Nov 2022 lows).
---
4. Implication for Now (Aug 2025)
Since S&P is at resistance → BTC may either:
Already be at/near its cycle top (like Nov 2021 before S&P Jan 2022), or
Could top within the next 1–3 months if S&P confirms reversal.
If S&P rejects at channel → BTC likely heads into next bear phase.
If S&P breaks out strongly → BTC could extend into a supercycle rally (less likely but possible).
---
📌 In short:
BTC cycle tops often precede or coincide with S&P tops. With S&P at resistance now, BTC could be at/near its 2025 macro peak. $BTC
---
1. S&P 500 Major Tops (Recent)
Jan 2018 → Hit channel top (red arrow on your chart)
Dec 2021 / Jan 2022 → Another major peak before correction
Aug 2025 → Currently testing the channel top again
---
2. BTC Behavior at the Same Times
Jan 2018 (S&P top)
BTC had just hit its $20k ATH in Dec 2017
Entered a brutal bear market right after (–85% over 1 year)
Dec 2021 / Jan 2022 (S&P top)
BTC made its $69k ATH in Nov 2021 (a bit earlier)
By Jan 2022, BTC was already rolling over → start of crypto winter
S&P peaked slightly after BTC, but both aligned in topping cycle
Aug 2025 (S&P testing top now)
If history rhymes → BTC could be near or just past a major cycle top.
BTC cycle usually peaks slightly earlier than equities (crypto is higher-beta and leads risk sentiment).
---
3. Correlation Insight
BTC tends to top slightly before or around S&P tops.
After S&P tops → both enter risk-off periods (BTC falls harder, equities correct moderately).
BTC bottoms often align with S&P major lows (e.g., Mar 2020 crash, Nov 2022 lows).
---
4. Implication for Now (Aug 2025)
Since S&P is at resistance → BTC may either:
Already be at/near its cycle top (like Nov 2021 before S&P Jan 2022), or
Could top within the next 1–3 months if S&P confirms reversal.
If S&P rejects at channel → BTC likely heads into next bear phase.
If S&P breaks out strongly → BTC could extend into a supercycle rally (less likely but possible).
---
📌 In short:
BTC cycle tops often precede or coincide with S&P tops. With S&P at resistance now, BTC could be at/near its 2025 macro peak. $BTC