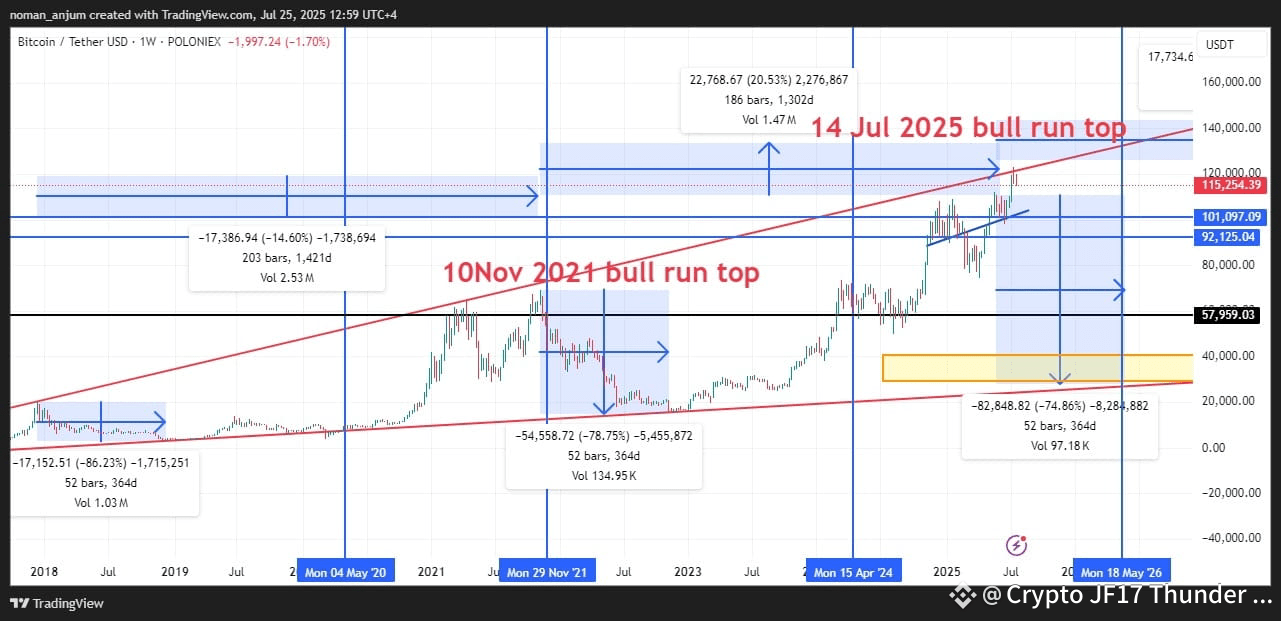
📈 $BTC Summary of Chart Key Points:
✅ Historical Bull Top:
10 Nov 2021 — BTC Top at ~$69K
After that, BTC dropped ~78.75% over 364 days into late 2022.
✅ Projected Bull Top:
14 July 2025 — Projected Bull Run Top
Price target: ~$115K–$120K range
Based on trendline and timing from past cycles
✅ Bear Market Projection:
After 14 July 2025, potential ~75–85% crash (similar to 2018 & 2022)
Projected bottom price: ~$17K–$30K range (yellow box)
Projected bottom date: ~18 May 2026 (52 bars/364 days after top)
---
🔔 Suggested Alerts (based on your chart):
Alert Level Trigger Condition Action/Note
🚨 Take Profit Zone Price enters $115K–$120K area (Jul 2025) Begin profit-taking or hedging
⚠️ Trend Reversal Warning Breakdown from the ascending wedge or fails to hold $101K–$92K Potential start of bear market
🔻 Capitulation Zone Alert BTC enters $40K–$30K (yellow zone) in 2026 Look for long-term entry opportunities
✅ Accumulation Alert BTC reaches $20K–$25K in mid-2026 Strong buy zone based on cycle repeats
---
📌 Insights & Strategy Suggestion:
This projection assumes Bitcoin follows historical halving cycles (peaking ~12-15 months after halving).
If 14 July 2025 is the peak:
Watch for distribution signs (volume divergence, bearish divergences, lower highs)
Prepare for a year-long bear market as in previous cycles.
---
✅ What You Can Do Now:
1. Set TradingView Alerts at key levels:
$115K (watch for top signals)
$92K (trendline support)
$40K, $30K, $20K (for potential buys)
2. Risk Management:
Secure profits as BTC enters top zone.
Don’t go all-in at the top; be ready for a 70–80% drop.
3. Portfolio Prep:
Have a cash position ready for mid-2026 bottom.
Diversify if holding only BTC.
✅ Historical Bull Top:
10 Nov 2021 — BTC Top at ~$69K
After that, BTC dropped ~78.75% over 364 days into late 2022.
✅ Projected Bull Top:
14 July 2025 — Projected Bull Run Top
Price target: ~$115K–$120K range
Based on trendline and timing from past cycles
✅ Bear Market Projection:
After 14 July 2025, potential ~75–85% crash (similar to 2018 & 2022)
Projected bottom price: ~$17K–$30K range (yellow box)
Projected bottom date: ~18 May 2026 (52 bars/364 days after top)
---
🔔 Suggested Alerts (based on your chart):
Alert Level Trigger Condition Action/Note
🚨 Take Profit Zone Price enters $115K–$120K area (Jul 2025) Begin profit-taking or hedging
⚠️ Trend Reversal Warning Breakdown from the ascending wedge or fails to hold $101K–$92K Potential start of bear market
🔻 Capitulation Zone Alert BTC enters $40K–$30K (yellow zone) in 2026 Look for long-term entry opportunities
✅ Accumulation Alert BTC reaches $20K–$25K in mid-2026 Strong buy zone based on cycle repeats
---
📌 Insights & Strategy Suggestion:
This projection assumes Bitcoin follows historical halving cycles (peaking ~12-15 months after halving).
If 14 July 2025 is the peak:
Watch for distribution signs (volume divergence, bearish divergences, lower highs)
Prepare for a year-long bear market as in previous cycles.
---
✅ What You Can Do Now:
1. Set TradingView Alerts at key levels:
$115K (watch for top signals)
$92K (trendline support)
$40K, $30K, $20K (for potential buys)
2. Risk Management:
Secure profits as BTC enters top zone.
Don’t go all-in at the top; be ready for a 70–80% drop.
3. Portfolio Prep:
Have a cash position ready for mid-2026 bottom.
Diversify if holding only BTC.