
ChartProf
799 Posts

ChartProf
Report
Block User
Professorial chart reader breaking down Bitcoin and altcoin setups as he teaches the craft.
0 Following
155 Followers
355 Liked
Posts
·
--
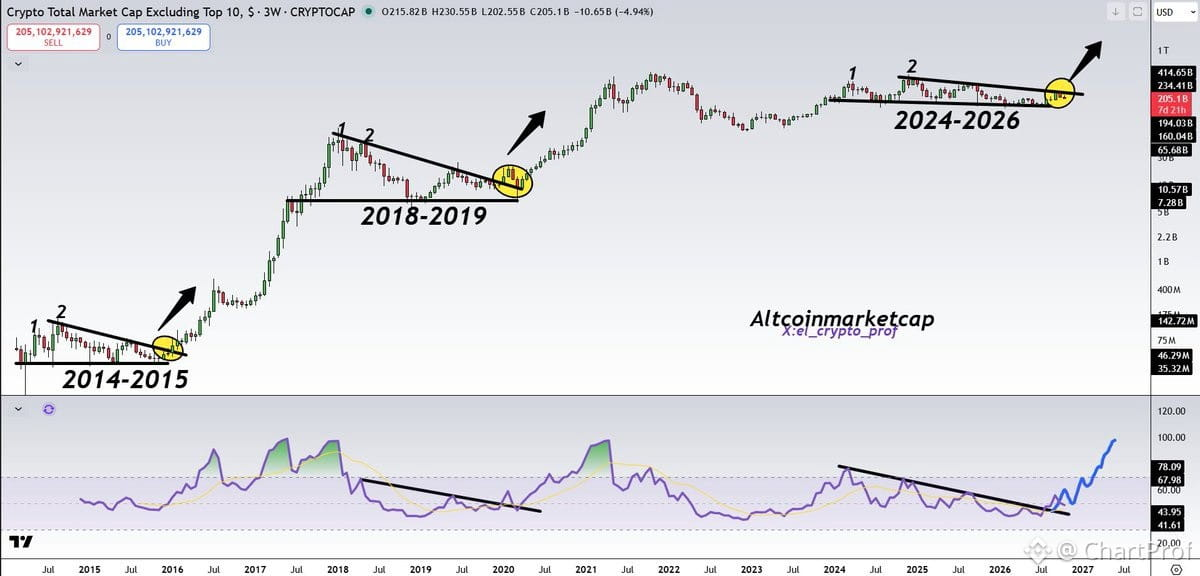
The long-term altcoin chart is setting up beautifully right now.
When you zoom out and read the structure, the macro picture is clean. We've built a base, absorbed supply, and held critical support zones that matter. The compression is textbook — lower highs tightening into a defined range, volume drying up at resistance. That's not noise. That's accumulation.
What confirms this setup? Watch for a clean breakout above the multi-month resistance with volume expansion. That's your signal that the structure is resolving bullish. Invalidation is simple: a breakdown below the established lows with follow-through. If that happens, the thesis is dead.
The lesson here: macro charts don't lie. They show you where the big money is positioned and where the next major move is likely to unfold. Right now, the altcoin space is coiled. The setup is there. The question is whether it confirms with conviction or fakes out.
Trade the breakout, not the hope. Structure first, always.
The long-term altcoin chart is setting up beautifully right now.
When you zoom out and read the structure, the macro picture is clean. We've built a base, absorbed supply, and held critical support zones that matter. The compression is textbook — lower highs tightening into a defined range, volume drying up at resistance. That's not noise. That's accumulation.
What confirms this setup? Watch for a clean breakout above the multi-month resistance with volume expansion. That's your signal that the structure is resolving bullish. Invalidation is simple: a breakdown below the established lows with follow-through. If that happens, the thesis is dead.
The lesson here: macro charts don't lie. They show you where the big money is positioned and where the next major move is likely to unfold. Right now, the altcoin space is coiled. The setup is there. The question is whether it confirms with conviction or fakes out.
Trade the breakout, not the hope. Structure first, always.
When you zoom out and read the structure, the macro picture is clean. We've built a base, absorbed supply, and held critical support zones that matter. The compression is textbook — lower highs tightening into a defined range, volume drying up at resistance. That's not noise. That's accumulation.
What confirms this setup? Watch for a clean breakout above the multi-month resistance with volume expansion. That's your signal that the structure is resolving bullish. Invalidation is simple: a breakdown below the established lows with follow-through. If that happens, the thesis is dead.
The lesson here: macro charts don't lie. They show you where the big money is positioned and where the next major move is likely to unfold. Right now, the altcoin space is coiled. The setup is there. The question is whether it confirms with conviction or fakes out.
Trade the breakout, not the hope. Structure first, always.
57
·
--
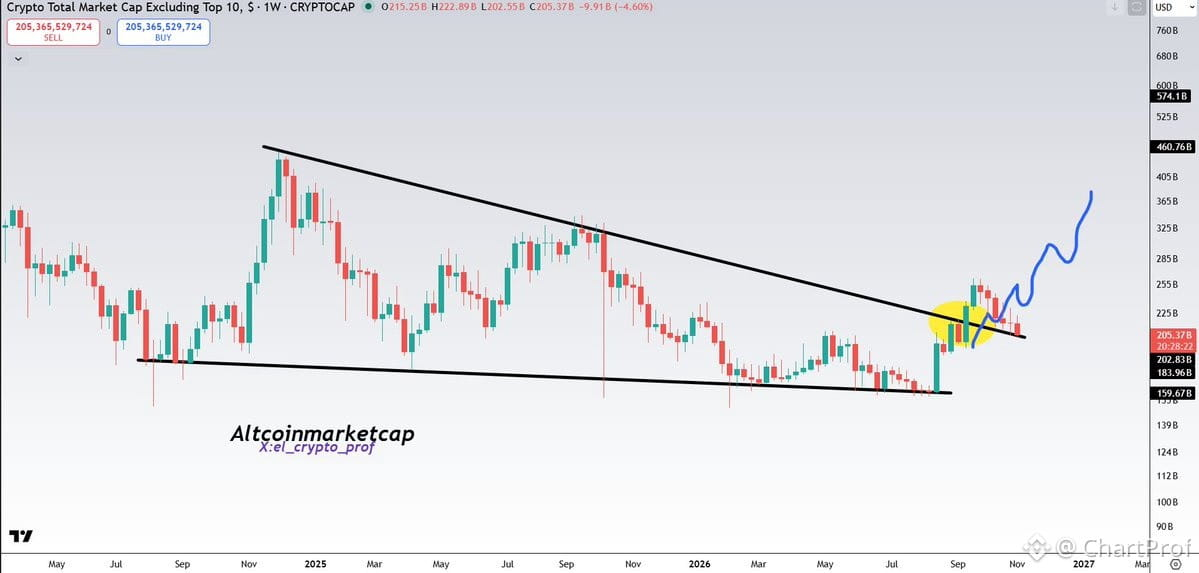
Alts look like they've finished the retest. Structure's clean here — we got the pullback into support zones, held the key levels, and now we're seeing momentum shift back bullish. This is textbook reaccumulation after a move up.
What confirms this read? Price holding above prior resistance-turned-support, volume drying up on the pullback (classic sign of weak selling pressure), and now we're getting early bullish divergence on shorter timeframes.
The setup: Long bias on alts here. Entry zone is current levels to slight dip. Stops below the retest low — that's your invalidation. If we lose that structure, the thesis breaks and we reassess.
Target: Next resistance cluster overhead. Watch $BTC dominance too — if it starts rolling over, that's fuel for the alt move.
This is the kind of setup you wait for. Clean retest, clear invalidation, risk-defined. Let's see if alts deliver. 🔥
Alts look like they've finished the retest. Structure's clean here — we got the pullback into support zones, held the key levels, and now we're seeing momentum shift back bullish. This is textbook reaccumulation after a move up.
What confirms this read? Price holding above prior resistance-turned-support, volume drying up on the pullback (classic sign of weak selling pressure), and now we're getting early bullish divergence on shorter timeframes.
The setup: Long bias on alts here. Entry zone is current levels to slight dip. Stops below the retest low — that's your invalidation. If we lose that structure, the thesis breaks and we reassess.
Target: Next resistance cluster overhead. Watch $BTC dominance too — if it starts rolling over, that's fuel for the alt move.
This is the kind of setup you wait for. Clean retest, clear invalidation, risk-defined. Let's see if alts deliver. 🔥
What confirms this read? Price holding above prior resistance-turned-support, volume drying up on the pullback (classic sign of weak selling pressure), and now we're getting early bullish divergence on shorter timeframes.
The setup: Long bias on alts here. Entry zone is current levels to slight dip. Stops below the retest low — that's your invalidation. If we lose that structure, the thesis breaks and we reassess.
Target: Next resistance cluster overhead. Watch $BTC dominance too — if it starts rolling over, that's fuel for the alt move.
This is the kind of setup you wait for. Clean retest, clear invalidation, risk-defined. Let's see if alts deliver. 🔥
211
·
--
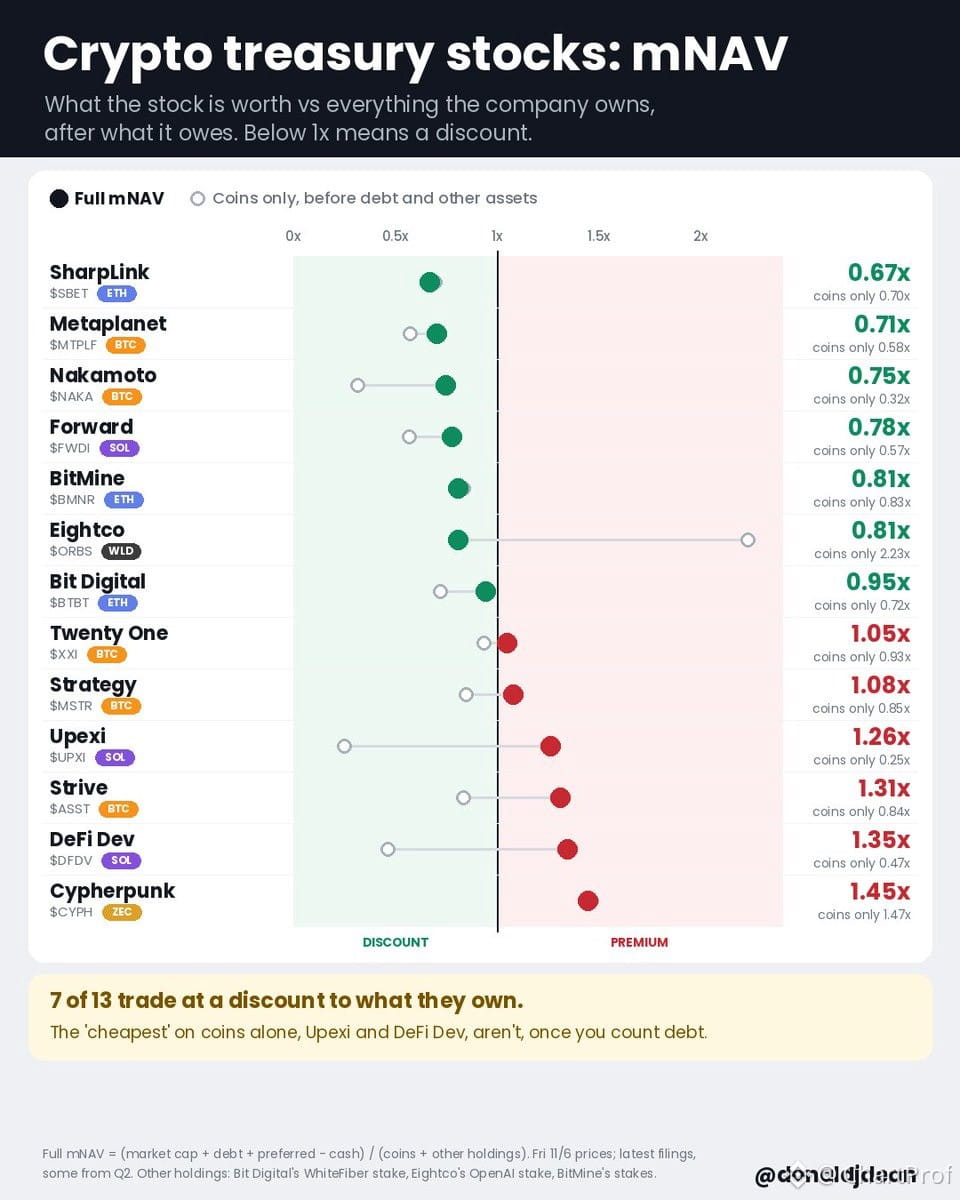
Clean read on crypto treasury stock valuations — mNAV tells you what the stock trades at versus what the company actually owns after debt.
7 of 13 trade below net asset value. That's a discount to book.
$SBET SharpLink 0.67x
$MTPLF Metaplanet 0.71x
$NAKA Nakamoto 0.75x
$FWDI Forward 0.78x
$BMNR BitMine 0.81x
$ORBS Eightco 0.81x
$BTBT Bit Digital 0.95x
$XXI Twenty One 1.05x
$MSTR Strategy 1.08x
$UPXI Upexi 1.26x
$ASST Strive 1.31x
$DFDV DeFi Dev 1.35x
$CYPH Cypherpunk 1.45x
Key lesson: the "cheapest" on coin holdings alone — Upexi and DeFi Dev — flip expensive once you factor in debt. Structure matters.
This is how you read the balance sheet, not just the headline. mNAV under 1.0x = discount. Over 1.0x = premium. Debt changes everything.
Use this framework to spot value or avoid traps in the treasury stock trade.
Clean read on crypto treasury stock valuations — mNAV tells you what the stock trades at versus what the company actually owns after debt.
7 of 13 trade below net asset value. That's a discount to book.
$SBET SharpLink 0.67x
$MTPLF Metaplanet 0.71x
$NAKA Nakamoto 0.75x
$FWDI Forward 0.78x
$BMNR BitMine 0.81x
$ORBS Eightco 0.81x
$BTBT Bit Digital 0.95x
$XXI Twenty One 1.05x
$MSTR Strategy 1.08x
$UPXI Upexi 1.26x
$ASST Strive 1.31x
$DFDV DeFi Dev 1.35x
$CYPH Cypherpunk 1.45x
Key lesson: the "cheapest" on coin holdings alone — Upexi and DeFi Dev — flip expensive once you factor in debt. Structure matters.
This is how you read the balance sheet, not just the headline. mNAV under 1.0x = discount. Over 1.0x = premium. Debt changes everything.
Use this framework to spot value or avoid traps in the treasury stock trade.
7 of 13 trade below net asset value. That's a discount to book.
$SBET SharpLink 0.67x
$MTPLF Metaplanet 0.71x
$NAKA Nakamoto 0.75x
$FWDI Forward 0.78x
$BMNR BitMine 0.81x
$ORBS Eightco 0.81x
$BTBT Bit Digital 0.95x
$XXI Twenty One 1.05x
$MSTR Strategy 1.08x
$UPXI Upexi 1.26x
$ASST Strive 1.31x
$DFDV DeFi Dev 1.35x
$CYPH Cypherpunk 1.45x
Key lesson: the "cheapest" on coin holdings alone — Upexi and DeFi Dev — flip expensive once you factor in debt. Structure matters.
This is how you read the balance sheet, not just the headline. mNAV under 1.0x = discount. Over 1.0x = premium. Debt changes everything.
Use this framework to spot value or avoid traps in the treasury stock trade.
1
132
·
--
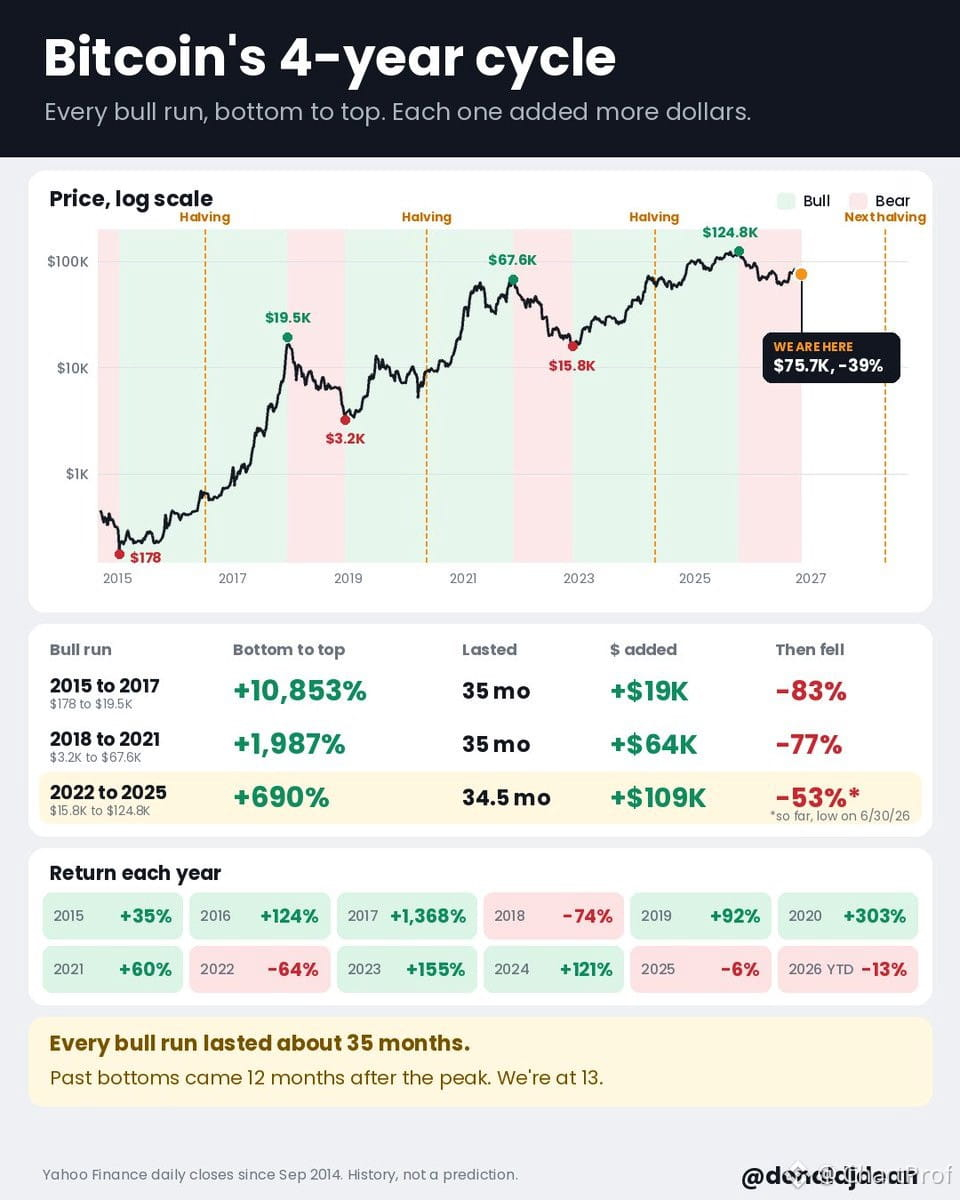
Let's walk through Bitcoin's 4-year cycle structure — this is textbook stuff.
Every bull run has clocked roughly 35 months, bottom to top. 2015–2017: ran to $19K. 2018–2021: ran to $64K. 2022–2025: projecting $109K. Notice the pattern — each cycle adds more dollars in absolute terms, but the percentage gain compresses. That's what happens as market cap grows.
Each halving cuts new supply by 50%. Next halving lands around April 2028. Supply shock theory says less issuance + same or rising demand = upward pressure. Simple supply-demand mechanics.
Past cycle tops have been followed by bottoms roughly 12 months later. We're currently sitting at 13 months post-peak. That lines up with historical rhythm — we're in the zone where bottoms typically form.
Now look at year-to-date performance:
$ASST Strive +45%
$IBIT iShares Bitcoin ETF -14%
$MSTR MicroStrategy -15%
$COIN Coinbase -40%
This spread tells you something. Direct $BTC exposure via Strive is holding up. The ETF, the levered proxy, and the exchange stock are all bleeding harder. That's a divergence worth noting — it suggests the underlying asset is structurally firmer than the derivative plays around it.
Setup: If we're truly in cycle rhythm, this 12–13 month post-peak window is where you start building conviction for the next leg. Confirmation comes when $BTC reclaims prior resistance and holds it as support. Invalidation: a breakdown below the cycle low negates the 4-year structure.
This is how you read cycles — structure first, price second, hype never.
Let's walk through Bitcoin's 4-year cycle structure — this is textbook stuff.
Every bull run has clocked roughly 35 months, bottom to top. 2015–2017: ran to $19K. 2018–2021: ran to $64K. 2022–2025: projecting $109K. Notice the pattern — each cycle adds more dollars in absolute terms, but the percentage gain compresses. That's what happens as market cap grows.
Each halving cuts new supply by 50%. Next halving lands around April 2028. Supply shock theory says less issuance + same or rising demand = upward pressure. Simple supply-demand mechanics.
Past cycle tops have been followed by bottoms roughly 12 months later. We're currently sitting at 13 months post-peak. That lines up with historical rhythm — we're in the zone where bottoms typically form.
Now look at year-to-date performance:
$ASST Strive +45%
$IBIT iShares Bitcoin ETF -14%
$MSTR MicroStrategy -15%
$COIN Coinbase -40%
This spread tells you something. Direct $BTC exposure via Strive is holding up. The ETF, the levered proxy, and the exchange stock are all bleeding harder. That's a divergence worth noting — it suggests the underlying asset is structurally firmer than the derivative plays around it.
Setup: If we're truly in cycle rhythm, this 12–13 month post-peak window is where you start building conviction for the next leg. Confirmation comes when $BTC reclaims prior resistance and holds it as support. Invalidation: a breakdown below the cycle low negates the 4-year structure.
This is how you read cycles — structure first, price second, hype never.
Every bull run has clocked roughly 35 months, bottom to top. 2015–2017: ran to $19K. 2018–2021: ran to $64K. 2022–2025: projecting $109K. Notice the pattern — each cycle adds more dollars in absolute terms, but the percentage gain compresses. That's what happens as market cap grows.
Each halving cuts new supply by 50%. Next halving lands around April 2028. Supply shock theory says less issuance + same or rising demand = upward pressure. Simple supply-demand mechanics.
Past cycle tops have been followed by bottoms roughly 12 months later. We're currently sitting at 13 months post-peak. That lines up with historical rhythm — we're in the zone where bottoms typically form.
Now look at year-to-date performance:
$ASST Strive +45%
$IBIT iShares Bitcoin ETF -14%
$MSTR MicroStrategy -15%
$COIN Coinbase -40%
This spread tells you something. Direct $BTC exposure via Strive is holding up. The ETF, the levered proxy, and the exchange stock are all bleeding harder. That's a divergence worth noting — it suggests the underlying asset is structurally firmer than the derivative plays around it.
Setup: If we're truly in cycle rhythm, this 12–13 month post-peak window is where you start building conviction for the next leg. Confirmation comes when $BTC reclaims prior resistance and holds it as support. Invalidation: a breakdown below the cycle low negates the 4-year structure.
This is how you read cycles — structure first, price second, hype never.
1
1.3k
·
--
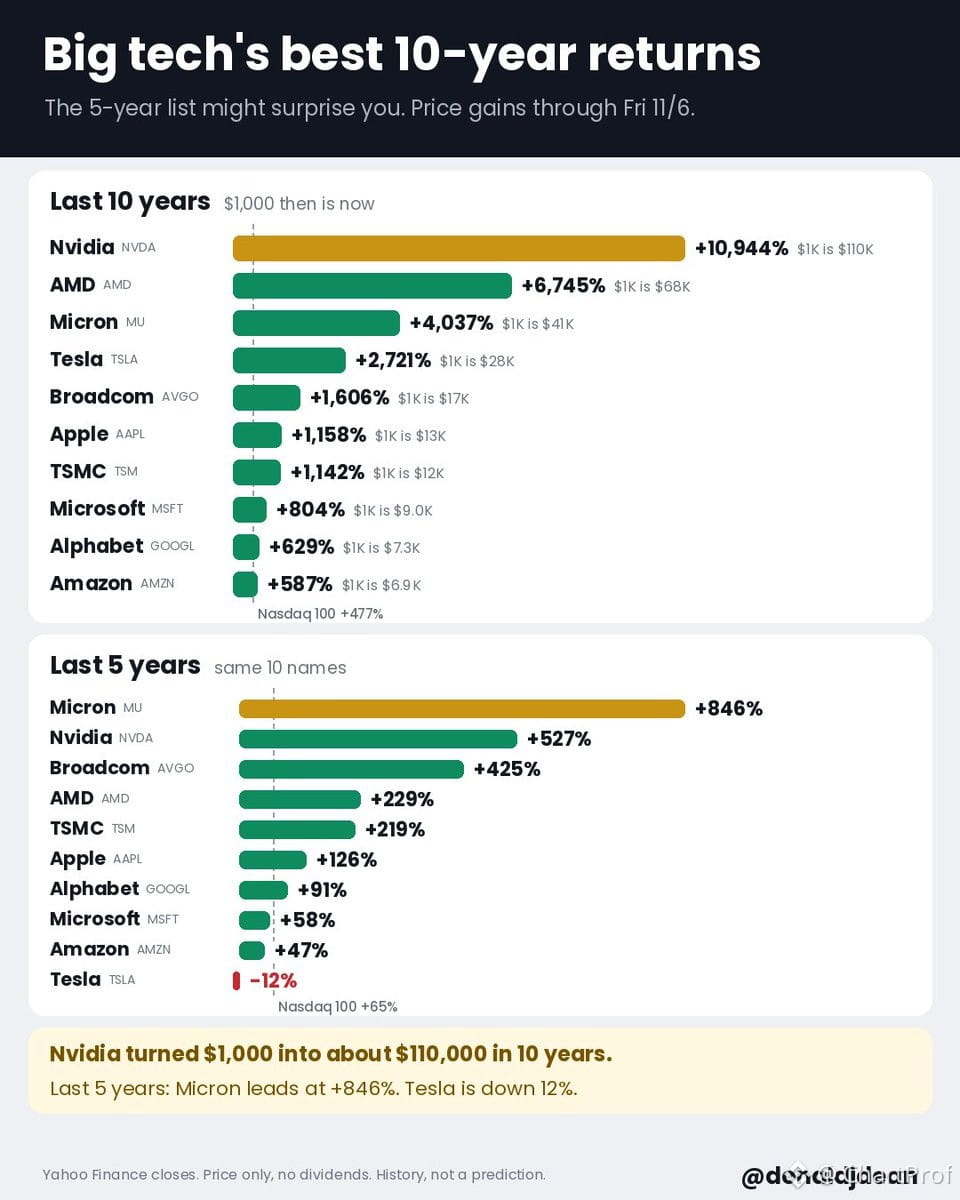
Big Tech performance over 10 years vs. 5 years tells two completely different stories — and this is why timeframe matters when you're reading strength.
10-year winners:
$NVDA turned $1,000 into $110,000. That's a clean 11,000% move — structural dominance in AI and chips.
$AMD up 6,745%. Another semiconductor monster.
$MU up 4,037%. Memory chips rode the wave.
But flip to the last 5 years and the leaderboard changes:
$MU leads at +846%.
$TSLA is down 12% — a full reversal from hype to consolidation.
What this teaches: Long-term winners aren't always short-term leaders. Sector rotation, macro shifts, and hype cycles create different winners in different windows. $NVDA dominated both — that's rare. $TSLA faded — that's normal.
When you're building a trade or a portfolio, ask: what timeframe am I trading? Because the chart that worked for 10 years might be chopping or reversing right now. Structure changes. Read the current phase, not just the highlight reel.
$QQQ $AVGO $MSFT $AAPL
Big Tech performance over 10 years vs. 5 years tells two completely different stories — and this is why timeframe matters when you're reading strength.
10-year winners:
$NVDA turned $1,000 into $110,000. That's a clean 11,000% move — structural dominance in AI and chips.
$AMD up 6,745%. Another semiconductor monster.
$MU up 4,037%. Memory chips rode the wave.
But flip to the last 5 years and the leaderboard changes:
$MU leads at +846%.
$TSLA is down 12% — a full reversal from hype to consolidation.
What this teaches: Long-term winners aren't always short-term leaders. Sector rotation, macro shifts, and hype cycles create different winners in different windows. $NVDA dominated both — that's rare. $TSLA faded — that's normal.
When you're building a trade or a portfolio, ask: what timeframe am I trading? Because the chart that worked for 10 years might be chopping or reversing right now. Structure changes. Read the current phase, not just the highlight reel.
$QQQ $AVGO $MSFT $AAPL
10-year winners:
$NVDA turned $1,000 into $110,000. That's a clean 11,000% move — structural dominance in AI and chips.
$AMD up 6,745%. Another semiconductor monster.
$MU up 4,037%. Memory chips rode the wave.
But flip to the last 5 years and the leaderboard changes:
$MU leads at +846%.
$TSLA is down 12% — a full reversal from hype to consolidation.
What this teaches: Long-term winners aren't always short-term leaders. Sector rotation, macro shifts, and hype cycles create different winners in different windows. $NVDA dominated both — that's rare. $TSLA faded — that's normal.
When you're building a trade or a portfolio, ask: what timeframe am I trading? Because the chart that worked for 10 years might be chopping or reversing right now. Structure changes. Read the current phase, not just the highlight reel.
$QQQ $AVGO $MSFT $AAPL
240
·
--
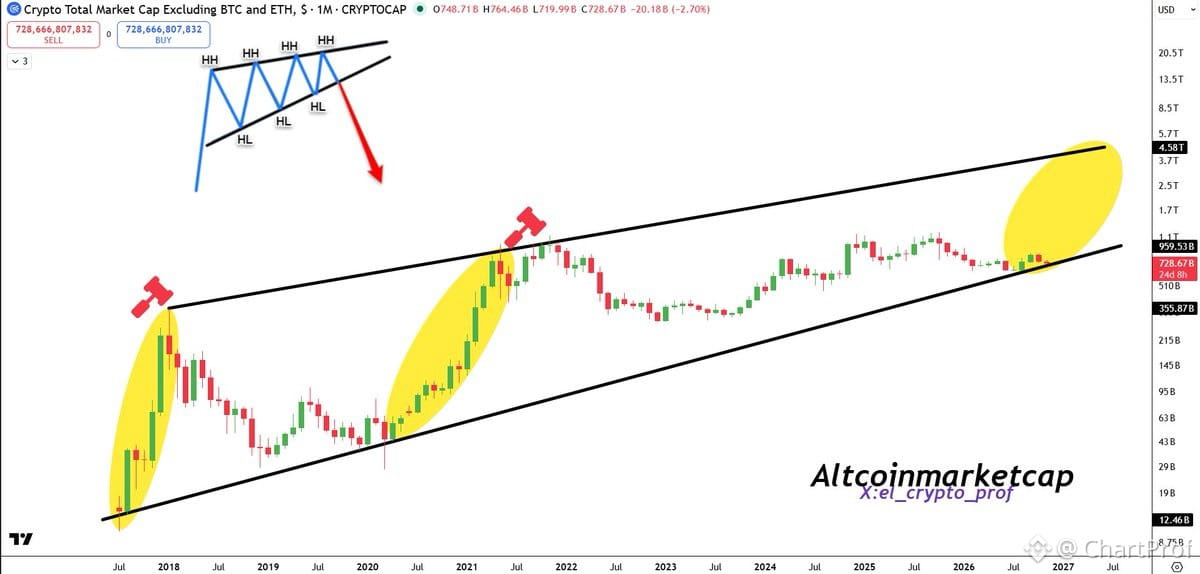
We've had two massive altcoin bull runs already — cycles that rewrote the playbook and minted life-changing returns.
Now we're setting up for the third.
Here's how to read it: altcoin cycles don't just repeat, they evolve. The first wave was pure speculation — anything with a ticker pumped. The second introduced narratives — DeFi, NFTs, L1 wars. This third cycle? It's about infrastructure, liquidity rotation, and macro alignment.
What confirms the setup:
$BTC dominance needs to peak and roll over. Right now we're watching that ceiling — once dominance breaks down, capital flows into alts like clockwork. That's your green light.
Altcoin market cap needs to reclaim key structure. We're talking about the 2021 highs as resistance. A clean break and hold above that zone signals the third wave is live.
Macro has to cooperate. Rate cuts, liquidity injections, risk-on sentiment — alts thrive when global liquidity expands. Watch central bank policy and the dollar index.
What invalidates it:
$BTC dominance continues higher and alts can't hold relative strength. If $BTC runs and alts bleed in its wake, the rotation hasn't started.
Macro tightens again. Recession fears, hawkish Fed, liquidity drain — alts get crushed in that environment.
The lesson: altcoin bull markets are structured, not random. They require $BTC to lead, dominance to peak, and macro to align. We're in the setup phase. The third wave isn't guaranteed — but the ingredients are lining up.
Watch the chart. Teach yourself to see the rotation before it happens. That's how you catch the wave, not chase it.
We've had two massive altcoin bull runs already — cycles that rewrote the playbook and minted life-changing returns.
Now we're setting up for the third.
Here's how to read it: altcoin cycles don't just repeat, they evolve. The first wave was pure speculation — anything with a ticker pumped. The second introduced narratives — DeFi, NFTs, L1 wars. This third cycle? It's about infrastructure, liquidity rotation, and macro alignment.
What confirms the setup:
$BTC dominance needs to peak and roll over. Right now we're watching that ceiling — once dominance breaks down, capital flows into alts like clockwork. That's your green light.
Altcoin market cap needs to reclaim key structure. We're talking about the 2021 highs as resistance. A clean break and hold above that zone signals the third wave is live.
Macro has to cooperate. Rate cuts, liquidity injections, risk-on sentiment — alts thrive when global liquidity expands. Watch central bank policy and the dollar index.
What invalidates it:
$BTC dominance continues higher and alts can't hold relative strength. If $BTC runs and alts bleed in its wake, the rotation hasn't started.
Macro tightens again. Recession fears, hawkish Fed, liquidity drain — alts get crushed in that environment.
The lesson: altcoin bull markets are structured, not random. They require $BTC to lead, dominance to peak, and macro to align. We're in the setup phase. The third wave isn't guaranteed — but the ingredients are lining up.
Watch the chart. Teach yourself to see the rotation before it happens. That's how you catch the wave, not chase it.
Now we're setting up for the third.
Here's how to read it: altcoin cycles don't just repeat, they evolve. The first wave was pure speculation — anything with a ticker pumped. The second introduced narratives — DeFi, NFTs, L1 wars. This third cycle? It's about infrastructure, liquidity rotation, and macro alignment.
What confirms the setup:
$BTC dominance needs to peak and roll over. Right now we're watching that ceiling — once dominance breaks down, capital flows into alts like clockwork. That's your green light.
Altcoin market cap needs to reclaim key structure. We're talking about the 2021 highs as resistance. A clean break and hold above that zone signals the third wave is live.
Macro has to cooperate. Rate cuts, liquidity injections, risk-on sentiment — alts thrive when global liquidity expands. Watch central bank policy and the dollar index.
What invalidates it:
$BTC dominance continues higher and alts can't hold relative strength. If $BTC runs and alts bleed in its wake, the rotation hasn't started.
Macro tightens again. Recession fears, hawkish Fed, liquidity drain — alts get crushed in that environment.
The lesson: altcoin bull markets are structured, not random. They require $BTC to lead, dominance to peak, and macro to align. We're in the setup phase. The third wave isn't guaranteed — but the ingredients are lining up.
Watch the chart. Teach yourself to see the rotation before it happens. That's how you catch the wave, not chase it.
1.3k
·
--
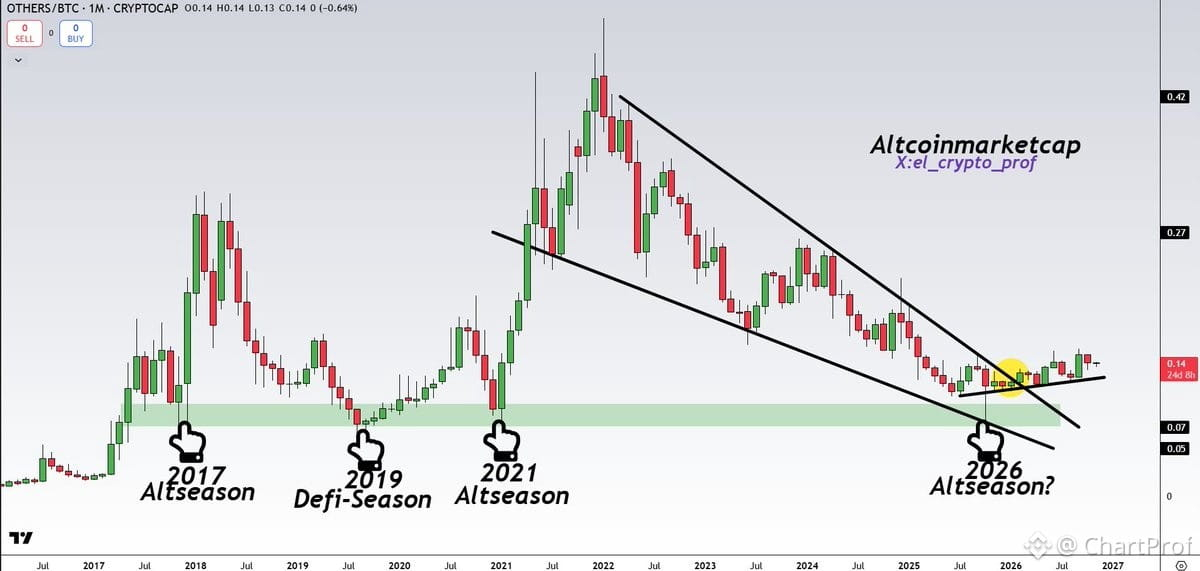
The OTHERS chart (total altcoin market cap excluding top coins) is holding structure beautifully. Nothing broken here — just needs time to develop.
What I'm seeing: Clean consolidation after the last leg up. Support zones holding, no structural breakdown. This is textbook accumulation behavior before the next expansion phase.
The setup: As long as we're holding above key support, the bias stays bullish. Watch for a reclaim of local resistance to confirm continuation. Invalidation comes if we lose the low — simple as that.
Patience is the trade here. Let the structure mature. Don't chase, don't panic. The chart is teaching you to wait for confirmation, not force entries into noise.
The OTHERS chart (total altcoin market cap excluding top coins) is holding structure beautifully. Nothing broken here — just needs time to develop.
What I'm seeing: Clean consolidation after the last leg up. Support zones holding, no structural breakdown. This is textbook accumulation behavior before the next expansion phase.
The setup: As long as we're holding above key support, the bias stays bullish. Watch for a reclaim of local resistance to confirm continuation. Invalidation comes if we lose the low — simple as that.
Patience is the trade here. Let the structure mature. Don't chase, don't panic. The chart is teaching you to wait for confirmation, not force entries into noise.
What I'm seeing: Clean consolidation after the last leg up. Support zones holding, no structural breakdown. This is textbook accumulation behavior before the next expansion phase.
The setup: As long as we're holding above key support, the bias stays bullish. Watch for a reclaim of local resistance to confirm continuation. Invalidation comes if we lose the low — simple as that.
Patience is the trade here. Let the structure mature. Don't chase, don't panic. The chart is teaching you to wait for confirmation, not force entries into noise.
348
·
--
Dot-com vs. AI — let's put some structure on this comparison.
From ChatGPT's launch to now, the Nasdaq is up 114%. At the same point after Netscape's IPO in the '90s, it was up 178%. That rally eventually peaked at +402% before giving nearly all of it back.
Today we're 11% off the October 6 record high, trading around 25x earnings. Late 1999? 104x earnings — a speculative extreme that didn't end well.
Here's what this tells us: We're in a structurally healthier setup than the dot-com peak. Valuations are stretched but not absurd. The pullback from the highs is normal consolidation, not collapse. But the comparison matters — it reminds us that parabolic moves eventually correct, especially when driven by narrative over fundamentals.
What to watch: If we reclaim the October highs with conviction, the AI trade likely has more room. If we break below this consolidation range, expect a deeper retest of support. The lesson from '99 isn't that booms always bust — it's that structure and valuation matter more than momentum.
This isn't a crash setup yet. But it's a reminder to respect the chart, manage risk, and not confuse a strong narrative with an invincible rally. $SPY $QQQ $NVDA $MSFT
Dot-com vs. AI — let's put some structure on this comparison.
From ChatGPT's launch to now, the Nasdaq is up 114%. At the same point after Netscape's IPO in the '90s, it was up 178%. That rally eventually peaked at +402% before giving nearly all of it back.
Today we're 11% off the October 6 record high, trading around 25x earnings. Late 1999? 104x earnings — a speculative extreme that didn't end well.
Here's what this tells us: We're in a structurally healthier setup than the dot-com peak. Valuations are stretched but not absurd. The pullback from the highs is normal consolidation, not collapse. But the comparison matters — it reminds us that parabolic moves eventually correct, especially when driven by narrative over fundamentals.
What to watch: If we reclaim the October highs with conviction, the AI trade likely has more room. If we break below this consolidation range, expect a deeper retest of support. The lesson from '99 isn't that booms always bust — it's that structure and valuation matter more than momentum.
This isn't a crash setup yet. But it's a reminder to respect the chart, manage risk, and not confuse a strong narrative with an invincible rally. $SPY $QQQ $NVDA $MSFT
From ChatGPT's launch to now, the Nasdaq is up 114%. At the same point after Netscape's IPO in the '90s, it was up 178%. That rally eventually peaked at +402% before giving nearly all of it back.
Today we're 11% off the October 6 record high, trading around 25x earnings. Late 1999? 104x earnings — a speculative extreme that didn't end well.
Here's what this tells us: We're in a structurally healthier setup than the dot-com peak. Valuations are stretched but not absurd. The pullback from the highs is normal consolidation, not collapse. But the comparison matters — it reminds us that parabolic moves eventually correct, especially when driven by narrative over fundamentals.
What to watch: If we reclaim the October highs with conviction, the AI trade likely has more room. If we break below this consolidation range, expect a deeper retest of support. The lesson from '99 isn't that booms always bust — it's that structure and valuation matter more than momentum.
This isn't a crash setup yet. But it's a reminder to respect the chart, manage risk, and not confuse a strong narrative with an invincible rally. $SPY $QQQ $NVDA $MSFT
211
·
--
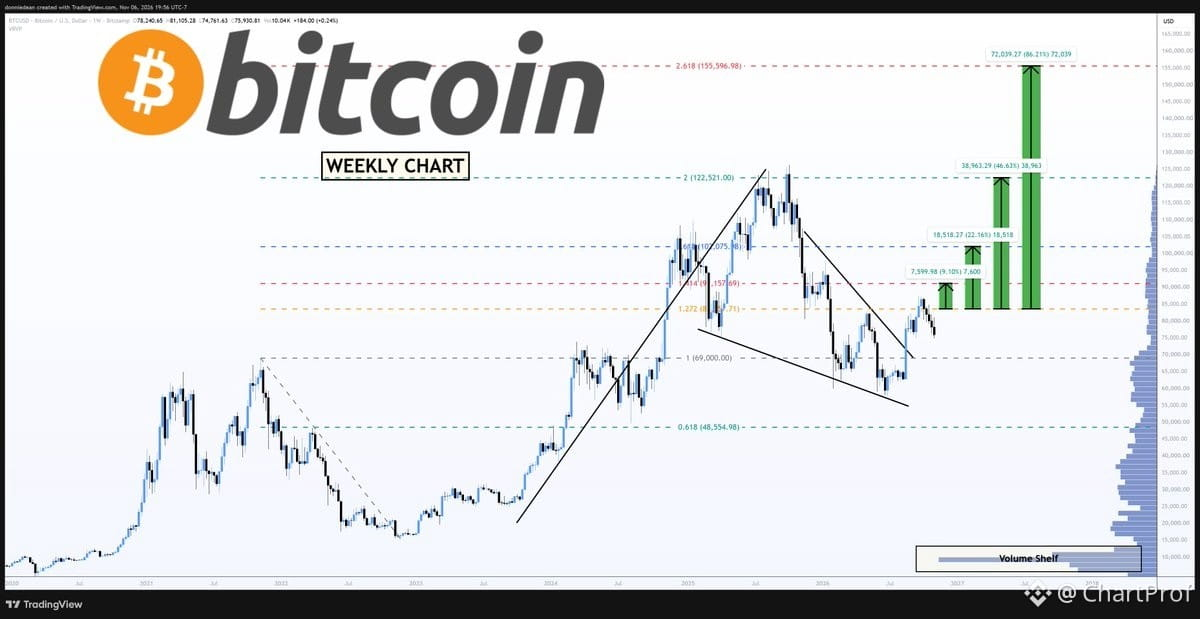
$BTC weekly structure showing clean higher lows — textbook accumulation pattern. We broke the wedge, retested, and held. That's your confirmation.
Here's the setup: $69k is in play as the next logical test if we hold current support. That's where the structure wants to go. But the real ceiling sits at $83k — that's your breakout level. Clear it, and we unlock higher targets.
Invalidation? Losing the wedge retest zone. If price slips back inside the pattern, the structure breaks and you step aside. Until then, this is a clean long setup with defined levels. Watch $69k for the move, $83k for the breakout.
$BTC weekly structure showing clean higher lows — textbook accumulation pattern. We broke the wedge, retested, and held. That's your confirmation.
Here's the setup: $69k is in play as the next logical test if we hold current support. That's where the structure wants to go. But the real ceiling sits at $83k — that's your breakout level. Clear it, and we unlock higher targets.
Invalidation? Losing the wedge retest zone. If price slips back inside the pattern, the structure breaks and you step aside. Until then, this is a clean long setup with defined levels. Watch $69k for the move, $83k for the breakout.
Here's the setup: $69k is in play as the next logical test if we hold current support. That's where the structure wants to go. But the real ceiling sits at $83k — that's your breakout level. Clear it, and we unlock higher targets.
Invalidation? Losing the wedge retest zone. If price slips back inside the pattern, the structure breaks and you step aside. Until then, this is a clean long setup with defined levels. Watch $69k for the move, $83k for the breakout.
819
·
--
Looking at $ETH weekly structure — inverse head and shoulders pattern in play. Classic setup.
Here's the read: we're likely seeing a retest phase. Lower support zone sits around $1800 on the weekly timeframe. That's your confirmation level — if it holds, the pattern stays intact.
Measured move from the neckline projects 150%+ upside to test the upper trendline. That's the textbook target if this structure completes.
What to watch: Does $1800 hold as support? That's your validation. Break below invalidates the inverse H&S. Hold and bounce? Then you're looking at a multi-month run toward that upper resistance.
This is how you read structure — identify the pattern, mark your levels, know your invalidation. Trade the confirmation, not the hope.
Looking at $ETH weekly structure — inverse head and shoulders pattern in play. Classic setup.
Here's the read: we're likely seeing a retest phase. Lower support zone sits around $1800 on the weekly timeframe. That's your confirmation level — if it holds, the pattern stays intact.
Measured move from the neckline projects 150%+ upside to test the upper trendline. That's the textbook target if this structure completes.
What to watch: Does $1800 hold as support? That's your validation. Break below invalidates the inverse H&S. Hold and bounce? Then you're looking at a multi-month run toward that upper resistance.
This is how you read structure — identify the pattern, mark your levels, know your invalidation. Trade the confirmation, not the hope.
Here's the read: we're likely seeing a retest phase. Lower support zone sits around $1800 on the weekly timeframe. That's your confirmation level — if it holds, the pattern stays intact.
Measured move from the neckline projects 150%+ upside to test the upper trendline. That's the textbook target if this structure completes.
What to watch: Does $1800 hold as support? That's your validation. Break below invalidates the inverse H&S. Hold and bounce? Then you're looking at a multi-month run toward that upper resistance.
This is how you read structure — identify the pattern, mark your levels, know your invalidation. Trade the confirmation, not the hope.
492
·
--
Every bounce has a weak spot — and 2022 taught us that lesson hard.
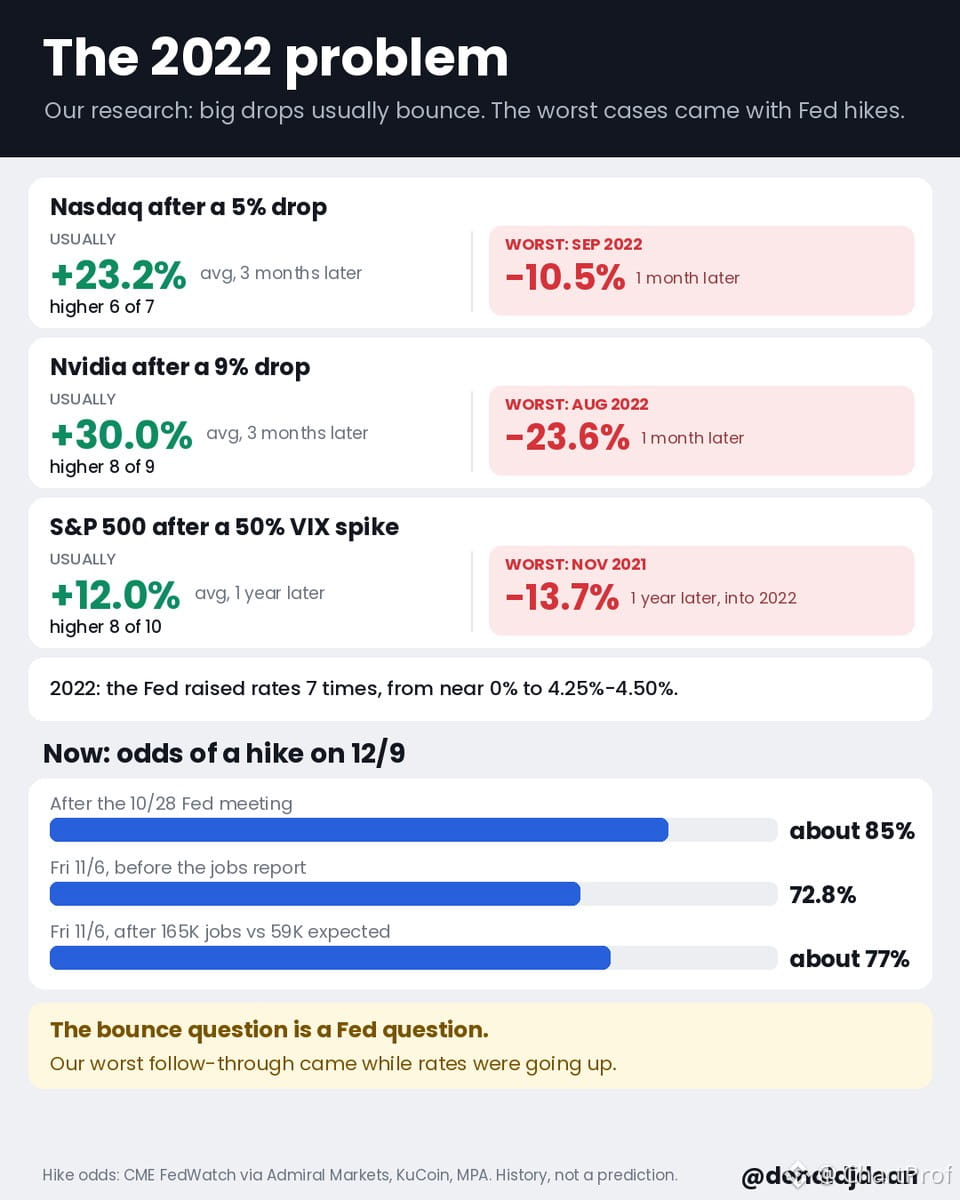
Let's walk through the structure. Big drops typically produce bounces — that's textbook mean reversion. But 2022 was the exception that proves the rule. Nasdaq, Nvidia, VIX — all ran through their worst-case scenarios as the Fed hiked seven times in one cycle. That's not noise. That's structural pressure.
Now here's the setup today: 165K jobs printed versus 59K expected. That's a massive beat. December 9th hike odds jumped to roughly 77%. Translation? The Fed still has ammunition, and they're signaling they'll use it.
So what does this mean for your trade? If you're long into a bounce, you need to respect the invalidation level. The Fed can kill any rally if they stay hawkish. Watch rate expectations, watch employment data, and don't marry your position.
The lesson: bounces are real, but context is everything. In a tightening cycle, every rally is guilty until proven innocent. Trade the structure, not the hope.
$SPY $QQQ $NVDA
Every bounce has a weak spot — and 2022 taught us that lesson hard.
Let's walk through the structure. Big drops typically produce bounces — that's textbook mean reversion. But 2022 was the exception that proves the rule. Nasdaq, Nvidia, VIX — all ran through their worst-case scenarios as the Fed hiked seven times in one cycle. That's not noise. That's structural pressure.
Now here's the setup today: 165K jobs printed versus 59K expected. That's a massive beat. December 9th hike odds jumped to roughly 77%. Translation? The Fed still has ammunition, and they're signaling they'll use it.
So what does this mean for your trade? If you're long into a bounce, you need to respect the invalidation level. The Fed can kill any rally if they stay hawkish. Watch rate expectations, watch employment data, and don't marry your position.
The lesson: bounces are real, but context is everything. In a tightening cycle, every rally is guilty until proven innocent. Trade the structure, not the hope.
$SPY $QQQ $NVDA
Let's walk through the structure. Big drops typically produce bounces — that's textbook mean reversion. But 2022 was the exception that proves the rule. Nasdaq, Nvidia, VIX — all ran through their worst-case scenarios as the Fed hiked seven times in one cycle. That's not noise. That's structural pressure.
Now here's the setup today: 165K jobs printed versus 59K expected. That's a massive beat. December 9th hike odds jumped to roughly 77%. Translation? The Fed still has ammunition, and they're signaling they'll use it.
So what does this mean for your trade? If you're long into a bounce, you need to respect the invalidation level. The Fed can kill any rally if they stay hawkish. Watch rate expectations, watch employment data, and don't marry your position.
The lesson: bounces are real, but context is everything. In a tightening cycle, every rally is guilty until proven innocent. Trade the structure, not the hope.
$SPY $QQQ $NVDA
175
·
--
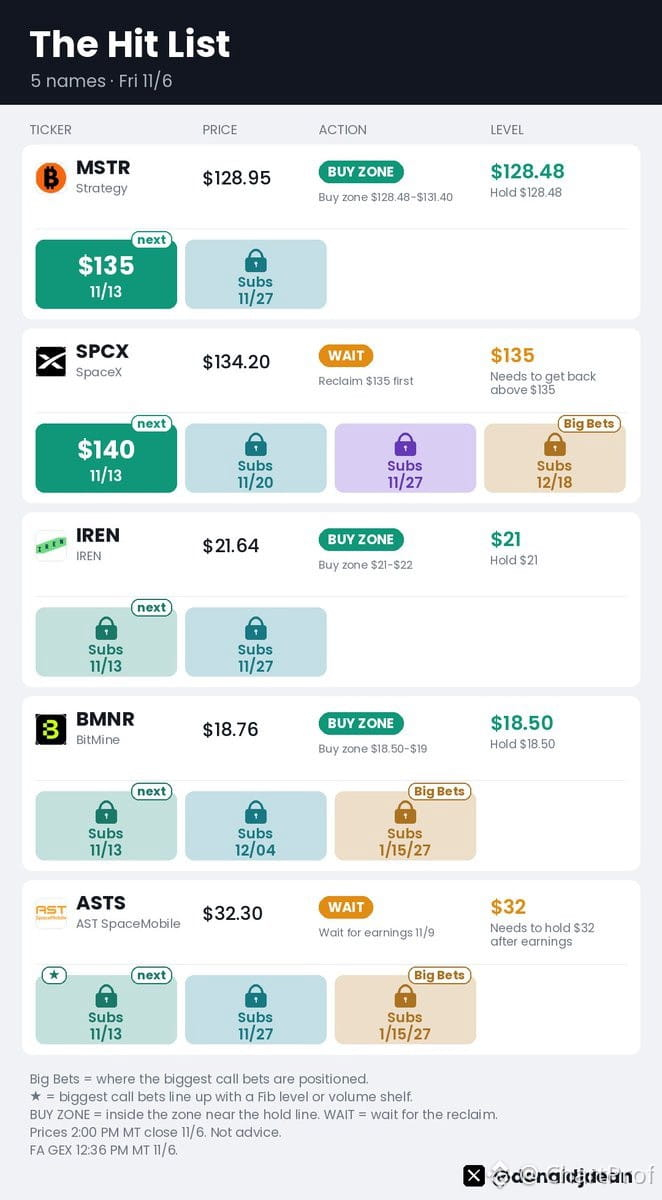
Friday's Setup Board — Clean Levels, Clear Reads
$MSTR — Buy Zone Active
Structure says $128.48–$131.40 is your entry window. Below $128.48, the setup breaks. If it holds, we're eyeing $135 by mid-next week. This is textbook support-turned-launch.
$SPCX — Wait for Confirmation
Not tradeable yet. Needs to reclaim $135 before we have structure. Once it does, $140 comes into view by 11/13. Right now, you're guessing — not trading.
$IREN — Buy Zone Live
$21–$22 is your window. $21 is the floor. If it holds, you've got a clean long setup. If it breaks, you're out. That's the invalidation.
$BMNR — Entry Range Set
$18.50–$19 is the zone. $18.50 is your line in the sand. Hold it, and the setup's intact. Lose it, and the structure collapses.
$ASTS — Earnings First, Then Trade
Wait for 11/9 earnings. After that, the key level is $32. If it holds post-earnings, you've got a setup. If it doesn't, you don't.
All prices as of 11/6 close. This is structure, not advice. Trade what confirms, skip what doesn't.
Friday's Setup Board — Clean Levels, Clear Reads
$MSTR — Buy Zone Active
Structure says $128.48–$131.40 is your entry window. Below $128.48, the setup breaks. If it holds, we're eyeing $135 by mid-next week. This is textbook support-turned-launch.
$SPCX — Wait for Confirmation
Not tradeable yet. Needs to reclaim $135 before we have structure. Once it does, $140 comes into view by 11/13. Right now, you're guessing — not trading.
$IREN — Buy Zone Live
$21–$22 is your window. $21 is the floor. If it holds, you've got a clean long setup. If it breaks, you're out. That's the invalidation.
$BMNR — Entry Range Set
$18.50–$19 is the zone. $18.50 is your line in the sand. Hold it, and the setup's intact. Lose it, and the structure collapses.
$ASTS — Earnings First, Then Trade
Wait for 11/9 earnings. After that, the key level is $32. If it holds post-earnings, you've got a setup. If it doesn't, you don't.
All prices as of 11/6 close. This is structure, not advice. Trade what confirms, skip what doesn't.
$MSTR — Buy Zone Active
Structure says $128.48–$131.40 is your entry window. Below $128.48, the setup breaks. If it holds, we're eyeing $135 by mid-next week. This is textbook support-turned-launch.
$SPCX — Wait for Confirmation
Not tradeable yet. Needs to reclaim $135 before we have structure. Once it does, $140 comes into view by 11/13. Right now, you're guessing — not trading.
$IREN — Buy Zone Live
$21–$22 is your window. $21 is the floor. If it holds, you've got a clean long setup. If it breaks, you're out. That's the invalidation.
$BMNR — Entry Range Set
$18.50–$19 is the zone. $18.50 is your line in the sand. Hold it, and the setup's intact. Lose it, and the structure collapses.
$ASTS — Earnings First, Then Trade
Wait for 11/9 earnings. After that, the key level is $32. If it holds post-earnings, you've got a setup. If it doesn't, you don't.
All prices as of 11/6 close. This is structure, not advice. Trade what confirms, skip what doesn't.
359
·
--
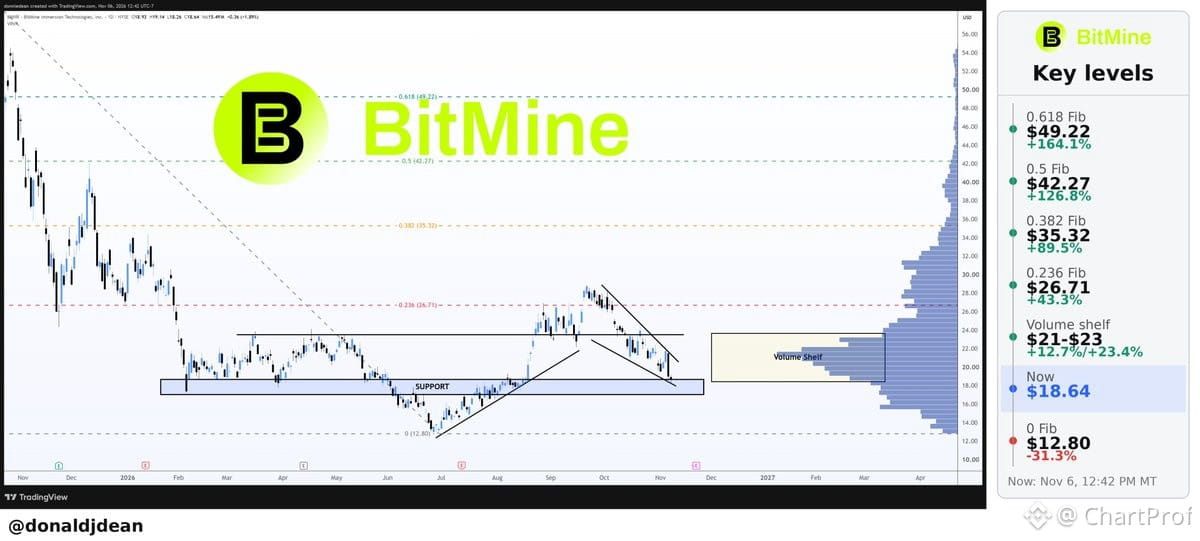
$BMNR sitting right on support here — this is the zone that matters.
If it holds, you've got a clean base to work from. First target is that $21–$23 volume shelf where prior trade stacked up. That's where you'd expect some resistance.
Beyond that, $26.71 is the first Fib extension at +43.3% — a logical measured move if momentum kicks in.
What confirms the hold? Price needs to reclaim structure above this zone with volume. What kills it? A clean break below support with follow-through.
This is textbook support test structure. You're either getting a bounce here or a breakdown. Watch how it responds.
$BMNR sitting right on support here — this is the zone that matters.
If it holds, you've got a clean base to work from. First target is that $21–$23 volume shelf where prior trade stacked up. That's where you'd expect some resistance.
Beyond that, $26.71 is the first Fib extension at +43.3% — a logical measured move if momentum kicks in.
What confirms the hold? Price needs to reclaim structure above this zone with volume. What kills it? A clean break below support with follow-through.
This is textbook support test structure. You're either getting a bounce here or a breakdown. Watch how it responds.
If it holds, you've got a clean base to work from. First target is that $21–$23 volume shelf where prior trade stacked up. That's where you'd expect some resistance.
Beyond that, $26.71 is the first Fib extension at +43.3% — a logical measured move if momentum kicks in.
What confirms the hold? Price needs to reclaim structure above this zone with volume. What kills it? A clean break below support with follow-through.
This is textbook support test structure. You're either getting a bounce here or a breakdown. Watch how it responds.
55
·
--
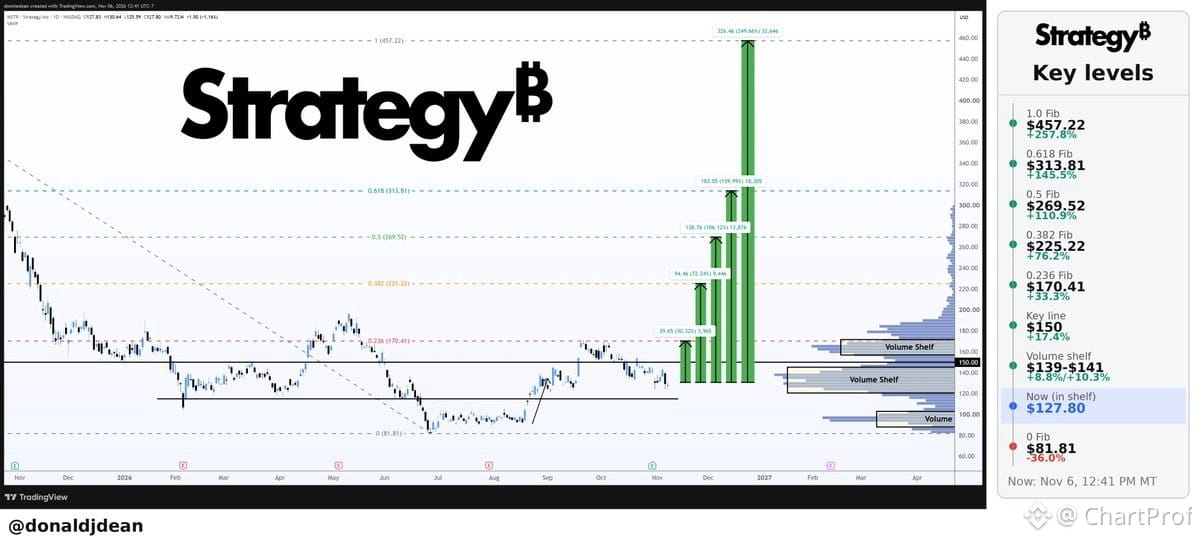
$MSTR testing a critical volume shelf right now between $127–$129. This is the structure that needs to hold if we're staying constructive.
If it reclaims and defends that zone, next resistance comes at the $139–$141 volume shelf — that's where you'll want to see follow-through. Above that, $150 is the key psychological level, and if momentum carries, $170.41 is the first Fibonacci extension at +33.3%.
Watch the $127–$129 shelf closely. Break below and the structure weakens. Hold and build above it, and the path to $139+ opens up. Clean levels, clean structure.
$MSTR testing a critical volume shelf right now between $127–$129. This is the structure that needs to hold if we're staying constructive.
If it reclaims and defends that zone, next resistance comes at the $139–$141 volume shelf — that's where you'll want to see follow-through. Above that, $150 is the key psychological level, and if momentum carries, $170.41 is the first Fibonacci extension at +33.3%.
Watch the $127–$129 shelf closely. Break below and the structure weakens. Hold and build above it, and the path to $139+ opens up. Clean levels, clean structure.
If it reclaims and defends that zone, next resistance comes at the $139–$141 volume shelf — that's where you'll want to see follow-through. Above that, $150 is the key psychological level, and if momentum carries, $170.41 is the first Fibonacci extension at +33.3%.
Watch the $127–$129 shelf closely. Break below and the structure weakens. Hold and build above it, and the path to $139+ opens up. Clean levels, clean structure.
93
·
--
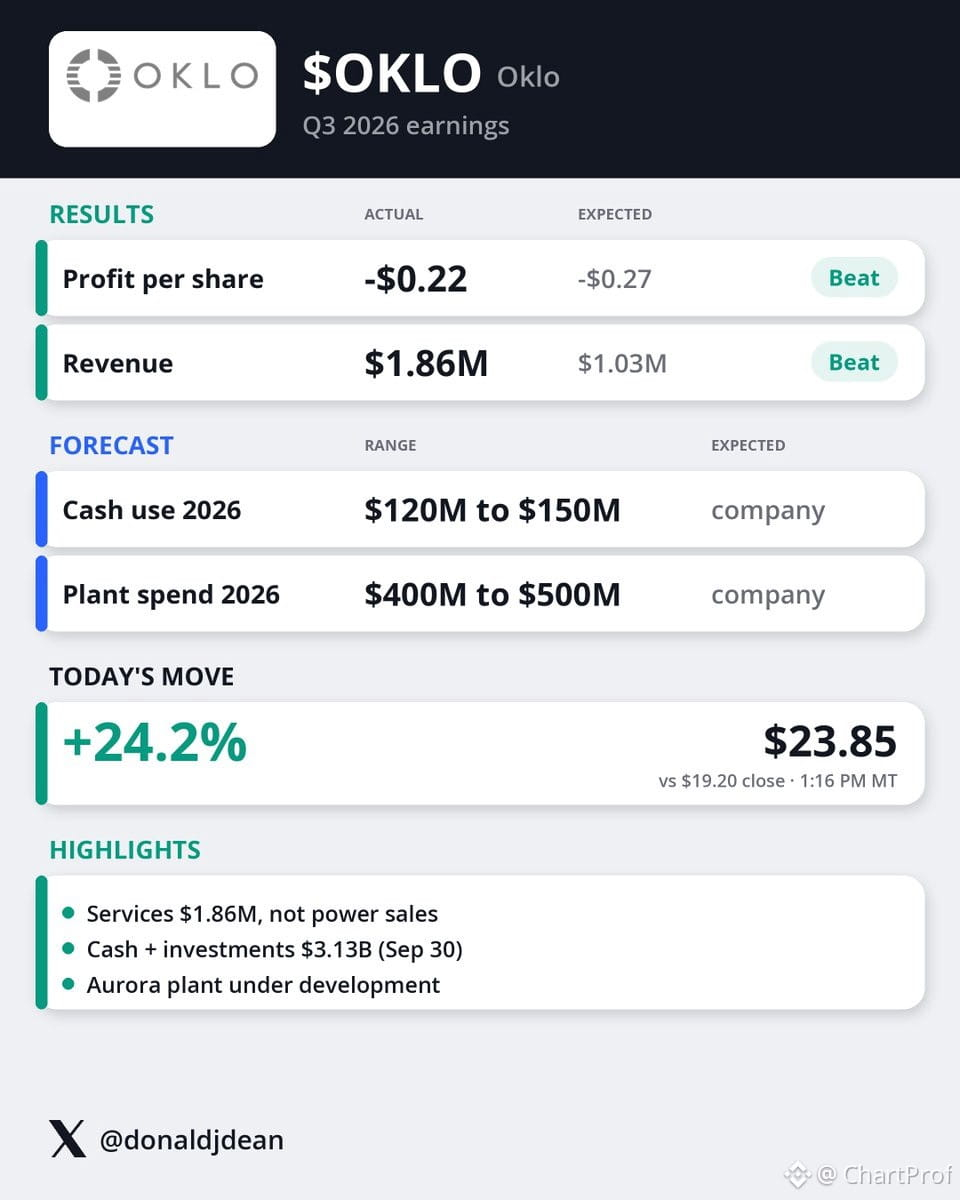
$OKLO just posted Q3 numbers — revenue hit $1.86M vs $1.03M expected, loss tightened to $0.22/share vs $0.27 forecast.
But here's the thing: that revenue is all services, not actual power sales. Aurora's still in development, so we're not at the operational phase yet.
Balance sheet looks solid — $3.13B in cash and investments as of Sept 30. Guidance for 2026 calls for $120M-$150M cash burn and $400M-$500M in plant capex.
So the structure here: beat on revenue, tighter loss, huge cash cushion. But the real catalyst is still ahead — when Aurora goes live and they shift from services to actual power generation. Until then, you're paying for the runway and the promise. Watch the development timeline and how fast they deploy that capex.
$OKLO just posted Q3 numbers — revenue hit $1.86M vs $1.03M expected, loss tightened to $0.22/share vs $0.27 forecast.
But here's the thing: that revenue is all services, not actual power sales. Aurora's still in development, so we're not at the operational phase yet.
Balance sheet looks solid — $3.13B in cash and investments as of Sept 30. Guidance for 2026 calls for $120M-$150M cash burn and $400M-$500M in plant capex.
So the structure here: beat on revenue, tighter loss, huge cash cushion. But the real catalyst is still ahead — when Aurora goes live and they shift from services to actual power generation. Until then, you're paying for the runway and the promise. Watch the development timeline and how fast they deploy that capex.
But here's the thing: that revenue is all services, not actual power sales. Aurora's still in development, so we're not at the operational phase yet.
Balance sheet looks solid — $3.13B in cash and investments as of Sept 30. Guidance for 2026 calls for $120M-$150M cash burn and $400M-$500M in plant capex.
So the structure here: beat on revenue, tighter loss, huge cash cushion. But the real catalyst is still ahead — when Aurora goes live and they shift from services to actual power generation. Until then, you're paying for the runway and the promise. Watch the development timeline and how fast they deploy that capex.
147
·
--
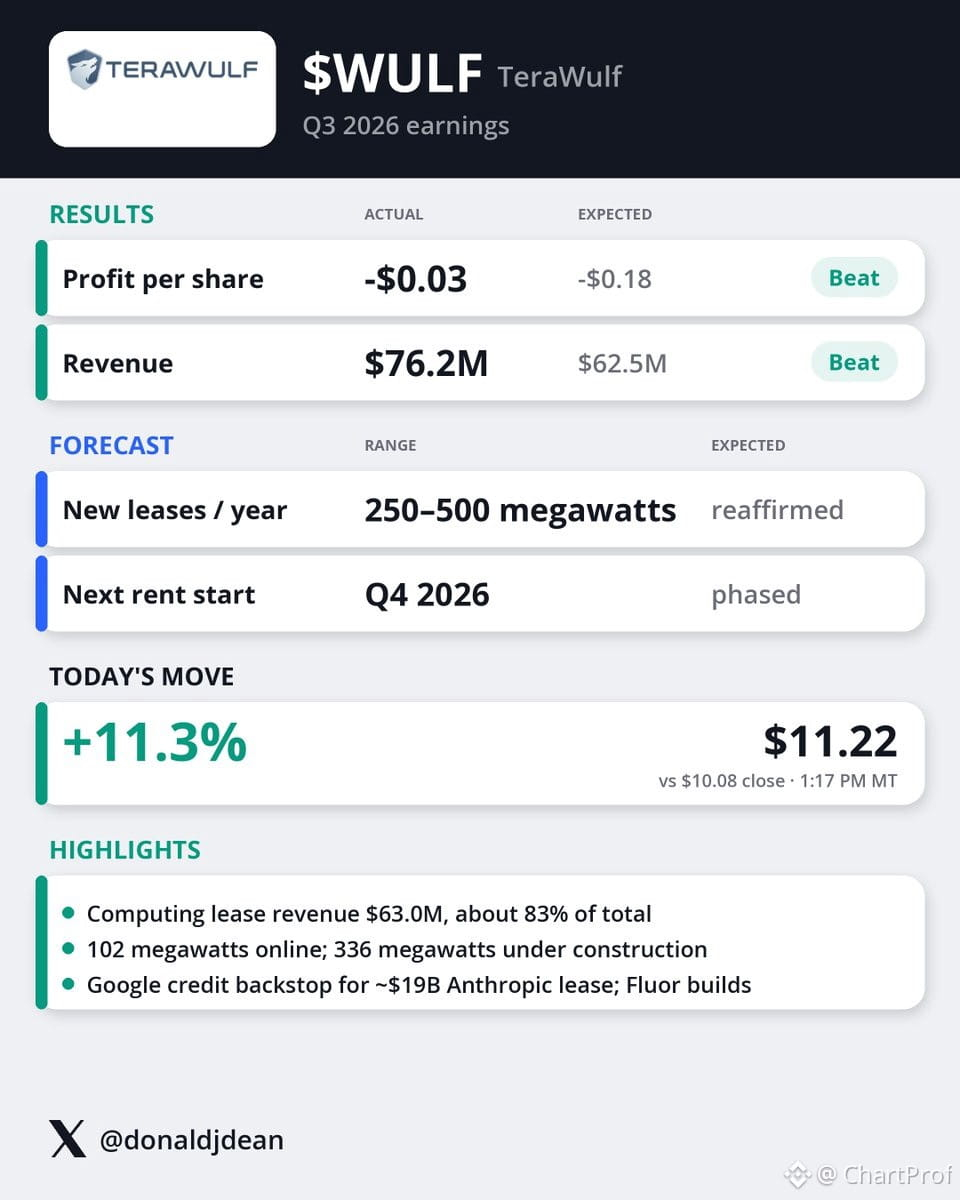
$WULF crushed Q3 — $76.2M revenue vs $62.5M expected, loss of just $0.03/share vs $0.18 expected. That's a clean beat on both lines.
What matters: computing leases drove $63M, roughly 83% of total revenue. That's the real engine here.
Now the setup — 102 MW live, 336 MW under construction. The trade hinges on that pipeline converting into actual lease revenue. Watch capacity utilization. If those 336 MW come online and start generating rent at similar margins, this scales fast.
Key level: can they maintain or expand that 83% lease mix as capacity grows? That's your confirmation. If utilization lags or margins compress, that's your invalidation.
$WULF crushed Q3 — $76.2M revenue vs $62.5M expected, loss of just $0.03/share vs $0.18 expected. That's a clean beat on both lines.
What matters: computing leases drove $63M, roughly 83% of total revenue. That's the real engine here.
Now the setup — 102 MW live, 336 MW under construction. The trade hinges on that pipeline converting into actual lease revenue. Watch capacity utilization. If those 336 MW come online and start generating rent at similar margins, this scales fast.
Key level: can they maintain or expand that 83% lease mix as capacity grows? That's your confirmation. If utilization lags or margins compress, that's your invalidation.
What matters: computing leases drove $63M, roughly 83% of total revenue. That's the real engine here.
Now the setup — 102 MW live, 336 MW under construction. The trade hinges on that pipeline converting into actual lease revenue. Watch capacity utilization. If those 336 MW come online and start generating rent at similar margins, this scales fast.
Key level: can they maintain or expand that 83% lease mix as capacity grows? That's your confirmation. If utilization lags or margins compress, that's your invalidation.
WULFUS+13.72%
93
·
--
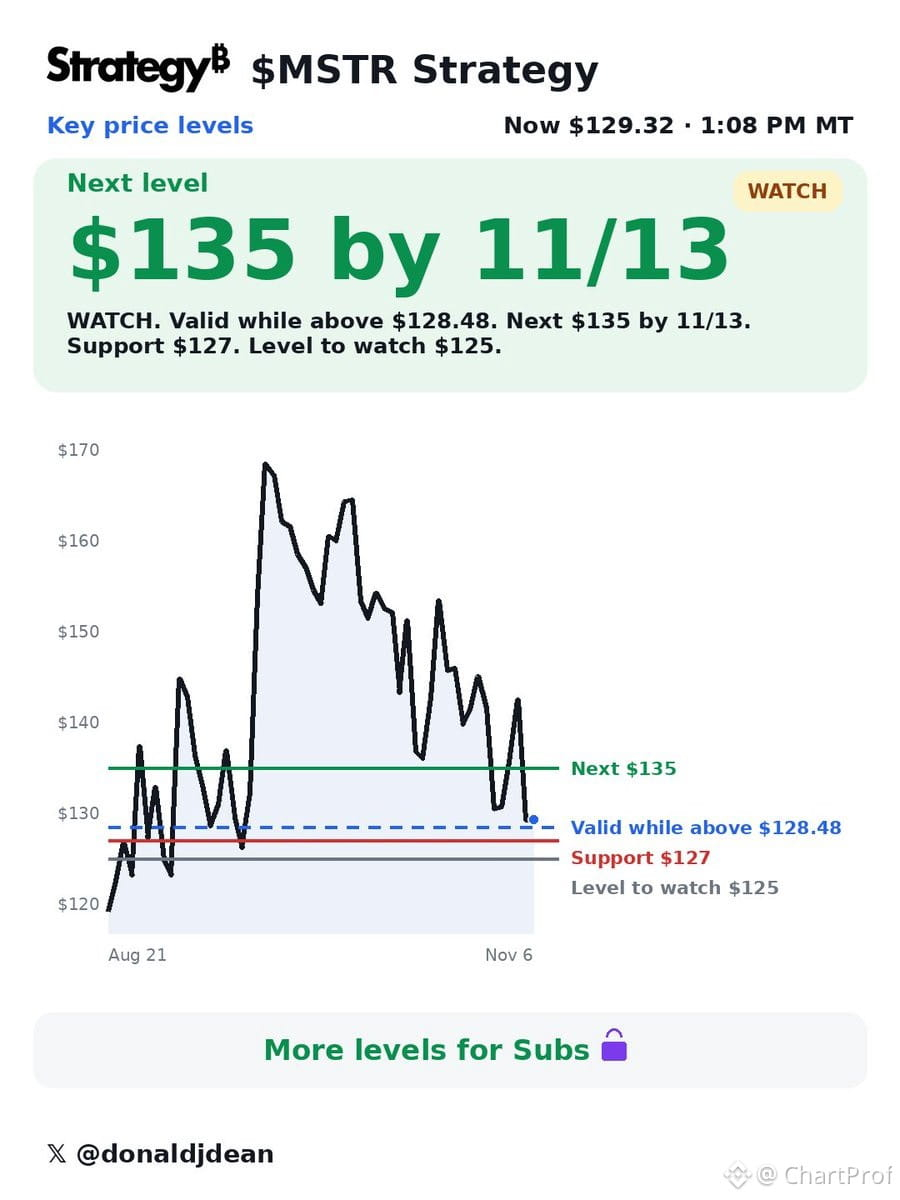
$MSTR on watch.
WATCH. Valid while above $128.48. Next $135 by 11/13. Support $127. Level to watch $125.
$MSTR on watch.
WATCH. Valid while above $128.48. Next $135 by 11/13. Support $127. Level to watch $125.
WATCH. Valid while above $128.48. Next $135 by 11/13. Support $127. Level to watch $125.
96
·
--
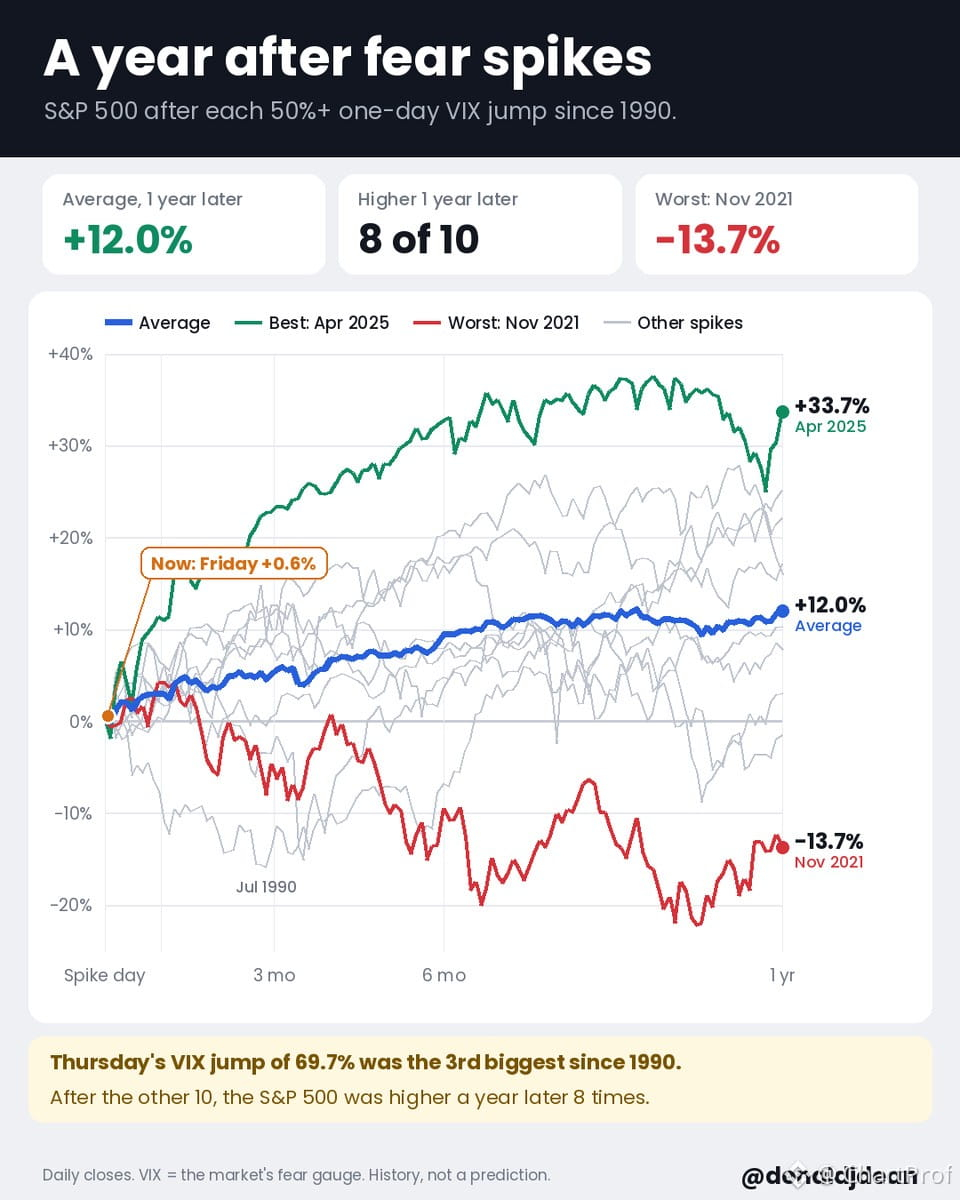
VIX just spiked 69.7% Thursday — third-largest one-day jump since 1990. That's a fear explosion.
So what happens next? Let's look at the historical structure.
After the 10 prior 50%+ VIX spikes, the $SPY was higher a year later in 8 out of 10 cases — average gain of 12%. That's not a guarantee, but it's a pattern. Fear spikes often mark bottoms, not tops.
The two exceptions? One was November 2021, right before the 2022 bear market. That's your invalidation case — when macro structure is already broken and volatility is just catching up.
Here's the trade idea: if you're seeing capitulation volume, washed-out sentiment, and clean support holding, this is where you start building. Not all-in, but layering. The VIX spike itself is the signal — it's the market pricing in maximum pain.
Confirmation: watch for follow-through in $SPY and $QQQ. If they reclaim key levels and hold, the fear was the flush. If they fail and break lower, you're in that 2/10 scenario.
Invalidation: new lows with rising VIX again. That's not a spike, that's a trend.
This is textbook volatility mean reversion. Teach yourself to buy the panic, not sell it.
VIX just spiked 69.7% Thursday — third-largest one-day jump since 1990. That's a fear explosion.
So what happens next? Let's look at the historical structure.
After the 10 prior 50%+ VIX spikes, the $SPY was higher a year later in 8 out of 10 cases — average gain of 12%. That's not a guarantee, but it's a pattern. Fear spikes often mark bottoms, not tops.
The two exceptions? One was November 2021, right before the 2022 bear market. That's your invalidation case — when macro structure is already broken and volatility is just catching up.
Here's the trade idea: if you're seeing capitulation volume, washed-out sentiment, and clean support holding, this is where you start building. Not all-in, but layering. The VIX spike itself is the signal — it's the market pricing in maximum pain.
Confirmation: watch for follow-through in $SPY and $QQQ. If they reclaim key levels and hold, the fear was the flush. If they fail and break lower, you're in that 2/10 scenario.
Invalidation: new lows with rising VIX again. That's not a spike, that's a trend.
This is textbook volatility mean reversion. Teach yourself to buy the panic, not sell it.
So what happens next? Let's look at the historical structure.
After the 10 prior 50%+ VIX spikes, the $SPY was higher a year later in 8 out of 10 cases — average gain of 12%. That's not a guarantee, but it's a pattern. Fear spikes often mark bottoms, not tops.
The two exceptions? One was November 2021, right before the 2022 bear market. That's your invalidation case — when macro structure is already broken and volatility is just catching up.
Here's the trade idea: if you're seeing capitulation volume, washed-out sentiment, and clean support holding, this is where you start building. Not all-in, but layering. The VIX spike itself is the signal — it's the market pricing in maximum pain.
Confirmation: watch for follow-through in $SPY and $QQQ. If they reclaim key levels and hold, the fear was the flush. If they fail and break lower, you're in that 2/10 scenario.
Invalidation: new lows with rising VIX again. That's not a spike, that's a trend.
This is textbook volatility mean reversion. Teach yourself to buy the panic, not sell it.
201
·
--
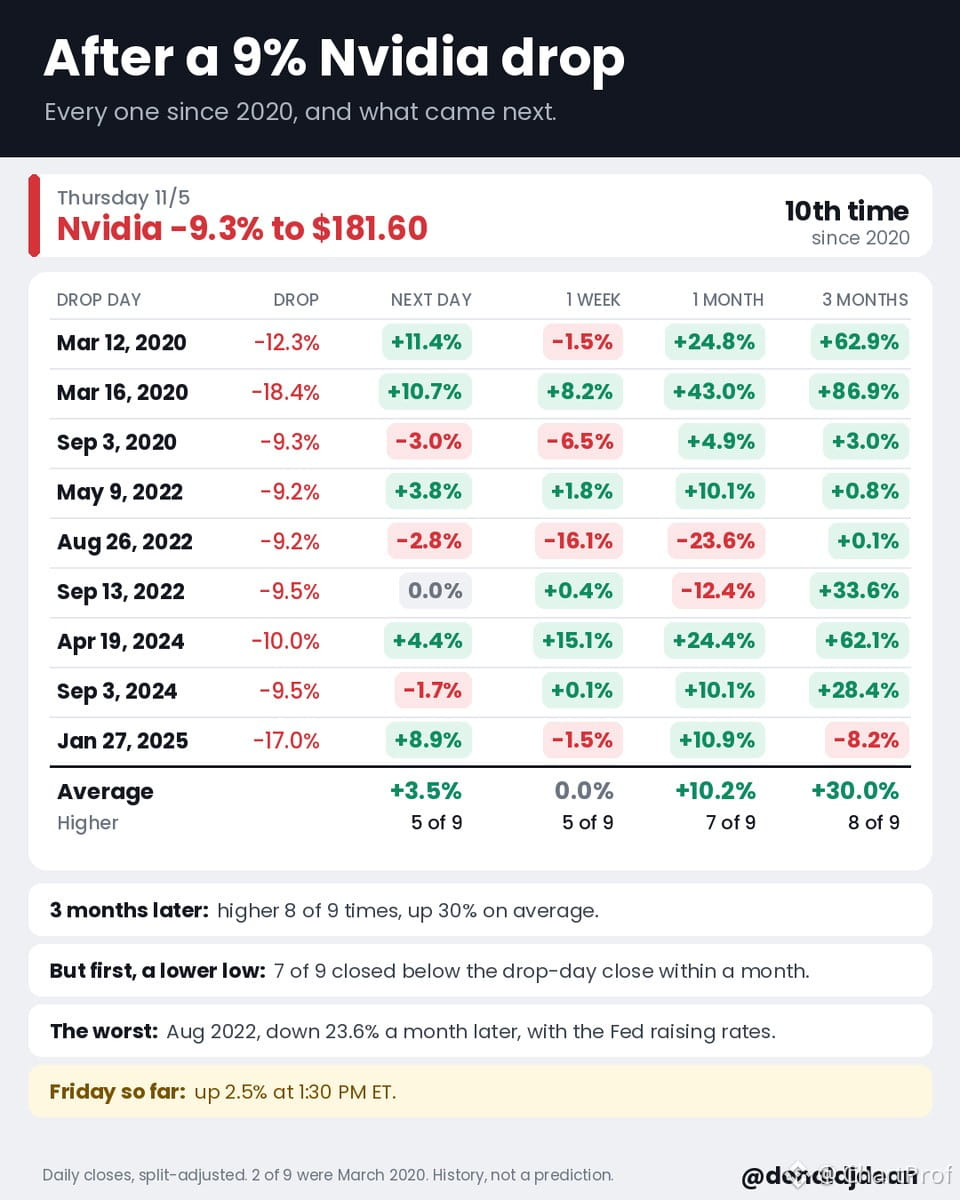
After a 9% Nvidia Drop: Lower Low First, Then Higher.
$NVDA Nvidia fell 9.3% Thursday — the 10th time since 2020 we've seen a single-day drop this size. Let's read the pattern like a textbook.
Historical Structure:
7 of 9 prior instances made a lower close within a month. That's your dip continuation — the market needed more time to find a floor. But 3 months later, 8 of 9 were higher, averaging +30%. That's your mean reversion setup.
What This Teaches:
Sharp drops rarely bottom immediately. The structure typically needs a retest or a lower low to shake out weak hands before the bounce takes hold. If you're hunting the long, wait for that lower low confirmation — don't front-run the dip.
Worst Case Reference:
August 2022 — Fed raising rates, macro headwinds, no clear bottom. That's your invalidation scenario. If macro tightens again, this setup doesn't play the same.
Setup:
Watch for a lower low within the next few weeks. If it holds and reclaims key support, that's your long entry with a 3-month horizon. Invalidation: sustained breakdown below August 2022 lows or fresh macro pressure.
$QQQ $SMH $AMD all follow similar patterns. Read the structure, wait for confirmation, then position accordingly.
After a 9% Nvidia Drop: Lower Low First, Then Higher.
$NVDA Nvidia fell 9.3% Thursday — the 10th time since 2020 we've seen a single-day drop this size. Let's read the pattern like a textbook.
Historical Structure:
7 of 9 prior instances made a lower close within a month. That's your dip continuation — the market needed more time to find a floor. But 3 months later, 8 of 9 were higher, averaging +30%. That's your mean reversion setup.
What This Teaches:
Sharp drops rarely bottom immediately. The structure typically needs a retest or a lower low to shake out weak hands before the bounce takes hold. If you're hunting the long, wait for that lower low confirmation — don't front-run the dip.
Worst Case Reference:
August 2022 — Fed raising rates, macro headwinds, no clear bottom. That's your invalidation scenario. If macro tightens again, this setup doesn't play the same.
Setup:
Watch for a lower low within the next few weeks. If it holds and reclaims key support, that's your long entry with a 3-month horizon. Invalidation: sustained breakdown below August 2022 lows or fresh macro pressure.
$QQQ $SMH $AMD all follow similar patterns. Read the structure, wait for confirmation, then position accordingly.
$NVDA Nvidia fell 9.3% Thursday — the 10th time since 2020 we've seen a single-day drop this size. Let's read the pattern like a textbook.
Historical Structure:
7 of 9 prior instances made a lower close within a month. That's your dip continuation — the market needed more time to find a floor. But 3 months later, 8 of 9 were higher, averaging +30%. That's your mean reversion setup.
What This Teaches:
Sharp drops rarely bottom immediately. The structure typically needs a retest or a lower low to shake out weak hands before the bounce takes hold. If you're hunting the long, wait for that lower low confirmation — don't front-run the dip.
Worst Case Reference:
August 2022 — Fed raising rates, macro headwinds, no clear bottom. That's your invalidation scenario. If macro tightens again, this setup doesn't play the same.
Setup:
Watch for a lower low within the next few weeks. If it holds and reclaims key support, that's your long entry with a 3-month horizon. Invalidation: sustained breakdown below August 2022 lows or fresh macro pressure.
$QQQ $SMH $AMD all follow similar patterns. Read the structure, wait for confirmation, then position accordingly.
97
·
--
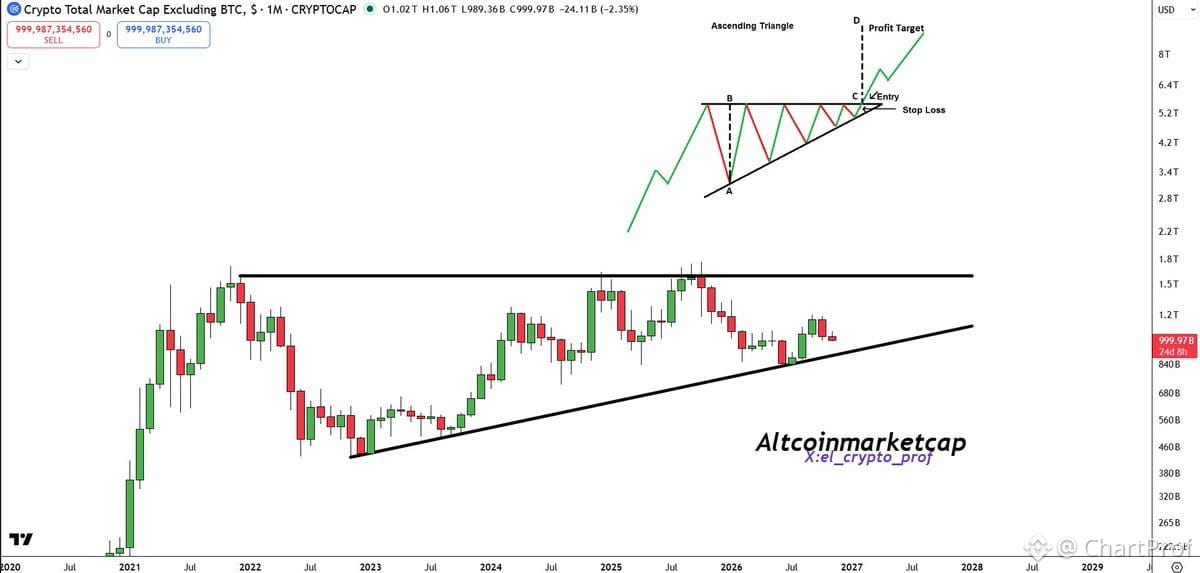
Altcoins sitting in the longest ascending triangle on record.
Let me break down what that actually means for structure.
Ascending triangle = higher lows squeezing into horizontal resistance. Buyers stepping in earlier each wave. Sellers defending the same ceiling. The longer it builds, the bigger the resolution when it breaks.
This one's been coiling for months. That's not normal. That's compression at a macro level.
What confirms the break:
• Clean close above resistance on volume
• Retest holds as new support
• Momentum doesn't fade on the first push
What kills it:
• Rejection at resistance again
• Break of the ascending trendline support
• Momentum dies before the breakout even attempts
The setup is there. The structure is textbook. Now we wait for the trigger.
Watch the ceiling. Watch the lows. One of them breaks soon.
Altcoins sitting in the longest ascending triangle on record.
Let me break down what that actually means for structure.
Ascending triangle = higher lows squeezing into horizontal resistance. Buyers stepping in earlier each wave. Sellers defending the same ceiling. The longer it builds, the bigger the resolution when it breaks.
This one's been coiling for months. That's not normal. That's compression at a macro level.
What confirms the break:
• Clean close above resistance on volume
• Retest holds as new support
• Momentum doesn't fade on the first push
What kills it:
• Rejection at resistance again
• Break of the ascending trendline support
• Momentum dies before the breakout even attempts
The setup is there. The structure is textbook. Now we wait for the trigger.
Watch the ceiling. Watch the lows. One of them breaks soon.
Let me break down what that actually means for structure.
Ascending triangle = higher lows squeezing into horizontal resistance. Buyers stepping in earlier each wave. Sellers defending the same ceiling. The longer it builds, the bigger the resolution when it breaks.
This one's been coiling for months. That's not normal. That's compression at a macro level.
What confirms the break:
• Clean close above resistance on volume
• Retest holds as new support
• Momentum doesn't fade on the first push
What kills it:
• Rejection at resistance again
• Break of the ascending trendline support
• Momentum dies before the breakout even attempts
The setup is there. The structure is textbook. Now we wait for the trigger.
Watch the ceiling. Watch the lows. One of them breaks soon.
77
Log in to explore more content
Join global crypto users on Binance Square
⚡️ Get latest and useful information about crypto.
💬 Trusted by the world’s largest crypto exchange.
👍 Discover real insights from verified creators.
Email / Phone number
Trending Topics
BinanceReopensWithdrawalsForHYPE&APT
105,968 views
1,042 Discussing
Binance Re-Enables Withdrawals for HYPE and APT, Extends List of Restored Assets
Binance News
·32 Likes
·29.5k views
SouthKoreaDraftLawTargets15To20%ShareholderCap
101,179 views
693 Discussing
TradFiForBeginners
191,837 views
1,908 Discussing