
币圈老司机
998 Posts
 LIVE
LIVE币圈老司机
 Square Verified
币圈老司机,一个追逐热点的老韭菜,//Twitter:@SEFATUBA3//二级市场博主//币安注册邀请码:BQLSJ // 用我的邀请码注册欢迎私信我入小群

Live Trader

原创之星

USD1 Holder
Frequent Trader
8.8 Years
58 Following
11.1K+ Followers
6.2K+ Liked
2 Badges
Posts
All
Quotes
Videos
Live
PINNED



·
--
🎙️ Tonight, storage is likely to plunge—let’s take a look at the market

End
01 h 08 m 05 s
1.4k
0
·
--
🎙️ US stocks rebound hard tonight! Time to buy the dip in Haili Shi!

End
01 h 23 m 18 s
1.3k
0
Verified
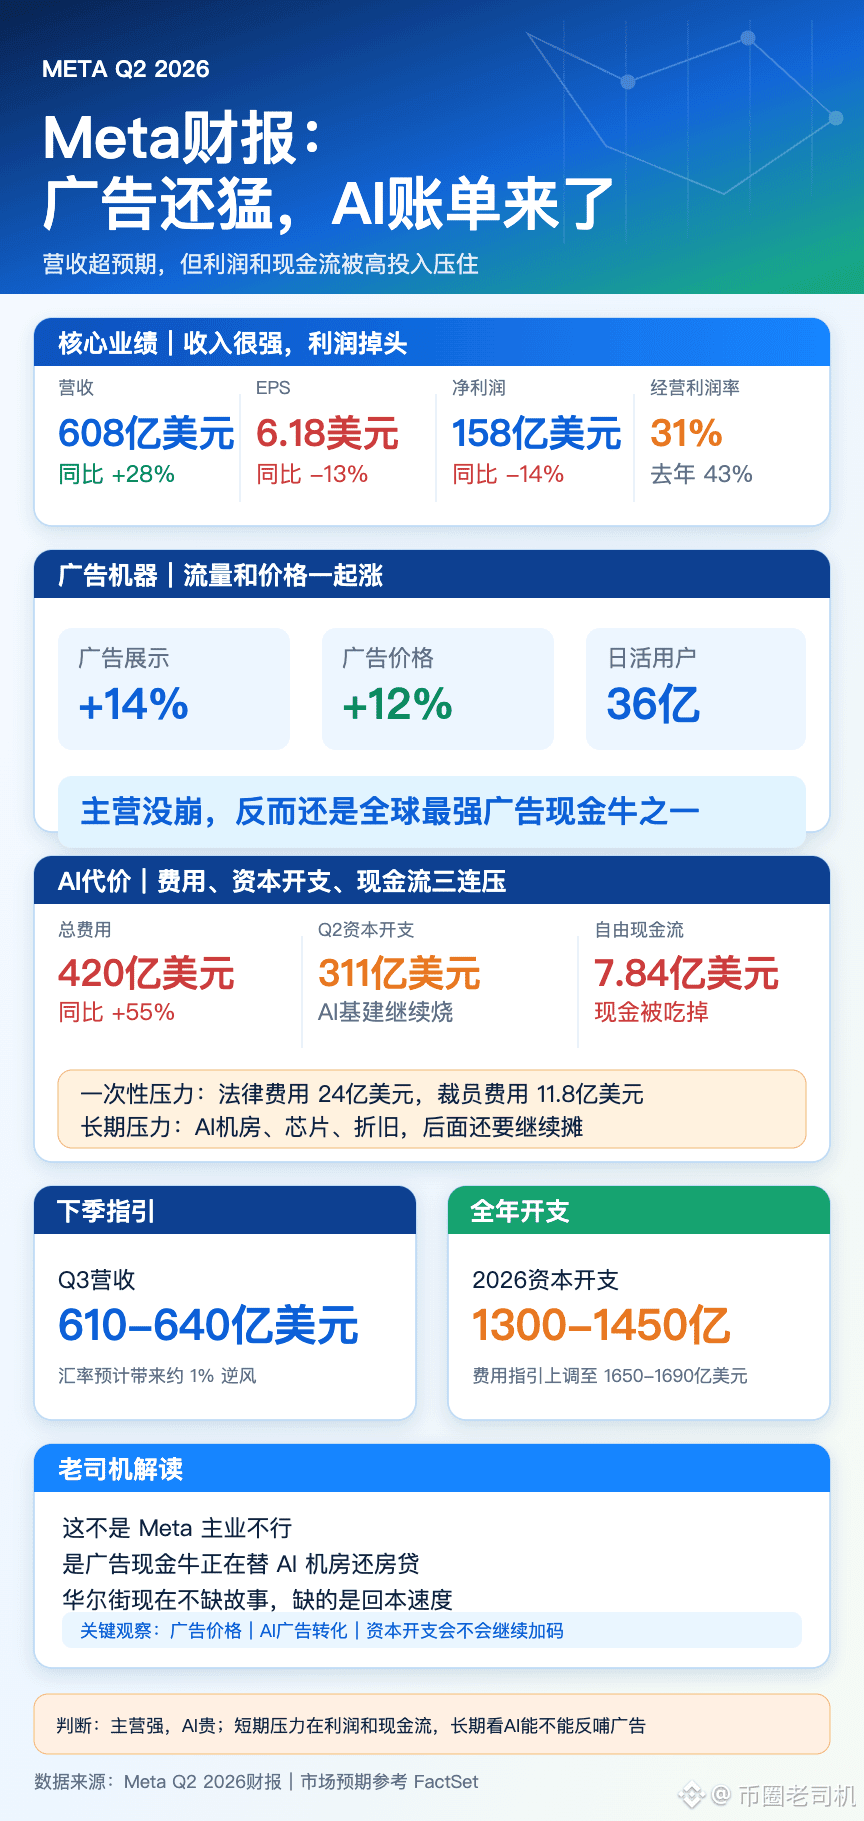
# Meta Q2 earnings interpretation
Meta’s earnings report—guys, don’t just look at the stock price diving
The real action is in the two numbers battling each other
Revenue: $60.8 billion, year-over-year +28%
Ad impressions +14%, ad pricing +12%
This suggests Facebook, Instagram, and WhatsApp—the ad machine—is still very strong
But on the other side, EPS is only $6.18, year-over-year -13%
Expenses jumped to $42 billion, year-over-year +55%
Inside that are $2.4 billion in legal-related costs, plus $1.18 billion in layoffs
Most eye-catching is free cash flow
In Q2, it’s down to just $784 million
It’s not that they’re not making money—the money they earn basically gets swallowed back by AI infrastructure
Meta’s 2025 capital expenditure guidance has been raised to $130 billion to $145 billion
What Zuckerberg is betting on right now is one thing:
AI isn’t just about telling stories—it needs to be used to completely redo ads, recommendations, content production, and personal assistants
If this actually works, Meta will still be a cash cow—upgraded
If it doesn’t, then the ad business is basically paying the mortgage for AI data centers
So my take on this earnings report is:
Core business is strong, AI is expensive, and the market doesn’t want dreams right now—it wants to see how fast they’ll get their money back
Next, focus on three things
Can ad pricing keep rising?
Can AI tools truly improve ad conversions?
Will capital expenditures keep getting bigger?
Meta isn’t falling apart
It’s just that Wall Street is starting to ask Zuckerberg one question:
Bro, when exactly will your AI bill turn into profit?
Source: Meta Q2 2026 earnings report; market expectations reference: FactSet
Meta’s earnings report—guys, don’t just look at the stock price diving
The real action is in the two numbers battling each other
Revenue: $60.8 billion, year-over-year +28%
Ad impressions +14%, ad pricing +12%
This suggests Facebook, Instagram, and WhatsApp—the ad machine—is still very strong
But on the other side, EPS is only $6.18, year-over-year -13%
Expenses jumped to $42 billion, year-over-year +55%
Inside that are $2.4 billion in legal-related costs, plus $1.18 billion in layoffs
Most eye-catching is free cash flow
In Q2, it’s down to just $784 million
It’s not that they’re not making money—the money they earn basically gets swallowed back by AI infrastructure
Meta’s 2025 capital expenditure guidance has been raised to $130 billion to $145 billion
What Zuckerberg is betting on right now is one thing:
AI isn’t just about telling stories—it needs to be used to completely redo ads, recommendations, content production, and personal assistants
If this actually works, Meta will still be a cash cow—upgraded
If it doesn’t, then the ad business is basically paying the mortgage for AI data centers
So my take on this earnings report is:
Core business is strong, AI is expensive, and the market doesn’t want dreams right now—it wants to see how fast they’ll get their money back
Next, focus on three things
Can ad pricing keep rising?
Can AI tools truly improve ad conversions?
Will capital expenditures keep getting bigger?
Meta isn’t falling apart
It’s just that Wall Street is starting to ask Zuckerberg one question:
Bro, when exactly will your AI bill turn into profit?
Source: Meta Q2 2026 earnings report; market expectations reference: FactSet
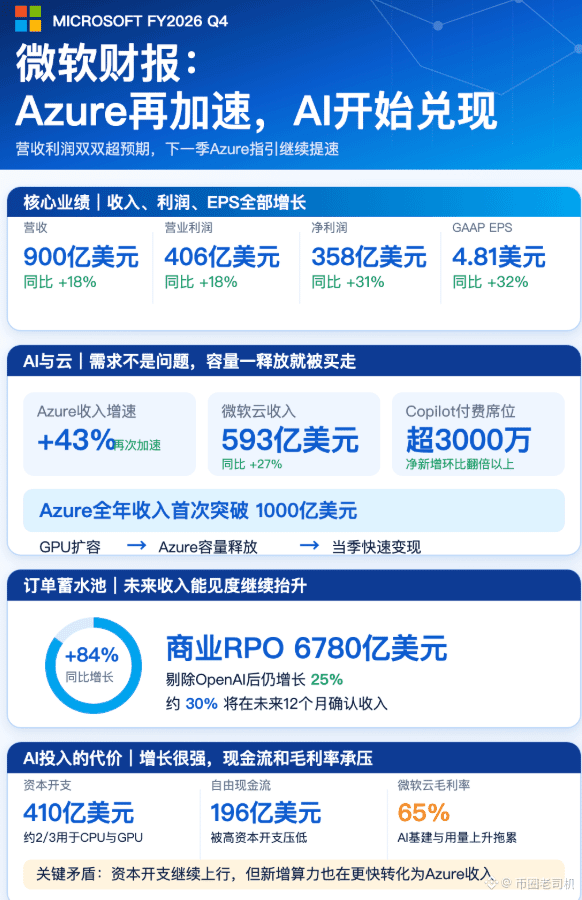
This set of Microsoft’s earnings reports sends a very clear signal: AI is no longer just telling stories—it is continuously turning into revenue.
In the quarter, Microsoft revenue was $90 billion, up 18% year over year; operating income was $40.6 billion, up 18%; and net income was $35.8 billion, up 31%. However, net income includes $3.2 billion in gains from its investment in Anthropic. Excluding the impact of that related investment, net income growth is roughly 22%, and the core business remains very solid.
The biggest highlight is Azure. Azure revenue grew 43% year over year, beating market expectations. Microsoft also expects Azure to grow by about 45% in the next quarter on a constant-currency basis. Management said that customer demand is still exceeding available compute capacity. With newly added CPU and GPU capacity coming online, it can be converted into revenue quickly. This indicates that Microsoft’s large-scale construction of AI data centers is not blind expansion—there is indeed strong enterprise demand behind it.
AI software is also entering its harvest period. Paid seats for Microsoft 365 Copilot have already surpassed 30 million, and the net addition of seats in the quarter more than doubled quarter over quarter. Microsoft is not only selling compute capacity through Azure—it can also charge per seat and by usage through Copilot, forming a dual monetization model of “cloud infrastructure + AI applications.”
But the cost of high growth is equally evident. Capital expenditures in the quarter reached $41 billion, with roughly two-thirds invested in CPU and GPU. Free cash flow was only $19.6 billion, and Microsoft’s cloud gross margin fell to 65%. Next quarter, capital expenditures are expected to exceed $50 billion as well.
So overall, this earnings report is relatively strong. Azure is accelerating, Copilot is scaling up, and order volume is healthy—all of which show Microsoft is benefiting from the AI upside. Going forward, what the market is really focused on is no longer whether there is demand for AI, but whether these massive investments can continue to deliver faster revenue growth and protect cloud business profit margins.
In the quarter, Microsoft revenue was $90 billion, up 18% year over year; operating income was $40.6 billion, up 18%; and net income was $35.8 billion, up 31%. However, net income includes $3.2 billion in gains from its investment in Anthropic. Excluding the impact of that related investment, net income growth is roughly 22%, and the core business remains very solid.
The biggest highlight is Azure. Azure revenue grew 43% year over year, beating market expectations. Microsoft also expects Azure to grow by about 45% in the next quarter on a constant-currency basis. Management said that customer demand is still exceeding available compute capacity. With newly added CPU and GPU capacity coming online, it can be converted into revenue quickly. This indicates that Microsoft’s large-scale construction of AI data centers is not blind expansion—there is indeed strong enterprise demand behind it.
AI software is also entering its harvest period. Paid seats for Microsoft 365 Copilot have already surpassed 30 million, and the net addition of seats in the quarter more than doubled quarter over quarter. Microsoft is not only selling compute capacity through Azure—it can also charge per seat and by usage through Copilot, forming a dual monetization model of “cloud infrastructure + AI applications.”
But the cost of high growth is equally evident. Capital expenditures in the quarter reached $41 billion, with roughly two-thirds invested in CPU and GPU. Free cash flow was only $19.6 billion, and Microsoft’s cloud gross margin fell to 65%. Next quarter, capital expenditures are expected to exceed $50 billion as well.
So overall, this earnings report is relatively strong. Azure is accelerating, Copilot is scaling up, and order volume is healthy—all of which show Microsoft is benefiting from the AI upside. Going forward, what the market is really focused on is no longer whether there is demand for AI, but whether these massive investments can continue to deliver faster revenue growth and protect cloud business profit margins.
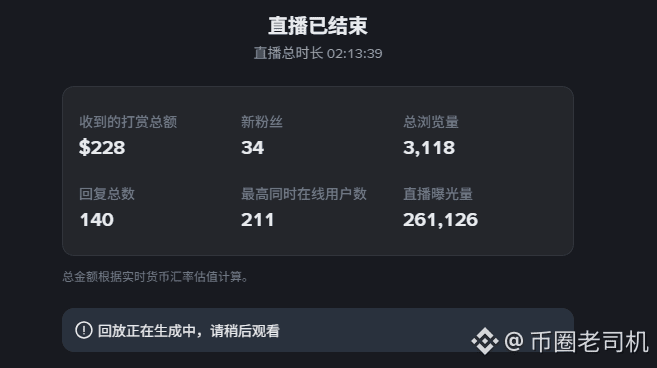
Received a gift for the first time on Binance Live
Thank you, sisi defi little miner
Hahahahahaha
Thank you, sisi defi little miner
Hahahahahaha


·
--
🎙️ The US stock market just crashed again! Come in to get compensated if you’ve lost money!

End
01 h 21 m 16 s
1.2k
0
Partly True
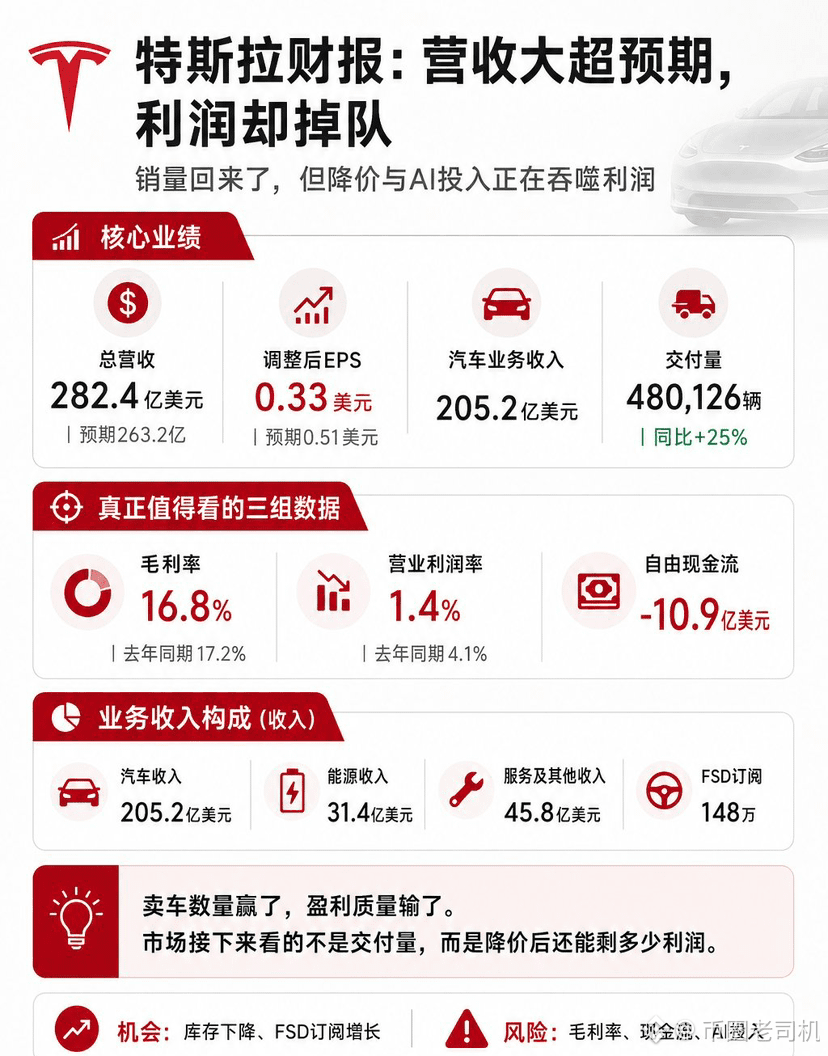
Tesla Q2 earnings are over!
Tesla revenue was $28.24 billion, clearly above expectations. Vehicle deliveries were 480,000, up 25% year over year. The sales rebound is real.
But adjusted EPS was only $0.33, below the expected $0.51. This suggests that the sales growth hasn’t been smoothly converted into profits.
Gross margin fell from 17.2% to 16.8%, and operating margin dropped even more—from 4.1% to 1.4%. Price cuts, promotions, and spending on new business are squeezing profitability.
Free cash flow was negative $1.09 billion. Although it’s better than what the market previously feared, it still indicates that investment in AI, Robotaxi, Optimus, and new production lines is very heavy.
I looked into the reasons behind the gross margin decline, profit loss, and cash flow deterioration.
1. The drop in gross margin is because, to boost sales in Q2, Tesla used a lot of financial products—like 0% financing for 8 years. That money still has to be paid by Tesla.
2. The decline in profit is because Tesla invested in things like autonomous robotaxis, AI, compute power, factories, and so on.
Spending continuously has effectively consumed the profits through investment, so profit also fell.
Similarly, the reason for the cash flow shortfall is also that the investments are simply too large.
Tesla is down, and its close sibling, SpaceX, won’t have an easy time tomorrow either.
Let’s see the conference call—whether Tesla will mention SpaceX
$IBM
Tesla revenue was $28.24 billion, clearly above expectations. Vehicle deliveries were 480,000, up 25% year over year. The sales rebound is real.
But adjusted EPS was only $0.33, below the expected $0.51. This suggests that the sales growth hasn’t been smoothly converted into profits.
Gross margin fell from 17.2% to 16.8%, and operating margin dropped even more—from 4.1% to 1.4%. Price cuts, promotions, and spending on new business are squeezing profitability.
Free cash flow was negative $1.09 billion. Although it’s better than what the market previously feared, it still indicates that investment in AI, Robotaxi, Optimus, and new production lines is very heavy.
I looked into the reasons behind the gross margin decline, profit loss, and cash flow deterioration.
1. The drop in gross margin is because, to boost sales in Q2, Tesla used a lot of financial products—like 0% financing for 8 years. That money still has to be paid by Tesla.
2. The decline in profit is because Tesla invested in things like autonomous robotaxis, AI, compute power, factories, and so on.
Spending continuously has effectively consumed the profits through investment, so profit also fell.
Similarly, the reason for the cash flow shortfall is also that the investments are simply too large.
Tesla is down, and its close sibling, SpaceX, won’t have an easy time tomorrow either.
Let’s see the conference call—whether Tesla will mention SpaceX
$IBM
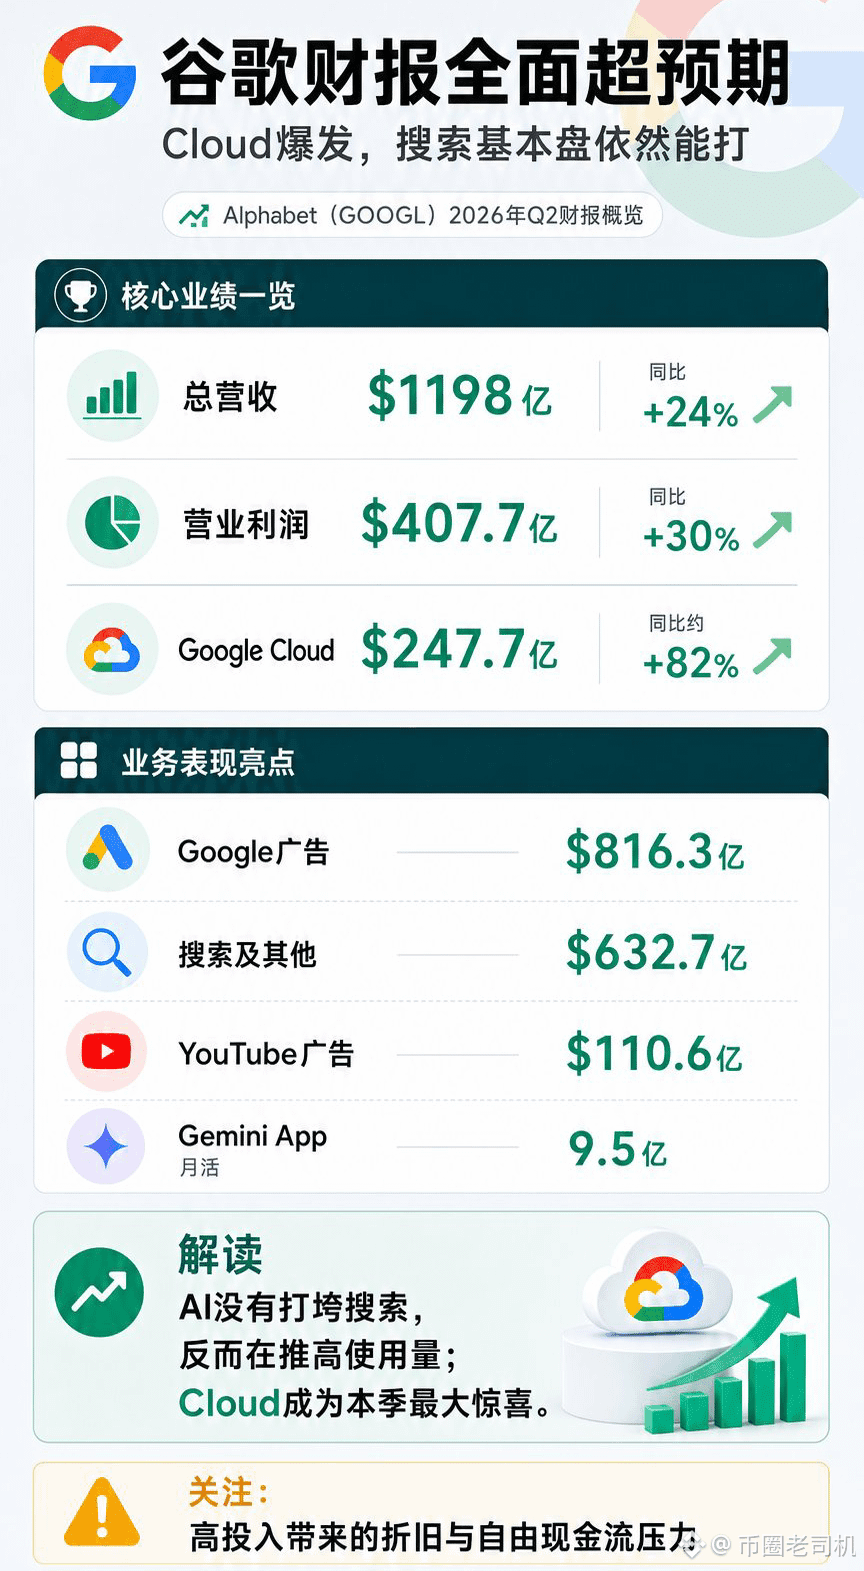
Google has just released the latest earnings report
The report shows that Google’s revenue, profits, and growth all far exceeded expectations
Revenue was $119.8 billion, up 24% year over year
Profit was $40.77 billion, up 30% year over year
Cloud business revenue was $40.77 billion, up 82% year over year
As for the other businesses, I won’t list them here—everyone can take a look yourselves
It’s clear to see that:
1. Google isn’t just trying out AI—it’s grabbing compute power
CapEx in Q1 increased from $35.7 billion to $45.9 billion
2. Google’s AI spending isn’t just pure money-burning—it’s profitable money-burning
The most straightforward data is that cloud business has exploded, up 82% year over year
3. Google, following the budget set at the start of the year, will spend $180 billion on AI for the full year
They invested $80 billion in the first half, and the second half will spend $100 billion—more aggressive than the first half
Basically, it’s broadly positive for storage, AI, and optical module segments
Micron is saved!!!!!!! $GOOGLB
The report shows that Google’s revenue, profits, and growth all far exceeded expectations
Revenue was $119.8 billion, up 24% year over year
Profit was $40.77 billion, up 30% year over year
Cloud business revenue was $40.77 billion, up 82% year over year
As for the other businesses, I won’t list them here—everyone can take a look yourselves
It’s clear to see that:
1. Google isn’t just trying out AI—it’s grabbing compute power
CapEx in Q1 increased from $35.7 billion to $45.9 billion
2. Google’s AI spending isn’t just pure money-burning—it’s profitable money-burning
The most straightforward data is that cloud business has exploded, up 82% year over year
3. Google, following the budget set at the start of the year, will spend $180 billion on AI for the full year
They invested $80 billion in the first half, and the second half will spend $100 billion—more aggressive than the first half
Basically, it’s broadly positive for storage, AI, and optical module segments
Micron is saved!!!!!!! $GOOGLB
·
--
🎙️ Google’s tonight earnings report directly decides the fate of AI

End
01 h 23 m 28 s
1.4k
1

July 16 Market Analysis
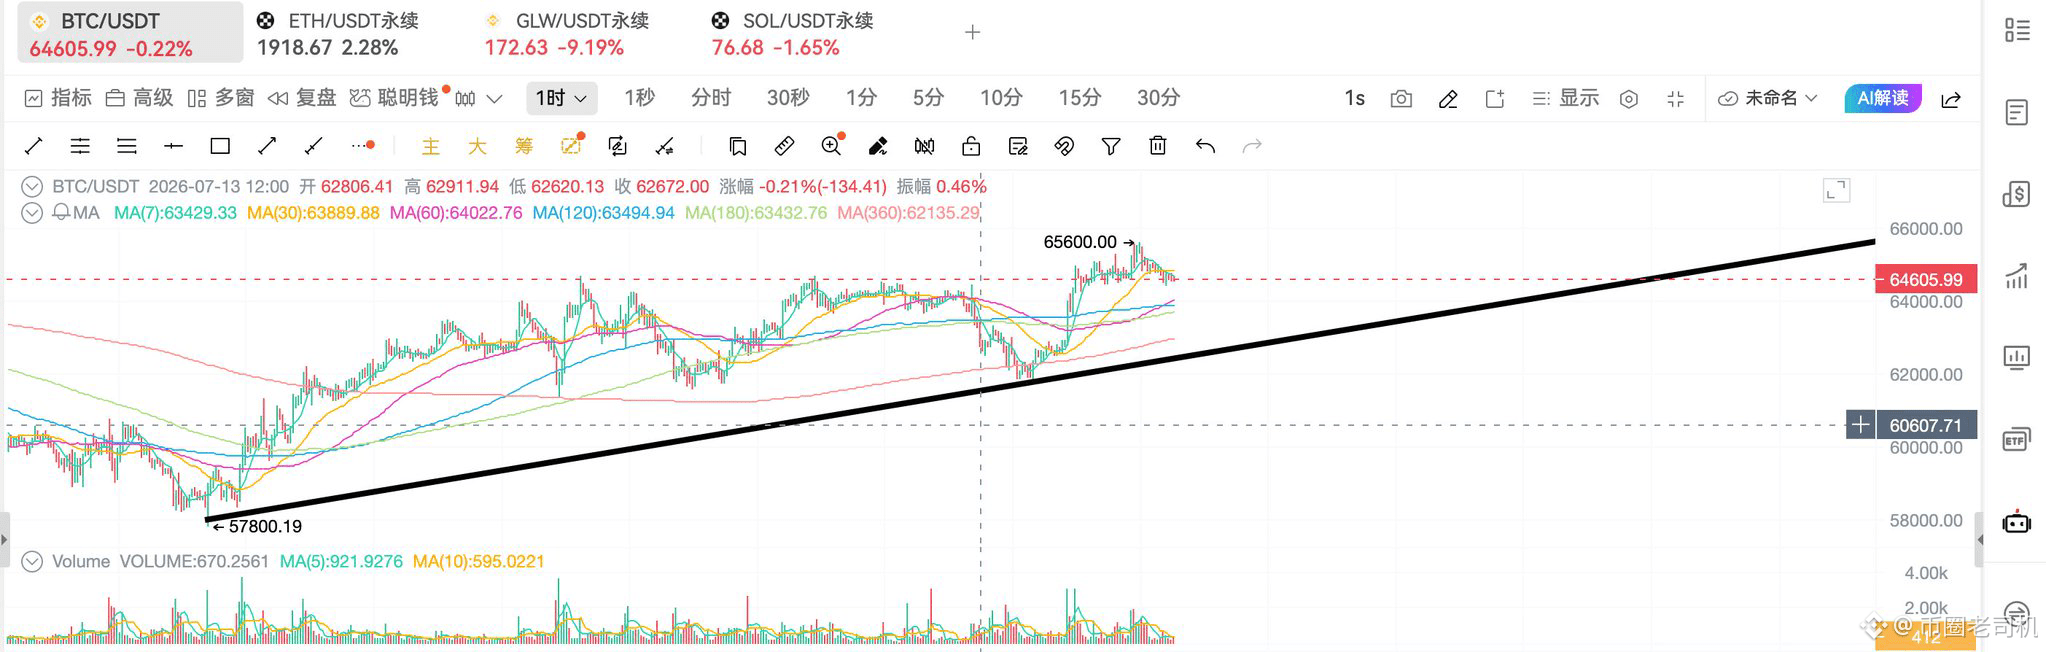
BTC is currently around 645,800. The 24-hour high is 655,900, the low is 643,700. After a push higher, it pulled back, but overall it is still trading above 640,000.
The technical outlook is bullish.
1-hour RSI is 47. Short-term momentum isn’t that strong. Price is temporarily capped below the EMA20 at 647,500, but it is still above the EMA60 at 643,500.
4-hour RSI is 56. Price is above the EMA20 at 641,800 and the EMA60 at 633,800.
The 4-hour MACD DIF is 401, DEA is 288, and the red histogram is still 227. The 4-hour rebound structure hasn’t broken down.
The 1-hour Bollinger Bands midline is 648,700, and the lower band is 643,900. The 643,000 to 640,000 area is the most critical short-term support today.
The contract funding rate is 0.0059%. Open interest is about $1.994 billion. The funding rate isn’t high, and the contract longs aren’t noticeably crowded.
ETF flows have returned for two consecutive days. On July 14, net inflow was $181.1 million. On July 15, it saw another $107.7 million inflow. In total over two days, it’s close to $289 million.
The macro environment is also a bit more comfortable than the past few days. The U.S. 10-year Treasury yield fell from 4.622% to 4.545%, and the U.S. Dollar Index dropped from 101.3 to 100.51—this is relatively favorable for BTC.
In the news, the SEC approved an increase in BlackRock’s spot BTC ETF options position and exercise limits to 1,000,000 contracts. Over the long run, this should increase institutional hedging and trading depth.
On-chain, there are two large movements in opposite directions. One is an address that has been dormant for eight years transferring 5,908 BTC (about $383 million). This could indicate potential sell pressure that we need to monitor.
The other is that whales continue buying roughly $170.5 million worth of BTC from Coinbase in accumulation, suggesting there is also demand around the 640,000 level.
U.S. June PPI month-on-month is -0.3%, below expectations. This gives risk assets some breathing room in the short term, but Powell is still emphasizing the inflation issue—rate expectations can still fluctuate.
Middle East risks haven’t fully disappeared, but the U.S. military said the latest round of actions has ended. For now, geopolitical headlines haven’t further escalated into direct sell pressure for BTC.
In terms of liquidity, both the BTC liquidity index over the past 24 hours and the current BTC liquidity index are “Buy,” but overall market liquidity is still “Hold.” This suggests BTC is stronger than the broader market, and altcoins shouldn’t be too aggressive for now.
Go long directly.
Don’t chase above 65,000. If there’s a pullback to 64,300–64,000 and it doesn’t break, you can consider going long.
The first target is 65,600. After a breakout, look for 66,100.
Place the stop-loss below 63,900.
BTC is currently around 645,800. The 24-hour high is 655,900, the low is 643,700. After a push higher, it pulled back, but overall it is still trading above 640,000.
The technical outlook is bullish.
1-hour RSI is 47. Short-term momentum isn’t that strong. Price is temporarily capped below the EMA20 at 647,500, but it is still above the EMA60 at 643,500.
4-hour RSI is 56. Price is above the EMA20 at 641,800 and the EMA60 at 633,800.
The 4-hour MACD DIF is 401, DEA is 288, and the red histogram is still 227. The 4-hour rebound structure hasn’t broken down.
The 1-hour Bollinger Bands midline is 648,700, and the lower band is 643,900. The 643,000 to 640,000 area is the most critical short-term support today.
The contract funding rate is 0.0059%. Open interest is about $1.994 billion. The funding rate isn’t high, and the contract longs aren’t noticeably crowded.
ETF flows have returned for two consecutive days. On July 14, net inflow was $181.1 million. On July 15, it saw another $107.7 million inflow. In total over two days, it’s close to $289 million.
The macro environment is also a bit more comfortable than the past few days. The U.S. 10-year Treasury yield fell from 4.622% to 4.545%, and the U.S. Dollar Index dropped from 101.3 to 100.51—this is relatively favorable for BTC.
In the news, the SEC approved an increase in BlackRock’s spot BTC ETF options position and exercise limits to 1,000,000 contracts. Over the long run, this should increase institutional hedging and trading depth.
On-chain, there are two large movements in opposite directions. One is an address that has been dormant for eight years transferring 5,908 BTC (about $383 million). This could indicate potential sell pressure that we need to monitor.
The other is that whales continue buying roughly $170.5 million worth of BTC from Coinbase in accumulation, suggesting there is also demand around the 640,000 level.
U.S. June PPI month-on-month is -0.3%, below expectations. This gives risk assets some breathing room in the short term, but Powell is still emphasizing the inflation issue—rate expectations can still fluctuate.
Middle East risks haven’t fully disappeared, but the U.S. military said the latest round of actions has ended. For now, geopolitical headlines haven’t further escalated into direct sell pressure for BTC.
In terms of liquidity, both the BTC liquidity index over the past 24 hours and the current BTC liquidity index are “Buy,” but overall market liquidity is still “Hold.” This suggests BTC is stronger than the broader market, and altcoins shouldn’t be too aggressive for now.
Go long directly.
Don’t chase above 65,000. If there’s a pullback to 64,300–64,000 and it doesn’t break, you can consider going long.
The first target is 65,600. After a breakout, look for 66,100.
Place the stop-loss below 63,900.
July 13 Market Analysis
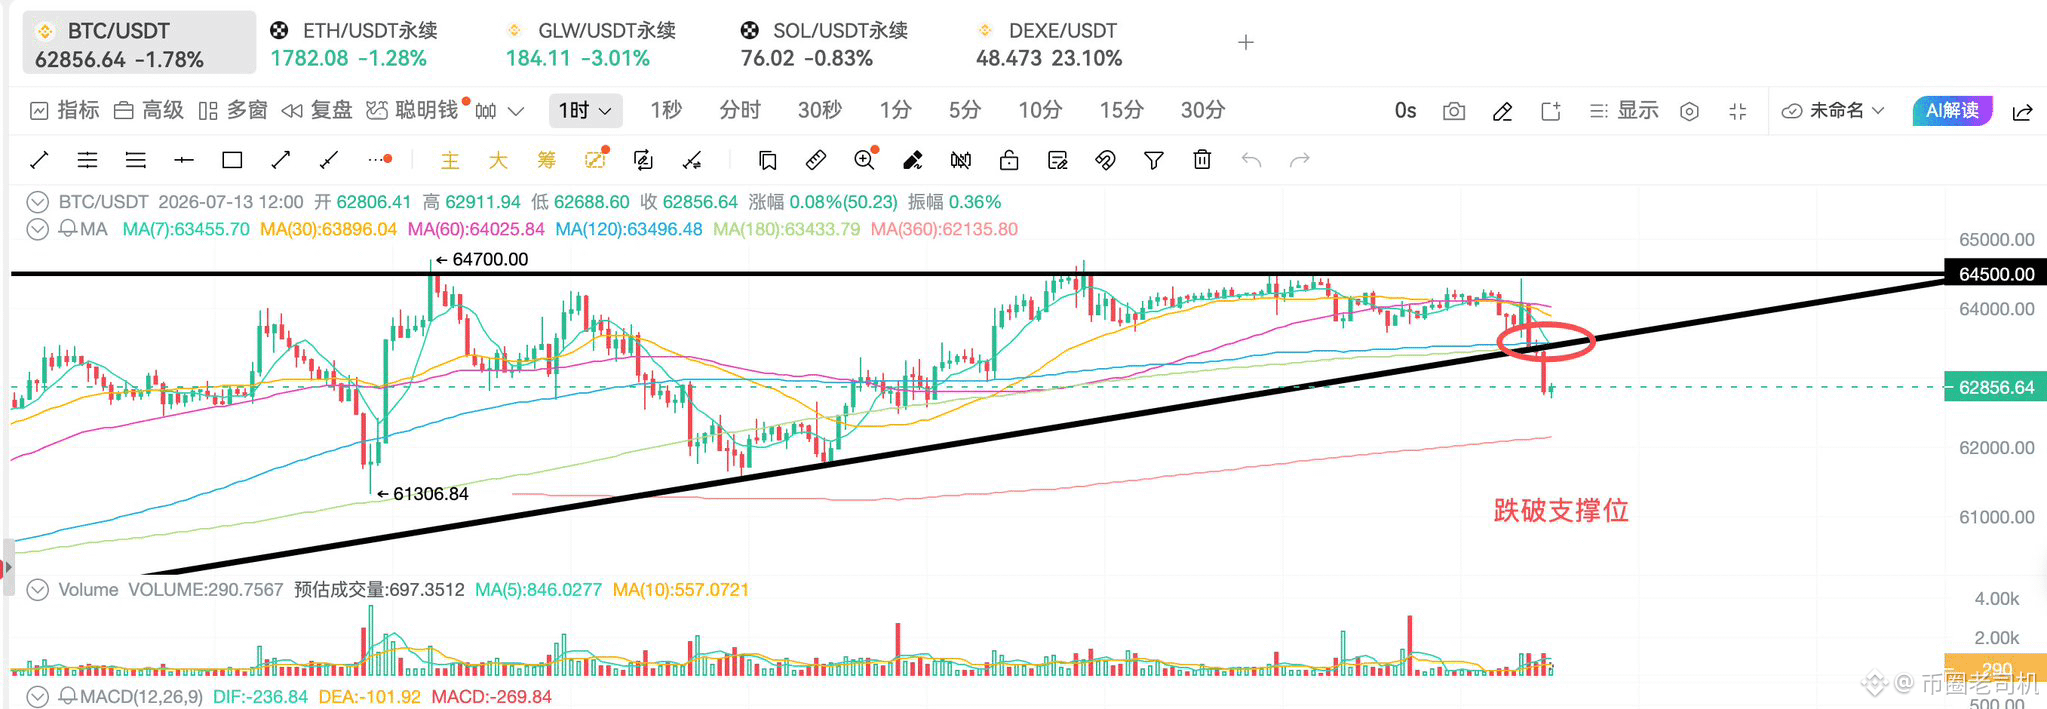
BTC is currently around 628,200, with a 24-hour high of 643,900 and a low of 626,400. During the day, it has already clearly pulled back from above 640,000.
The technical outlook is bearish.
Price has broken below the 1-hour EMA20 at 637,900 and the EMA60 at 638,300, and it has also fallen below the 4-hour EMA20 at 637,400 and the 4-hour EMA60 at 628,800.
On the 4-hour MACD, the DIF is 134 and the DEA is 270. The green histogram continues to expand, and the short-term downtrend structure has not ended yet.
The 1-hour RSI has already reached 26, while the 4-hour RSI is at 39, indicating the short-term market is oversold. Therefore, the current position is not suitable for chasing shorts.
On the 1-hour Bollinger Bands, the lower band is at 632,000. Price has already dropped below the lower band, so it is more likely to first see a rebound before choosing a direction.
The perpetual contract funding rate is still positive at 0.0048%. Open interest is about $1.945 billion. When the price is falling, the longs have not fully been flushed out yet, so pay attention to potential long liquidation-stop “trampling” below.
For ETFs, the most recent trading day was July 10. Net inflow was $90.4 million, but the two days prior saw outflows of $84.9 million and $95.3 million. Institutional capital has not yet shown consistent re-entry.
On the macro front, the biggest hotspot in the past 24 hours has been the escalation of the Middle East situation. The U.S. has again targeted Iran, controversy over transit in the Strait of Hormuz has intensified, and both Brent and WTI crude oil have risen by nearly 4% intraday.
Rising oil prices will amplify inflation expectations. The market has started pricing in the risk that the Federal Reserve may maintain high interest rates or even shift toward rate hikes.
On-chain, a whale sold 13,708 ETH and swapped it for 393.4 BTC, with a size of about $25 million. This is a trade based on relative strength of ETH/BTC. It provides some support for BTC, but the scale is not large enough to overturn the broader market.
BTC mining difficulty has been reduced by 5% to 127.17T. This eases marginal pressure on miners at the production level. It is moderately positive for the medium to long term, with limited impact in the short term.
The total market cap of stablecoins declined by about $7.7 billion in June, the largest monthly drawdown since after Terra. Overall, market liquidity remains somewhat contracted.
On-chain, selling pressure from short-term holders has cooled somewhat, but it has not been confirmed whether institutional capital can re-enter continuously.
In the liquidation chart: after BTC broke below 61,000, cumulative liquidation pressure on longs on major exchanges is about $501 million. Above 65,000, there is roughly $882 million of liquidation pressure on shorts.
In the current market, chasing shorts directly at 62.8k is not ideal. Wait for a rebound to 63.2k–63.8k, then consider adding shorts.
The first target is 62,640. After a break below that, the next target is 61,000.
Place the stop loss above 64,400.
BTC is currently around 628,200, with a 24-hour high of 643,900 and a low of 626,400. During the day, it has already clearly pulled back from above 640,000.
The technical outlook is bearish.
Price has broken below the 1-hour EMA20 at 637,900 and the EMA60 at 638,300, and it has also fallen below the 4-hour EMA20 at 637,400 and the 4-hour EMA60 at 628,800.
On the 4-hour MACD, the DIF is 134 and the DEA is 270. The green histogram continues to expand, and the short-term downtrend structure has not ended yet.
The 1-hour RSI has already reached 26, while the 4-hour RSI is at 39, indicating the short-term market is oversold. Therefore, the current position is not suitable for chasing shorts.
On the 1-hour Bollinger Bands, the lower band is at 632,000. Price has already dropped below the lower band, so it is more likely to first see a rebound before choosing a direction.
The perpetual contract funding rate is still positive at 0.0048%. Open interest is about $1.945 billion. When the price is falling, the longs have not fully been flushed out yet, so pay attention to potential long liquidation-stop “trampling” below.
For ETFs, the most recent trading day was July 10. Net inflow was $90.4 million, but the two days prior saw outflows of $84.9 million and $95.3 million. Institutional capital has not yet shown consistent re-entry.
On the macro front, the biggest hotspot in the past 24 hours has been the escalation of the Middle East situation. The U.S. has again targeted Iran, controversy over transit in the Strait of Hormuz has intensified, and both Brent and WTI crude oil have risen by nearly 4% intraday.
Rising oil prices will amplify inflation expectations. The market has started pricing in the risk that the Federal Reserve may maintain high interest rates or even shift toward rate hikes.
On-chain, a whale sold 13,708 ETH and swapped it for 393.4 BTC, with a size of about $25 million. This is a trade based on relative strength of ETH/BTC. It provides some support for BTC, but the scale is not large enough to overturn the broader market.
BTC mining difficulty has been reduced by 5% to 127.17T. This eases marginal pressure on miners at the production level. It is moderately positive for the medium to long term, with limited impact in the short term.
The total market cap of stablecoins declined by about $7.7 billion in June, the largest monthly drawdown since after Terra. Overall, market liquidity remains somewhat contracted.
On-chain, selling pressure from short-term holders has cooled somewhat, but it has not been confirmed whether institutional capital can re-enter continuously.
In the liquidation chart: after BTC broke below 61,000, cumulative liquidation pressure on longs on major exchanges is about $501 million. Above 65,000, there is roughly $882 million of liquidation pressure on shorts.
In the current market, chasing shorts directly at 62.8k is not ideal. Wait for a rebound to 63.2k–63.8k, then consider adding shorts.
The first target is 62,640. After a break below that, the next target is 61,000.
Place the stop loss above 64,400.
Still watching the bounce today. The direction is to stay long, but don’t chase above 64,000.
Macro hasn’t fully turned暖. US 10-year yields are still above 4.5%, which remains pressure on risk assets.
However, the US Dollar Index has already fallen to around 100.77, and oil prices have also pulled back from their highs. The market’s panic about the US-Iran situation has not continued to escalate, which gives BTC a brief breather.
But the US-Iran risk hasn’t ended. Both sides are still discussing the Hormuz issue. Ceasefire has also been prone to reversals, and geopolitical headlines could bring another sharp drop and rebound at any time.
For ETFs, there were outflows in the past two days: on July 8, outflows totaled $84.90 million; on July 9, $95.30 million; but on July 10, it returned to net inflow of $90.40 million.
This rebound in flows is basically IBIT buying—single-day net inflow of $86.80 million—indicating institutional funds haven’t fully left; they’re just probing back and forth.
Be a bit mindful of on-chain liquidity. Over the past month, the total supply of USDT and USDC has decreased by roughly $13.9 billion. Incremental capital still isn’t sufficient, so even if there’s a bounce, it can’t be taken as a full-fledged rebound.
Tether’s Q2 BTC reserves still haven’t shown any新增 on-chain deposits so far. The market will be watching whether it’s slowing its coin-buying pace—this news is mildly negative/neutral.
Today, capital is also running into high-volatility meme plays. CASHCAT briefly surged to a market cap of $200 million, and Hyperliquid has listed its perpetuals/contracts. This suggests risk appetite has warmed up, but funds haven’t fully returned to BTC or major coins yet.
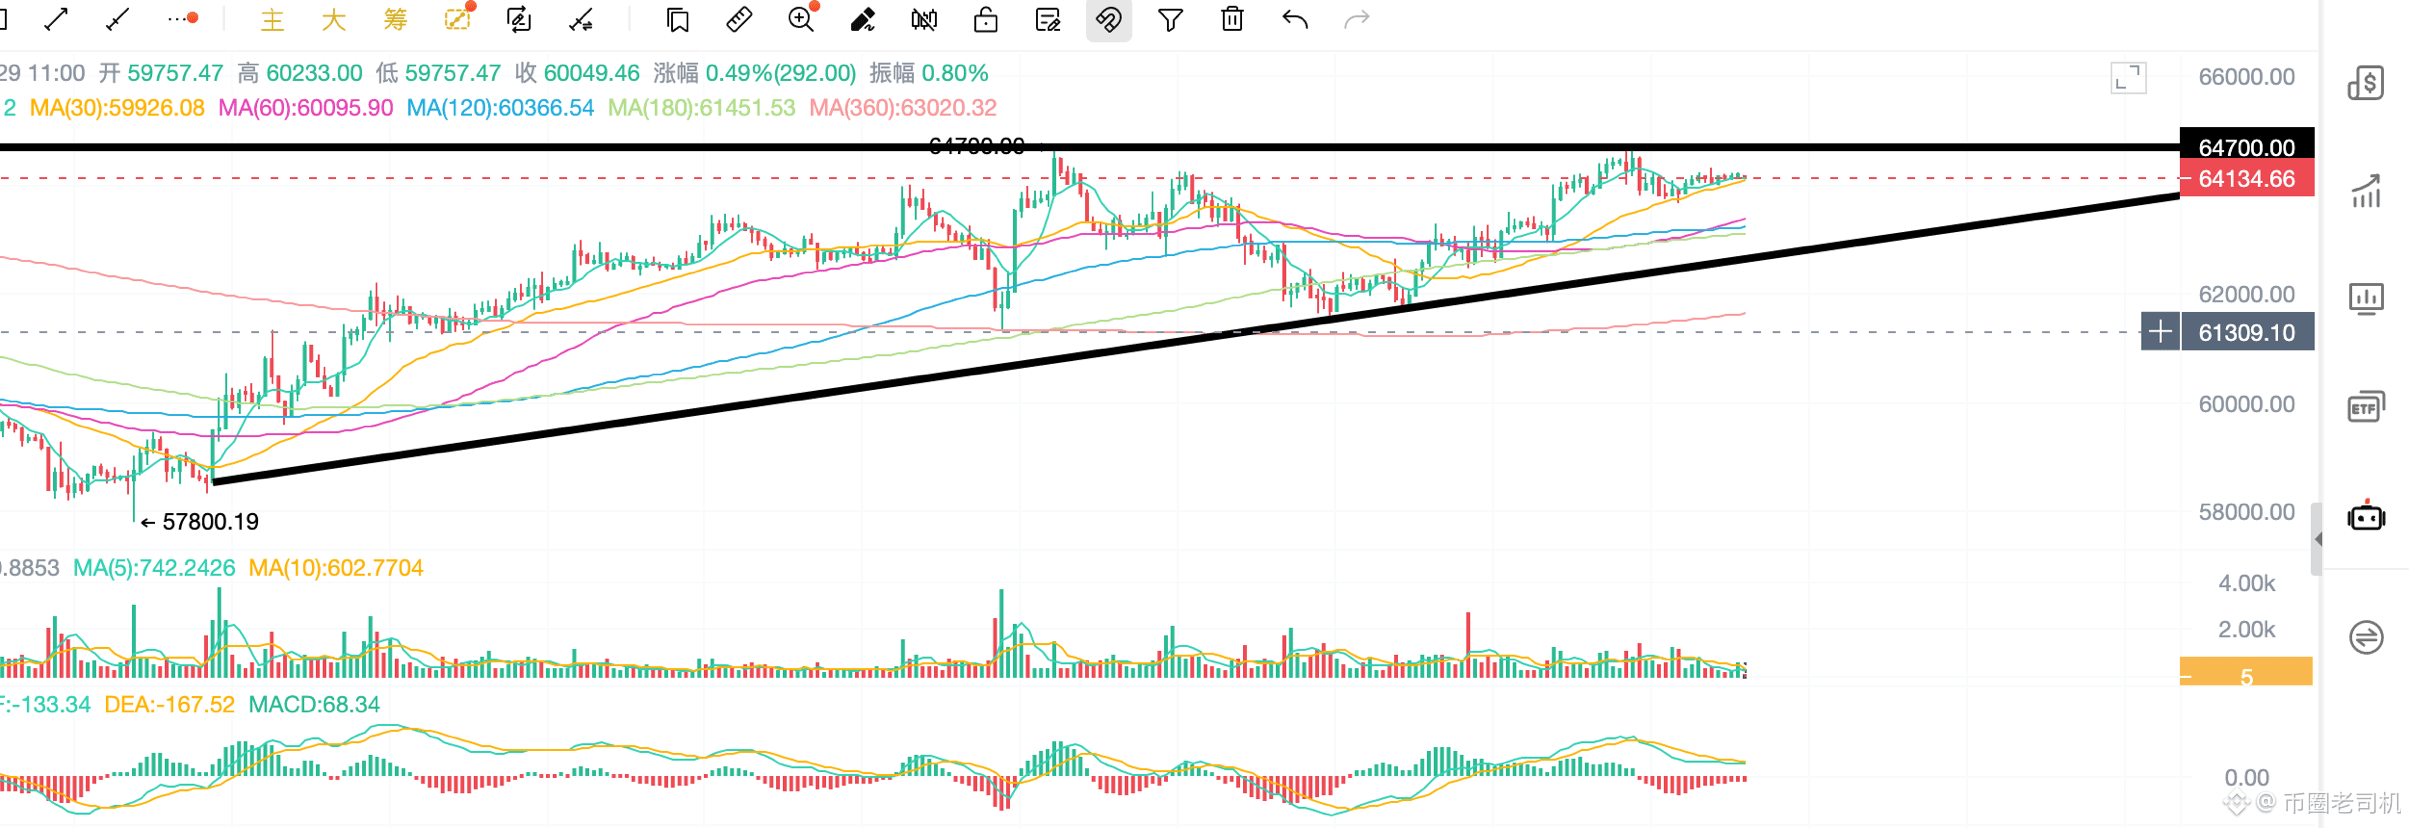
On the technicals: BTC is currently around 64.1k. The 1-hour RSI is 56, the 4-hour RSI is 60, and the daily RSI is 54. In the short term it’s not overheated, and 4-hour strength is still holding.
Price has moved back above the 20-EMA and 60-EMA on both the 1-hour and 4-hour charts. The 4-hour MACD continues to expand above the zero line, and the rebound structure hasn’t broken down.
The funding rate is only around 0.00013%. Open interest is about $1.96 billion, and longs aren’t crowded. At this level, the upside doesn’t face much pressure.
For resistance: the first level is 64.45k. After a breakout, look for 64.67k. Strong resistance remains at 65k.
For support: the first level is 64.0k to 63.7k. Strong support is at 63.5k.
My conclusion is to go long.
If you pull back to 64.0k–63.7k and it doesn’t break, you can continue to enter longs, with a stop-loss placed below 63.3k.
For targets: first look at 64.45k and 64.67k. If 65k can hold, then this bounce has a chance to continue higher.
Macro hasn’t fully turned暖. US 10-year yields are still above 4.5%, which remains pressure on risk assets.
However, the US Dollar Index has already fallen to around 100.77, and oil prices have also pulled back from their highs. The market’s panic about the US-Iran situation has not continued to escalate, which gives BTC a brief breather.
But the US-Iran risk hasn’t ended. Both sides are still discussing the Hormuz issue. Ceasefire has also been prone to reversals, and geopolitical headlines could bring another sharp drop and rebound at any time.
For ETFs, there were outflows in the past two days: on July 8, outflows totaled $84.90 million; on July 9, $95.30 million; but on July 10, it returned to net inflow of $90.40 million.
This rebound in flows is basically IBIT buying—single-day net inflow of $86.80 million—indicating institutional funds haven’t fully left; they’re just probing back and forth.
Be a bit mindful of on-chain liquidity. Over the past month, the total supply of USDT and USDC has decreased by roughly $13.9 billion. Incremental capital still isn’t sufficient, so even if there’s a bounce, it can’t be taken as a full-fledged rebound.
Tether’s Q2 BTC reserves still haven’t shown any新增 on-chain deposits so far. The market will be watching whether it’s slowing its coin-buying pace—this news is mildly negative/neutral.
Today, capital is also running into high-volatility meme plays. CASHCAT briefly surged to a market cap of $200 million, and Hyperliquid has listed its perpetuals/contracts. This suggests risk appetite has warmed up, but funds haven’t fully returned to BTC or major coins yet.
On the technicals: BTC is currently around 64.1k. The 1-hour RSI is 56, the 4-hour RSI is 60, and the daily RSI is 54. In the short term it’s not overheated, and 4-hour strength is still holding.
Price has moved back above the 20-EMA and 60-EMA on both the 1-hour and 4-hour charts. The 4-hour MACD continues to expand above the zero line, and the rebound structure hasn’t broken down.
The funding rate is only around 0.00013%. Open interest is about $1.96 billion, and longs aren’t crowded. At this level, the upside doesn’t face much pressure.
For resistance: the first level is 64.45k. After a breakout, look for 64.67k. Strong resistance remains at 65k.
For support: the first level is 64.0k to 63.7k. Strong support is at 63.5k.
My conclusion is to go long.
If you pull back to 64.0k–63.7k and it doesn’t break, you can continue to enter longs, with a stop-loss placed below 63.3k.
For targets: first look at 64.45k and 64.67k. If 65k can hold, then this bounce has a chance to continue higher.
Send a red envelope
Binance US stocks are really convenient!
Binance US stocks are really convenient!
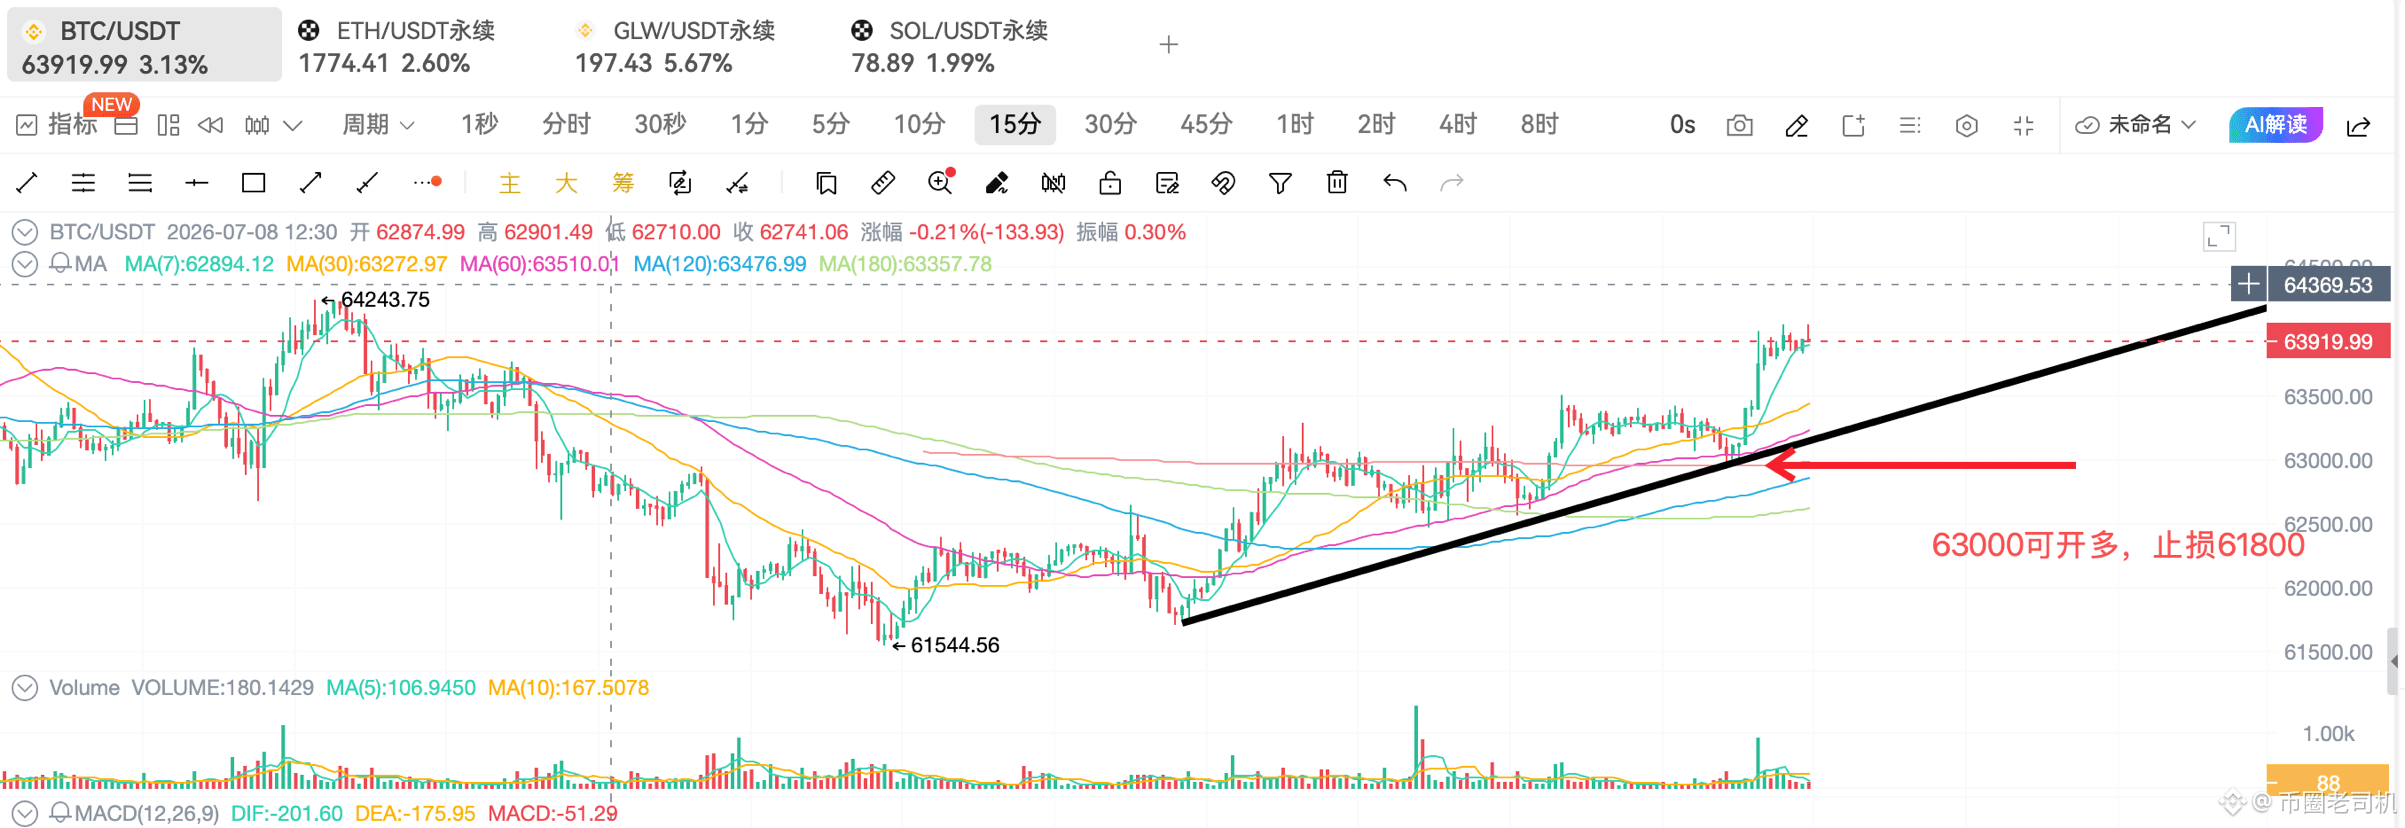
Still looking at a rebound this week. The bias is slightly bullish, but I wouldn’t suggest chasing directly around 64,000.
On the macro front, things aren’t particularly loose. The Fed’s latest meeting minutes show significant internal disagreement regarding inflation and the direction of rates, and rate-cut expectations haven’t fully been priced in yet.
The 10-year U.S. Treasury yield is around 4.55%, and the U.S. Dollar Index is near 100.94—both continue to weigh on BTC. So what we’re seeing now looks more like a liquidity repair, not a full-on bull market.
The recent headlines mainly involve the U.S.-Iran situation swinging back and forth. Oil prices and U.S. Treasury yields are likely to keep moving around, but BTC is still holding above 60,000 under these negatives, which suggests decent accumulation near the lows.
Also, Vanguard has started hiring a head for digital assets. That’s a longer-term positive, but this kind of news won’t immediately push the price up in the short run.
ETF flows haven’t fully turned strong either. Net inflows were $265 million on July 6, $21.5 million on July 7, net outflows of $84.9 million on July 8, and net outflows of $95.3 million on July 9. Institutional money is still moving cautiously—watching and waiting.
Technically, BTC is around 63.8k. The 1-hour RSI is 67, the 4-hour RSI is 60, and the daily RSI is 53. Overall it’s bullish, but the short-term is already a bit hot.
Price is trading above the 1-hour and 4-hour EMA20 and EMA60. The 4-hour MACD is also above the zero line and continues to expand, indicating the rebound structure hasn’t broken down.
That said, it has already climbed to the upper band of the 1-hour Bollinger Bands. 64,000 is the first resistance level. After breaking it, look toward 65,000. Strong resistance is at 68,000.
First support is at 63.1k–62.9k, and stronger support is at 62.2k.
The funding rate is only around 0.0053%, and open interest is roughly $1.93 billion. Longs are starting to warm up, but positioning isn’t especially crowded yet.
So my conclusion is: slightly bullish—don’t chase longs.
If you pull back to 63.1k–62.9k and it doesn’t break, you can keep looking for the rebound. Put your stop-loss below 61.8k.
If it holds and settles above 64,000 with volume, then continue to look toward 65,000 and 68,000.
On the macro front, things aren’t particularly loose. The Fed’s latest meeting minutes show significant internal disagreement regarding inflation and the direction of rates, and rate-cut expectations haven’t fully been priced in yet.
The 10-year U.S. Treasury yield is around 4.55%, and the U.S. Dollar Index is near 100.94—both continue to weigh on BTC. So what we’re seeing now looks more like a liquidity repair, not a full-on bull market.
The recent headlines mainly involve the U.S.-Iran situation swinging back and forth. Oil prices and U.S. Treasury yields are likely to keep moving around, but BTC is still holding above 60,000 under these negatives, which suggests decent accumulation near the lows.
Also, Vanguard has started hiring a head for digital assets. That’s a longer-term positive, but this kind of news won’t immediately push the price up in the short run.
ETF flows haven’t fully turned strong either. Net inflows were $265 million on July 6, $21.5 million on July 7, net outflows of $84.9 million on July 8, and net outflows of $95.3 million on July 9. Institutional money is still moving cautiously—watching and waiting.
Technically, BTC is around 63.8k. The 1-hour RSI is 67, the 4-hour RSI is 60, and the daily RSI is 53. Overall it’s bullish, but the short-term is already a bit hot.
Price is trading above the 1-hour and 4-hour EMA20 and EMA60. The 4-hour MACD is also above the zero line and continues to expand, indicating the rebound structure hasn’t broken down.
That said, it has already climbed to the upper band of the 1-hour Bollinger Bands. 64,000 is the first resistance level. After breaking it, look toward 65,000. Strong resistance is at 68,000.
First support is at 63.1k–62.9k, and stronger support is at 62.2k.
The funding rate is only around 0.0053%, and open interest is roughly $1.93 billion. Longs are starting to warm up, but positioning isn’t especially crowded yet.
So my conclusion is: slightly bullish—don’t chase longs.
If you pull back to 63.1k–62.9k and it doesn’t break, you can keep looking for the rebound. Put your stop-loss below 61.8k.
If it holds and settles above 64,000 with volume, then continue to look toward 65,000 and 68,000.
·
--
🎙️ US stocks surge, let's talk about US stocks!
End
01 h 01 m 42 s
643
0
Log in to explore more content