July 16 Market Analysis
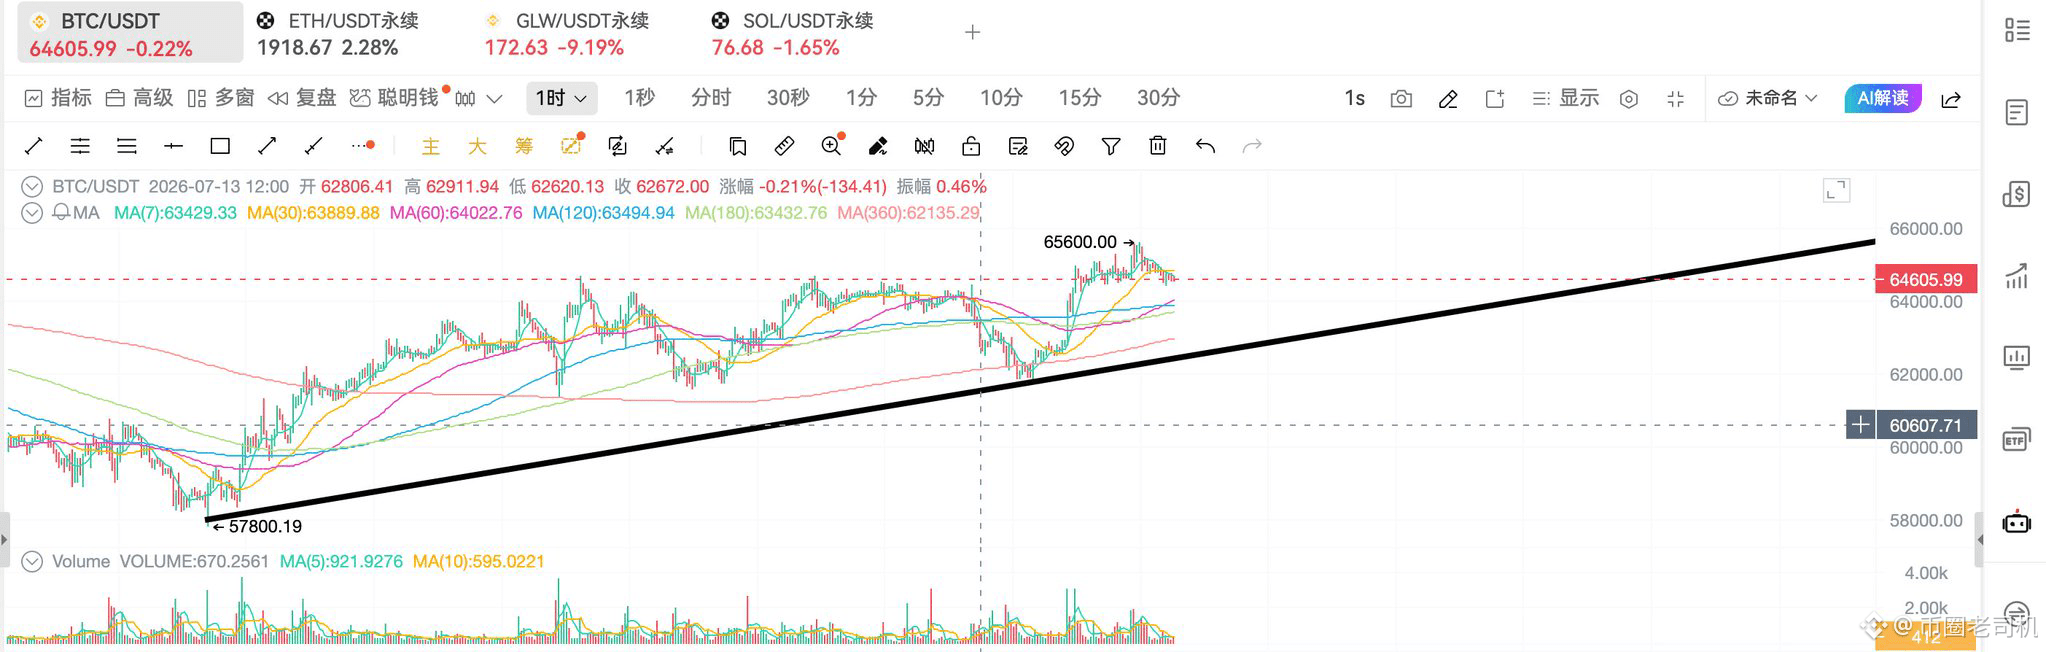
BTC is currently around 645,800. The 24-hour high is 655,900, the low is 643,700. After a push higher, it pulled back, but overall it is still trading above 640,000.
The technical outlook is bullish.
1-hour RSI is 47. Short-term momentum isn’t that strong. Price is temporarily capped below the EMA20 at 647,500, but it is still above the EMA60 at 643,500.
4-hour RSI is 56. Price is above the EMA20 at 641,800 and the EMA60 at 633,800.
The 4-hour MACD DIF is 401, DEA is 288, and the red histogram is still 227. The 4-hour rebound structure hasn’t broken down.
The 1-hour Bollinger Bands midline is 648,700, and the lower band is 643,900. The 643,000 to 640,000 area is the most critical short-term support today.
The contract funding rate is 0.0059%. Open interest is about $1.994 billion. The funding rate isn’t high, and the contract longs aren’t noticeably crowded.
ETF flows have returned for two consecutive days. On July 14, net inflow was $181.1 million. On July 15, it saw another $107.7 million inflow. In total over two days, it’s close to $289 million.
The macro environment is also a bit more comfortable than the past few days. The U.S. 10-year Treasury yield fell from 4.622% to 4.545%, and the U.S. Dollar Index dropped from 101.3 to 100.51—this is relatively favorable for BTC.
In the news, the SEC approved an increase in BlackRock’s spot BTC ETF options position and exercise limits to 1,000,000 contracts. Over the long run, this should increase institutional hedging and trading depth.
On-chain, there are two large movements in opposite directions. One is an address that has been dormant for eight years transferring 5,908 BTC (about $383 million). This could indicate potential sell pressure that we need to monitor.
The other is that whales continue buying roughly $170.5 million worth of BTC from Coinbase in accumulation, suggesting there is also demand around the 640,000 level.
U.S. June PPI month-on-month is -0.3%, below expectations. This gives risk assets some breathing room in the short term, but Powell is still emphasizing the inflation issue—rate expectations can still fluctuate.
Middle East risks haven’t fully disappeared, but the U.S. military said the latest round of actions has ended. For now, geopolitical headlines haven’t further escalated into direct sell pressure for BTC.
In terms of liquidity, both the BTC liquidity index over the past 24 hours and the current BTC liquidity index are “Buy,” but overall market liquidity is still “Hold.” This suggests BTC is stronger than the broader market, and altcoins shouldn’t be too aggressive for now.
Go long directly.
Don’t chase above 65,000. If there’s a pullback to 64,300–64,000 and it doesn’t break, you can consider going long.
The first target is 65,600. After a breakout, look for 66,100.
Place the stop-loss below 63,900.
BTC is currently around 645,800. The 24-hour high is 655,900, the low is 643,700. After a push higher, it pulled back, but overall it is still trading above 640,000.
The technical outlook is bullish.
1-hour RSI is 47. Short-term momentum isn’t that strong. Price is temporarily capped below the EMA20 at 647,500, but it is still above the EMA60 at 643,500.
4-hour RSI is 56. Price is above the EMA20 at 641,800 and the EMA60 at 633,800.
The 4-hour MACD DIF is 401, DEA is 288, and the red histogram is still 227. The 4-hour rebound structure hasn’t broken down.
The 1-hour Bollinger Bands midline is 648,700, and the lower band is 643,900. The 643,000 to 640,000 area is the most critical short-term support today.
The contract funding rate is 0.0059%. Open interest is about $1.994 billion. The funding rate isn’t high, and the contract longs aren’t noticeably crowded.
ETF flows have returned for two consecutive days. On July 14, net inflow was $181.1 million. On July 15, it saw another $107.7 million inflow. In total over two days, it’s close to $289 million.
The macro environment is also a bit more comfortable than the past few days. The U.S. 10-year Treasury yield fell from 4.622% to 4.545%, and the U.S. Dollar Index dropped from 101.3 to 100.51—this is relatively favorable for BTC.
In the news, the SEC approved an increase in BlackRock’s spot BTC ETF options position and exercise limits to 1,000,000 contracts. Over the long run, this should increase institutional hedging and trading depth.
On-chain, there are two large movements in opposite directions. One is an address that has been dormant for eight years transferring 5,908 BTC (about $383 million). This could indicate potential sell pressure that we need to monitor.
The other is that whales continue buying roughly $170.5 million worth of BTC from Coinbase in accumulation, suggesting there is also demand around the 640,000 level.
U.S. June PPI month-on-month is -0.3%, below expectations. This gives risk assets some breathing room in the short term, but Powell is still emphasizing the inflation issue—rate expectations can still fluctuate.
Middle East risks haven’t fully disappeared, but the U.S. military said the latest round of actions has ended. For now, geopolitical headlines haven’t further escalated into direct sell pressure for BTC.
In terms of liquidity, both the BTC liquidity index over the past 24 hours and the current BTC liquidity index are “Buy,” but overall market liquidity is still “Hold.” This suggests BTC is stronger than the broader market, and altcoins shouldn’t be too aggressive for now.
Go long directly.
Don’t chase above 65,000. If there’s a pullback to 64,300–64,000 and it doesn’t break, you can consider going long.
The first target is 65,600. After a breakout, look for 66,100.
Place the stop-loss below 63,900.