

Pelin Ay 1
140 Posts

Pelin Ay 1
Report
Block User
TRADER-ANALİST-YAZAR
0 Following
1 Followers
0 Liked
Posts
·
--
What’s Behind the Sharp Rise on SOON?
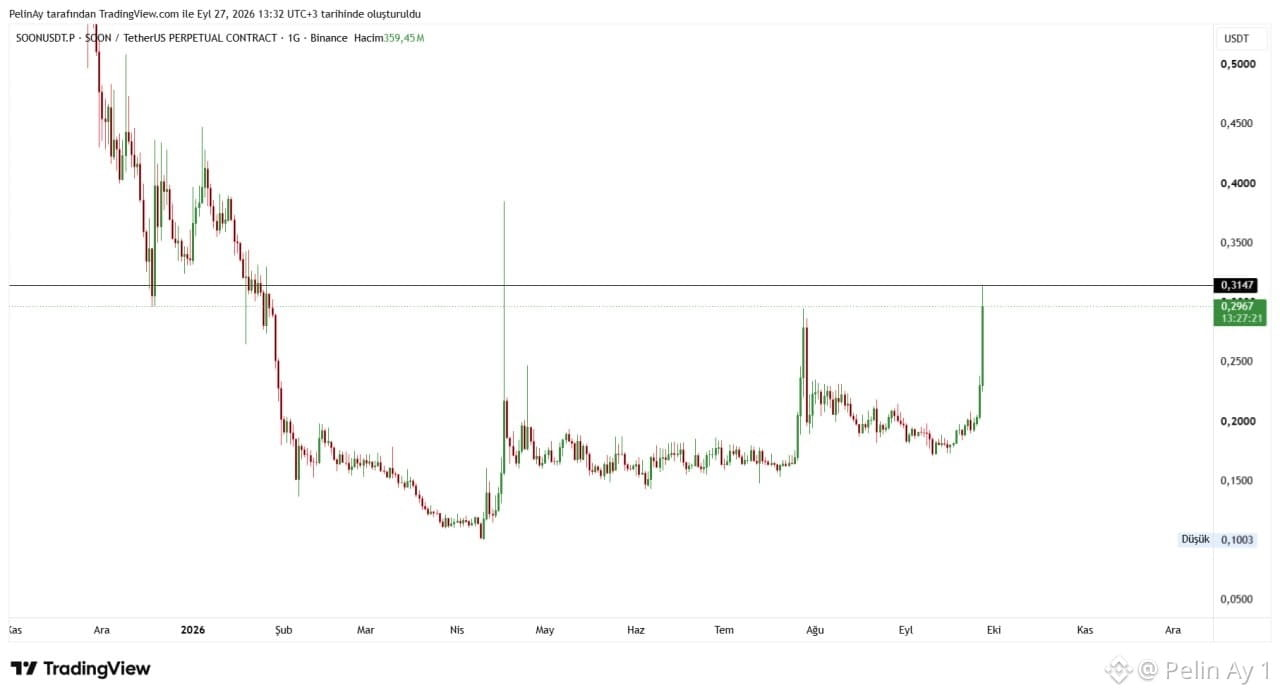
On the SOON chart, especially in the last section, after a long consolidation in the 0.18–0,20$ band, we see a very sharp upward breakout. In the chart, the price rose from around 0,18$ to 0.2967$, making a move of over 60% in a short time. Moreover, the formation of a long wick on the daily candle testing the 0,3147$ resistance suggests that there are significant sell orders in this area.
One of the most important developments that could explain this move was the unlock of 20.24 million SOON tokens that took place on September 23. This amount was equivalent to about 3.6% of the circulating supply. After this unlock, which initially created selling pressure, the fact that the price then rose strongly again suggests that the market’s sell orders may have been absorbed.
In addition, SOON’s core story continues. The project runs an SVM-based rollup infrastructure on Ethereum, BNB Chain, and Base; the TON–Solana connection via InterSOON is also active. This multi-L1 approach is one of the factors that could bring speculative demand to SOON, especially if the SVM narrative regains attention.
In CMC’s September 26 analysis, it was also noted that there was no specific, confirmed factor for the rally and that the move may have been strengthened by relatively low speculative flows. Therefore, it may be more accurate to assess the current move as being driven by the reduction of sell pressure after the unlock, low liquidity, technical breakout effects, and speculative trading.
On the chart, 0.3147 is a critical resistance level. If a daily close occurs above this zone, the continuity of the breakout could strengthen; however, if rejected, profit-taking could be seen toward 0.25–0.26 and then the 0.20–0,22$ zone. Considering the high Binance volume shown on the chart, it should be taken into account that the move may have been amplified not only by spot demand but also by leveraged trades. $SOON #SOON
What’s Behind the Sharp Rise on SOON?
On the SOON chart, especially in the last section, after a long consolidation in the 0.18–0,20$ band, we see a very sharp upward breakout. In the chart, the price rose from around 0,18$ to 0.2967$, making a move of over 60% in a short time. Moreover, the formation of a long wick on the daily candle testing the 0,3147$ resistance suggests that there are significant sell orders in this area.
One of the most important developments that could explain this move was the unlock of 20.24 million SOON tokens that took place on September 23. This amount was equivalent to about 3.6% of the circulating supply. After this unlock, which initially created selling pressure, the fact that the price then rose strongly again suggests that the market’s sell orders may have been absorbed.
In addition, SOON’s core story continues. The project runs an SVM-based rollup infrastructure on Ethereum, BNB Chain, and Base; the TON–Solana connection via InterSOON is also active. This multi-L1 approach is one of the factors that could bring speculative demand to SOON, especially if the SVM narrative regains attention.
In CMC’s September 26 analysis, it was also noted that there was no specific, confirmed factor for the rally and that the move may have been strengthened by relatively low speculative flows. Therefore, it may be more accurate to assess the current move as being driven by the reduction of sell pressure after the unlock, low liquidity, technical breakout effects, and speculative trading.
On the chart, 0.3147 is a critical resistance level. If a daily close occurs above this zone, the continuity of the breakout could strengthen; however, if rejected, profit-taking could be seen toward 0.25–0.26 and then the 0.20–0,22$ zone. Considering the high Binance volume shown on the chart, it should be taken into account that the move may have been amplified not only by spot demand but also by leveraged trades. $SOON #SOON
On the SOON chart, especially in the last section, after a long consolidation in the 0.18–0,20$ band, we see a very sharp upward breakout. In the chart, the price rose from around 0,18$ to 0.2967$, making a move of over 60% in a short time. Moreover, the formation of a long wick on the daily candle testing the 0,3147$ resistance suggests that there are significant sell orders in this area.
One of the most important developments that could explain this move was the unlock of 20.24 million SOON tokens that took place on September 23. This amount was equivalent to about 3.6% of the circulating supply. After this unlock, which initially created selling pressure, the fact that the price then rose strongly again suggests that the market’s sell orders may have been absorbed.
In addition, SOON’s core story continues. The project runs an SVM-based rollup infrastructure on Ethereum, BNB Chain, and Base; the TON–Solana connection via InterSOON is also active. This multi-L1 approach is one of the factors that could bring speculative demand to SOON, especially if the SVM narrative regains attention.
In CMC’s September 26 analysis, it was also noted that there was no specific, confirmed factor for the rally and that the move may have been strengthened by relatively low speculative flows. Therefore, it may be more accurate to assess the current move as being driven by the reduction of sell pressure after the unlock, low liquidity, technical breakout effects, and speculative trading.
On the chart, 0.3147 is a critical resistance level. If a daily close occurs above this zone, the continuity of the breakout could strengthen; however, if rejected, profit-taking could be seen toward 0.25–0.26 and then the 0.20–0,22$ zone. Considering the high Binance volume shown on the chart, it should be taken into account that the move may have been amplified not only by spot demand but also by leveraged trades. $SOON #SOON
89
·
--
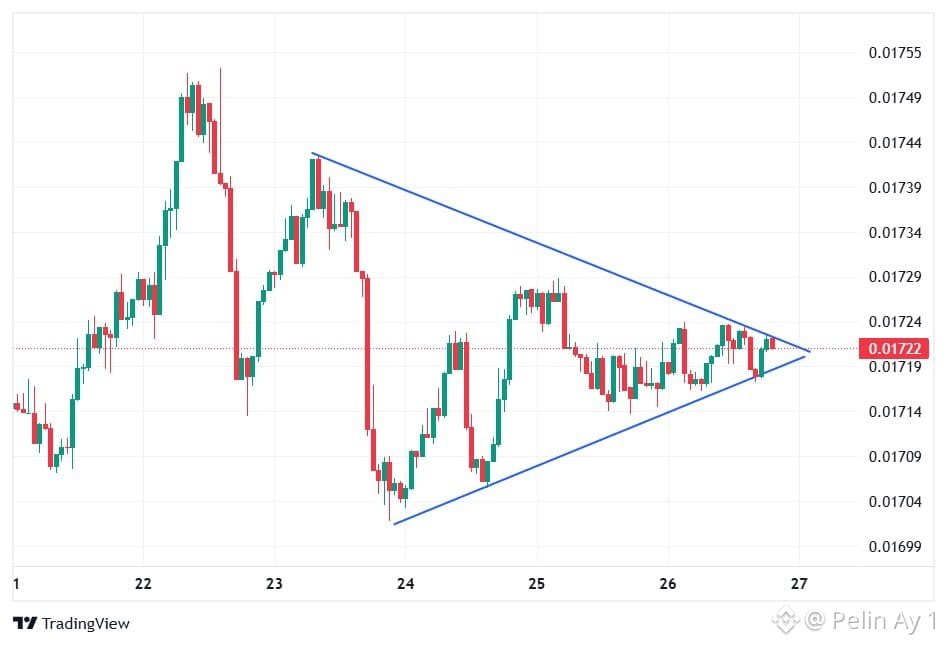
The symmetric triangle formation in the Sun chart is intriguing. The price is strongly compressed around the 0.01722 level.
In symmetric triangles, the breakout direction is initially unclear and is mostly determined by the trading volume during the breakout. It is important for confirmation of the pattern that investors see a noticeable increase in volume in the direction where the trendline breaks before making their trading decisions.
SUN is a one-stop DeFi platform built on the TRON blockchain that supports stablecoin swaps, token mining, and decentralized governance (DAO).
Latest News and Ecosystem Developments
SunX Ecosystem Expansion: SunPerp, the decentralized perpetual trading platform, was rebranded as SunX in November 2025 to evolve into a comprehensive trading ecosystem.
Buyback and Burn Transparency: In April 2026, SUN.io released a public control panel that allows the buyback and burn program to be tracked on-chain. Revenues generated from products such as SunSwap, SunPump, and SunX are automatically used to buy and burn SUN tokens from the market. As of the end of August 2026, more than 678 million SUN tokens—equivalent to approximately 3.4% of the total supply—have been permanently removed from circulation.
Shift Toward AI Infrastructure: In a strategic live stream held on September 3, 2026, it was announced that SUN’s narrative of AI infrastructure was incorporated by discussing projects related to decentralized compute routing and AI gateways together with ecosystem partners.
Justin Sun Academic Award: TRON founder Justin Sun announced on September 16, 2026 the launch of a zero-trust, decentralized academic awards system, including a prize pool of up to $1 million for solving fundamental mathematics problems. This development aims to increase ecosystem prestige by drawing academic and institutional capital interest to the TRON network, where the SUN token is one of the core DeFi assets. #sun $SUN
The symmetric triangle formation in the Sun chart is intriguing. The price is strongly compressed around the 0.01722 level.
In symmetric triangles, the breakout direction is initially unclear and is mostly determined by the trading volume during the breakout. It is important for confirmation of the pattern that investors see a noticeable increase in volume in the direction where the trendline breaks before making their trading decisions.
SUN is a one-stop DeFi platform built on the TRON blockchain that supports stablecoin swaps, token mining, and decentralized governance (DAO).
Latest News and Ecosystem Developments
SunX Ecosystem Expansion: SunPerp, the decentralized perpetual trading platform, was rebranded as SunX in November 2025 to evolve into a comprehensive trading ecosystem.
Buyback and Burn Transparency: In April 2026, SUN.io released a public control panel that allows the buyback and burn program to be tracked on-chain. Revenues generated from products such as SunSwap, SunPump, and SunX are automatically used to buy and burn SUN tokens from the market. As of the end of August 2026, more than 678 million SUN tokens—equivalent to approximately 3.4% of the total supply—have been permanently removed from circulation.
Shift Toward AI Infrastructure: In a strategic live stream held on September 3, 2026, it was announced that SUN’s narrative of AI infrastructure was incorporated by discussing projects related to decentralized compute routing and AI gateways together with ecosystem partners.
Justin Sun Academic Award: TRON founder Justin Sun announced on September 16, 2026 the launch of a zero-trust, decentralized academic awards system, including a prize pool of up to $1 million for solving fundamental mathematics problems. This development aims to increase ecosystem prestige by drawing academic and institutional capital interest to the TRON network, where the SUN token is one of the core DeFi assets. #sun $SUN
In symmetric triangles, the breakout direction is initially unclear and is mostly determined by the trading volume during the breakout. It is important for confirmation of the pattern that investors see a noticeable increase in volume in the direction where the trendline breaks before making their trading decisions.
SUN is a one-stop DeFi platform built on the TRON blockchain that supports stablecoin swaps, token mining, and decentralized governance (DAO).
Latest News and Ecosystem Developments
SunX Ecosystem Expansion: SunPerp, the decentralized perpetual trading platform, was rebranded as SunX in November 2025 to evolve into a comprehensive trading ecosystem.
Buyback and Burn Transparency: In April 2026, SUN.io released a public control panel that allows the buyback and burn program to be tracked on-chain. Revenues generated from products such as SunSwap, SunPump, and SunX are automatically used to buy and burn SUN tokens from the market. As of the end of August 2026, more than 678 million SUN tokens—equivalent to approximately 3.4% of the total supply—have been permanently removed from circulation.
Shift Toward AI Infrastructure: In a strategic live stream held on September 3, 2026, it was announced that SUN’s narrative of AI infrastructure was incorporated by discussing projects related to decentralized compute routing and AI gateways together with ecosystem partners.
Justin Sun Academic Award: TRON founder Justin Sun announced on September 16, 2026 the launch of a zero-trust, decentralized academic awards system, including a prize pool of up to $1 million for solving fundamental mathematics problems. This development aims to increase ecosystem prestige by drawing academic and institutional capital interest to the TRON network, where the SUN token is one of the core DeFi assets. #sun $SUN
45
·
--
FLOKI’s Critical Resistance Test: Eyes on the 0,000031 Zone
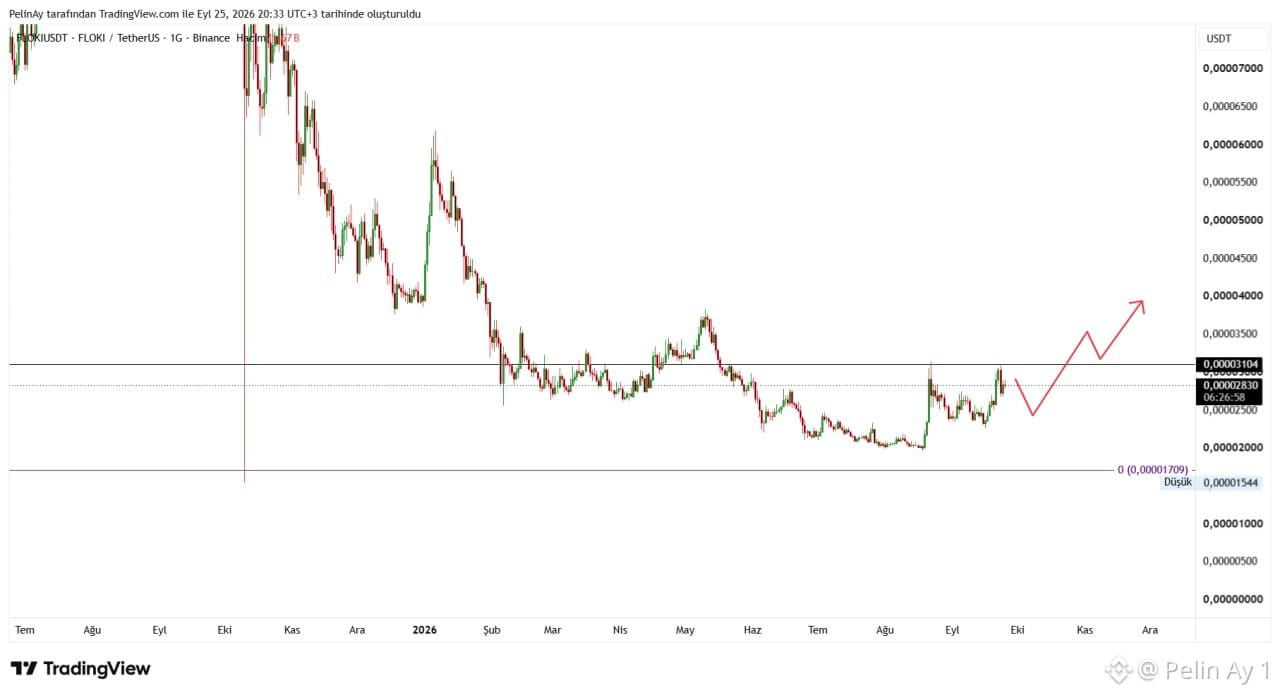
After a long-standing downtrend on FLOKI’s daily chart, a strong base has formed in the 0,000019–0,000020 area. With the recovery that began after August, the price has moved back into the 0,000028–0,000031 range. The current price on the chart is approximately at the 0,00002830 level, and horizontal resistance around 0,00003104 is being tested.
The critical point here is whether FLOKI can post a daily close above the 0,000031 level. If this zone is broken through with volume, then, in line with the scenario drawn on the chart, first 0,000035 and then the 0,000038–0,000040 area could come into focus. On the other hand, if selling emerges at resistance, the 0,000025–0,000026 zone would be the first support; below that, the 0,000020 area may be watched as an important base.
On the fundamentals side, there is also a notable new development. As of September 24, FLOKI became eligible to be used as collateral for USDC borrowings on Morpho. The integration carried out via API3 is moving FLOKI’s use case into the DeFi lending segment.
In addition, in CoinMarketCap’s September 24 analysis, it was stated that if FLOKI stays above $0.000027, the $0.000030 area could be tested; however, if this support is lost, around $0.000025 could come into play.
In summary, from a technical perspective, FLOKI is at an important decision zone. Sustained strength above 0,000031 could pave the way for a move toward 0,000035 and 0,000038/0,000040 on the chart. But if it is rejected at resistance, the risk of a short-term correction remains. The Morpho integration is an important development that, beyond the technical structure, shows FLOKI’s DeFi use cases are expanding. $FLOKI #floki
FLOKI’s Critical Resistance Test: Eyes on the 0,000031 Zone
After a long-standing downtrend on FLOKI’s daily chart, a strong base has formed in the 0,000019–0,000020 area. With the recovery that began after August, the price has moved back into the 0,000028–0,000031 range. The current price on the chart is approximately at the 0,00002830 level, and horizontal resistance around 0,00003104 is being tested.
The critical point here is whether FLOKI can post a daily close above the 0,000031 level. If this zone is broken through with volume, then, in line with the scenario drawn on the chart, first 0,000035 and then the 0,000038–0,000040 area could come into focus. On the other hand, if selling emerges at resistance, the 0,000025–0,000026 zone would be the first support; below that, the 0,000020 area may be watched as an important base.
On the fundamentals side, there is also a notable new development. As of September 24, FLOKI became eligible to be used as collateral for USDC borrowings on Morpho. The integration carried out via API3 is moving FLOKI’s use case into the DeFi lending segment.
In addition, in CoinMarketCap’s September 24 analysis, it was stated that if FLOKI stays above $0.000027, the $0.000030 area could be tested; however, if this support is lost, around $0.000025 could come into play.
In summary, from a technical perspective, FLOKI is at an important decision zone. Sustained strength above 0,000031 could pave the way for a move toward 0,000035 and 0,000038/0,000040 on the chart. But if it is rejected at resistance, the risk of a short-term correction remains. The Morpho integration is an important development that, beyond the technical structure, shows FLOKI’s DeFi use cases are expanding. $FLOKI #floki
After a long-standing downtrend on FLOKI’s daily chart, a strong base has formed in the 0,000019–0,000020 area. With the recovery that began after August, the price has moved back into the 0,000028–0,000031 range. The current price on the chart is approximately at the 0,00002830 level, and horizontal resistance around 0,00003104 is being tested.
The critical point here is whether FLOKI can post a daily close above the 0,000031 level. If this zone is broken through with volume, then, in line with the scenario drawn on the chart, first 0,000035 and then the 0,000038–0,000040 area could come into focus. On the other hand, if selling emerges at resistance, the 0,000025–0,000026 zone would be the first support; below that, the 0,000020 area may be watched as an important base.
On the fundamentals side, there is also a notable new development. As of September 24, FLOKI became eligible to be used as collateral for USDC borrowings on Morpho. The integration carried out via API3 is moving FLOKI’s use case into the DeFi lending segment.
In addition, in CoinMarketCap’s September 24 analysis, it was stated that if FLOKI stays above $0.000027, the $0.000030 area could be tested; however, if this support is lost, around $0.000025 could come into play.
In summary, from a technical perspective, FLOKI is at an important decision zone. Sustained strength above 0,000031 could pave the way for a move toward 0,000035 and 0,000038/0,000040 on the chart. But if it is rejected at resistance, the risk of a short-term correction remains. The Morpho integration is an important development that, beyond the technical structure, shows FLOKI’s DeFi use cases are expanding. $FLOKI #floki
36
·
--
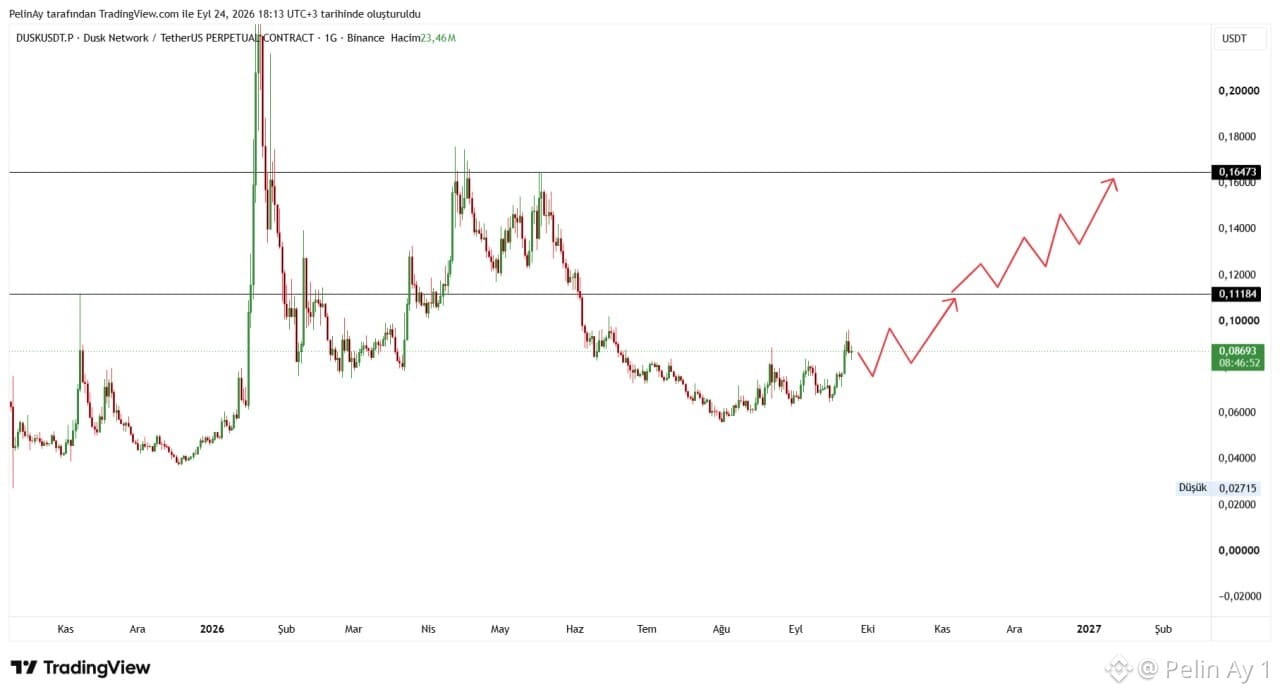
On the DUSK/USDT chart, the long-term outlook draws attention with a notable recovery structure. The chart shows that it entered an uptrend after August. The current price is at approximately the 0,0869$ level on the chart.
Technically, the first important zone is 0,10$ , followed by the 0,11184$ level, which is marked on the chart as a horizontal resistance. If daily closes arrive above this zone, there may be room for the price to move toward the 0,12–0,14$ band, where heavy trading previously took place. The main resistance on the chart is at 0,16473$ . Therefore, if 0,1118$ is broken, the next key area to watch in the medium term will be 0,1647$ . Conversely, in order to preserve the current bullish structure, price action around 0,08$ is important; below that, especially the 0,06–0,07$ zone could come back into focus.
There are also current developments on the project side. The latest post dated September 15, officially published by Dusk, focuses on the interoperability of RWA across different blockchains. Dusk aims for the issuance of real-world assets—such as securities and fund shares—directly on the blockchain and for these assets to be used with applications on other chains. Dusk also leverages Chainlink CCIP, DataLink, and Data Streams integrations.
On the project’s technical side, the Boreas upgrade in 2026 has been deployed on the mainnet. DUSK is also positioned as the local token used in the network’s transaction fees and staking mechanism. According to Dusk’s documentation, the total supply model was designed to start with 500 million DUSK and, over time, emissions would cap it at a maximum of 1 billion DUSK.
In summary, the project’s improvements around RWA, regulated finance, and cross-chain interoperability are among the key developments that support the story shown in the price chart.
$DUSK #DUSK
On the DUSK/USDT chart, the long-term outlook draws attention with a notable recovery structure. The chart shows that it entered an uptrend after August. The current price is at approximately the 0,0869$ level on the chart.
Technically, the first important zone is 0,10$ , followed by the 0,11184$ level, which is marked on the chart as a horizontal resistance. If daily closes arrive above this zone, there may be room for the price to move toward the 0,12–0,14$ band, where heavy trading previously took place. The main resistance on the chart is at 0,16473$ . Therefore, if 0,1118$ is broken, the next key area to watch in the medium term will be 0,1647$ . Conversely, in order to preserve the current bullish structure, price action around 0,08$ is important; below that, especially the 0,06–0,07$ zone could come back into focus.
There are also current developments on the project side. The latest post dated September 15, officially published by Dusk, focuses on the interoperability of RWA across different blockchains. Dusk aims for the issuance of real-world assets—such as securities and fund shares—directly on the blockchain and for these assets to be used with applications on other chains. Dusk also leverages Chainlink CCIP, DataLink, and Data Streams integrations.
On the project’s technical side, the Boreas upgrade in 2026 has been deployed on the mainnet. DUSK is also positioned as the local token used in the network’s transaction fees and staking mechanism. According to Dusk’s documentation, the total supply model was designed to start with 500 million DUSK and, over time, emissions would cap it at a maximum of 1 billion DUSK.
In summary, the project’s improvements around RWA, regulated finance, and cross-chain interoperability are among the key developments that support the story shown in the price chart.
$DUSK #DUSK
Technically, the first important zone is 0,10$ , followed by the 0,11184$ level, which is marked on the chart as a horizontal resistance. If daily closes arrive above this zone, there may be room for the price to move toward the 0,12–0,14$ band, where heavy trading previously took place. The main resistance on the chart is at 0,16473$ . Therefore, if 0,1118$ is broken, the next key area to watch in the medium term will be 0,1647$ . Conversely, in order to preserve the current bullish structure, price action around 0,08$ is important; below that, especially the 0,06–0,07$ zone could come back into focus.
There are also current developments on the project side. The latest post dated September 15, officially published by Dusk, focuses on the interoperability of RWA across different blockchains. Dusk aims for the issuance of real-world assets—such as securities and fund shares—directly on the blockchain and for these assets to be used with applications on other chains. Dusk also leverages Chainlink CCIP, DataLink, and Data Streams integrations.
On the project’s technical side, the Boreas upgrade in 2026 has been deployed on the mainnet. DUSK is also positioned as the local token used in the network’s transaction fees and staking mechanism. According to Dusk’s documentation, the total supply model was designed to start with 500 million DUSK and, over time, emissions would cap it at a maximum of 1 billion DUSK.
In summary, the project’s improvements around RWA, regulated finance, and cross-chain interoperability are among the key developments that support the story shown in the price chart.
$DUSK #DUSK
55
·
--
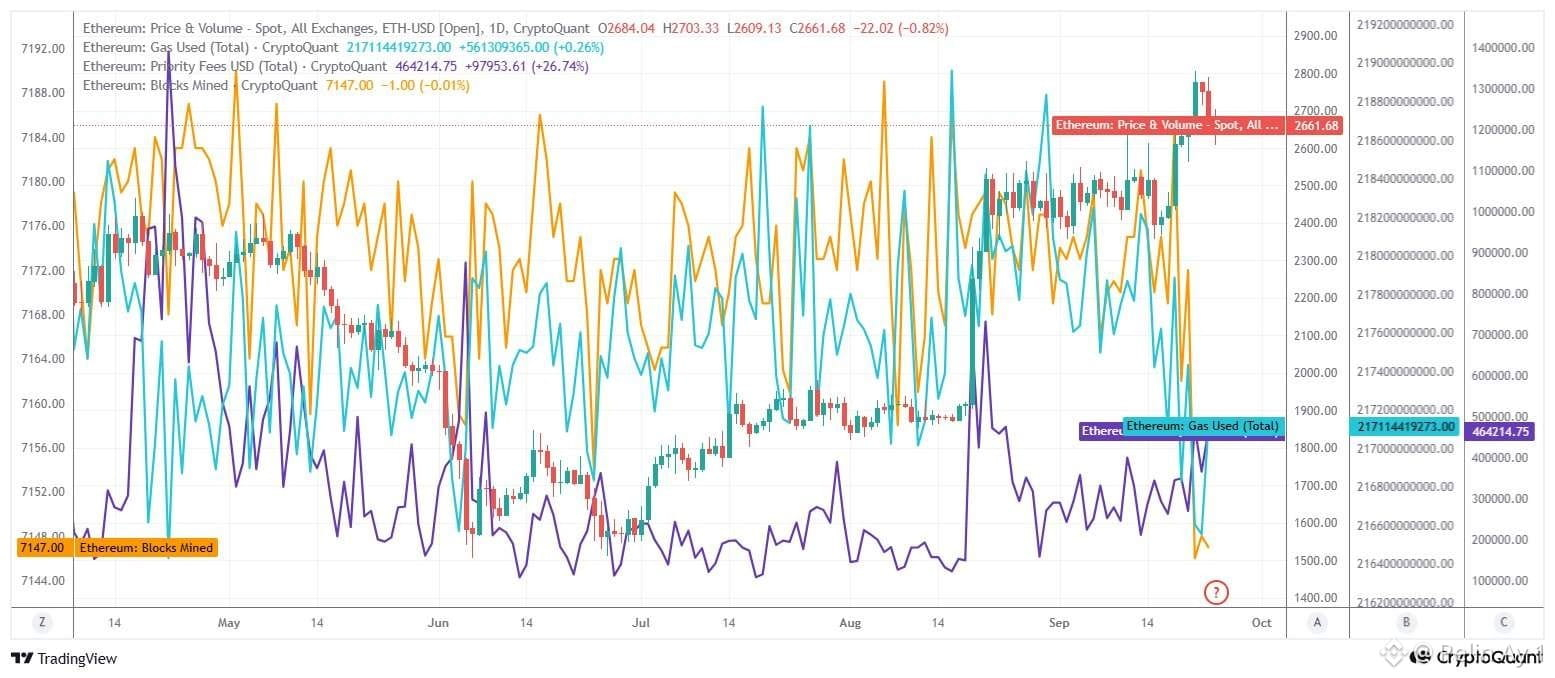
Ethereum’s network usage is still strong. The ETH price has risen from the approximate 1,900 dollar area to 2,800 dollars in the latest part of the chart, before pulling back to around 2,660 dollars. Meanwhile, the Gas Used side is at roughly 217.1 billion and shows a 0.26% increase in the latest data. What matters here is that even though the price has pulled back, there is no clear crash in gas usage. This indicates that transaction demand on the Ethereum network has not disappeared completely along with the price.
The latest Priority Fees value is around 464 thousand dollars, with a daily change of a 26.74% increase. While Gas Used is up only 0.26%, Priority Fees rising by over 26% is a notable divergence. This could suggest that users are starting to pay higher priority fees to validators to get their transactions processed faster. In other words, it looks like not only the number of transactions, but also the fee people are willing to pay for block space, has increased. This could form a positive usage signal specifically for ETH, because it suggests that economic activity on Ethereum is not only driven by speculative price movements.
Blocks Mined is around the 7,147 level and is almost flat.
This data indicates that there hasn’t been a significant increase in the number of blocks produced by the network. Therefore, the movement in Gas Used and Priority Fees is not mainly due to more blocks being generated, but rather because existing blocks are being used more heavily and competition for block space is increasing.
If the 2,600–2,650$ area is maintained, keeping network usage high and allowing Priority Fees to continue rising could help ensure that the current pullback remains only a correction. In that case, it may come up that the price could retest the 2,700–2,800$ area again.
The structure I see on the chart right now shows that during the period when ETH rose from around 1,900$ to 2,800$, network usage—and especially Priority Fees—strengthened significantly. However, the latest price falling from $2,800 back to around $2,660$ suggests that the upward move has lost momentum in the short term. $ETH #Ethereum
Ethereum’s network usage is still strong. The ETH price has risen from the approximate 1,900 dollar area to 2,800 dollars in the latest part of the chart, before pulling back to around 2,660 dollars. Meanwhile, the Gas Used side is at roughly 217.1 billion and shows a 0.26% increase in the latest data. What matters here is that even though the price has pulled back, there is no clear crash in gas usage. This indicates that transaction demand on the Ethereum network has not disappeared completely along with the price.
The latest Priority Fees value is around 464 thousand dollars, with a daily change of a 26.74% increase. While Gas Used is up only 0.26%, Priority Fees rising by over 26% is a notable divergence. This could suggest that users are starting to pay higher priority fees to validators to get their transactions processed faster. In other words, it looks like not only the number of transactions, but also the fee people are willing to pay for block space, has increased. This could form a positive usage signal specifically for ETH, because it suggests that economic activity on Ethereum is not only driven by speculative price movements.
Blocks Mined is around the 7,147 level and is almost flat.
This data indicates that there hasn’t been a significant increase in the number of blocks produced by the network. Therefore, the movement in Gas Used and Priority Fees is not mainly due to more blocks being generated, but rather because existing blocks are being used more heavily and competition for block space is increasing.
If the 2,600–2,650$ area is maintained, keeping network usage high and allowing Priority Fees to continue rising could help ensure that the current pullback remains only a correction. In that case, it may come up that the price could retest the 2,700–2,800$ area again.
The structure I see on the chart right now shows that during the period when ETH rose from around 1,900$ to 2,800$, network usage—and especially Priority Fees—strengthened significantly. However, the latest price falling from $2,800 back to around $2,660$ suggests that the upward move has lost momentum in the short term. $ETH #Ethereum
The latest Priority Fees value is around 464 thousand dollars, with a daily change of a 26.74% increase. While Gas Used is up only 0.26%, Priority Fees rising by over 26% is a notable divergence. This could suggest that users are starting to pay higher priority fees to validators to get their transactions processed faster. In other words, it looks like not only the number of transactions, but also the fee people are willing to pay for block space, has increased. This could form a positive usage signal specifically for ETH, because it suggests that economic activity on Ethereum is not only driven by speculative price movements.
Blocks Mined is around the 7,147 level and is almost flat.
This data indicates that there hasn’t been a significant increase in the number of blocks produced by the network. Therefore, the movement in Gas Used and Priority Fees is not mainly due to more blocks being generated, but rather because existing blocks are being used more heavily and competition for block space is increasing.
If the 2,600–2,650$ area is maintained, keeping network usage high and allowing Priority Fees to continue rising could help ensure that the current pullback remains only a correction. In that case, it may come up that the price could retest the 2,700–2,800$ area again.
The structure I see on the chart right now shows that during the period when ETH rose from around 1,900$ to 2,800$, network usage—and especially Priority Fees—strengthened significantly. However, the latest price falling from $2,800 back to around $2,660$ suggests that the upward move has lost momentum in the short term. $ETH #Ethereum
59
·
--
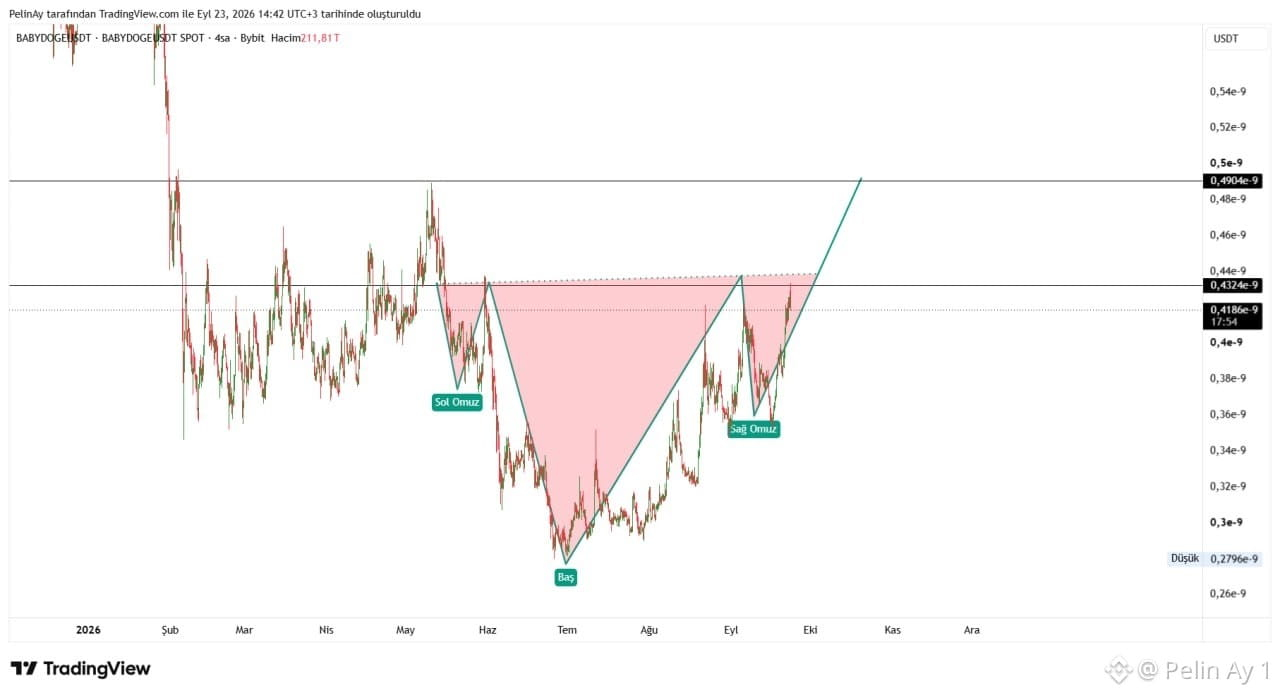
A highly notable Inverted Head-and-Shoulders (IHS) structure appears to be forming on the BABYDOGE/USDT chart.
As of now, the price is around 0.4186 × 10⁻⁹, just below the neckline. Therefore, the most important area for BABYDOGE is the 0.4324 × 10⁻⁹ resistance. A breakout from this level with strong volume and 4-hour closes above it could technically confirm the pattern. After such a break, the first significant target on the chart stands out as the 0.49 × 10⁻⁹ zone. In the classic measurement method for the pattern, when the distance from the head to the neckline is projected upward, a higher theoretical target area also emerges; however, for that to happen, the neckline must first be broken and held above it permanently.
On the other hand, the 0.40 × 10⁻⁹ and 0.38 × 10⁻⁹ zones can be monitored as short-term support. Especially if the price continues to hold below the right-shoulder area, it could weaken the pattern’s overall look.
Meanwhile, on the fundamentals side, BABYDOGE is also trying not to remain just a classic meme coin. In the project’s current ecosystem, there are products such as BabyDoge Swap, Puppyfun meme token launchpad, a cross-chain bridge, and an eSim service. According to the project’s official website, the token is available not only on BNB Chain, but also on Solana, TON, and Base, and it states that roughly 51% of the total supply has been burned.
More importantly, the announcement on September 14, 2026 that BabyDoge acquired LimeWire is one of the most striking developments for the project recently. According to the announcement, this move aims to expand BabyDoge’s ecosystem in terms of products and Web3 direction.
In summary, on the BABYDOGE chart, the key point of the story right now is the 0.4324 × 10⁻⁹ neckline. If this level is broken, the upside room created by the pattern could expand; however, if price sees renewed selling pressure at resistance, it may pull back again toward the 0.40–0.38 × 10⁻⁹ support zones. Therefore, at the current level, the main thing to watch is not only whether the price rises, but whether the 0.4324 region breaks upward with volume and sustains that breakout. $BabyDoge #BabyDoge
A highly notable Inverted Head-and-Shoulders (IHS) structure appears to be forming on the BABYDOGE/USDT chart.
As of now, the price is around 0.4186 × 10⁻⁹, just below the neckline. Therefore, the most important area for BABYDOGE is the 0.4324 × 10⁻⁹ resistance. A breakout from this level with strong volume and 4-hour closes above it could technically confirm the pattern. After such a break, the first significant target on the chart stands out as the 0.49 × 10⁻⁹ zone. In the classic measurement method for the pattern, when the distance from the head to the neckline is projected upward, a higher theoretical target area also emerges; however, for that to happen, the neckline must first be broken and held above it permanently.
On the other hand, the 0.40 × 10⁻⁹ and 0.38 × 10⁻⁹ zones can be monitored as short-term support. Especially if the price continues to hold below the right-shoulder area, it could weaken the pattern’s overall look.
Meanwhile, on the fundamentals side, BABYDOGE is also trying not to remain just a classic meme coin. In the project’s current ecosystem, there are products such as BabyDoge Swap, Puppyfun meme token launchpad, a cross-chain bridge, and an eSim service. According to the project’s official website, the token is available not only on BNB Chain, but also on Solana, TON, and Base, and it states that roughly 51% of the total supply has been burned.
More importantly, the announcement on September 14, 2026 that BabyDoge acquired LimeWire is one of the most striking developments for the project recently. According to the announcement, this move aims to expand BabyDoge’s ecosystem in terms of products and Web3 direction.
In summary, on the BABYDOGE chart, the key point of the story right now is the 0.4324 × 10⁻⁹ neckline. If this level is broken, the upside room created by the pattern could expand; however, if price sees renewed selling pressure at resistance, it may pull back again toward the 0.40–0.38 × 10⁻⁹ support zones. Therefore, at the current level, the main thing to watch is not only whether the price rises, but whether the 0.4324 region breaks upward with volume and sustains that breakout. $BabyDoge #BabyDoge
As of now, the price is around 0.4186 × 10⁻⁹, just below the neckline. Therefore, the most important area for BABYDOGE is the 0.4324 × 10⁻⁹ resistance. A breakout from this level with strong volume and 4-hour closes above it could technically confirm the pattern. After such a break, the first significant target on the chart stands out as the 0.49 × 10⁻⁹ zone. In the classic measurement method for the pattern, when the distance from the head to the neckline is projected upward, a higher theoretical target area also emerges; however, for that to happen, the neckline must first be broken and held above it permanently.
On the other hand, the 0.40 × 10⁻⁹ and 0.38 × 10⁻⁹ zones can be monitored as short-term support. Especially if the price continues to hold below the right-shoulder area, it could weaken the pattern’s overall look.
Meanwhile, on the fundamentals side, BABYDOGE is also trying not to remain just a classic meme coin. In the project’s current ecosystem, there are products such as BabyDoge Swap, Puppyfun meme token launchpad, a cross-chain bridge, and an eSim service. According to the project’s official website, the token is available not only on BNB Chain, but also on Solana, TON, and Base, and it states that roughly 51% of the total supply has been burned.
More importantly, the announcement on September 14, 2026 that BabyDoge acquired LimeWire is one of the most striking developments for the project recently. According to the announcement, this move aims to expand BabyDoge’s ecosystem in terms of products and Web3 direction.
In summary, on the BABYDOGE chart, the key point of the story right now is the 0.4324 × 10⁻⁹ neckline. If this level is broken, the upside room created by the pattern could expand; however, if price sees renewed selling pressure at resistance, it may pull back again toward the 0.40–0.38 × 10⁻⁹ support zones. Therefore, at the current level, the main thing to watch is not only whether the price rises, but whether the 0.4324 region breaks upward with volume and sustains that breakout. $BabyDoge #BabyDoge
98
·
--
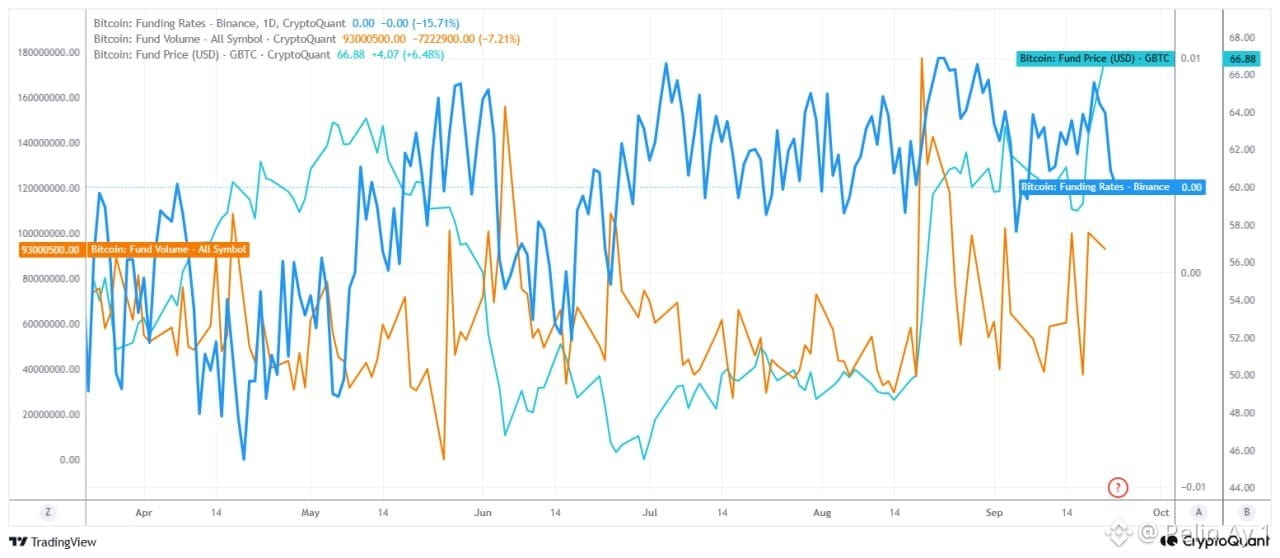
In this chart, I think the most important point is that the Funding Rate has returned to the 0.00 level. This indicates that leveraged positions in Bitcoin's derivatives market have been significantly balanced.
In the current market data, the Binance BTC funding rate is around 0.001%. Therefore, the current picture is different from the scenario we saw in the past—where prices rose, everyone opened longs, funding became excessively high, and long liquidations followed. In such an environment, if the price continues to rise, the market may move forward in a healthier way.
Fund Volume has increased to the 93 million level. This tells us that the market is seeing more trading and fund activity again. The fact that Funding remains low at the same time as volume increases suggests that this activity is not being supported by extreme long leverage.
GBTC Fun Price has risen to the 66.88 level. Therefore, the rise in the GBTC price along with the recovery in fund volume can be considered as an additional signal that activity on the institutional side is increasing.
Just by looking at this chart, I do not see a signal that a strong renewed drop is about to begin. In fact, the current funding structure has an important advantage: funding is not excessively positive, there is no large long crowd, and the risk of long liquidation is limited.
To summarize the current view of the chart: In Bitcoin's derivatives market, excessive long positioning is not clearly evident right now. As the Funding Rate approaches 0.00, it suggests that leverage pressure has been cleaned up and the market has become more balanced. At the same time, the recovery in Fund Volume shows that market activity is increasing again. Therefore, looking only at this chart, there isn’t enough data to say that a new and sharp decline has started. In short, what is alarming for me right now is that the leverage side has become quite calm. This structure may indicate that if the price rises again, the move has not yet been supported by an overly crowded long position. #BTC $BTC
In this chart, I think the most important point is that the Funding Rate has returned to the 0.00 level. This indicates that leveraged positions in Bitcoin's derivatives market have been significantly balanced.
In the current market data, the Binance BTC funding rate is around 0.001%. Therefore, the current picture is different from the scenario we saw in the past—where prices rose, everyone opened longs, funding became excessively high, and long liquidations followed. In such an environment, if the price continues to rise, the market may move forward in a healthier way.
Fund Volume has increased to the 93 million level. This tells us that the market is seeing more trading and fund activity again. The fact that Funding remains low at the same time as volume increases suggests that this activity is not being supported by extreme long leverage.
GBTC Fun Price has risen to the 66.88 level. Therefore, the rise in the GBTC price along with the recovery in fund volume can be considered as an additional signal that activity on the institutional side is increasing.
Just by looking at this chart, I do not see a signal that a strong renewed drop is about to begin. In fact, the current funding structure has an important advantage: funding is not excessively positive, there is no large long crowd, and the risk of long liquidation is limited.
To summarize the current view of the chart: In Bitcoin's derivatives market, excessive long positioning is not clearly evident right now. As the Funding Rate approaches 0.00, it suggests that leverage pressure has been cleaned up and the market has become more balanced. At the same time, the recovery in Fund Volume shows that market activity is increasing again. Therefore, looking only at this chart, there isn’t enough data to say that a new and sharp decline has started. In short, what is alarming for me right now is that the leverage side has become quite calm. This structure may indicate that if the price rises again, the move has not yet been supported by an overly crowded long position. #BTC $BTC
In the current market data, the Binance BTC funding rate is around 0.001%. Therefore, the current picture is different from the scenario we saw in the past—where prices rose, everyone opened longs, funding became excessively high, and long liquidations followed. In such an environment, if the price continues to rise, the market may move forward in a healthier way.
Fund Volume has increased to the 93 million level. This tells us that the market is seeing more trading and fund activity again. The fact that Funding remains low at the same time as volume increases suggests that this activity is not being supported by extreme long leverage.
GBTC Fun Price has risen to the 66.88 level. Therefore, the rise in the GBTC price along with the recovery in fund volume can be considered as an additional signal that activity on the institutional side is increasing.
Just by looking at this chart, I do not see a signal that a strong renewed drop is about to begin. In fact, the current funding structure has an important advantage: funding is not excessively positive, there is no large long crowd, and the risk of long liquidation is limited.
To summarize the current view of the chart: In Bitcoin's derivatives market, excessive long positioning is not clearly evident right now. As the Funding Rate approaches 0.00, it suggests that leverage pressure has been cleaned up and the market has become more balanced. At the same time, the recovery in Fund Volume shows that market activity is increasing again. Therefore, looking only at this chart, there isn’t enough data to say that a new and sharp decline has started. In short, what is alarming for me right now is that the leverage side has become quite calm. This structure may indicate that if the price rises again, the move has not yet been supported by an overly crowded long position. #BTC $BTC
68
·
--
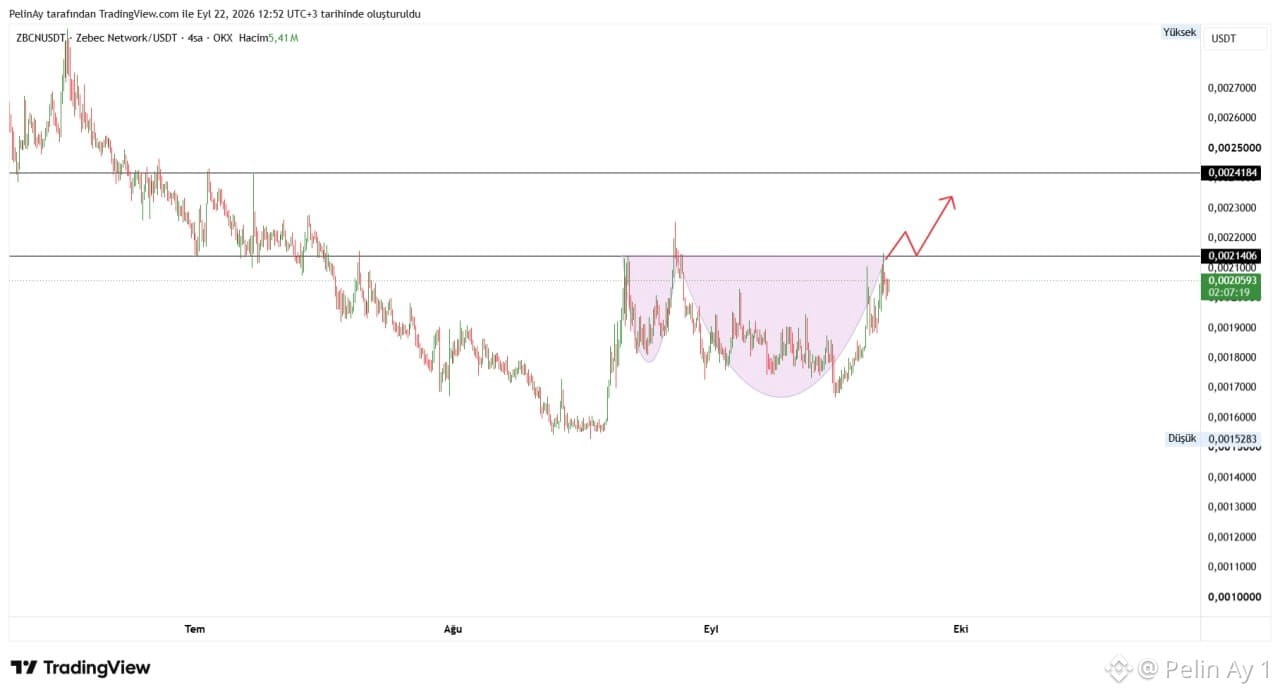
After a long-lasting decline trend, it appears that a clear recovery has formed and a cup-handle structure has emerged. The fact that the price rose by reacting from approximately the $0.00165–0.00170$ area and subsequently began to form higher lows is noteworthy from a short-term structural perspective.
Currently, the price is around the 0.0020593 USDT level and is just below the key resistance of 0.0021406 USDT on the chart. This area is technically important because it has acted as a horizontal resistance where the price has struggled multiple times before. If 4-hour closes come in above 0,0021406$ , the likelihood of the formation getting bullish confirmation may increase. In such a scenario, the first targets could be $0,00220–$0,00230, followed by the stronger 0,0024184 resistance on the chart. If 0,0024184 is also broken with substantial volume, considering the extent of the prior price move, the 0,00250–0,00260 zone could come into focus.
In Zebec’s 2026 Q1 report, it is stated that SuperApp’s payroll, cards, staking, payments, and treasury management are consolidated into a single platform; it also reported approximately $49 million in monthly payroll volume, serving 13,100 employees and 243 corporate customers. The same report mentions that the 100,000 ZBCN holder milestone has been surpassed and that the most recent token unlock process was completed in March. It can be seen that Zebec announced progress to use AllUnity’s EURAU stablecoin on Stellar for digital payments on September 16, and on September 9, it announced a partnership that expands access to corporate payroll and global fiat off-ramp on the Stellar network with MoneyGram. Additionally, Zebec stated in September that its ZBCN buyback program is no longer limited only to Zebec Cards revenue; Cards, SuperApp, and Zebec payroll net revenues are included in the buyback program. $ZBCN #ZBCN
After a long-lasting decline trend, it appears that a clear recovery has formed and a cup-handle structure has emerged. The fact that the price rose by reacting from approximately the $0.00165–0.00170$ area and subsequently began to form higher lows is noteworthy from a short-term structural perspective.
Currently, the price is around the 0.0020593 USDT level and is just below the key resistance of 0.0021406 USDT on the chart. This area is technically important because it has acted as a horizontal resistance where the price has struggled multiple times before. If 4-hour closes come in above 0,0021406$ , the likelihood of the formation getting bullish confirmation may increase. In such a scenario, the first targets could be $0,00220–$0,00230, followed by the stronger 0,0024184 resistance on the chart. If 0,0024184 is also broken with substantial volume, considering the extent of the prior price move, the 0,00250–0,00260 zone could come into focus.
In Zebec’s 2026 Q1 report, it is stated that SuperApp’s payroll, cards, staking, payments, and treasury management are consolidated into a single platform; it also reported approximately $49 million in monthly payroll volume, serving 13,100 employees and 243 corporate customers. The same report mentions that the 100,000 ZBCN holder milestone has been surpassed and that the most recent token unlock process was completed in March. It can be seen that Zebec announced progress to use AllUnity’s EURAU stablecoin on Stellar for digital payments on September 16, and on September 9, it announced a partnership that expands access to corporate payroll and global fiat off-ramp on the Stellar network with MoneyGram. Additionally, Zebec stated in September that its ZBCN buyback program is no longer limited only to Zebec Cards revenue; Cards, SuperApp, and Zebec payroll net revenues are included in the buyback program. $ZBCN #ZBCN
Currently, the price is around the 0.0020593 USDT level and is just below the key resistance of 0.0021406 USDT on the chart. This area is technically important because it has acted as a horizontal resistance where the price has struggled multiple times before. If 4-hour closes come in above 0,0021406$ , the likelihood of the formation getting bullish confirmation may increase. In such a scenario, the first targets could be $0,00220–$0,00230, followed by the stronger 0,0024184 resistance on the chart. If 0,0024184 is also broken with substantial volume, considering the extent of the prior price move, the 0,00250–0,00260 zone could come into focus.
In Zebec’s 2026 Q1 report, it is stated that SuperApp’s payroll, cards, staking, payments, and treasury management are consolidated into a single platform; it also reported approximately $49 million in monthly payroll volume, serving 13,100 employees and 243 corporate customers. The same report mentions that the 100,000 ZBCN holder milestone has been surpassed and that the most recent token unlock process was completed in March. It can be seen that Zebec announced progress to use AllUnity’s EURAU stablecoin on Stellar for digital payments on September 16, and on September 9, it announced a partnership that expands access to corporate payroll and global fiat off-ramp on the Stellar network with MoneyGram. Additionally, Zebec stated in September that its ZBCN buyback program is no longer limited only to Zebec Cards revenue; Cards, SuperApp, and Zebec payroll net revenues are included in the buyback program. $ZBCN #ZBCN
58
·
--
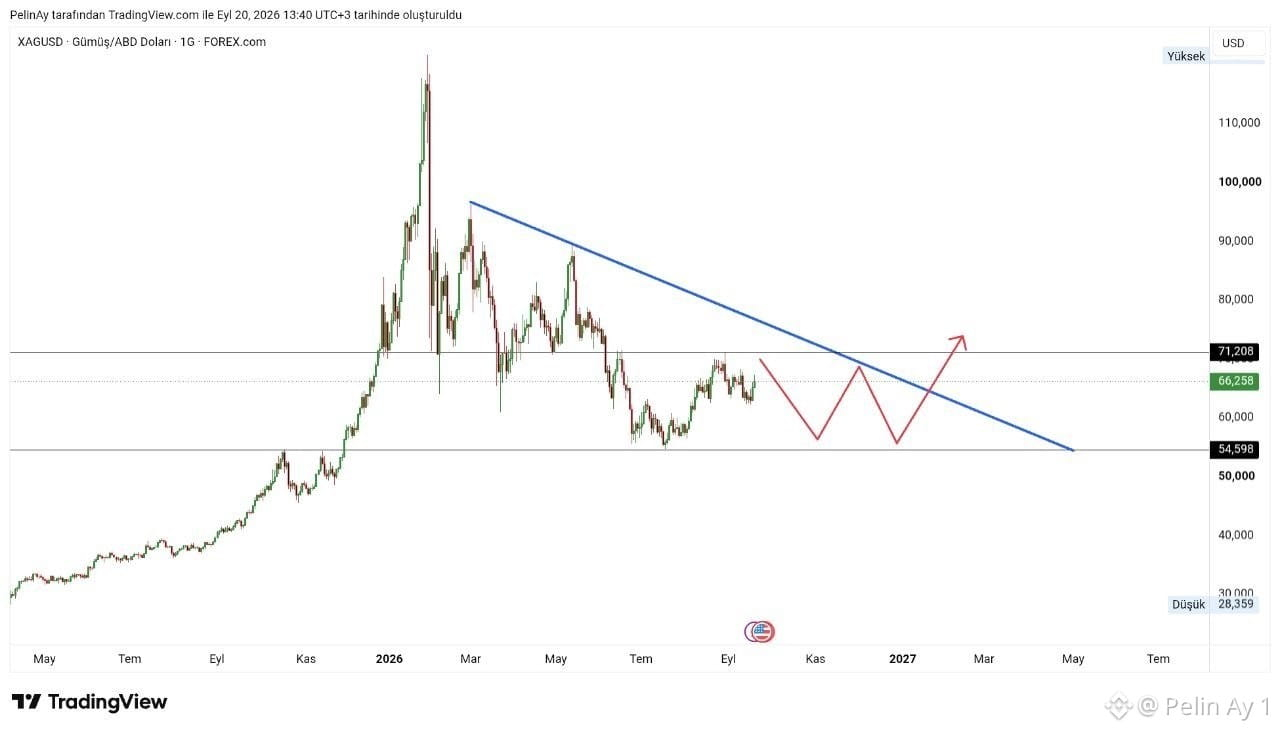
On the daily chart of silver, a clear correction stands out. The price rose above the 110 level in the first part of the year, then retreated below the 70 level after strong selling pressure. The descending trendline that formed during this process is positioned as a decisive resistance in silver’s medium-term price action.
The price is around 66.25. The 71.20 area just above the current price stands out as an important horizontal resistance. In addition, the descending trendline is also moving toward this zone, making the 71.20 level even more critical. Therefore, in order for silver to transition to a medium-term uptrend, it will be important not only to break above 71.20, but also to achieve daily closes above the descending trendline.
The 54.60 level is the key support. As long as the price holds above 54.60, it is possible to interpret the current move within a broad horizontal/consolidation pattern. Conversely, if 54.60 breaks down, selling pressure may intensify and lower levels could come into focus.
A possible price scenario on the chart is that, in the coming period, silver will fluctuate within the 55–71 dollar range and test the descending trendline. In particular, after price moves in the 60–65 area, a technical follow-up would be the renewed retest of the 71.20 resistance. Maintaining stability above 71.20 would mean breaking the descending trend, which could disrupt the falling peak structure on the chart. Following such a breakout, the upper target zone marked on the chart—73–75—and potentially even higher levels could come into play.
In summary, at this stage in silver, 54.60 support and 71.20 resistance should be monitored. Which of these two levels will break will play a critical role in determining the medium-term direction of price. The current structure has not yet fully turned into an uptrend; however, if 71.20 and the falling trendline are surpassed, the technical outlook could strengthen significantly. $XAG #XAGUSD
On the daily chart of silver, a clear correction stands out. The price rose above the 110 level in the first part of the year, then retreated below the 70 level after strong selling pressure. The descending trendline that formed during this process is positioned as a decisive resistance in silver’s medium-term price action.
The price is around 66.25. The 71.20 area just above the current price stands out as an important horizontal resistance. In addition, the descending trendline is also moving toward this zone, making the 71.20 level even more critical. Therefore, in order for silver to transition to a medium-term uptrend, it will be important not only to break above 71.20, but also to achieve daily closes above the descending trendline.
The 54.60 level is the key support. As long as the price holds above 54.60, it is possible to interpret the current move within a broad horizontal/consolidation pattern. Conversely, if 54.60 breaks down, selling pressure may intensify and lower levels could come into focus.
A possible price scenario on the chart is that, in the coming period, silver will fluctuate within the 55–71 dollar range and test the descending trendline. In particular, after price moves in the 60–65 area, a technical follow-up would be the renewed retest of the 71.20 resistance. Maintaining stability above 71.20 would mean breaking the descending trend, which could disrupt the falling peak structure on the chart. Following such a breakout, the upper target zone marked on the chart—73–75—and potentially even higher levels could come into play.
In summary, at this stage in silver, 54.60 support and 71.20 resistance should be monitored. Which of these two levels will break will play a critical role in determining the medium-term direction of price. The current structure has not yet fully turned into an uptrend; however, if 71.20 and the falling trendline are surpassed, the technical outlook could strengthen significantly. $XAG #XAGUSD
The price is around 66.25. The 71.20 area just above the current price stands out as an important horizontal resistance. In addition, the descending trendline is also moving toward this zone, making the 71.20 level even more critical. Therefore, in order for silver to transition to a medium-term uptrend, it will be important not only to break above 71.20, but also to achieve daily closes above the descending trendline.
The 54.60 level is the key support. As long as the price holds above 54.60, it is possible to interpret the current move within a broad horizontal/consolidation pattern. Conversely, if 54.60 breaks down, selling pressure may intensify and lower levels could come into focus.
A possible price scenario on the chart is that, in the coming period, silver will fluctuate within the 55–71 dollar range and test the descending trendline. In particular, after price moves in the 60–65 area, a technical follow-up would be the renewed retest of the 71.20 resistance. Maintaining stability above 71.20 would mean breaking the descending trend, which could disrupt the falling peak structure on the chart. Following such a breakout, the upper target zone marked on the chart—73–75—and potentially even higher levels could come into play.
In summary, at this stage in silver, 54.60 support and 71.20 resistance should be monitored. Which of these two levels will break will play a critical role in determining the medium-term direction of price. The current structure has not yet fully turned into an uptrend; however, if 71.20 and the falling trendline are surpassed, the technical outlook could strengthen significantly. $XAG #XAGUSD
52
·
--
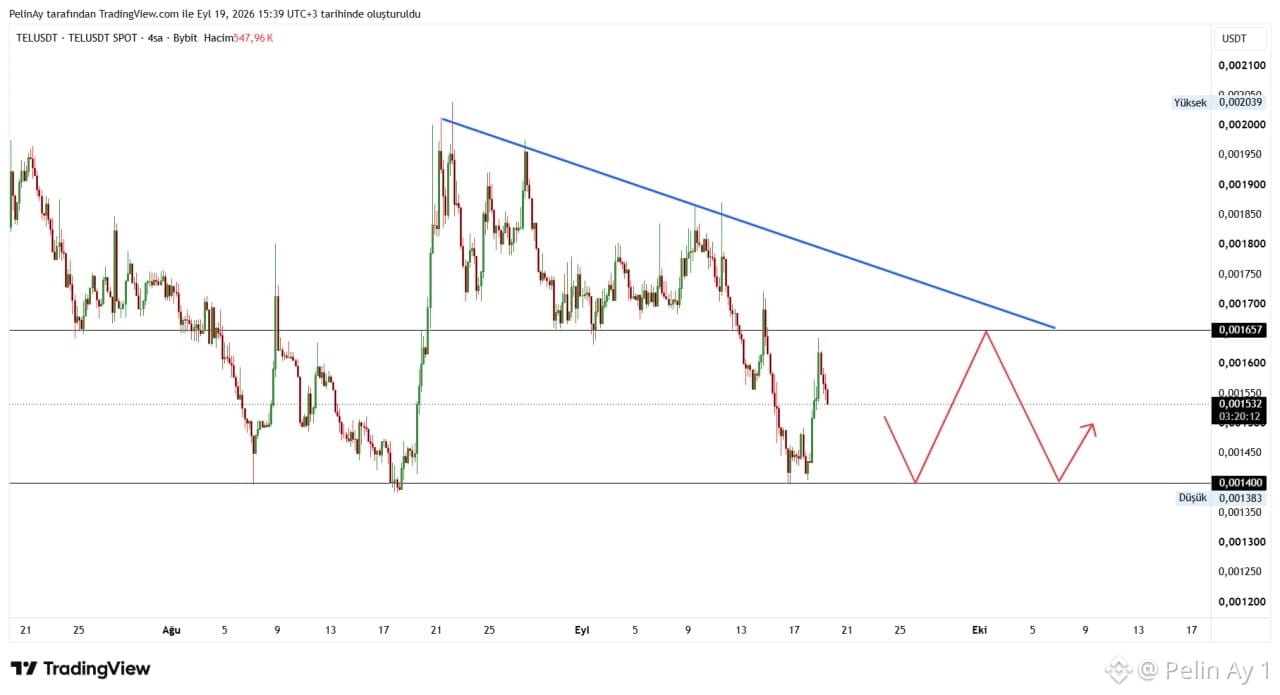
In the TEL/USDT chart, the short-term outlook is negative. Price is moving below the descending trendline since the end of August; this suggests that selling pressure may continue during rebound rallies. On the chart, 0,001532$ stands out as a support level and 0,001400$ as the main support zone. If price holds above 0,001400$ , a recovery toward 0,00153$ and then 0,001657$ could be seen. Conversely, 4-hour closes below 0,001400$ may deepen the sell-off and bring lower price areas into focus. For the bullish scenario to gain strength, it is important to break the 0,001657$ resistance and the descending trendline with substantial volume.
Telcoin is a project aiming to combine mobile telecommunications with blockchain-based finance, offering features such as money transfers, a digital wallet, and stablecoin infrastructure. On the current front, the company announced that in June 2026 it launched regulated on-chain bank accounts in the U.S. linked to eUSD; this development may be viewed positively for the long-term usage narrative. However, the price impact of regulatory developments depends on market conditions and the pace of adoption. Therefore, along with technical levels, the direction of Bitcoin, volume, and news flow should be monitored. $TEL #TEL
In the TEL/USDT chart, the short-term outlook is negative. Price is moving below the descending trendline since the end of August; this suggests that selling pressure may continue during rebound rallies. On the chart, 0,001532$ stands out as a support level and 0,001400$ as the main support zone. If price holds above 0,001400$ , a recovery toward 0,00153$ and then 0,001657$ could be seen. Conversely, 4-hour closes below 0,001400$ may deepen the sell-off and bring lower price areas into focus. For the bullish scenario to gain strength, it is important to break the 0,001657$ resistance and the descending trendline with substantial volume.
Telcoin is a project aiming to combine mobile telecommunications with blockchain-based finance, offering features such as money transfers, a digital wallet, and stablecoin infrastructure. On the current front, the company announced that in June 2026 it launched regulated on-chain bank accounts in the U.S. linked to eUSD; this development may be viewed positively for the long-term usage narrative. However, the price impact of regulatory developments depends on market conditions and the pace of adoption. Therefore, along with technical levels, the direction of Bitcoin, volume, and news flow should be monitored. $TEL #TEL
Telcoin is a project aiming to combine mobile telecommunications with blockchain-based finance, offering features such as money transfers, a digital wallet, and stablecoin infrastructure. On the current front, the company announced that in June 2026 it launched regulated on-chain bank accounts in the U.S. linked to eUSD; this development may be viewed positively for the long-term usage narrative. However, the price impact of regulatory developments depends on market conditions and the pace of adoption. Therefore, along with technical levels, the direction of Bitcoin, volume, and news flow should be monitored. $TEL #TEL
76
·
--
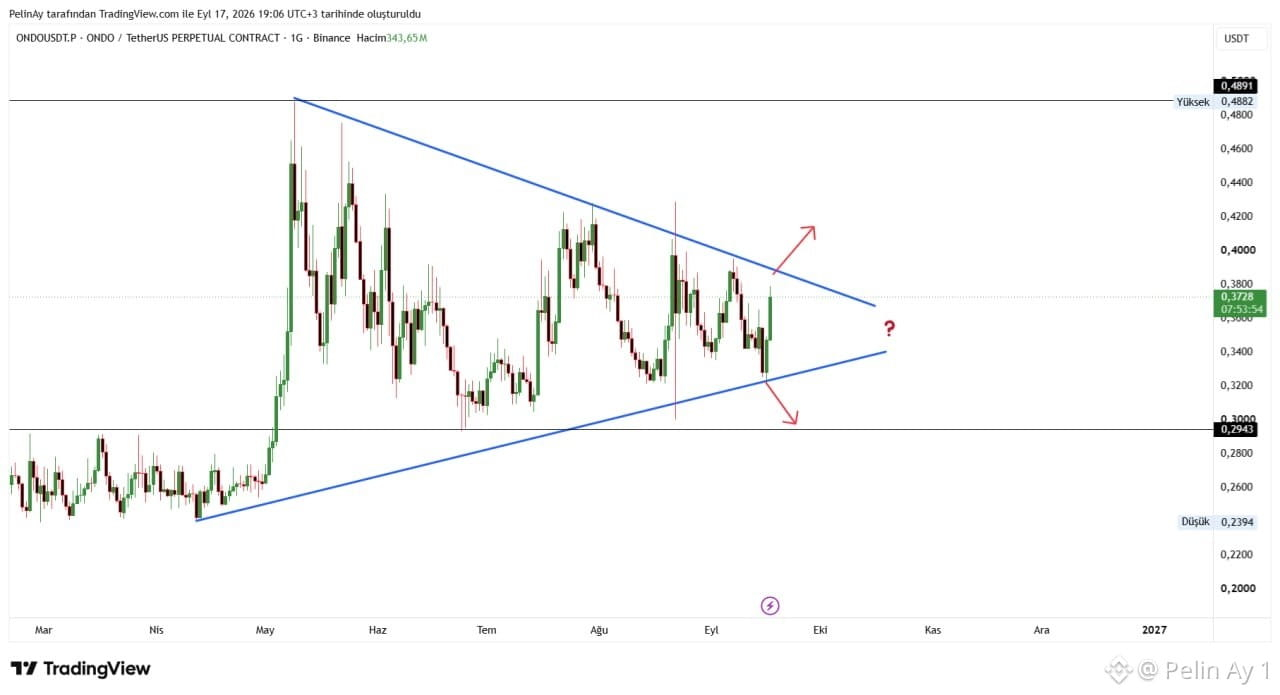
In the ONDOUSDT 1-day chart, the price is forming a symmetrical triangle between a descending resistance and an ascending support. The current price is around 0.373 USDT, close to the upper trendline; therefore, it is in the decision area. The rising of the recent lows and the strong reaction coming from the 0.32–0.34 range slightly increase the likelihood of an upside breakout in the short term. However, for a clear confirmation, the daily close must hold above 0.38–0.39 and then above 0.40 USDT. In this scenario, targets could be 0.42 and later the 0.48–0.49 resistance levels. Conversely, a high-volume break of the 0.32 support could indicate that the triangle is breaking downwards. The 0.294 and 0.24 areas should be watched. In triangles, direction is not certain; it’s important to confirm the breakout with volume and the daily close.
Ondo Finance is a finance infrastructure project focused on making real-world assets (RWA) accessible on the blockchain. Its ecosystem includes OUSG, which is tied to short-term U.S. Treasury bills, yield-focused USDY, and tokenized securities initiatives. The ONDO token is connected to the ecosystem through its governance dimension; buying the token does not mean directly owning these products or the underlying assets. The project’s strong story is that it bridges traditional institutional finance with on-chain markets; in contrast, regulation, access restrictions, token unlocks, and overall crypto market risk should be monitored carefully. $ONDO #ONDO
In the ONDOUSDT 1-day chart, the price is forming a symmetrical triangle between a descending resistance and an ascending support. The current price is around 0.373 USDT, close to the upper trendline; therefore, it is in the decision area. The rising of the recent lows and the strong reaction coming from the 0.32–0.34 range slightly increase the likelihood of an upside breakout in the short term. However, for a clear confirmation, the daily close must hold above 0.38–0.39 and then above 0.40 USDT. In this scenario, targets could be 0.42 and later the 0.48–0.49 resistance levels. Conversely, a high-volume break of the 0.32 support could indicate that the triangle is breaking downwards. The 0.294 and 0.24 areas should be watched. In triangles, direction is not certain; it’s important to confirm the breakout with volume and the daily close.
Ondo Finance is a finance infrastructure project focused on making real-world assets (RWA) accessible on the blockchain. Its ecosystem includes OUSG, which is tied to short-term U.S. Treasury bills, yield-focused USDY, and tokenized securities initiatives. The ONDO token is connected to the ecosystem through its governance dimension; buying the token does not mean directly owning these products or the underlying assets. The project’s strong story is that it bridges traditional institutional finance with on-chain markets; in contrast, regulation, access restrictions, token unlocks, and overall crypto market risk should be monitored carefully. $ONDO #ONDO
Ondo Finance is a finance infrastructure project focused on making real-world assets (RWA) accessible on the blockchain. Its ecosystem includes OUSG, which is tied to short-term U.S. Treasury bills, yield-focused USDY, and tokenized securities initiatives. The ONDO token is connected to the ecosystem through its governance dimension; buying the token does not mean directly owning these products or the underlying assets. The project’s strong story is that it bridges traditional institutional finance with on-chain markets; in contrast, regulation, access restrictions, token unlocks, and overall crypto market risk should be monitored carefully. $ONDO #ONDO
43
·
--
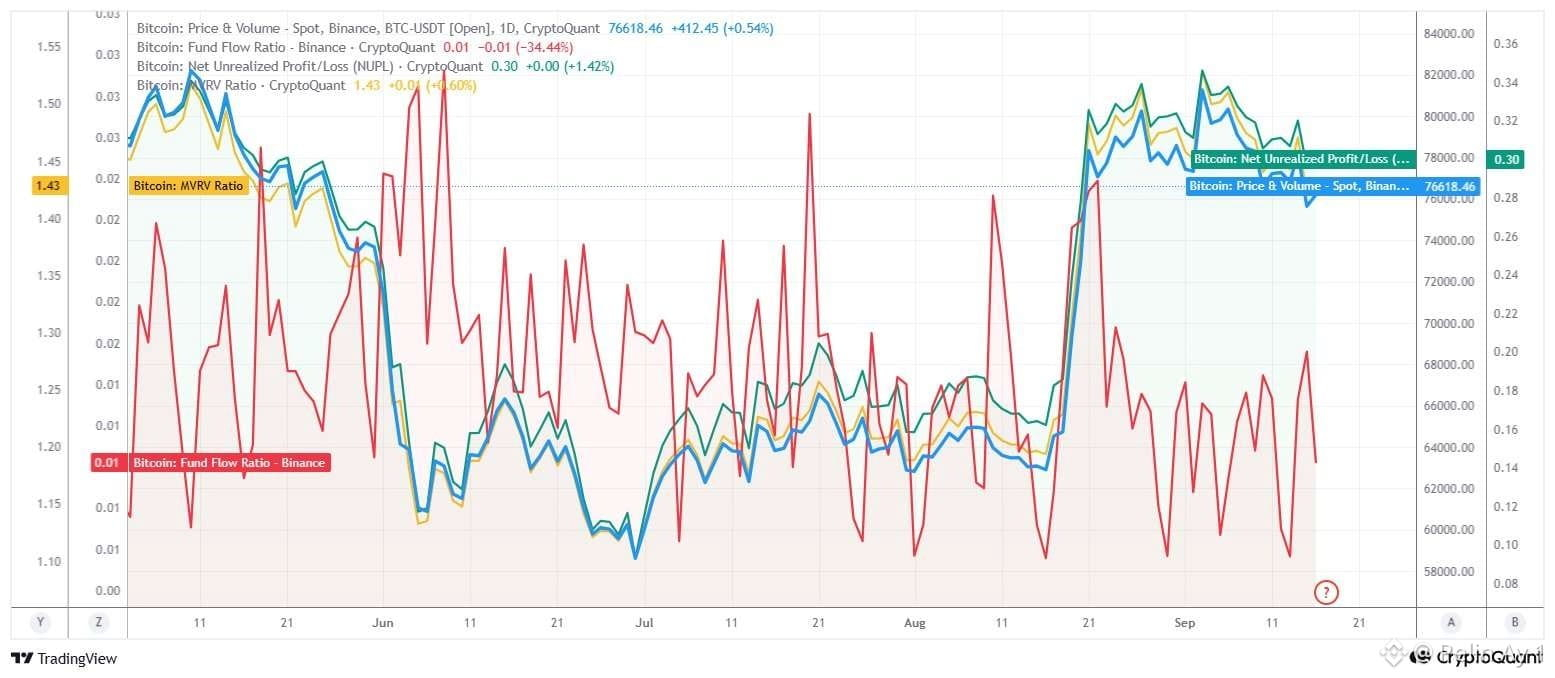
Bitcoin Is Falling Even Though the Sales Chart Doesn't Trigger an Alarm?
#Bitcoin price is around $76,618. After the sharp rise in mid-August from the 64K range to the 80–82K area, it pulled back into the 76–79K band and then went sideways.
Fund Flow Ratio is 0.01 and there is an approximate 34% daily drop. This suggests that a smaller portion of on-chain #BTC transfers is related to exchanges—meaning exchange-driven demand and sudden liquidity are low. In terms of this metric, it’s more a context of activity than a direct signal.
NUPL is 0.30. This indicates the market is, overall, in unrealized profit, but not in an overly euphoric phase. There is a risk of profit-taking, but there is no classic top-panic signal at the chart level.
MVRV is 1.43, meaning the market value is about 43% above the average investor’s cost basis. This points to a profitable market structure; historically, it isn’t an extreme level that would be considered outright overvaluation by itself. However, this profitability can still lead to panic selling.
After reading all this data, we can make some inferences regarding the impact on price.
First, even though reduced inflows and outflows to Binance may look positive, in my previous analyses, I shared that the historical peak in the exchange reserve was an important signal. In other words, even if inflows and outflows are down, the amount of Bitcoin held on exchanges is high enough that it can lead to selling within exchanges.
Especially if we assume the ratio of unrealized profit in the market is high, we can say these sell-offs could happen relatively easily.
Investors are nearly half above their BTC average costs—meaning the 43% BTC investors on Binance will have no hesitation to sell.
On top of that, considering the Fed’s rate-hike policy, it’s not surprising that investors are selling. I think the price is still expensive for many investors to buy. So, seeing further declines for a while would not be surprising. $BTC
Bitcoin Is Falling Even Though the Sales Chart Doesn't Trigger an Alarm?
#Bitcoin price is around $76,618. After the sharp rise in mid-August from the 64K range to the 80–82K area, it pulled back into the 76–79K band and then went sideways.
Fund Flow Ratio is 0.01 and there is an approximate 34% daily drop. This suggests that a smaller portion of on-chain #BTC transfers is related to exchanges—meaning exchange-driven demand and sudden liquidity are low. In terms of this metric, it’s more a context of activity than a direct signal.
NUPL is 0.30. This indicates the market is, overall, in unrealized profit, but not in an overly euphoric phase. There is a risk of profit-taking, but there is no classic top-panic signal at the chart level.
MVRV is 1.43, meaning the market value is about 43% above the average investor’s cost basis. This points to a profitable market structure; historically, it isn’t an extreme level that would be considered outright overvaluation by itself. However, this profitability can still lead to panic selling.
After reading all this data, we can make some inferences regarding the impact on price.
First, even though reduced inflows and outflows to Binance may look positive, in my previous analyses, I shared that the historical peak in the exchange reserve was an important signal. In other words, even if inflows and outflows are down, the amount of Bitcoin held on exchanges is high enough that it can lead to selling within exchanges.
Especially if we assume the ratio of unrealized profit in the market is high, we can say these sell-offs could happen relatively easily.
Investors are nearly half above their BTC average costs—meaning the 43% BTC investors on Binance will have no hesitation to sell.
On top of that, considering the Fed’s rate-hike policy, it’s not surprising that investors are selling. I think the price is still expensive for many investors to buy. So, seeing further declines for a while would not be surprising. $BTC
#Bitcoin price is around $76,618. After the sharp rise in mid-August from the 64K range to the 80–82K area, it pulled back into the 76–79K band and then went sideways.
Fund Flow Ratio is 0.01 and there is an approximate 34% daily drop. This suggests that a smaller portion of on-chain #BTC transfers is related to exchanges—meaning exchange-driven demand and sudden liquidity are low. In terms of this metric, it’s more a context of activity than a direct signal.
NUPL is 0.30. This indicates the market is, overall, in unrealized profit, but not in an overly euphoric phase. There is a risk of profit-taking, but there is no classic top-panic signal at the chart level.
MVRV is 1.43, meaning the market value is about 43% above the average investor’s cost basis. This points to a profitable market structure; historically, it isn’t an extreme level that would be considered outright overvaluation by itself. However, this profitability can still lead to panic selling.
After reading all this data, we can make some inferences regarding the impact on price.
First, even though reduced inflows and outflows to Binance may look positive, in my previous analyses, I shared that the historical peak in the exchange reserve was an important signal. In other words, even if inflows and outflows are down, the amount of Bitcoin held on exchanges is high enough that it can lead to selling within exchanges.
Especially if we assume the ratio of unrealized profit in the market is high, we can say these sell-offs could happen relatively easily.
Investors are nearly half above their BTC average costs—meaning the 43% BTC investors on Binance will have no hesitation to sell.
On top of that, considering the Fed’s rate-hike policy, it’s not surprising that investors are selling. I think the price is still expensive for many investors to buy. So, seeing further declines for a while would not be surprising. $BTC
69
·
--
The chart gives a constructive medium-term outlook for Bitcoin before the Fed decision, while in the short term it appears cautious.
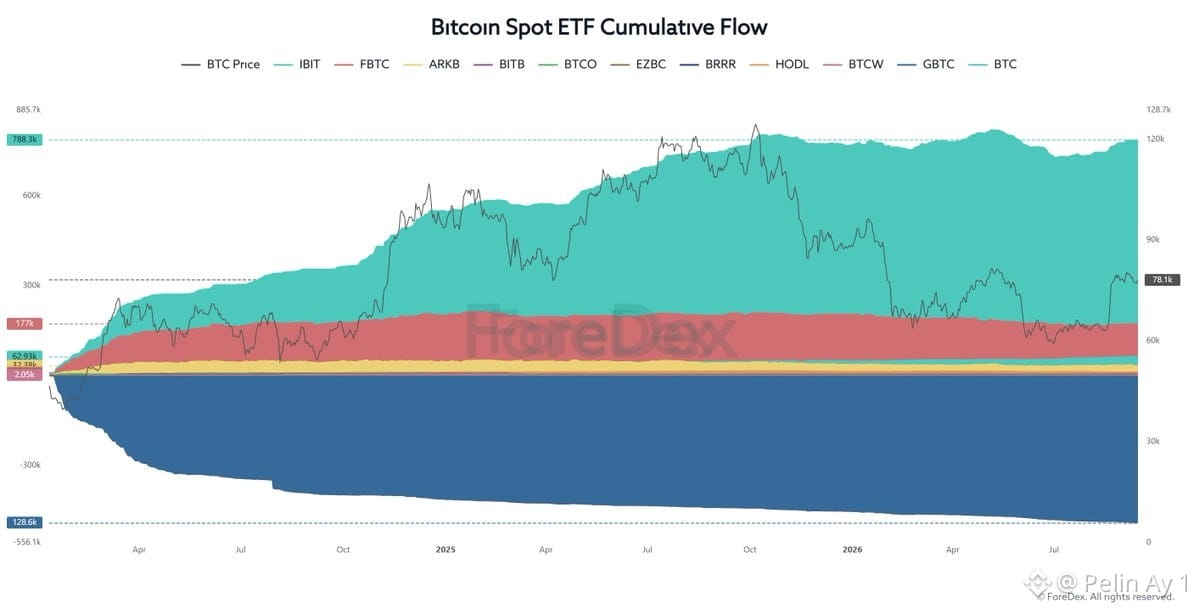
The most striking point is that the total accumulation in spot ETFs remains at a high level. In particular, cumulative inflows into the IBIT side have reached around 788k. This shows that institutional interest in Bitcoin has not completely disappeared and that buying continues on pullbacks. Positive accumulation is also being maintained in other funds such as FBTC and ARKB. In contrast, historical outflows from GBTC limit the overall impact of ETF demand to some extent.
In the chart, while the #Bitcoin price is trading around the $78k area, the flattening of ETF cumulative flows in the high zone indicates an important divergence. Net positions are being preserved on the institutional side, but the price remains below its prior highs. This suggests that much of the selling pressure could be coming from the spot market or leveraged trading, whereas the ETF investor appears to be taking a longer-term view.
The expected #interest rate increase by the Fed could initially weigh on Bitcoin by supporting the dollar and bond yields in the short term. In particular, if the post-decision message is “rates will stay high for a long time,” we may see renewed selling in #BTC around the $78k level. However, if ETF inflows continue during this decline or outflows remain limited, the pullback may be viewed more as a buying opportunity than as a lasting trend reversal.
On the other hand, if the decision comes in as expected and the Fed delivers a more moderate outlook, the removal of uncertainty in the market could support an upside reaction in Bitcoin. The chart’s core takeaway is this: ETF demand creates strong structural support for the price, but what will determine the direction on Fed day will be the tone of the decision statement rather than the rate hike itself. $BTC
The chart gives a constructive medium-term outlook for Bitcoin before the Fed decision, while in the short term it appears cautious.
The most striking point is that the total accumulation in spot ETFs remains at a high level. In particular, cumulative inflows into the IBIT side have reached around 788k. This shows that institutional interest in Bitcoin has not completely disappeared and that buying continues on pullbacks. Positive accumulation is also being maintained in other funds such as FBTC and ARKB. In contrast, historical outflows from GBTC limit the overall impact of ETF demand to some extent.
In the chart, while the #Bitcoin price is trading around the $78k area, the flattening of ETF cumulative flows in the high zone indicates an important divergence. Net positions are being preserved on the institutional side, but the price remains below its prior highs. This suggests that much of the selling pressure could be coming from the spot market or leveraged trading, whereas the ETF investor appears to be taking a longer-term view.
The expected #interest rate increase by the Fed could initially weigh on Bitcoin by supporting the dollar and bond yields in the short term. In particular, if the post-decision message is “rates will stay high for a long time,” we may see renewed selling in #BTC around the $78k level. However, if ETF inflows continue during this decline or outflows remain limited, the pullback may be viewed more as a buying opportunity than as a lasting trend reversal.
On the other hand, if the decision comes in as expected and the Fed delivers a more moderate outlook, the removal of uncertainty in the market could support an upside reaction in Bitcoin. The chart’s core takeaway is this: ETF demand creates strong structural support for the price, but what will determine the direction on Fed day will be the tone of the decision statement rather than the rate hike itself. $BTC
The most striking point is that the total accumulation in spot ETFs remains at a high level. In particular, cumulative inflows into the IBIT side have reached around 788k. This shows that institutional interest in Bitcoin has not completely disappeared and that buying continues on pullbacks. Positive accumulation is also being maintained in other funds such as FBTC and ARKB. In contrast, historical outflows from GBTC limit the overall impact of ETF demand to some extent.
In the chart, while the #Bitcoin price is trading around the $78k area, the flattening of ETF cumulative flows in the high zone indicates an important divergence. Net positions are being preserved on the institutional side, but the price remains below its prior highs. This suggests that much of the selling pressure could be coming from the spot market or leveraged trading, whereas the ETF investor appears to be taking a longer-term view.
The expected #interest rate increase by the Fed could initially weigh on Bitcoin by supporting the dollar and bond yields in the short term. In particular, if the post-decision message is “rates will stay high for a long time,” we may see renewed selling in #BTC around the $78k level. However, if ETF inflows continue during this decline or outflows remain limited, the pullback may be viewed more as a buying opportunity than as a lasting trend reversal.
On the other hand, if the decision comes in as expected and the Fed delivers a more moderate outlook, the removal of uncertainty in the market could support an upside reaction in Bitcoin. The chart’s core takeaway is this: ETF demand creates strong structural support for the price, but what will determine the direction on Fed day will be the tone of the decision statement rather than the rate hike itself. $BTC
60
·
--
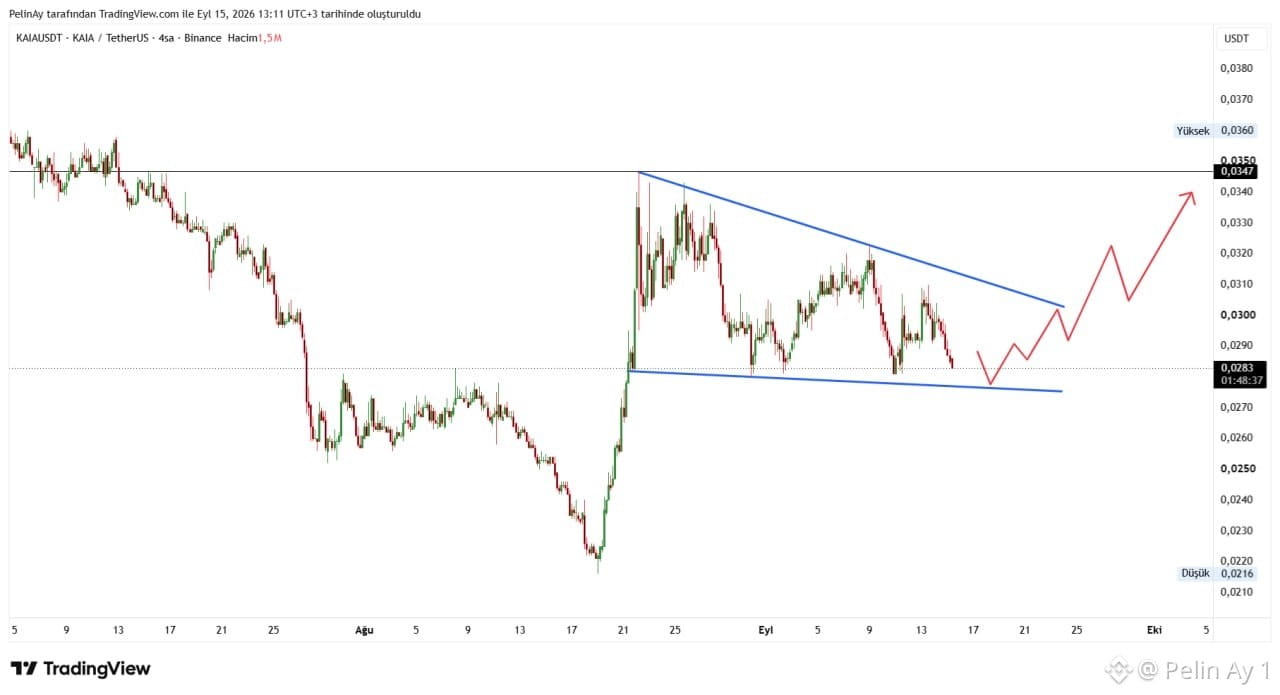
On the KAIA/USDT 4-hour chart, the price is moving around the 0.0283 USDT level within a contracting triangle formation. While the descending upper trendline runs through the $0.0300–$0.0305 area, the lower support trendline is around $0.0278. This setup suggests a potential volatile breakout: 4-hour closes below $0.0278 could bring the $0.0270 and then $0.0250 support levels into focus. Conversely, a sustained move above $0.0305 could support an upward bias toward resistance levels at $0.0320 and $0.0347 in the near term. The possible scenario outlined on the chart also reflects the expectation of first testing support and then attempting an upside breakout; however, it should be noted that breakouts occurring without an increase in volume may be misleading.
KAIA is a Layer-1 blockchain with Ethereum compatibility, created from the combination of Klaytn and the LINE/Finschia networks. Focused on Asia, it aims to provide low-fee, fast infrastructure for payments, stablecoin transfers, DeFi, tokenized assets, and LINE mini apps. According to its official technical documentation, key features include an approximately 1-second block time, instant finality, and EVM compatibility. Regarding current developments, it appears that Kaia has announced v2.2 work in 2026 to increase compatibility with Ethereum tooling. In addition, the network’s support from Dune Analytics was discontinued on September 6, 2026; this may create a need for developers using on-chain data to transition to alternative indexing solutions. This evaluation is not investment advice; the direction of BTC, market volume, and confirmation of the triangle breakout with a close should be closely monitored. $KAIA #KAIA
On the KAIA/USDT 4-hour chart, the price is moving around the 0.0283 USDT level within a contracting triangle formation. While the descending upper trendline runs through the $0.0300–$0.0305 area, the lower support trendline is around $0.0278. This setup suggests a potential volatile breakout: 4-hour closes below $0.0278 could bring the $0.0270 and then $0.0250 support levels into focus. Conversely, a sustained move above $0.0305 could support an upward bias toward resistance levels at $0.0320 and $0.0347 in the near term. The possible scenario outlined on the chart also reflects the expectation of first testing support and then attempting an upside breakout; however, it should be noted that breakouts occurring without an increase in volume may be misleading.
KAIA is a Layer-1 blockchain with Ethereum compatibility, created from the combination of Klaytn and the LINE/Finschia networks. Focused on Asia, it aims to provide low-fee, fast infrastructure for payments, stablecoin transfers, DeFi, tokenized assets, and LINE mini apps. According to its official technical documentation, key features include an approximately 1-second block time, instant finality, and EVM compatibility. Regarding current developments, it appears that Kaia has announced v2.2 work in 2026 to increase compatibility with Ethereum tooling. In addition, the network’s support from Dune Analytics was discontinued on September 6, 2026; this may create a need for developers using on-chain data to transition to alternative indexing solutions. This evaluation is not investment advice; the direction of BTC, market volume, and confirmation of the triangle breakout with a close should be closely monitored. $KAIA #KAIA
KAIA is a Layer-1 blockchain with Ethereum compatibility, created from the combination of Klaytn and the LINE/Finschia networks. Focused on Asia, it aims to provide low-fee, fast infrastructure for payments, stablecoin transfers, DeFi, tokenized assets, and LINE mini apps. According to its official technical documentation, key features include an approximately 1-second block time, instant finality, and EVM compatibility. Regarding current developments, it appears that Kaia has announced v2.2 work in 2026 to increase compatibility with Ethereum tooling. In addition, the network’s support from Dune Analytics was discontinued on September 6, 2026; this may create a need for developers using on-chain data to transition to alternative indexing solutions. This evaluation is not investment advice; the direction of BTC, market volume, and confirmation of the triangle breakout with a close should be closely monitored. $KAIA #KAIA
46
·
--
How will tomorrow's Fed interest rate decision affect #Bitcoin?
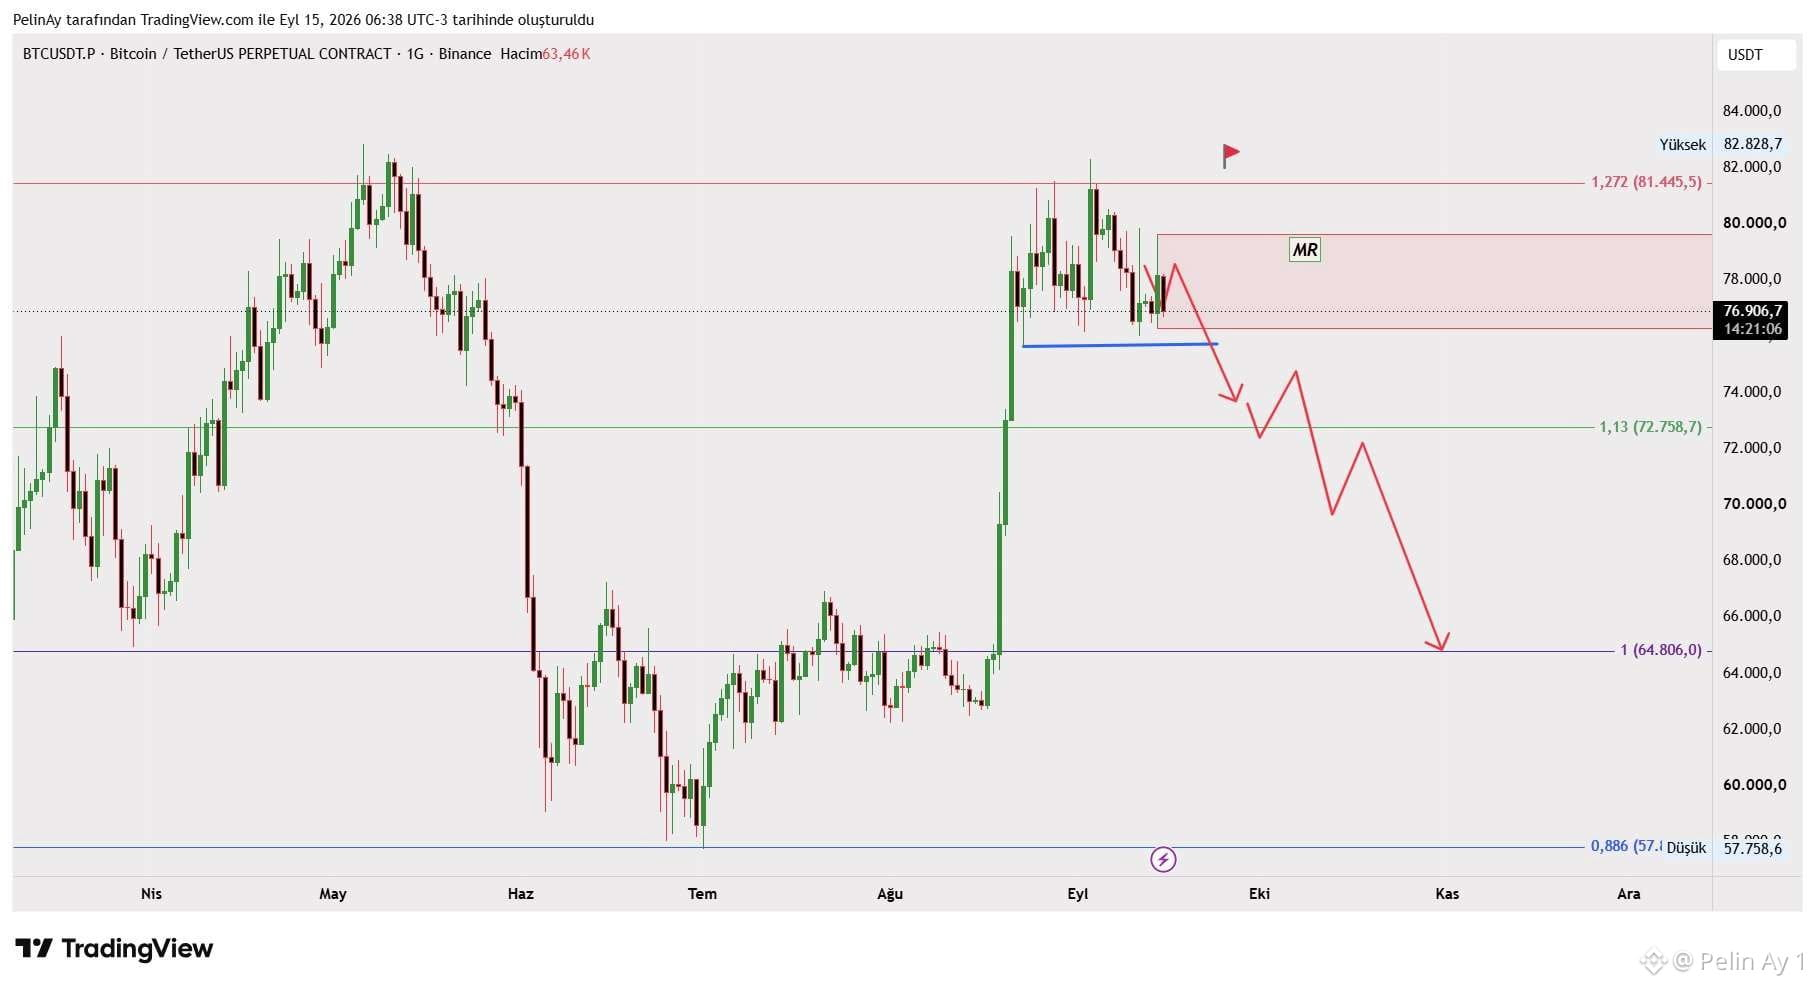
The expectation that the Fed will raise rates by 25 basis points has risen to 86.5%. If the rate-hike expectation materializes, the interest rate will move to the 3.75–4 range. In this case, it is clear that the crypto markets will be negatively affected.
#BTC has been trading sideways for 2 weeks. The 75,600$ support level is maintaining this structure. A breakdown of this support will accelerate the downside. I don't expect an alternative scenario.
$BTC
How will tomorrow's Fed interest rate decision affect #Bitcoin?
The expectation that the Fed will raise rates by 25 basis points has risen to 86.5%. If the rate-hike expectation materializes, the interest rate will move to the 3.75–4 range. In this case, it is clear that the crypto markets will be negatively affected.
#BTC has been trading sideways for 2 weeks. The 75,600$ support level is maintaining this structure. A breakdown of this support will accelerate the downside. I don't expect an alternative scenario.
$BTC
The expectation that the Fed will raise rates by 25 basis points has risen to 86.5%. If the rate-hike expectation materializes, the interest rate will move to the 3.75–4 range. In this case, it is clear that the crypto markets will be negatively affected.
#BTC has been trading sideways for 2 weeks. The 75,600$ support level is maintaining this structure. A breakdown of this support will accelerate the downside. I don't expect an alternative scenario.
$BTC
59
·
--
Will the ABD Faiz Decision Affect Ethereum Leverage?
Ethereum’s latest close is around $2,500; the intraday range is $2,464–$2,535. After a strong breakout at the end of August, the price has been consolidating sideways within the $2,400–$2,550.$ band. At this stage, that means there’s a sideways look following a sharp rally.
The funding rate is very close to zero. This matters because there isn’t an over-crowded long side in the futures market; therefore, the risk of sudden downside pressure driven by long liquidations is quite low when the price rises. In positive funding, longs pay shorts; keeping funding near zero suggests the up-move hasn’t been excessively inflated by leverage. The estimated leverage ratio is around 0.69 and has been gradually increasing in recent weeks, but it remains far from the approximate 1.00 peak seen in June. In other words, leverage appetite is rising, but it hasn’t yet reached the historically extreme zone on the chart. While this leaves room for upward movement, if leverage keeps increasing, liquidation risk in the opposite direction also grows.
RSI at 60.19 shows neither an overbought nor a weak momentum condition. Its pullback from the end-of-August overbought area above 80 is positive; as the price stays sideways, the RSI cooling provides technical room for a potential new attempt higher.
In the main scenario, as long as daily closes hold above the $2,400–$2,450 band, buyers’ advantage remains intact. In that case, the first target could be the $2,535–$2,550 resistance area, followed by the $2,650–$2,700 range where the old sharp wick was located. If funding stays low and the price strengthens above $2,550, the move is likely to be healthier because it will be more spot-driven. However, with this week’s expected interest-rate hike developments on the U.S. side, I believe the likelihood of filling the FVG structure formed up to 1900$ a is higher. $ETH
Will the ABD Faiz Decision Affect Ethereum Leverage?
Ethereum’s latest close is around $2,500; the intraday range is $2,464–$2,535. After a strong breakout at the end of August, the price has been consolidating sideways within the $2,400–$2,550.$ band. At this stage, that means there’s a sideways look following a sharp rally.
The funding rate is very close to zero. This matters because there isn’t an over-crowded long side in the futures market; therefore, the risk of sudden downside pressure driven by long liquidations is quite low when the price rises. In positive funding, longs pay shorts; keeping funding near zero suggests the up-move hasn’t been excessively inflated by leverage. The estimated leverage ratio is around 0.69 and has been gradually increasing in recent weeks, but it remains far from the approximate 1.00 peak seen in June. In other words, leverage appetite is rising, but it hasn’t yet reached the historically extreme zone on the chart. While this leaves room for upward movement, if leverage keeps increasing, liquidation risk in the opposite direction also grows.
RSI at 60.19 shows neither an overbought nor a weak momentum condition. Its pullback from the end-of-August overbought area above 80 is positive; as the price stays sideways, the RSI cooling provides technical room for a potential new attempt higher.
In the main scenario, as long as daily closes hold above the $2,400–$2,450 band, buyers’ advantage remains intact. In that case, the first target could be the $2,535–$2,550 resistance area, followed by the $2,650–$2,700 range where the old sharp wick was located. If funding stays low and the price strengthens above $2,550, the move is likely to be healthier because it will be more spot-driven. However, with this week’s expected interest-rate hike developments on the U.S. side, I believe the likelihood of filling the FVG structure formed up to 1900$ a is higher. $ETH
Ethereum’s latest close is around $2,500; the intraday range is $2,464–$2,535. After a strong breakout at the end of August, the price has been consolidating sideways within the $2,400–$2,550.$ band. At this stage, that means there’s a sideways look following a sharp rally.
The funding rate is very close to zero. This matters because there isn’t an over-crowded long side in the futures market; therefore, the risk of sudden downside pressure driven by long liquidations is quite low when the price rises. In positive funding, longs pay shorts; keeping funding near zero suggests the up-move hasn’t been excessively inflated by leverage. The estimated leverage ratio is around 0.69 and has been gradually increasing in recent weeks, but it remains far from the approximate 1.00 peak seen in June. In other words, leverage appetite is rising, but it hasn’t yet reached the historically extreme zone on the chart. While this leaves room for upward movement, if leverage keeps increasing, liquidation risk in the opposite direction also grows.
RSI at 60.19 shows neither an overbought nor a weak momentum condition. Its pullback from the end-of-August overbought area above 80 is positive; as the price stays sideways, the RSI cooling provides technical room for a potential new attempt higher.
In the main scenario, as long as daily closes hold above the $2,400–$2,450 band, buyers’ advantage remains intact. In that case, the first target could be the $2,535–$2,550 resistance area, followed by the $2,650–$2,700 range where the old sharp wick was located. If funding stays low and the price strengthens above $2,550, the move is likely to be healthier because it will be more spot-driven. However, with this week’s expected interest-rate hike developments on the U.S. side, I believe the likelihood of filling the FVG structure formed up to 1900$ a is higher. $ETH
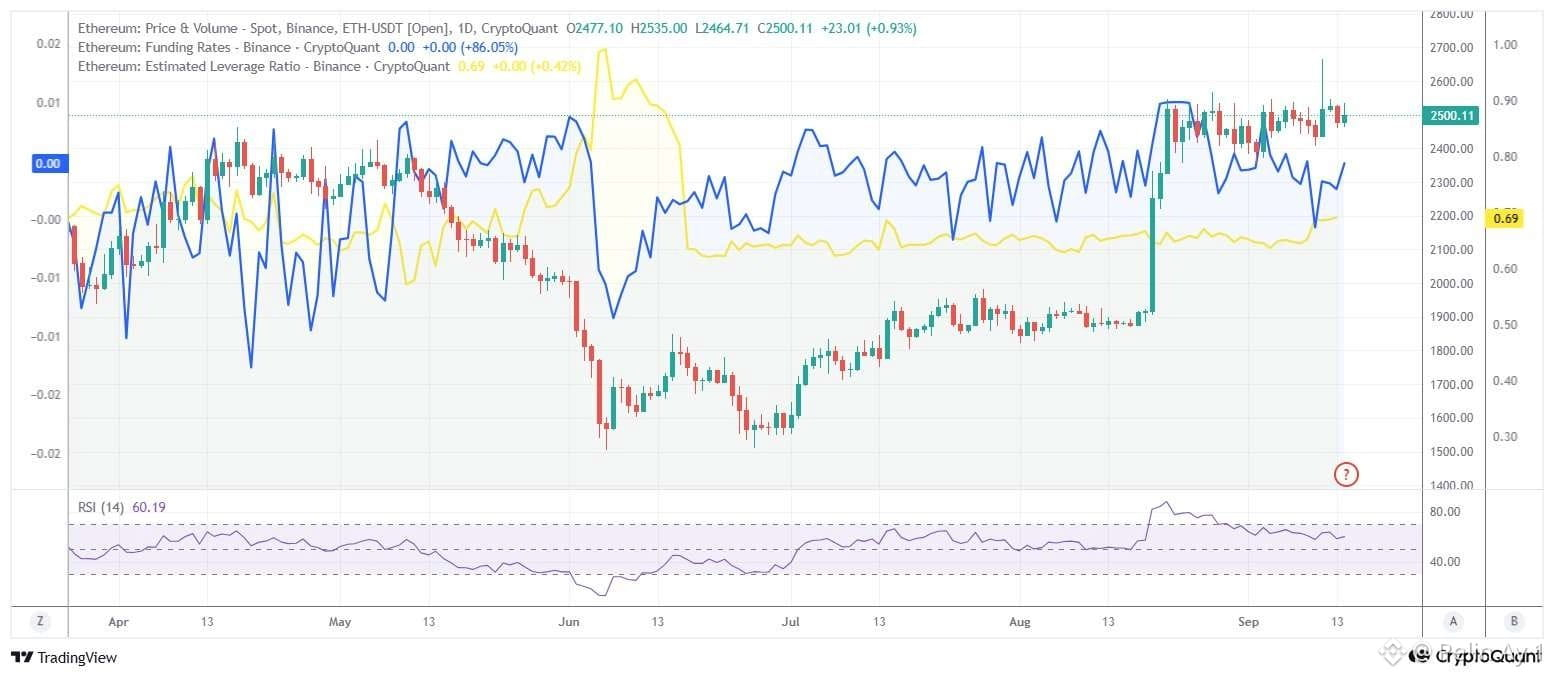
35
·
--
Bitcoin Maintains a Negative Structure
The taker rate is not, by itself, a buy/sell trading signal, but since it measures the dominance of buyers versus sellers, it provides important clues about the likely direction of price.
The spot taker buy/sell ratio at the latest value is -0.02, meaning the sell side is still very slightly dominant with market orders. In other words, spot buyers have not yet taken net control.
#BTC price is around $77.3k, while the Active Realized Price is around $84k. If price remains below this cost basis, it indicates that selling pressure is still ongoing on-chain. Even though buy bars have increased recently, sell bars are also strong; this points to a search for volatile equilibrium rather than a reliably confirmed trend reversal for now.
Therefore, the main scenario is that sideways-to-down moves or selling rallies are more likely unless the $84,$ region is reclaimed. If the area around $77,$ holds, a short-term rebound could be seen; however, for the bullish case to become more convincing, both the ratio must permanently turn positive and the price must hold above $82,$ . $BTC #Bitcoin
Bitcoin Maintains a Negative Structure
The taker rate is not, by itself, a buy/sell trading signal, but since it measures the dominance of buyers versus sellers, it provides important clues about the likely direction of price.
The spot taker buy/sell ratio at the latest value is -0.02, meaning the sell side is still very slightly dominant with market orders. In other words, spot buyers have not yet taken net control.
#BTC price is around $77.3k, while the Active Realized Price is around $84k. If price remains below this cost basis, it indicates that selling pressure is still ongoing on-chain. Even though buy bars have increased recently, sell bars are also strong; this points to a search for volatile equilibrium rather than a reliably confirmed trend reversal for now.
Therefore, the main scenario is that sideways-to-down moves or selling rallies are more likely unless the $84,$ region is reclaimed. If the area around $77,$ holds, a short-term rebound could be seen; however, for the bullish case to become more convincing, both the ratio must permanently turn positive and the price must hold above $82,$ . $BTC #Bitcoin
The taker rate is not, by itself, a buy/sell trading signal, but since it measures the dominance of buyers versus sellers, it provides important clues about the likely direction of price.
The spot taker buy/sell ratio at the latest value is -0.02, meaning the sell side is still very slightly dominant with market orders. In other words, spot buyers have not yet taken net control.
#BTC price is around $77.3k, while the Active Realized Price is around $84k. If price remains below this cost basis, it indicates that selling pressure is still ongoing on-chain. Even though buy bars have increased recently, sell bars are also strong; this points to a search for volatile equilibrium rather than a reliably confirmed trend reversal for now.
Therefore, the main scenario is that sideways-to-down moves or selling rallies are more likely unless the $84,$ region is reclaimed. If the area around $77,$ holds, a short-term rebound could be seen; however, for the bullish case to become more convincing, both the ratio must permanently turn positive and the price must hold above $82,$ . $BTC #Bitcoin
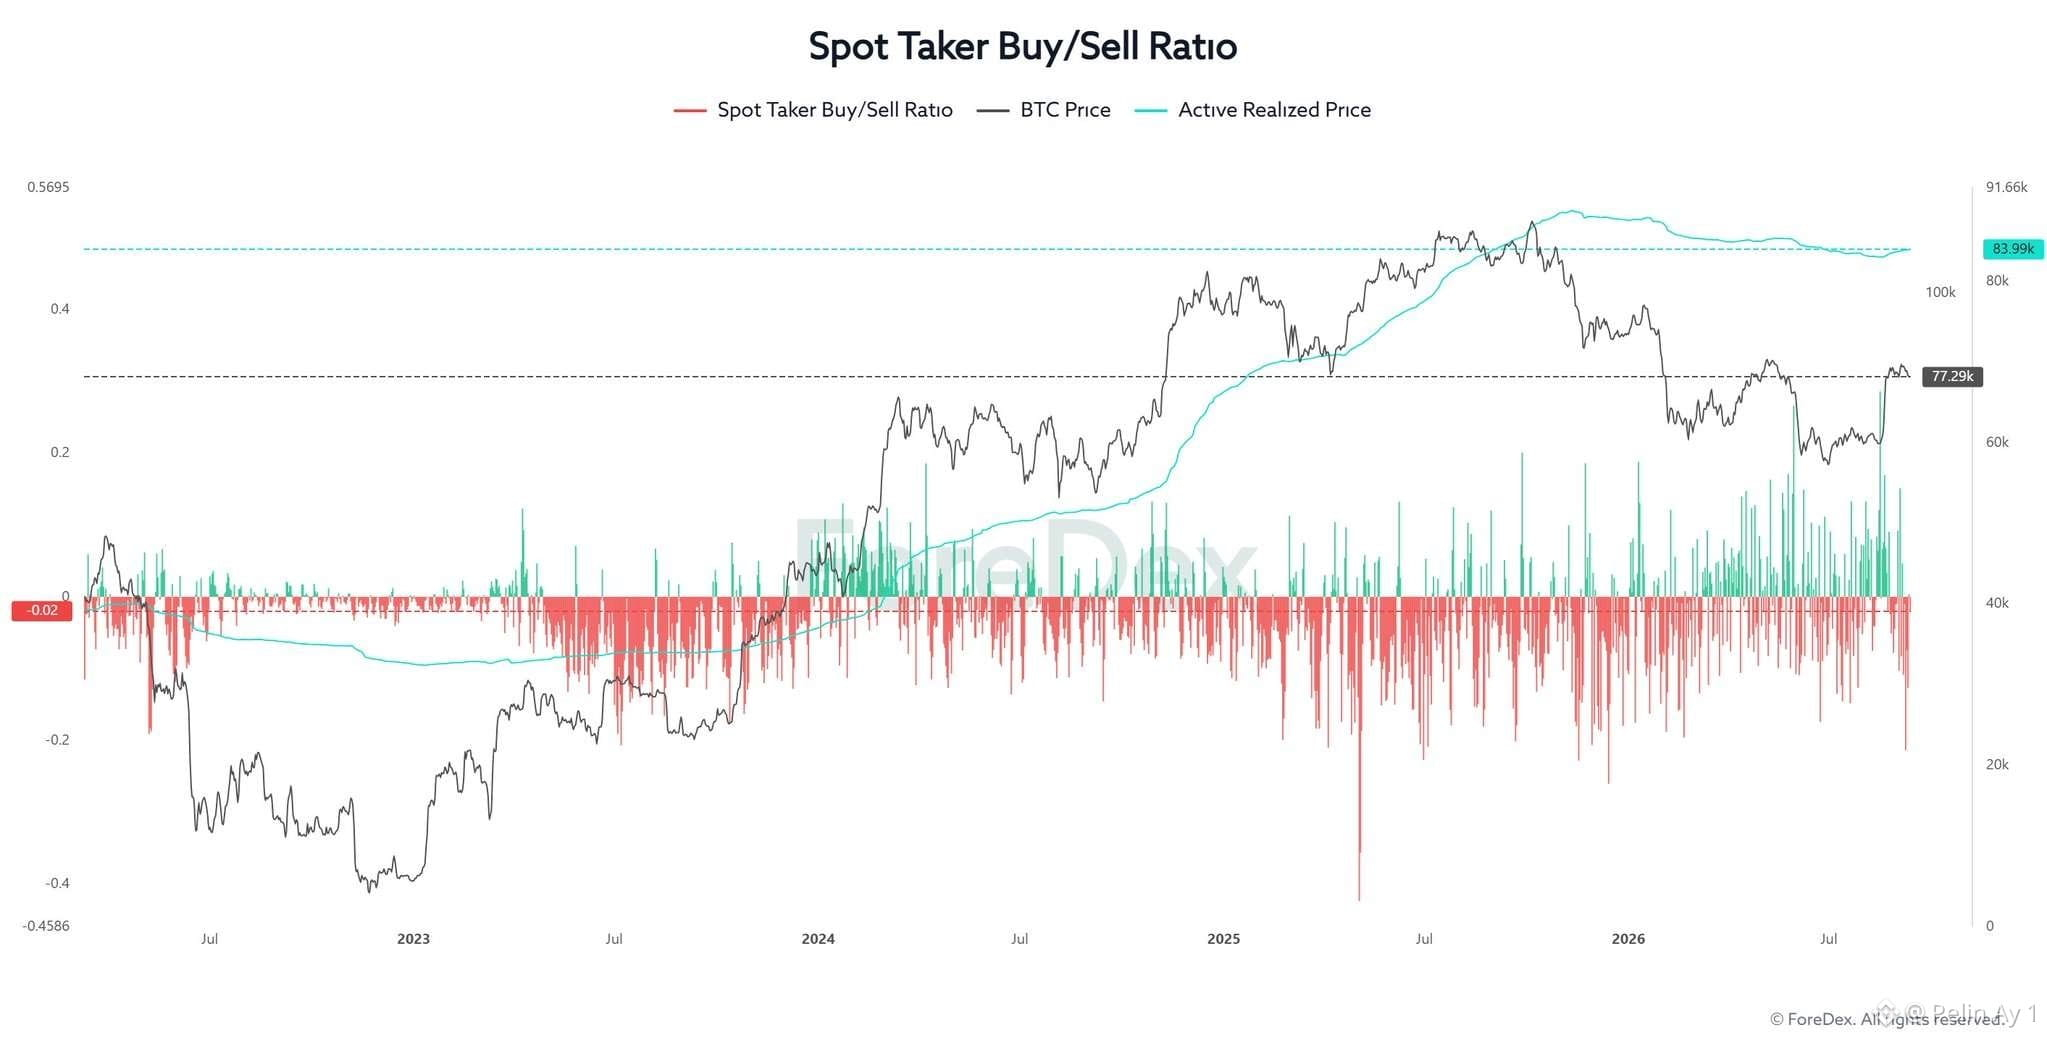
46
·
--
LSK (Lisk) is a project built on Ethereum that, in its new strategy, focuses on companies’ multi-currency, payment, and treasury operations.
The main driver of yesterday’s sharp surge was the closure of the DAO alongside the impending end of the Lisk Chain on October 31, and the initiation of a 100 million #LSK burn that would reduce total supply from 400 million to 300 million. The expectation of a lower supply triggered the first buys; then, in the futures side, rising volume and forced closures of short positions created a bigger short squeeze. Lisk’s official announcement confirms that the burn continues; however, since tokens need to be transferred before the chain shutdown, there is also a risk of additional sell pressure later.
On the chart, in the 1-hour view, after an extremely volatile spike reaching around $2.3, the price is consolidating around $0.85. The drawn pattern is not the classic descending triangle with horizontal support; the lower band also slopes slightly downward, giving it a falling wedge/triangle character. There is no directional confirmation until the upper falling trend resistance is broken. If there are volume-backed hourly closes above approximately $0.95–$1.00$ , the likelihood of a reaction toward the $1.20–$1.35$ region strengthens. Conversely, losing the $0.66–$0.70$ support would risk a breakdown of the pattern and a sharp pullback first to $0.50 and then to the area around $0.33$ , the prior breakout zone on the chart. Therefore, it’s not accurate to say it will break upward with certainty: it’s healthier to wait for high-volume confirmation; in moves of this scale driven by news, wicks and abrupt reversals are common. $LSK
LSK (Lisk) is a project built on Ethereum that, in its new strategy, focuses on companies’ multi-currency, payment, and treasury operations.
The main driver of yesterday’s sharp surge was the closure of the DAO alongside the impending end of the Lisk Chain on October 31, and the initiation of a 100 million #LSK burn that would reduce total supply from 400 million to 300 million. The expectation of a lower supply triggered the first buys; then, in the futures side, rising volume and forced closures of short positions created a bigger short squeeze. Lisk’s official announcement confirms that the burn continues; however, since tokens need to be transferred before the chain shutdown, there is also a risk of additional sell pressure later.
On the chart, in the 1-hour view, after an extremely volatile spike reaching around $2.3, the price is consolidating around $0.85. The drawn pattern is not the classic descending triangle with horizontal support; the lower band also slopes slightly downward, giving it a falling wedge/triangle character. There is no directional confirmation until the upper falling trend resistance is broken. If there are volume-backed hourly closes above approximately $0.95–$1.00$ , the likelihood of a reaction toward the $1.20–$1.35$ region strengthens. Conversely, losing the $0.66–$0.70$ support would risk a breakdown of the pattern and a sharp pullback first to $0.50 and then to the area around $0.33$ , the prior breakout zone on the chart. Therefore, it’s not accurate to say it will break upward with certainty: it’s healthier to wait for high-volume confirmation; in moves of this scale driven by news, wicks and abrupt reversals are common. $LSK
The main driver of yesterday’s sharp surge was the closure of the DAO alongside the impending end of the Lisk Chain on October 31, and the initiation of a 100 million #LSK burn that would reduce total supply from 400 million to 300 million. The expectation of a lower supply triggered the first buys; then, in the futures side, rising volume and forced closures of short positions created a bigger short squeeze. Lisk’s official announcement confirms that the burn continues; however, since tokens need to be transferred before the chain shutdown, there is also a risk of additional sell pressure later.
On the chart, in the 1-hour view, after an extremely volatile spike reaching around $2.3, the price is consolidating around $0.85. The drawn pattern is not the classic descending triangle with horizontal support; the lower band also slopes slightly downward, giving it a falling wedge/triangle character. There is no directional confirmation until the upper falling trend resistance is broken. If there are volume-backed hourly closes above approximately $0.95–$1.00$ , the likelihood of a reaction toward the $1.20–$1.35$ region strengthens. Conversely, losing the $0.66–$0.70$ support would risk a breakdown of the pattern and a sharp pullback first to $0.50 and then to the area around $0.33$ , the prior breakout zone on the chart. Therefore, it’s not accurate to say it will break upward with certainty: it’s healthier to wait for high-volume confirmation; in moves of this scale driven by news, wicks and abrupt reversals are common. $LSK
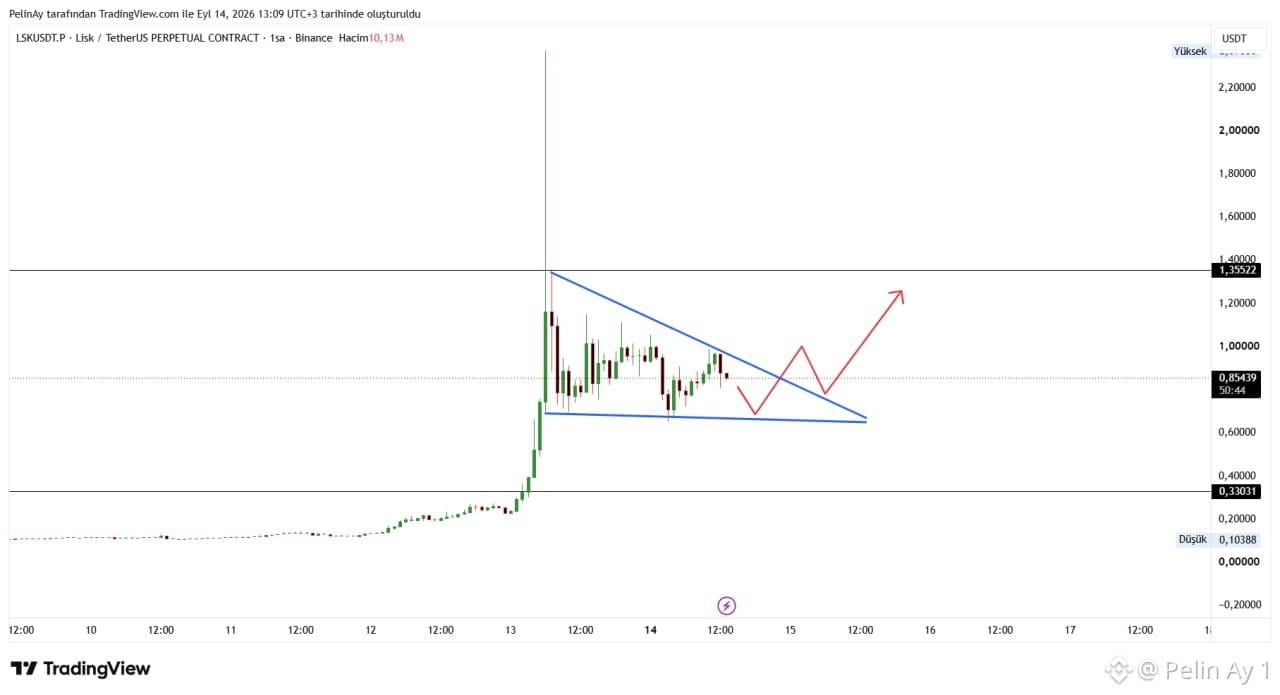
62
·
--
There’s a cautionary message from Ethereum to investors
In the chart, Binance netflow is about +3.439 ETH. This is not an absolutely massive inflow; however, the strong daily increase in netflow indicates that the amount of ETH directed to Binance that day rose significantly compared to the previous day. Throughout the chart, the blue line appears to fluctuate sharply around the zero level most of the time. This is a choppy environment where regular one-direction short-term transfers and the moves of large players are likely at work.
A single-day positive netflow is often not a reliable sell signal. These transfers could be related to staking, collateral, arbitrage, or internal wallet adjustments. To strengthen the signal, you typically need to see several days in a row of high positive netflow.
As for the number of new depositors, it is up by 259 and about 18.8% during the day. If we read this data together with netflow:
The new depositor count shows occasional sharp spikes, but they do not form a sustained upward trend. The current 259 level is low compared to its previous sharp peaks. Therefore, it would be wrong to infer a major sell-off wave spreading through the market for now.
Newly added supply is about 2.922 ETH and has changed by almost nothing. Keeping this line flat indicates that there has not been a sudden expansion on the side of newly created ETH supply.
This isn’t, by itself, a bullish signal; but it does suggest there isn’t an additional, structural supply shock for selling. Especially if the exchange netflow eventually turns negative over time, the combination of a steady supply and withdrawals from exchanges can become supportive for the price.
In my view, these data points require caution in the short term; during attempts to push ETH higher, you may encounter selling, or the market could make a sideways-to-downward move. But since the number of new depositors remains low, this chart alone does not support a strong downside expectation. $ETH
There’s a cautionary message from Ethereum to investors
In the chart, Binance netflow is about +3.439 ETH. This is not an absolutely massive inflow; however, the strong daily increase in netflow indicates that the amount of ETH directed to Binance that day rose significantly compared to the previous day. Throughout the chart, the blue line appears to fluctuate sharply around the zero level most of the time. This is a choppy environment where regular one-direction short-term transfers and the moves of large players are likely at work.
A single-day positive netflow is often not a reliable sell signal. These transfers could be related to staking, collateral, arbitrage, or internal wallet adjustments. To strengthen the signal, you typically need to see several days in a row of high positive netflow.
As for the number of new depositors, it is up by 259 and about 18.8% during the day. If we read this data together with netflow:
The new depositor count shows occasional sharp spikes, but they do not form a sustained upward trend. The current 259 level is low compared to its previous sharp peaks. Therefore, it would be wrong to infer a major sell-off wave spreading through the market for now.
Newly added supply is about 2.922 ETH and has changed by almost nothing. Keeping this line flat indicates that there has not been a sudden expansion on the side of newly created ETH supply.
This isn’t, by itself, a bullish signal; but it does suggest there isn’t an additional, structural supply shock for selling. Especially if the exchange netflow eventually turns negative over time, the combination of a steady supply and withdrawals from exchanges can become supportive for the price.
In my view, these data points require caution in the short term; during attempts to push ETH higher, you may encounter selling, or the market could make a sideways-to-downward move. But since the number of new depositors remains low, this chart alone does not support a strong downside expectation. $ETH
In the chart, Binance netflow is about +3.439 ETH. This is not an absolutely massive inflow; however, the strong daily increase in netflow indicates that the amount of ETH directed to Binance that day rose significantly compared to the previous day. Throughout the chart, the blue line appears to fluctuate sharply around the zero level most of the time. This is a choppy environment where regular one-direction short-term transfers and the moves of large players are likely at work.
A single-day positive netflow is often not a reliable sell signal. These transfers could be related to staking, collateral, arbitrage, or internal wallet adjustments. To strengthen the signal, you typically need to see several days in a row of high positive netflow.
As for the number of new depositors, it is up by 259 and about 18.8% during the day. If we read this data together with netflow:
The new depositor count shows occasional sharp spikes, but they do not form a sustained upward trend. The current 259 level is low compared to its previous sharp peaks. Therefore, it would be wrong to infer a major sell-off wave spreading through the market for now.
Newly added supply is about 2.922 ETH and has changed by almost nothing. Keeping this line flat indicates that there has not been a sudden expansion on the side of newly created ETH supply.
This isn’t, by itself, a bullish signal; but it does suggest there isn’t an additional, structural supply shock for selling. Especially if the exchange netflow eventually turns negative over time, the combination of a steady supply and withdrawals from exchanges can become supportive for the price.
In my view, these data points require caution in the short term; during attempts to push ETH higher, you may encounter selling, or the market could make a sideways-to-downward move. But since the number of new depositors remains low, this chart alone does not support a strong downside expectation. $ETH
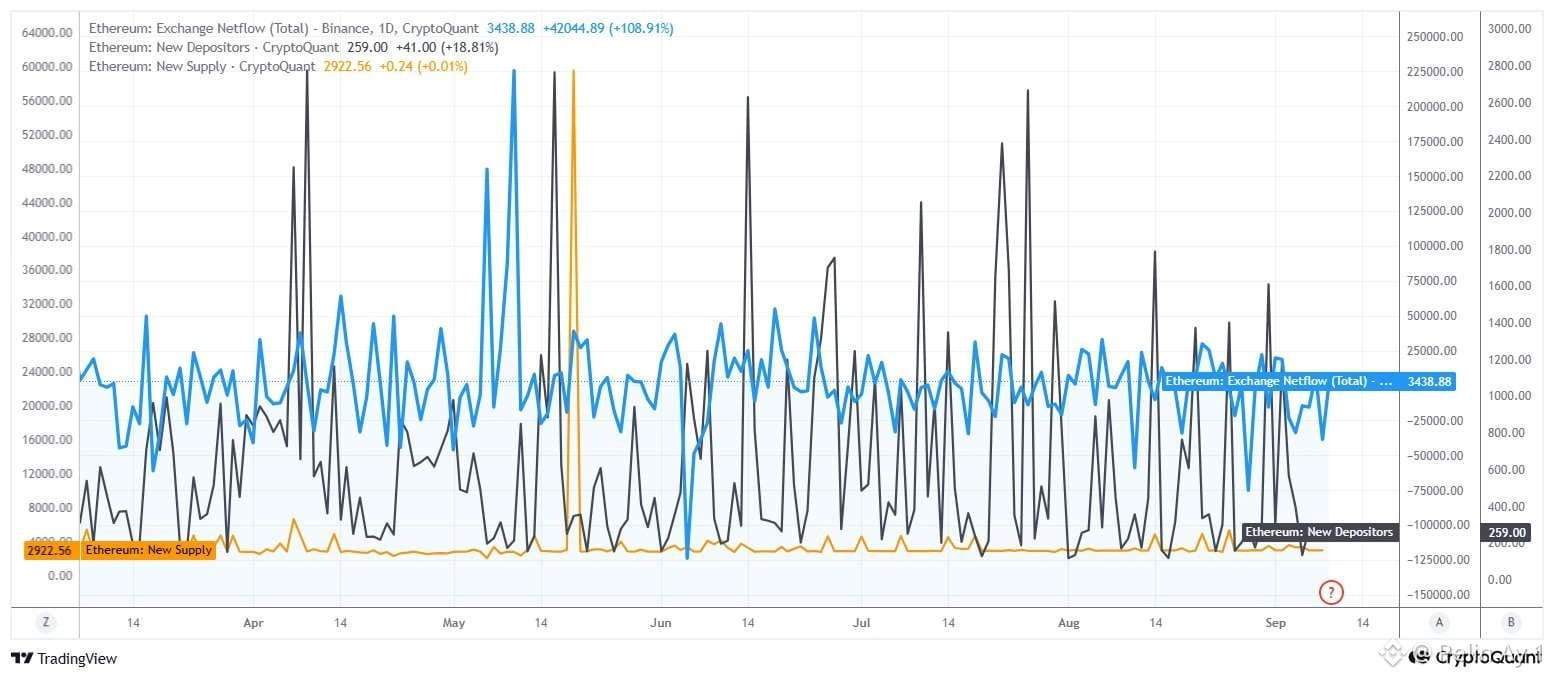
64
·
--
Ethereum is preserving its rising triangle structure. I think it will result in a downward breakdown up to the 1750$ level. I don’t know if a new bottom will come, but our chances of seeing the previous bottom again are very high. Do you agree? $ETH
Ethereum is preserving its rising triangle structure. I think it will result in a downward breakdown up to the 1750$ level. I don’t know if a new bottom will come, but our chances of seeing the previous bottom again are very high. Do you agree? $ETH
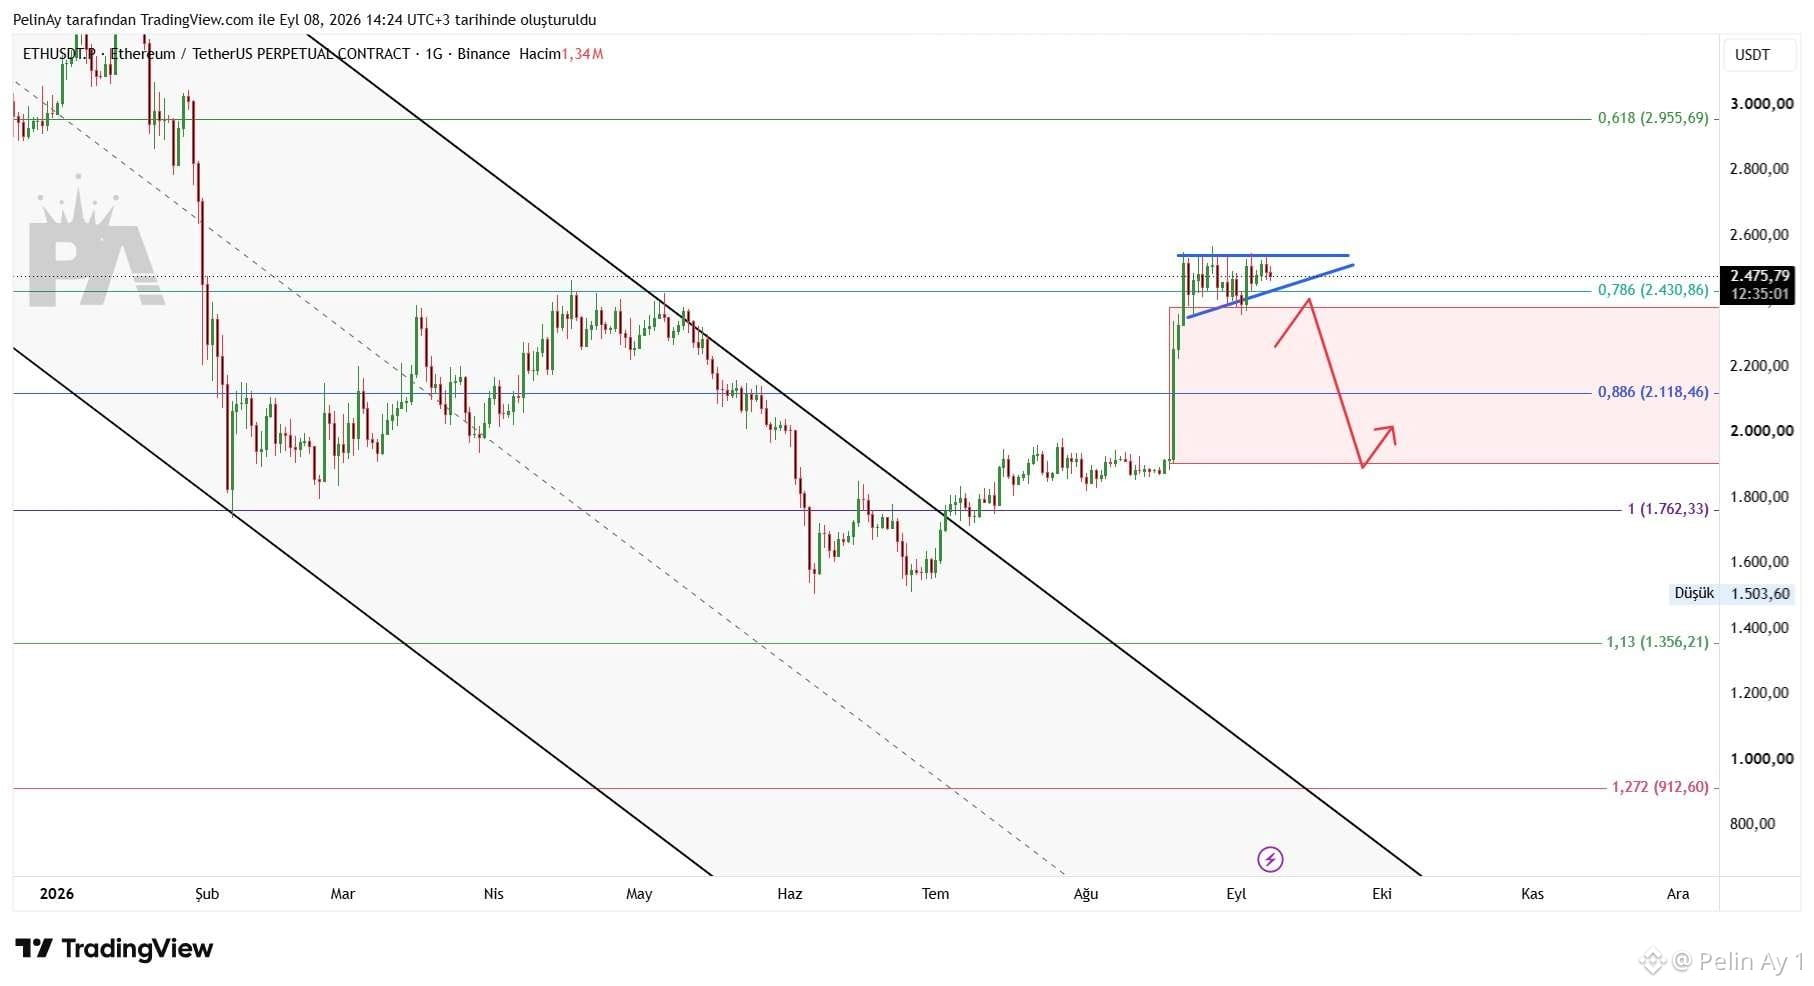
39
Log in to explore more content
Join global crypto users on Binance Square
⚡️ Get latest and useful information about crypto.
💬 Trusted by the world’s largest crypto exchange.
👍 Discover real insights from verified creators.
Email / Phone number
Trending Topics
BitwiseFilesFinalNEARSpotETFProspectus
8,553 views
350 Discussing
#bitwisefilesfinalnearspotetfprospectus 🏛️ Institutional Crypto Expansion: Bitwise Files Final NEAR Spot ETF Prospectus
The push for regulated altcoin investment products is accelerating rapidly. A major traditional asset manager has just taken a definitive step toward bringing the NEAR Protocol to traditional finance.
📰 The Core News
Bitwise, a prominent crypto asset manager, has officially filed the final prospectus for its proposed spot NEAR ETF. This critical regulatory milestone indicates that the fund is moving through the final stages of the review process, awaiting the green light from regulators before it can be listed and traded.
📊 Market Impact & Analysis
• 🏦 Institutional Validation This filing demonstrates growing institutional confidence in Layer-1 networks beyond the market leaders, recognizing NEAR's technological infrastructure and long-term viability.
• 💧 Potential Liquidity If approved, a spot ETF creates a regulated bridge, potentially introducing substantial traditional capital and new liquidity into the NEAR ecosystem.
• 📈 The Altcoin ETF Trend This move underscores a broader market shift. Asset managers are actively diversifying their regulated crypto product suites, expanding their focus to prominent altcoins following the regulatory precedents set by Bitcoin and Ethereum.
💭 Discussion
Do you believe the rollout of spot altcoin ETFs will successfully decentralize institutional capital across various Layer-1 blockchains, or will the majority of traditional inflows remain heavily concentrated in Bitcoin and Ethereum? Share your analysis in the comments! 👇
#NEAR #Bitwise #CryptoETF #InstitutionalCrypto #Layer1
This is for educational purposes only. Not Financial Advice (NFA). Always Do Your Own Research (DYOR).
$QNT $GLMR $QI
珍妮丝 kgf
·5 Likes
·3.9k views
BitgetHackerMoves$83MStolenXRP
13,570 views
83 Discussing
SOLSpotETFWeeklyInflow$188M
5,546 views
66 Discussing