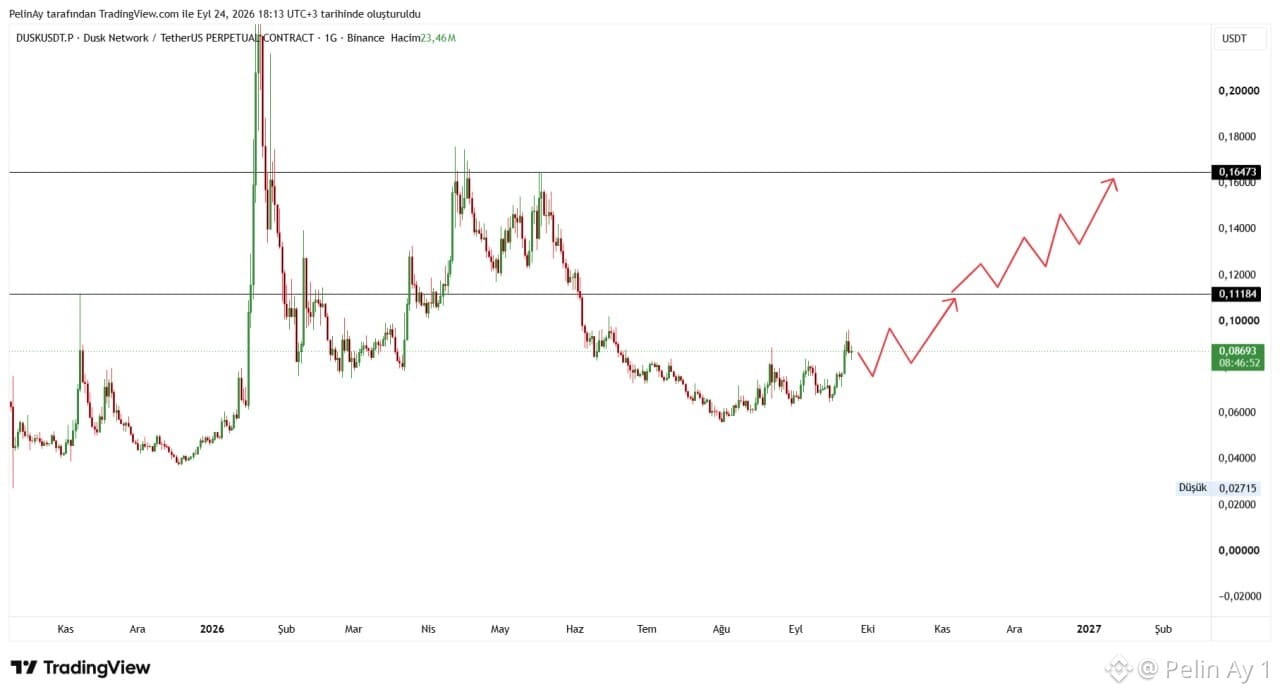
On the DUSK/USDT chart, the long-term outlook draws attention with a notable recovery structure. The chart shows that it entered an uptrend after August. The current price is at approximately the 0,0869$ level on the chart.
Technically, the first important zone is 0,10$ , followed by the 0,11184$ level, which is marked on the chart as a horizontal resistance. If daily closes arrive above this zone, there may be room for the price to move toward the 0,12–0,14$ band, where heavy trading previously took place. The main resistance on the chart is at 0,16473$ . Therefore, if 0,1118$ is broken, the next key area to watch in the medium term will be 0,1647$ . Conversely, in order to preserve the current bullish structure, price action around 0,08$ is important; below that, especially the 0,06–0,07$ zone could come back into focus.
There are also current developments on the project side. The latest post dated September 15, officially published by Dusk, focuses on the interoperability of RWA across different blockchains. Dusk aims for the issuance of real-world assets—such as securities and fund shares—directly on the blockchain and for these assets to be used with applications on other chains. Dusk also leverages Chainlink CCIP, DataLink, and Data Streams integrations.
On the project’s technical side, the Boreas upgrade in 2026 has been deployed on the mainnet. DUSK is also positioned as the local token used in the network’s transaction fees and staking mechanism. According to Dusk’s documentation, the total supply model was designed to start with 500 million DUSK and, over time, emissions would cap it at a maximum of 1 billion DUSK.
In summary, the project’s improvements around RWA, regulated finance, and cross-chain interoperability are among the key developments that support the story shown in the price chart.
$DUSK #DUSK
Technically, the first important zone is 0,10$ , followed by the 0,11184$ level, which is marked on the chart as a horizontal resistance. If daily closes arrive above this zone, there may be room for the price to move toward the 0,12–0,14$ band, where heavy trading previously took place. The main resistance on the chart is at 0,16473$ . Therefore, if 0,1118$ is broken, the next key area to watch in the medium term will be 0,1647$ . Conversely, in order to preserve the current bullish structure, price action around 0,08$ is important; below that, especially the 0,06–0,07$ zone could come back into focus.
There are also current developments on the project side. The latest post dated September 15, officially published by Dusk, focuses on the interoperability of RWA across different blockchains. Dusk aims for the issuance of real-world assets—such as securities and fund shares—directly on the blockchain and for these assets to be used with applications on other chains. Dusk also leverages Chainlink CCIP, DataLink, and Data Streams integrations.
On the project’s technical side, the Boreas upgrade in 2026 has been deployed on the mainnet. DUSK is also positioned as the local token used in the network’s transaction fees and staking mechanism. According to Dusk’s documentation, the total supply model was designed to start with 500 million DUSK and, over time, emissions would cap it at a maximum of 1 billion DUSK.
In summary, the project’s improvements around RWA, regulated finance, and cross-chain interoperability are among the key developments that support the story shown in the price chart.
$DUSK #DUSK