Bitcoin Is Falling Even Though the Sales Chart Doesn't Trigger an Alarm?
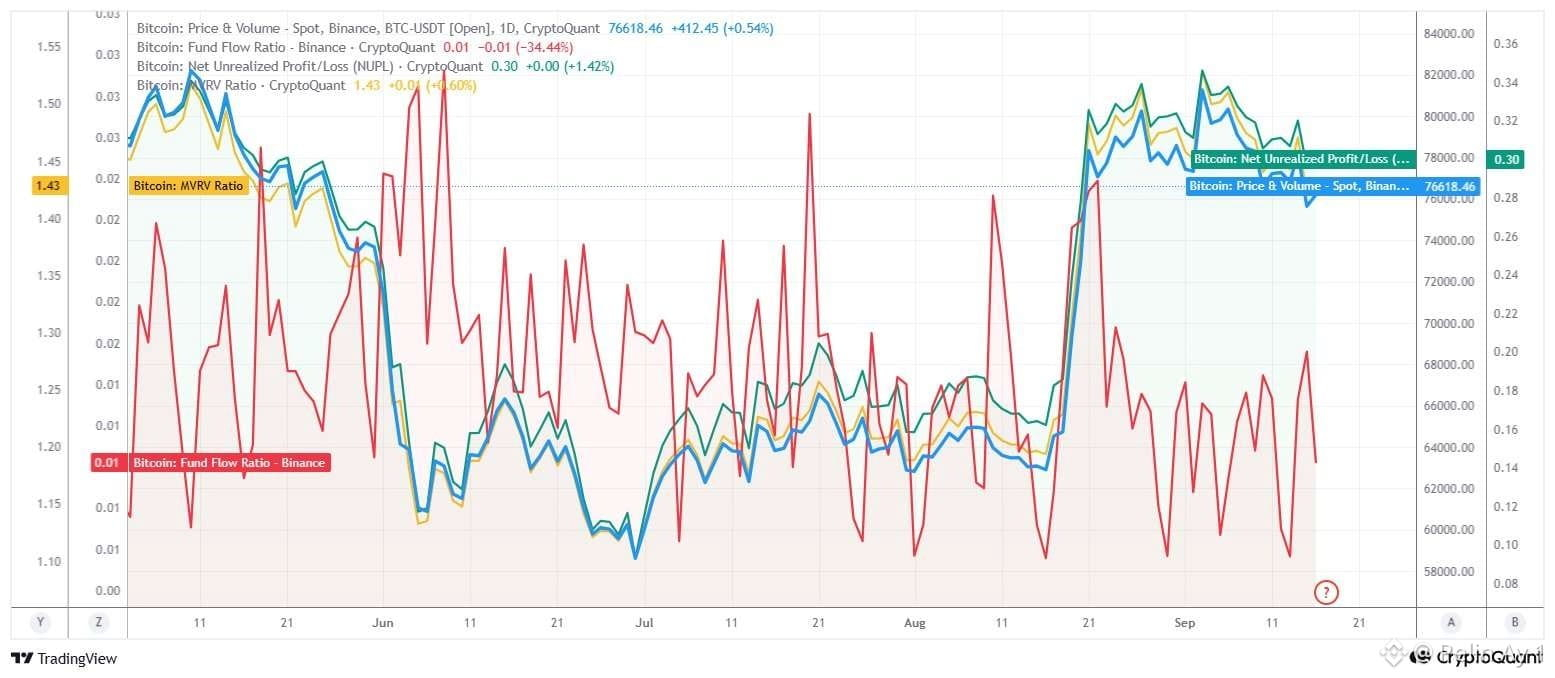
#Bitcoin price is around $76,618. After the sharp rise in mid-August from the 64K range to the 80–82K area, it pulled back into the 76–79K band and then went sideways.
Fund Flow Ratio is 0.01 and there is an approximate 34% daily drop. This suggests that a smaller portion of on-chain #BTC transfers is related to exchanges—meaning exchange-driven demand and sudden liquidity are low. In terms of this metric, it’s more a context of activity than a direct signal.
NUPL is 0.30. This indicates the market is, overall, in unrealized profit, but not in an overly euphoric phase. There is a risk of profit-taking, but there is no classic top-panic signal at the chart level.
MVRV is 1.43, meaning the market value is about 43% above the average investor’s cost basis. This points to a profitable market structure; historically, it isn’t an extreme level that would be considered outright overvaluation by itself. However, this profitability can still lead to panic selling.
After reading all this data, we can make some inferences regarding the impact on price.
First, even though reduced inflows and outflows to Binance may look positive, in my previous analyses, I shared that the historical peak in the exchange reserve was an important signal. In other words, even if inflows and outflows are down, the amount of Bitcoin held on exchanges is high enough that it can lead to selling within exchanges.
Especially if we assume the ratio of unrealized profit in the market is high, we can say these sell-offs could happen relatively easily.
Investors are nearly half above their BTC average costs—meaning the 43% BTC investors on Binance will have no hesitation to sell.
On top of that, considering the Fed’s rate-hike policy, it’s not surprising that investors are selling. I think the price is still expensive for many investors to buy. So, seeing further declines for a while would not be surprising. $BTC
#Bitcoin price is around $76,618. After the sharp rise in mid-August from the 64K range to the 80–82K area, it pulled back into the 76–79K band and then went sideways.
Fund Flow Ratio is 0.01 and there is an approximate 34% daily drop. This suggests that a smaller portion of on-chain #BTC transfers is related to exchanges—meaning exchange-driven demand and sudden liquidity are low. In terms of this metric, it’s more a context of activity than a direct signal.
NUPL is 0.30. This indicates the market is, overall, in unrealized profit, but not in an overly euphoric phase. There is a risk of profit-taking, but there is no classic top-panic signal at the chart level.
MVRV is 1.43, meaning the market value is about 43% above the average investor’s cost basis. This points to a profitable market structure; historically, it isn’t an extreme level that would be considered outright overvaluation by itself. However, this profitability can still lead to panic selling.
After reading all this data, we can make some inferences regarding the impact on price.
First, even though reduced inflows and outflows to Binance may look positive, in my previous analyses, I shared that the historical peak in the exchange reserve was an important signal. In other words, even if inflows and outflows are down, the amount of Bitcoin held on exchanges is high enough that it can lead to selling within exchanges.
Especially if we assume the ratio of unrealized profit in the market is high, we can say these sell-offs could happen relatively easily.
Investors are nearly half above their BTC average costs—meaning the 43% BTC investors on Binance will have no hesitation to sell.
On top of that, considering the Fed’s rate-hike policy, it’s not surprising that investors are selling. I think the price is still expensive for many investors to buy. So, seeing further declines for a while would not be surprising. $BTC