

aldaihan82
111 Posts

aldaihan82
Report
Block User
على باب الله أنقل المواضيع التى أعتقد أنها مهمة
Open Trade

BTC Holder
Occasional Trader
5.5 Years
3 Following
37 Followers
158 Liked
Posts
Portfolio
All
Quotes
Videos
·
--
#Bitcoin
#BTC
#CryptoTrading
#CryptoForBeginners
#BinanceSquare
#BinanceAcademy
#TradingTips
#RiskManagement
#CryptoEducation
#BTCUSDT
#Bitcoin
#BTC
#CryptoTrading
#CryptoForBeginners
#BinanceSquare
#BinanceAcademy
#TradingTips
#RiskManagement
#CryptoEducation
#BTCUSDT
#BTC
#CryptoTrading
#CryptoForBeginners
#BinanceSquare
#BinanceAcademy
#TradingTips
#RiskManagement
#CryptoEducation
#BTCUSDT
1
102
·
--
Article
See translation
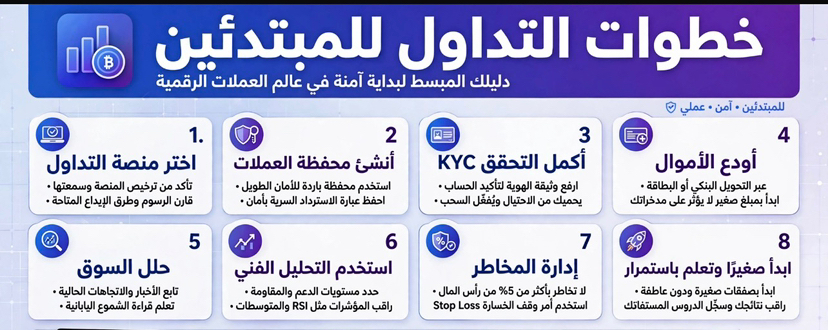
خطوات التدوال للمبتدئين في سوق العملات الرقميةيُعد سوق العملات الرقمية من أكثر الأسواق المالية تقلباً وفرصاً في آن واحد. دخول هذا السوق دون خطة واضحة يؤدي في الغالب إلى خسائر سريعة. فيما يلي خارطة طريق عملية للمبتدئ تبدأ من الصفر حتى تنفيذ أول صفقة بشكل آمن.
1. فهم السوق قبل إيداع أي مبلغ
قبل فتح أي حساب، يجب فهم الفرق الجوهري بين السوق الفوري Spot والسوق الآجل Futures. السوق الفوري هو شراء العملة وامتلاكها فعلياً مثل شراء $BTC والاحتفاظ به، بينما سوق الفيوتشر هو عقد للمراهنة على السعر باستخدام رافعة مالية، وهو سبب تصفية أكثر من 70% من حسابات المبتدئين. ابدأ دائماً بالسوق الفوري.
2. اختيار منصة موثوقة وتأمين الحساب
اعتمد على منصات كبرى مثل Binance و Bybit و OKX. بعد التسجيل، هذه الخطوات الأمنية إلزامية:
- تفعيل التحقق الثنائي 2FA عبر Google Authenticator وليس عبر الرسائل النصية.
- تفعيل القائمة البيضاء للسحب Whitelist.
- تفعيل رمز مكافحة التصيد Anti-Phishing Code.
- عدم ترك كل رأس المال في المنصة، بل الاحتفاظ بالنصيب الأكبر في محفظة باردة.
3. تعلم قراءة الشارت والمؤشرات الأساسية
لا تحتاج لأن تكون خبير تحليل فني في البداية، يكفي إتقان ثلاث أدوات:
- الدعم والمقاومة: مناطق يتوقف عندها السعر تاريخياً.
- مؤشر RSI: لمعرفة هل العملة في تشبع شرائي فوق 70 أو بيعي تحت 30.
- المتوسطات المتحركة EMA 50 و EMA 200: لتحديد الاتجاه العام.
اعتمد على إطار زمني واحد في البداية، يفضل 4 ساعات، وتجنب التنقل العشوائي بين الفريمات.
4. إدارة رأس المال - القاعدة الذهبية
هذه هي أهم خطوة على الإطلاق. القاعدة الاحترافية تقول: لا تخاطر بأكثر من 1-2% من رأس مالك في الصفقة الواحدة.
إذا كان رأس مالك 1000 دولار، فالخسارة القصوى في الصفقة الواحدة هي 10-20 دولاراً فقط. حدد دائماً وقف الخسارة Stop Loss قبل تحديد هدف الربح، ولا تدخل صفقة لا تعرف فيها أين ستخرج إذا انعكس السوق.
5. استراتيجية الدخول والخروج
للمبتدئ، أفضل استراتيجيتين هما:
- الشراء على دفعات DCA: تقسيم مبلغ الاستثمار على 3-4 دفعات عند مستويات مختلفة، يقلل من تأثير التقلب.
- استراتيجية الاختراق وإعادة الاختبار: انتظر أن يخترق السعر مقاومة قوية، ثم يعود لاختبارها كدعم، ثم ادخل. لا تشتري في قمة الشمعة الخضراء الطويلة.
6. الأخطاء التي يجب تجنبها
- التداول بالرافعة المالية في أول 6 أشهر.
- التداول بدافع الانتقام بعد الخسارة.
- متابعة توصيات التيليجرام المجهولة.
- الاستثمار في عملات ميم جديدة دون سيولة حقيقية.
- عدم تسجيل الصفقات. احتفظ بدفتر يومي تكتب فيه سبب الدخول والخروج.
7. بناء خطة تداول أسبوعية
خصص ساعتين يومياً فقط للسوق، ساعة للتعلم وساعة للتحليل. لا تجلس أمام الشارت 12 ساعة. حدد 3 عملات فقط للمتابعة في البداية، ويفضل أن تكون $BTC و $ETH و bnb لسيولتها العالية واستقرارها النسبي. التزم بخطة واحدة لمدة 30 يوماً على الأقل قبل الحكم عليها.
التداول ليس طريقاً للثراء السريع، بل هو مهارة تتراكم بالانضباط وإدارة المخاطر. من يحافظ على رأس ماله أولاً، يربح ثانياً.
#Bitcoin #BTC走势分析 #solana #TrendingTopic #Xrp🔥🔥
خطوات التدوال للمبتدئين في سوق العملات الرقمية
يُعد سوق العملات الرقمية من أكثر الأسواق المالية تقلباً وفرصاً في آن واحد. دخول هذا السوق دون خطة واضحة يؤدي في الغالب إلى خسائر سريعة. فيما يلي خارطة طريق عملية للمبتدئ تبدأ من الصفر حتى تنفيذ أول صفقة بشكل آمن.
1. فهم السوق قبل إيداع أي مبلغ
قبل فتح أي حساب، يجب فهم الفرق الجوهري بين السوق الفوري Spot والسوق الآجل Futures. السوق الفوري هو شراء العملة وامتلاكها فعلياً مثل شراء $BTC والاحتفاظ به، بينما سوق الفيوتشر هو عقد للمراهنة على السعر باستخدام رافعة مالية، وهو سبب تصفية أكثر من 70% من حسابات المبتدئين. ابدأ دائماً بالسوق الفوري.
2. اختيار منصة موثوقة وتأمين الحساب
اعتمد على منصات كبرى مثل Binance و Bybit و OKX. بعد التسجيل، هذه الخطوات الأمنية إلزامية:
- تفعيل التحقق الثنائي 2FA عبر Google Authenticator وليس عبر الرسائل النصية.
- تفعيل القائمة البيضاء للسحب Whitelist.
- تفعيل رمز مكافحة التصيد Anti-Phishing Code.
- عدم ترك كل رأس المال في المنصة، بل الاحتفاظ بالنصيب الأكبر في محفظة باردة.
3. تعلم قراءة الشارت والمؤشرات الأساسية
لا تحتاج لأن تكون خبير تحليل فني في البداية، يكفي إتقان ثلاث أدوات:
- الدعم والمقاومة: مناطق يتوقف عندها السعر تاريخياً.
- مؤشر RSI: لمعرفة هل العملة في تشبع شرائي فوق 70 أو بيعي تحت 30.
- المتوسطات المتحركة EMA 50 و EMA 200: لتحديد الاتجاه العام.
اعتمد على إطار زمني واحد في البداية، يفضل 4 ساعات، وتجنب التنقل العشوائي بين الفريمات.
4. إدارة رأس المال - القاعدة الذهبية
هذه هي أهم خطوة على الإطلاق. القاعدة الاحترافية تقول: لا تخاطر بأكثر من 1-2% من رأس مالك في الصفقة الواحدة.
إذا كان رأس مالك 1000 دولار، فالخسارة القصوى في الصفقة الواحدة هي 10-20 دولاراً فقط. حدد دائماً وقف الخسارة Stop Loss قبل تحديد هدف الربح، ولا تدخل صفقة لا تعرف فيها أين ستخرج إذا انعكس السوق.
5. استراتيجية الدخول والخروج
للمبتدئ، أفضل استراتيجيتين هما:
- الشراء على دفعات DCA: تقسيم مبلغ الاستثمار على 3-4 دفعات عند مستويات مختلفة، يقلل من تأثير التقلب.
- استراتيجية الاختراق وإعادة الاختبار: انتظر أن يخترق السعر مقاومة قوية، ثم يعود لاختبارها كدعم، ثم ادخل. لا تشتري في قمة الشمعة الخضراء الطويلة.
6. الأخطاء التي يجب تجنبها
- التداول بالرافعة المالية في أول 6 أشهر.
- التداول بدافع الانتقام بعد الخسارة.
- متابعة توصيات التيليجرام المجهولة.
- الاستثمار في عملات ميم جديدة دون سيولة حقيقية.
- عدم تسجيل الصفقات. احتفظ بدفتر يومي تكتب فيه سبب الدخول والخروج.
7. بناء خطة تداول أسبوعية
خصص ساعتين يومياً فقط للسوق، ساعة للتعلم وساعة للتحليل. لا تجلس أمام الشارت 12 ساعة. حدد 3 عملات فقط للمتابعة في البداية، ويفضل أن تكون $BTC و $ETH و bnb لسيولتها العالية واستقرارها النسبي. التزم بخطة واحدة لمدة 30 يوماً على الأقل قبل الحكم عليها.
التداول ليس طريقاً للثراء السريع، بل هو مهارة تتراكم بالانضباط وإدارة المخاطر. من يحافظ على رأس ماله أولاً، يربح ثانياً.
#Bitcoin #BTC走势分析 #solana #TrendingTopic #Xrp🔥🔥
1. فهم السوق قبل إيداع أي مبلغ
قبل فتح أي حساب، يجب فهم الفرق الجوهري بين السوق الفوري Spot والسوق الآجل Futures. السوق الفوري هو شراء العملة وامتلاكها فعلياً مثل شراء $BTC والاحتفاظ به، بينما سوق الفيوتشر هو عقد للمراهنة على السعر باستخدام رافعة مالية، وهو سبب تصفية أكثر من 70% من حسابات المبتدئين. ابدأ دائماً بالسوق الفوري.
2. اختيار منصة موثوقة وتأمين الحساب
اعتمد على منصات كبرى مثل Binance و Bybit و OKX. بعد التسجيل، هذه الخطوات الأمنية إلزامية:
- تفعيل التحقق الثنائي 2FA عبر Google Authenticator وليس عبر الرسائل النصية.
- تفعيل القائمة البيضاء للسحب Whitelist.
- تفعيل رمز مكافحة التصيد Anti-Phishing Code.
- عدم ترك كل رأس المال في المنصة، بل الاحتفاظ بالنصيب الأكبر في محفظة باردة.
3. تعلم قراءة الشارت والمؤشرات الأساسية
لا تحتاج لأن تكون خبير تحليل فني في البداية، يكفي إتقان ثلاث أدوات:
- الدعم والمقاومة: مناطق يتوقف عندها السعر تاريخياً.
- مؤشر RSI: لمعرفة هل العملة في تشبع شرائي فوق 70 أو بيعي تحت 30.
- المتوسطات المتحركة EMA 50 و EMA 200: لتحديد الاتجاه العام.
اعتمد على إطار زمني واحد في البداية، يفضل 4 ساعات، وتجنب التنقل العشوائي بين الفريمات.
4. إدارة رأس المال - القاعدة الذهبية
هذه هي أهم خطوة على الإطلاق. القاعدة الاحترافية تقول: لا تخاطر بأكثر من 1-2% من رأس مالك في الصفقة الواحدة.
إذا كان رأس مالك 1000 دولار، فالخسارة القصوى في الصفقة الواحدة هي 10-20 دولاراً فقط. حدد دائماً وقف الخسارة Stop Loss قبل تحديد هدف الربح، ولا تدخل صفقة لا تعرف فيها أين ستخرج إذا انعكس السوق.
5. استراتيجية الدخول والخروج
للمبتدئ، أفضل استراتيجيتين هما:
- الشراء على دفعات DCA: تقسيم مبلغ الاستثمار على 3-4 دفعات عند مستويات مختلفة، يقلل من تأثير التقلب.
- استراتيجية الاختراق وإعادة الاختبار: انتظر أن يخترق السعر مقاومة قوية، ثم يعود لاختبارها كدعم، ثم ادخل. لا تشتري في قمة الشمعة الخضراء الطويلة.
6. الأخطاء التي يجب تجنبها
- التداول بالرافعة المالية في أول 6 أشهر.
- التداول بدافع الانتقام بعد الخسارة.
- متابعة توصيات التيليجرام المجهولة.
- الاستثمار في عملات ميم جديدة دون سيولة حقيقية.
- عدم تسجيل الصفقات. احتفظ بدفتر يومي تكتب فيه سبب الدخول والخروج.
7. بناء خطة تداول أسبوعية
خصص ساعتين يومياً فقط للسوق، ساعة للتعلم وساعة للتحليل. لا تجلس أمام الشارت 12 ساعة. حدد 3 عملات فقط للمتابعة في البداية، ويفضل أن تكون $BTC و $ETH و bnb لسيولتها العالية واستقرارها النسبي. التزم بخطة واحدة لمدة 30 يوماً على الأقل قبل الحكم عليها.
التداول ليس طريقاً للثراء السريع، بل هو مهارة تتراكم بالانضباط وإدارة المخاطر. من يحافظ على رأس ماله أولاً، يربح ثانياً.
#Bitcoin #BTC走势分析 #solana #TrendingTopic #Xrp🔥🔥
1
1
·
--
Article
*The Long Hunt*What is happening to Long positions on trading platforms and its impact on the crypto market? Are we facing organized quasi-fraud?
Every time the market drops suddenly, you see the same scene repeat: hundreds of millions of dollars liquidated in minutes, most of them Long positions. During 2026 alone, the market recorded more than 15 mass liquidation events exceeding $300 million in 24 hours, reaching more than $600 million on some days, and even approaching $1 billion on extremely volatile days.
The last of these waves occurred at the end of September 2026, when around $309 million in Longs were liquidated in a single day, with the largest share on Binance, OKX, Bybit, and Hyperliquid. A few days earlier, on September 16, $571 million in Long positions were wiped out after the failure to pass the CLARITY Act in the US Senate, with $190 million for Bitcoin alone and $190 million for Ethereum.
How does the liquidation mechanism work and why does it hit Longs more?
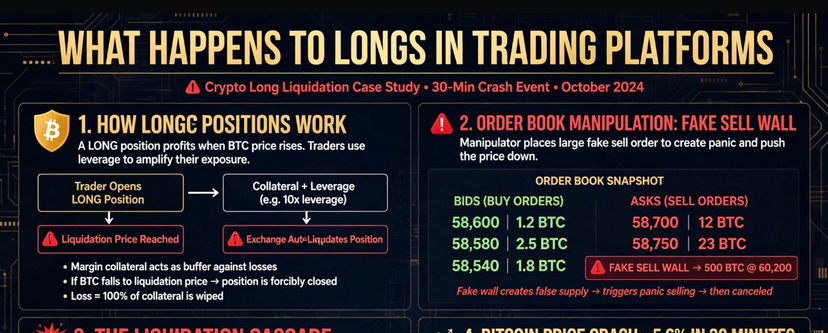
When you open a Long position with 10x leverage worth $10,000, you actually control $100,000. If the price drops just 10% against your expectation, you lose your entire margin and the platform closes your position forcibly.
The problem is that these closures are executed via immediate market sell orders, and this selling pushes the price down further, so other positions are liquidated, and thus the market enters a vicious cycle called Liquidation Cascade. Data indicates that 70-80% of liquidation in a downtrend is for Long positions, because the majority tends to be optimistic and enters Long, making the market completely exposed under the blows of market makers.
In one event documented in 2026, liquidity in order books dropped by 98% and bid-ask spreads widened by more than 1,300 times within just one hour, and more than $500 million was liquidated.
Are platforms manipulating? And what is the fraud suspicion?
Here the market is divided into two opinions, and both have evidence:
1. The technical view: The market works as designed
There is no single entity responsible. Platforms apply the automatic liquidation system to protect themselves from losses. The rise in Open Interest to between $48 and $51 billion, while spot trading volume is much lower, means that a large part of the price is artificial and built on leverage, and any small shake blows it up. This is not fraud, but a structural fragility in the Perpetual futures system that never expires.
2. The view that sees manipulation: Hunting Liquidity
Here suspicions begin. Numerous reports from traders on OKX and Binance talk about the same pattern:
- Freezing the platform and suspending login and canceling orders at critical moments, and only small traders with Long positions are affected, while institutional accounts and Short accounts work normally, leaving them until their positions are blown up.
- Inserting a fake Wick candle: Suddenly a very sharp bearish candle appears on only one platform, different from the global price, accurately hitting the stop-loss of Longs and then the price immediately returns to normal. This process is described by traders as precise harvesting by controlling the fake market depth.
- The phenomenon of adding fake liquidity: As happened this week when Bitcoin fell below $83,000 after more than $30 million in sell orders suddenly appeared at $85,700 to stop the price rise and push it to liquidate $70 million of Longs.
Even Kris Marszalek, CEO of http://Crypto.com, called for an urgent regulatory investigation after a record liquidation of $20 billion following Bitcoin's 15% drop from $124,000 to $98,500, talking about manipulation in order books and printing abnormal prices during the sell-off, and called on the SEC and CFTC to investigate pricing, lag, and margin systems.
Impact on the market
As a result of this system, the crypto market moves not based on project news, but based on where liquidity pools. Market makers know where high-leverage Long positions accumulate below the price of $83,000 to $78,000, and it becomes very low-cost to insert a dip to liquidate $2 billion at once. And when ETF buying slowed from $1 billion per day in September to just $15 million, the market lost its biggest supporter, and the liquidation of Longs became inevitable.
It is not direct fraud like fake platforms that confiscate users' money, but it is a system that allows major platforms to profit from liquidation fees, and from the ADL system that punishes winning traders to cover the losses of insolvent ones, a system that does not exist in traditional markets and raises serious questions about market integrity.
$AAPLB #BTC
*The Long Hunt*
What is happening to Long positions on trading platforms and its impact on the crypto market? Are we facing organized quasi-fraud?
Every time the market drops suddenly, you see the same scene repeat: hundreds of millions of dollars liquidated in minutes, most of them Long positions. During 2026 alone, the market recorded more than 15 mass liquidation events exceeding $300 million in 24 hours, reaching more than $600 million on some days, and even approaching $1 billion on extremely volatile days.
The last of these waves occurred at the end of September 2026, when around $309 million in Longs were liquidated in a single day, with the largest share on Binance, OKX, Bybit, and Hyperliquid. A few days earlier, on September 16, $571 million in Long positions were wiped out after the failure to pass the CLARITY Act in the US Senate, with $190 million for Bitcoin alone and $190 million for Ethereum.
How does the liquidation mechanism work and why does it hit Longs more?
When you open a Long position with 10x leverage worth $10,000, you actually control $100,000. If the price drops just 10% against your expectation, you lose your entire margin and the platform closes your position forcibly.
The problem is that these closures are executed via immediate market sell orders, and this selling pushes the price down further, so other positions are liquidated, and thus the market enters a vicious cycle called Liquidation Cascade. Data indicates that 70-80% of liquidation in a downtrend is for Long positions, because the majority tends to be optimistic and enters Long, making the market completely exposed under the blows of market makers.
In one event documented in 2026, liquidity in order books dropped by 98% and bid-ask spreads widened by more than 1,300 times within just one hour, and more than $500 million was liquidated.
Are platforms manipulating? And what is the fraud suspicion?
Here the market is divided into two opinions, and both have evidence:
1. The technical view: The market works as designed
There is no single entity responsible. Platforms apply the automatic liquidation system to protect themselves from losses. The rise in Open Interest to between $48 and $51 billion, while spot trading volume is much lower, means that a large part of the price is artificial and built on leverage, and any small shake blows it up. This is not fraud, but a structural fragility in the Perpetual futures system that never expires.
2. The view that sees manipulation: Hunting Liquidity
Here suspicions begin. Numerous reports from traders on OKX and Binance talk about the same pattern:
- Freezing the platform and suspending login and canceling orders at critical moments, and only small traders with Long positions are affected, while institutional accounts and Short accounts work normally, leaving them until their positions are blown up.
- Inserting a fake Wick candle: Suddenly a very sharp bearish candle appears on only one platform, different from the global price, accurately hitting the stop-loss of Longs and then the price immediately returns to normal. This process is described by traders as precise harvesting by controlling the fake market depth.
- The phenomenon of adding fake liquidity: As happened this week when Bitcoin fell below $83,000 after more than $30 million in sell orders suddenly appeared at $85,700 to stop the price rise and push it to liquidate $70 million of Longs.
Even Kris Marszalek, CEO of http://Crypto.com, called for an urgent regulatory investigation after a record liquidation of $20 billion following Bitcoin's 15% drop from $124,000 to $98,500, talking about manipulation in order books and printing abnormal prices during the sell-off, and called on the SEC and CFTC to investigate pricing, lag, and margin systems.
Impact on the market
As a result of this system, the crypto market moves not based on project news, but based on where liquidity pools. Market makers know where high-leverage Long positions accumulate below the price of $83,000 to $78,000, and it becomes very low-cost to insert a dip to liquidate $2 billion at once. And when ETF buying slowed from $1 billion per day in September to just $15 million, the market lost its biggest supporter, and the liquidation of Longs became inevitable.
It is not direct fraud like fake platforms that confiscate users' money, but it is a system that allows major platforms to profit from liquidation fees, and from the ADL system that punishes winning traders to cover the losses of insolvent ones, a system that does not exist in traditional markets and raises serious questions about market integrity.
$AAPLB #BTC
Every time the market drops suddenly, you see the same scene repeat: hundreds of millions of dollars liquidated in minutes, most of them Long positions. During 2026 alone, the market recorded more than 15 mass liquidation events exceeding $300 million in 24 hours, reaching more than $600 million on some days, and even approaching $1 billion on extremely volatile days.
The last of these waves occurred at the end of September 2026, when around $309 million in Longs were liquidated in a single day, with the largest share on Binance, OKX, Bybit, and Hyperliquid. A few days earlier, on September 16, $571 million in Long positions were wiped out after the failure to pass the CLARITY Act in the US Senate, with $190 million for Bitcoin alone and $190 million for Ethereum.
How does the liquidation mechanism work and why does it hit Longs more?
When you open a Long position with 10x leverage worth $10,000, you actually control $100,000. If the price drops just 10% against your expectation, you lose your entire margin and the platform closes your position forcibly.
The problem is that these closures are executed via immediate market sell orders, and this selling pushes the price down further, so other positions are liquidated, and thus the market enters a vicious cycle called Liquidation Cascade. Data indicates that 70-80% of liquidation in a downtrend is for Long positions, because the majority tends to be optimistic and enters Long, making the market completely exposed under the blows of market makers.
In one event documented in 2026, liquidity in order books dropped by 98% and bid-ask spreads widened by more than 1,300 times within just one hour, and more than $500 million was liquidated.
Are platforms manipulating? And what is the fraud suspicion?
Here the market is divided into two opinions, and both have evidence:
1. The technical view: The market works as designed
There is no single entity responsible. Platforms apply the automatic liquidation system to protect themselves from losses. The rise in Open Interest to between $48 and $51 billion, while spot trading volume is much lower, means that a large part of the price is artificial and built on leverage, and any small shake blows it up. This is not fraud, but a structural fragility in the Perpetual futures system that never expires.
2. The view that sees manipulation: Hunting Liquidity
Here suspicions begin. Numerous reports from traders on OKX and Binance talk about the same pattern:
- Freezing the platform and suspending login and canceling orders at critical moments, and only small traders with Long positions are affected, while institutional accounts and Short accounts work normally, leaving them until their positions are blown up.
- Inserting a fake Wick candle: Suddenly a very sharp bearish candle appears on only one platform, different from the global price, accurately hitting the stop-loss of Longs and then the price immediately returns to normal. This process is described by traders as precise harvesting by controlling the fake market depth.
- The phenomenon of adding fake liquidity: As happened this week when Bitcoin fell below $83,000 after more than $30 million in sell orders suddenly appeared at $85,700 to stop the price rise and push it to liquidate $70 million of Longs.
Even Kris Marszalek, CEO of http://Crypto.com, called for an urgent regulatory investigation after a record liquidation of $20 billion following Bitcoin's 15% drop from $124,000 to $98,500, talking about manipulation in order books and printing abnormal prices during the sell-off, and called on the SEC and CFTC to investigate pricing, lag, and margin systems.
Impact on the market
As a result of this system, the crypto market moves not based on project news, but based on where liquidity pools. Market makers know where high-leverage Long positions accumulate below the price of $83,000 to $78,000, and it becomes very low-cost to insert a dip to liquidate $2 billion at once. And when ETF buying slowed from $1 billion per day in September to just $15 million, the market lost its biggest supporter, and the liquidation of Longs became inevitable.
It is not direct fraud like fake platforms that confiscate users' money, but it is a system that allows major platforms to profit from liquidation fees, and from the ADL system that punishes winning traders to cover the losses of insolvent ones, a system that does not exist in traditional markets and raises serious questions about market integrity.
$AAPLB #BTC
1
82
·
--
Article
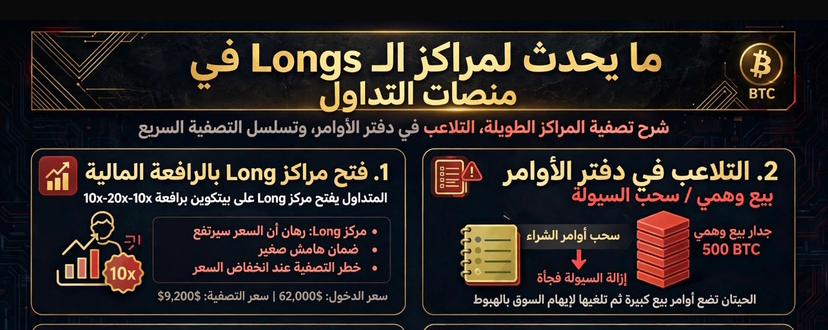
Serious Questions About the Integrity of the Crypto MarketWhat happens to Long positions on trading platforms, and how does it affect the crypto market? Are we looking at something like a coordinated quasi-scam?
Every time the market suddenly drops, you see the same scene repeat: hundreds of millions of dollars are liquidated within minutes, and most of it goes to Longs buying positions. In just 2026, the market recorded more than 15 mass liquidation events exceeding 300 million dollars within 24 hours, and on some days it reached more than 600 million dollars—approaching nearly one billion dollars on highly volatile days.
Serious Questions About the Integrity of the Crypto Market
What happens to Long positions on trading platforms, and how does it affect the crypto market? Are we looking at something like a coordinated quasi-scam?
Every time the market suddenly drops, you see the same scene repeat: hundreds of millions of dollars are liquidated within minutes, and most of it goes to Longs buying positions. In just 2026, the market recorded more than 15 mass liquidation events exceeding 300 million dollars within 24 hours, and on some days it reached more than 600 million dollars—approaching nearly one billion dollars on highly volatile days.
Every time the market suddenly drops, you see the same scene repeat: hundreds of millions of dollars are liquidated within minutes, and most of it goes to Longs buying positions. In just 2026, the market recorded more than 15 mass liquidation events exceeding 300 million dollars within 24 hours, and on some days it reached more than 600 million dollars—approaching nearly one billion dollars on highly volatile days.
2
403
·
--

Article
GTC - Gitcoin Token: What is a public goods funding project in Web3?What is the GTC - Gitcoin token? The comprehensive guide to a public goods funding project
GTC is the governing token of the Gitcoin platform, one of the most important infrastructure projects in the Web3 world. The project launched in 2017 by Kevin Owoki and Scott Moore to solve the problem of funding open-source projects and digital public goods that everyone uses but no one directly funds.
GTC - Gitcoin Token: What is a public goods funding project in Web3?
What is the GTC - Gitcoin token? The comprehensive guide to a public goods funding project
GTC is the governing token of the Gitcoin platform, one of the most important infrastructure projects in the Web3 world. The project launched in 2017 by Kevin Owoki and Scott Moore to solve the problem of funding open-source projects and digital public goods that everyone uses but no one directly funds.
GTC is the governing token of the Gitcoin platform, one of the most important infrastructure projects in the Web3 world. The project launched in 2017 by Kevin Owoki and Scott Moore to solve the problem of funding open-source projects and digital public goods that everyone uses but no one directly funds.
1
144
·
--
Article
*RSI Divergence Explained: 6 Powerful Signals to Predict Crypto Reversals (2026 Guide)*Mastering RSI Signals: The Complete Divergence Guide With Practical Examples
The Relative Strength Index (RSI) is one of the most important momentum indicators in the crypto market. It measures the speed and change of price movements on a scale from 0 to 100. The traditional rule says that above 70 means overbought and below 30 means oversold, but the real power of RSI lies in reading the divergence between price action and the indicator itself.
Divergence occurs when price moves in one direction while RSI moves in the opposite direction. It is one of the strongest early signals that reveals weakness in the current trend or a potential reversal.
Part 1: Bullish Divergence
This type appears during a downtrend and indicates weakening sellers and a potential upside bounce.
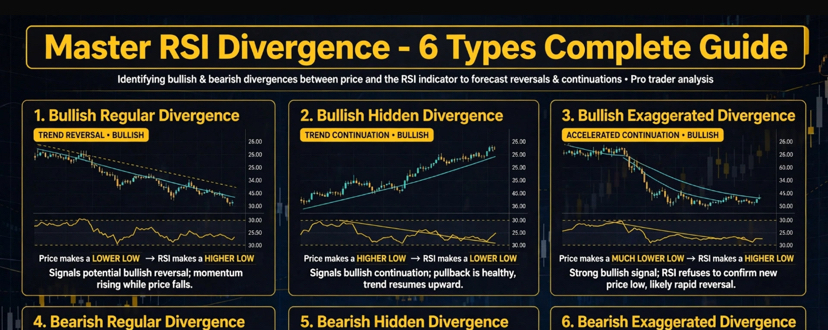
1. Regular Bullish Divergence - Strong Bullish Reversal Signal
This happens when price makes a lower low than the previous low, while RSI makes a higher low. Although price dropped further, bearish momentum weakened.
Practical Example: Bitcoin drops from 65,000 to 60,000, bounces to 62,000, then drops again to 58,000 - a lower low. At the same time, RSI was 28 at the first low and 41 at the second low - a higher low. This difference means sellers lost strength, and a professional trader waits for a strong bullish candle to enter a long position.
2. Hidden Bullish Divergence - Bullish Continuation Signal
Appears during a temporary correction in an uptrend. Price makes a higher low than the previous low, while RSI makes a lower low.
Practical Example: ETH is in an uptrend and corrects slightly. Its low was at 3,000, then rose to 3,500, then dropped to 3,200 - a higher low. At the same time, RSI fell from 55 to 38 - a lower low. Price maintains higher lows while RSI makes a lower low, meaning the correction is weak and the uptrend will continue. It's an opportunity to add to a long.
3. Exaggerated Bullish Divergence - Hidden Bullish Reversal
Occurs when price makes two almost equal lows, while RSI makes a higher low. Equal price lows with rising RSI lows reveal hidden accumulation.
Practical Example: BNB trading at 600 touches 580 twice, two equal lows. But RSI was 32 the first time and 48 the second time - a clear higher low. Price stability with rising RSI means silent buyers are entering, often followed by a breakout to the upside.
Part 2: Bearish Divergence
This type appears during an uptrend and indicates weakening buyers and a potential downside move.
4. Regular Bearish Divergence - Strong Bearish Reversal Signal
Happens when price makes a higher high than the previous high, while RSI makes a lower high. Despite price rising, buying power fades.
Practical Example: Solana SOL rises from 150 to 180, corrects to 165, then rises to 190 - a higher high. But RSI was 78 at the first high and 62 at the second high - a lower high. Price makes higher highs and RSI makes lower highs, a strong signal to exit or open a short.
5. Hidden Bearish Divergence - Bearish Continuation Signal
Occurs during a temporary bounce in a downtrend. Price makes a lower high than the previous high, while RSI makes a higher high.
Practical Example: XRP in a downtrend bounces from 0.50 to 0.58, then drops to 0.48, then bounces again to 0.55 - a lower high. RSI in the first bounce was 45 and in the second 58 - a higher high. Price makes lower highs and RSI makes higher highs, meaning the bounce is fake and the downtrend continues.
6. Exaggerated Bearish Divergence - Potential Bearish Reversal
Happens when price makes two equal highs, while RSI makes a lower high. Stable price highs with declining indicator highs reveal distribution.
Practical Example: DOGE at 0.15 makes two equal highs at 0.16 within a week, but RSI was 72 at the first high and 55 at the second - a lower high. Stable highs with weak momentum means buyers are exhausted, often followed by a sharp drop.
How to Apply Divergence Professionally on Binance?
Never enter a trade just because divergence appears. The professional way is to combine divergence with other tools. Draw divergence on the 4-hour or daily timeframe as it's more reliable than smaller timeframes, and keep RSI settings at 14. After divergence appears, wait for confirmation such as a break of a minor trendline or an engulfing candle, place your stop-loss below the last low for longs or above the last high for shorts, and combine the signal with strong support and resistance zones to increase your success rate.
$BTC $XRP $ETH
#BTC走势分析 #btc70k #BTC #Xrp🔥🔥
*RSI Divergence Explained: 6 Powerful Signals to Predict Crypto Reversals (2026 Guide)*
Mastering RSI Signals: The Complete Divergence Guide With Practical Examples
The Relative Strength Index (RSI) is one of the most important momentum indicators in the crypto market. It measures the speed and change of price movements on a scale from 0 to 100. The traditional rule says that above 70 means overbought and below 30 means oversold, but the real power of RSI lies in reading the divergence between price action and the indicator itself.
Divergence occurs when price moves in one direction while RSI moves in the opposite direction. It is one of the strongest early signals that reveals weakness in the current trend or a potential reversal.
Part 1: Bullish Divergence
This type appears during a downtrend and indicates weakening sellers and a potential upside bounce.
1. Regular Bullish Divergence - Strong Bullish Reversal Signal
This happens when price makes a lower low than the previous low, while RSI makes a higher low. Although price dropped further, bearish momentum weakened.
Practical Example: Bitcoin drops from 65,000 to 60,000, bounces to 62,000, then drops again to 58,000 - a lower low. At the same time, RSI was 28 at the first low and 41 at the second low - a higher low. This difference means sellers lost strength, and a professional trader waits for a strong bullish candle to enter a long position.
2. Hidden Bullish Divergence - Bullish Continuation Signal
Appears during a temporary correction in an uptrend. Price makes a higher low than the previous low, while RSI makes a lower low.
Practical Example: ETH is in an uptrend and corrects slightly. Its low was at 3,000, then rose to 3,500, then dropped to 3,200 - a higher low. At the same time, RSI fell from 55 to 38 - a lower low. Price maintains higher lows while RSI makes a lower low, meaning the correction is weak and the uptrend will continue. It's an opportunity to add to a long.
3. Exaggerated Bullish Divergence - Hidden Bullish Reversal
Occurs when price makes two almost equal lows, while RSI makes a higher low. Equal price lows with rising RSI lows reveal hidden accumulation.
Practical Example: BNB trading at 600 touches 580 twice, two equal lows. But RSI was 32 the first time and 48 the second time - a clear higher low. Price stability with rising RSI means silent buyers are entering, often followed by a breakout to the upside.
Part 2: Bearish Divergence
This type appears during an uptrend and indicates weakening buyers and a potential downside move.
4. Regular Bearish Divergence - Strong Bearish Reversal Signal
Happens when price makes a higher high than the previous high, while RSI makes a lower high. Despite price rising, buying power fades.
Practical Example: Solana SOL rises from 150 to 180, corrects to 165, then rises to 190 - a higher high. But RSI was 78 at the first high and 62 at the second high - a lower high. Price makes higher highs and RSI makes lower highs, a strong signal to exit or open a short.
5. Hidden Bearish Divergence - Bearish Continuation Signal
Occurs during a temporary bounce in a downtrend. Price makes a lower high than the previous high, while RSI makes a higher high.
Practical Example: XRP in a downtrend bounces from 0.50 to 0.58, then drops to 0.48, then bounces again to 0.55 - a lower high. RSI in the first bounce was 45 and in the second 58 - a higher high. Price makes lower highs and RSI makes higher highs, meaning the bounce is fake and the downtrend continues.
6. Exaggerated Bearish Divergence - Potential Bearish Reversal
Happens when price makes two equal highs, while RSI makes a lower high. Stable price highs with declining indicator highs reveal distribution.
Practical Example: DOGE at 0.15 makes two equal highs at 0.16 within a week, but RSI was 72 at the first high and 55 at the second - a lower high. Stable highs with weak momentum means buyers are exhausted, often followed by a sharp drop.
How to Apply Divergence Professionally on Binance?
Never enter a trade just because divergence appears. The professional way is to combine divergence with other tools. Draw divergence on the 4-hour or daily timeframe as it's more reliable than smaller timeframes, and keep RSI settings at 14. After divergence appears, wait for confirmation such as a break of a minor trendline or an engulfing candle, place your stop-loss below the last low for longs or above the last high for shorts, and combine the signal with strong support and resistance zones to increase your success rate.
$BTC $XRP $ETH
#BTC走势分析 #btc70k #BTC #Xrp🔥🔥
The Relative Strength Index (RSI) is one of the most important momentum indicators in the crypto market. It measures the speed and change of price movements on a scale from 0 to 100. The traditional rule says that above 70 means overbought and below 30 means oversold, but the real power of RSI lies in reading the divergence between price action and the indicator itself.
Divergence occurs when price moves in one direction while RSI moves in the opposite direction. It is one of the strongest early signals that reveals weakness in the current trend or a potential reversal.
Part 1: Bullish Divergence
This type appears during a downtrend and indicates weakening sellers and a potential upside bounce.
1. Regular Bullish Divergence - Strong Bullish Reversal Signal
This happens when price makes a lower low than the previous low, while RSI makes a higher low. Although price dropped further, bearish momentum weakened.
Practical Example: Bitcoin drops from 65,000 to 60,000, bounces to 62,000, then drops again to 58,000 - a lower low. At the same time, RSI was 28 at the first low and 41 at the second low - a higher low. This difference means sellers lost strength, and a professional trader waits for a strong bullish candle to enter a long position.
2. Hidden Bullish Divergence - Bullish Continuation Signal
Appears during a temporary correction in an uptrend. Price makes a higher low than the previous low, while RSI makes a lower low.
Practical Example: ETH is in an uptrend and corrects slightly. Its low was at 3,000, then rose to 3,500, then dropped to 3,200 - a higher low. At the same time, RSI fell from 55 to 38 - a lower low. Price maintains higher lows while RSI makes a lower low, meaning the correction is weak and the uptrend will continue. It's an opportunity to add to a long.
3. Exaggerated Bullish Divergence - Hidden Bullish Reversal
Occurs when price makes two almost equal lows, while RSI makes a higher low. Equal price lows with rising RSI lows reveal hidden accumulation.
Practical Example: BNB trading at 600 touches 580 twice, two equal lows. But RSI was 32 the first time and 48 the second time - a clear higher low. Price stability with rising RSI means silent buyers are entering, often followed by a breakout to the upside.
Part 2: Bearish Divergence
This type appears during an uptrend and indicates weakening buyers and a potential downside move.
4. Regular Bearish Divergence - Strong Bearish Reversal Signal
Happens when price makes a higher high than the previous high, while RSI makes a lower high. Despite price rising, buying power fades.
Practical Example: Solana SOL rises from 150 to 180, corrects to 165, then rises to 190 - a higher high. But RSI was 78 at the first high and 62 at the second high - a lower high. Price makes higher highs and RSI makes lower highs, a strong signal to exit or open a short.
5. Hidden Bearish Divergence - Bearish Continuation Signal
Occurs during a temporary bounce in a downtrend. Price makes a lower high than the previous high, while RSI makes a higher high.
Practical Example: XRP in a downtrend bounces from 0.50 to 0.58, then drops to 0.48, then bounces again to 0.55 - a lower high. RSI in the first bounce was 45 and in the second 58 - a higher high. Price makes lower highs and RSI makes higher highs, meaning the bounce is fake and the downtrend continues.
6. Exaggerated Bearish Divergence - Potential Bearish Reversal
Happens when price makes two equal highs, while RSI makes a lower high. Stable price highs with declining indicator highs reveal distribution.
Practical Example: DOGE at 0.15 makes two equal highs at 0.16 within a week, but RSI was 72 at the first high and 55 at the second - a lower high. Stable highs with weak momentum means buyers are exhausted, often followed by a sharp drop.
How to Apply Divergence Professionally on Binance?
Never enter a trade just because divergence appears. The professional way is to combine divergence with other tools. Draw divergence on the 4-hour or daily timeframe as it's more reliable than smaller timeframes, and keep RSI settings at 14. After divergence appears, wait for confirmation such as a break of a minor trendline or an engulfing candle, place your stop-loss below the last low for longs or above the last high for shorts, and combine the signal with strong support and resistance zones to increase your success rate.
$BTC $XRP $ETH
#BTC走势分析 #btc70k #BTC #Xrp🔥🔥
1
139
·
--
Article
Learn to Read RSI Signals ProfessionallyLearn to Read RSI Signals Professionally:
Complete Divergence Guide with Practical Application Examples
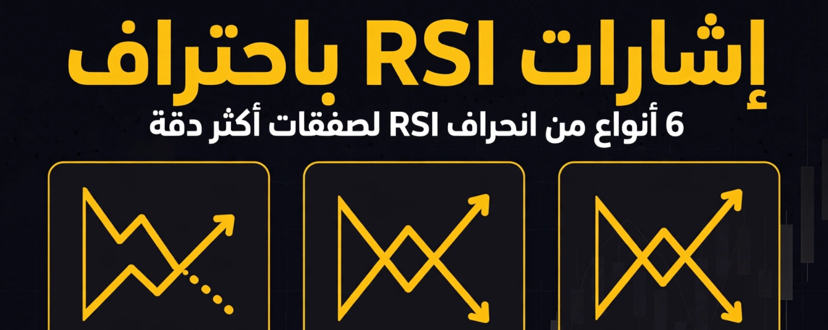
The Relative Strength Index (RSI) is one of the most important momentum indicators in the cryptocurrency market. Its function is to measure the speed and change in price movement on a scale from 0 to 100. The traditional rule says that a level above 70 indicates a buying overbought condition and a level above 30 indicates a selling overbought condition. However, the indicator’s true strength lies in reading the divergence between price action and the indicator’s movement itself.
Learn to Read RSI Signals Professionally
Learn to Read RSI Signals Professionally:
Complete Divergence Guide with Practical Application Examples
The Relative Strength Index (RSI) is one of the most important momentum indicators in the cryptocurrency market. Its function is to measure the speed and change in price movement on a scale from 0 to 100. The traditional rule says that a level above 70 indicates a buying overbought condition and a level above 30 indicates a selling overbought condition. However, the indicator’s true strength lies in reading the divergence between price action and the indicator’s movement itself.
Complete Divergence Guide with Practical Application Examples
The Relative Strength Index (RSI) is one of the most important momentum indicators in the cryptocurrency market. Its function is to measure the speed and change in price movement on a scale from 0 to 100. The traditional rule says that a level above 70 indicates a buying overbought condition and a level above 30 indicates a selling overbought condition. However, the indicator’s true strength lies in reading the divergence between price action and the indicator’s movement itself.
1
147
·
--

Article
Trading on the Binance platform and the offers it provides so you don't miss outBinance is the largest cryptocurrency trading platform in the world by trading volume. It offers an integrated ecosystem that is not limited to spot buying and selling, but extends to advanced investment tools.
Types of trading available on Binance
Spot trading is the foundation of the platform, where you can buy and sell more than 350 digital currencies for currencies such as USDT, BTC, and FDUSD, with fees starting from 0.1% and decreasing for BNB coin holders. The platform also provides futures trading with leverage of up to 125x, with USDT-Margined and COIN-Margined contracts, as well as options trading and margin trading.
Trading on the Binance platform and the offers it provides so you don't miss out
Binance is the largest cryptocurrency trading platform in the world by trading volume. It offers an integrated ecosystem that is not limited to spot buying and selling, but extends to advanced investment tools.
Types of trading available on Binance
Spot trading is the foundation of the platform, where you can buy and sell more than 350 digital currencies for currencies such as USDT, BTC, and FDUSD, with fees starting from 0.1% and decreasing for BNB coin holders. The platform also provides futures trading with leverage of up to 125x, with USDT-Margined and COIN-Margined contracts, as well as options trading and margin trading.
Types of trading available on Binance
Spot trading is the foundation of the platform, where you can buy and sell more than 350 digital currencies for currencies such as USDT, BTC, and FDUSD, with fees starting from 0.1% and decreasing for BNB coin holders. The platform also provides futures trading with leverage of up to 125x, with USDT-Margined and COIN-Margined contracts, as well as options trading and margin trading.
164
·
--
Article
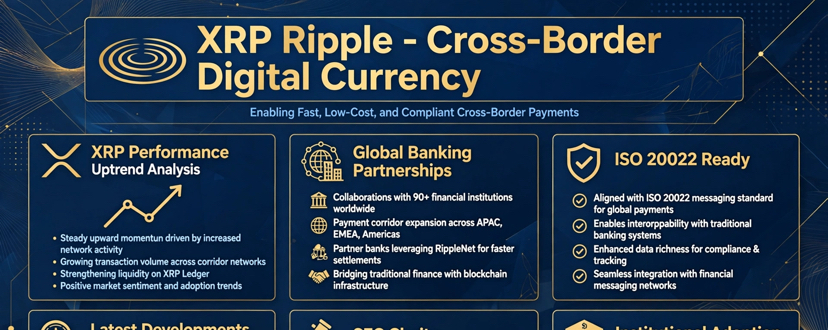
XRP Ripple: Latest Developments and Price Predictions for Q4 2026 and Early 2027XRP is currently going through a pivotal phase combining unprecedented institutional expansion with technical price pressure, trading around $1.52 at the end of September 2026.
I. Latest Fundamental Developments
1. Historic Breakthrough in Brazilian Financial Infrastructure
CSD BR, Brazil's Central Securities Depository managing over BRL 22 trillion in assets, announced an official partnership with Ripple to mirror securities ownership data on the XRP Ledger. The project started with fund shares from BTG Pactual, the largest investment bank in Latin America, and uses XRPL's Multi-Purpose Token standard and Ripple Custody. This step does not change legal frameworks but enhances transparency and traceability, and opens the door for future native issuance and peer-to-peer trading of other assets like real estate and agribusiness receivables certificates.
2. Integration with SWIFT via a Partner Handling 9% of Global Traffic
ACI Worldwide, which processes about 9% of global SWIFT traffic with an estimated annual volume of $155 trillion, has officially listed XRP Ledger as a supported settlement rail within SWIFT's new multi-chain framework. This integration is significant because SWIFT is rolling out ISO 20022 throughout 2026, and Ripple's technology is already natively compatible with it. This allows banks to use XRP as a settlement currency via the On-Demand Liquidity product and convert back to local fiat quickly.
3. XRP Ledger Upgrades and Security Event
The XRP Ledger Foundation released version xrpld 3.4.1 on September 25 as an emergency update addressing sensitive protocol issues. The update introduces amendment fixBatchV1_2, which has gained majority validator support and is expected to activate on October 9 if support continues. This upgrade will allow users to send up to 8 transactions together, including all-or-nothing exchanges, enabling simultaneous settlement of tokenized assets.
4. Escrow File and ETF Inflows
The escrow schedule still affects supply. Ripple locked 55 billion XRP into escrow in 2017 and releases up to 1 billion monthly, but typically re-escrows 700 to 800 million. For the remainder of 2026, a total of 3 billion XRP is expected to be unlocked between October and December, with about 2.1 billion to be re-escrowed, leaving a net new supply of only about 900 million, less than 1% of the total 100 billion supply. In contrast, reports indicate continued ETF inflows at a pace of up to $20 million daily, which helps absorb this supply.
II. Price Predictions for Q4 2026 and Early 2027
The current price is moving in a tight range between support at $1.48-$1.50 and resistance at $1.55, with a previous seven-month high at $1.66.
October - December 2026 Forecast:
The scenario outlined by AI models and analysts sets three paths after the end of the 2026 escrow releases:
- Bearish Scenario: Between $1.20 and $1.35 if institutional demand weakens and ETF flows drop below $5 million weekly.
- Base-Case Scenario: Between $1.60 and $1.90, with ChatGPT model forecasting a price of $1.85, a 22% increase from the current $1.52.
- Bullish Scenario: Between $2.20 and $2.80, supported by a break above the $1.66 level and reaching the August high of $1.70, paving the way toward $2.00.
Some analytical datasets put the average for October at $1.41 with an upside margin to $2.11, November at an average of $1.37, and December at an average of $1.33 with an upside margin to $2.02.
Q1 2027 Forecast:
More optimistic forecasts begin to appear in early 2027. VentureBurn estimates put the Q1 2027 average at $1.306, with gradual improvement in Q2 to $1.558. The main driver will be the U.S. SEC decisions on spot XRP fund filings from Grayscale, Bitwise, and WisdomTree, which if approved could inject billions in institutional flows.
The critical level traders are watching now is $1.36 to $1.37. Holding above it with continued whale accumulation and ETF flows at $20 million daily, and Bitcoin holding above $84,000, supports the upward path toward $1.70. A break below could return the coin to a prolonged consolidation phase.
$XRP #X #Xrp🔥🔥 #XRPRealityCheck
XRP Ripple: Latest Developments and Price Predictions for Q4 2026 and Early 2027
XRP is currently going through a pivotal phase combining unprecedented institutional expansion with technical price pressure, trading around $1.52 at the end of September 2026.
I. Latest Fundamental Developments
1. Historic Breakthrough in Brazilian Financial Infrastructure
CSD BR, Brazil's Central Securities Depository managing over BRL 22 trillion in assets, announced an official partnership with Ripple to mirror securities ownership data on the XRP Ledger. The project started with fund shares from BTG Pactual, the largest investment bank in Latin America, and uses XRPL's Multi-Purpose Token standard and Ripple Custody. This step does not change legal frameworks but enhances transparency and traceability, and opens the door for future native issuance and peer-to-peer trading of other assets like real estate and agribusiness receivables certificates.
2. Integration with SWIFT via a Partner Handling 9% of Global Traffic
ACI Worldwide, which processes about 9% of global SWIFT traffic with an estimated annual volume of $155 trillion, has officially listed XRP Ledger as a supported settlement rail within SWIFT's new multi-chain framework. This integration is significant because SWIFT is rolling out ISO 20022 throughout 2026, and Ripple's technology is already natively compatible with it. This allows banks to use XRP as a settlement currency via the On-Demand Liquidity product and convert back to local fiat quickly.
3. XRP Ledger Upgrades and Security Event
The XRP Ledger Foundation released version xrpld 3.4.1 on September 25 as an emergency update addressing sensitive protocol issues. The update introduces amendment fixBatchV1_2, which has gained majority validator support and is expected to activate on October 9 if support continues. This upgrade will allow users to send up to 8 transactions together, including all-or-nothing exchanges, enabling simultaneous settlement of tokenized assets.
4. Escrow File and ETF Inflows
The escrow schedule still affects supply. Ripple locked 55 billion XRP into escrow in 2017 and releases up to 1 billion monthly, but typically re-escrows 700 to 800 million. For the remainder of 2026, a total of 3 billion XRP is expected to be unlocked between October and December, with about 2.1 billion to be re-escrowed, leaving a net new supply of only about 900 million, less than 1% of the total 100 billion supply. In contrast, reports indicate continued ETF inflows at a pace of up to $20 million daily, which helps absorb this supply.
II. Price Predictions for Q4 2026 and Early 2027
The current price is moving in a tight range between support at $1.48-$1.50 and resistance at $1.55, with a previous seven-month high at $1.66.
October - December 2026 Forecast:
The scenario outlined by AI models and analysts sets three paths after the end of the 2026 escrow releases:
- Bearish Scenario: Between $1.20 and $1.35 if institutional demand weakens and ETF flows drop below $5 million weekly.
- Base-Case Scenario: Between $1.60 and $1.90, with ChatGPT model forecasting a price of $1.85, a 22% increase from the current $1.52.
- Bullish Scenario: Between $2.20 and $2.80, supported by a break above the $1.66 level and reaching the August high of $1.70, paving the way toward $2.00.
Some analytical datasets put the average for October at $1.41 with an upside margin to $2.11, November at an average of $1.37, and December at an average of $1.33 with an upside margin to $2.02.
Q1 2027 Forecast:
More optimistic forecasts begin to appear in early 2027. VentureBurn estimates put the Q1 2027 average at $1.306, with gradual improvement in Q2 to $1.558. The main driver will be the U.S. SEC decisions on spot XRP fund filings from Grayscale, Bitwise, and WisdomTree, which if approved could inject billions in institutional flows.
The critical level traders are watching now is $1.36 to $1.37. Holding above it with continued whale accumulation and ETF flows at $20 million daily, and Bitcoin holding above $84,000, supports the upward path toward $1.70. A break below could return the coin to a prolonged consolidation phase.
$XRP #X #Xrp🔥🔥 #XRPRealityCheck
I. Latest Fundamental Developments
1. Historic Breakthrough in Brazilian Financial Infrastructure
CSD BR, Brazil's Central Securities Depository managing over BRL 22 trillion in assets, announced an official partnership with Ripple to mirror securities ownership data on the XRP Ledger. The project started with fund shares from BTG Pactual, the largest investment bank in Latin America, and uses XRPL's Multi-Purpose Token standard and Ripple Custody. This step does not change legal frameworks but enhances transparency and traceability, and opens the door for future native issuance and peer-to-peer trading of other assets like real estate and agribusiness receivables certificates.
2. Integration with SWIFT via a Partner Handling 9% of Global Traffic
ACI Worldwide, which processes about 9% of global SWIFT traffic with an estimated annual volume of $155 trillion, has officially listed XRP Ledger as a supported settlement rail within SWIFT's new multi-chain framework. This integration is significant because SWIFT is rolling out ISO 20022 throughout 2026, and Ripple's technology is already natively compatible with it. This allows banks to use XRP as a settlement currency via the On-Demand Liquidity product and convert back to local fiat quickly.
3. XRP Ledger Upgrades and Security Event
The XRP Ledger Foundation released version xrpld 3.4.1 on September 25 as an emergency update addressing sensitive protocol issues. The update introduces amendment fixBatchV1_2, which has gained majority validator support and is expected to activate on October 9 if support continues. This upgrade will allow users to send up to 8 transactions together, including all-or-nothing exchanges, enabling simultaneous settlement of tokenized assets.
4. Escrow File and ETF Inflows
The escrow schedule still affects supply. Ripple locked 55 billion XRP into escrow in 2017 and releases up to 1 billion monthly, but typically re-escrows 700 to 800 million. For the remainder of 2026, a total of 3 billion XRP is expected to be unlocked between October and December, with about 2.1 billion to be re-escrowed, leaving a net new supply of only about 900 million, less than 1% of the total 100 billion supply. In contrast, reports indicate continued ETF inflows at a pace of up to $20 million daily, which helps absorb this supply.
II. Price Predictions for Q4 2026 and Early 2027
The current price is moving in a tight range between support at $1.48-$1.50 and resistance at $1.55, with a previous seven-month high at $1.66.
October - December 2026 Forecast:
The scenario outlined by AI models and analysts sets three paths after the end of the 2026 escrow releases:
- Bearish Scenario: Between $1.20 and $1.35 if institutional demand weakens and ETF flows drop below $5 million weekly.
- Base-Case Scenario: Between $1.60 and $1.90, with ChatGPT model forecasting a price of $1.85, a 22% increase from the current $1.52.
- Bullish Scenario: Between $2.20 and $2.80, supported by a break above the $1.66 level and reaching the August high of $1.70, paving the way toward $2.00.
Some analytical datasets put the average for October at $1.41 with an upside margin to $2.11, November at an average of $1.37, and December at an average of $1.33 with an upside margin to $2.02.
Q1 2027 Forecast:
More optimistic forecasts begin to appear in early 2027. VentureBurn estimates put the Q1 2027 average at $1.306, with gradual improvement in Q2 to $1.558. The main driver will be the U.S. SEC decisions on spot XRP fund filings from Grayscale, Bitwise, and WisdomTree, which if approved could inject billions in institutional flows.
The critical level traders are watching now is $1.36 to $1.37. Holding above it with continued whale accumulation and ETF flows at $20 million daily, and Bitcoin holding above $84,000, supports the upward path toward $1.70. A break below could return the coin to a prolonged consolidation phase.
$XRP #X #Xrp🔥🔥 #XRPRealityCheck
1
292
·
--
Verified
Article
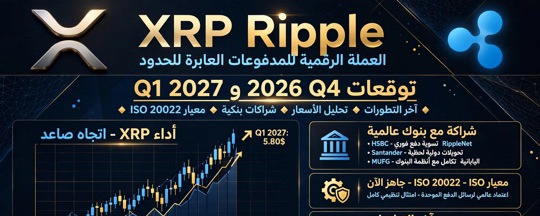
Ripple (XRP) Coin: Latest Developments and Price Predictions for Q4 2026 and the Beginning of 2027Ripple coin turning point: $XRP Currently in a pivotal stage combining unprecedented institutional expansion and technical price pressures, trading around the $1.52 level by the end of September 2026.
First: the most important developments
1. A historic breakthrough in Brazil’s financial infrastructure
CSD BR, the central securities depository in Brazil that manages more than 22 trillion Brazilian reais, announced an official partnership with Ripple to reflect securities ownership data on the XRP Ledger’s دفتر. The project began with shares from investment funds affiliated with BTG Pactual, the largest investment bank in Latin America, and uses XRPL’s Multi-Purpose Token standard and Ripple Custody service. This step does not change the legal frameworks; it enhances transparency and traceability, and paves the way in the future for primary issuance and peer-to-peer trading of other assets such as real estate and agricultural receivables instruments.
Ripple (XRP) Coin: Latest Developments and Price Predictions for Q4 2026 and the Beginning of 2027
Ripple coin turning point: $XRP Currently in a pivotal stage combining unprecedented institutional expansion and technical price pressures, trading around the $1.52 level by the end of September 2026.
First: the most important developments
1. A historic breakthrough in Brazil’s financial infrastructure
CSD BR, the central securities depository in Brazil that manages more than 22 trillion Brazilian reais, announced an official partnership with Ripple to reflect securities ownership data on the XRP Ledger’s دفتر. The project began with shares from investment funds affiliated with BTG Pactual, the largest investment bank in Latin America, and uses XRPL’s Multi-Purpose Token standard and Ripple Custody service. This step does not change the legal frameworks; it enhances transparency and traceability, and paves the way in the future for primary issuance and peer-to-peer trading of other assets such as real estate and agricultural receivables instruments.
First: the most important developments
1. A historic breakthrough in Brazil’s financial infrastructure
CSD BR, the central securities depository in Brazil that manages more than 22 trillion Brazilian reais, announced an official partnership with Ripple to reflect securities ownership data on the XRP Ledger’s دفتر. The project began with shares from investment funds affiliated with BTG Pactual, the largest investment bank in Latin America, and uses XRPL’s Multi-Purpose Token standard and Ripple Custody service. This step does not change the legal frameworks; it enhances transparency and traceability, and paves the way in the future for primary issuance and peer-to-peer trading of other assets such as real estate and agricultural receivables instruments.
1
1.2k
·
--
Article
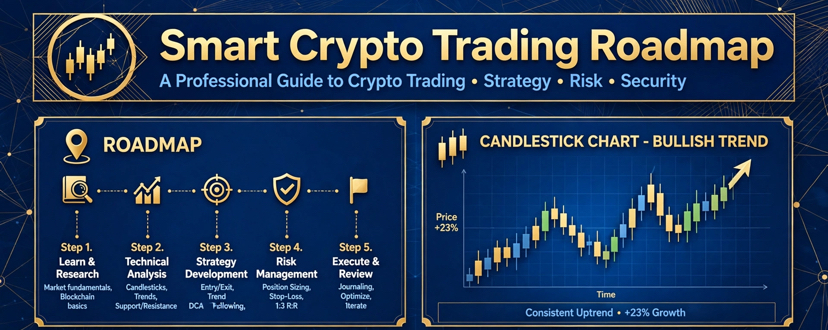
Smart Crypto Trading: From Zero to Pro - The Complete Roadmap for Risk Management and SuccessSteps to Trade Cryptocurrencies Correctly
Cryptocurrency trading is not random gambling, but an investment process with clear rules. Most of the losses beginners suffer are not caused by the market, but by the lack of a plan. Here are the practical steps to trade professionally.
1. Education and Understanding the Market Before Injecting Any Capital
Do not start trading while you cannot differentiate between a coin like Bitcoin $BTC and a project coin like $NMR . You must understand three types of analysis:
- Fundamental Analysis: Studying the project itself. Who is the team? What problem does it solve? Does it have real partnerships?
- Example: When you want to buy a coin like Numeraire, fundamental analysis makes you look for the fact that the project is backed by JPMorgan and manages $700 million, not just a meme coin with no utility.
- Technical Analysis: Reading charts and indicators like RSI and Moving Average.
- Market Sentiment Analysis: Following news and liquidity.
2. Choosing a Secure Exchange and Wallet
The biggest mistake is leaving your coins on untrusted platforms. Follow this division:
- For fast trading: Use major licensed centralized platforms like Binance, Coinbase, or Kraken.
- For long-term storage: Move your coins to a Cold Wallet like Ledger or Trezor.
Practical example: A trader bought $1000 worth of $ETH and left it on a small unknown exchange, the exchange shut down and his money disappeared. If he had moved it to his own wallet, he would have been safe.
3. Setting a Written Trading Plan and Money Management
Do not enter any trade without pre-defining three numbers:
- Entry Point: The price at which you will buy.
- Stop Loss Point: The price at which you will exit if the market reverses. The golden rule is to risk no more than 1% to 2% of your capital in a single trade.
- Take Profit Point: The price at which you will sell.
Example: Your capital is $10,000. You decide to buy SOL at $150. You set the stop loss at $140 (a $10 loss per coin), and take profit at $180. This way the risk-to-reward ratio is 3 to 1. Even if you lose 5 trades and win only 3, you will still be profitable.
4. Applying a Clear Strategy and Not Switching Between Them
Choose one strategy and stick to it for at least 3 months:
- Scalping: Fast trades for minutes aiming for 1% to 3%.
- Swing Trading: Holding the coin for days to weeks to benefit from an uptrend. Example: Buying a coin after a 30% correction and waiting for a 50% rebound.
- Long-term Investing HODL: Buying core coins like BTC and ETH and storing them for years regardless of short-term volatility.
5. Controlling Emotions and Documenting Everything
The two arch-enemies of a trader are greed and fear. When the market rises 20% he gets greedy and buys at the top, and when it drops 20% he gets scared and sells at the bottom.
The solution is a Trading Journal. Record in it:
The date of the trade, coin name, reason for entry, entry and exit price, and profit or loss.
After a month of logging, you will discover for example: that 80% of your losses come from trading meme coins after seeing posts on Twitter, while your profits come from trading strong project coins.
#btc70k #btc70k #ETH🔥🔥🔥🔥🔥🔥 #BTC走势分析
Smart Crypto Trading: From Zero to Pro - The Complete Roadmap for Risk Management and Success
Steps to Trade Cryptocurrencies Correctly
Cryptocurrency trading is not random gambling, but an investment process with clear rules. Most of the losses beginners suffer are not caused by the market, but by the lack of a plan. Here are the practical steps to trade professionally.
1. Education and Understanding the Market Before Injecting Any Capital
Do not start trading while you cannot differentiate between a coin like Bitcoin $BTC and a project coin like $NMR . You must understand three types of analysis:
- Fundamental Analysis: Studying the project itself. Who is the team? What problem does it solve? Does it have real partnerships?
- Example: When you want to buy a coin like Numeraire, fundamental analysis makes you look for the fact that the project is backed by JPMorgan and manages $700 million, not just a meme coin with no utility.
- Technical Analysis: Reading charts and indicators like RSI and Moving Average.
- Market Sentiment Analysis: Following news and liquidity.
2. Choosing a Secure Exchange and Wallet
The biggest mistake is leaving your coins on untrusted platforms. Follow this division:
- For fast trading: Use major licensed centralized platforms like Binance, Coinbase, or Kraken.
- For long-term storage: Move your coins to a Cold Wallet like Ledger or Trezor.
Practical example: A trader bought $1000 worth of $ETH and left it on a small unknown exchange, the exchange shut down and his money disappeared. If he had moved it to his own wallet, he would have been safe.
3. Setting a Written Trading Plan and Money Management
Do not enter any trade without pre-defining three numbers:
- Entry Point: The price at which you will buy.
- Stop Loss Point: The price at which you will exit if the market reverses. The golden rule is to risk no more than 1% to 2% of your capital in a single trade.
- Take Profit Point: The price at which you will sell.
Example: Your capital is $10,000. You decide to buy SOL at $150. You set the stop loss at $140 (a $10 loss per coin), and take profit at $180. This way the risk-to-reward ratio is 3 to 1. Even if you lose 5 trades and win only 3, you will still be profitable.
4. Applying a Clear Strategy and Not Switching Between Them
Choose one strategy and stick to it for at least 3 months:
- Scalping: Fast trades for minutes aiming for 1% to 3%.
- Swing Trading: Holding the coin for days to weeks to benefit from an uptrend. Example: Buying a coin after a 30% correction and waiting for a 50% rebound.
- Long-term Investing HODL: Buying core coins like BTC and ETH and storing them for years regardless of short-term volatility.
5. Controlling Emotions and Documenting Everything
The two arch-enemies of a trader are greed and fear. When the market rises 20% he gets greedy and buys at the top, and when it drops 20% he gets scared and sells at the bottom.
The solution is a Trading Journal. Record in it:
The date of the trade, coin name, reason for entry, entry and exit price, and profit or loss.
After a month of logging, you will discover for example: that 80% of your losses come from trading meme coins after seeing posts on Twitter, while your profits come from trading strong project coins.
#btc70k #btc70k #ETH🔥🔥🔥🔥🔥🔥 #BTC走势分析
Cryptocurrency trading is not random gambling, but an investment process with clear rules. Most of the losses beginners suffer are not caused by the market, but by the lack of a plan. Here are the practical steps to trade professionally.
1. Education and Understanding the Market Before Injecting Any Capital
Do not start trading while you cannot differentiate between a coin like Bitcoin $BTC and a project coin like $NMR . You must understand three types of analysis:
- Fundamental Analysis: Studying the project itself. Who is the team? What problem does it solve? Does it have real partnerships?
- Example: When you want to buy a coin like Numeraire, fundamental analysis makes you look for the fact that the project is backed by JPMorgan and manages $700 million, not just a meme coin with no utility.
- Technical Analysis: Reading charts and indicators like RSI and Moving Average.
- Market Sentiment Analysis: Following news and liquidity.
2. Choosing a Secure Exchange and Wallet
The biggest mistake is leaving your coins on untrusted platforms. Follow this division:
- For fast trading: Use major licensed centralized platforms like Binance, Coinbase, or Kraken.
- For long-term storage: Move your coins to a Cold Wallet like Ledger or Trezor.
Practical example: A trader bought $1000 worth of $ETH and left it on a small unknown exchange, the exchange shut down and his money disappeared. If he had moved it to his own wallet, he would have been safe.
3. Setting a Written Trading Plan and Money Management
Do not enter any trade without pre-defining three numbers:
- Entry Point: The price at which you will buy.
- Stop Loss Point: The price at which you will exit if the market reverses. The golden rule is to risk no more than 1% to 2% of your capital in a single trade.
- Take Profit Point: The price at which you will sell.
Example: Your capital is $10,000. You decide to buy SOL at $150. You set the stop loss at $140 (a $10 loss per coin), and take profit at $180. This way the risk-to-reward ratio is 3 to 1. Even if you lose 5 trades and win only 3, you will still be profitable.
4. Applying a Clear Strategy and Not Switching Between Them
Choose one strategy and stick to it for at least 3 months:
- Scalping: Fast trades for minutes aiming for 1% to 3%.
- Swing Trading: Holding the coin for days to weeks to benefit from an uptrend. Example: Buying a coin after a 30% correction and waiting for a 50% rebound.
- Long-term Investing HODL: Buying core coins like BTC and ETH and storing them for years regardless of short-term volatility.
5. Controlling Emotions and Documenting Everything
The two arch-enemies of a trader are greed and fear. When the market rises 20% he gets greedy and buys at the top, and when it drops 20% he gets scared and sells at the bottom.
The solution is a Trading Journal. Record in it:
The date of the trade, coin name, reason for entry, entry and exit price, and profit or loss.
After a month of logging, you will discover for example: that 80% of your losses come from trading meme coins after seeing posts on Twitter, while your profits come from trading strong project coins.
#btc70k #btc70k #ETH🔥🔥🔥🔥🔥🔥 #BTC走势分析
1
257
·
--
Article
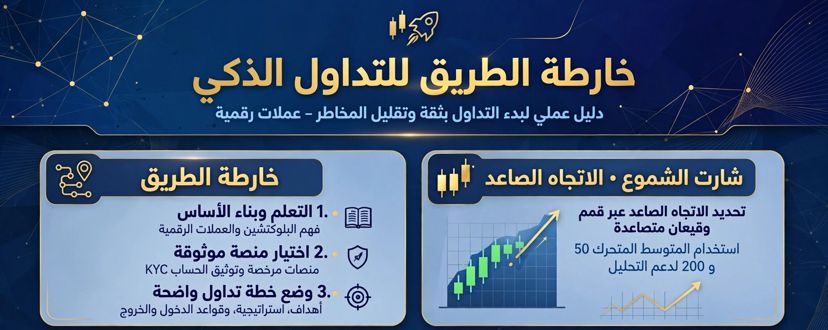
A Roadmap from Zero to Pro: A Smart Trader’s Guide in the Digital Currency MarketSteps for trading digital currencies correctly
Trading digital currencies is not random gambling, but an investment process with clear rules. Many of the losses beginners experience are not due to the market, but due to the absence of a plan. Below are practical steps to trade professionally.
1. Learning and understanding the market before injecting any capital
A Roadmap from Zero to Pro: A Smart Trader’s Guide in the Digital Currency Market
Steps for trading digital currencies correctly
Trading digital currencies is not random gambling, but an investment process with clear rules. Many of the losses beginners experience are not due to the market, but due to the absence of a plan. Below are practical steps to trade professionally.
1. Learning and understanding the market before injecting any capital
Trading digital currencies is not random gambling, but an investment process with clear rules. Many of the losses beginners experience are not due to the market, but due to the absence of a plan. Below are practical steps to trade professionally.
1. Learning and understanding the market before injecting any capital
3
2
1.1k
·
--
Article
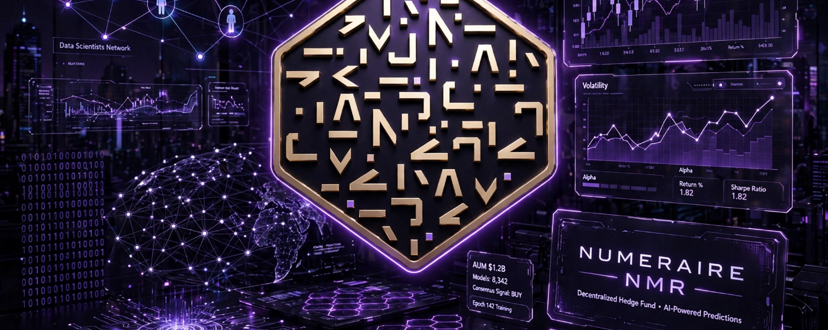
NMR Explained:HowAl, Data Scientists,and Ethereum Power the World’s First Decentralized Hedge FundNMR Coin - Numeraire
$NMR is the native cryptocurrency of the Numerai platform, a San Francisco-based hedge fund founded in 2015 by Richard Craib, a Cornell graduate in mathematics and economics.
The platform's concept is completely different from other hedge funds. Numerai does not hire internal analysts, but instead relies on a global network of thousands of anonymous data scientists around the world. The company provides them with encrypted and obfuscated financial data, and they build AI models that predict stock market movements.
How does the coin work?
NMR is a token built on the Ethereum network under the ERC-20 standard. Its total supply is limited to only 11 million coins, with around 7.6 million currently circulating.
Its primary use is for staking in a weekly competition called the Numerai Tournament:
1. The data scientist submits their market prediction
2. They place a bet alongside their prediction with an amount of NMR coins
3. If their prediction is correct in the real market, they get their stake back and receive an additional reward in NMR
4. If their prediction is wrong, the coins they staked are burned
This way, the platform ensures that participants do not send random predictions, but only bet on models they are confident in.
After that, Numerai collects all the winning predictions and merges them into one massive model called the Meta Model, and this model is what the company uses for actual trading on the stock exchange.
The Coin's Ecosystem
- Tournament: The main weekly competition for data scientists
- Signals: Allows users to trade equities directly on the blockchain using their own models
- Erasure Protocol: A protocol developed by the company to sell predictions in a decentralized way
Current Status of the Project
The project is not just an idea, it is a real hedge fund currently managing around $700 million in assets, after managing only $60 million three years ago. In August 2025, it secured a $500 million commitment from JPMorgan Asset Management to expand its operations.
It also raised a Series C funding round of $30 million in November 2025 led by major university endowments, bringing the company's valuation to $500 million. This investment caused the price of the NMR coin to rise more than 40% in a single day.
And because the company distributes NMR rewards from its own treasury, it conducts periodic buybacks from the open market. So far it has made three purchases totaling $3.2 million via Coinbase Institutional to replenish its treasury, where it has about 3.1 million coins left.
The coin's price today moves around $9 to $10, with a market cap of approximately $73 million and a daily trading volume of $7 million.
#NMR
NMR Explained:HowAl, Data Scientists,and Ethereum Power the World’s First Decentralized Hedge Fund
NMR Coin - Numeraire
$NMR is the native cryptocurrency of the Numerai platform, a San Francisco-based hedge fund founded in 2015 by Richard Craib, a Cornell graduate in mathematics and economics.
The platform's concept is completely different from other hedge funds. Numerai does not hire internal analysts, but instead relies on a global network of thousands of anonymous data scientists around the world. The company provides them with encrypted and obfuscated financial data, and they build AI models that predict stock market movements.
How does the coin work?
NMR is a token built on the Ethereum network under the ERC-20 standard. Its total supply is limited to only 11 million coins, with around 7.6 million currently circulating.
Its primary use is for staking in a weekly competition called the Numerai Tournament:
1. The data scientist submits their market prediction
2. They place a bet alongside their prediction with an amount of NMR coins
3. If their prediction is correct in the real market, they get their stake back and receive an additional reward in NMR
4. If their prediction is wrong, the coins they staked are burned
This way, the platform ensures that participants do not send random predictions, but only bet on models they are confident in.
After that, Numerai collects all the winning predictions and merges them into one massive model called the Meta Model, and this model is what the company uses for actual trading on the stock exchange.
The Coin's Ecosystem
- Tournament: The main weekly competition for data scientists
- Signals: Allows users to trade equities directly on the blockchain using their own models
- Erasure Protocol: A protocol developed by the company to sell predictions in a decentralized way
Current Status of the Project
The project is not just an idea, it is a real hedge fund currently managing around $700 million in assets, after managing only $60 million three years ago. In August 2025, it secured a $500 million commitment from JPMorgan Asset Management to expand its operations.
It also raised a Series C funding round of $30 million in November 2025 led by major university endowments, bringing the company's valuation to $500 million. This investment caused the price of the NMR coin to rise more than 40% in a single day.
And because the company distributes NMR rewards from its own treasury, it conducts periodic buybacks from the open market. So far it has made three purchases totaling $3.2 million via Coinbase Institutional to replenish its treasury, where it has about 3.1 million coins left.
The coin's price today moves around $9 to $10, with a market cap of approximately $73 million and a daily trading volume of $7 million.
#NMR
$NMR is the native cryptocurrency of the Numerai platform, a San Francisco-based hedge fund founded in 2015 by Richard Craib, a Cornell graduate in mathematics and economics.
The platform's concept is completely different from other hedge funds. Numerai does not hire internal analysts, but instead relies on a global network of thousands of anonymous data scientists around the world. The company provides them with encrypted and obfuscated financial data, and they build AI models that predict stock market movements.
How does the coin work?
NMR is a token built on the Ethereum network under the ERC-20 standard. Its total supply is limited to only 11 million coins, with around 7.6 million currently circulating.
Its primary use is for staking in a weekly competition called the Numerai Tournament:
1. The data scientist submits their market prediction
2. They place a bet alongside their prediction with an amount of NMR coins
3. If their prediction is correct in the real market, they get their stake back and receive an additional reward in NMR
4. If their prediction is wrong, the coins they staked are burned
This way, the platform ensures that participants do not send random predictions, but only bet on models they are confident in.
After that, Numerai collects all the winning predictions and merges them into one massive model called the Meta Model, and this model is what the company uses for actual trading on the stock exchange.
The Coin's Ecosystem
- Tournament: The main weekly competition for data scientists
- Signals: Allows users to trade equities directly on the blockchain using their own models
- Erasure Protocol: A protocol developed by the company to sell predictions in a decentralized way
Current Status of the Project
The project is not just an idea, it is a real hedge fund currently managing around $700 million in assets, after managing only $60 million three years ago. In August 2025, it secured a $500 million commitment from JPMorgan Asset Management to expand its operations.
It also raised a Series C funding round of $30 million in November 2025 led by major university endowments, bringing the company's valuation to $500 million. This investment caused the price of the NMR coin to rise more than 40% in a single day.
And because the company distributes NMR rewards from its own treasury, it conducts periodic buybacks from the open market. So far it has made three purchases totaling $3.2 million via Coinbase Institutional to replenish its treasury, where it has about 3.1 million coins left.
The coin's price today moves around $9 to $10, with a market cap of approximately $73 million and a daily trading volume of $7 million.
#NMR
1
184
·
--
Article
A real hedge fund that jumped from 60 million to 700 millionNMR - Numeraire currency
A currency $NMR is the digital currency of the Numerai platform. It is a hedge fund based in San Francisco, founded in 2015 by Richard Crepp, a mathematics and economics graduate from Cornell University.
The platform’s concept is completely different from other hedge funds. Numerai does not employ in-house analysts; instead, it relies on a global network of thousands of anonymous data scientists around the world. The company provides them with encrypted and ambiguous financial data, and they build AI models that predict the movement of stock markets.
A real hedge fund that jumped from 60 million to 700 million
NMR - Numeraire currency
A currency $NMR is the digital currency of the Numerai platform. It is a hedge fund based in San Francisco, founded in 2015 by Richard Crepp, a mathematics and economics graduate from Cornell University.
The platform’s concept is completely different from other hedge funds. Numerai does not employ in-house analysts; instead, it relies on a global network of thousands of anonymous data scientists around the world. The company provides them with encrypted and ambiguous financial data, and they build AI models that predict the movement of stock markets.
A currency $NMR is the digital currency of the Numerai platform. It is a hedge fund based in San Francisco, founded in 2015 by Richard Crepp, a mathematics and economics graduate from Cornell University.
The platform’s concept is completely different from other hedge funds. Numerai does not employ in-house analysts; instead, it relies on a global network of thousands of anonymous data scientists around the world. The company provides them with encrypted and ambiguous financial data, and they build AI models that predict the movement of stock markets.
1
170
·
--

Article
Beautiful science fictionWhat if I bought with an amount of $1000 every year from the year Bitcoin appeared?
Literal scenario: $1000 every year from 2009 to 2026
Your total investment = $18,000 (18 years)
But because of the year 2009 alone:
- In 2009, the price of Bitcoin was $0.00076, meaning $1000 could get you 1,315,789 bitcoins!
- In 2010, at a price of $0.30, you could get 3,333 bitcoins
- All the years from 2011 until today combined give you only less than 300 bitcoins
Beautiful science fiction
What if I bought with an amount of $1000 every year from the year Bitcoin appeared?
Literal scenario: $1000 every year from 2009 to 2026
Your total investment = $18,000 (18 years)
But because of the year 2009 alone:
- In 2009, the price of Bitcoin was $0.00076, meaning $1000 could get you 1,315,789 bitcoins!
- In 2010, at a price of $0.30, you could get 3,333 bitcoins
- All the years from 2011 until today combined give you only less than 300 bitcoins
Literal scenario: $1000 every year from 2009 to 2026
Your total investment = $18,000 (18 years)
But because of the year 2009 alone:
- In 2009, the price of Bitcoin was $0.00076, meaning $1000 could get you 1,315,789 bitcoins!
- In 2010, at a price of $0.30, you could get 3,333 bitcoins
- All the years from 2011 until today combined give you only less than 300 bitcoins
1
156
·
--
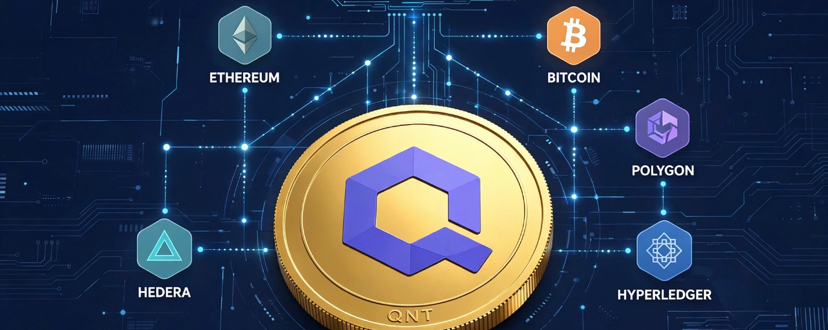
Article
Comprehensive Overview and Price PredictionsQuant coin ( $QNT ):
What is QNT coin?
Quant is considered one of the few projects that does not compete with blockchains, but rather connects them with each other. Its core product is Overledger, an operating system that allows companies, banks, and governments to connect different networks such as Ethereum and Bitcoin and Ripple, even traditional banking systems, without needing to change their infrastructure.
Comprehensive Overview and Price Predictions
Quant coin ( $QNT ):
What is QNT coin?
Quant is considered one of the few projects that does not compete with blockchains, but rather connects them with each other. Its core product is Overledger, an operating system that allows companies, banks, and governments to connect different networks such as Ethereum and Bitcoin and Ripple, even traditional banking systems, without needing to change their infrastructure.
What is QNT coin?
Quant is considered one of the few projects that does not compete with blockchains, but rather connects them with each other. Its core product is Overledger, an operating system that allows companies, banks, and governments to connect different networks such as Ethereum and Bitcoin and Ripple, even traditional banking systems, without needing to change their infrastructure.
1
200
·
--
Article
Btc 100000Bitcoin is on the verge of one hundred thousand, and the question is no longer whether it will reach it, but when.
What’s happening in the market right now is not a routine surge, but a moment of historical turning. Bitcoin is trading today around $84,000 to $86,000 after reclaiming its momentum strongly this week, and the market is preparing for a price breakout we haven’t seen in years.
First, institutional demand is back with unprecedented strength. Spot ETF funds recorded inflows of $2.25 billion this week—the highest pace since October 2025. This means Wall Street is no longer just watching; it’s buying. And when institutions buy, they’re not buying for tomorrow, but for the years ahead.
Btc 100000
Bitcoin is on the verge of one hundred thousand, and the question is no longer whether it will reach it, but when.
What’s happening in the market right now is not a routine surge, but a moment of historical turning. Bitcoin is trading today around $84,000 to $86,000 after reclaiming its momentum strongly this week, and the market is preparing for a price breakout we haven’t seen in years.
First, institutional demand is back with unprecedented strength. Spot ETF funds recorded inflows of $2.25 billion this week—the highest pace since October 2025. This means Wall Street is no longer just watching; it’s buying. And when institutions buy, they’re not buying for tomorrow, but for the years ahead.
What’s happening in the market right now is not a routine surge, but a moment of historical turning. Bitcoin is trading today around $84,000 to $86,000 after reclaiming its momentum strongly this week, and the market is preparing for a price breakout we haven’t seen in years.
First, institutional demand is back with unprecedented strength. Spot ETF funds recorded inflows of $2.25 billion this week—the highest pace since October 2025. This means Wall Street is no longer just watching; it’s buying. And when institutions buy, they’re not buying for tomorrow, but for the years ahead.
1
135
·
--

Article
Future of SyriaStrategic Future of Syria:
Between an invaluable position and challenges that cannot be postponed
The future of Syria cannot be understood unless we understand its geographic past. Syria is not merely a country, but a crossroads. It connects the Mediterranean to the Gulf, Turkey to Jordan, and guards the gate of the Mashriq. Whoever controls its stability holds the key to four directions. This location is its greatest asset, and its greatest curse at the same time.
Future of Syria
Strategic Future of Syria:
Between an invaluable position and challenges that cannot be postponed
The future of Syria cannot be understood unless we understand its geographic past. Syria is not merely a country, but a crossroads. It connects the Mediterranean to the Gulf, Turkey to Jordan, and guards the gate of the Mashriq. Whoever controls its stability holds the key to four directions. This location is its greatest asset, and its greatest curse at the same time.
Between an invaluable position and challenges that cannot be postponed
The future of Syria cannot be understood unless we understand its geographic past. Syria is not merely a country, but a crossroads. It connects the Mediterranean to the Gulf, Turkey to Jordan, and guards the gate of the Mashriq. Whoever controls its stability holds the key to four directions. This location is its greatest asset, and its greatest curse at the same time.
1
8
·
--
Article
The future you dream of is what you decide today...!The relationship between the past and the future: how one decision can shape your entire destiny
We live in a big illusion—we think time is a straight line that begins with the past and ends with the future. The truth is much deeper than that. The past and the future are not different places; they are two sides of the same coin called “your decision today.”
First: the past is not a memory, but programming
Everything that has happened to you hasn’t ended. It’s still working in the background like a hidden program. Your thinking about money, your fear of taking risks, your confidence in yourself—these are not traits you were born with. They’re the results of decisions you made based on what you learned from your family, your community, and your old experiences.
The future you dream of is what you decide today...!
The relationship between the past and the future: how one decision can shape your entire destiny
We live in a big illusion—we think time is a straight line that begins with the past and ends with the future. The truth is much deeper than that. The past and the future are not different places; they are two sides of the same coin called “your decision today.”
First: the past is not a memory, but programming
Everything that has happened to you hasn’t ended. It’s still working in the background like a hidden program. Your thinking about money, your fear of taking risks, your confidence in yourself—these are not traits you were born with. They’re the results of decisions you made based on what you learned from your family, your community, and your old experiences.
We live in a big illusion—we think time is a straight line that begins with the past and ends with the future. The truth is much deeper than that. The past and the future are not different places; they are two sides of the same coin called “your decision today.”
First: the past is not a memory, but programming
Everything that has happened to you hasn’t ended. It’s still working in the background like a hidden program. Your thinking about money, your fear of taking risks, your confidence in yourself—these are not traits you were born with. They’re the results of decisions you made based on what you learned from your family, your community, and your old experiences.
39
·
--
The Next Wealth Won’t Be a CoincidenceThe Future of AI Coins:
If we went back ten years, anyone telling you about a digital currency run by a decentralized smart network would be considered a dreamer. Today, we’re not talking about a fantasy—we’re talking about the fastest-growing sector in the cryptocurrency world: AI coins.
Why AI coins are the future, not just a trend?
The Next Wealth Won’t Be a Coincidence
The Future of AI Coins:
If we went back ten years, anyone telling you about a digital currency run by a decentralized smart network would be considered a dreamer. Today, we’re not talking about a fantasy—we’re talking about the fastest-growing sector in the cryptocurrency world: AI coins.
Why AI coins are the future, not just a trend?
If we went back ten years, anyone telling you about a digital currency run by a decentralized smart network would be considered a dreamer. Today, we’re not talking about a fantasy—we’re talking about the fastest-growing sector in the cryptocurrency world: AI coins.
Why AI coins are the future, not just a trend?
285
Log in to explore more content
Join global crypto users on Binance Square
⚡️ Get latest and useful information about crypto.
💬 Trusted by the world’s largest crypto exchange.
👍 Discover real insights from verified creators.
Email / Phone number
Trending Topics
BNBSurpasses$790
1,298 views
36 Discussing
$BNB strategic long plan -> FOCUS NOW
BNB has created 2 strong lows after taking out internal liquidity
I'm expecting a move towards swing high $815-$830 and looking for a long on a retest of the green box
#BNBSurpasses$790 #bnb
Ghost Writer
·0 Likes
·496 views
ZamaRises15.99%ToIntradayHigh$0.09
802 views
40 Discussing
BitcoinSpotETFsDraw$6.34BInflowsInQ3
1,698 views
34 Discussing