

带单之星-雾哥-先赚后付
51 Posts

带单之星-雾哥-先赚后付
Report
Block User
多年职业交易员,专注合约波段操作,全职交易,稳健复利形选手。不返佣没有付费群,可跟单吃肉,低成本高回报。
0 Following
2 Followers
1 Liked
Posts
·
--
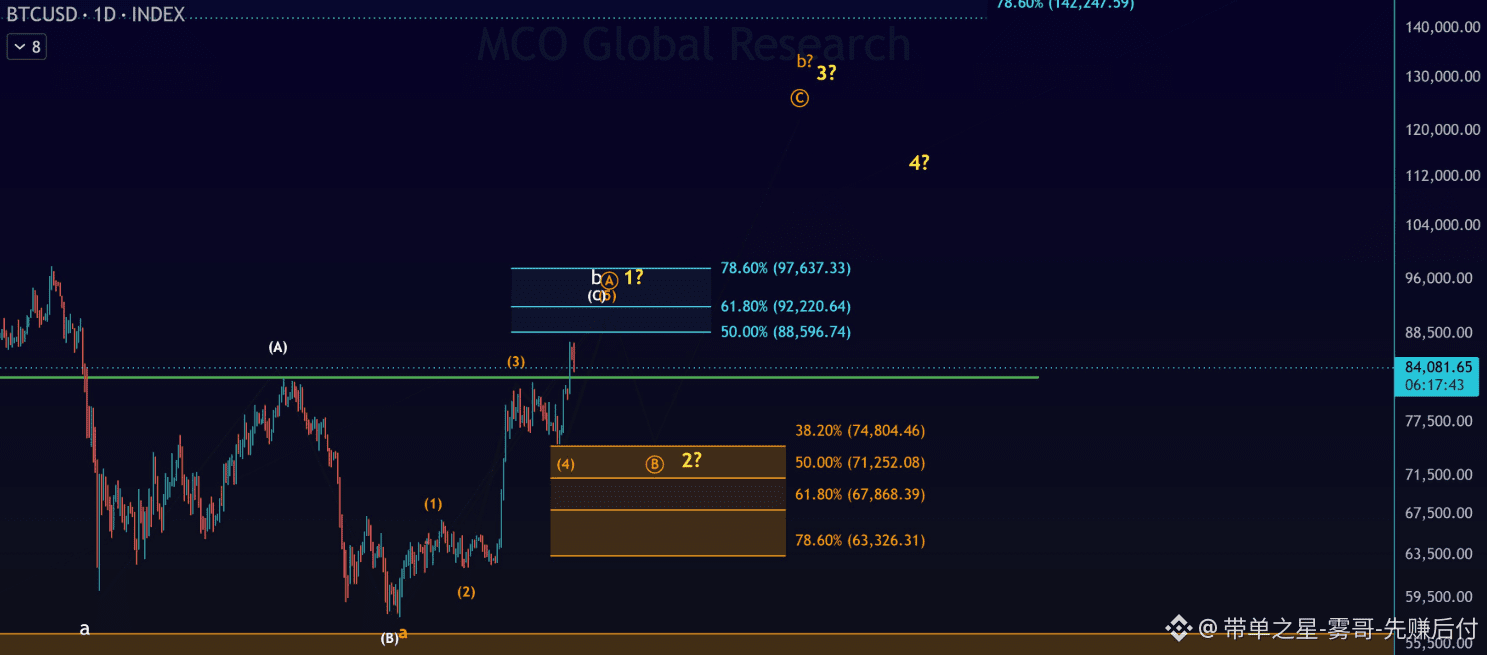
$BTC Bitcoin has just completed a move that can be regarded as a five-wave advance. The minimum requirements have been met. Price could potentially move higher to $93,000, which would shift the Fibonacci support zone upward. Alternatively, the A/B wave may already have topped. In any case, once a local top forms, attention will shift to the higher-timeframe support zones to prepare for a retracement of the B wave or second wave. This upward move puts pressure on the bearish scenario, but it does not fully end the bearish outlook.#BTC #BTC走势分析
$BTC Bitcoin has just completed a move that can be regarded as a five-wave advance. The minimum requirements have been met. Price could potentially move higher to $93,000, which would shift the Fibonacci support zone upward. Alternatively, the A/B wave may already have topped. In any case, once a local top forms, attention will shift to the higher-timeframe support zones to prepare for a retracement of the B wave or second wave. This upward move puts pressure on the bearish scenario, but it does not fully end the bearish outlook.#BTC #BTC走势分析
1
115
·
--
Some major changes are quietly taking place in the U.S. dollar…… While I’m tracking cryptocurrencies, I’m also keeping a close eye on the U.S. Dollar Index #DXY
First of all, what is the U.S. Dollar Index? Let me explain it simply: it’s an index that reflects the strength of the U.S. dollar against major currencies such as the euro, the Japanese yen, and the British pound. Therefore, if the U.S. Dollar Index rises, it means the dollar is strengthening; if it falls, it means the dollar is temporarily pulling back. So what does this
have to do with cryptocurrencies #kripto ?
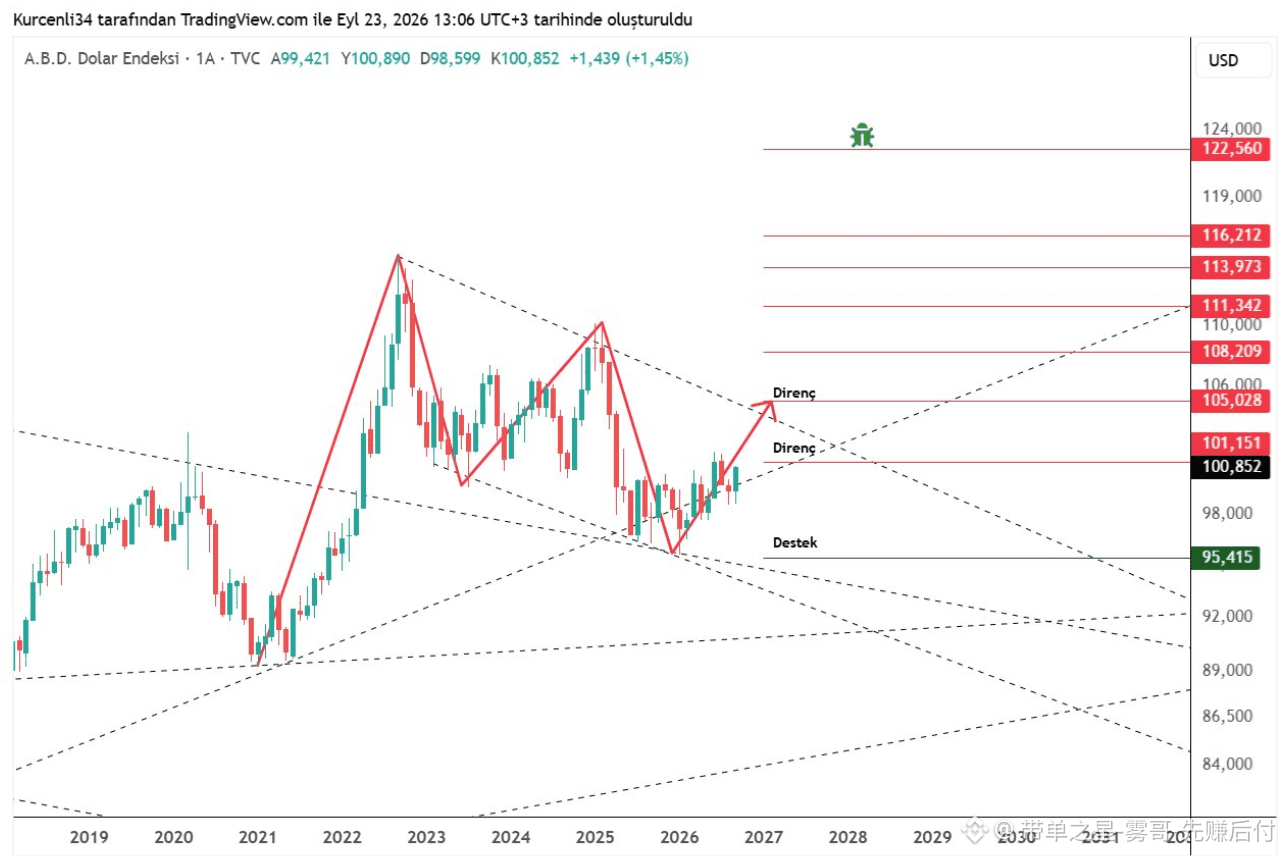
In general, a strong U.S. dollar is not favorable for risk assets. When the U.S. Dollar Index weakens, the price movements of Bitcoin and other cryptocurrencies become more free. Of course, this is not an absolute rule—I mainly use it to gauge overall market sentiment. Based on my chart…… The U.S. Dollar Index is currently near 100.85 and has just touched a key area. The first thing I’m watching is 101.15. If it breaks above that area, the next target would be 105. Especially if the U.S. Dollar Index breaks above 105, I’ll discuss the possibility of a strengthening dollar more seriously. Next, the 108 → 111 → 113 area is worth paying attention to. On the downside, 95.41 is an important support level for me. If the price drops again and falls below that level, the dollar’s weakness will be more evident. In short: U.S. Dollar Index rising → the dollar strengthens, and the crypto market should be cautious U.S. Dollar Index falling → the dollar weakens, and risk assets may ease a bit. Right now, my focus is on the two price levels: 101 and 105. Because sometimes, when we’re watching the $BTC chart, the answer we’ve been struggling to find may actually be hiding in the U.S. dollar chart. #BTC走势分析
{spot}(BTCUSDT)
Some major changes are quietly taking place in the U.S. dollar…… While I’m tracking cryptocurrencies, I’m also keeping a close eye on the U.S. Dollar Index #DXY
First of all, what is the U.S. Dollar Index? Let me explain it simply: it’s an index that reflects the strength of the U.S. dollar against major currencies such as the euro, the Japanese yen, and the British pound. Therefore, if the U.S. Dollar Index rises, it means the dollar is strengthening; if it falls, it means the dollar is temporarily pulling back. So what does this
have to do with cryptocurrencies #kripto ?
In general, a strong U.S. dollar is not favorable for risk assets. When the U.S. Dollar Index weakens, the price movements of Bitcoin and other cryptocurrencies become more free. Of course, this is not an absolute rule—I mainly use it to gauge overall market sentiment. Based on my chart…… The U.S. Dollar Index is currently near 100.85 and has just touched a key area. The first thing I’m watching is 101.15. If it breaks above that area, the next target would be 105. Especially if the U.S. Dollar Index breaks above 105, I’ll discuss the possibility of a strengthening dollar more seriously. Next, the 108 → 111 → 113 area is worth paying attention to. On the downside, 95.41 is an important support level for me. If the price drops again and falls below that level, the dollar’s weakness will be more evident. In short: U.S. Dollar Index rising → the dollar strengthens, and the crypto market should be cautious U.S. Dollar Index falling → the dollar weakens, and risk assets may ease a bit. Right now, my focus is on the two price levels: 101 and 105. Because sometimes, when we’re watching the $BTC chart, the answer we’ve been struggling to find may actually be hiding in the U.S. dollar chart. #BTC走势分析
First of all, what is the U.S. Dollar Index? Let me explain it simply: it’s an index that reflects the strength of the U.S. dollar against major currencies such as the euro, the Japanese yen, and the British pound. Therefore, if the U.S. Dollar Index rises, it means the dollar is strengthening; if it falls, it means the dollar is temporarily pulling back. So what does this
have to do with cryptocurrencies #kripto ?
In general, a strong U.S. dollar is not favorable for risk assets. When the U.S. Dollar Index weakens, the price movements of Bitcoin and other cryptocurrencies become more free. Of course, this is not an absolute rule—I mainly use it to gauge overall market sentiment. Based on my chart…… The U.S. Dollar Index is currently near 100.85 and has just touched a key area. The first thing I’m watching is 101.15. If it breaks above that area, the next target would be 105. Especially if the U.S. Dollar Index breaks above 105, I’ll discuss the possibility of a strengthening dollar more seriously. Next, the 108 → 111 → 113 area is worth paying attention to. On the downside, 95.41 is an important support level for me. If the price drops again and falls below that level, the dollar’s weakness will be more evident. In short: U.S. Dollar Index rising → the dollar strengthens, and the crypto market should be cautious U.S. Dollar Index falling → the dollar weakens, and risk assets may ease a bit. Right now, my focus is on the two price levels: 101 and 105. Because sometimes, when we’re watching the $BTC chart, the answer we’ve been struggling to find may actually be hiding in the U.S. dollar chart. #BTC走势分析
101
·
--
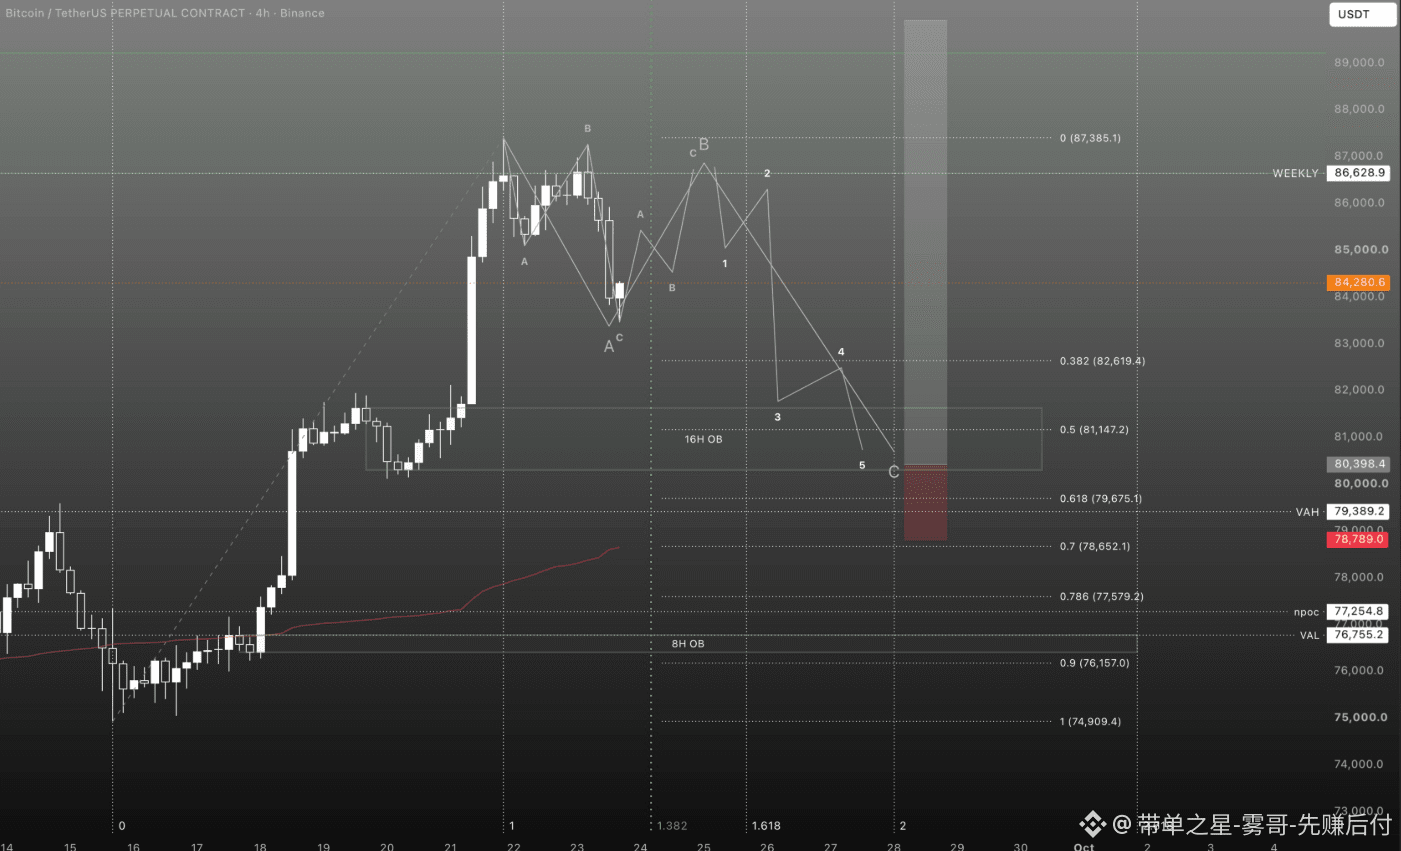
$BTC Go long? Only when the uptrend structure (75K to 87.3K) is completed do we need the pullback to take more time to end. Ideally, the pullback should finish after the vertical green line, not before. The ABC structure we have formed may just be the A leg of a larger ABC structure. In any case, if price reaches the lower 16-hour order block, then going long and trying it looks reasonable. However, the uptrend structure may not have completed yet. We will see the result soon. If price rises in a five-wave structure, then the depicted pullback is invalid. In that case, we expect the larger uptrend structure to end with a new high. But if price rises in a three-wave structure, then what’s shown in the chart is very likely to occur.#BTC #BTC走势分析
{spot}(BTCUSDT)
$BTC Go long? Only when the uptrend structure (75K to 87.3K) is completed do we need the pullback to take more time to end. Ideally, the pullback should finish after the vertical green line, not before. The ABC structure we have formed may just be the A leg of a larger ABC structure. In any case, if price reaches the lower 16-hour order block, then going long and trying it looks reasonable. However, the uptrend structure may not have completed yet. We will see the result soon. If price rises in a five-wave structure, then the depicted pullback is invalid. In that case, we expect the larger uptrend structure to end with a new high. But if price rises in a three-wave structure, then what’s shown in the chart is very likely to occur.#BTC #BTC走势分析
165
·
--
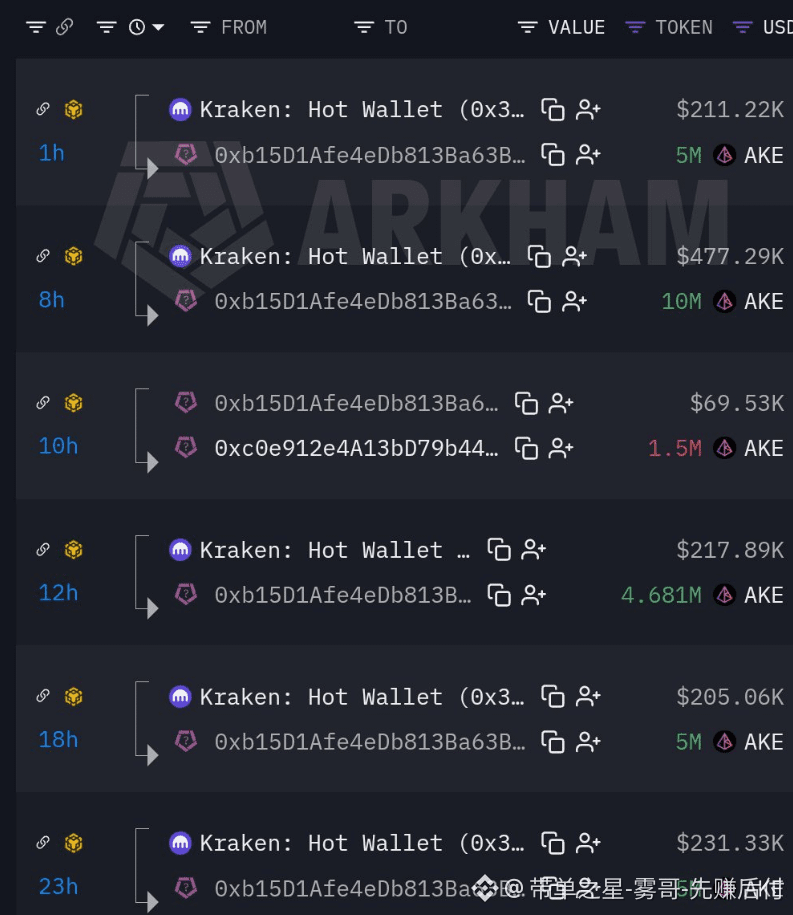
The connected institutional wallets are actively liquidating the on-chain $AKE at this moment. $AKE The price has fallen to 0.041. Within the past 24 hours, the institution has pulled out more than 29.6 million $AKE from hot wallets in batches (worth over $1.34 million), with each withdrawal ranging between 5 million and 10 million tokens. They do not hold it; instead, they trade it directly through an aggregator, automatically executing ongoing market sell-offs to the liquidity pool every few minutes. Currently, their wallet balance has dropped to 4.82 million tokens (worth $201,000), clearly indicating a full liquidation. As market makers continuously extract $AKE and sell it into the order book, it is difficult for the price to form any structural support. Please watch the 0.03 price level closely. #AKE
The connected institutional wallets are actively liquidating the on-chain $AKE at this moment. $AKE The price has fallen to 0.041. Within the past 24 hours, the institution has pulled out more than 29.6 million $AKE from hot wallets in batches (worth over $1.34 million), with each withdrawal ranging between 5 million and 10 million tokens. They do not hold it; instead, they trade it directly through an aggregator, automatically executing ongoing market sell-offs to the liquidity pool every few minutes. Currently, their wallet balance has dropped to 4.82 million tokens (worth $201,000), clearly indicating a full liquidation. As market makers continuously extract $AKE and sell it into the order book, it is difficult for the price to form any structural support. Please watch the 0.03 price level closely. #AKE
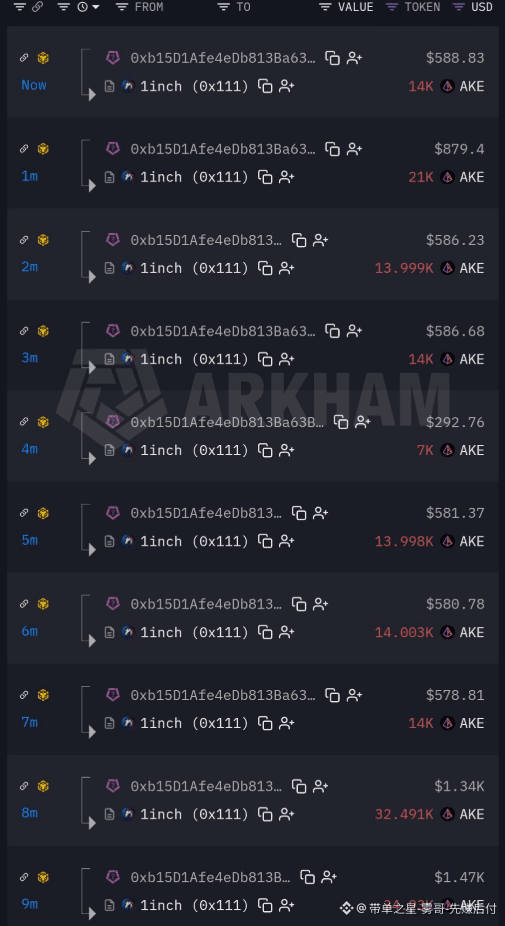
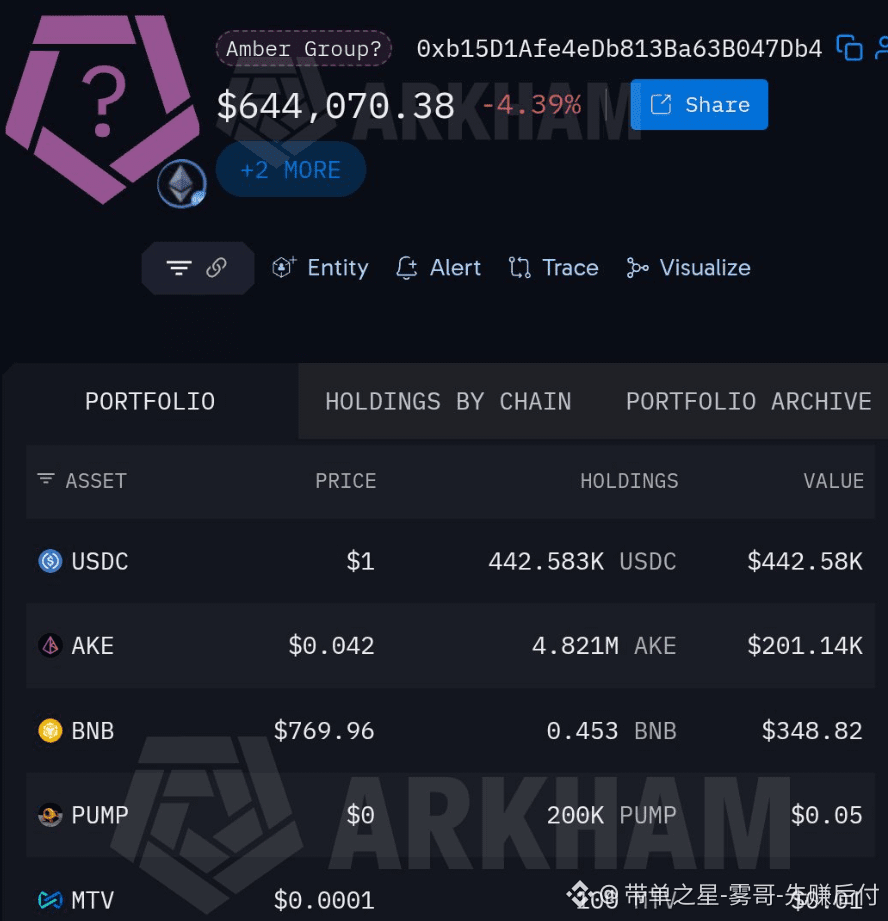
1
222
·
--
Gold, I’ve recently been following gold, especially its fluctuating price action. Recent trades: I bought around $3,900, sold around $4,600, and also shorted around $4,600 (confirmed). I ultimately closed the position at the year’s opening price. After that, I did not open any new positions. You can look back at my earlier posts to review all trade records. Current thoughts: After gold drops to $4,250, I think sell-off pressure may increase, and the $4,110–$4,130 range could be tested. This zone is one of the areas where a new buying opportunity could be established in the short term. I believe that if gold breaks above the black dashed-line region, it could rise toward the $4,530–$4,550 area. If oil prices ($BCO.US ) keep falling (near $90), we may see the second scenario play out. If the market crashes, around $3,700 is another important area in which I would consider building a long-term position. The blue-box region and the institution-level annual opening price are currently a support area, suitable for investors looking to seek confirmation (validate) the structure.$BTC
{spot}(BTCUSDT)
Gold, I’ve recently been following gold, especially its fluctuating price action. Recent trades: I bought around $3,900, sold around $4,600, and also shorted around $4,600 (confirmed). I ultimately closed the position at the year’s opening price. After that, I did not open any new positions. You can look back at my earlier posts to review all trade records. Current thoughts: After gold drops to $4,250, I think sell-off pressure may increase, and the $4,110–$4,130 range could be tested. This zone is one of the areas where a new buying opportunity could be established in the short term. I believe that if gold breaks above the black dashed-line region, it could rise toward the $4,530–$4,550 area. If oil prices ($BCO.US ) keep falling (near $90), we may see the second scenario play out. If the market crashes, around $3,700 is another important area in which I would consider building a long-term position. The blue-box region and the institution-level annual opening price are currently a support area, suitable for investors looking to seek confirmation (validate) the structure.$BTC
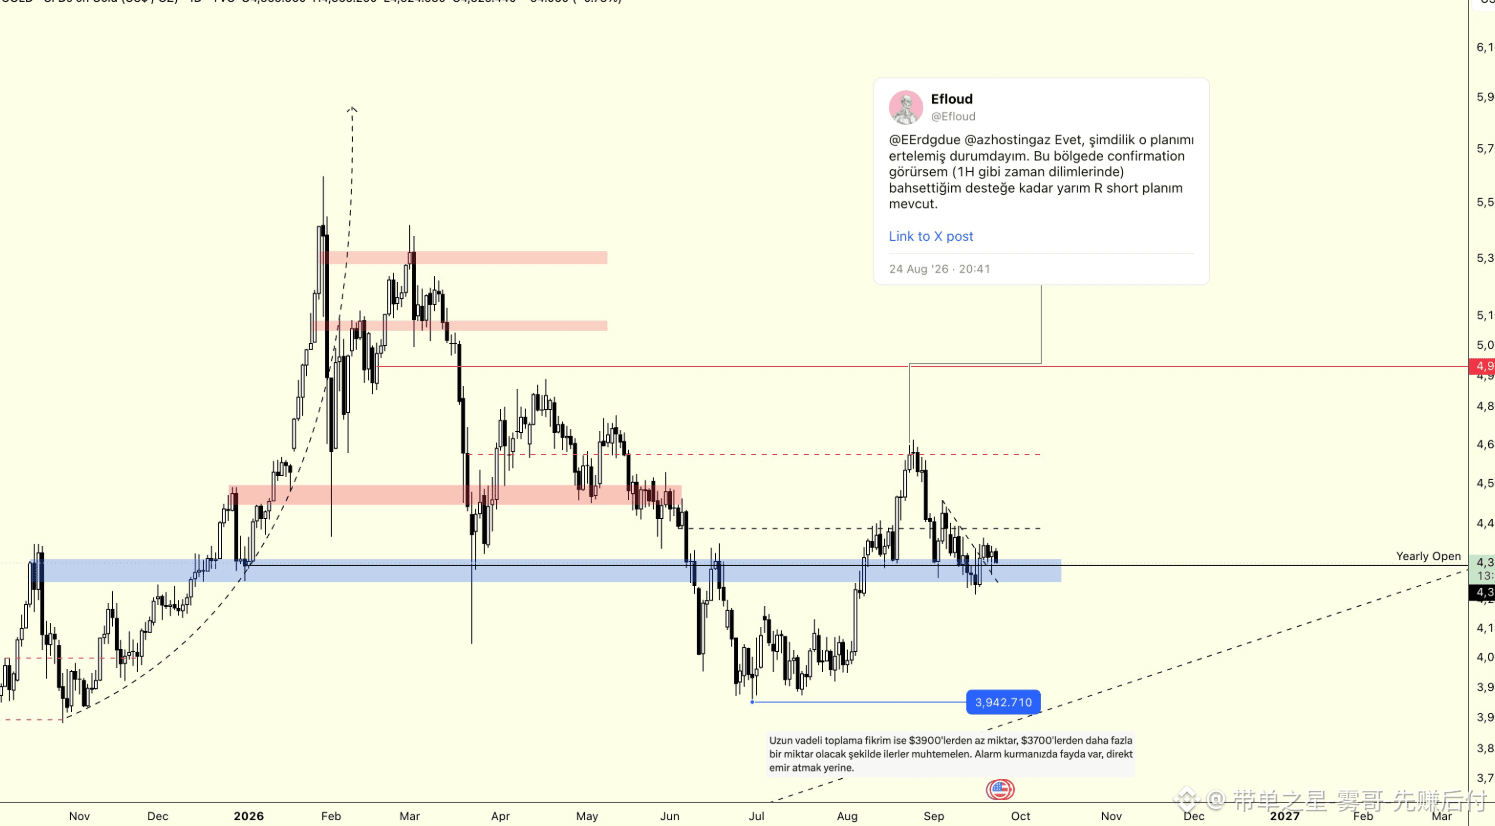
255
·
--
$ICP Price is rebounding, but it has already broken below the lows of 2022–2023. The larger structure still needs to be repaired. $3.50–$4.20 is the first test. If the weekly closing price is above that range and successfully retests it, the rebound expectation will strengthen. Next, I’ll watch $5–$6.50. Only if that range is continuously reclaimed can the target be locked at $8–$10. If it’s rejected, the price may fall back to $2–$2.50. Once that bottom is lost, the rebound expectation will weaken further. The weekly candles have not yet reclaimed it. Wait for the outcome of the rebound. Anything is possible. This is not investment advice. Please do your own research.#icp
$ICP Price is rebounding, but it has already broken below the lows of 2022–2023. The larger structure still needs to be repaired. $3.50–$4.20 is the first test. If the weekly closing price is above that range and successfully retests it, the rebound expectation will strengthen. Next, I’ll watch $5–$6.50. Only if that range is continuously reclaimed can the target be locked at $8–$10. If it’s rejected, the price may fall back to $2–$2.50. Once that bottom is lost, the rebound expectation will weaken further. The weekly candles have not yet reclaimed it. Wait for the outcome of the rebound. Anything is possible. This is not investment advice. Please do your own research.#icp
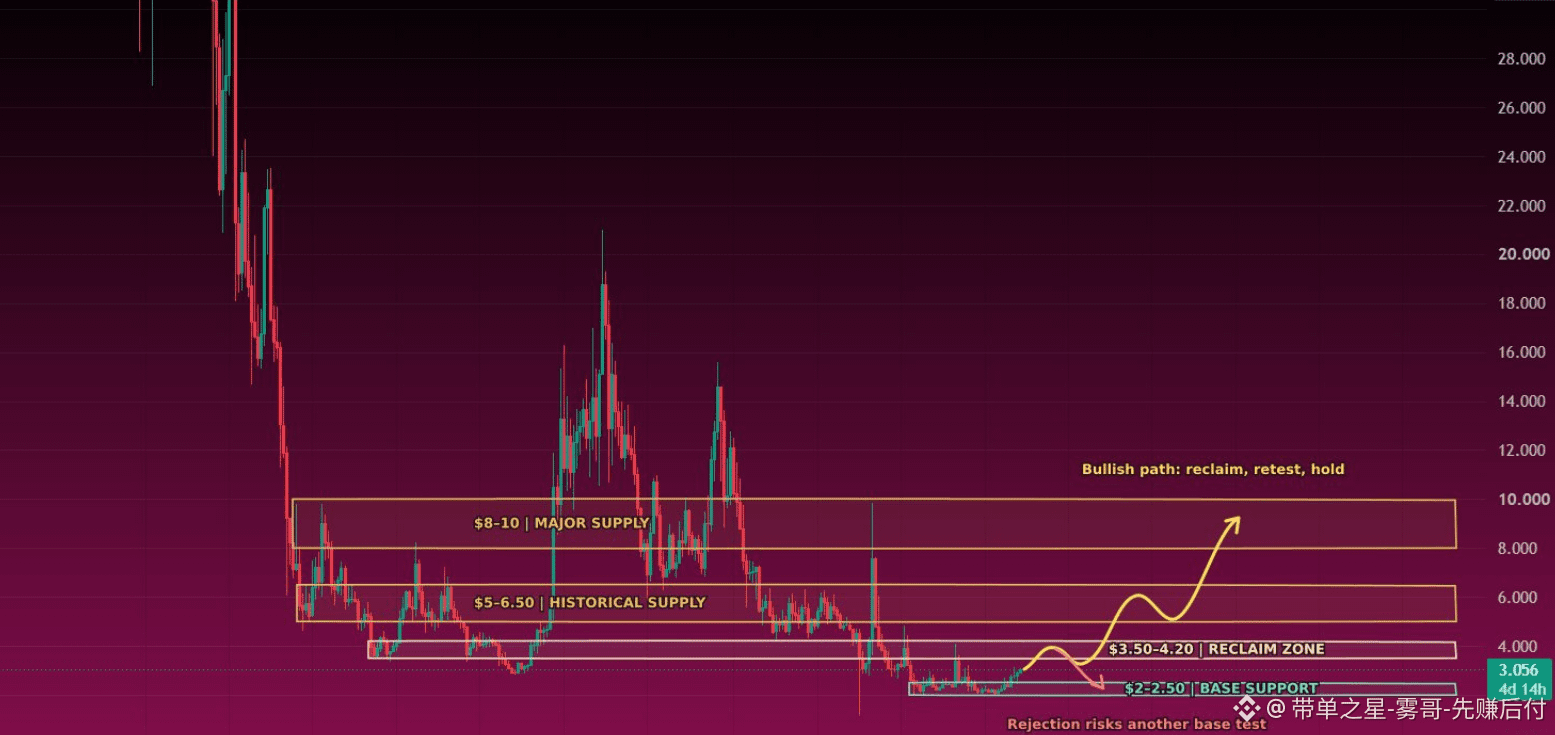
119
·
--
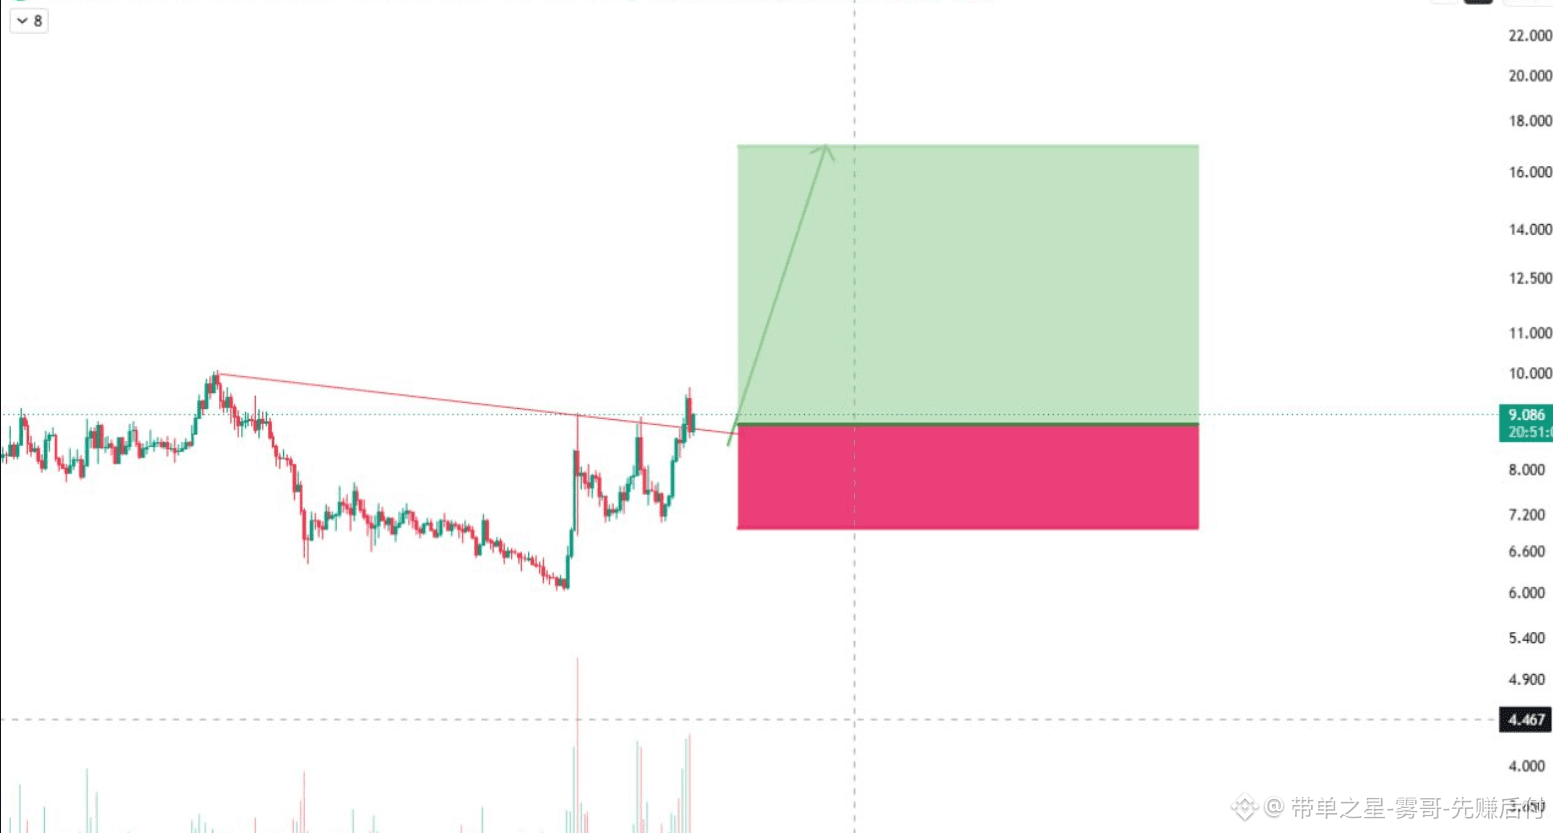
The chart has broken out of a cage that has lasted for over a year. For more than a year, ETC’s price has been constrained by a steep descending trendline. It has just broken through that trendline and has found its footing. This isn’t a wick—it’s a structural change. This week’s 28% rally confirms an influx of buyers. A “mini-halving” is coming in a few months. The block reward for ETC halves by 20% every 5 million blocks. The next halving (2.048 → 1.638 ETC) is expected to occur before the end of 2026. ETC’s supply cap is about 210.7 million coins. Reduced new supply—while market sentiment is currently in an upswing. It’s already deflationary. The Olympia upgrade adds a fee-burn mechanism similar to EIP-1559, along with an on-chain treasury and DAOs. This isn’t a dead chain—it’s actively upgrading. The story of “early Ethereum” is unfolding. ETH has moved to a proof-of-stake mechanism. ETC still uses proof-of-work and is mined by real GPU miners. In a market that suddenly starts paying for mined tokens, this is exactly what institutions can explain to a committee. It’s one of the lowest market-cap, highest-potential laggards right now. With a market cap of $1.25 billion—down 95% from its all-time high. When BCH (a $5.5 billion asset) crashes 36%, capital looks for the next inexpensive PoW token. ETC is right there. The above is only personal opinion and does not constitute any financial advice or recommendation to buy or sell. Cryptocurrency is extremely risky; do your own research and take full responsibility. No token promotion of any kind. $BTC
{spot}(BTCUSDT)
The chart has broken out of a cage that has lasted for over a year. For more than a year, ETC’s price has been constrained by a steep descending trendline. It has just broken through that trendline and has found its footing. This isn’t a wick—it’s a structural change. This week’s 28% rally confirms an influx of buyers. A “mini-halving” is coming in a few months. The block reward for ETC halves by 20% every 5 million blocks. The next halving (2.048 → 1.638 ETC) is expected to occur before the end of 2026. ETC’s supply cap is about 210.7 million coins. Reduced new supply—while market sentiment is currently in an upswing. It’s already deflationary. The Olympia upgrade adds a fee-burn mechanism similar to EIP-1559, along with an on-chain treasury and DAOs. This isn’t a dead chain—it’s actively upgrading. The story of “early Ethereum” is unfolding. ETH has moved to a proof-of-stake mechanism. ETC still uses proof-of-work and is mined by real GPU miners. In a market that suddenly starts paying for mined tokens, this is exactly what institutions can explain to a committee. It’s one of the lowest market-cap, highest-potential laggards right now. With a market cap of $1.25 billion—down 95% from its all-time high. When BCH (a $5.5 billion asset) crashes 36%, capital looks for the next inexpensive PoW token. ETC is right there. The above is only personal opinion and does not constitute any financial advice or recommendation to buy or sell. Cryptocurrency is extremely risky; do your own research and take full responsibility. No token promotion of any kind. $BTC
480
·
--
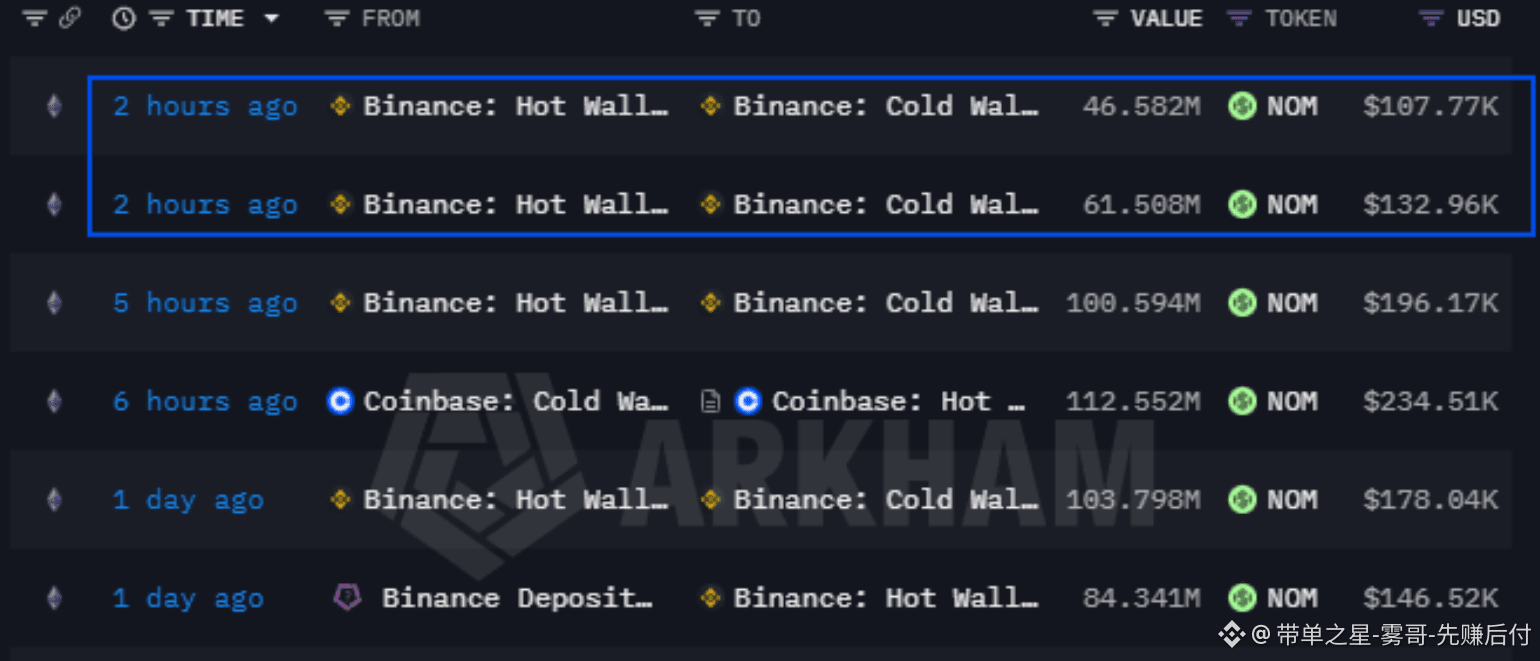
The trend of $NOM becomes quite interesting around $0.00232. Within the past 5 hours, more than 208 million $NOM were transferred into Binance cold wallets, and within 24 hours, more than 312 million $NOM were moved out of Binance-related wallets. At the same time, the flow amount turned negative, indicating that short positions are being squeezed. However, Coinbase also transferred 112.5 million $NOM to its hot wallet (about $234,000). As a result, we’re seeing a large amount of exchange withdrawals, crowded short positions, and some new sell-side liquidity. If short positions are squeezed, the price of $NOM could move rapidly.
The trend of $NOM becomes quite interesting around $0.00232. Within the past 5 hours, more than 208 million $NOM were transferred into Binance cold wallets, and within 24 hours, more than 312 million $NOM were moved out of Binance-related wallets. At the same time, the flow amount turned negative, indicating that short positions are being squeezed. However, Coinbase also transferred 112.5 million $NOM to its hot wallet (about $234,000). As a result, we’re seeing a large amount of exchange withdrawals, crowded short positions, and some new sell-side liquidity. If short positions are squeezed, the price of $NOM could move rapidly.
67
·
--
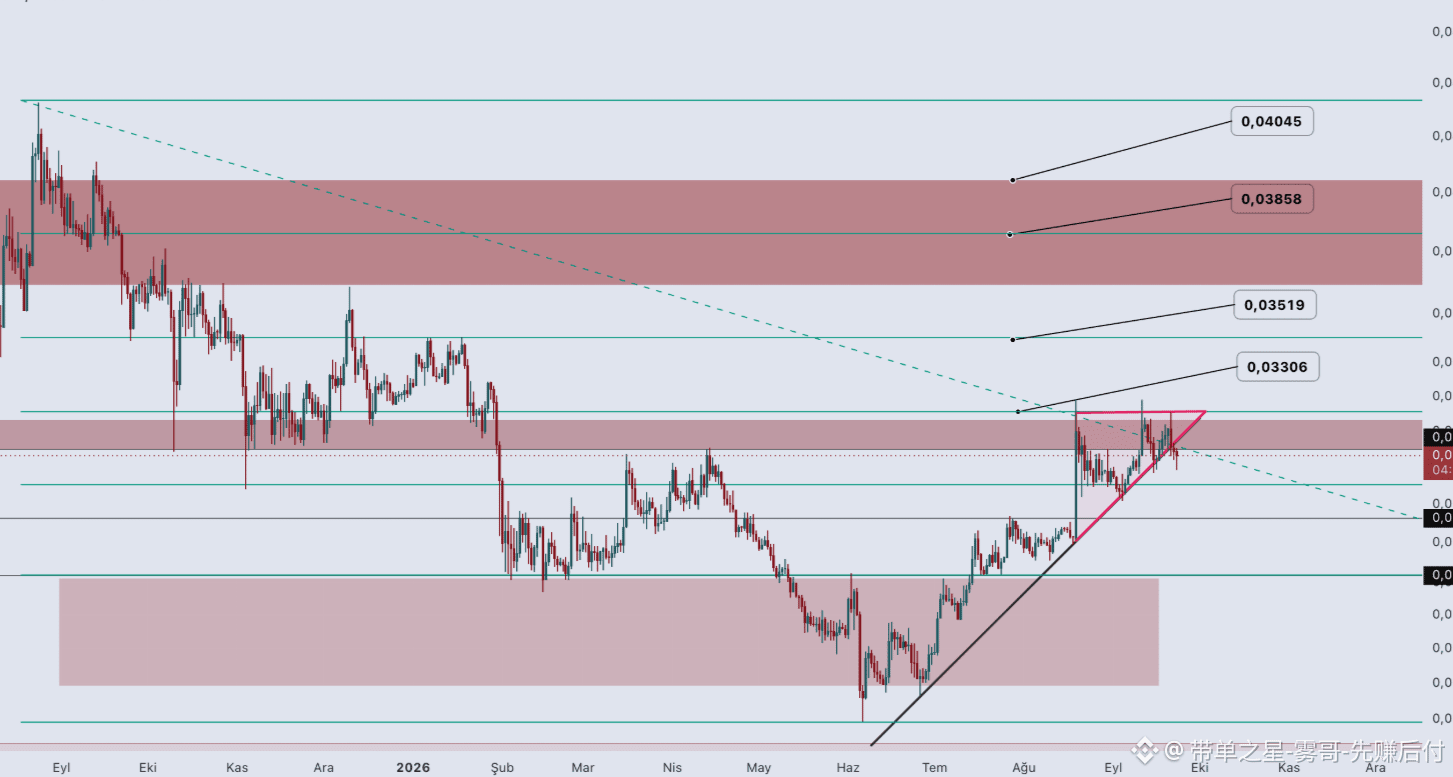
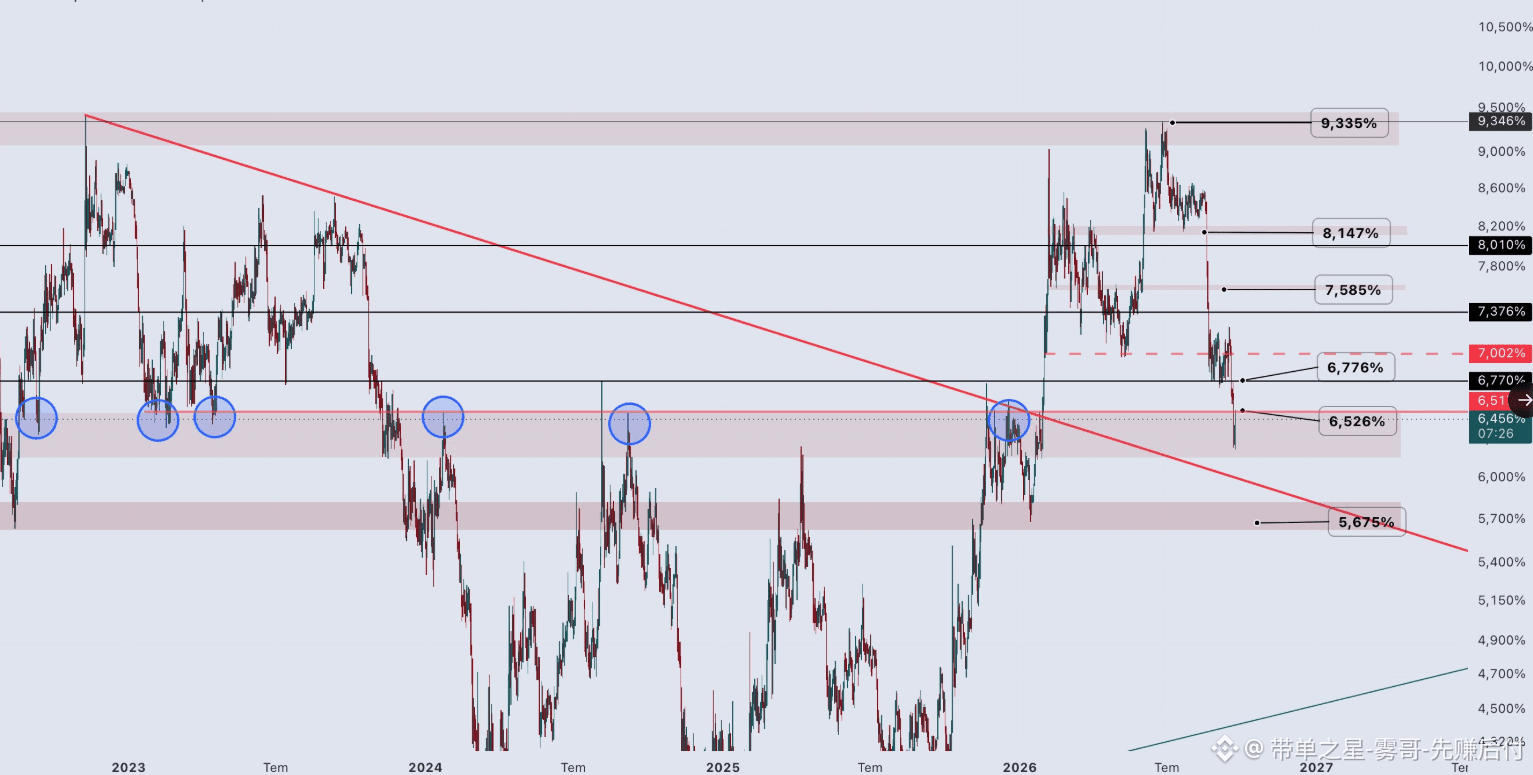
$BTC Despite an overall optimistic outlook for the cryptocurrency market, altcoin investors have not truly felt this optimism yet. USDT’s dominance is currently at a critical support level, which could lead to a Bitcoin pullback. We may see Bitcoin pull back into the $82,000–$78,000 range; if the STH RP tests $72,800, that’s not good news for us. If the pullback reaches these levels and holds above $78,000, the situation will become very critical. Honestly, I expect Bitcoin to rebound in the $76,000–$78,000 range. No matter how the pullback plays out, the important resistance levels ahead are in the $94,500–$97,000 range. For Ethereum, if it tests $2,350, holding that price level is crucial—that is the key level for breaking out of the range. If we lose it, we could see a pullback to $2,100, which will make altcoin investors uneasy. $3,080 is an important resistance level ahead. If ETH/BTC breaks below the rising trendline, Bitcoin dominance takes over. Other crypto investors will also need some time to digest this news, but overall, this is good news.#BTC走势分析
{spot}(BTCUSDT)
$BTC Despite an overall optimistic outlook for the cryptocurrency market, altcoin investors have not truly felt this optimism yet. USDT’s dominance is currently at a critical support level, which could lead to a Bitcoin pullback. We may see Bitcoin pull back into the $82,000–$78,000 range; if the STH RP tests $72,800, that’s not good news for us. If the pullback reaches these levels and holds above $78,000, the situation will become very critical. Honestly, I expect Bitcoin to rebound in the $76,000–$78,000 range. No matter how the pullback plays out, the important resistance levels ahead are in the $94,500–$97,000 range. For Ethereum, if it tests $2,350, holding that price level is crucial—that is the key level for breaking out of the range. If we lose it, we could see a pullback to $2,100, which will make altcoin investors uneasy. $3,080 is an important resistance level ahead. If ETH/BTC breaks below the rising trendline, Bitcoin dominance takes over. Other crypto investors will also need some time to digest this news, but overall, this is good news.#BTC走势分析
97
·
--
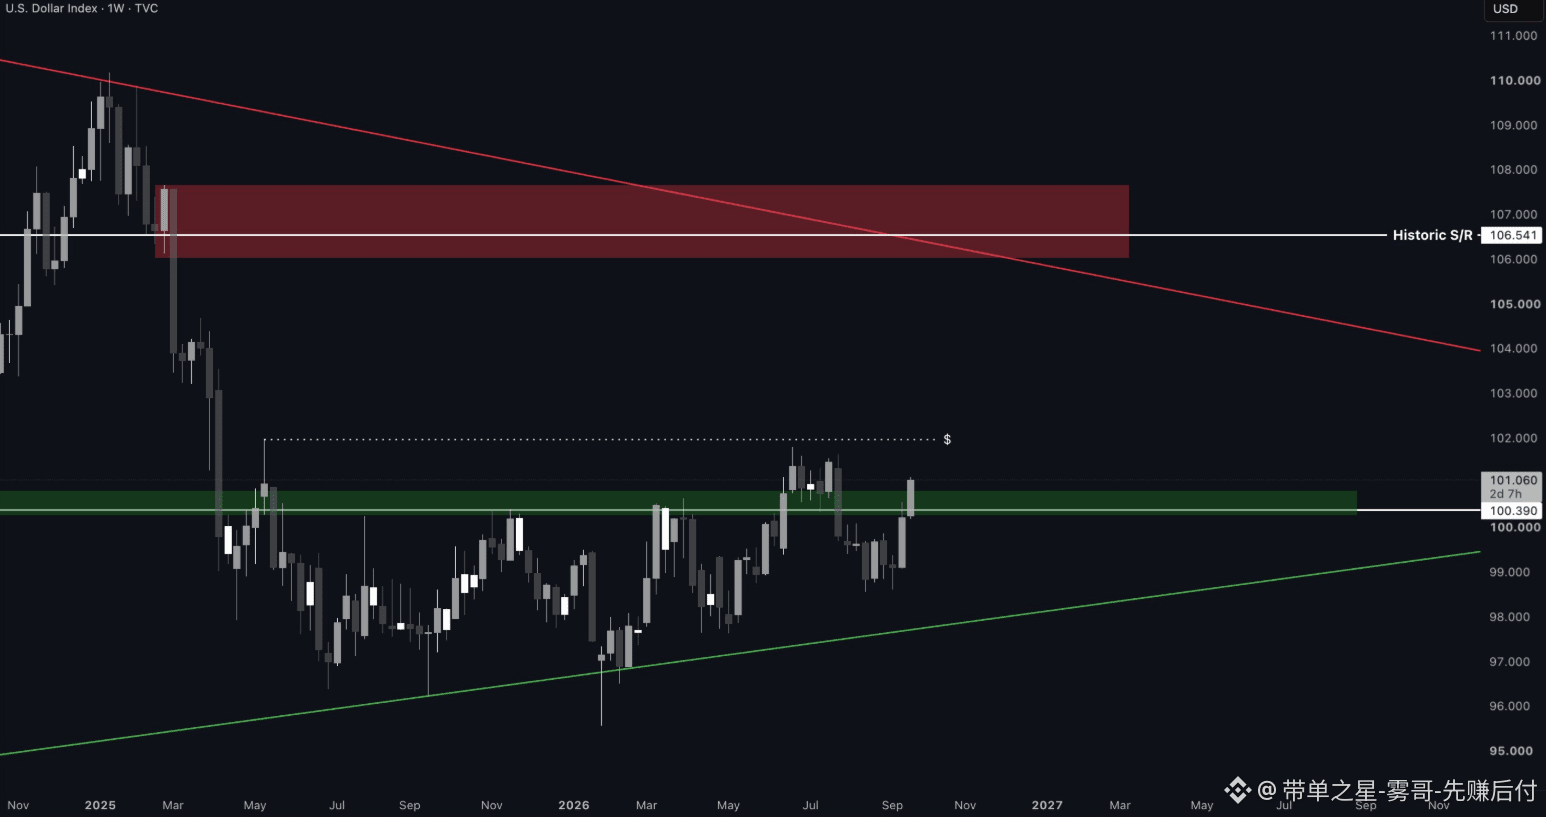
$BTC New entrants in the market are ignoring macroeconomic correlations, betting on an AI-driven rally and the 2021 monetary expansion policy. The efficiency of AI and large-scale capital expenditures may be able to prevent economic contraction in a high-interest-rate environment. However, once the U.S. dollar index breaks below the key 100.4 level, it will trigger pullbacks across all risk assets. Crypto newcomers have not yet realized this, while experienced gold investors have already priced it in. I believe this quarter will be the one where veterans teach a lesson to newcomers. The 100.4 level has been breached—investment opportunities for Q4 are now officially on the table. Whether the bottom is higher or lower doesn’t matter; a bottom is a bottom.#人工智能 #黄金
{spot}(BTCUSDT)
$BTC New entrants in the market are ignoring macroeconomic correlations, betting on an AI-driven rally and the 2021 monetary expansion policy. The efficiency of AI and large-scale capital expenditures may be able to prevent economic contraction in a high-interest-rate environment. However, once the U.S. dollar index breaks below the key 100.4 level, it will trigger pullbacks across all risk assets. Crypto newcomers have not yet realized this, while experienced gold investors have already priced it in. I believe this quarter will be the one where veterans teach a lesson to newcomers. The 100.4 level has been breached—investment opportunities for Q4 are now officially on the table. Whether the bottom is higher or lower doesn’t matter; a bottom is a bottom.#人工智能 #黄金
75
·
--
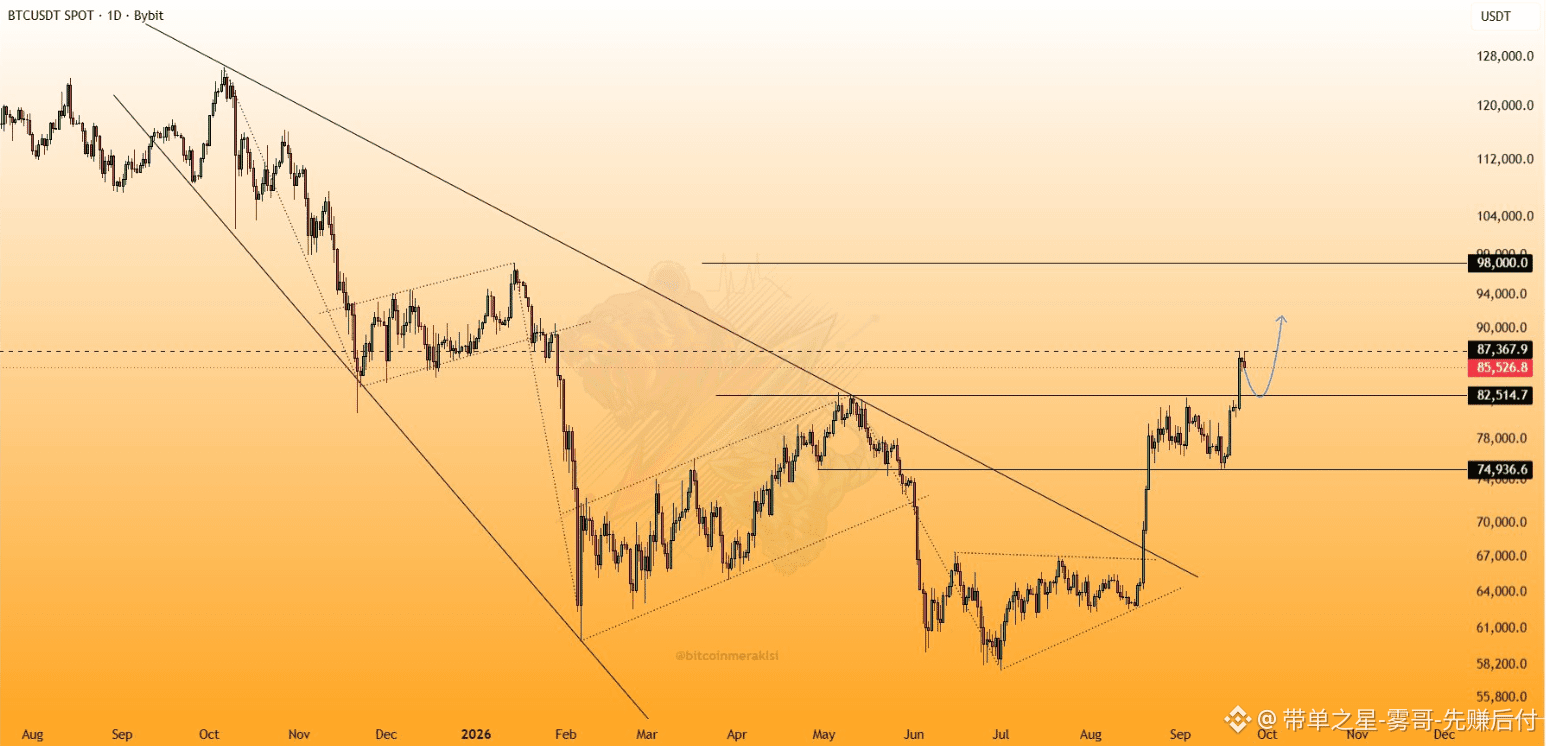
$BTC #BTC Current trend. Friends, after Bitcoin price rebounded from the $87,350 resistance level, it is attempting to break through that resistance again today. We can see that sellers still dominate at this resistance level. The second possibility I mentioned in the referenced post now seems even more convincing. In other words, the likelihood of a retest of the $82,500 level currently appears to be the highest. However, before reaching the $82,500 level, there is an intermediate support level at $84,600. If the price cannot hold this intermediate support, then the possibility of falling to $82,500 will increase significantly. But as long as the price stays above $82,500, the upward trend remains intact. In short: intermediate support: $84,600; major support: $82,500; intermediate resistance: $87,400; major resistance: $98,000.#BTC走势分析
{spot}(BTCUSDT)
$BTC #BTC Current trend. Friends, after Bitcoin price rebounded from the $87,350 resistance level, it is attempting to break through that resistance again today. We can see that sellers still dominate at this resistance level. The second possibility I mentioned in the referenced post now seems even more convincing. In other words, the likelihood of a retest of the $82,500 level currently appears to be the highest. However, before reaching the $82,500 level, there is an intermediate support level at $84,600. If the price cannot hold this intermediate support, then the possibility of falling to $82,500 will increase significantly. But as long as the price stays above $82,500, the upward trend remains intact. In short: intermediate support: $84,600; major support: $82,500; intermediate resistance: $87,400; major resistance: $98,000.#BTC走势分析
6
·
--
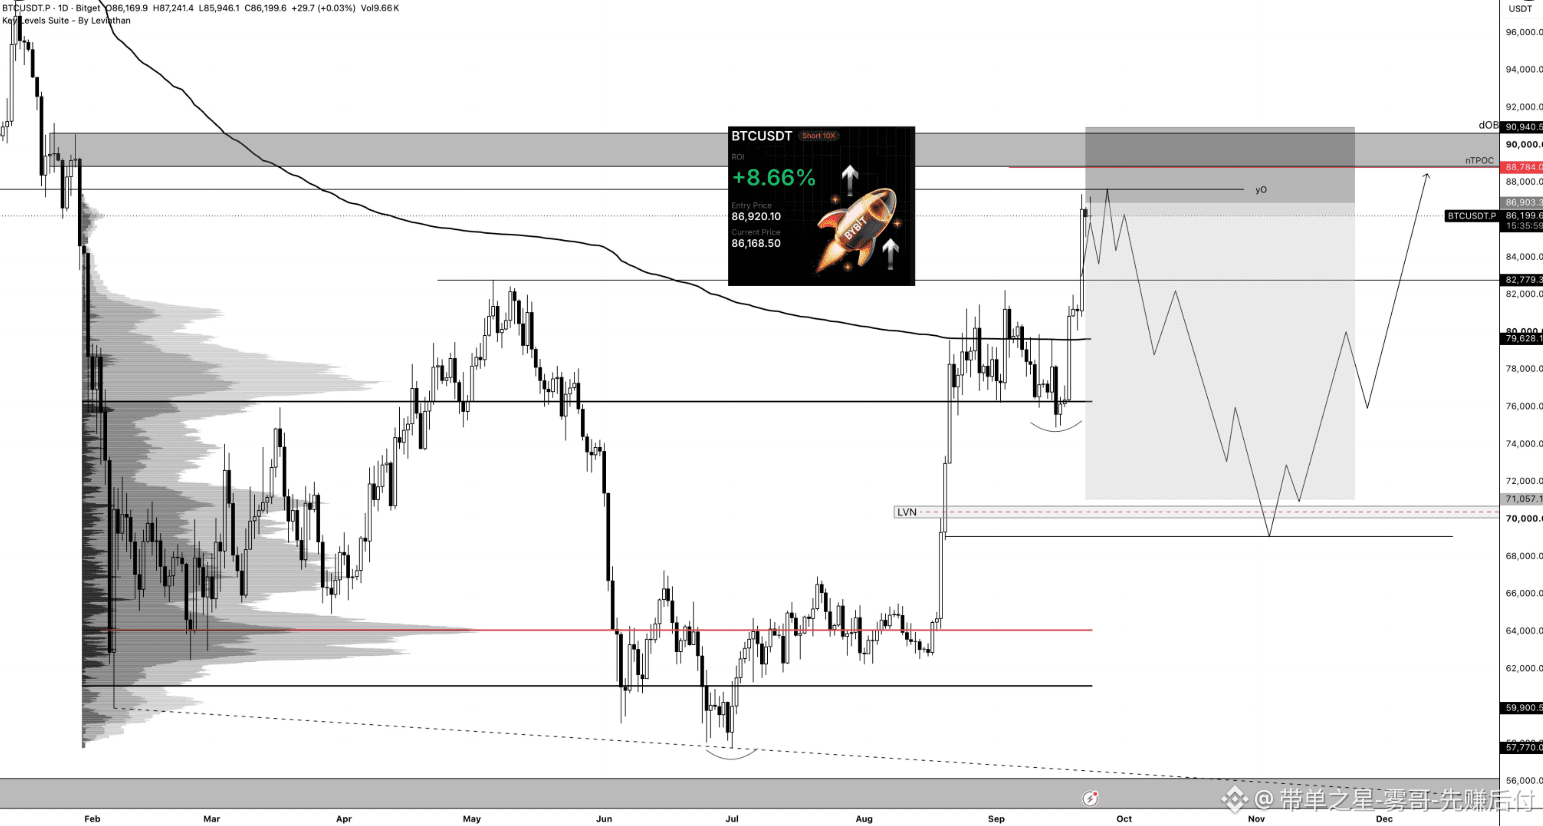
$BTC MTF band short: I set my limit at the year’s opening price, but this morning I saw the closing price was below that level. Also, the order flow lacked clear bullish strength, so I entered the position early and adjusted my position size accordingly. -> If price moves up toward the year’s opening price and remains below that level, I will gradually add to my position. The area above this level is still a strong convergence zone: the year’s opening price + nTPOC + the daily opening price + the previous price range. Because the positioning is overheated, I view it as a potential local top formation process. In other words, I will still hedge against any clear local bullish confirmation signals -> these counter-moves could quickly strengthen.#BTC走势分析
{spot}(BTCUSDT)
$BTC MTF band short: I set my limit at the year’s opening price, but this morning I saw the closing price was below that level. Also, the order flow lacked clear bullish strength, so I entered the position early and adjusted my position size accordingly. -> If price moves up toward the year’s opening price and remains below that level, I will gradually add to my position. The area above this level is still a strong convergence zone: the year’s opening price + nTPOC + the daily opening price + the previous price range. Because the positioning is overheated, I view it as a potential local top formation process. In other words, I will still hedge against any clear local bullish confirmation signals -> these counter-moves could quickly strengthen.#BTC走势分析
93
·
--
The $MARSCOIN order book on Binance has just witnessed a large-scale transaction between two giant whales. Within just 60 minutes, two new accounts took over and bought exactly the same quantity. Wallet 0xb244... withdrew 899,000 units of $MARSCOIN , while wallet 0xCF7A... directly withdrew 1.59 million units of $MARSCOIN from a hot wallet. The well-known 0x8156... accumulated wallet turned bearish 8 hours ago, moving all of its 1.694 million $MARSCOIN (worth $221,000) back into Binance. As exchanges compete for available liquidity, a private transfer of up to 3.09 million MARSCOIN (worth $402,000) was quietly completed 9 hours ago. One giant whale’s exit from liquidity instantly became another giant whale’s accumulation zone.#MARSCOIN飙升
{spot}(MARSCOINUSDT)
The $MARSCOIN order book on Binance has just witnessed a large-scale transaction between two giant whales. Within just 60 minutes, two new accounts took over and bought exactly the same quantity. Wallet 0xb244... withdrew 899,000 units of $MARSCOIN , while wallet 0xCF7A... directly withdrew 1.59 million units of $MARSCOIN from a hot wallet. The well-known 0x8156... accumulated wallet turned bearish 8 hours ago, moving all of its 1.694 million $MARSCOIN (worth $221,000) back into Binance. As exchanges compete for available liquidity, a private transfer of up to 3.09 million MARSCOIN (worth $402,000) was quietly completed 9 hours ago. One giant whale’s exit from liquidity instantly became another giant whale’s accumulation zone.#MARSCOIN飙升
428
·
--
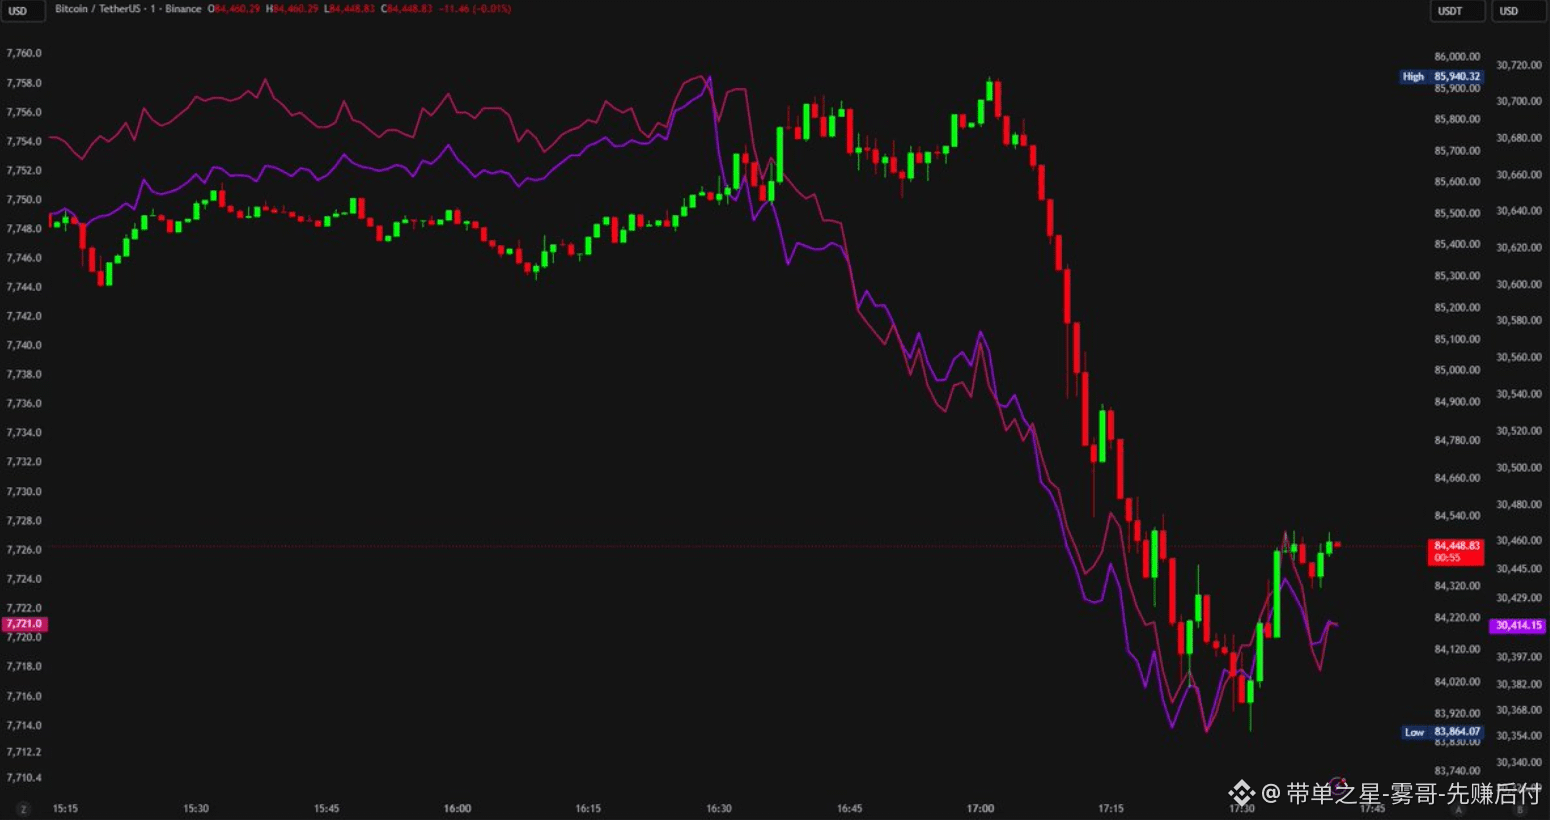
$BTC Bitcoin price fell from $87,000 to $84,000 within one hour, and other cryptocurrencies saw even larger pullbacks. The decline was not driven by internal factors within the crypto market, but by the U.S. Purchasing Managers’ Index data released at 4:45 p.m. The composite index came in at 58.4, a five-year high, and input costs also reached the highest level since October 2022. The Federal Reserve had just raised rates last week, and this data further intensified market expectations of “potential additional rate hikes in the future.” Bond yields rose, while stocks and the crypto sector declined. While such sudden events may trigger a pullback, they do not change the overall trend. In the current market environment, once a macroeconomic shock hits, sellers have long been prepared—this is not surprising. As long as the $80,000 support level remains valid, there’s no need to worry. As long as the $80,000 support level is not affected, the trend structure can stay positive; pullbacks like this offer off-market investors a good entry opportunity. As shown in the chart, currently the U.S. stock market and #BTC Bitcoin price movements are moving in sync. Everyone, today we are also closely monitoring the U.S. market.#BTC走势分析
{spot}(BTCUSDT)
$BTC Bitcoin price fell from $87,000 to $84,000 within one hour, and other cryptocurrencies saw even larger pullbacks. The decline was not driven by internal factors within the crypto market, but by the U.S. Purchasing Managers’ Index data released at 4:45 p.m. The composite index came in at 58.4, a five-year high, and input costs also reached the highest level since October 2022. The Federal Reserve had just raised rates last week, and this data further intensified market expectations of “potential additional rate hikes in the future.” Bond yields rose, while stocks and the crypto sector declined. While such sudden events may trigger a pullback, they do not change the overall trend. In the current market environment, once a macroeconomic shock hits, sellers have long been prepared—this is not surprising. As long as the $80,000 support level remains valid, there’s no need to worry. As long as the $80,000 support level is not affected, the trend structure can stay positive; pullbacks like this offer off-market investors a good entry opportunity. As shown in the chart, currently the U.S. stock market and #BTC Bitcoin price movements are moving in sync. Everyone, today we are also closely monitoring the U.S. market.#BTC走势分析
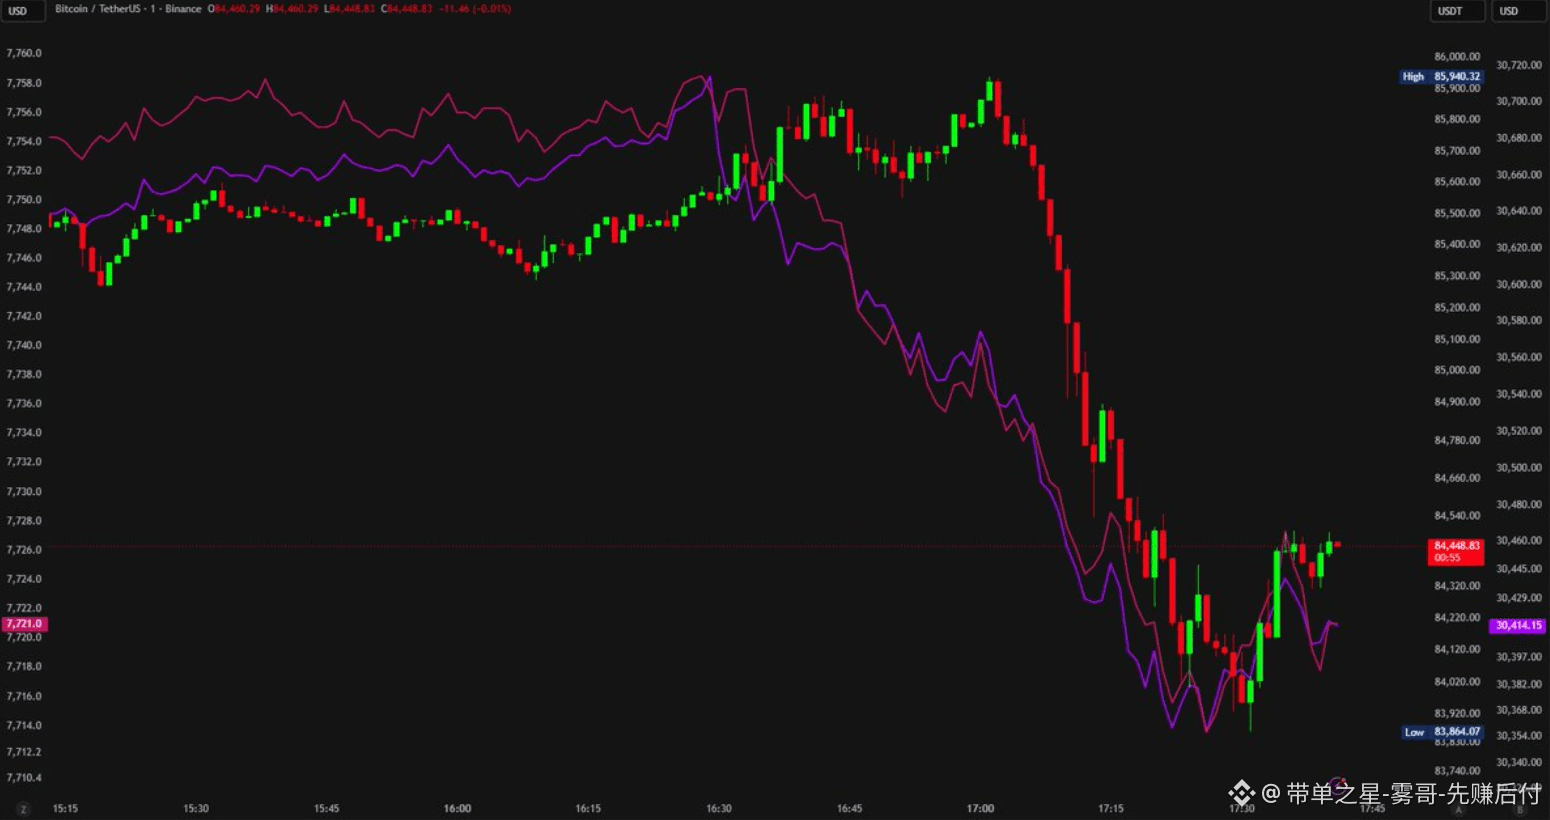
36
·
--
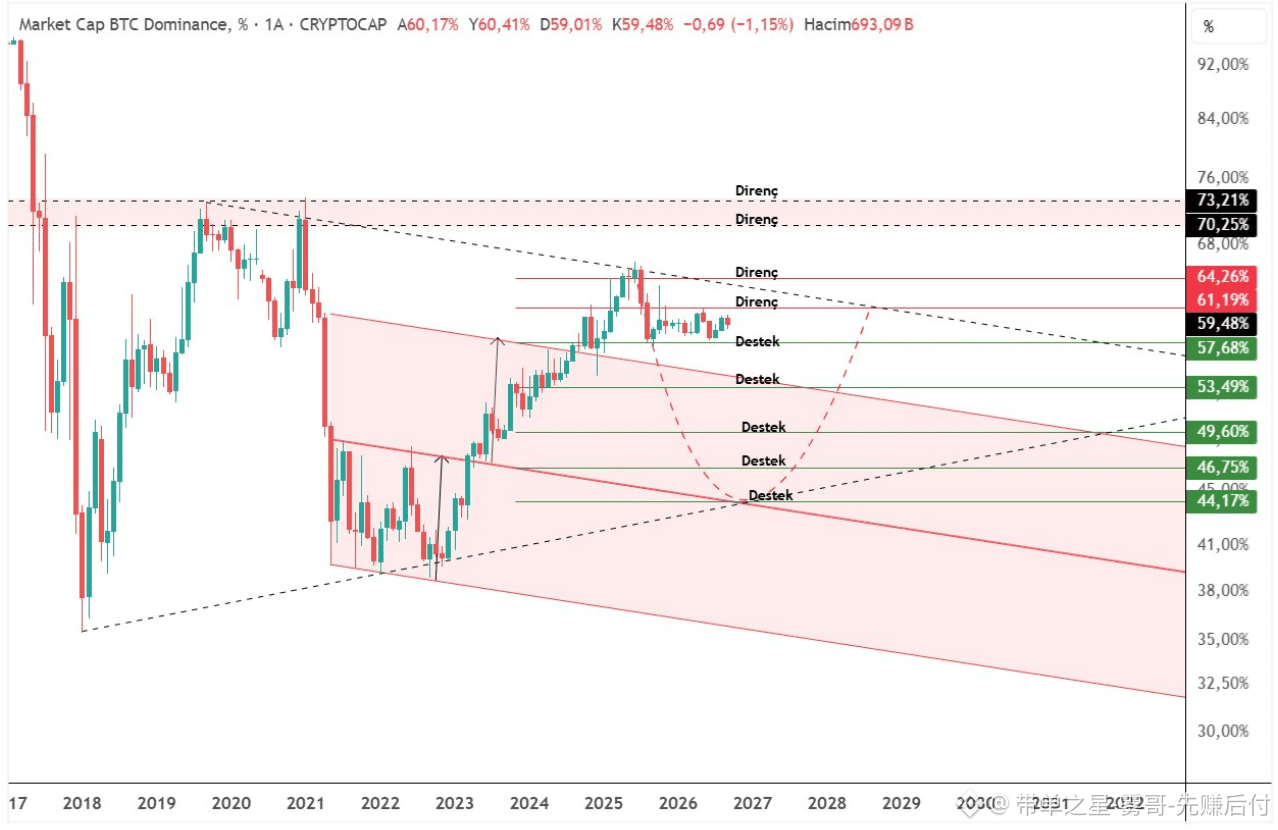
In my view, the situation with BTC.D is starting to get more interesting... First, let me explain what BTC.D is in the simplest way possible. :)
#BTC shows Bitcoin’s share of the entire cryptocurrency market. In other words, it roughly tells you how much of every 100 dollars in the crypto market is Bitcoin. At the moment, in my chart, BTC.D is about 59.5%, and the first level I’m watching is 57.68%. If the share starts to fall and breaks below 57.68%, then next I’ll watch the levels 53.49% → 49.60% → 46.75% and 44.17%. So what does this mean for altcoins? If the price of #bitcoin stays strong while the share declines, then funds may flow from Bitcoin into altcoins. This is one of the most favorable scenarios for altcoins—especially when Bitcoin’s share falls below 50%, since then altcoins’ price action will grab my attention even more. But if the share rebounds, things change. 61.19% and 64.26% are my key resistance levels. If those resistances are broken, it means Bitcoin is regaining market dominance. In those periods, altcoins usually have a harder time than Bitcoin. But there’s one detail that’s very important: BTC.D falling doesn’t necessarily mean altcoins will rise—there’s no such rule. For example, when Bitcoin’s price crashes, the altcoin share may also decline, and at that time the entire market might be falling. That’s why I never interpret the dominance chart in isolation; I analyze it together with Bitcoin’s price and the TOTAL/TOTAL3 indicators. For me, the current read is simple:
Above 61–64%: Bitcoin’s strength is increasing...
Below 57%: altcoins start getting opportunities...
Below 50%, that’s when I really start paying close attention.
So, those waiting for an altcoin rally shouldn’t only watch the coin price—they should also watch Bitcoin’s market share.
{spot}(BTCUSDT)
In my view, the situation with BTC.D is starting to get more interesting... First, let me explain what BTC.D is in the simplest way possible. :)
#BTC shows Bitcoin’s share of the entire cryptocurrency market. In other words, it roughly tells you how much of every 100 dollars in the crypto market is Bitcoin. At the moment, in my chart, BTC.D is about 59.5%, and the first level I’m watching is 57.68%. If the share starts to fall and breaks below 57.68%, then next I’ll watch the levels 53.49% → 49.60% → 46.75% and 44.17%. So what does this mean for altcoins? If the price of #bitcoin stays strong while the share declines, then funds may flow from Bitcoin into altcoins. This is one of the most favorable scenarios for altcoins—especially when Bitcoin’s share falls below 50%, since then altcoins’ price action will grab my attention even more. But if the share rebounds, things change. 61.19% and 64.26% are my key resistance levels. If those resistances are broken, it means Bitcoin is regaining market dominance. In those periods, altcoins usually have a harder time than Bitcoin. But there’s one detail that’s very important: BTC.D falling doesn’t necessarily mean altcoins will rise—there’s no such rule. For example, when Bitcoin’s price crashes, the altcoin share may also decline, and at that time the entire market might be falling. That’s why I never interpret the dominance chart in isolation; I analyze it together with Bitcoin’s price and the TOTAL/TOTAL3 indicators. For me, the current read is simple:
Above 61–64%: Bitcoin’s strength is increasing...
Below 57%: altcoins start getting opportunities...
Below 50%, that’s when I really start paying close attention.
So, those waiting for an altcoin rally shouldn’t only watch the coin price—they should also watch Bitcoin’s market share.
#BTC shows Bitcoin’s share of the entire cryptocurrency market. In other words, it roughly tells you how much of every 100 dollars in the crypto market is Bitcoin. At the moment, in my chart, BTC.D is about 59.5%, and the first level I’m watching is 57.68%. If the share starts to fall and breaks below 57.68%, then next I’ll watch the levels 53.49% → 49.60% → 46.75% and 44.17%. So what does this mean for altcoins? If the price of #bitcoin stays strong while the share declines, then funds may flow from Bitcoin into altcoins. This is one of the most favorable scenarios for altcoins—especially when Bitcoin’s share falls below 50%, since then altcoins’ price action will grab my attention even more. But if the share rebounds, things change. 61.19% and 64.26% are my key resistance levels. If those resistances are broken, it means Bitcoin is regaining market dominance. In those periods, altcoins usually have a harder time than Bitcoin. But there’s one detail that’s very important: BTC.D falling doesn’t necessarily mean altcoins will rise—there’s no such rule. For example, when Bitcoin’s price crashes, the altcoin share may also decline, and at that time the entire market might be falling. That’s why I never interpret the dominance chart in isolation; I analyze it together with Bitcoin’s price and the TOTAL/TOTAL3 indicators. For me, the current read is simple:
Above 61–64%: Bitcoin’s strength is increasing...
Below 57%: altcoins start getting opportunities...
Below 50%, that’s when I really start paying close attention.
So, those waiting for an altcoin rally shouldn’t only watch the coin price—they should also watch Bitcoin’s market share.
144
·
--
$BTC The first resistance level at 87,000 USD has been reached! The Relative Strength Index (RSI) on the higher time frame (HTF) shows a bearish reversal impulse, but the lower time frame (LTF) seems to still need to form another high point... The chart shows the direction of the move that I think is unfolding. I’m watching a retest around 83,500 USD... If it holds this support level, then #BTC may again attempt the resistance level at 89,000 USD... It will certainly produce bearish signals and may mark the top of this macro B wave. Around 83,500 USD is the key price level we’re focused on! Now, be extra careful in the crypto market... BTC is already approaching its target! After confirming the top, the lowest pullback target is around 70,000 USD, and a new low is very likely. I’ll update you with the latest developments at any time.
{spot}(BTCUSDT)
$BTC The first resistance level at 87,000 USD has been reached! The Relative Strength Index (RSI) on the higher time frame (HTF) shows a bearish reversal impulse, but the lower time frame (LTF) seems to still need to form another high point... The chart shows the direction of the move that I think is unfolding. I’m watching a retest around 83,500 USD... If it holds this support level, then #BTC may again attempt the resistance level at 89,000 USD... It will certainly produce bearish signals and may mark the top of this macro B wave. Around 83,500 USD is the key price level we’re focused on! Now, be extra careful in the crypto market... BTC is already approaching its target! After confirming the top, the lowest pullback target is around 70,000 USD, and a new low is very likely. I’ll update you with the latest developments at any time.
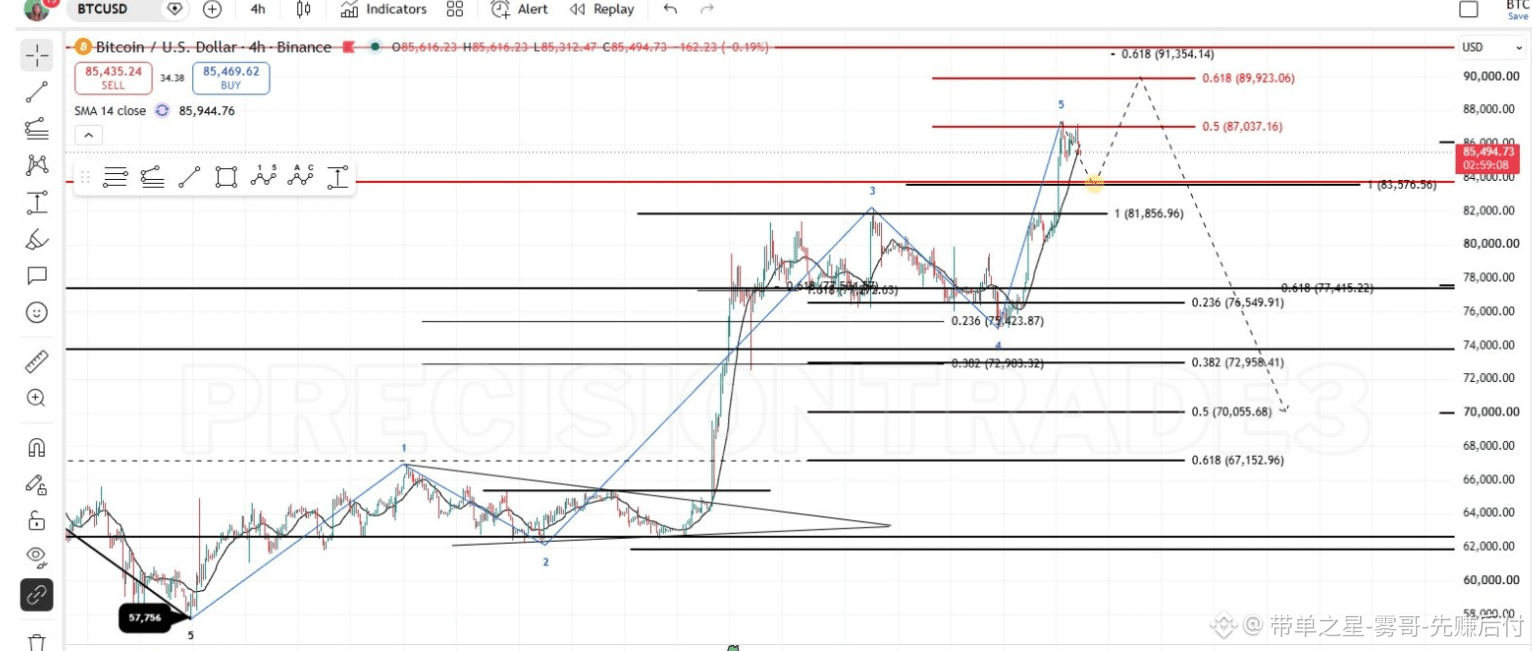
102
·
--
$BTC
{spot}(BTCUSDT)
The likelihood of a callback to the $81,000–$83,000 range is becoming increasingly likely. Today, Bitcoin first broke below the short-term uptrend line, then retested the trend line, and subsequently sharply broke through the support level of our key long-term trend line. #BTC is currently consolidating around the $84,000 mark. If the downward momentum does not immediately continue to $83,000, I believe we may first see a retest of the $85,000 area. In that scenario, I would consider setting up hedges for my short positions to protect my ongoing swing-long position. My first target is the recent breakout’s prior range high. If the downward momentum continues, the next target is the low of the current rebound. #BTC走势分析
$BTC
The likelihood of a callback to the $81,000–$83,000 range is becoming increasingly likely. Today, Bitcoin first broke below the short-term uptrend line, then retested the trend line, and subsequently sharply broke through the support level of our key long-term trend line. #BTC is currently consolidating around the $84,000 mark. If the downward momentum does not immediately continue to $83,000, I believe we may first see a retest of the $85,000 area. In that scenario, I would consider setting up hedges for my short positions to protect my ongoing swing-long position. My first target is the recent breakout’s prior range high. If the downward momentum continues, the next target is the low of the current rebound. #BTC走势分析
The likelihood of a callback to the $81,000–$83,000 range is becoming increasingly likely. Today, Bitcoin first broke below the short-term uptrend line, then retested the trend line, and subsequently sharply broke through the support level of our key long-term trend line. #BTC is currently consolidating around the $84,000 mark. If the downward momentum does not immediately continue to $83,000, I believe we may first see a retest of the $85,000 area. In that scenario, I would consider setting up hedges for my short positions to protect my ongoing swing-long position. My first target is the recent breakout’s prior range high. If the downward momentum continues, the next target is the low of the current rebound. #BTC走势分析
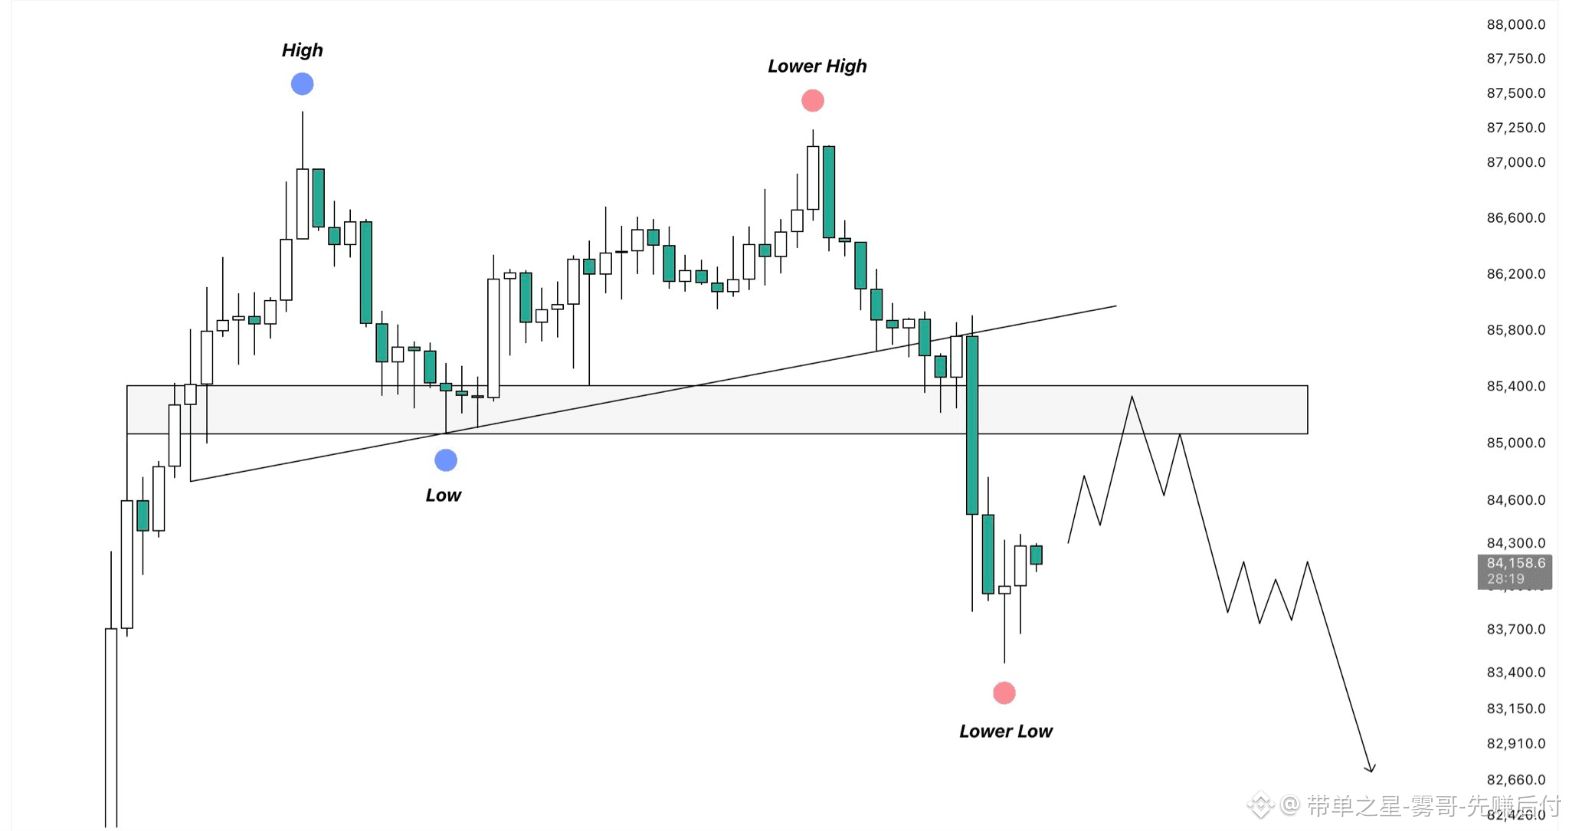
77
·
--
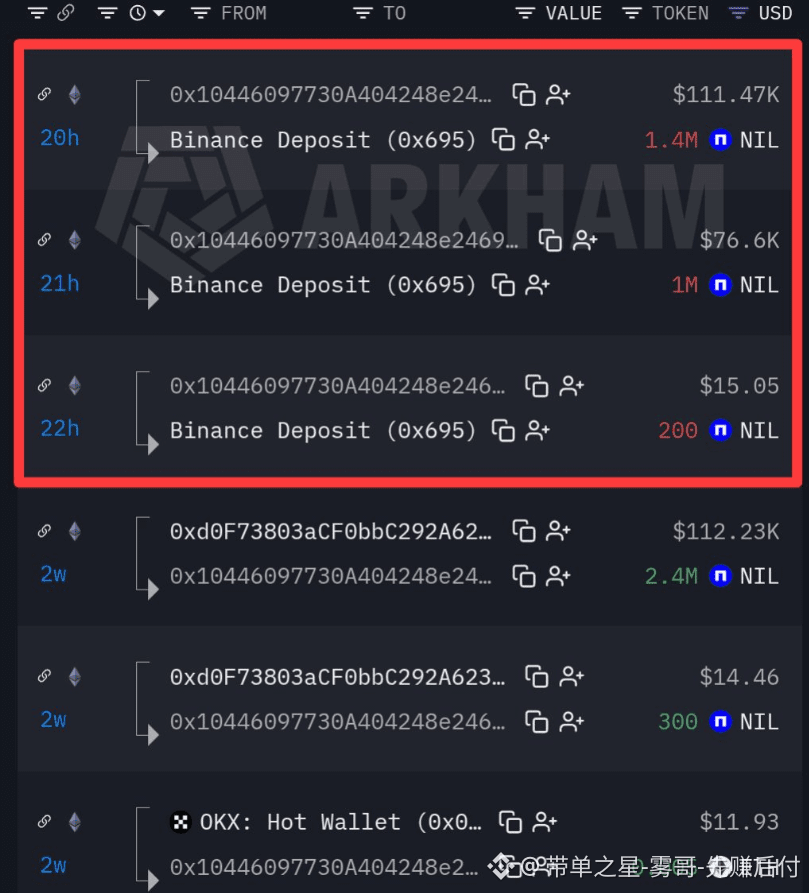
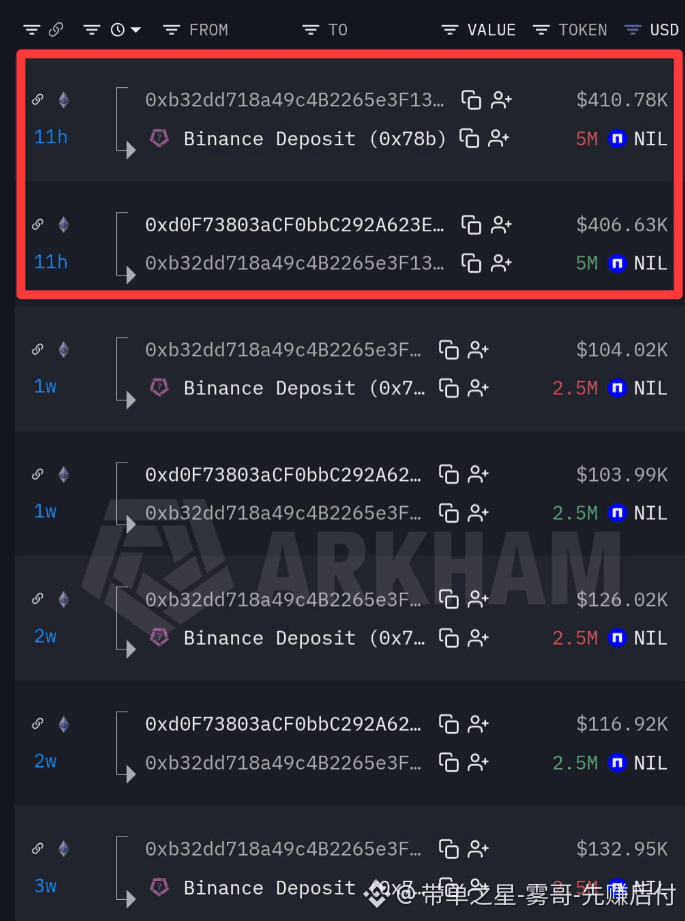
$NIL is rapidly approaching 0.098 (up 20% today), but the on-chain capital flow situation is completely different. More than 41 million $NIL (worth over $2.6 million) have been transferred into the hot wallets of three major exchanges. More importantly, these three wallets have now been emptied of $NIL . One MEXC wallet withdrew 26.25 million NIL near $0.049, then almost all of it was deposited shortly after near $0.062. A Binance wallet accumulated 12.5 million NIL near $0.041–0.046 and has now deposited it all into Binance. Another wallet received 2.4 million NIL near $0.046 and then deposited it all into Binance near $0.078. Therefore, the wallets that were accumulated early have all been cleared. Meanwhile, the price is pressing toward 0.10, and latecomers are chasing the rally. This is exactly what I’m focused on. When large accumulated positions are fully moved to exchanges and the wallet balances drop to zero, I will closely watch for potential sell pressure above. I will track fund flows between wallets and exchanges as well as the price reaction.
$NIL is rapidly approaching 0.098 (up 20% today), but the on-chain capital flow situation is completely different. More than 41 million $NIL (worth over $2.6 million) have been transferred into the hot wallets of three major exchanges. More importantly, these three wallets have now been emptied of $NIL . One MEXC wallet withdrew 26.25 million NIL near $0.049, then almost all of it was deposited shortly after near $0.062. A Binance wallet accumulated 12.5 million NIL near $0.041–0.046 and has now deposited it all into Binance. Another wallet received 2.4 million NIL near $0.046 and then deposited it all into Binance near $0.078. Therefore, the wallets that were accumulated early have all been cleared. Meanwhile, the price is pressing toward 0.10, and latecomers are chasing the rally. This is exactly what I’m focused on. When large accumulated positions are fully moved to exchanges and the wallet balances drop to zero, I will closely watch for potential sell pressure above. I will track fund flows between wallets and exchanges as well as the price reaction.
79
·
--
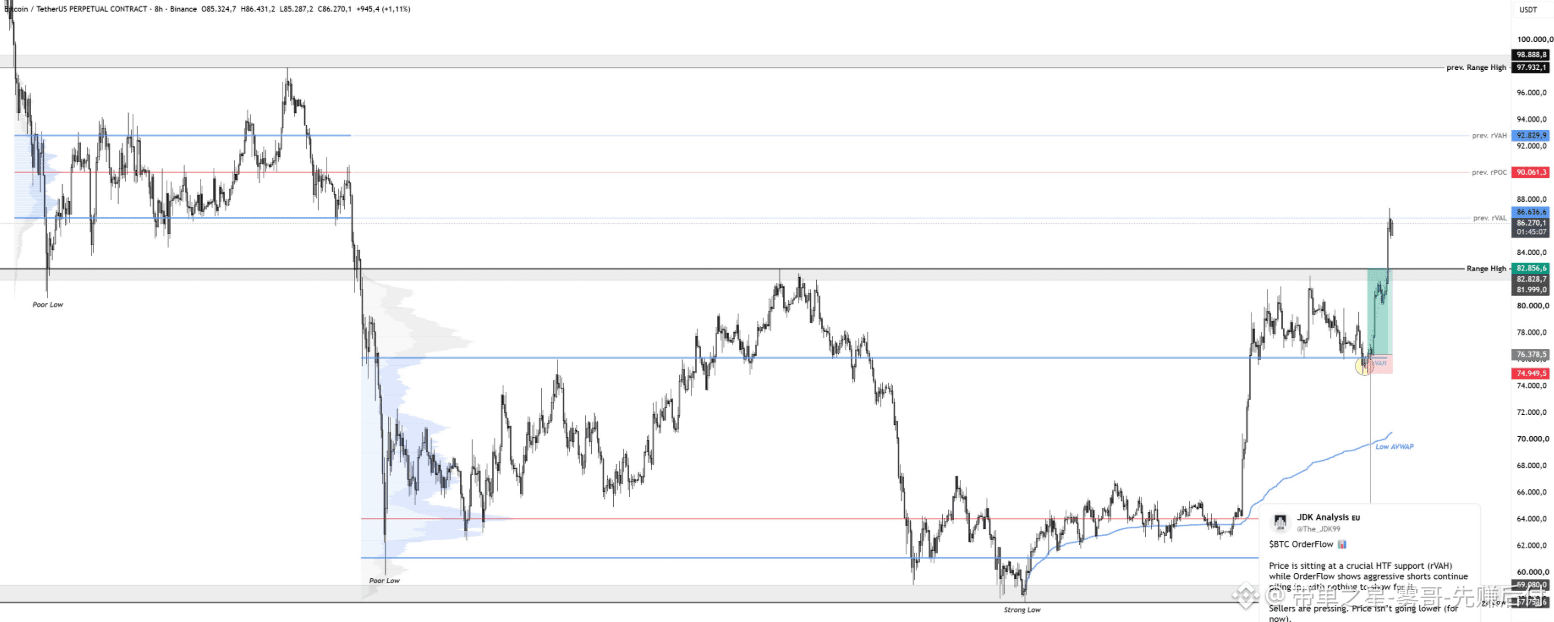
$BTC My last high-probability trading opportunity was a long at the high point of a range-bound move. At the time, a large number of new short positions were opened at that price level, but it did not lead to any decline. I executed real trades then and explained the order flow to you in detail. However, right now I truly can't find any other high-probability trading opportunities. Yesterday's daily close was far above the range high (a very bullish signal), and price has continued to trade above that level and receive support. We are now beginning to test the previous range value—that's a key area. However, so far, I haven't seen enough signs of weakness to support a short. #BTC #BTC走势分析
$BTC My last high-probability trading opportunity was a long at the high point of a range-bound move. At the time, a large number of new short positions were opened at that price level, but it did not lead to any decline. I executed real trades then and explained the order flow to you in detail. However, right now I truly can't find any other high-probability trading opportunities. Yesterday's daily close was far above the range high (a very bullish signal), and price has continued to trade above that level and receive support. We are now beginning to test the previous range value—that's a key area. However, so far, I haven't seen enough signs of weakness to support a short. #BTC #BTC走势分析
326
·
--
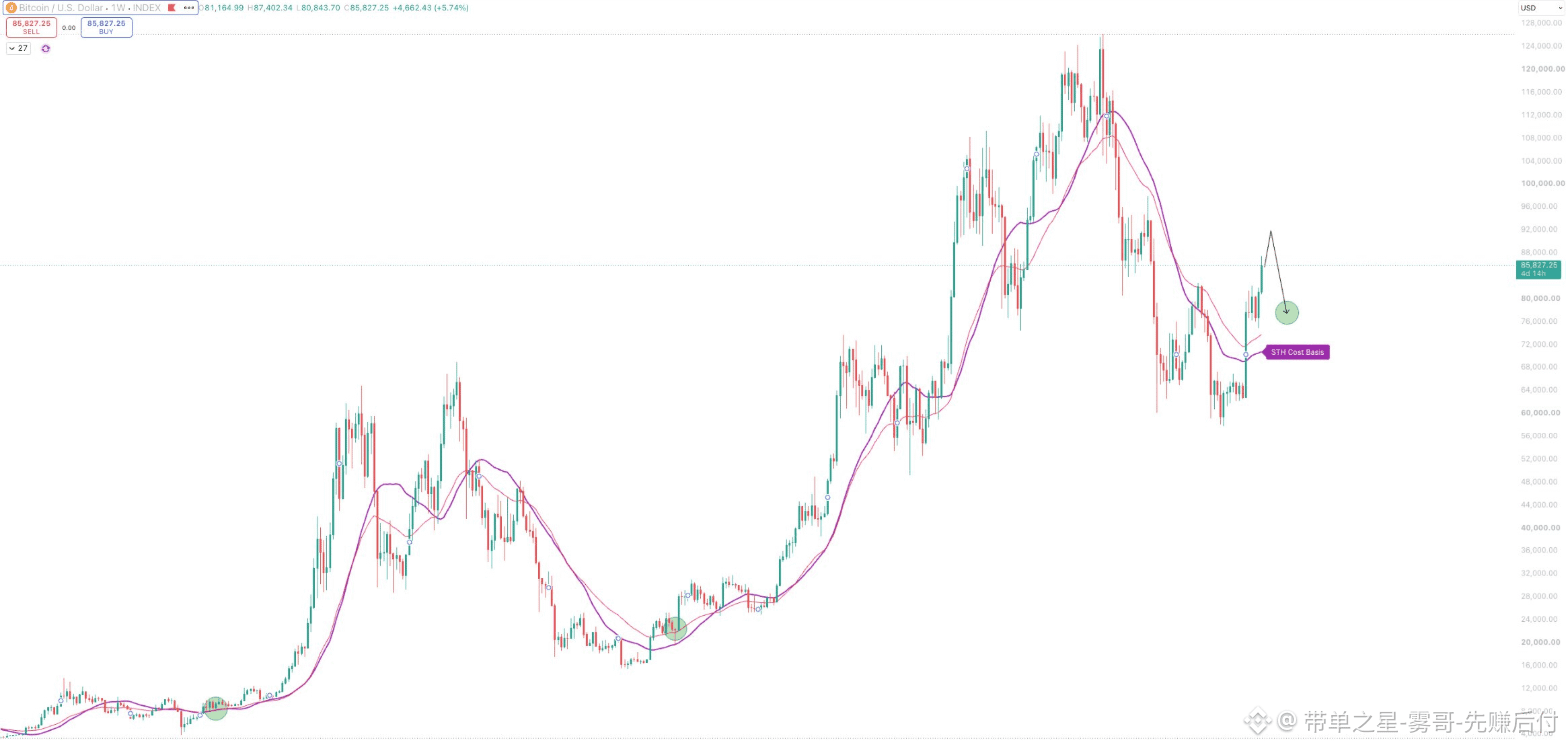
Prices will drop significantly. Within the next few weeks, at some point, there will be the first “concerning” decline. After the bear market turns into a bull market, something similar always happens. So far, Bitcoin has barely pulled back, and the rally has been strong. Many supporters of the four-year cycle theory have already given up, and I think before the first major drop, the price may rise one more wave, reaching around $90,000. However, this scenario may also happen earlier. I can only say that the decline is definitely coming, and it will arrive soon. This drop will be a good time to buy, not a good time to sell. Looking back at 2020 and 2023, after we ultimately broke out in those two markets, we then retested the cost basis of $STHO.US and the 200-day moving average. This is very likely to happen again. Be prepared. If you are currently holding and waiting on the sidelines, this is your entry time. My analysis shows that the price will rise first, but this could happen at any moment; the target price is around $80,000 or above $70,000. This decline will be caused by over-the-counter late buyers chasing the rally out of fear of missing out, as well as later emotional longs using leverage to buy at overbought levels. Friends, don’t be scared. $BTC #BTC走势分析
Prices will drop significantly. Within the next few weeks, at some point, there will be the first “concerning” decline. After the bear market turns into a bull market, something similar always happens. So far, Bitcoin has barely pulled back, and the rally has been strong. Many supporters of the four-year cycle theory have already given up, and I think before the first major drop, the price may rise one more wave, reaching around $90,000. However, this scenario may also happen earlier. I can only say that the decline is definitely coming, and it will arrive soon. This drop will be a good time to buy, not a good time to sell. Looking back at 2020 and 2023, after we ultimately broke out in those two markets, we then retested the cost basis of $STHO.US and the 200-day moving average. This is very likely to happen again. Be prepared. If you are currently holding and waiting on the sidelines, this is your entry time. My analysis shows that the price will rise first, but this could happen at any moment; the target price is around $80,000 or above $70,000. This decline will be caused by over-the-counter late buyers chasing the rally out of fear of missing out, as well as later emotional longs using leverage to buy at overbought levels. Friends, don’t be scared. $BTC #BTC走势分析
54
Log in to explore more content
Join global crypto users on Binance Square
⚡️ Get latest and useful information about crypto.
💬 Trusted by the world’s largest crypto exchange.
👍 Discover real insights from verified creators.
Email / Phone number