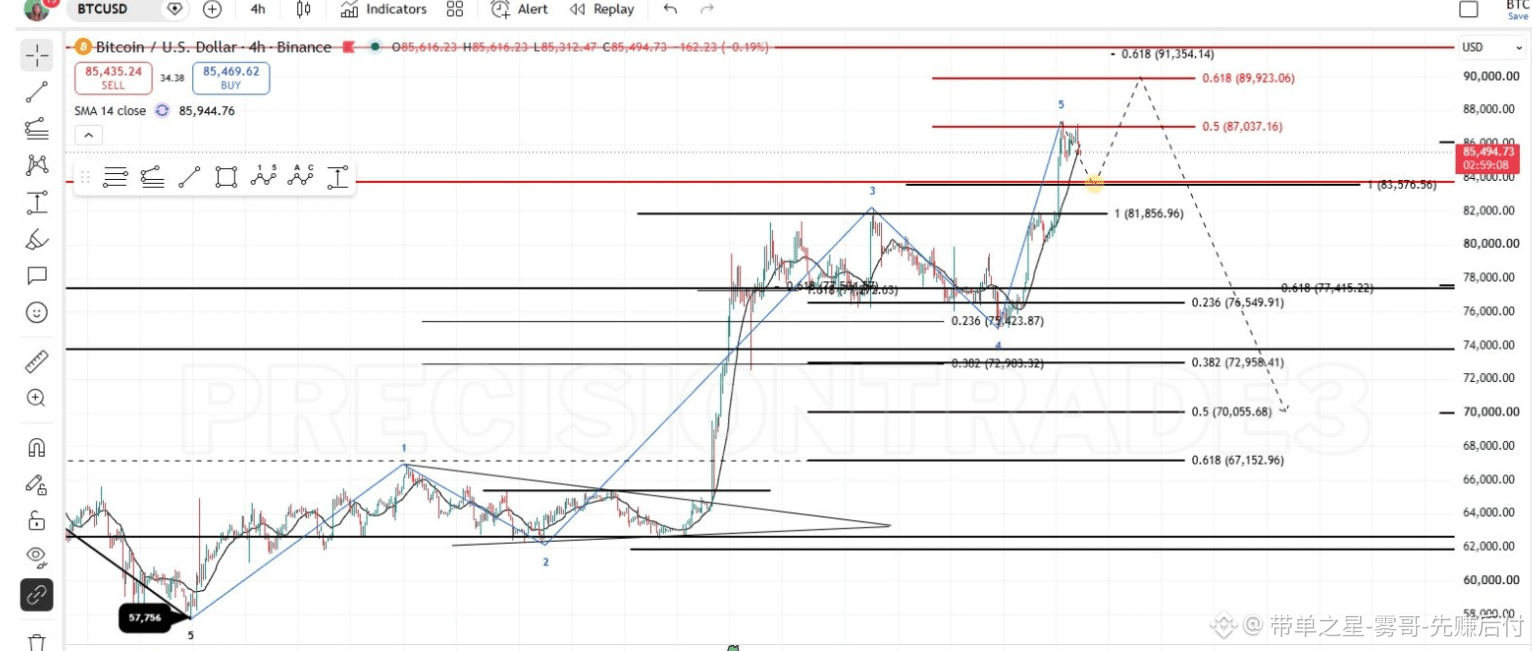
$BTC The first resistance level at 87,000 USD has been reached! The Relative Strength Index (RSI) on the higher time frame (HTF) shows a bearish reversal impulse, but the lower time frame (LTF) seems to still need to form another high point... The chart shows the direction of the move that I think is unfolding. I’m watching a retest around 83,500 USD... If it holds this support level, then #BTC may again attempt the resistance level at 89,000 USD... It will certainly produce bearish signals and may mark the top of this macro B wave. Around 83,500 USD is the key price level we’re focused on! Now, be extra careful in the crypto market... BTC is already approaching its target! After confirming the top, the lowest pullback target is around 70,000 USD, and a new low is very likely. I’ll update you with the latest developments at any time.


Post