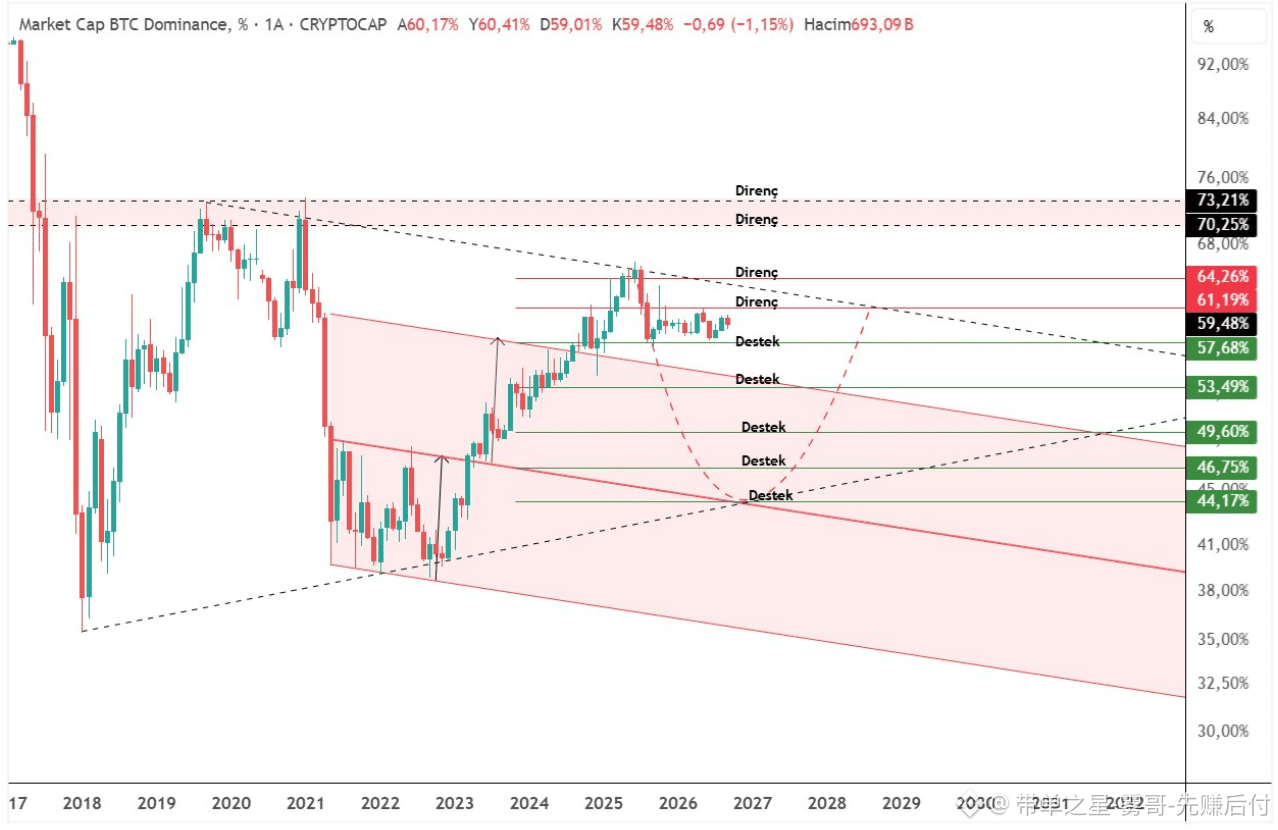
In my view, the situation with BTC.D is starting to get more interesting... First, let me explain what BTC.D is in the simplest way possible. :)
#BTC shows Bitcoin’s share of the entire cryptocurrency market. In other words, it roughly tells you how much of every 100 dollars in the crypto market is Bitcoin. At the moment, in my chart, BTC.D is about 59.5%, and the first level I’m watching is 57.68%. If the share starts to fall and breaks below 57.68%, then next I’ll watch the levels 53.49% → 49.60% → 46.75% and 44.17%. So what does this mean for altcoins? If the price of #bitcoin stays strong while the share declines, then funds may flow from Bitcoin into altcoins. This is one of the most favorable scenarios for altcoins—especially when Bitcoin’s share falls below 50%, since then altcoins’ price action will grab my attention even more. But if the share rebounds, things change. 61.19% and 64.26% are my key resistance levels. If those resistances are broken, it means Bitcoin is regaining market dominance. In those periods, altcoins usually have a harder time than Bitcoin. But there’s one detail that’s very important: BTC.D falling doesn’t necessarily mean altcoins will rise—there’s no such rule. For example, when Bitcoin’s price crashes, the altcoin share may also decline, and at that time the entire market might be falling. That’s why I never interpret the dominance chart in isolation; I analyze it together with Bitcoin’s price and the TOTAL/TOTAL3 indicators. For me, the current read is simple:
Above 61–64%: Bitcoin’s strength is increasing...
Below 57%: altcoins start getting opportunities...
Below 50%, that’s when I really start paying close attention.
So, those waiting for an altcoin rally shouldn’t only watch the coin price—they should also watch Bitcoin’s market share.
#BTC shows Bitcoin’s share of the entire cryptocurrency market. In other words, it roughly tells you how much of every 100 dollars in the crypto market is Bitcoin. At the moment, in my chart, BTC.D is about 59.5%, and the first level I’m watching is 57.68%. If the share starts to fall and breaks below 57.68%, then next I’ll watch the levels 53.49% → 49.60% → 46.75% and 44.17%. So what does this mean for altcoins? If the price of #bitcoin stays strong while the share declines, then funds may flow from Bitcoin into altcoins. This is one of the most favorable scenarios for altcoins—especially when Bitcoin’s share falls below 50%, since then altcoins’ price action will grab my attention even more. But if the share rebounds, things change. 61.19% and 64.26% are my key resistance levels. If those resistances are broken, it means Bitcoin is regaining market dominance. In those periods, altcoins usually have a harder time than Bitcoin. But there’s one detail that’s very important: BTC.D falling doesn’t necessarily mean altcoins will rise—there’s no such rule. For example, when Bitcoin’s price crashes, the altcoin share may also decline, and at that time the entire market might be falling. That’s why I never interpret the dominance chart in isolation; I analyze it together with Bitcoin’s price and the TOTAL/TOTAL3 indicators. For me, the current read is simple:
Above 61–64%: Bitcoin’s strength is increasing...
Below 57%: altcoins start getting opportunities...
Below 50%, that’s when I really start paying close attention.
So, those waiting for an altcoin rally shouldn’t only watch the coin price—they should also watch Bitcoin’s market share.