

三档苟哥
223 Posts

三档苟哥
Report
Block User

Top traders by profit in 7D

Top 30D Traders by Volume
High-Frequency Trader
8.8 Years
88 Following
119 Followers
82 Liked
2 Badges
Posts
All
Quotes
·
--
FLUID: Leaning toward further upside; watch level: FLUID 2.25 USDT
Over the next 1–4 hours, I’m leaning toward FLUID continuing higher. The first level to watch is FLUID 2.25 USDT; as price approaches, I’ll check for support and volume. It looks promising, but let’s keep the champagne in the fridge for now. 😏
Over the same rolling 24-hour period, FLUID is up 19.56%, outperforming BTC by 19.22 percentage points. That gives us a reason to keep watching, but I care more about whether it can hold onto that edge during the next pullback. If the outperformance fades, I’ll lower my expectations for it to keep strengthening independently.
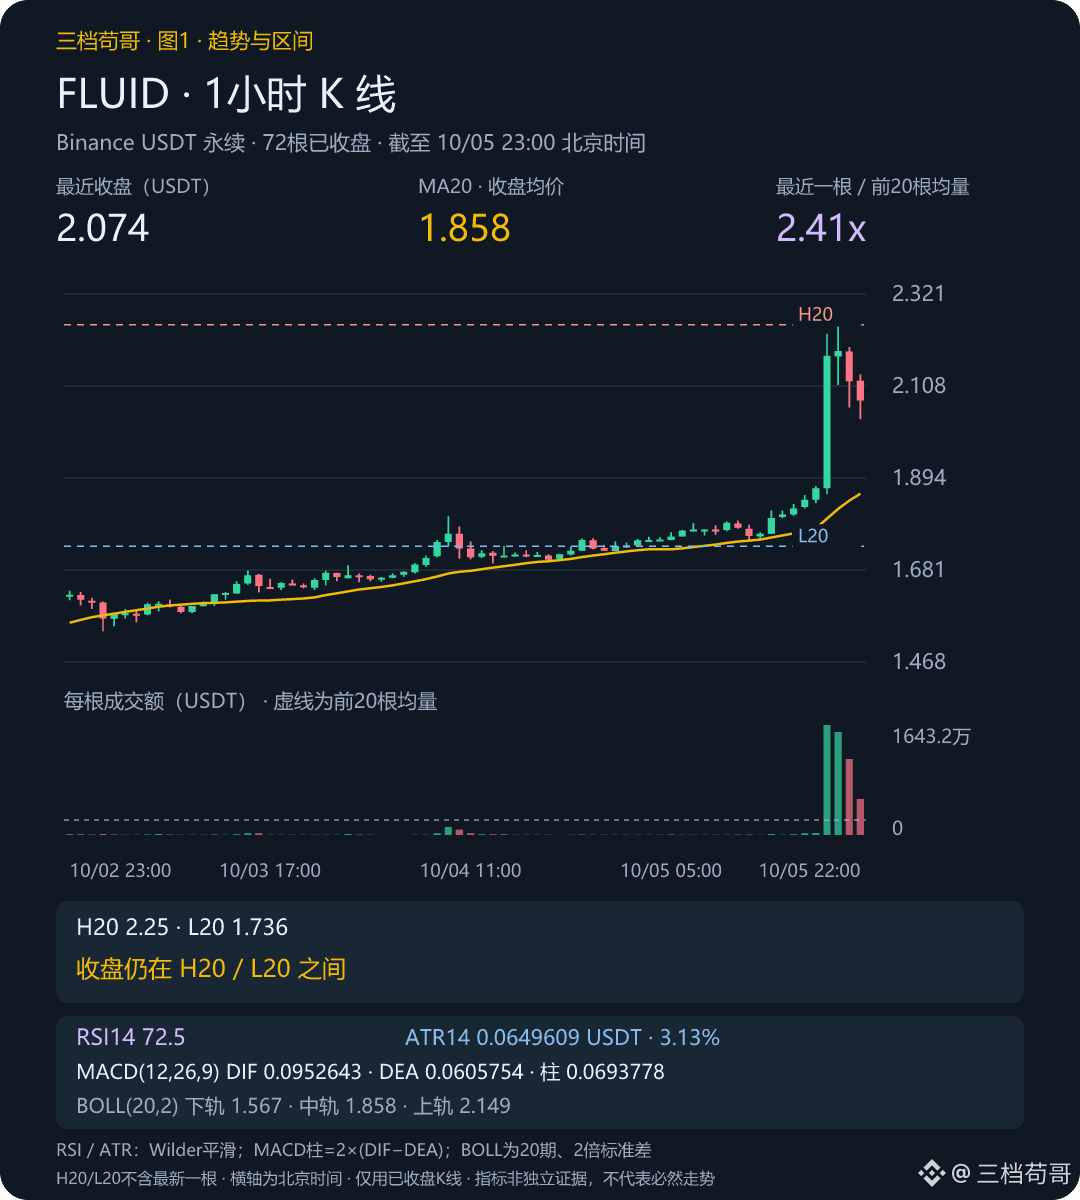
📊 Chart 1 | 1-hour chart through 23:00 Beijing time: The close remains within the range of the previous 20 bars. MA20 has risen over the last 3 bars, and the close is above it; volume was 2.41 times the average of the previous 20 bars, so this move was accompanied by increased volume.
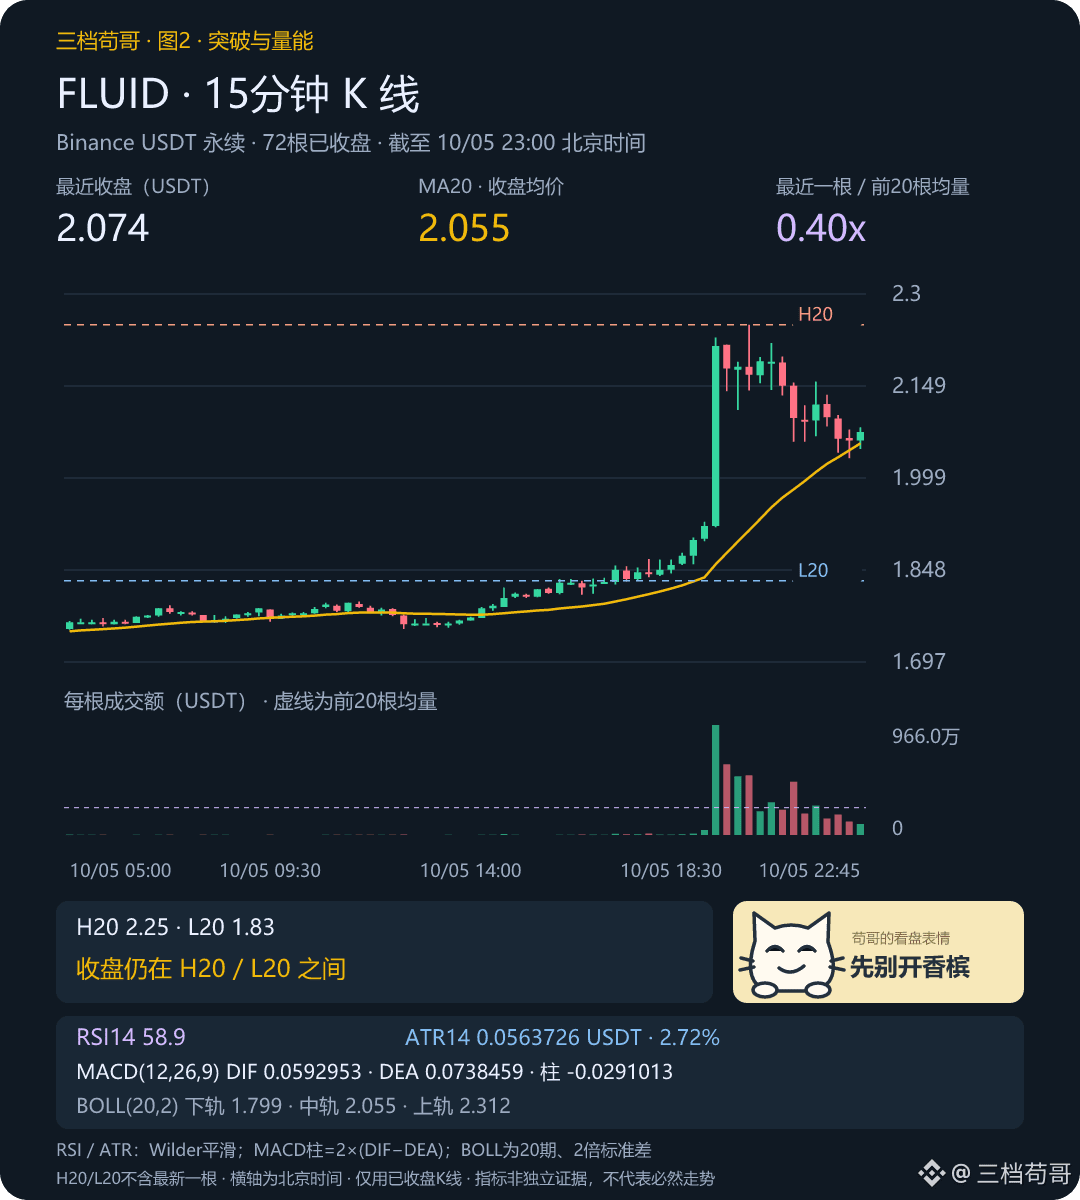
🔎 Chart 2 | FLUID 15-minute chart through 23:00 Beijing time: The close is above MA20, volume is 0.40 times average, and MA20 has risen over the last 3 bars. The shorter timeframe isn’t clearly contradicting the move. First, let’s see if this alignment continues through the next close.
🧭 RSI14 is 72.5, and the MACD positive histogram bars are shrinking: momentum is strong but getting overheated, so this alone isn’t a reason to chase the price. ATR14 is 0.064961 USDT, about 3.13% of the closing price, and is used to gauge the potential volatility range.
→ Main scenario: If the pullback holds above FLUID 1.86 USDT, I lean toward a test of FLUID 2.25 USDT. The watch level is based on the highest price among the latest 20 closed candles, including the most recent one. Once price gets close, I’ll assess the strength of any breakout.
⚠️ If the next 1-hour close falls back below FLUID 1.86 USDT, I’ll withdraw the original view. This is the MA20 moving-average watch line; in that case, I’ll turn my attention to FLUID 1.75 USDT. A wick touching the level doesn’t count; reassess if the time window has passed.
💬 Do you think price will test higher first, or is the rebound likely to give back its gains? Feel free to share which evidence on the chart makes you think so.
I’ll keep the conditions above in place and continue checking them against FLUID’s price action below.
Source: Binance USDT perpetuals | Rolling 24 hours | 2026/10/5 23:05:55 Beijing time.
For discussion only; not investment advice.
$BTC $ETH $FLUID
FLUID: Leaning toward further upside; watch level: FLUID 2.25 USDT
Over the next 1–4 hours, I’m leaning toward FLUID continuing higher. The first level to watch is FLUID 2.25 USDT; as price approaches, I’ll check for support and volume. It looks promising, but let’s keep the champagne in the fridge for now. 😏
Over the same rolling 24-hour period, FLUID is up 19.56%, outperforming BTC by 19.22 percentage points. That gives us a reason to keep watching, but I care more about whether it can hold onto that edge during the next pullback. If the outperformance fades, I’ll lower my expectations for it to keep strengthening independently.
📊 Chart 1 | 1-hour chart through 23:00 Beijing time: The close remains within the range of the previous 20 bars. MA20 has risen over the last 3 bars, and the close is above it; volume was 2.41 times the average of the previous 20 bars, so this move was accompanied by increased volume.
🔎 Chart 2 | FLUID 15-minute chart through 23:00 Beijing time: The close is above MA20, volume is 0.40 times average, and MA20 has risen over the last 3 bars. The shorter timeframe isn’t clearly contradicting the move. First, let’s see if this alignment continues through the next close.
🧭 RSI14 is 72.5, and the MACD positive histogram bars are shrinking: momentum is strong but getting overheated, so this alone isn’t a reason to chase the price. ATR14 is 0.064961 USDT, about 3.13% of the closing price, and is used to gauge the potential volatility range.
→ Main scenario: If the pullback holds above FLUID 1.86 USDT, I lean toward a test of FLUID 2.25 USDT. The watch level is based on the highest price among the latest 20 closed candles, including the most recent one. Once price gets close, I’ll assess the strength of any breakout.
⚠️ If the next 1-hour close falls back below FLUID 1.86 USDT, I’ll withdraw the original view. This is the MA20 moving-average watch line; in that case, I’ll turn my attention to FLUID 1.75 USDT. A wick touching the level doesn’t count; reassess if the time window has passed.
💬 Do you think price will test higher first, or is the rebound likely to give back its gains? Feel free to share which evidence on the chart makes you think so.
I’ll keep the conditions above in place and continue checking them against FLUID’s price action below.
Source: Binance USDT perpetuals | Rolling 24 hours | 2026/10/5 23:05:55 Beijing time.
For discussion only; not investment advice.
$BTC $ETH $FLUID
Over the next 1–4 hours, I’m leaning toward FLUID continuing higher. The first level to watch is FLUID 2.25 USDT; as price approaches, I’ll check for support and volume. It looks promising, but let’s keep the champagne in the fridge for now. 😏
Over the same rolling 24-hour period, FLUID is up 19.56%, outperforming BTC by 19.22 percentage points. That gives us a reason to keep watching, but I care more about whether it can hold onto that edge during the next pullback. If the outperformance fades, I’ll lower my expectations for it to keep strengthening independently.
📊 Chart 1 | 1-hour chart through 23:00 Beijing time: The close remains within the range of the previous 20 bars. MA20 has risen over the last 3 bars, and the close is above it; volume was 2.41 times the average of the previous 20 bars, so this move was accompanied by increased volume.
🔎 Chart 2 | FLUID 15-minute chart through 23:00 Beijing time: The close is above MA20, volume is 0.40 times average, and MA20 has risen over the last 3 bars. The shorter timeframe isn’t clearly contradicting the move. First, let’s see if this alignment continues through the next close.
🧭 RSI14 is 72.5, and the MACD positive histogram bars are shrinking: momentum is strong but getting overheated, so this alone isn’t a reason to chase the price. ATR14 is 0.064961 USDT, about 3.13% of the closing price, and is used to gauge the potential volatility range.
→ Main scenario: If the pullback holds above FLUID 1.86 USDT, I lean toward a test of FLUID 2.25 USDT. The watch level is based on the highest price among the latest 20 closed candles, including the most recent one. Once price gets close, I’ll assess the strength of any breakout.
⚠️ If the next 1-hour close falls back below FLUID 1.86 USDT, I’ll withdraw the original view. This is the MA20 moving-average watch line; in that case, I’ll turn my attention to FLUID 1.75 USDT. A wick touching the level doesn’t count; reassess if the time window has passed.
💬 Do you think price will test higher first, or is the rebound likely to give back its gains? Feel free to share which evidence on the chart makes you think so.
I’ll keep the conditions above in place and continue checking them against FLUID’s price action below.
Source: Binance USDT perpetuals | Rolling 24 hours | 2026/10/5 23:05:55 Beijing time.
For discussion only; not investment advice.
$BTC $ETH $FLUID
534
·
--
SOL has upgrade expectations, so why am I still not rushing to chase it? A look at three factors together
👀 SOL’s story is still intact, but short-term buyers need to show evidence. At 21:42 Beijing time on October 5, Binance perpetual mark price was 120.32, down 1.11% over 24 hours. For now, I’m leaning toward weak sideways action; a stronger outlook depends on whether price can reclaim 121.03.
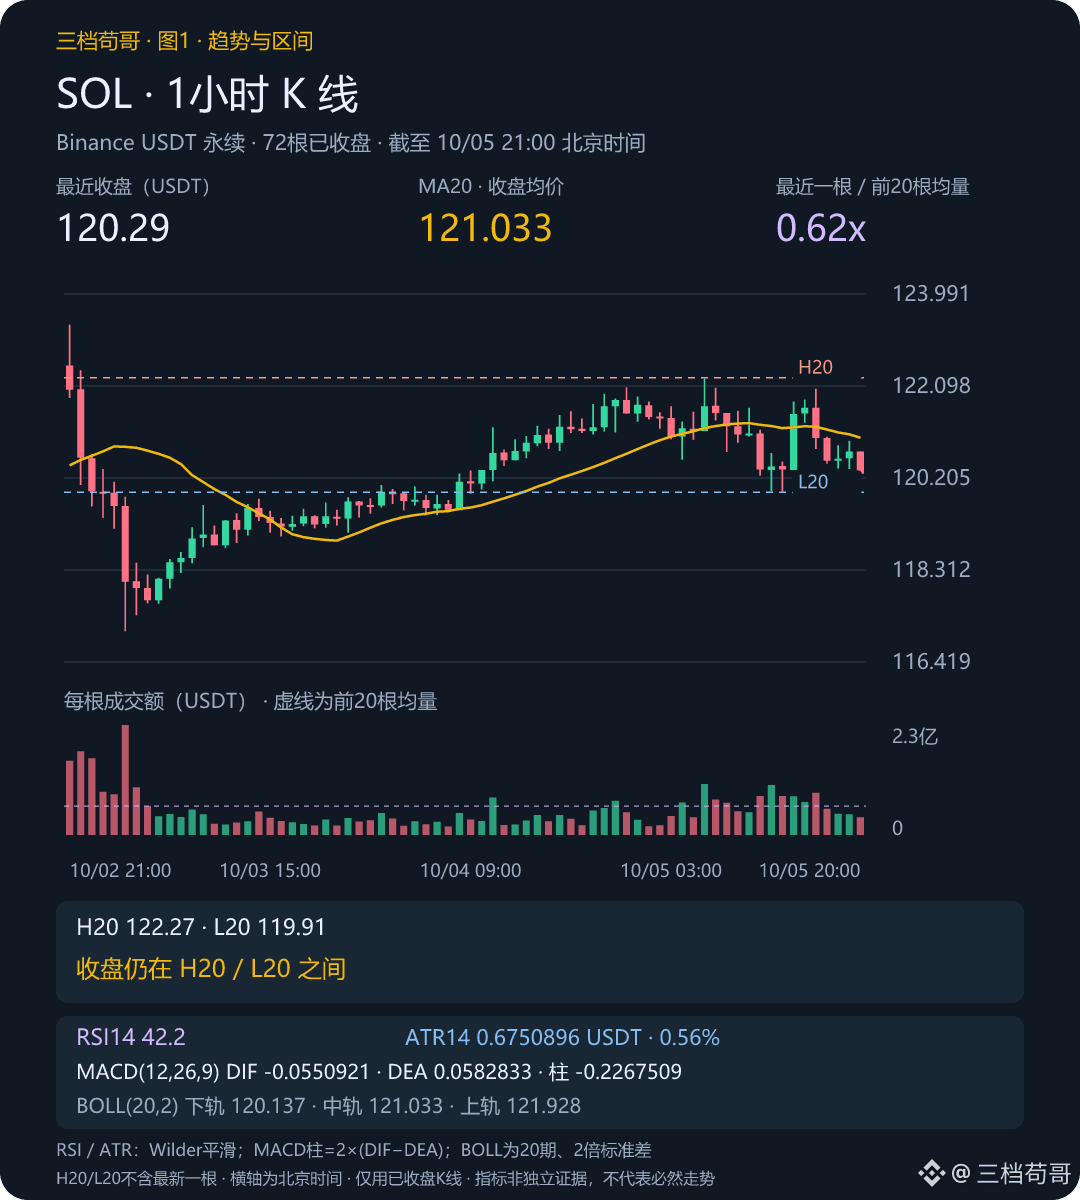
📈 Technicals: The hourly candle closed at 120.29 as of 21:00, below the MA20 at 121.03; RSI was 42.2, the MACD histogram was -0.227, and the latest candle’s volume ratio was 0.62x. Taken together, these signals suggest the rebound is not yet strong enough. The lower Bollinger Band at 120.14 and the low from the previous 20 hours at 119.91 are the first support zone to watch. ATR is about $0.68, so a stop that’s too tight could get swept by volatility.
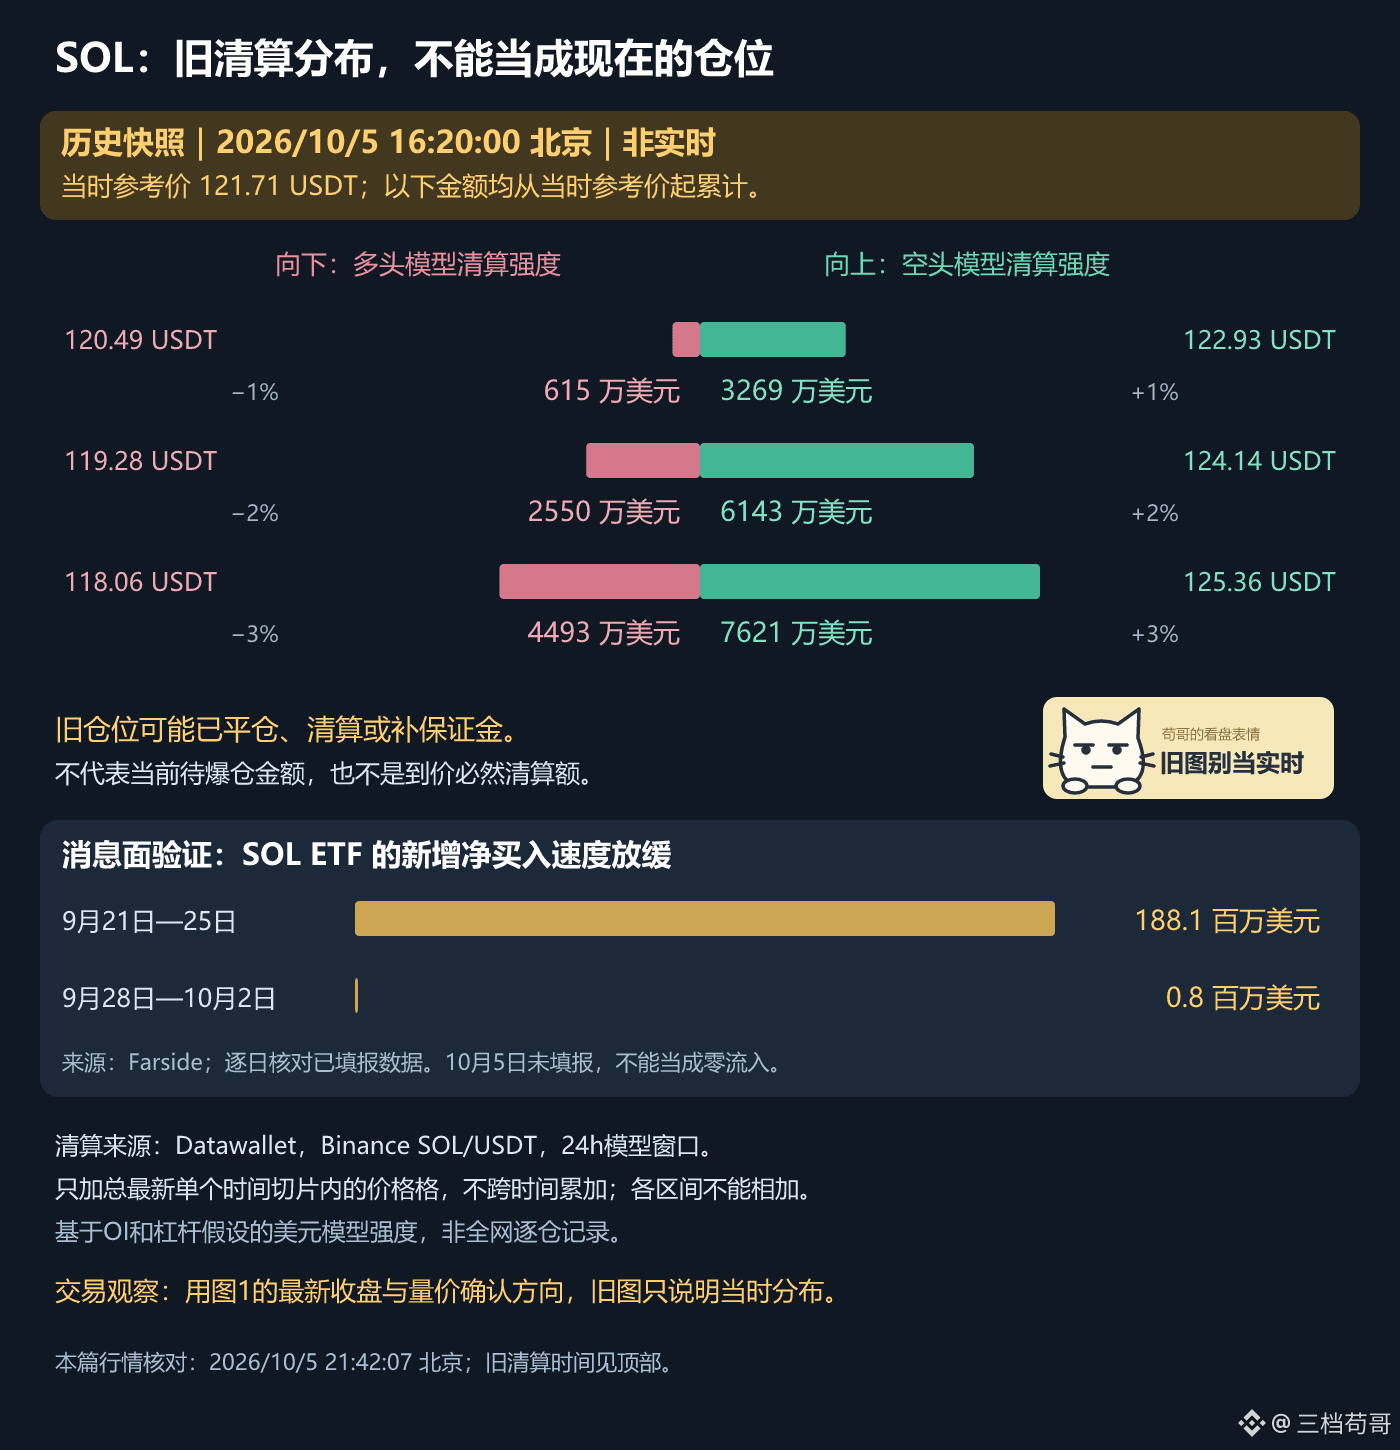
📰 News: Based on the reported figures compiled by Farside, ETF net inflows from September 28 to October 2 totaled just $800,000, versus about $188.1 million the previous week. Flows are still net positive, but momentum has cooled significantly. On October 2, the Foundation still described Alpenglow as an “upcoming upgrade.” Faster speeds and improved reliability are expectations; it would be inaccurate to say it has already gone live on mainnet.
⚠️ Liquidation data is based only on a historical snapshot from 16:20 on October 5, not real-time data! Datawallet’s Binance 24-hour model, starting at 121.71: on the way up to 124.14, the cumulative modeled short liquidation intensity along the path was about $61.43 million; on the way down to 119.28, the long-side figure was about $25.50 million. At that time, the figure above was about 2.41 times the one below. But the current price has moved: these are absolutely not current liquidation balances, and reaching those prices does not mean liquidations are guaranteed.
🎯 My plan: I’ll give more weight to a bullish outlook only if the hourly candle reclaims 121.03, the volume ratio is at least 1.5x, and price holds on a retest. First targets: 121.93–122.27. If 119.91 gives way and the rebound fails to reclaim it, I’ll treat that as a continuation of the downtrend. Open interest by coin is up 0.01% over the past 4 hours, and the funding rate is 0.0011%—not enough on its own to support a short squeeze.
💬 Would you wait for a high-volume reclaim of the moving average, or first wait to see how price reacts at support?
There’s a SOL market link below to compare against the range shown in the chart.
Sources: Binance perpetual candlesticks/mark price/OI; Farside https://farside.co.uk/sol/; Solana Foundation https://x.com/SolanaFndn/status/2105699876675940384; Datawallet historical model https://www.datawallet.com/zh/liquidation-heatmap/solana
Methodology: Prices are in USDT; volume ratio = the latest closed candle’s trading volume / the average of the previous 20 candles; MACD histogram = 2×(DIF−DEA); RSI/ATR use the Wilder method; OI is measured in coins. The 1.5x volume ratio is a condition to watch, not a backtested threshold. ETF figures for October 5 have not been reported; do not treat them as zero inflows. Figure 1 shows the latest closed hourly candle. Figure 2’s liquidation data is an old 16:20 snapshot, summing only price bins from a single time slice; it is not market-wide data or actual liquidation amounts, and should not be used as a basis for current positioning or directional bias.
For discussion only; not investment advice.
$BTC $ETH $SOL
SOL has upgrade expectations, so why am I still not rushing to chase it? A look at three factors together
👀 SOL’s story is still intact, but short-term buyers need to show evidence. At 21:42 Beijing time on October 5, Binance perpetual mark price was 120.32, down 1.11% over 24 hours. For now, I’m leaning toward weak sideways action; a stronger outlook depends on whether price can reclaim 121.03.
📈 Technicals: The hourly candle closed at 120.29 as of 21:00, below the MA20 at 121.03; RSI was 42.2, the MACD histogram was -0.227, and the latest candle’s volume ratio was 0.62x. Taken together, these signals suggest the rebound is not yet strong enough. The lower Bollinger Band at 120.14 and the low from the previous 20 hours at 119.91 are the first support zone to watch. ATR is about $0.68, so a stop that’s too tight could get swept by volatility.
📰 News: Based on the reported figures compiled by Farside, ETF net inflows from September 28 to October 2 totaled just $800,000, versus about $188.1 million the previous week. Flows are still net positive, but momentum has cooled significantly. On October 2, the Foundation still described Alpenglow as an “upcoming upgrade.” Faster speeds and improved reliability are expectations; it would be inaccurate to say it has already gone live on mainnet.
⚠️ Liquidation data is based only on a historical snapshot from 16:20 on October 5, not real-time data! Datawallet’s Binance 24-hour model, starting at 121.71: on the way up to 124.14, the cumulative modeled short liquidation intensity along the path was about $61.43 million; on the way down to 119.28, the long-side figure was about $25.50 million. At that time, the figure above was about 2.41 times the one below. But the current price has moved: these are absolutely not current liquidation balances, and reaching those prices does not mean liquidations are guaranteed.
🎯 My plan: I’ll give more weight to a bullish outlook only if the hourly candle reclaims 121.03, the volume ratio is at least 1.5x, and price holds on a retest. First targets: 121.93–122.27. If 119.91 gives way and the rebound fails to reclaim it, I’ll treat that as a continuation of the downtrend. Open interest by coin is up 0.01% over the past 4 hours, and the funding rate is 0.0011%—not enough on its own to support a short squeeze.
💬 Would you wait for a high-volume reclaim of the moving average, or first wait to see how price reacts at support?
There’s a SOL market link below to compare against the range shown in the chart.
Sources: Binance perpetual candlesticks/mark price/OI; Farside https://farside.co.uk/sol/; Solana Foundation https://x.com/SolanaFndn/status/2105699876675940384; Datawallet historical model https://www.datawallet.com/zh/liquidation-heatmap/solana
Methodology: Prices are in USDT; volume ratio = the latest closed candle’s trading volume / the average of the previous 20 candles; MACD histogram = 2×(DIF−DEA); RSI/ATR use the Wilder method; OI is measured in coins. The 1.5x volume ratio is a condition to watch, not a backtested threshold. ETF figures for October 5 have not been reported; do not treat them as zero inflows. Figure 1 shows the latest closed hourly candle. Figure 2’s liquidation data is an old 16:20 snapshot, summing only price bins from a single time slice; it is not market-wide data or actual liquidation amounts, and should not be used as a basis for current positioning or directional bias.
For discussion only; not investment advice.
$BTC $ETH $SOL
👀 SOL’s story is still intact, but short-term buyers need to show evidence. At 21:42 Beijing time on October 5, Binance perpetual mark price was 120.32, down 1.11% over 24 hours. For now, I’m leaning toward weak sideways action; a stronger outlook depends on whether price can reclaim 121.03.
📈 Technicals: The hourly candle closed at 120.29 as of 21:00, below the MA20 at 121.03; RSI was 42.2, the MACD histogram was -0.227, and the latest candle’s volume ratio was 0.62x. Taken together, these signals suggest the rebound is not yet strong enough. The lower Bollinger Band at 120.14 and the low from the previous 20 hours at 119.91 are the first support zone to watch. ATR is about $0.68, so a stop that’s too tight could get swept by volatility.
📰 News: Based on the reported figures compiled by Farside, ETF net inflows from September 28 to October 2 totaled just $800,000, versus about $188.1 million the previous week. Flows are still net positive, but momentum has cooled significantly. On October 2, the Foundation still described Alpenglow as an “upcoming upgrade.” Faster speeds and improved reliability are expectations; it would be inaccurate to say it has already gone live on mainnet.
⚠️ Liquidation data is based only on a historical snapshot from 16:20 on October 5, not real-time data! Datawallet’s Binance 24-hour model, starting at 121.71: on the way up to 124.14, the cumulative modeled short liquidation intensity along the path was about $61.43 million; on the way down to 119.28, the long-side figure was about $25.50 million. At that time, the figure above was about 2.41 times the one below. But the current price has moved: these are absolutely not current liquidation balances, and reaching those prices does not mean liquidations are guaranteed.
🎯 My plan: I’ll give more weight to a bullish outlook only if the hourly candle reclaims 121.03, the volume ratio is at least 1.5x, and price holds on a retest. First targets: 121.93–122.27. If 119.91 gives way and the rebound fails to reclaim it, I’ll treat that as a continuation of the downtrend. Open interest by coin is up 0.01% over the past 4 hours, and the funding rate is 0.0011%—not enough on its own to support a short squeeze.
💬 Would you wait for a high-volume reclaim of the moving average, or first wait to see how price reacts at support?
There’s a SOL market link below to compare against the range shown in the chart.
Sources: Binance perpetual candlesticks/mark price/OI; Farside https://farside.co.uk/sol/; Solana Foundation https://x.com/SolanaFndn/status/2105699876675940384; Datawallet historical model https://www.datawallet.com/zh/liquidation-heatmap/solana
Methodology: Prices are in USDT; volume ratio = the latest closed candle’s trading volume / the average of the previous 20 candles; MACD histogram = 2×(DIF−DEA); RSI/ATR use the Wilder method; OI is measured in coins. The 1.5x volume ratio is a condition to watch, not a backtested threshold. ETF figures for October 5 have not been reported; do not treat them as zero inflows. Figure 1 shows the latest closed hourly candle. Figure 2’s liquidation data is an old 16:20 snapshot, summing only price bins from a single time slice; it is not market-wide data or actual liquidation amounts, and should not be used as a basis for current positioning or directional bias.
For discussion only; not investment advice.
$BTC $ETH $SOL
468
·
--
Musk takes aim at USAID again: What did he say this time?
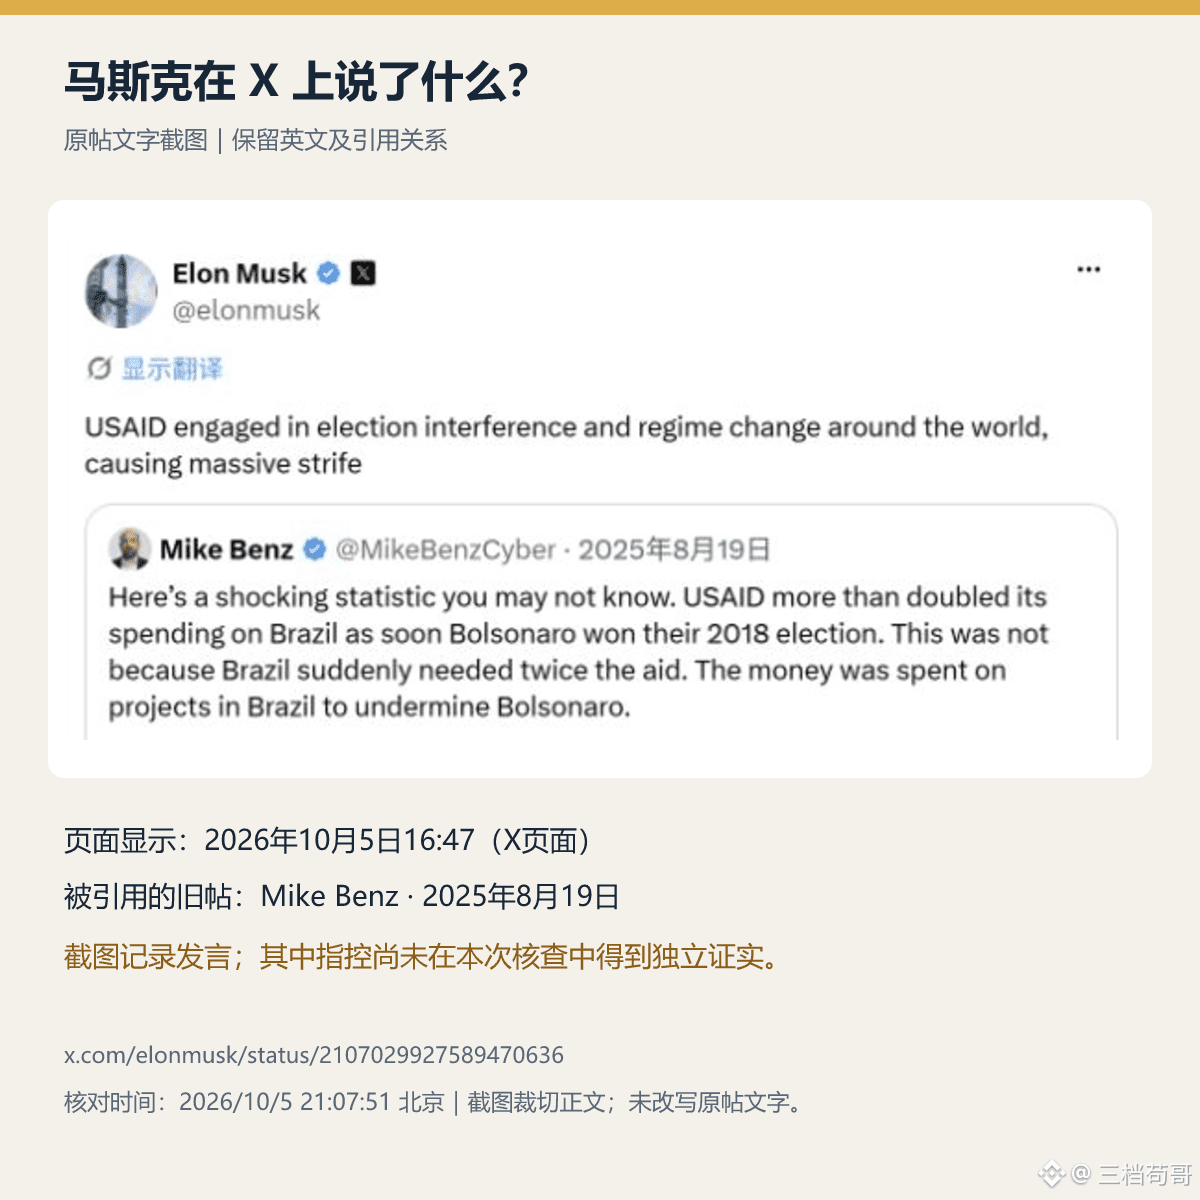
👀 On October 5, Musk posted on X, targeting the U.S. Agency for International Development (USAID). The original post page showed 16:47, and at the time of verification it showed approximately 1.567 million views. First, let’s see exactly what he said.
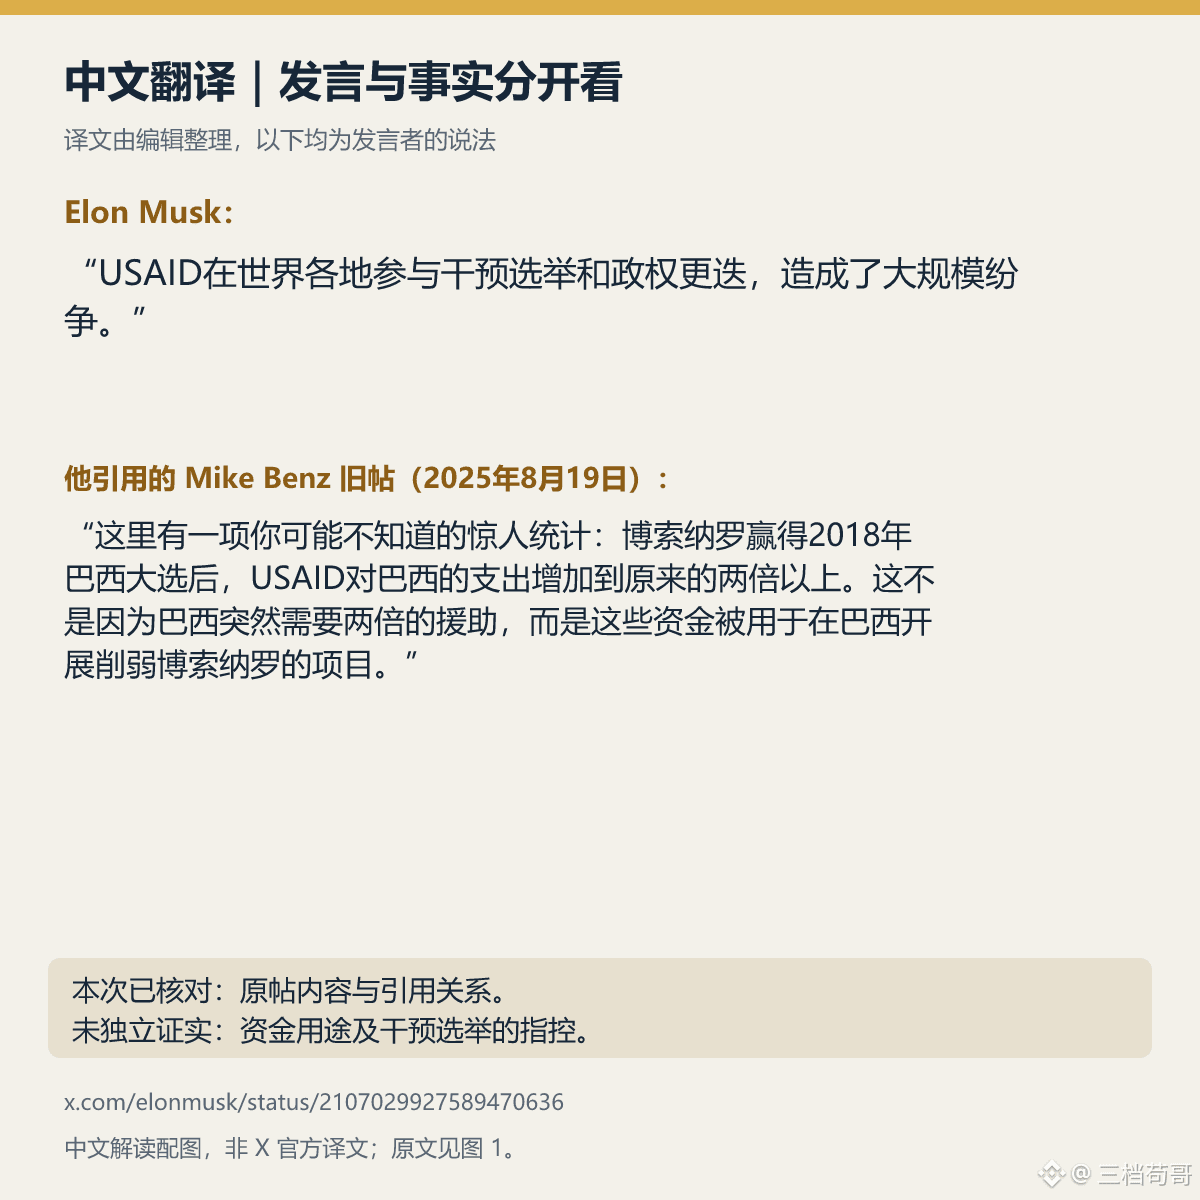
📣 Translation of the original: “USAID is involved in election interference and regime change around the world, causing widespread conflict.” This is an accusation made by Musk; it has not been independently verified in this fact-check.
He cited an old post by Mike Benz from August 19, 2025. Benz claimed that after Bolsonaro won Brazil’s 2018 general election, USAID’s spending in Brazil more than doubled, and said the funds were used to undermine Bolsonaro. Note that these claims about how the money was used also require evidence; an increase in spending alone is not enough to prove election interference.
🧩 In my view, what’s notable about this post is how an old issue is spreading again through a high-profile account. The cited material concerns Brazil, while Musk’s own statement broadened the claim to “around the world.” The scope of the discussion has expanded; whether the evidence can support such a broad claim still needs to be checked.
🔎 I’ll be watching for two things: whether there are original project lists, audits, or court records; and whether the U.S. government takes any concrete action involving budgets, diplomacy, or sanctions. The former would help assess the allegations, while the latter could affect the business environment and market risk expectations for related companies.
As for BTC, ETH, and DOGE, this post does not directly mention them. My view is that we should follow the news for now; this statement alone is not enough to infer a direction for crypto prices. Image 1 is a screenshot of the original post, and Image 2 is the Chinese translation.
💬 For stories like this, would you rather see a translation of the original post or an analysis of how assets are affected after policies are implemented?
The DOGE market data below is included only to check the market reaction; it does not mean the news has become a price catalyst.
Source: Elon Musk’s original X post https://x.com/elonmusk/status/2107029927589470636; the cited old post is dated August 19, 2025. The original post time follows what was displayed on the page, and the view count is a snapshot taken at the time of verification. The related allegations have not been independently verified in this fact-check.
For discussion purposes only; this is not investment advice.
$BTC $ETH $DOGE
Musk takes aim at USAID again: What did he say this time?
👀 On October 5, Musk posted on X, targeting the U.S. Agency for International Development (USAID). The original post page showed 16:47, and at the time of verification it showed approximately 1.567 million views. First, let’s see exactly what he said.
📣 Translation of the original: “USAID is involved in election interference and regime change around the world, causing widespread conflict.” This is an accusation made by Musk; it has not been independently verified in this fact-check.
He cited an old post by Mike Benz from August 19, 2025. Benz claimed that after Bolsonaro won Brazil’s 2018 general election, USAID’s spending in Brazil more than doubled, and said the funds were used to undermine Bolsonaro. Note that these claims about how the money was used also require evidence; an increase in spending alone is not enough to prove election interference.
🧩 In my view, what’s notable about this post is how an old issue is spreading again through a high-profile account. The cited material concerns Brazil, while Musk’s own statement broadened the claim to “around the world.” The scope of the discussion has expanded; whether the evidence can support such a broad claim still needs to be checked.
🔎 I’ll be watching for two things: whether there are original project lists, audits, or court records; and whether the U.S. government takes any concrete action involving budgets, diplomacy, or sanctions. The former would help assess the allegations, while the latter could affect the business environment and market risk expectations for related companies.
As for BTC, ETH, and DOGE, this post does not directly mention them. My view is that we should follow the news for now; this statement alone is not enough to infer a direction for crypto prices. Image 1 is a screenshot of the original post, and Image 2 is the Chinese translation.
💬 For stories like this, would you rather see a translation of the original post or an analysis of how assets are affected after policies are implemented?
The DOGE market data below is included only to check the market reaction; it does not mean the news has become a price catalyst.
Source: Elon Musk’s original X post https://x.com/elonmusk/status/2107029927589470636; the cited old post is dated August 19, 2025. The original post time follows what was displayed on the page, and the view count is a snapshot taken at the time of verification. The related allegations have not been independently verified in this fact-check.
For discussion purposes only; this is not investment advice.
$BTC $ETH $DOGE
👀 On October 5, Musk posted on X, targeting the U.S. Agency for International Development (USAID). The original post page showed 16:47, and at the time of verification it showed approximately 1.567 million views. First, let’s see exactly what he said.
📣 Translation of the original: “USAID is involved in election interference and regime change around the world, causing widespread conflict.” This is an accusation made by Musk; it has not been independently verified in this fact-check.
He cited an old post by Mike Benz from August 19, 2025. Benz claimed that after Bolsonaro won Brazil’s 2018 general election, USAID’s spending in Brazil more than doubled, and said the funds were used to undermine Bolsonaro. Note that these claims about how the money was used also require evidence; an increase in spending alone is not enough to prove election interference.
🧩 In my view, what’s notable about this post is how an old issue is spreading again through a high-profile account. The cited material concerns Brazil, while Musk’s own statement broadened the claim to “around the world.” The scope of the discussion has expanded; whether the evidence can support such a broad claim still needs to be checked.
🔎 I’ll be watching for two things: whether there are original project lists, audits, or court records; and whether the U.S. government takes any concrete action involving budgets, diplomacy, or sanctions. The former would help assess the allegations, while the latter could affect the business environment and market risk expectations for related companies.
As for BTC, ETH, and DOGE, this post does not directly mention them. My view is that we should follow the news for now; this statement alone is not enough to infer a direction for crypto prices. Image 1 is a screenshot of the original post, and Image 2 is the Chinese translation.
💬 For stories like this, would you rather see a translation of the original post or an analysis of how assets are affected after policies are implemented?
The DOGE market data below is included only to check the market reaction; it does not mean the news has become a price catalyst.
Source: Elon Musk’s original X post https://x.com/elonmusk/status/2107029927589470636; the cited old post is dated August 19, 2025. The original post time follows what was displayed on the page, and the view count is a snapshot taken at the time of verification. The related allegations have not been independently verified in this fact-check.
For discussion purposes only; this is not investment advice.
$BTC $ETH $DOGE
461
·
--
NVDA Perpetual Contract: Choppy range, no clear trend yet; level to watch: NVDA 236.61 USDT
Over the next 1–4 hours, I’m leaning toward more back-and-forth within a range for the NVDA perpetual contract, with no clear one-way move yet. First, watch the NVDA 234.97 USDT–NVDA 236.61 USDT range. The price action feels a bit like “you move in, I move out,” so let’s not imagine a big move before it happens. 🫠
This analysis is based on Binance’s NVDAUSDT perpetual contract, quoted in USDT; the chart and volume data are both from this contract. The NVDA perpetual contract is currently around 235.64 USDT, up 0.38% over 24 hours and 0.41% below the high for this window. The price change hasn’t established a new directional advantage. Given the mixed signals on the chart, I’d rather interpret the next move as range-bound for now.
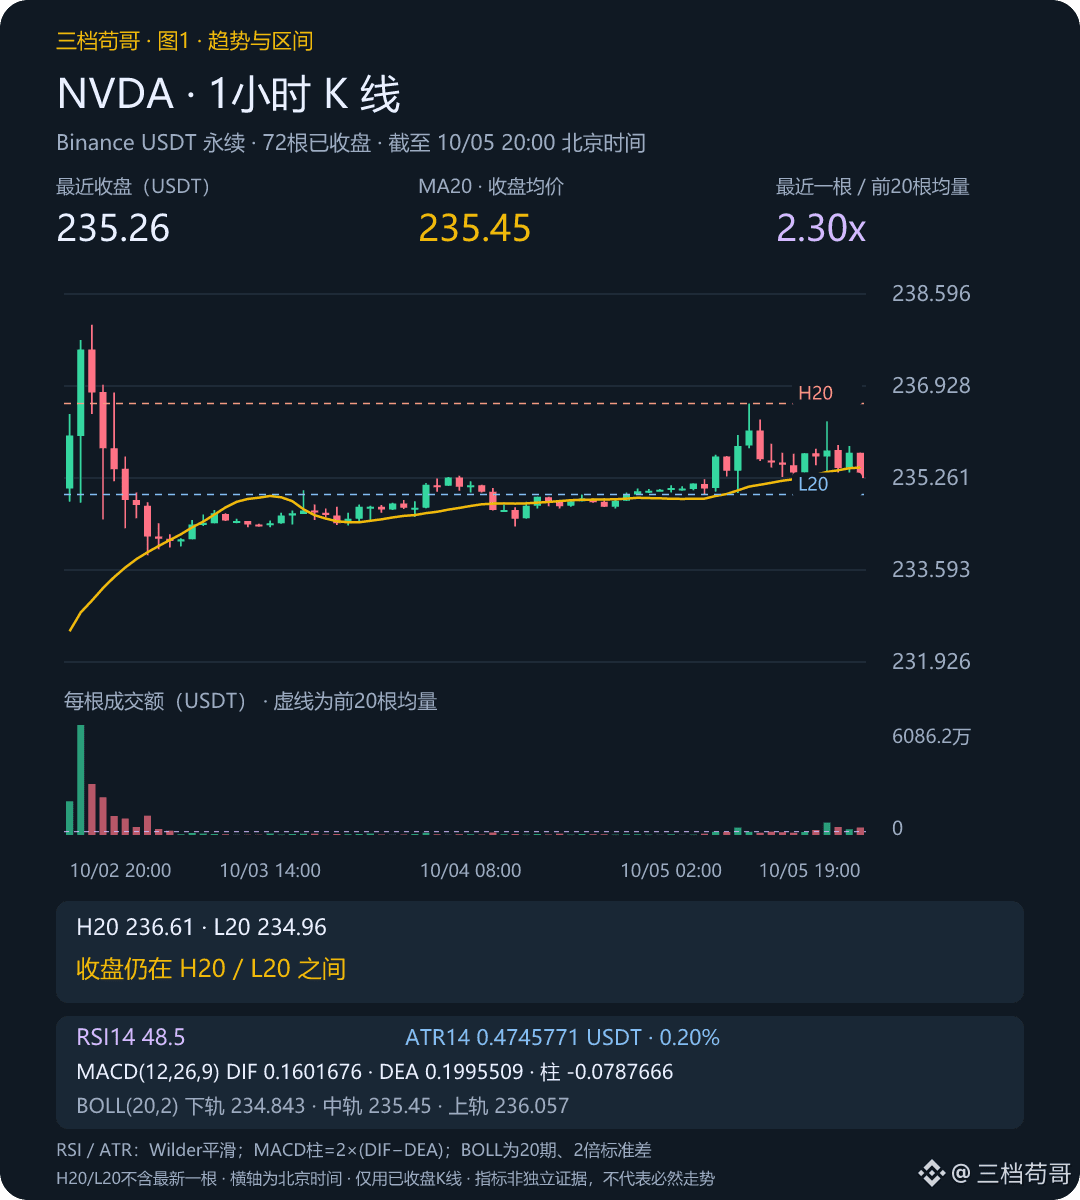
📊 Chart 1 | 1-hour, as of 20:00 Beijing time: The close remains within the range of the previous 20 candles. The MA20 has risen over the last 3 candles, with the close below it; volume is 2.30 times the average of the previous 20 candles, so this price move came with increased volume.
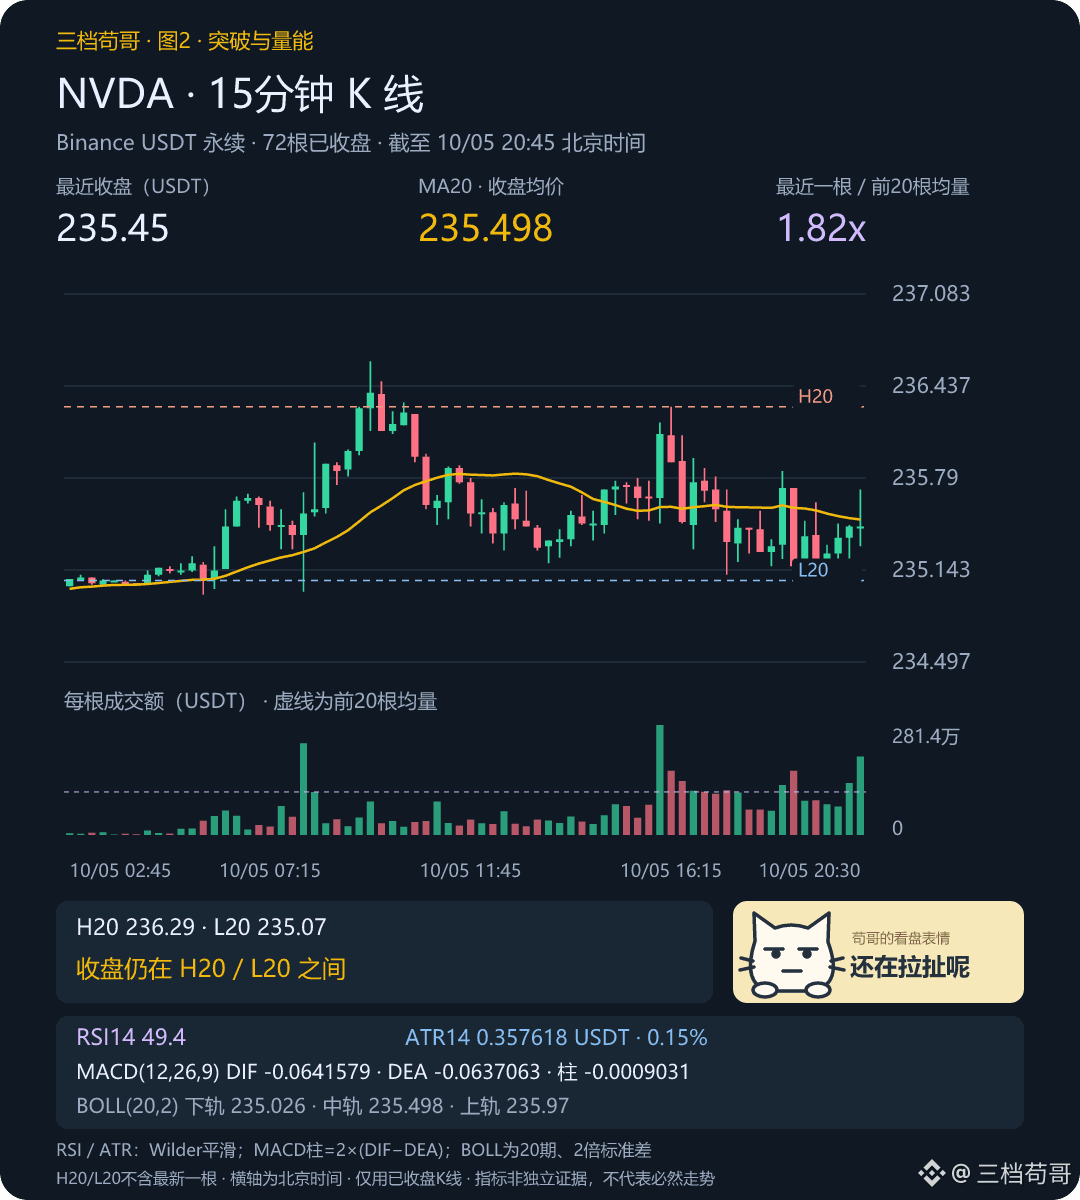
🔎 Chart 2 | NVDA 15-minute, as of 20:45 Beijing time: The close is below the MA20, volume is 1.82 times average, and the MA20 remains flat. The shorter timeframe isn’t clearly contradicting this picture, so let’s see whether this alignment holds through the next close.
🧭 RSI14 is 48.5, and the MACD negative histogram bars are expanding: momentum is bearish, and a rebound still needs price confirmation. ATR14 is 0.47458 USDT, about 0.20% of the closing price, and is used to gauge the potential volatility range.
→ The base case is continued back-and-forth within the range: if price tests NVDA 236.61 USDT but fails to hold above it at the close, it may return to the middle of the range; if it tests NVDA 234.97 USDT, watch whether the low holds.
⚠️ What would change my view: If a subsequent 1-hour candle closes above NVDA 236.61 USDT or below NVDA 234.97 USDT, with volume exceeding the average of the previous 20 candles, I’d switch to a view favoring the breakout direction. Without increased volume, beware of a false breakout and wait for the next candle to confirm. Reassess if we move beyond the time window.
💬 Do you think the price will keep ranging, or will the next close pick a direction? Feel free to share which chart signal leads you to that view.
To keep following along, check the NVDA market data below against the conditions above.
Source: Binance USDT Perpetual | Rolling 24 hours | 2026/10/5 20:55:55 Beijing time.
For discussion only; not investment advice.
$BTC $ETH $NVDA
NVDA Perpetual Contract: Choppy range, no clear trend yet; level to watch: NVDA 236.61 USDT
Over the next 1–4 hours, I’m leaning toward more back-and-forth within a range for the NVDA perpetual contract, with no clear one-way move yet. First, watch the NVDA 234.97 USDT–NVDA 236.61 USDT range. The price action feels a bit like “you move in, I move out,” so let’s not imagine a big move before it happens. 🫠
This analysis is based on Binance’s NVDAUSDT perpetual contract, quoted in USDT; the chart and volume data are both from this contract. The NVDA perpetual contract is currently around 235.64 USDT, up 0.38% over 24 hours and 0.41% below the high for this window. The price change hasn’t established a new directional advantage. Given the mixed signals on the chart, I’d rather interpret the next move as range-bound for now.
📊 Chart 1 | 1-hour, as of 20:00 Beijing time: The close remains within the range of the previous 20 candles. The MA20 has risen over the last 3 candles, with the close below it; volume is 2.30 times the average of the previous 20 candles, so this price move came with increased volume.
🔎 Chart 2 | NVDA 15-minute, as of 20:45 Beijing time: The close is below the MA20, volume is 1.82 times average, and the MA20 remains flat. The shorter timeframe isn’t clearly contradicting this picture, so let’s see whether this alignment holds through the next close.
🧭 RSI14 is 48.5, and the MACD negative histogram bars are expanding: momentum is bearish, and a rebound still needs price confirmation. ATR14 is 0.47458 USDT, about 0.20% of the closing price, and is used to gauge the potential volatility range.
→ The base case is continued back-and-forth within the range: if price tests NVDA 236.61 USDT but fails to hold above it at the close, it may return to the middle of the range; if it tests NVDA 234.97 USDT, watch whether the low holds.
⚠️ What would change my view: If a subsequent 1-hour candle closes above NVDA 236.61 USDT or below NVDA 234.97 USDT, with volume exceeding the average of the previous 20 candles, I’d switch to a view favoring the breakout direction. Without increased volume, beware of a false breakout and wait for the next candle to confirm. Reassess if we move beyond the time window.
💬 Do you think the price will keep ranging, or will the next close pick a direction? Feel free to share which chart signal leads you to that view.
To keep following along, check the NVDA market data below against the conditions above.
Source: Binance USDT Perpetual | Rolling 24 hours | 2026/10/5 20:55:55 Beijing time.
For discussion only; not investment advice.
$BTC $ETH $NVDA
Over the next 1–4 hours, I’m leaning toward more back-and-forth within a range for the NVDA perpetual contract, with no clear one-way move yet. First, watch the NVDA 234.97 USDT–NVDA 236.61 USDT range. The price action feels a bit like “you move in, I move out,” so let’s not imagine a big move before it happens. 🫠
This analysis is based on Binance’s NVDAUSDT perpetual contract, quoted in USDT; the chart and volume data are both from this contract. The NVDA perpetual contract is currently around 235.64 USDT, up 0.38% over 24 hours and 0.41% below the high for this window. The price change hasn’t established a new directional advantage. Given the mixed signals on the chart, I’d rather interpret the next move as range-bound for now.
📊 Chart 1 | 1-hour, as of 20:00 Beijing time: The close remains within the range of the previous 20 candles. The MA20 has risen over the last 3 candles, with the close below it; volume is 2.30 times the average of the previous 20 candles, so this price move came with increased volume.
🔎 Chart 2 | NVDA 15-minute, as of 20:45 Beijing time: The close is below the MA20, volume is 1.82 times average, and the MA20 remains flat. The shorter timeframe isn’t clearly contradicting this picture, so let’s see whether this alignment holds through the next close.
🧭 RSI14 is 48.5, and the MACD negative histogram bars are expanding: momentum is bearish, and a rebound still needs price confirmation. ATR14 is 0.47458 USDT, about 0.20% of the closing price, and is used to gauge the potential volatility range.
→ The base case is continued back-and-forth within the range: if price tests NVDA 236.61 USDT but fails to hold above it at the close, it may return to the middle of the range; if it tests NVDA 234.97 USDT, watch whether the low holds.
⚠️ What would change my view: If a subsequent 1-hour candle closes above NVDA 236.61 USDT or below NVDA 234.97 USDT, with volume exceeding the average of the previous 20 candles, I’d switch to a view favoring the breakout direction. Without increased volume, beware of a false breakout and wait for the next candle to confirm. Reassess if we move beyond the time window.
💬 Do you think the price will keep ranging, or will the next close pick a direction? Feel free to share which chart signal leads you to that view.
To keep following along, check the NVDA market data below against the conditions above.
Source: Binance USDT Perpetual | Rolling 24 hours | 2026/10/5 20:55:55 Beijing time.
For discussion only; not investment advice.
$BTC $ETH $NVDA
93
·
--
SOL: Choppy range-bound trading, with no clear trend breakout yet; key level: SOL 122.27 USDT
Over the next 1–4 hours, I’m leaning toward more range-bound movement in SOL, with no clear trend breakout for now. First, watch the SOL 119.91 USDT–SOL 122.27 USDT range. The price action feels a bit like “you move forward, I step back,” so let’s not imagine a big move before it happens. 🫠
Over the same rolling 24-hour period, SOL is down 0.40%, underperforming BTC by 1.29 percentage points. That relative weakness means I’m in no hurry to expect a catch-up rally; for me to change this view, the price structure needs to recover first—we can’t just wait for other coins to finish rising.
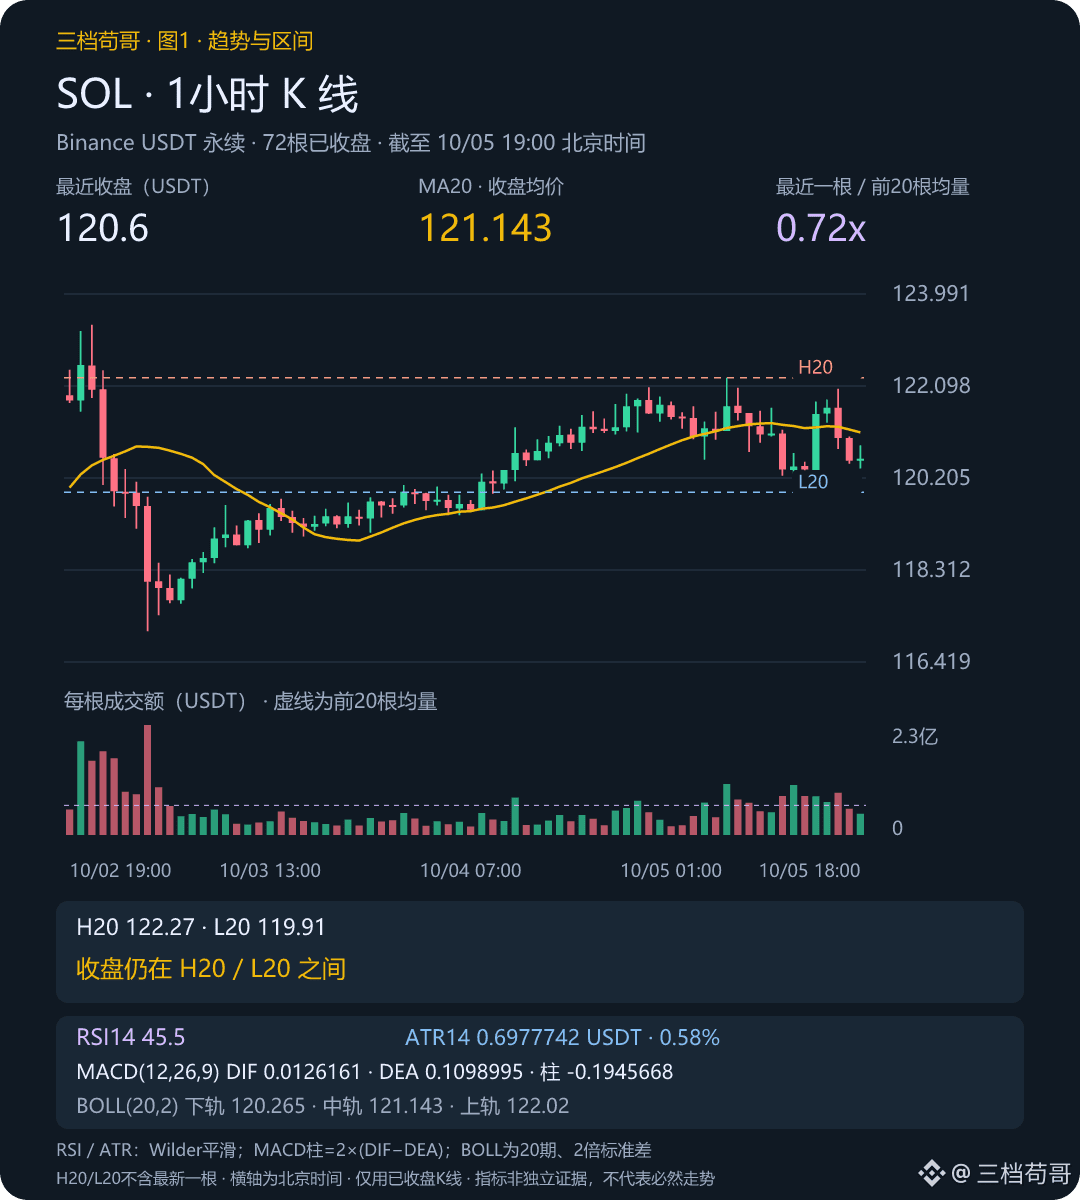
📊 Chart 1 | 1-hour, as of 19:00 Beijing time: The close remains within the range of the previous 20 candles. The MA20 has moved lower over the last 3 candles, and the close is below it; volume is 0.72 times the average of the previous 20 candles, which is weak, so don’t expect momentum to carry too quickly.
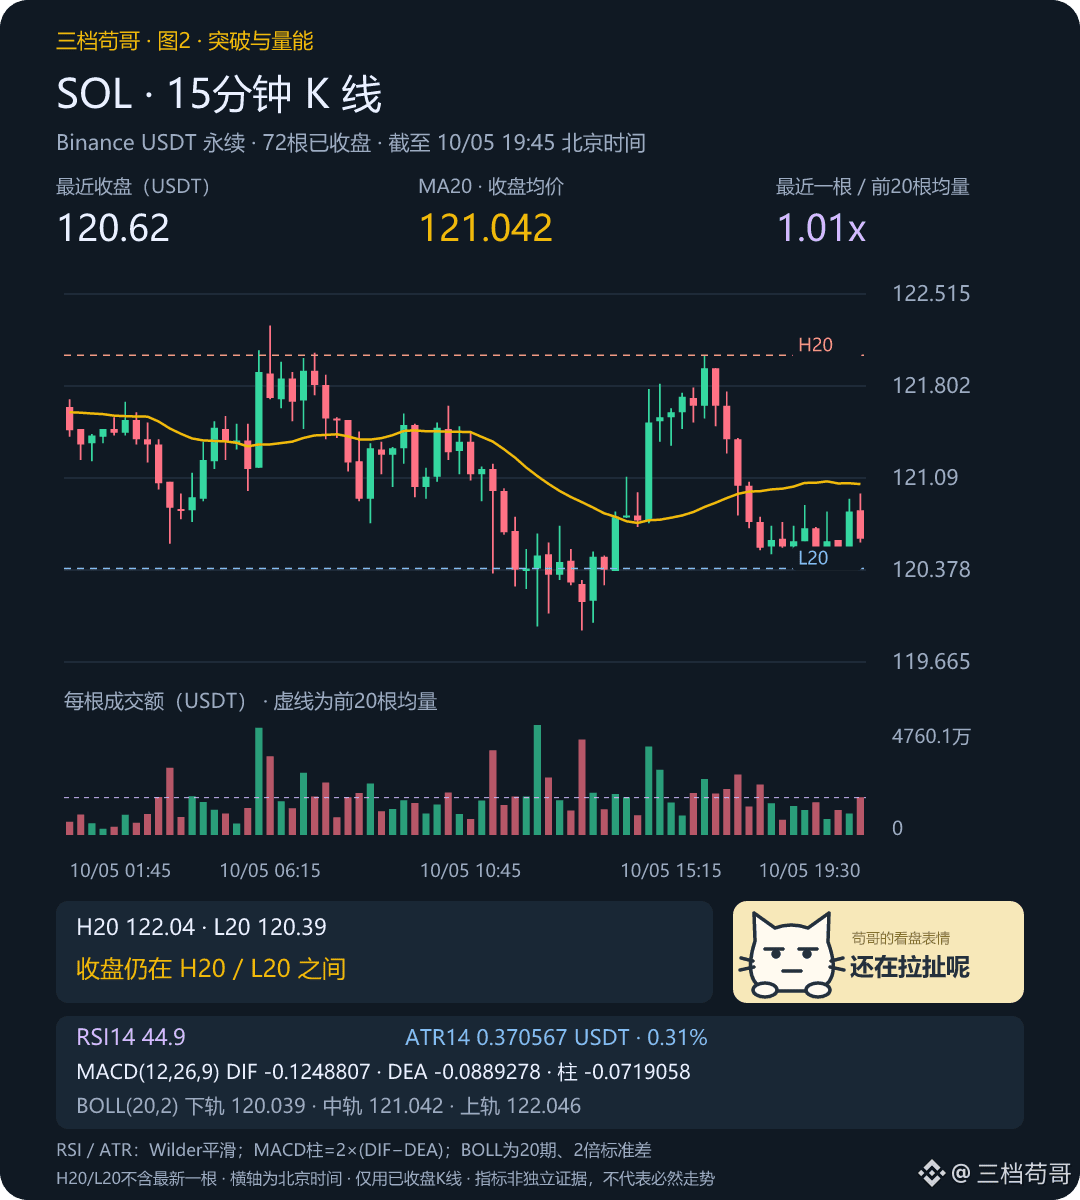
🔎 Chart 2 | SOL 15-minute, as of 19:45 Beijing time: The close is below the MA20, volume is 1.01 times average, and the MA20 is still flat. The shorter timeframe isn’t showing a clear contradiction, so let’s see whether this alignment holds through the next close.
🧭 RSI14 is 45.5, and the MACD negative bars are widening: momentum leans bearish, but a rebound still needs price confirmation. ATR14 is 0.69777 USDT, about 0.58% of the closing price, and is used to gauge the potential volatility range.
→ The main scenario is continued movement within the range: If SOL tests 122.27 USDT but fails to hold above it, I’d expect it to lean back toward the middle of the range; if it tests SOL 119.91 USDT, watch whether the low holds.
⚠️ What would change my view: If a subsequent 1-hour close moves above SOL 122.27 USDT or below SOL 119.91 USDT, with volume exceeding the average of the previous 20 candles, I’d switch to a view favoring the breakout direction. Without a volume increase, beware of a false breakout and wait for the next candle to confirm; reassess once the time window has passed.
💬 Do you agree with continued range-bound back-and-forth, or do you think the next close will pick a direction? Feel free to share which evidence on the chart leads you to that view.
There’s a SOL market link below for comparing against the range on the chart.
Source: Binance USDT perpetuals | Rolling 24 hours | 2026/10/5 19:53:53 Beijing time.
For discussion only; not investment advice.
$BTC $ETH $SOL
SOL: Choppy range-bound trading, with no clear trend breakout yet; key level: SOL 122.27 USDT
Over the next 1–4 hours, I’m leaning toward more range-bound movement in SOL, with no clear trend breakout for now. First, watch the SOL 119.91 USDT–SOL 122.27 USDT range. The price action feels a bit like “you move forward, I step back,” so let’s not imagine a big move before it happens. 🫠
Over the same rolling 24-hour period, SOL is down 0.40%, underperforming BTC by 1.29 percentage points. That relative weakness means I’m in no hurry to expect a catch-up rally; for me to change this view, the price structure needs to recover first—we can’t just wait for other coins to finish rising.
📊 Chart 1 | 1-hour, as of 19:00 Beijing time: The close remains within the range of the previous 20 candles. The MA20 has moved lower over the last 3 candles, and the close is below it; volume is 0.72 times the average of the previous 20 candles, which is weak, so don’t expect momentum to carry too quickly.
🔎 Chart 2 | SOL 15-minute, as of 19:45 Beijing time: The close is below the MA20, volume is 1.01 times average, and the MA20 is still flat. The shorter timeframe isn’t showing a clear contradiction, so let’s see whether this alignment holds through the next close.
🧭 RSI14 is 45.5, and the MACD negative bars are widening: momentum leans bearish, but a rebound still needs price confirmation. ATR14 is 0.69777 USDT, about 0.58% of the closing price, and is used to gauge the potential volatility range.
→ The main scenario is continued movement within the range: If SOL tests 122.27 USDT but fails to hold above it, I’d expect it to lean back toward the middle of the range; if it tests SOL 119.91 USDT, watch whether the low holds.
⚠️ What would change my view: If a subsequent 1-hour close moves above SOL 122.27 USDT or below SOL 119.91 USDT, with volume exceeding the average of the previous 20 candles, I’d switch to a view favoring the breakout direction. Without a volume increase, beware of a false breakout and wait for the next candle to confirm; reassess once the time window has passed.
💬 Do you agree with continued range-bound back-and-forth, or do you think the next close will pick a direction? Feel free to share which evidence on the chart leads you to that view.
There’s a SOL market link below for comparing against the range on the chart.
Source: Binance USDT perpetuals | Rolling 24 hours | 2026/10/5 19:53:53 Beijing time.
For discussion only; not investment advice.
$BTC $ETH $SOL
Over the next 1–4 hours, I’m leaning toward more range-bound movement in SOL, with no clear trend breakout for now. First, watch the SOL 119.91 USDT–SOL 122.27 USDT range. The price action feels a bit like “you move forward, I step back,” so let’s not imagine a big move before it happens. 🫠
Over the same rolling 24-hour period, SOL is down 0.40%, underperforming BTC by 1.29 percentage points. That relative weakness means I’m in no hurry to expect a catch-up rally; for me to change this view, the price structure needs to recover first—we can’t just wait for other coins to finish rising.
📊 Chart 1 | 1-hour, as of 19:00 Beijing time: The close remains within the range of the previous 20 candles. The MA20 has moved lower over the last 3 candles, and the close is below it; volume is 0.72 times the average of the previous 20 candles, which is weak, so don’t expect momentum to carry too quickly.
🔎 Chart 2 | SOL 15-minute, as of 19:45 Beijing time: The close is below the MA20, volume is 1.01 times average, and the MA20 is still flat. The shorter timeframe isn’t showing a clear contradiction, so let’s see whether this alignment holds through the next close.
🧭 RSI14 is 45.5, and the MACD negative bars are widening: momentum leans bearish, but a rebound still needs price confirmation. ATR14 is 0.69777 USDT, about 0.58% of the closing price, and is used to gauge the potential volatility range.
→ The main scenario is continued movement within the range: If SOL tests 122.27 USDT but fails to hold above it, I’d expect it to lean back toward the middle of the range; if it tests SOL 119.91 USDT, watch whether the low holds.
⚠️ What would change my view: If a subsequent 1-hour close moves above SOL 122.27 USDT or below SOL 119.91 USDT, with volume exceeding the average of the previous 20 candles, I’d switch to a view favoring the breakout direction. Without a volume increase, beware of a false breakout and wait for the next candle to confirm; reassess once the time window has passed.
💬 Do you agree with continued range-bound back-and-forth, or do you think the next close will pick a direction? Feel free to share which evidence on the chart leads you to that view.
There’s a SOL market link below for comparing against the range on the chart.
Source: Binance USDT perpetuals | Rolling 24 hours | 2026/10/5 19:53:53 Beijing time.
For discussion only; not investment advice.
$BTC $ETH $SOL
82
·
--
MSTR contract: consolidate first, then test the upper edge; watch level: MSTR 166.48 USDT
Over the next 1–4 hours, I’m leaning toward the MSTR contract consolidating first, then testing the upper edge. The first level to watch is MSTR 166.48 USDT. The lower timeframe hasn’t lined up yet, so we may see a few more back-and-forth tests first. It looks promising, but let’s keep the champagne on ice. 😏
This is the Binance MSTRUSDT perpetual contract, quoted in USDT; both the chart and volume data are from this contract. Over the same rolling 24 hours, the MSTR contract is down 0.06%, underperforming BTC by 0.86 percentage points. That relative underperformance makes me reluctant to expect a catch-up rally just yet. For me to change that view, the price structure needs to improve first—we can’t just wait for other coins to finish rising.
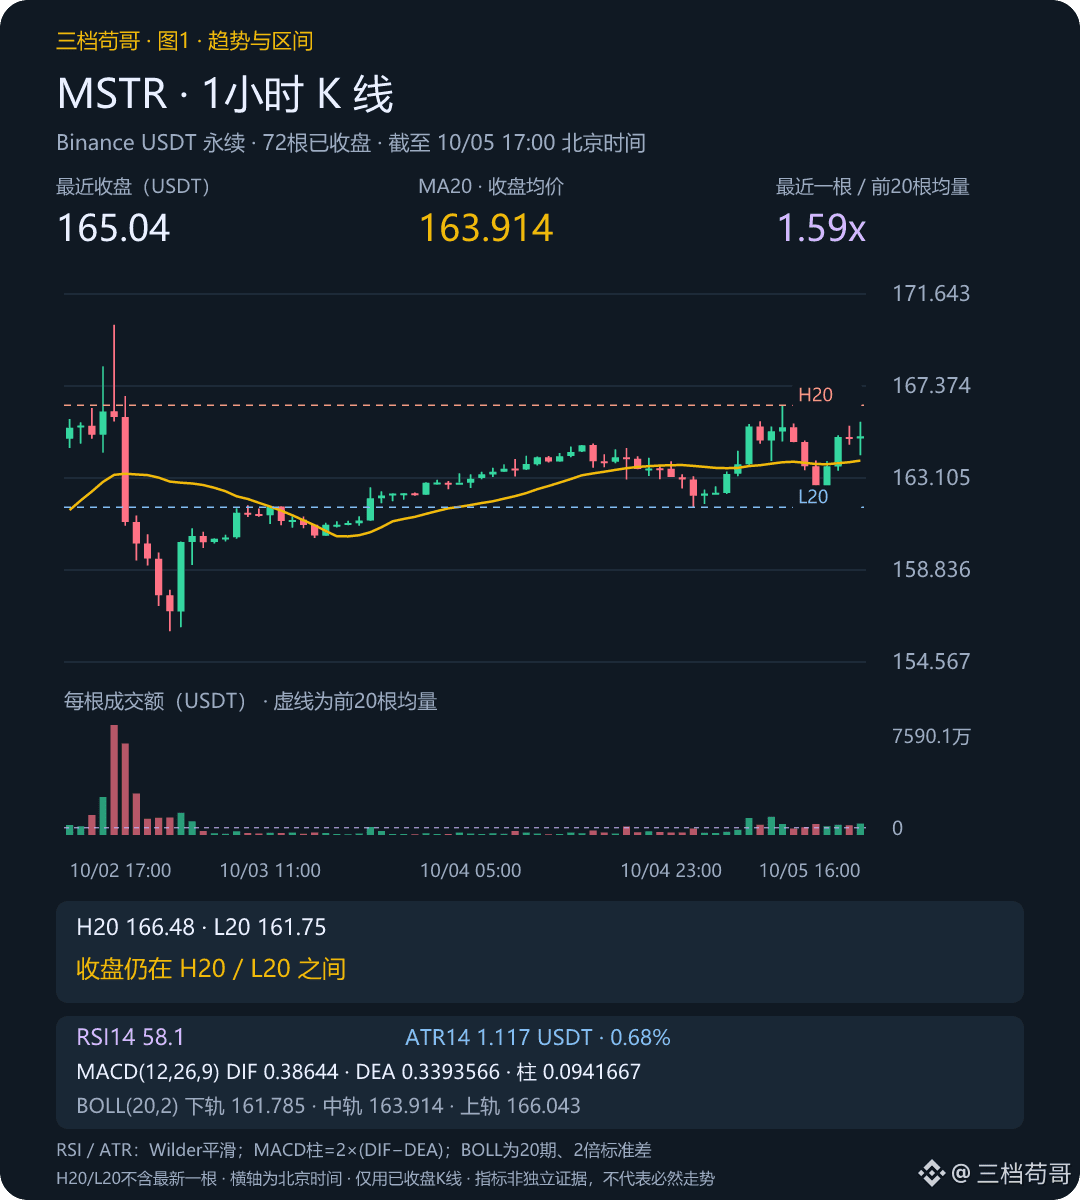
📊 Chart 1 | 1-hour, as of 17:00 Beijing time: The close is still within the range of the previous 20 candles. MA20 has risen over the last 3 candles, and the close is above it. Volume is 1.59 times the average of the previous 20 candles, so this move has been accompanied by increased volume.
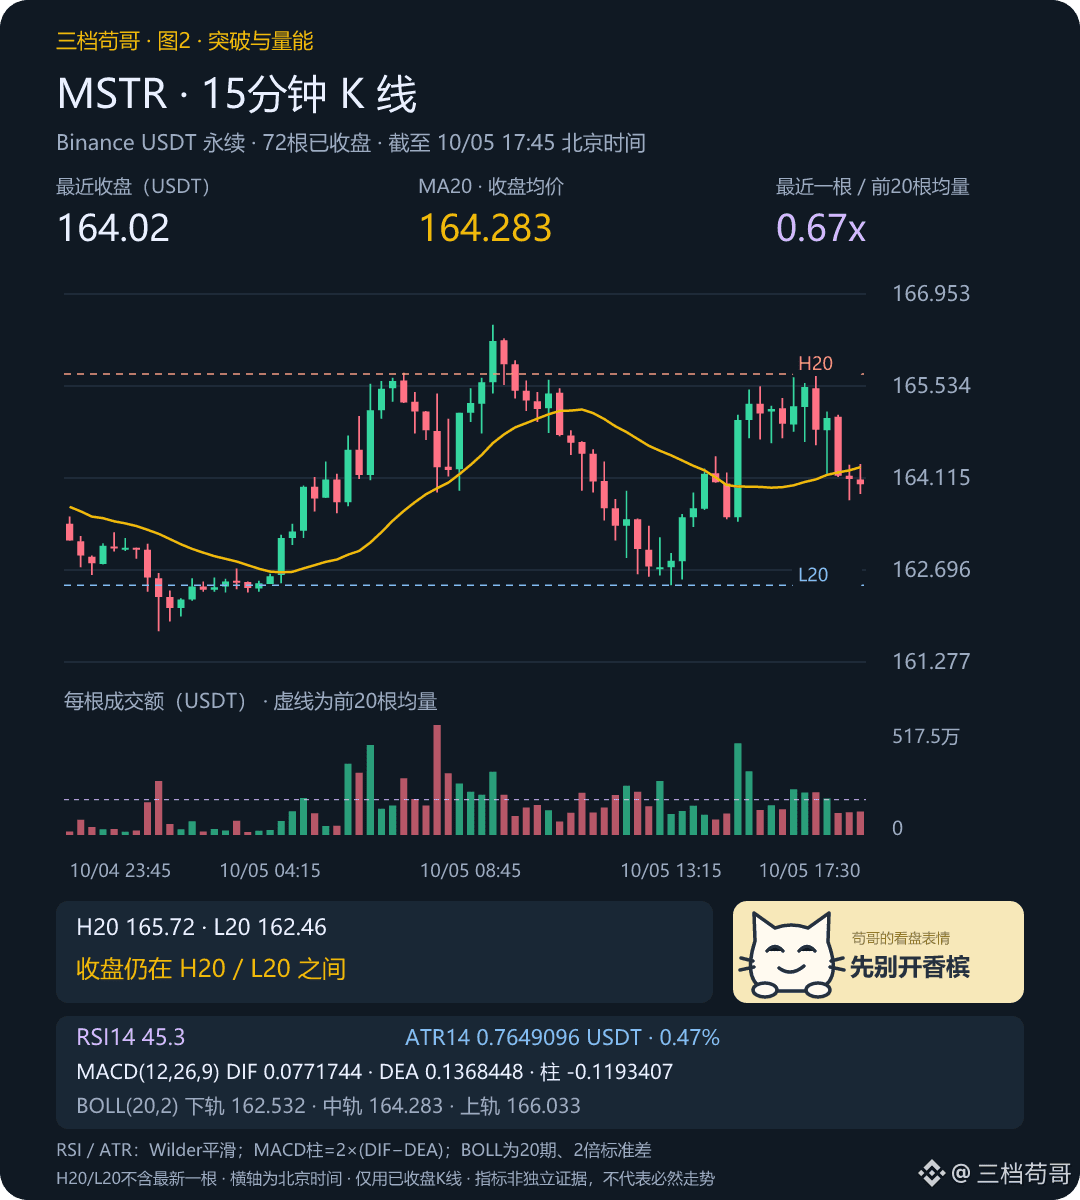
🔎 Chart 2 | MSTR 15-minute, as of 17:45 Beijing time: The close is below MA20, volume is 0.67 times average, and MA20 remains below MA50. The lower timeframe hasn’t confirmed the main view yet, so a choppy move is more likely than a straight run to the level to watch.
🧭 RSI14 is 58.1, and the MACD positive bars are expanding: momentum leans bullish, but should be checked alongside the price structure. ATR14 is 1.12 USDT, or about 0.68% of the closing price, and is used to gauge the potential price range.
→ Main scenario: If a pullback holds above MSTR 163.91 USDT, the bias is toward testing MSTR 166.48 USDT. The level to watch is the high of the latest 20 completed candles, including the most recent one. We can assess the strength of a breakout if price gets close.
⚠️ If the next 1-hour close falls back below MSTR 163.91 USDT, the original view is invalidated. This is the MA20 moving-average level to watch; in that case, I’d look toward MSTR 161.75 USDT instead. A wick touching the level doesn’t count. Reassess if we move beyond the time window.
💬 Do you agree that price will test higher first, or do you think the rebound is likely to fade? Share which piece of evidence on the chart leads you to that view.
If you want to keep following along, you can check the MSTR market data below against the conditions above.
Source: Binance USDT Perpetual | Rolling 24 hours | 2026/10/5 17:49:49 Beijing time.
For discussion only; not investment advice.
$BTC $ETH $MSTR
MSTR contract: consolidate first, then test the upper edge; watch level: MSTR 166.48 USDT
Over the next 1–4 hours, I’m leaning toward the MSTR contract consolidating first, then testing the upper edge. The first level to watch is MSTR 166.48 USDT. The lower timeframe hasn’t lined up yet, so we may see a few more back-and-forth tests first. It looks promising, but let’s keep the champagne on ice. 😏
This is the Binance MSTRUSDT perpetual contract, quoted in USDT; both the chart and volume data are from this contract. Over the same rolling 24 hours, the MSTR contract is down 0.06%, underperforming BTC by 0.86 percentage points. That relative underperformance makes me reluctant to expect a catch-up rally just yet. For me to change that view, the price structure needs to improve first—we can’t just wait for other coins to finish rising.
📊 Chart 1 | 1-hour, as of 17:00 Beijing time: The close is still within the range of the previous 20 candles. MA20 has risen over the last 3 candles, and the close is above it. Volume is 1.59 times the average of the previous 20 candles, so this move has been accompanied by increased volume.
🔎 Chart 2 | MSTR 15-minute, as of 17:45 Beijing time: The close is below MA20, volume is 0.67 times average, and MA20 remains below MA50. The lower timeframe hasn’t confirmed the main view yet, so a choppy move is more likely than a straight run to the level to watch.
🧭 RSI14 is 58.1, and the MACD positive bars are expanding: momentum leans bullish, but should be checked alongside the price structure. ATR14 is 1.12 USDT, or about 0.68% of the closing price, and is used to gauge the potential price range.
→ Main scenario: If a pullback holds above MSTR 163.91 USDT, the bias is toward testing MSTR 166.48 USDT. The level to watch is the high of the latest 20 completed candles, including the most recent one. We can assess the strength of a breakout if price gets close.
⚠️ If the next 1-hour close falls back below MSTR 163.91 USDT, the original view is invalidated. This is the MA20 moving-average level to watch; in that case, I’d look toward MSTR 161.75 USDT instead. A wick touching the level doesn’t count. Reassess if we move beyond the time window.
💬 Do you agree that price will test higher first, or do you think the rebound is likely to fade? Share which piece of evidence on the chart leads you to that view.
If you want to keep following along, you can check the MSTR market data below against the conditions above.
Source: Binance USDT Perpetual | Rolling 24 hours | 2026/10/5 17:49:49 Beijing time.
For discussion only; not investment advice.
$BTC $ETH $MSTR
Over the next 1–4 hours, I’m leaning toward the MSTR contract consolidating first, then testing the upper edge. The first level to watch is MSTR 166.48 USDT. The lower timeframe hasn’t lined up yet, so we may see a few more back-and-forth tests first. It looks promising, but let’s keep the champagne on ice. 😏
This is the Binance MSTRUSDT perpetual contract, quoted in USDT; both the chart and volume data are from this contract. Over the same rolling 24 hours, the MSTR contract is down 0.06%, underperforming BTC by 0.86 percentage points. That relative underperformance makes me reluctant to expect a catch-up rally just yet. For me to change that view, the price structure needs to improve first—we can’t just wait for other coins to finish rising.
📊 Chart 1 | 1-hour, as of 17:00 Beijing time: The close is still within the range of the previous 20 candles. MA20 has risen over the last 3 candles, and the close is above it. Volume is 1.59 times the average of the previous 20 candles, so this move has been accompanied by increased volume.
🔎 Chart 2 | MSTR 15-minute, as of 17:45 Beijing time: The close is below MA20, volume is 0.67 times average, and MA20 remains below MA50. The lower timeframe hasn’t confirmed the main view yet, so a choppy move is more likely than a straight run to the level to watch.
🧭 RSI14 is 58.1, and the MACD positive bars are expanding: momentum leans bullish, but should be checked alongside the price structure. ATR14 is 1.12 USDT, or about 0.68% of the closing price, and is used to gauge the potential price range.
→ Main scenario: If a pullback holds above MSTR 163.91 USDT, the bias is toward testing MSTR 166.48 USDT. The level to watch is the high of the latest 20 completed candles, including the most recent one. We can assess the strength of a breakout if price gets close.
⚠️ If the next 1-hour close falls back below MSTR 163.91 USDT, the original view is invalidated. This is the MA20 moving-average level to watch; in that case, I’d look toward MSTR 161.75 USDT instead. A wick touching the level doesn’t count. Reassess if we move beyond the time window.
💬 Do you agree that price will test higher first, or do you think the rebound is likely to fade? Share which piece of evidence on the chart leads you to that view.
If you want to keep following along, you can check the MSTR market data below against the conditions above.
Source: Binance USDT Perpetual | Rolling 24 hours | 2026/10/5 17:49:49 Beijing time.
For discussion only; not investment advice.
$BTC $ETH $MSTR
97
·
--
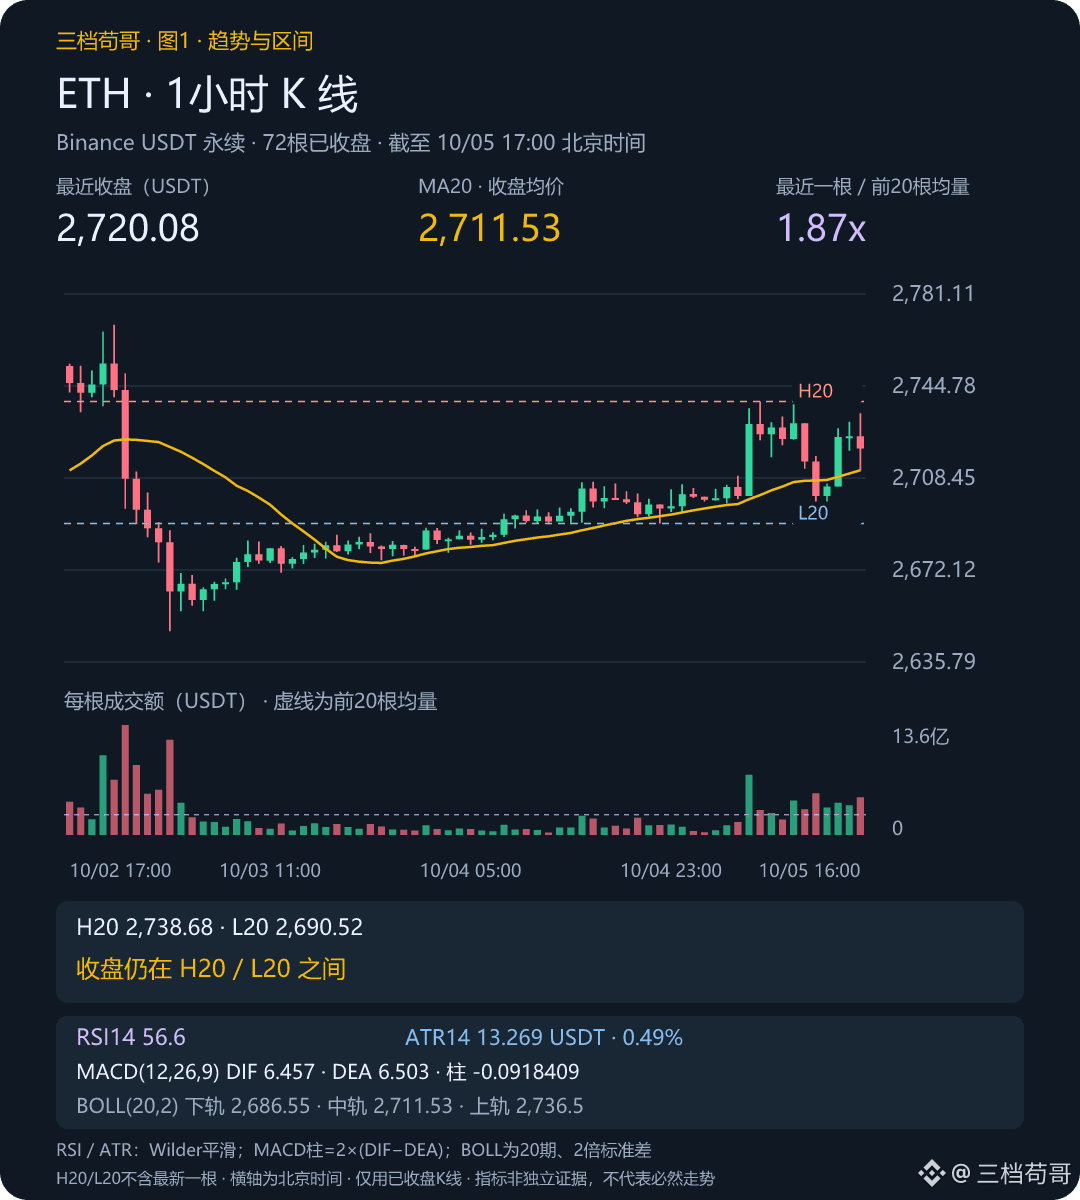
ETH: Consolidate first, then test the upper end; watch level: ETH 2,738.68 USDT
Over the next 1–4 hours, I’m leaning toward ETH consolidating first, then testing the upper end. The first level to watch is ETH 2,738.68 USDT. The lower time frame hasn’t lined up yet, so there may be a few more tests first. It looks promising, but let’s keep the champagne on ice for now. 😏
ETH is up 0.70% over 24 hours, ranking 235th by gain, yet it ranks 2nd in trading volume, with a 16.58% share. Trading activity is already evident; the key now is whether price can break out of the range. If it can’t hold the higher levels, all this activity may be more about position rotation.
📊 Chart 1 | 1-hour chart, as of 17:00 Beijing time: The close remains within the range of the previous 20 candles. The MA20 has risen over the last 3 candles, with the close above it; volume was 1.87 times the average of the previous 20 candles, so this move came with increased volume.
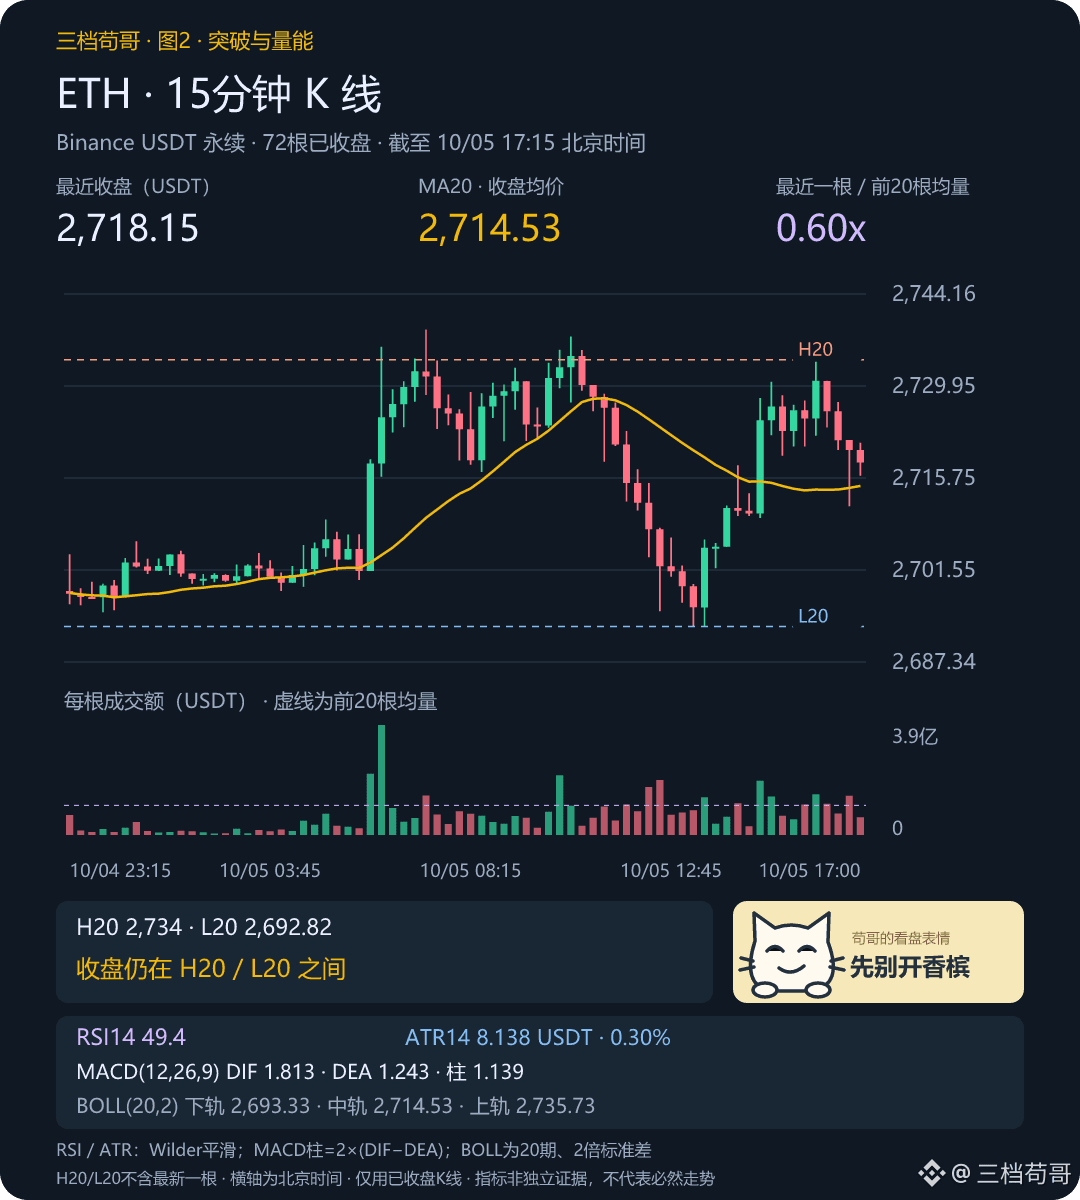
🔎 Chart 2 | ETH 15-minute chart, as of 17:15 Beijing time: The close is above the MA20, volume is 0.60 times average, and the MA20 remains flat. The lower time frame hasn’t aligned with the main view, so more back-and-forth is likely before a move to the level to watch.
🧭 RSI14 is 56.6, while the MACD negative histogram bars are expanding: momentum signals are mixed, so I wouldn’t treat any single signal as confirmation for now. ATR14 is 13.27 USDT, about 0.49% of the closing price, and can be used to gauge the potential volatility range.
→ Main scenario: If ETH holds above ETH 2,711.53 USDT on a retest, it may lean toward testing ETH 2,738.68 USDT. The level to watch is the high of the latest 20 completed candles, including the most recent one. We can assess the strength of any breakout when price gets close.
⚠️ If the 1-hour candle closes back below ETH 2,711.53 USDT, the original view is invalidated. This is the MA20 moving-average level to watch; in that case, the next level to watch is ETH 2,690.52 USDT. A wick touching the level doesn’t count; reassess if the time window passes.
💬 Do you agree more with an initial move higher, or do you think the rebound is likely to give back its gains? Let’s also discuss which evidence on the chart shapes your view.
There’s an ETH market link below to compare with the range on the chart.
Source: Binance USDT perpetuals | Rolling 24 hours | 2026/10/5 17:18:48 Beijing time.
For discussion only; not investment advice.
$BTC $ETH $CARV
ETH: Consolidate first, then test the upper end; watch level: ETH 2,738.68 USDT
Over the next 1–4 hours, I’m leaning toward ETH consolidating first, then testing the upper end. The first level to watch is ETH 2,738.68 USDT. The lower time frame hasn’t lined up yet, so there may be a few more tests first. It looks promising, but let’s keep the champagne on ice for now. 😏
ETH is up 0.70% over 24 hours, ranking 235th by gain, yet it ranks 2nd in trading volume, with a 16.58% share. Trading activity is already evident; the key now is whether price can break out of the range. If it can’t hold the higher levels, all this activity may be more about position rotation.
📊 Chart 1 | 1-hour chart, as of 17:00 Beijing time: The close remains within the range of the previous 20 candles. The MA20 has risen over the last 3 candles, with the close above it; volume was 1.87 times the average of the previous 20 candles, so this move came with increased volume.
🔎 Chart 2 | ETH 15-minute chart, as of 17:15 Beijing time: The close is above the MA20, volume is 0.60 times average, and the MA20 remains flat. The lower time frame hasn’t aligned with the main view, so more back-and-forth is likely before a move to the level to watch.
🧭 RSI14 is 56.6, while the MACD negative histogram bars are expanding: momentum signals are mixed, so I wouldn’t treat any single signal as confirmation for now. ATR14 is 13.27 USDT, about 0.49% of the closing price, and can be used to gauge the potential volatility range.
→ Main scenario: If ETH holds above ETH 2,711.53 USDT on a retest, it may lean toward testing ETH 2,738.68 USDT. The level to watch is the high of the latest 20 completed candles, including the most recent one. We can assess the strength of any breakout when price gets close.
⚠️ If the 1-hour candle closes back below ETH 2,711.53 USDT, the original view is invalidated. This is the MA20 moving-average level to watch; in that case, the next level to watch is ETH 2,690.52 USDT. A wick touching the level doesn’t count; reassess if the time window passes.
💬 Do you agree more with an initial move higher, or do you think the rebound is likely to give back its gains? Let’s also discuss which evidence on the chart shapes your view.
There’s an ETH market link below to compare with the range on the chart.
Source: Binance USDT perpetuals | Rolling 24 hours | 2026/10/5 17:18:48 Beijing time.
For discussion only; not investment advice.
$BTC $ETH $CARV
Over the next 1–4 hours, I’m leaning toward ETH consolidating first, then testing the upper end. The first level to watch is ETH 2,738.68 USDT. The lower time frame hasn’t lined up yet, so there may be a few more tests first. It looks promising, but let’s keep the champagne on ice for now. 😏
ETH is up 0.70% over 24 hours, ranking 235th by gain, yet it ranks 2nd in trading volume, with a 16.58% share. Trading activity is already evident; the key now is whether price can break out of the range. If it can’t hold the higher levels, all this activity may be more about position rotation.
📊 Chart 1 | 1-hour chart, as of 17:00 Beijing time: The close remains within the range of the previous 20 candles. The MA20 has risen over the last 3 candles, with the close above it; volume was 1.87 times the average of the previous 20 candles, so this move came with increased volume.
🔎 Chart 2 | ETH 15-minute chart, as of 17:15 Beijing time: The close is above the MA20, volume is 0.60 times average, and the MA20 remains flat. The lower time frame hasn’t aligned with the main view, so more back-and-forth is likely before a move to the level to watch.
🧭 RSI14 is 56.6, while the MACD negative histogram bars are expanding: momentum signals are mixed, so I wouldn’t treat any single signal as confirmation for now. ATR14 is 13.27 USDT, about 0.49% of the closing price, and can be used to gauge the potential volatility range.
→ Main scenario: If ETH holds above ETH 2,711.53 USDT on a retest, it may lean toward testing ETH 2,738.68 USDT. The level to watch is the high of the latest 20 completed candles, including the most recent one. We can assess the strength of any breakout when price gets close.
⚠️ If the 1-hour candle closes back below ETH 2,711.53 USDT, the original view is invalidated. This is the MA20 moving-average level to watch; in that case, the next level to watch is ETH 2,690.52 USDT. A wick touching the level doesn’t count; reassess if the time window passes.
💬 Do you agree more with an initial move higher, or do you think the rebound is likely to give back its gains? Let’s also discuss which evidence on the chart shapes your view.
There’s an ETH market link below to compare with the range on the chart.
Source: Binance USDT perpetuals | Rolling 24 hours | 2026/10/5 17:18:48 Beijing time.
For discussion only; not investment advice.
$BTC $ETH $CARV
49
·
--
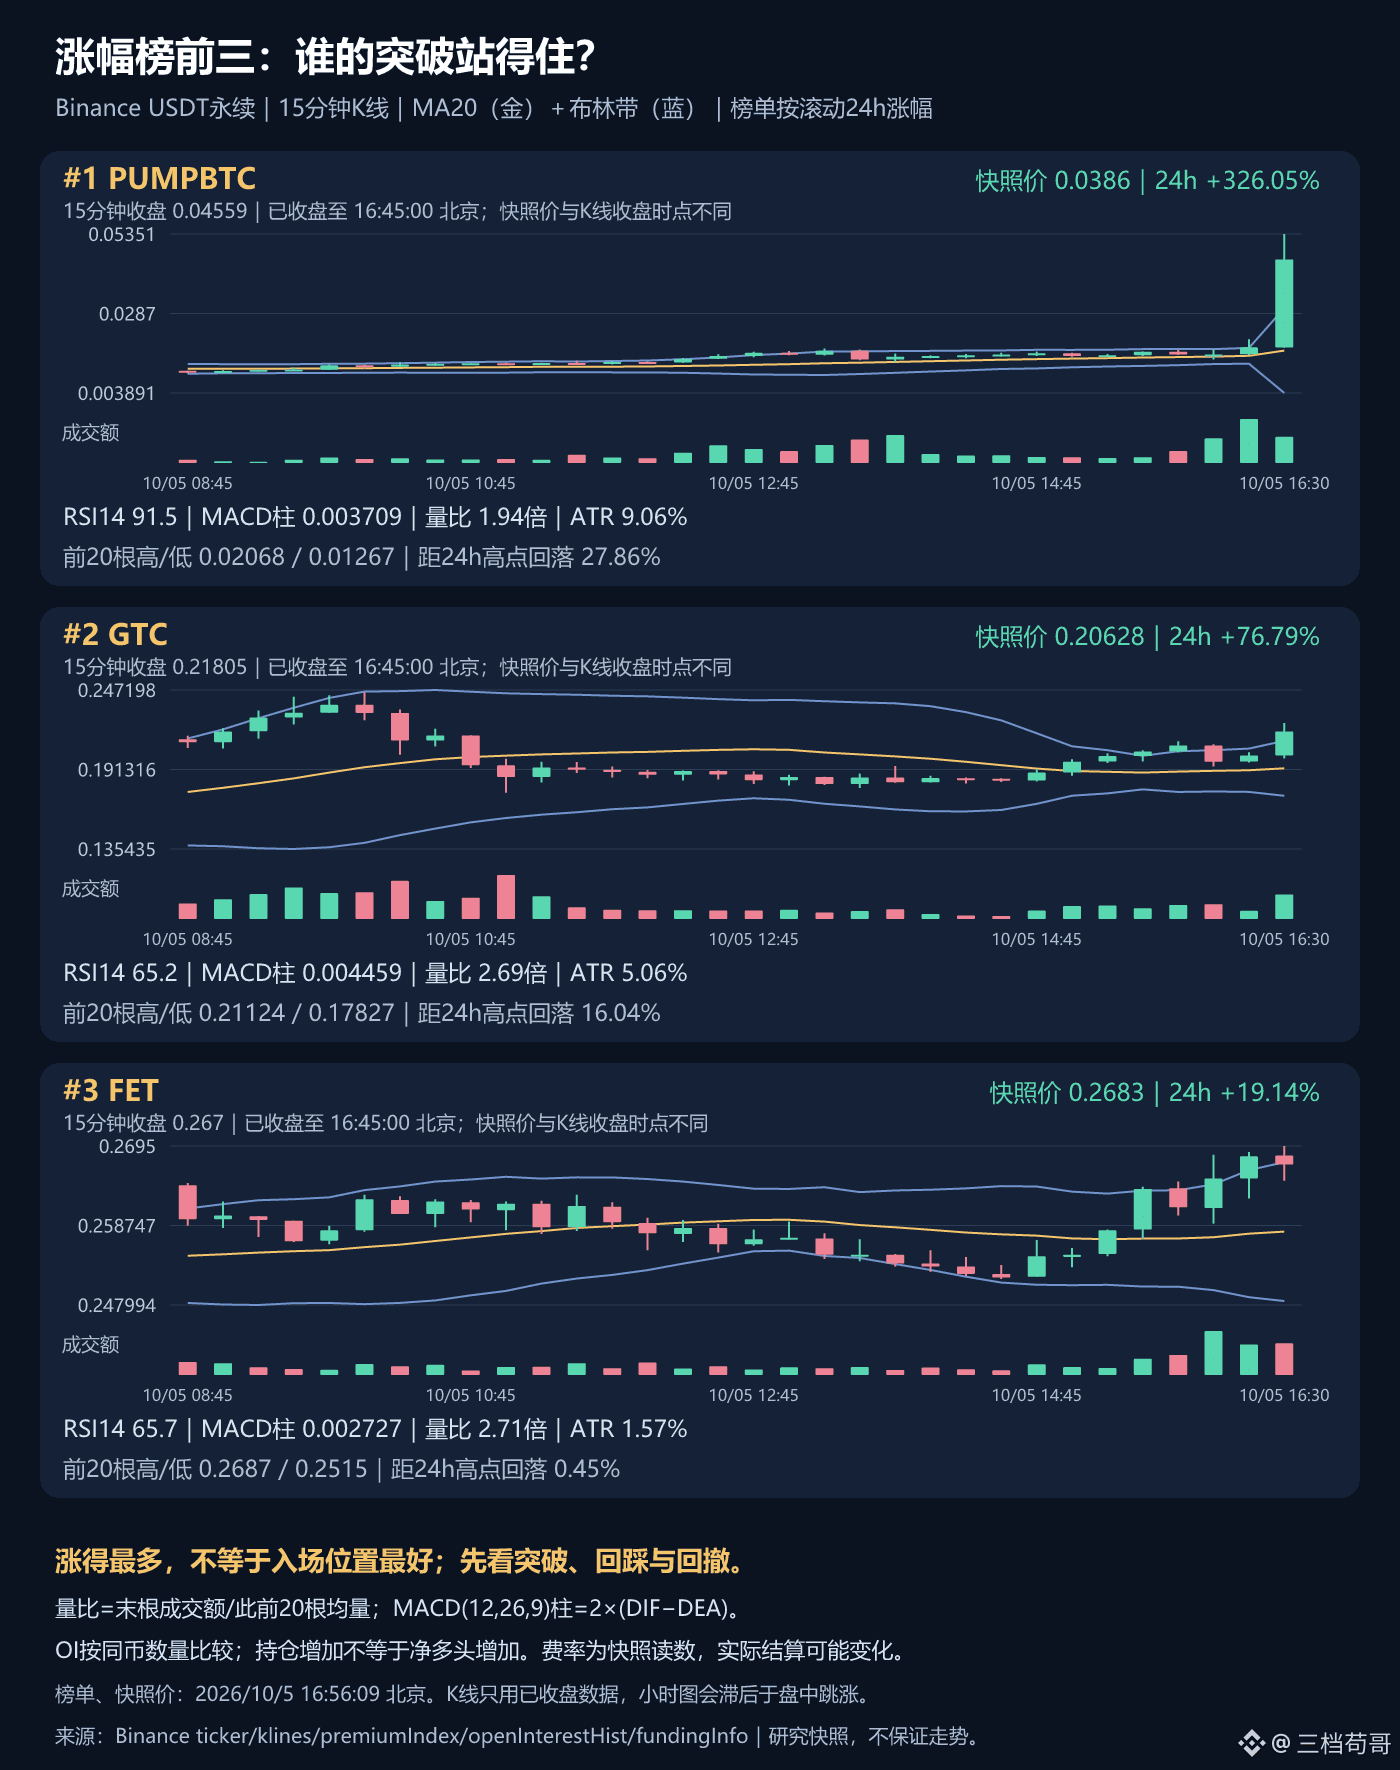
The top three gainers are all running hot: PUMPBTC, GTC, and FET—which one would I rather wait for?
👀 At 16:56 Beijing time on October 5, the top three 24-hour gainers among Binance USDT perpetuals were PUMPBTC, GTC, and FET. My order of interest: wait for a breakout in FET, wait for a recovery in GTC, and let PUMPBTC cool off first. The rankings tell you what has already risen; price and volume help you judge what might happen next.
🥇 PUMPBTC is up 326.0%, but has already pulled back 27.9% from its high; the 15-minute RSI is 91.5, showing a sharp short-term extension. I’d wait for it to reclaim and hold 0.04559, then watch the 0.05351 high. If it can’t get back above that level, I’d treat it as a spike-and-retrace for now—don’t mistake the gain for a safety cushion.
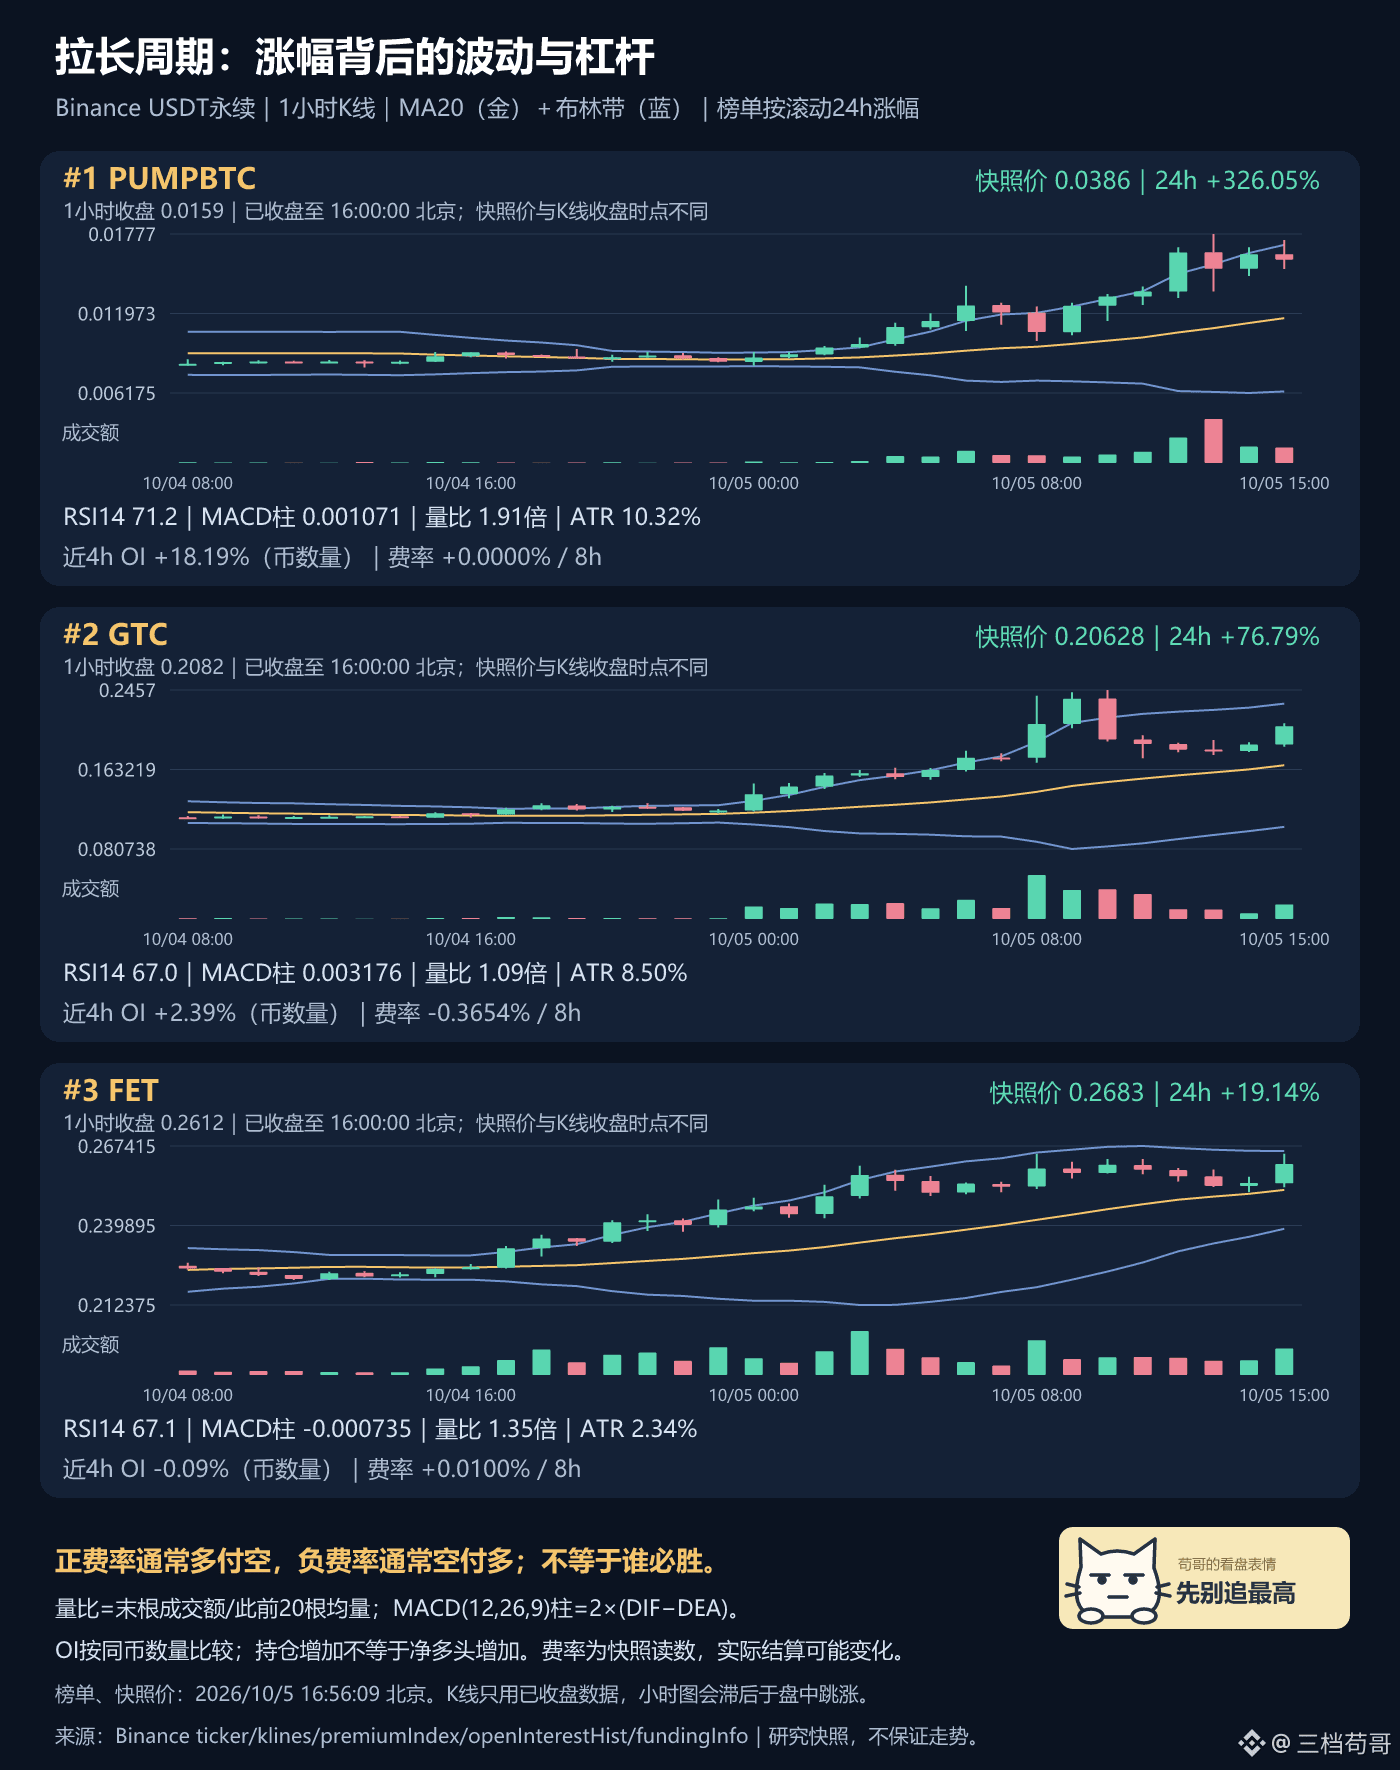
🥈 GTC is up 76.8%. The previous 15-minute candle had a volume ratio of 2.69x and closed above 0.21124, but the snapshot price has since fallen back below that level, so the breakout is not yet convincing. The current funding rate is -0.365%. Shorts paying longs helps explain the risk of a squeeze, but doesn’t guarantee one; first, watch whether price can reclaim this level and hold it on a retest.
🥉 FET is up 19.1%, just 0.45% below its 24-hour high, with a 15-minute volume ratio of 2.71x—relatively stronger follow-through. Still, I’d wait for a close above 0.2695 and a retest that holds. If it falls below the 15-minute MA20 at 0.25792 and fails to reclaim it on a rebound, I’d lower my expectations for further upside.
⚠️ Volatility differs significantly across the three, so position size should be calculated based on stop-loss distance; rising OI does not mean net long positions are entering. Figure 1 shows the short-term breakout; Figure 2 shows the hourly structure, open interest, and funding rate. Also, don’t mistake the hourly close for the current price.
💬 Would you choose the fastest riser, or the one with a smaller pullback and an easier confirmation to wait for? Share your entry conditions.
The three tags below correspond to the coins analyzed in this post and can be used to check live market data; rankings and prices are based on the snapshots cited in the text.
Sources: Binance ticker/klines/premiumIndex/openInterestHist/fundingInfo. Analysis is based on snapshots taken at the stated time; gains are rolling 24-hour returns, and prices are in USDT. Volume ratio is the latest closed candle’s traded value divided by the average of the previous 20 candles; H20 excludes the latest candle; RSI14 uses Wilder’s method. 4-hour OI is compared by coin quantity. The funding rate is the current reading from the API; actual settlement rates may change. Candlestick and current-price timestamps differ, and indicator thresholds have not been backtested as a strategy.
For discussion only; not investment advice.
$PUMPBTC $GTC $FET
The top three gainers are all running hot: PUMPBTC, GTC, and FET—which one would I rather wait for?
👀 At 16:56 Beijing time on October 5, the top three 24-hour gainers among Binance USDT perpetuals were PUMPBTC, GTC, and FET. My order of interest: wait for a breakout in FET, wait for a recovery in GTC, and let PUMPBTC cool off first. The rankings tell you what has already risen; price and volume help you judge what might happen next.
🥇 PUMPBTC is up 326.0%, but has already pulled back 27.9% from its high; the 15-minute RSI is 91.5, showing a sharp short-term extension. I’d wait for it to reclaim and hold 0.04559, then watch the 0.05351 high. If it can’t get back above that level, I’d treat it as a spike-and-retrace for now—don’t mistake the gain for a safety cushion.
🥈 GTC is up 76.8%. The previous 15-minute candle had a volume ratio of 2.69x and closed above 0.21124, but the snapshot price has since fallen back below that level, so the breakout is not yet convincing. The current funding rate is -0.365%. Shorts paying longs helps explain the risk of a squeeze, but doesn’t guarantee one; first, watch whether price can reclaim this level and hold it on a retest.
🥉 FET is up 19.1%, just 0.45% below its 24-hour high, with a 15-minute volume ratio of 2.71x—relatively stronger follow-through. Still, I’d wait for a close above 0.2695 and a retest that holds. If it falls below the 15-minute MA20 at 0.25792 and fails to reclaim it on a rebound, I’d lower my expectations for further upside.
⚠️ Volatility differs significantly across the three, so position size should be calculated based on stop-loss distance; rising OI does not mean net long positions are entering. Figure 1 shows the short-term breakout; Figure 2 shows the hourly structure, open interest, and funding rate. Also, don’t mistake the hourly close for the current price.
💬 Would you choose the fastest riser, or the one with a smaller pullback and an easier confirmation to wait for? Share your entry conditions.
The three tags below correspond to the coins analyzed in this post and can be used to check live market data; rankings and prices are based on the snapshots cited in the text.
Sources: Binance ticker/klines/premiumIndex/openInterestHist/fundingInfo. Analysis is based on snapshots taken at the stated time; gains are rolling 24-hour returns, and prices are in USDT. Volume ratio is the latest closed candle’s traded value divided by the average of the previous 20 candles; H20 excludes the latest candle; RSI14 uses Wilder’s method. 4-hour OI is compared by coin quantity. The funding rate is the current reading from the API; actual settlement rates may change. Candlestick and current-price timestamps differ, and indicator thresholds have not been backtested as a strategy.
For discussion only; not investment advice.
$PUMPBTC $GTC $FET
👀 At 16:56 Beijing time on October 5, the top three 24-hour gainers among Binance USDT perpetuals were PUMPBTC, GTC, and FET. My order of interest: wait for a breakout in FET, wait for a recovery in GTC, and let PUMPBTC cool off first. The rankings tell you what has already risen; price and volume help you judge what might happen next.
🥇 PUMPBTC is up 326.0%, but has already pulled back 27.9% from its high; the 15-minute RSI is 91.5, showing a sharp short-term extension. I’d wait for it to reclaim and hold 0.04559, then watch the 0.05351 high. If it can’t get back above that level, I’d treat it as a spike-and-retrace for now—don’t mistake the gain for a safety cushion.
🥈 GTC is up 76.8%. The previous 15-minute candle had a volume ratio of 2.69x and closed above 0.21124, but the snapshot price has since fallen back below that level, so the breakout is not yet convincing. The current funding rate is -0.365%. Shorts paying longs helps explain the risk of a squeeze, but doesn’t guarantee one; first, watch whether price can reclaim this level and hold it on a retest.
🥉 FET is up 19.1%, just 0.45% below its 24-hour high, with a 15-minute volume ratio of 2.71x—relatively stronger follow-through. Still, I’d wait for a close above 0.2695 and a retest that holds. If it falls below the 15-minute MA20 at 0.25792 and fails to reclaim it on a rebound, I’d lower my expectations for further upside.
⚠️ Volatility differs significantly across the three, so position size should be calculated based on stop-loss distance; rising OI does not mean net long positions are entering. Figure 1 shows the short-term breakout; Figure 2 shows the hourly structure, open interest, and funding rate. Also, don’t mistake the hourly close for the current price.
💬 Would you choose the fastest riser, or the one with a smaller pullback and an easier confirmation to wait for? Share your entry conditions.
The three tags below correspond to the coins analyzed in this post and can be used to check live market data; rankings and prices are based on the snapshots cited in the text.
Sources: Binance ticker/klines/premiumIndex/openInterestHist/fundingInfo. Analysis is based on snapshots taken at the stated time; gains are rolling 24-hour returns, and prices are in USDT. Volume ratio is the latest closed candle’s traded value divided by the average of the previous 20 candles; H20 excludes the latest candle; RSI14 uses Wilder’s method. 4-hour OI is compared by coin quantity. The funding rate is the current reading from the API; actual settlement rates may change. Candlestick and current-price timestamps differ, and indicator thresholds have not been backtested as a strategy.
For discussion only; not investment advice.
$PUMPBTC $GTC $FET
1
1.1k
·
--
Don’t rush to find the next coin about to skyrocket: Before a single trade, complete these four steps
😅 The trade most likely to get out of control often starts with “I’ll just buy a little first.” My order is: first identify where my thesis would be invalidated, then calculate position size, and only then consider buying. Even if you get the direction right, you still need to be able to withstand the volatility along the way.
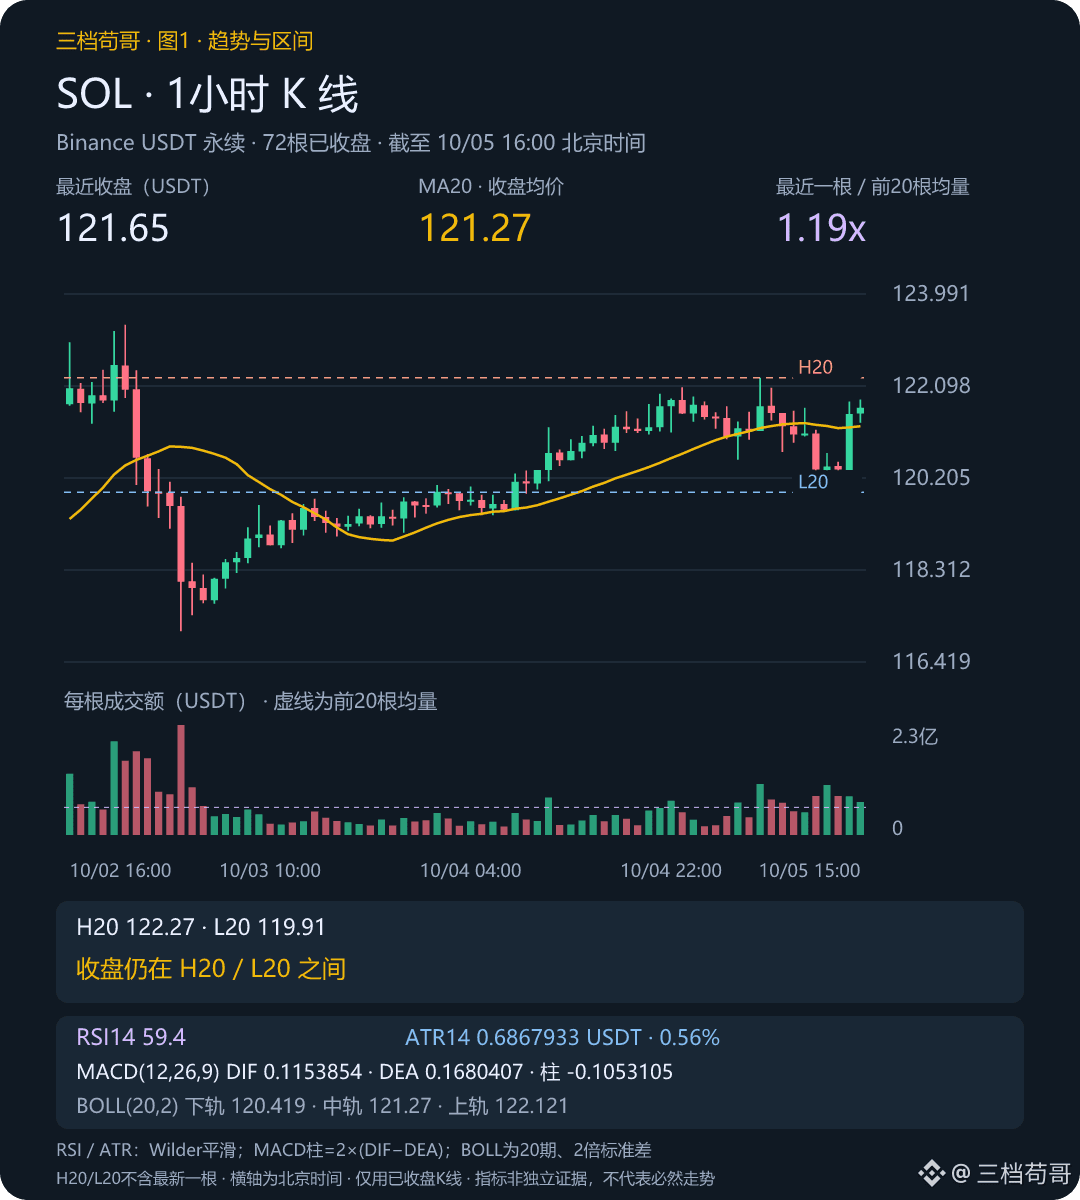
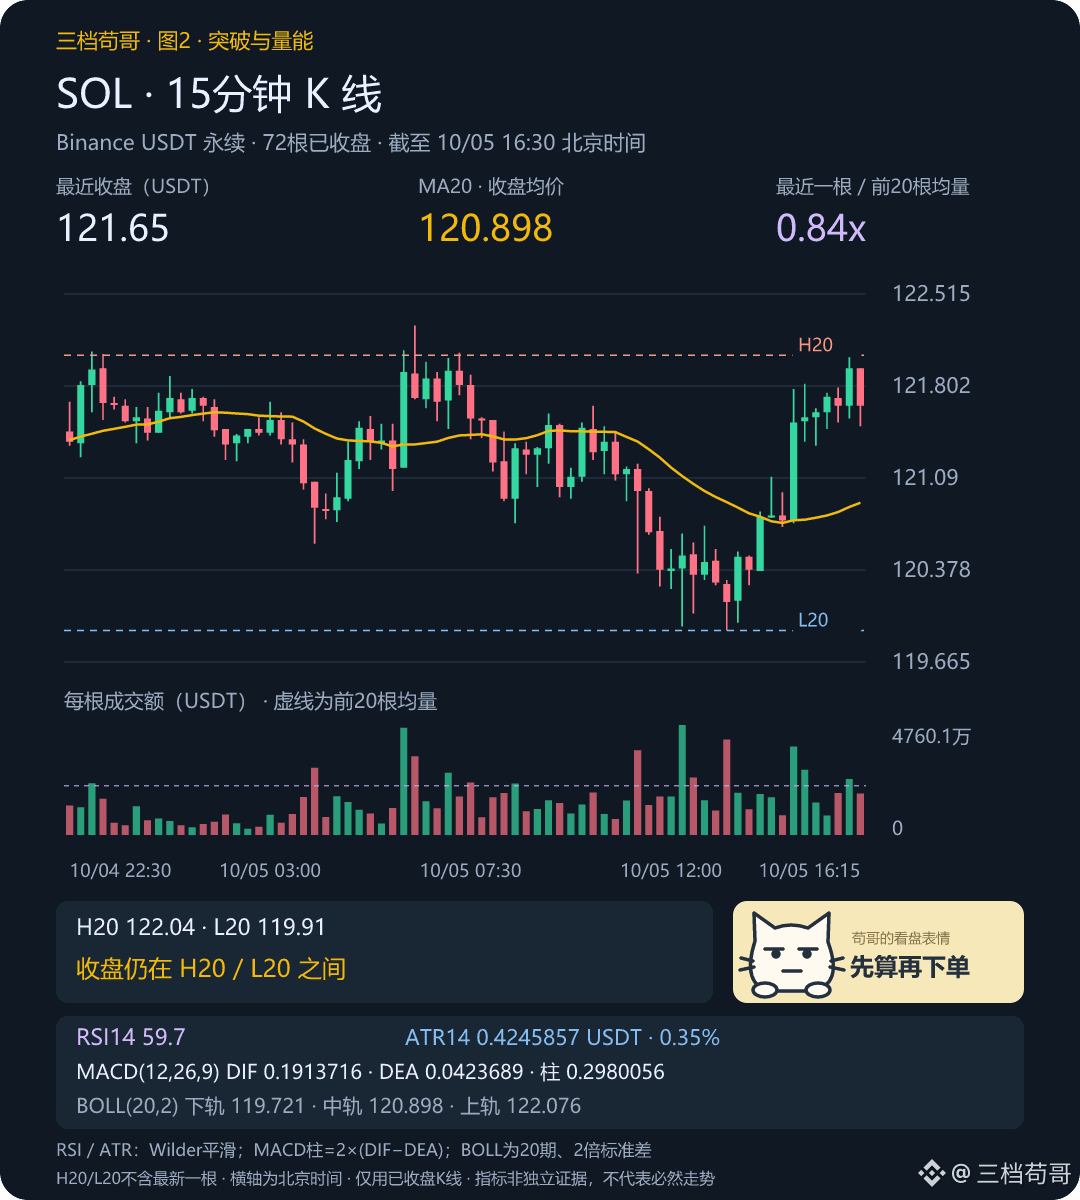
① Wait for an entry. Beginners can use a paper-trading account to practice one setup: use the 1-hour chart to identify the range, then wait on the 15-minute chart for a candle to close above the high of the previous 20 candles and for a retest to hold. An intraday wick above the level doesn’t count as confirmation. If it doesn’t happen, don’t trade. SOL in the chart is used to demonstrate how the two timeframes work together.
② Calculate position size. Suppose you have 10,000 USDT in capital and a risk budget of 50 per trade. Set aside 5 for fees and slippage first. If the entry is 100 and the stop-loss is 98, the price risk is 2 per coin, so you can buy 22.5 coins, for a notional position of 2,250. If actual costs exceed the amount set aside, your loss could still exceed 50.
③ Check the upside. Suppose the target is 104: before costs, the reward-to-risk ratio is 2. If resistance is just ahead at 101, it falls to only 0.5, so it may be worth passing on the trade. 100, 98, and 104 are hypothetical prices for illustration, not SOL’s current price. The stop-loss should correspond to where the structure becomes invalidated; don’t artificially tighten it just to buy more.
④ Exit according to plan. Set your stop-loss and target when you open the trade, and follow through when either is triggered. Don’t add to the position to try to break even. Leverage changes the margin requirement; it doesn’t reduce the price risk of the same notional position. After the trade, record your rationale, planned loss, and actual result, then test your rules across a batch of trades.
📊 Chart 1|SOL 1h (16:00 Beijing time): close 121.65 USDT, volume ratio 1.19x.
🔎 Chart 2|SOL 15m (16:30 Beijing time): close 121.65 USDT, volume ratio 0.84x.
💬 What’s hardest for you: waiting for confirmation, controlling position size, or exiting according to plan? Pick one thing to work on first—it’s easier to review than changing indicators every day.
There’s a SOL market link below so you can compare it with the range in the charts.
Source: Charts use closed SOLUSDT perpetual candles from Binance, captured before publication. The position-sizing example is hypothetical and for educational purposes; prices are in USDT. H20/L20 in the charts indicate the highs and lows of the previous 20 candles, excluding the latest candle. A breakout and retest is only a practice framework; it has not been backtested and does not indicate that a buy signal has occurred. Estimate fees, funding, and slippage based on your actual trades. A stop-loss does not guarantee execution at the specified price.
For discussion only; not investment advice.
$BTC $ETH $SOL
Don’t rush to find the next coin about to skyrocket: Before a single trade, complete these four steps
😅 The trade most likely to get out of control often starts with “I’ll just buy a little first.” My order is: first identify where my thesis would be invalidated, then calculate position size, and only then consider buying. Even if you get the direction right, you still need to be able to withstand the volatility along the way.
① Wait for an entry. Beginners can use a paper-trading account to practice one setup: use the 1-hour chart to identify the range, then wait on the 15-minute chart for a candle to close above the high of the previous 20 candles and for a retest to hold. An intraday wick above the level doesn’t count as confirmation. If it doesn’t happen, don’t trade. SOL in the chart is used to demonstrate how the two timeframes work together.
② Calculate position size. Suppose you have 10,000 USDT in capital and a risk budget of 50 per trade. Set aside 5 for fees and slippage first. If the entry is 100 and the stop-loss is 98, the price risk is 2 per coin, so you can buy 22.5 coins, for a notional position of 2,250. If actual costs exceed the amount set aside, your loss could still exceed 50.
③ Check the upside. Suppose the target is 104: before costs, the reward-to-risk ratio is 2. If resistance is just ahead at 101, it falls to only 0.5, so it may be worth passing on the trade. 100, 98, and 104 are hypothetical prices for illustration, not SOL’s current price. The stop-loss should correspond to where the structure becomes invalidated; don’t artificially tighten it just to buy more.
④ Exit according to plan. Set your stop-loss and target when you open the trade, and follow through when either is triggered. Don’t add to the position to try to break even. Leverage changes the margin requirement; it doesn’t reduce the price risk of the same notional position. After the trade, record your rationale, planned loss, and actual result, then test your rules across a batch of trades.
📊 Chart 1|SOL 1h (16:00 Beijing time): close 121.65 USDT, volume ratio 1.19x.
🔎 Chart 2|SOL 15m (16:30 Beijing time): close 121.65 USDT, volume ratio 0.84x.
💬 What’s hardest for you: waiting for confirmation, controlling position size, or exiting according to plan? Pick one thing to work on first—it’s easier to review than changing indicators every day.
There’s a SOL market link below so you can compare it with the range in the charts.
Source: Charts use closed SOLUSDT perpetual candles from Binance, captured before publication. The position-sizing example is hypothetical and for educational purposes; prices are in USDT. H20/L20 in the charts indicate the highs and lows of the previous 20 candles, excluding the latest candle. A breakout and retest is only a practice framework; it has not been backtested and does not indicate that a buy signal has occurred. Estimate fees, funding, and slippage based on your actual trades. A stop-loss does not guarantee execution at the specified price.
For discussion only; not investment advice.
$BTC $ETH $SOL
😅 The trade most likely to get out of control often starts with “I’ll just buy a little first.” My order is: first identify where my thesis would be invalidated, then calculate position size, and only then consider buying. Even if you get the direction right, you still need to be able to withstand the volatility along the way.
① Wait for an entry. Beginners can use a paper-trading account to practice one setup: use the 1-hour chart to identify the range, then wait on the 15-minute chart for a candle to close above the high of the previous 20 candles and for a retest to hold. An intraday wick above the level doesn’t count as confirmation. If it doesn’t happen, don’t trade. SOL in the chart is used to demonstrate how the two timeframes work together.
② Calculate position size. Suppose you have 10,000 USDT in capital and a risk budget of 50 per trade. Set aside 5 for fees and slippage first. If the entry is 100 and the stop-loss is 98, the price risk is 2 per coin, so you can buy 22.5 coins, for a notional position of 2,250. If actual costs exceed the amount set aside, your loss could still exceed 50.
③ Check the upside. Suppose the target is 104: before costs, the reward-to-risk ratio is 2. If resistance is just ahead at 101, it falls to only 0.5, so it may be worth passing on the trade. 100, 98, and 104 are hypothetical prices for illustration, not SOL’s current price. The stop-loss should correspond to where the structure becomes invalidated; don’t artificially tighten it just to buy more.
④ Exit according to plan. Set your stop-loss and target when you open the trade, and follow through when either is triggered. Don’t add to the position to try to break even. Leverage changes the margin requirement; it doesn’t reduce the price risk of the same notional position. After the trade, record your rationale, planned loss, and actual result, then test your rules across a batch of trades.
📊 Chart 1|SOL 1h (16:00 Beijing time): close 121.65 USDT, volume ratio 1.19x.
🔎 Chart 2|SOL 15m (16:30 Beijing time): close 121.65 USDT, volume ratio 0.84x.
💬 What’s hardest for you: waiting for confirmation, controlling position size, or exiting according to plan? Pick one thing to work on first—it’s easier to review than changing indicators every day.
There’s a SOL market link below so you can compare it with the range in the charts.
Source: Charts use closed SOLUSDT perpetual candles from Binance, captured before publication. The position-sizing example is hypothetical and for educational purposes; prices are in USDT. H20/L20 in the charts indicate the highs and lows of the previous 20 candles, excluding the latest candle. A breakout and retest is only a practice framework; it has not been backtested and does not indicate that a buy signal has occurred. Estimate fees, funding, and slippage based on your actual trades. A stop-loss does not guarantee execution at the specified price.
For discussion only; not investment advice.
$BTC $ETH $SOL
346
·
--
Liquidation pressure on both sides for BTC, ETH, and SOL: I’m watching for an upside short squeeze in SOL
👀 To guess which side big money will sweep first, I’ll compare liquidation pressure over the same distance. In this snapshot, the short fuel above SOL stands out the most, followed by ETH, while the gap between BTC’s two sides is smaller. But any directional call still needs to pass the volume-and-price test.
📍At 16:20 Beijing time on October 5, Datawallet’s Binance perpetuals 24-hour model showed the following cumulative liquidation intensity within roughly 2% above and below each coin’s reference price. Note: these are model estimates—not a guarantee that this much will be liquidated if the price reaches those levels.
BTC: Up to 88,087.81, about $306 million in shorts; down to 84,633.39, about $252 million in longs.
ETH: Up to 2,782.01, about $188 million in shorts; down to 2,672.91, about $136 million in longs.
SOL: Up to 124.14, about $61.43 million in shorts; down to 119.28, about $25.5 million in longs.
Ratio of liquidation size above vs. below over the same distance: BTC 1.22, ETH 1.38, SOL 2.41. So I’m prioritizing SOL’s potential push higher: if buying pressure drives a breakout first, forced short covering could add further fuel. The ratio is not the probability of a move.
⚡ My confirmation criteria: SOL closes an hourly candle above 122.27, the volume ratio reaches 1.5x, and price holds on a retest; then I’ll watch the zone above. At the time, the volume ratio was only 1.19, and the MACD histogram was still negative, so the evidence for chasing longs wasn’t all there yet. If SOL breaks below 119.91 and fails to reclaim it on a rebound, I’ll withdraw my upside-first view.
Open interest across all three coins has declined over the past four hours, so don’t read the liquidation map as evidence of new longs entering. Traders can close positions early or add margin, and liquidation clusters can shift. 💬 Would you wait for a breakout before following, or wait for both sides to be swept first?
If you want to keep tracking this, the SOL chart below can help you check the conditions above.
Source: Datawallet’s public liquidation heatmap, Binance, 24h; Binance hourly candles, open interest, and funding rates. Model reference prices: BTC 86,360.6 / ETH 2,727.46 / SOL 121.71 USDT. Only different price levels within the latest time slice, from reference price to target price, are summed; values are not stacked across time. These are not market-wide totals or isolated-margin records; units are model intensity in USD, as reported by the source. Figure 1 compares the ranges; Figure 2 checks actual candles and indicators. The 1.5x volume ratio is an observation threshold and has not been backtested as a strategy.
https://www.datawallet.com/zh/liquidation-heatmap/solana
For discussion only; this is not investment advice.
$BTC $ETH $SOL
Liquidation pressure on both sides for BTC, ETH, and SOL: I’m watching for an upside short squeeze in SOL
👀 To guess which side big money will sweep first, I’ll compare liquidation pressure over the same distance. In this snapshot, the short fuel above SOL stands out the most, followed by ETH, while the gap between BTC’s two sides is smaller. But any directional call still needs to pass the volume-and-price test.
📍At 16:20 Beijing time on October 5, Datawallet’s Binance perpetuals 24-hour model showed the following cumulative liquidation intensity within roughly 2% above and below each coin’s reference price. Note: these are model estimates—not a guarantee that this much will be liquidated if the price reaches those levels.
BTC: Up to 88,087.81, about $306 million in shorts; down to 84,633.39, about $252 million in longs.
ETH: Up to 2,782.01, about $188 million in shorts; down to 2,672.91, about $136 million in longs.
SOL: Up to 124.14, about $61.43 million in shorts; down to 119.28, about $25.5 million in longs.
Ratio of liquidation size above vs. below over the same distance: BTC 1.22, ETH 1.38, SOL 2.41. So I’m prioritizing SOL’s potential push higher: if buying pressure drives a breakout first, forced short covering could add further fuel. The ratio is not the probability of a move.
⚡ My confirmation criteria: SOL closes an hourly candle above 122.27, the volume ratio reaches 1.5x, and price holds on a retest; then I’ll watch the zone above. At the time, the volume ratio was only 1.19, and the MACD histogram was still negative, so the evidence for chasing longs wasn’t all there yet. If SOL breaks below 119.91 and fails to reclaim it on a rebound, I’ll withdraw my upside-first view.
Open interest across all three coins has declined over the past four hours, so don’t read the liquidation map as evidence of new longs entering. Traders can close positions early or add margin, and liquidation clusters can shift. 💬 Would you wait for a breakout before following, or wait for both sides to be swept first?
If you want to keep tracking this, the SOL chart below can help you check the conditions above.
Source: Datawallet’s public liquidation heatmap, Binance, 24h; Binance hourly candles, open interest, and funding rates. Model reference prices: BTC 86,360.6 / ETH 2,727.46 / SOL 121.71 USDT. Only different price levels within the latest time slice, from reference price to target price, are summed; values are not stacked across time. These are not market-wide totals or isolated-margin records; units are model intensity in USD, as reported by the source. Figure 1 compares the ranges; Figure 2 checks actual candles and indicators. The 1.5x volume ratio is an observation threshold and has not been backtested as a strategy.
https://www.datawallet.com/zh/liquidation-heatmap/solana
For discussion only; this is not investment advice.
$BTC $ETH $SOL
👀 To guess which side big money will sweep first, I’ll compare liquidation pressure over the same distance. In this snapshot, the short fuel above SOL stands out the most, followed by ETH, while the gap between BTC’s two sides is smaller. But any directional call still needs to pass the volume-and-price test.
📍At 16:20 Beijing time on October 5, Datawallet’s Binance perpetuals 24-hour model showed the following cumulative liquidation intensity within roughly 2% above and below each coin’s reference price. Note: these are model estimates—not a guarantee that this much will be liquidated if the price reaches those levels.
BTC: Up to 88,087.81, about $306 million in shorts; down to 84,633.39, about $252 million in longs.
ETH: Up to 2,782.01, about $188 million in shorts; down to 2,672.91, about $136 million in longs.
SOL: Up to 124.14, about $61.43 million in shorts; down to 119.28, about $25.5 million in longs.
Ratio of liquidation size above vs. below over the same distance: BTC 1.22, ETH 1.38, SOL 2.41. So I’m prioritizing SOL’s potential push higher: if buying pressure drives a breakout first, forced short covering could add further fuel. The ratio is not the probability of a move.
⚡ My confirmation criteria: SOL closes an hourly candle above 122.27, the volume ratio reaches 1.5x, and price holds on a retest; then I’ll watch the zone above. At the time, the volume ratio was only 1.19, and the MACD histogram was still negative, so the evidence for chasing longs wasn’t all there yet. If SOL breaks below 119.91 and fails to reclaim it on a rebound, I’ll withdraw my upside-first view.
Open interest across all three coins has declined over the past four hours, so don’t read the liquidation map as evidence of new longs entering. Traders can close positions early or add margin, and liquidation clusters can shift. 💬 Would you wait for a breakout before following, or wait for both sides to be swept first?
If you want to keep tracking this, the SOL chart below can help you check the conditions above.
Source: Datawallet’s public liquidation heatmap, Binance, 24h; Binance hourly candles, open interest, and funding rates. Model reference prices: BTC 86,360.6 / ETH 2,727.46 / SOL 121.71 USDT. Only different price levels within the latest time slice, from reference price to target price, are summed; values are not stacked across time. These are not market-wide totals or isolated-margin records; units are model intensity in USD, as reported by the source. Figure 1 compares the ranges; Figure 2 checks actual candles and indicators. The 1.5x volume ratio is an observation threshold and has not been backtested as a strategy.
https://www.datawallet.com/zh/liquidation-heatmap/solana
For discussion only; this is not investment advice.
$BTC $ETH $SOL
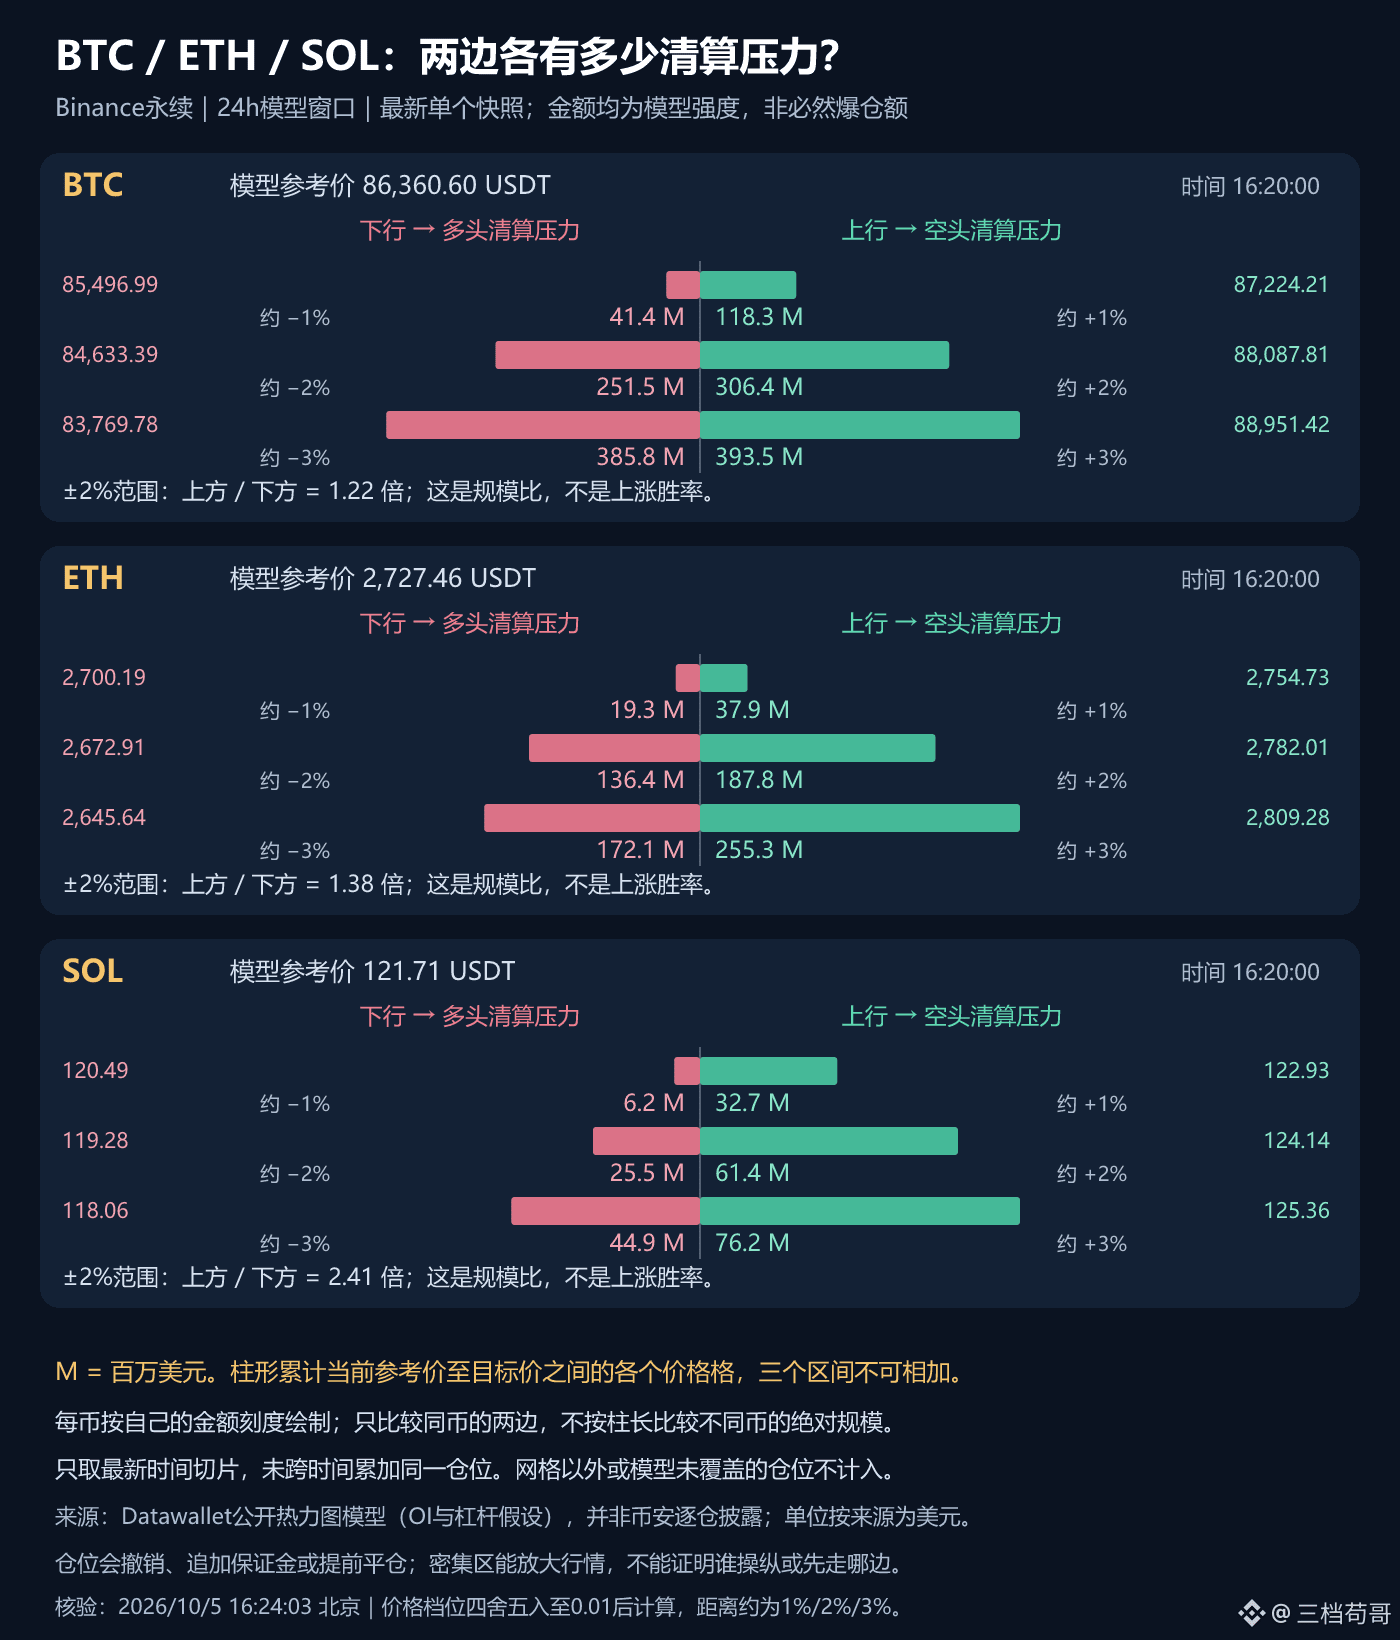
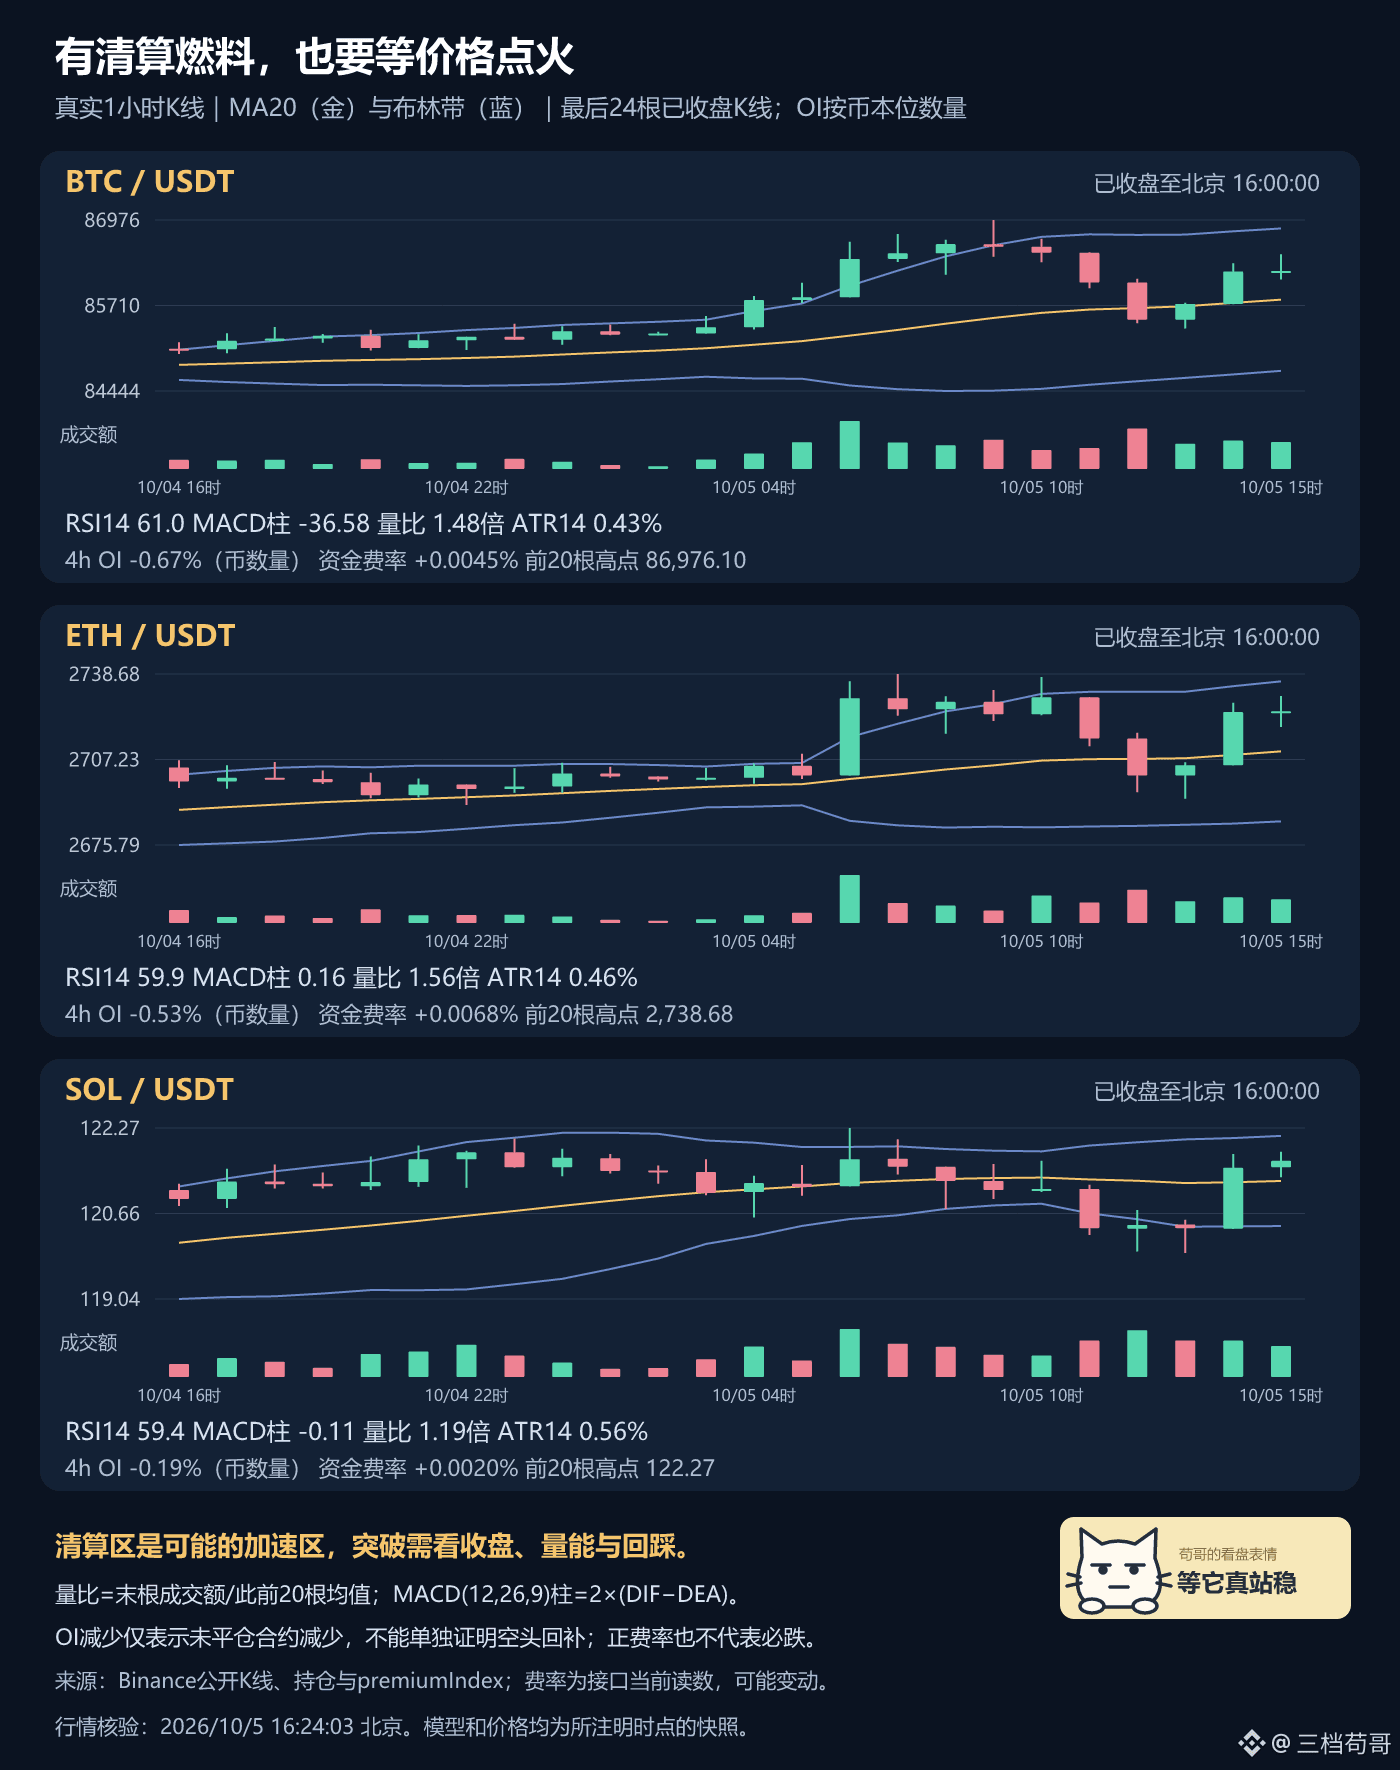
325
·
--
Partly True
Does BTC Have to Drop When the 5-Year U.S. Treasury Yield Rises? An Answer After 120 Trading Days
“U.S. Treasury yields are up again—should I short BTC?” 😏 After aligning the data, I found that there is indeed a negative correlation, but it’s nowhere near strong enough to use as a straightforward buy/sell trigger. First, let’s get the basics right: the “5-year” here refers to the bond’s maturity, and the study is about yields. Bond prices typically move inversely to yields, so they should not be confused.
📊 As of October 1, aligned by the New York 15:30 timestamp, I compared the yield basis-point changes of U.S. Treasuries with BTC’s同期 (concurrent) rise/fall. Over roughly 20, 60, and 120 trading days, the correlation coefficients are −0.31, −0.28, and −0.23—these indicate a weak negative correlation, not a “31%, 28%, or 23% chance of dropping.”
September 23 is a clear example: the 5-year yield rose by 16 basis points, i.e., 0.16 percentage points, while BTC fell by 2.45% over the same period. Holding Treasuries’ interest may be more attractive, potentially increasing the opportunity cost of holding non-yielding BTC; but shared inflation expectations and dollar movements could also push both sides at the same time.
My view: U.S. Treasuries are best used as an environmental filter. If yields pull back, and BTC breaks above the previous day’s high on expanding volume and then holds the level on a retest, that would be more supportive of a continuation higher. But if yields are falling while BTC breaks below the previous day’s low, then I would cancel this moderately bullish bias—this may be a flight-to-safety flow rather than a rebound in risk appetite.
⚠️ Within the sample, the rolling 20-day correlation approached zero, and the Treasury data were also released after the observation timestamps. This is a historical relationship; it doesn’t prove it can forecast the next day. 💬 When you look at BTC, do you weigh U.S. Treasuries and the dollar more, or ETF fund flows?
The three tags below are the top three performers by Binance USDT perpetual 24-hour change at the time of publication. They are for observation only and do not imply that this article’s conclusion applies to those coins.
Source: FRED DGS5, U.S. Treasury methodology notes, Binance spot BTCUSDT; verified on 2026-10-05, with the latest Treasury observation day being 10-01. The 120 sets of changes cover 04-13 to 10-01, with a baseline of 04-10. Missing Treasury days are skipped; BTC returns include the weekends and holidays crossed. Pearson correlation does not imply causation, and shared factors are not removed; scenario conditions were not tested via strategy backtesting. Figure 1 shows the scatter plot; Figure 2 shows the relationship changes.
https://fred.stlouisfed.org/series/DGS5
For discussion only; not investment advice.
$GTC $PUMPBTC $AIN
Does BTC Have to Drop When the 5-Year U.S. Treasury Yield Rises? An Answer After 120 Trading Days
“U.S. Treasury yields are up again—should I short BTC?” 😏 After aligning the data, I found that there is indeed a negative correlation, but it’s nowhere near strong enough to use as a straightforward buy/sell trigger. First, let’s get the basics right: the “5-year” here refers to the bond’s maturity, and the study is about yields. Bond prices typically move inversely to yields, so they should not be confused.
📊 As of October 1, aligned by the New York 15:30 timestamp, I compared the yield basis-point changes of U.S. Treasuries with BTC’s同期 (concurrent) rise/fall. Over roughly 20, 60, and 120 trading days, the correlation coefficients are −0.31, −0.28, and −0.23—these indicate a weak negative correlation, not a “31%, 28%, or 23% chance of dropping.”
September 23 is a clear example: the 5-year yield rose by 16 basis points, i.e., 0.16 percentage points, while BTC fell by 2.45% over the same period. Holding Treasuries’ interest may be more attractive, potentially increasing the opportunity cost of holding non-yielding BTC; but shared inflation expectations and dollar movements could also push both sides at the same time.
My view: U.S. Treasuries are best used as an environmental filter. If yields pull back, and BTC breaks above the previous day’s high on expanding volume and then holds the level on a retest, that would be more supportive of a continuation higher. But if yields are falling while BTC breaks below the previous day’s low, then I would cancel this moderately bullish bias—this may be a flight-to-safety flow rather than a rebound in risk appetite.
⚠️ Within the sample, the rolling 20-day correlation approached zero, and the Treasury data were also released after the observation timestamps. This is a historical relationship; it doesn’t prove it can forecast the next day. 💬 When you look at BTC, do you weigh U.S. Treasuries and the dollar more, or ETF fund flows?
The three tags below are the top three performers by Binance USDT perpetual 24-hour change at the time of publication. They are for observation only and do not imply that this article’s conclusion applies to those coins.
Source: FRED DGS5, U.S. Treasury methodology notes, Binance spot BTCUSDT; verified on 2026-10-05, with the latest Treasury observation day being 10-01. The 120 sets of changes cover 04-13 to 10-01, with a baseline of 04-10. Missing Treasury days are skipped; BTC returns include the weekends and holidays crossed. Pearson correlation does not imply causation, and shared factors are not removed; scenario conditions were not tested via strategy backtesting. Figure 1 shows the scatter plot; Figure 2 shows the relationship changes.
https://fred.stlouisfed.org/series/DGS5
For discussion only; not investment advice.
$GTC $PUMPBTC $AIN
“U.S. Treasury yields are up again—should I short BTC?” 😏 After aligning the data, I found that there is indeed a negative correlation, but it’s nowhere near strong enough to use as a straightforward buy/sell trigger. First, let’s get the basics right: the “5-year” here refers to the bond’s maturity, and the study is about yields. Bond prices typically move inversely to yields, so they should not be confused.
📊 As of October 1, aligned by the New York 15:30 timestamp, I compared the yield basis-point changes of U.S. Treasuries with BTC’s同期 (concurrent) rise/fall. Over roughly 20, 60, and 120 trading days, the correlation coefficients are −0.31, −0.28, and −0.23—these indicate a weak negative correlation, not a “31%, 28%, or 23% chance of dropping.”
September 23 is a clear example: the 5-year yield rose by 16 basis points, i.e., 0.16 percentage points, while BTC fell by 2.45% over the same period. Holding Treasuries’ interest may be more attractive, potentially increasing the opportunity cost of holding non-yielding BTC; but shared inflation expectations and dollar movements could also push both sides at the same time.
My view: U.S. Treasuries are best used as an environmental filter. If yields pull back, and BTC breaks above the previous day’s high on expanding volume and then holds the level on a retest, that would be more supportive of a continuation higher. But if yields are falling while BTC breaks below the previous day’s low, then I would cancel this moderately bullish bias—this may be a flight-to-safety flow rather than a rebound in risk appetite.
⚠️ Within the sample, the rolling 20-day correlation approached zero, and the Treasury data were also released after the observation timestamps. This is a historical relationship; it doesn’t prove it can forecast the next day. 💬 When you look at BTC, do you weigh U.S. Treasuries and the dollar more, or ETF fund flows?
The three tags below are the top three performers by Binance USDT perpetual 24-hour change at the time of publication. They are for observation only and do not imply that this article’s conclusion applies to those coins.
Source: FRED DGS5, U.S. Treasury methodology notes, Binance spot BTCUSDT; verified on 2026-10-05, with the latest Treasury observation day being 10-01. The 120 sets of changes cover 04-13 to 10-01, with a baseline of 04-10. Missing Treasury days are skipped; BTC returns include the weekends and holidays crossed. Pearson correlation does not imply causation, and shared factors are not removed; scenario conditions were not tested via strategy backtesting. Figure 1 shows the scatter plot; Figure 2 shows the relationship changes.
https://fred.stlouisfed.org/series/DGS5
For discussion only; not investment advice.
$GTC $PUMPBTC $AIN
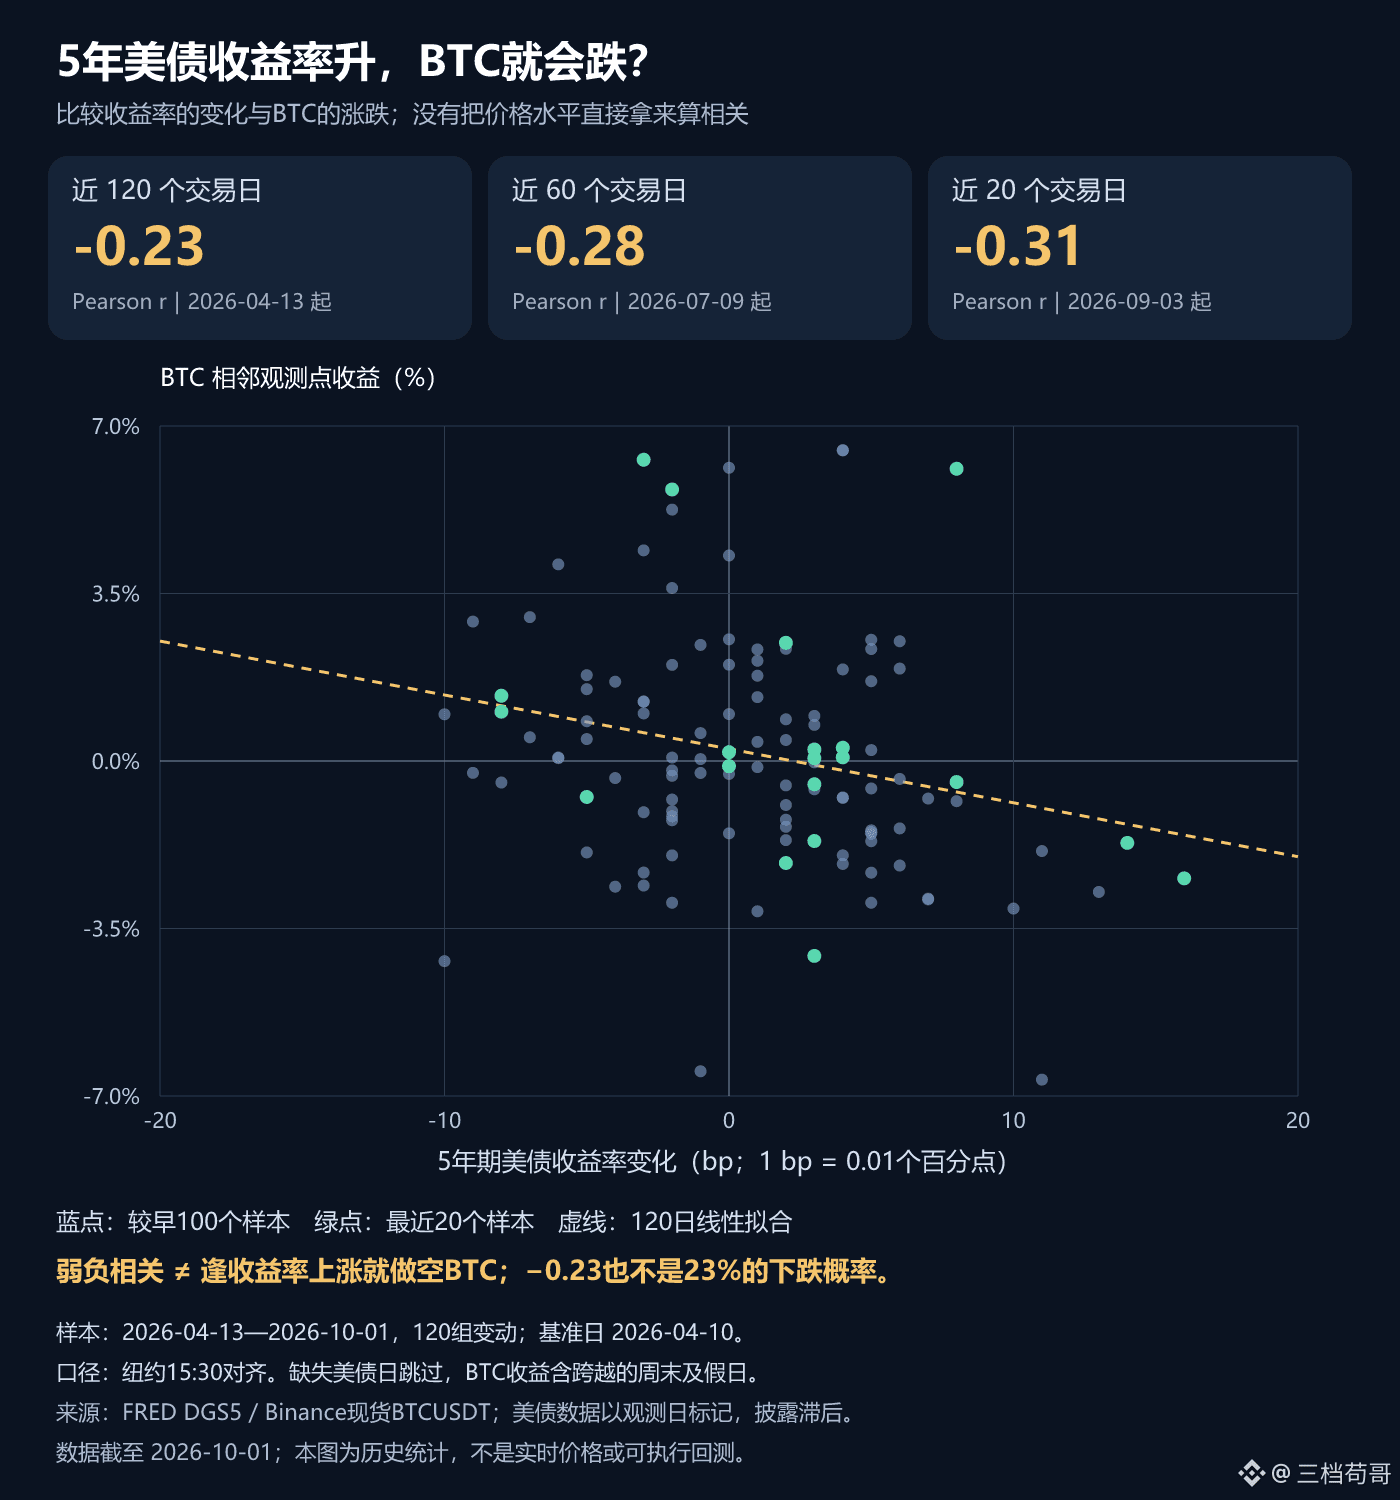
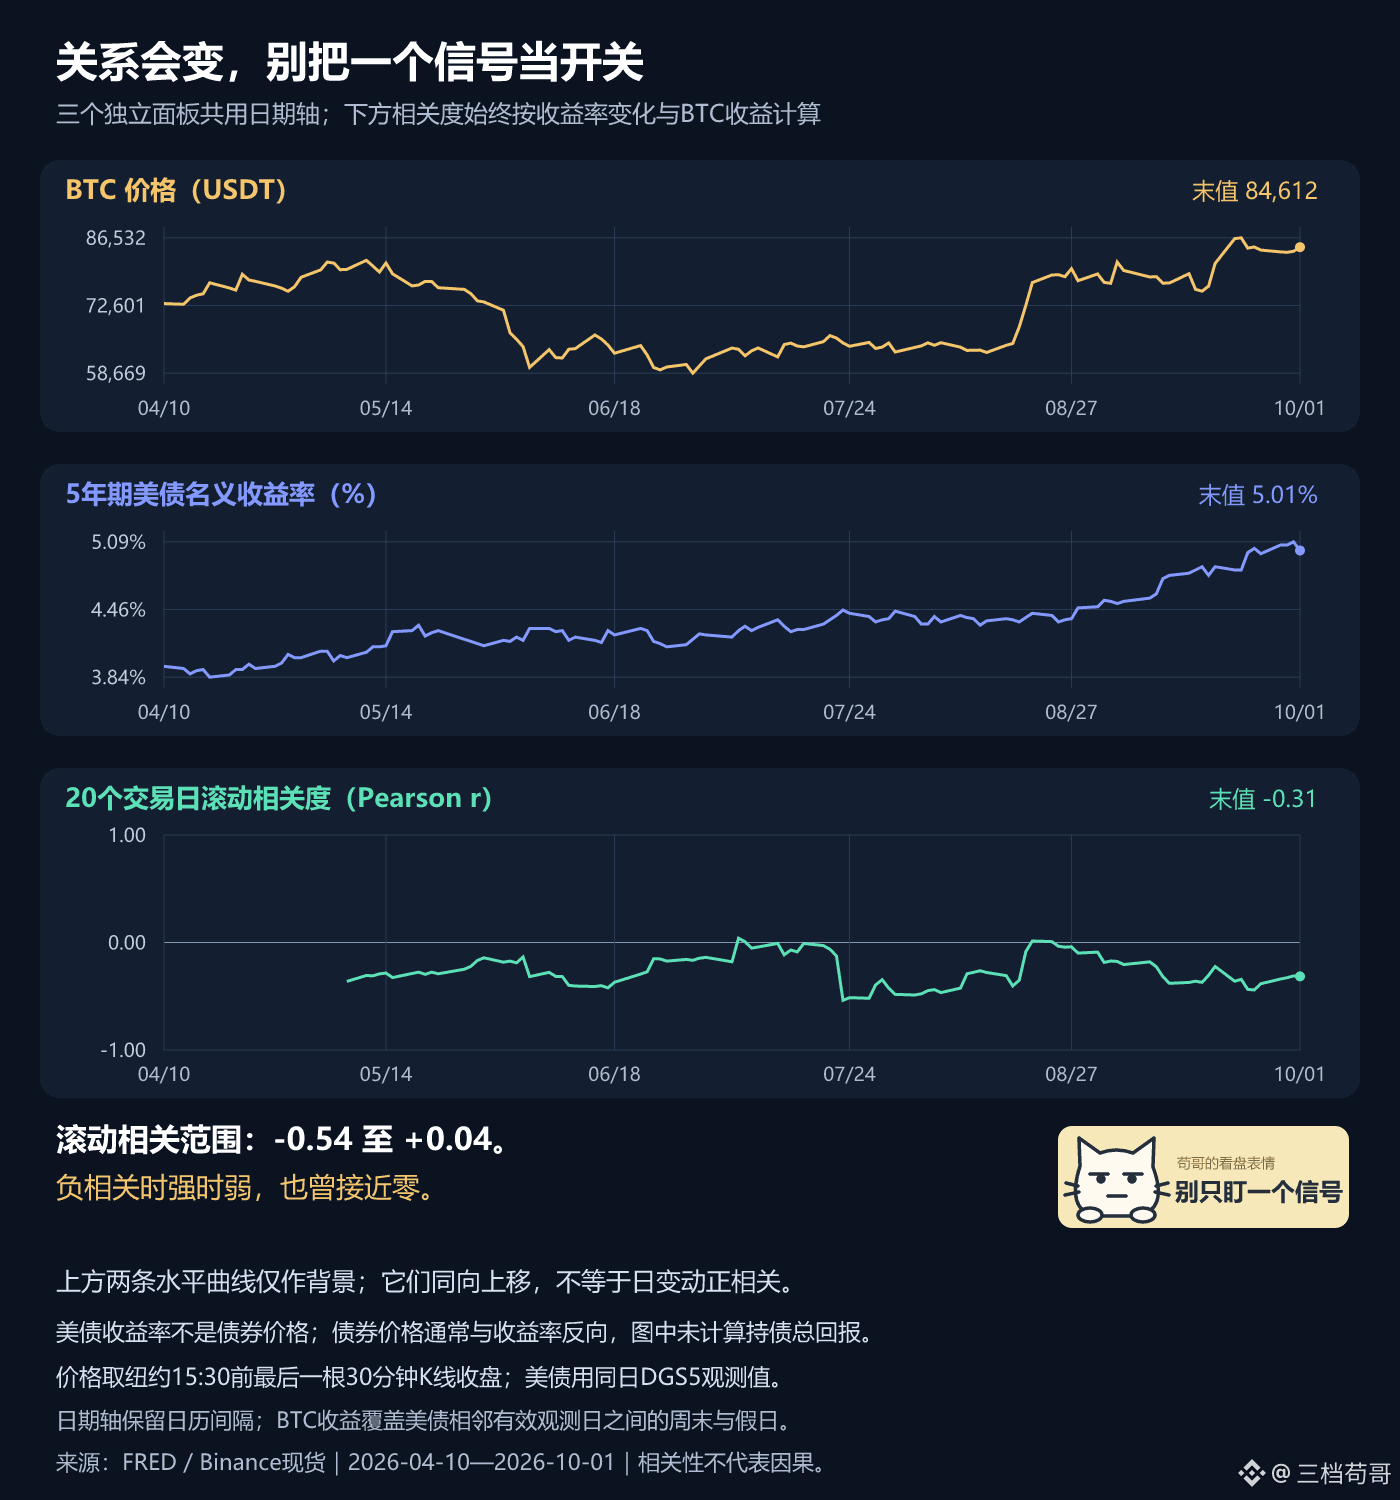
789
·
--
Oil Tankers Hit Again Over the Weekend—On Monday, Bitcoin First Has to Clear the “Oil Price Hurdle”
For Monday’s session, I’ll be a bit cautious first. 🙃 If the price holds steady for now, does that mean the bearish impact has been digested? Oil and US stocks haven’t finished pricing in the next round of market opens yet.
📰 According to a CNBC report on October 4, the UK maritime authority received a report that at least two ships were attacked in waters near Oman and Iran over the weekend. On the same day, the Iranian speaker reiterated that it would not reopen the Strait of Hormuz until its conditions are met. This corridor carried roughly one-fifth of the world’s oil supply before the war, so how long transport disruptions last is crucial.
First, note two reference points: on Friday, October 2, Brent settled at $102.25/bbl, and WTI at $91.11/bbl—these are the previous closing prices. The report also mentioned that the G7 announced the release of oil reserves, so both supply risk and buffering measures matter.
📌 How do you trade crypto and tech stocks using this news? If oil prices keep rising, they may lift inflation expectations and squeeze the room for rate cuts. If US Treasury yields rise again, valuations and risk appetite could face pressure. This is conditional scenario analysis—not a conclusion that Bitcoin must fall.
For the next trading day, I see two possible paths: if oil prices rise clearly versus Friday and yields also increase, and BTC then breaks below the weekend range lows, I would dial down expectations for the rebound. If oil prices spike and then pull back, and yields don’t follow, and BTC retraces while still holding the range, caution would be eased. Wait for cross-market confirmation—don’t treat the headline as a “buy now” button.
📊 Figure 1|BTC 1h (00:00 Beijing time): Close 85,204.3 USDT, Volume ratio 1.54×.
🔎 Figure 2|BTC 15m (00:30 Beijing time): Close 85,202.8 USDT, Volume ratio 0.52×.
💬 Do you think Monday should first trade supply risks, or the buffer from reserve releases? Which market reaction would you use to validate your view?
The BTC market snapshot below is only for cross-checking market reactions, and does not mean the news has already turned into a price catalyst.
Source: CNBC report dated 2026-10-04; updated at 20:35 Beijing time. Oil prices are the October 2 closing levels. The BTC charts reflect Binance’s already-closed candles at the time of publication and are only for market context—they do not prove that the news has driven the subsequent price action.
For discussion only; not investment advice.
$BTC $ETH $COLLECT
Oil Tankers Hit Again Over the Weekend—On Monday, Bitcoin First Has to Clear the “Oil Price Hurdle”
For Monday’s session, I’ll be a bit cautious first. 🙃 If the price holds steady for now, does that mean the bearish impact has been digested? Oil and US stocks haven’t finished pricing in the next round of market opens yet.
📰 According to a CNBC report on October 4, the UK maritime authority received a report that at least two ships were attacked in waters near Oman and Iran over the weekend. On the same day, the Iranian speaker reiterated that it would not reopen the Strait of Hormuz until its conditions are met. This corridor carried roughly one-fifth of the world’s oil supply before the war, so how long transport disruptions last is crucial.
First, note two reference points: on Friday, October 2, Brent settled at $102.25/bbl, and WTI at $91.11/bbl—these are the previous closing prices. The report also mentioned that the G7 announced the release of oil reserves, so both supply risk and buffering measures matter.
📌 How do you trade crypto and tech stocks using this news? If oil prices keep rising, they may lift inflation expectations and squeeze the room for rate cuts. If US Treasury yields rise again, valuations and risk appetite could face pressure. This is conditional scenario analysis—not a conclusion that Bitcoin must fall.
For the next trading day, I see two possible paths: if oil prices rise clearly versus Friday and yields also increase, and BTC then breaks below the weekend range lows, I would dial down expectations for the rebound. If oil prices spike and then pull back, and yields don’t follow, and BTC retraces while still holding the range, caution would be eased. Wait for cross-market confirmation—don’t treat the headline as a “buy now” button.
📊 Figure 1|BTC 1h (00:00 Beijing time): Close 85,204.3 USDT, Volume ratio 1.54×.
🔎 Figure 2|BTC 15m (00:30 Beijing time): Close 85,202.8 USDT, Volume ratio 0.52×.
💬 Do you think Monday should first trade supply risks, or the buffer from reserve releases? Which market reaction would you use to validate your view?
The BTC market snapshot below is only for cross-checking market reactions, and does not mean the news has already turned into a price catalyst.
Source: CNBC report dated 2026-10-04; updated at 20:35 Beijing time. Oil prices are the October 2 closing levels. The BTC charts reflect Binance’s already-closed candles at the time of publication and are only for market context—they do not prove that the news has driven the subsequent price action.
For discussion only; not investment advice.
$BTC $ETH $COLLECT
For Monday’s session, I’ll be a bit cautious first. 🙃 If the price holds steady for now, does that mean the bearish impact has been digested? Oil and US stocks haven’t finished pricing in the next round of market opens yet.
📰 According to a CNBC report on October 4, the UK maritime authority received a report that at least two ships were attacked in waters near Oman and Iran over the weekend. On the same day, the Iranian speaker reiterated that it would not reopen the Strait of Hormuz until its conditions are met. This corridor carried roughly one-fifth of the world’s oil supply before the war, so how long transport disruptions last is crucial.
First, note two reference points: on Friday, October 2, Brent settled at $102.25/bbl, and WTI at $91.11/bbl—these are the previous closing prices. The report also mentioned that the G7 announced the release of oil reserves, so both supply risk and buffering measures matter.
📌 How do you trade crypto and tech stocks using this news? If oil prices keep rising, they may lift inflation expectations and squeeze the room for rate cuts. If US Treasury yields rise again, valuations and risk appetite could face pressure. This is conditional scenario analysis—not a conclusion that Bitcoin must fall.
For the next trading day, I see two possible paths: if oil prices rise clearly versus Friday and yields also increase, and BTC then breaks below the weekend range lows, I would dial down expectations for the rebound. If oil prices spike and then pull back, and yields don’t follow, and BTC retraces while still holding the range, caution would be eased. Wait for cross-market confirmation—don’t treat the headline as a “buy now” button.
📊 Figure 1|BTC 1h (00:00 Beijing time): Close 85,204.3 USDT, Volume ratio 1.54×.
🔎 Figure 2|BTC 15m (00:30 Beijing time): Close 85,202.8 USDT, Volume ratio 0.52×.
💬 Do you think Monday should first trade supply risks, or the buffer from reserve releases? Which market reaction would you use to validate your view?
The BTC market snapshot below is only for cross-checking market reactions, and does not mean the news has already turned into a price catalyst.
Source: CNBC report dated 2026-10-04; updated at 20:35 Beijing time. Oil prices are the October 2 closing levels. The BTC charts reflect Binance’s already-closed candles at the time of publication and are only for market context—they do not prove that the news has driven the subsequent price action.
For discussion only; not investment advice.
$BTC $ETH $COLLECT
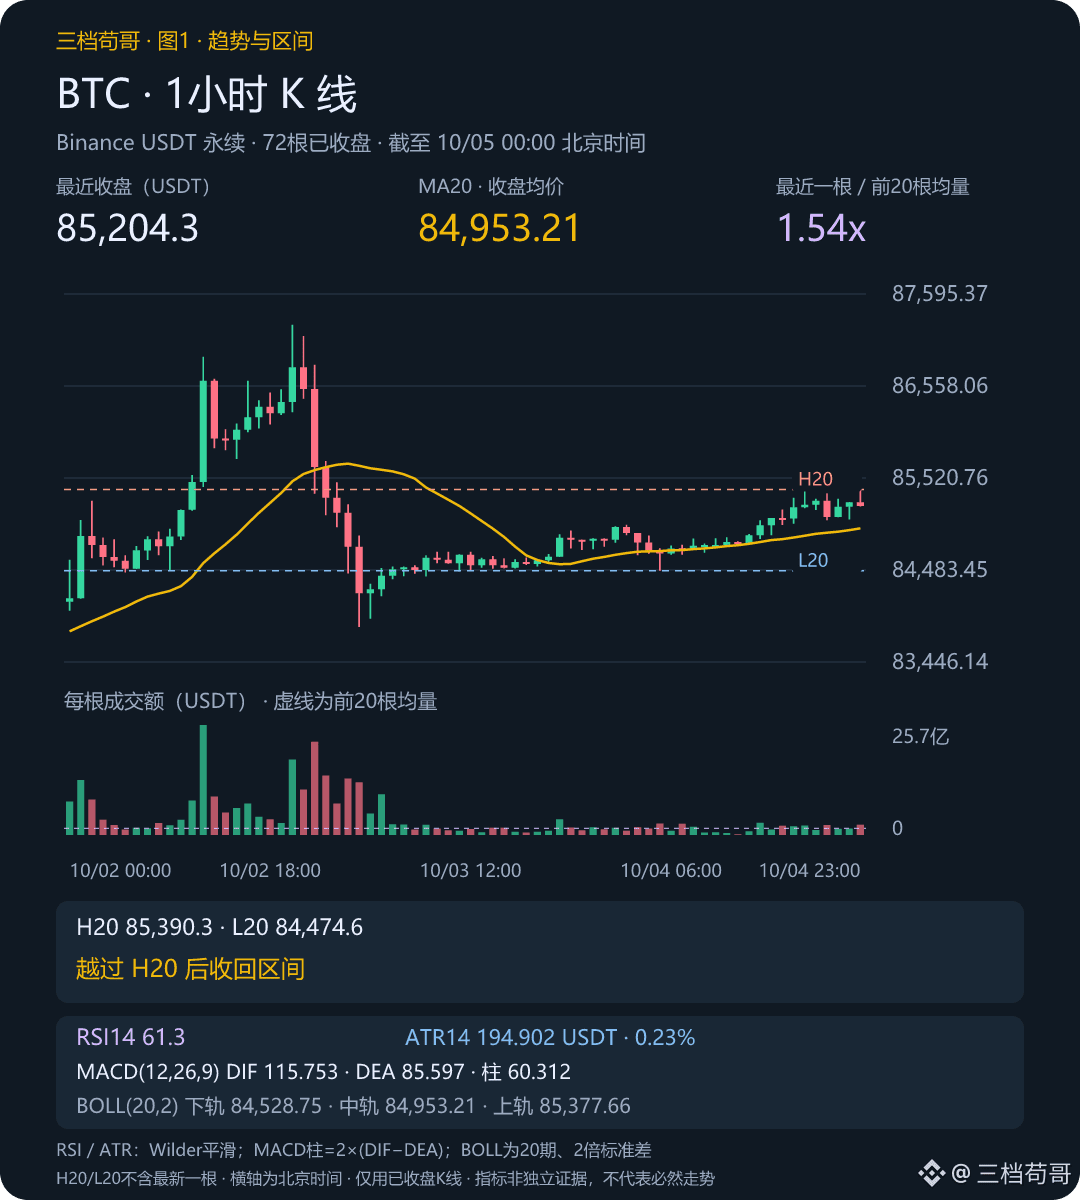
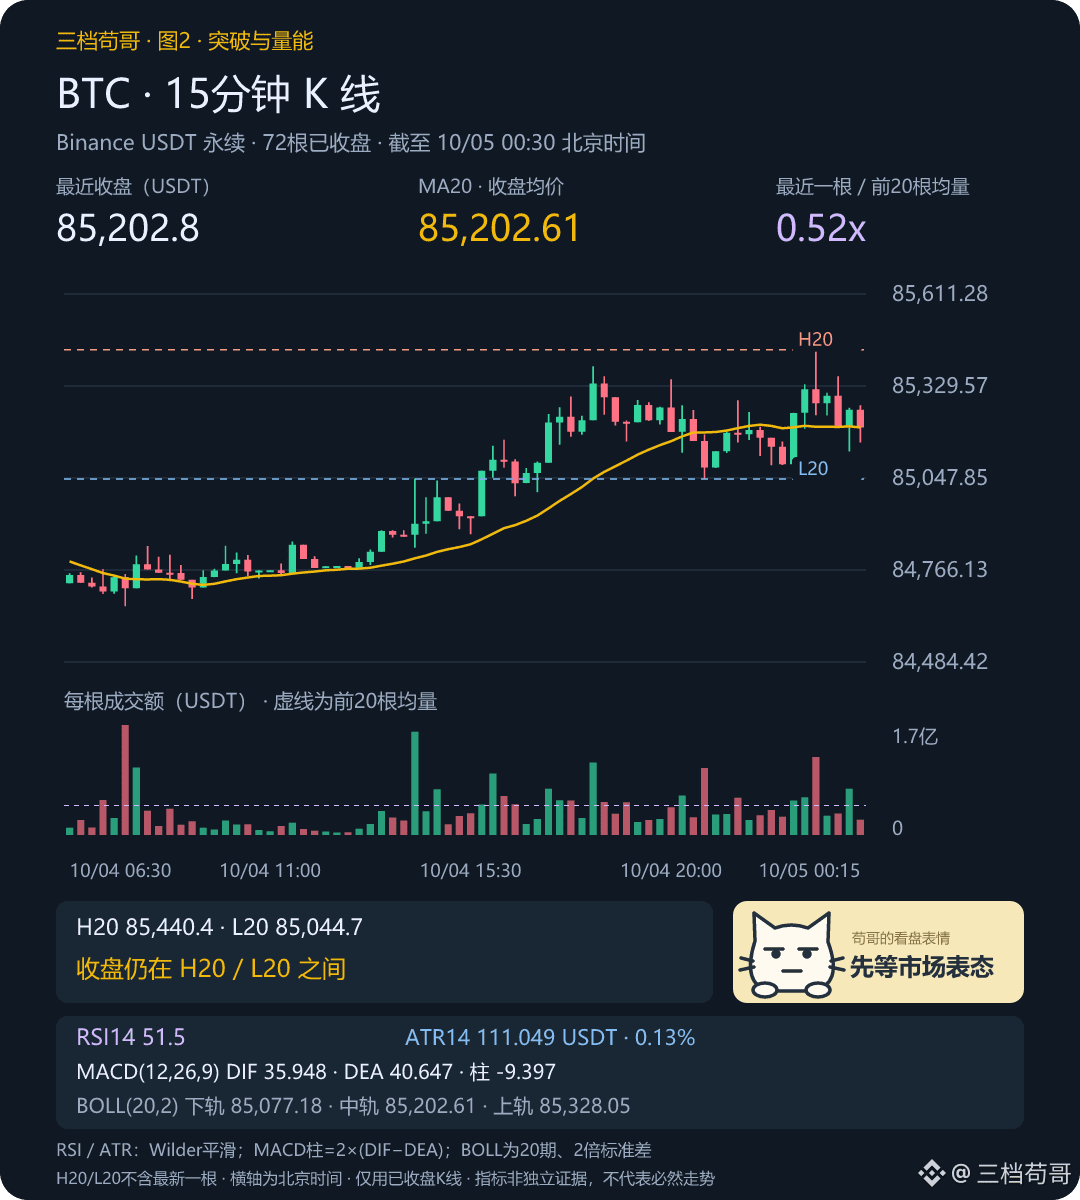
194
·
--
Should you chase the market when ETFs see net inflows? Data on BTC, ETH, and SOL pours a bucket of cold water on that idea
“ETF is buying again—so it’ll be up tomorrow, right?”😏 I lined up the capital flows and prices of BTC, ETH, and SOL and checked: within this sample, same-direction moves happened on the day, but on the next day there’s hardly any clear signal.
📊 Using Farside’s daily net flow for US spot/pledged ETFs, I compared it with the price up/down moves during Binance’s spot New York session from 9:30 to 16:00, and calculated the Pearson correlation coefficient. The sample covers 12 days from September 15 to October 1. Fund data missing on September 18 and October 2 were uniformly removed.
Same-day correlation: BTC 0.55, ETH 0.37, SOL 0.58. The closer it is to 1, the more it suggests that within this sample there’s a tendency to move up and down together. But 0.58 is not a 58% “win rate” for上涨!When I paired the capital flow with intraday price changes on the next trading day, the three correlations became −0.06, −0.06, and −0.15. This can’t be used to support the idea “if inflows come in today, prices will keep rising tomorrow.”
⚠️ Look at September 23: BTC net inflow was $346.9 million, yet during the same US stock market session it fell 1.20%. And after excluding the day with BTC’s largest net inflow, the same-day correlation dropped from 0.55 to 0.31. The sample is small, and big days have an outsized impact—so you can’t rank buys based on correlation.
My approach is to treat ETFs as a confirmation: watch for continuous net inflows, then a price break above the high from the previous US session, followed by a pullback that holds. Increase your attention when those align. If money keeps coming in but price breaks below the low of the prior session, reduce expectations for a bullish continuation.
You’re not really asking “how much the institution bought.” You’re asking whether those bids can actually hold up the price.
🔎 Figure 1 looks at correlation; Figure 2 looks at the real candlesticks and capital flow within the specific time window. Net flow is measured by the subscription/redemption channel—it’s not the same as synchronized buy orders. Here, disclosure timestamps, overnight weekend returns, and macro drivers weren’t included. Also, day-to-day correlation isn’t an actionable backtest, so it can’t be treated as a long-term rule.
💬 If you see consecutive net inflows but the coin price doesn’t rise, do you interpret it as building momentum—or as buying pressure being absorbed by sell pressure? Tell me which price signal you’d wait for.
https://farside.co.uk/btc/
https://farside.co.uk/eth/
https://farside.co.uk/sol/
For discussion only and does not constitute investment advice.
$BTC $ETH $SOL
Should you chase the market when ETFs see net inflows? Data on BTC, ETH, and SOL pours a bucket of cold water on that idea
“ETF is buying again—so it’ll be up tomorrow, right?”😏 I lined up the capital flows and prices of BTC, ETH, and SOL and checked: within this sample, same-direction moves happened on the day, but on the next day there’s hardly any clear signal.
📊 Using Farside’s daily net flow for US spot/pledged ETFs, I compared it with the price up/down moves during Binance’s spot New York session from 9:30 to 16:00, and calculated the Pearson correlation coefficient. The sample covers 12 days from September 15 to October 1. Fund data missing on September 18 and October 2 were uniformly removed.
Same-day correlation: BTC 0.55, ETH 0.37, SOL 0.58. The closer it is to 1, the more it suggests that within this sample there’s a tendency to move up and down together. But 0.58 is not a 58% “win rate” for上涨!When I paired the capital flow with intraday price changes on the next trading day, the three correlations became −0.06, −0.06, and −0.15. This can’t be used to support the idea “if inflows come in today, prices will keep rising tomorrow.”
⚠️ Look at September 23: BTC net inflow was $346.9 million, yet during the same US stock market session it fell 1.20%. And after excluding the day with BTC’s largest net inflow, the same-day correlation dropped from 0.55 to 0.31. The sample is small, and big days have an outsized impact—so you can’t rank buys based on correlation.
My approach is to treat ETFs as a confirmation: watch for continuous net inflows, then a price break above the high from the previous US session, followed by a pullback that holds. Increase your attention when those align. If money keeps coming in but price breaks below the low of the prior session, reduce expectations for a bullish continuation.
You’re not really asking “how much the institution bought.” You’re asking whether those bids can actually hold up the price.
🔎 Figure 1 looks at correlation; Figure 2 looks at the real candlesticks and capital flow within the specific time window. Net flow is measured by the subscription/redemption channel—it’s not the same as synchronized buy orders. Here, disclosure timestamps, overnight weekend returns, and macro drivers weren’t included. Also, day-to-day correlation isn’t an actionable backtest, so it can’t be treated as a long-term rule.
💬 If you see consecutive net inflows but the coin price doesn’t rise, do you interpret it as building momentum—or as buying pressure being absorbed by sell pressure? Tell me which price signal you’d wait for.
https://farside.co.uk/btc/
https://farside.co.uk/eth/
https://farside.co.uk/sol/
For discussion only and does not constitute investment advice.
$BTC $ETH $SOL
“ETF is buying again—so it’ll be up tomorrow, right?”😏 I lined up the capital flows and prices of BTC, ETH, and SOL and checked: within this sample, same-direction moves happened on the day, but on the next day there’s hardly any clear signal.
📊 Using Farside’s daily net flow for US spot/pledged ETFs, I compared it with the price up/down moves during Binance’s spot New York session from 9:30 to 16:00, and calculated the Pearson correlation coefficient. The sample covers 12 days from September 15 to October 1. Fund data missing on September 18 and October 2 were uniformly removed.
Same-day correlation: BTC 0.55, ETH 0.37, SOL 0.58. The closer it is to 1, the more it suggests that within this sample there’s a tendency to move up and down together. But 0.58 is not a 58% “win rate” for上涨!When I paired the capital flow with intraday price changes on the next trading day, the three correlations became −0.06, −0.06, and −0.15. This can’t be used to support the idea “if inflows come in today, prices will keep rising tomorrow.”
⚠️ Look at September 23: BTC net inflow was $346.9 million, yet during the same US stock market session it fell 1.20%. And after excluding the day with BTC’s largest net inflow, the same-day correlation dropped from 0.55 to 0.31. The sample is small, and big days have an outsized impact—so you can’t rank buys based on correlation.
My approach is to treat ETFs as a confirmation: watch for continuous net inflows, then a price break above the high from the previous US session, followed by a pullback that holds. Increase your attention when those align. If money keeps coming in but price breaks below the low of the prior session, reduce expectations for a bullish continuation.
You’re not really asking “how much the institution bought.” You’re asking whether those bids can actually hold up the price.
🔎 Figure 1 looks at correlation; Figure 2 looks at the real candlesticks and capital flow within the specific time window. Net flow is measured by the subscription/redemption channel—it’s not the same as synchronized buy orders. Here, disclosure timestamps, overnight weekend returns, and macro drivers weren’t included. Also, day-to-day correlation isn’t an actionable backtest, so it can’t be treated as a long-term rule.
💬 If you see consecutive net inflows but the coin price doesn’t rise, do you interpret it as building momentum—or as buying pressure being absorbed by sell pressure? Tell me which price signal you’d wait for.
https://farside.co.uk/btc/
https://farside.co.uk/eth/
https://farside.co.uk/sol/
For discussion only and does not constitute investment advice.
$BTC $ETH $SOL
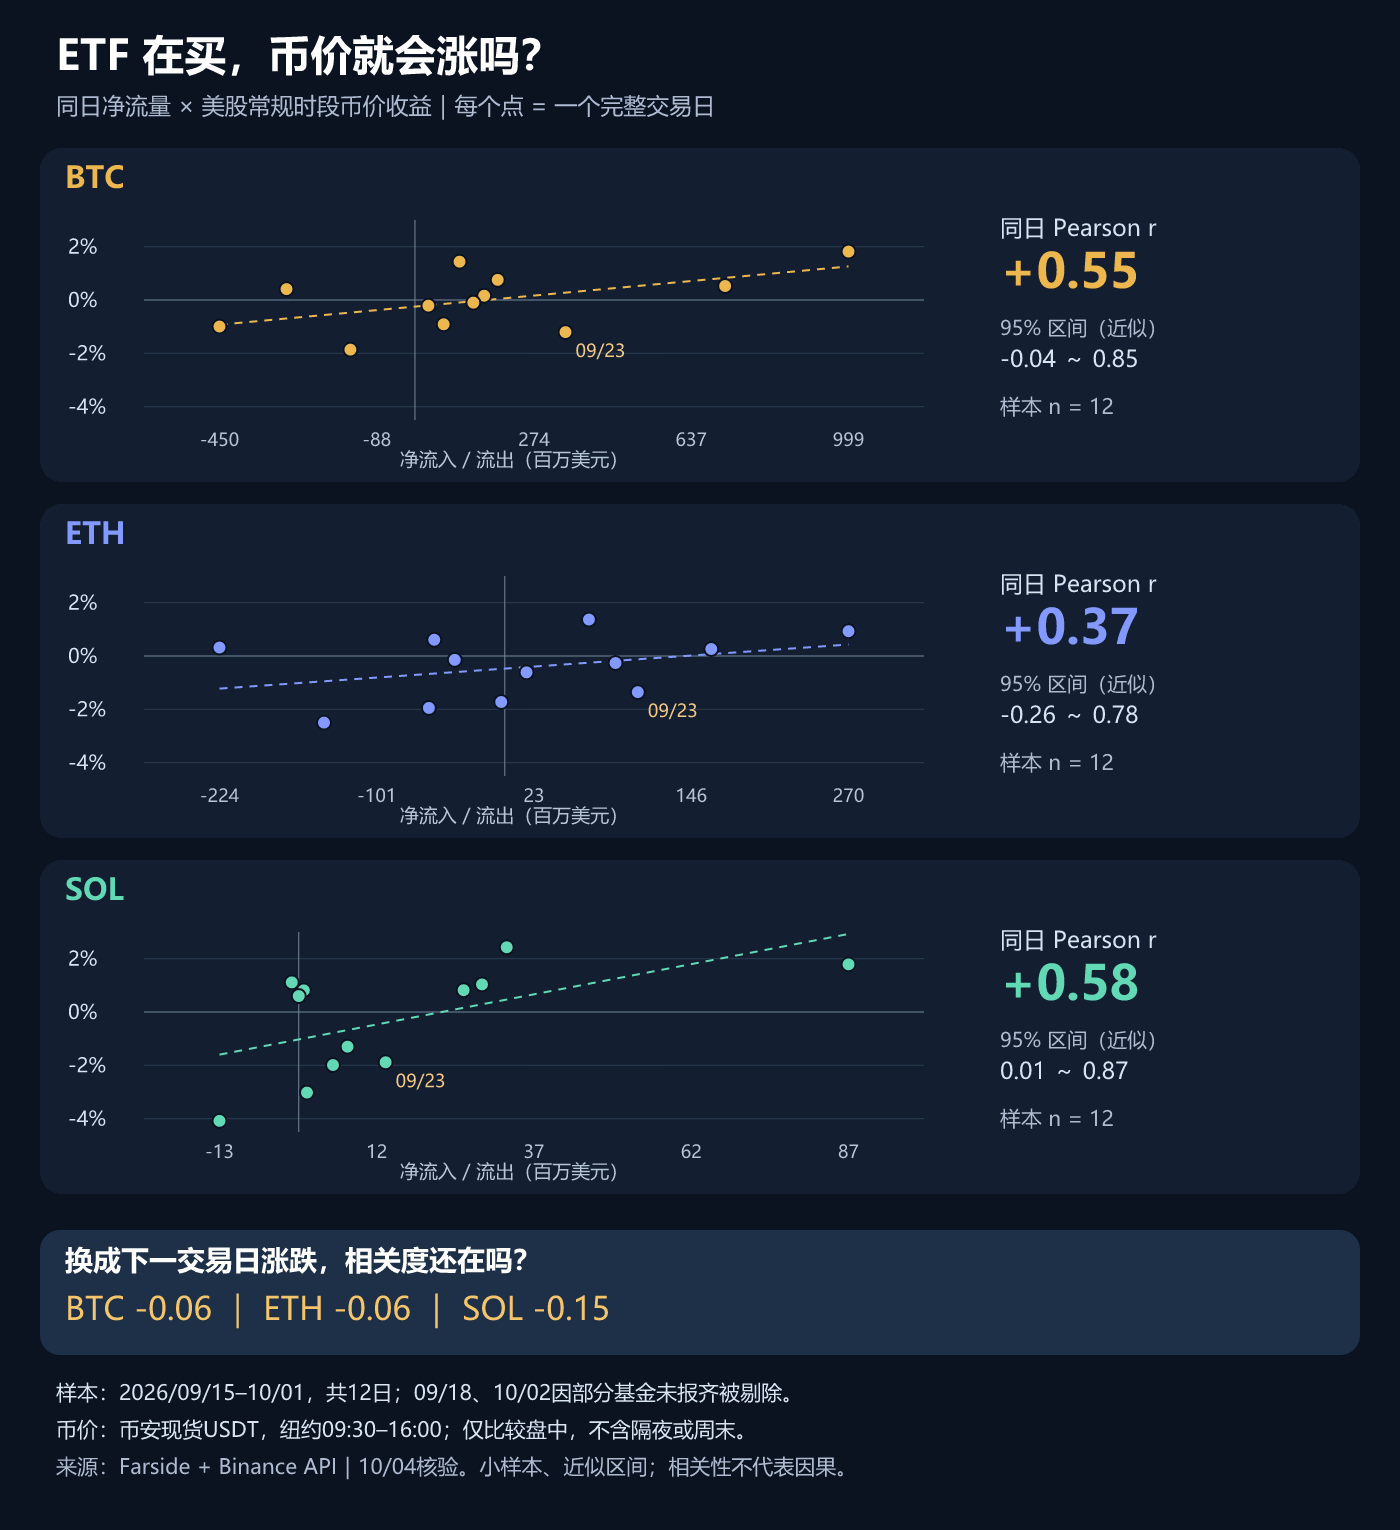
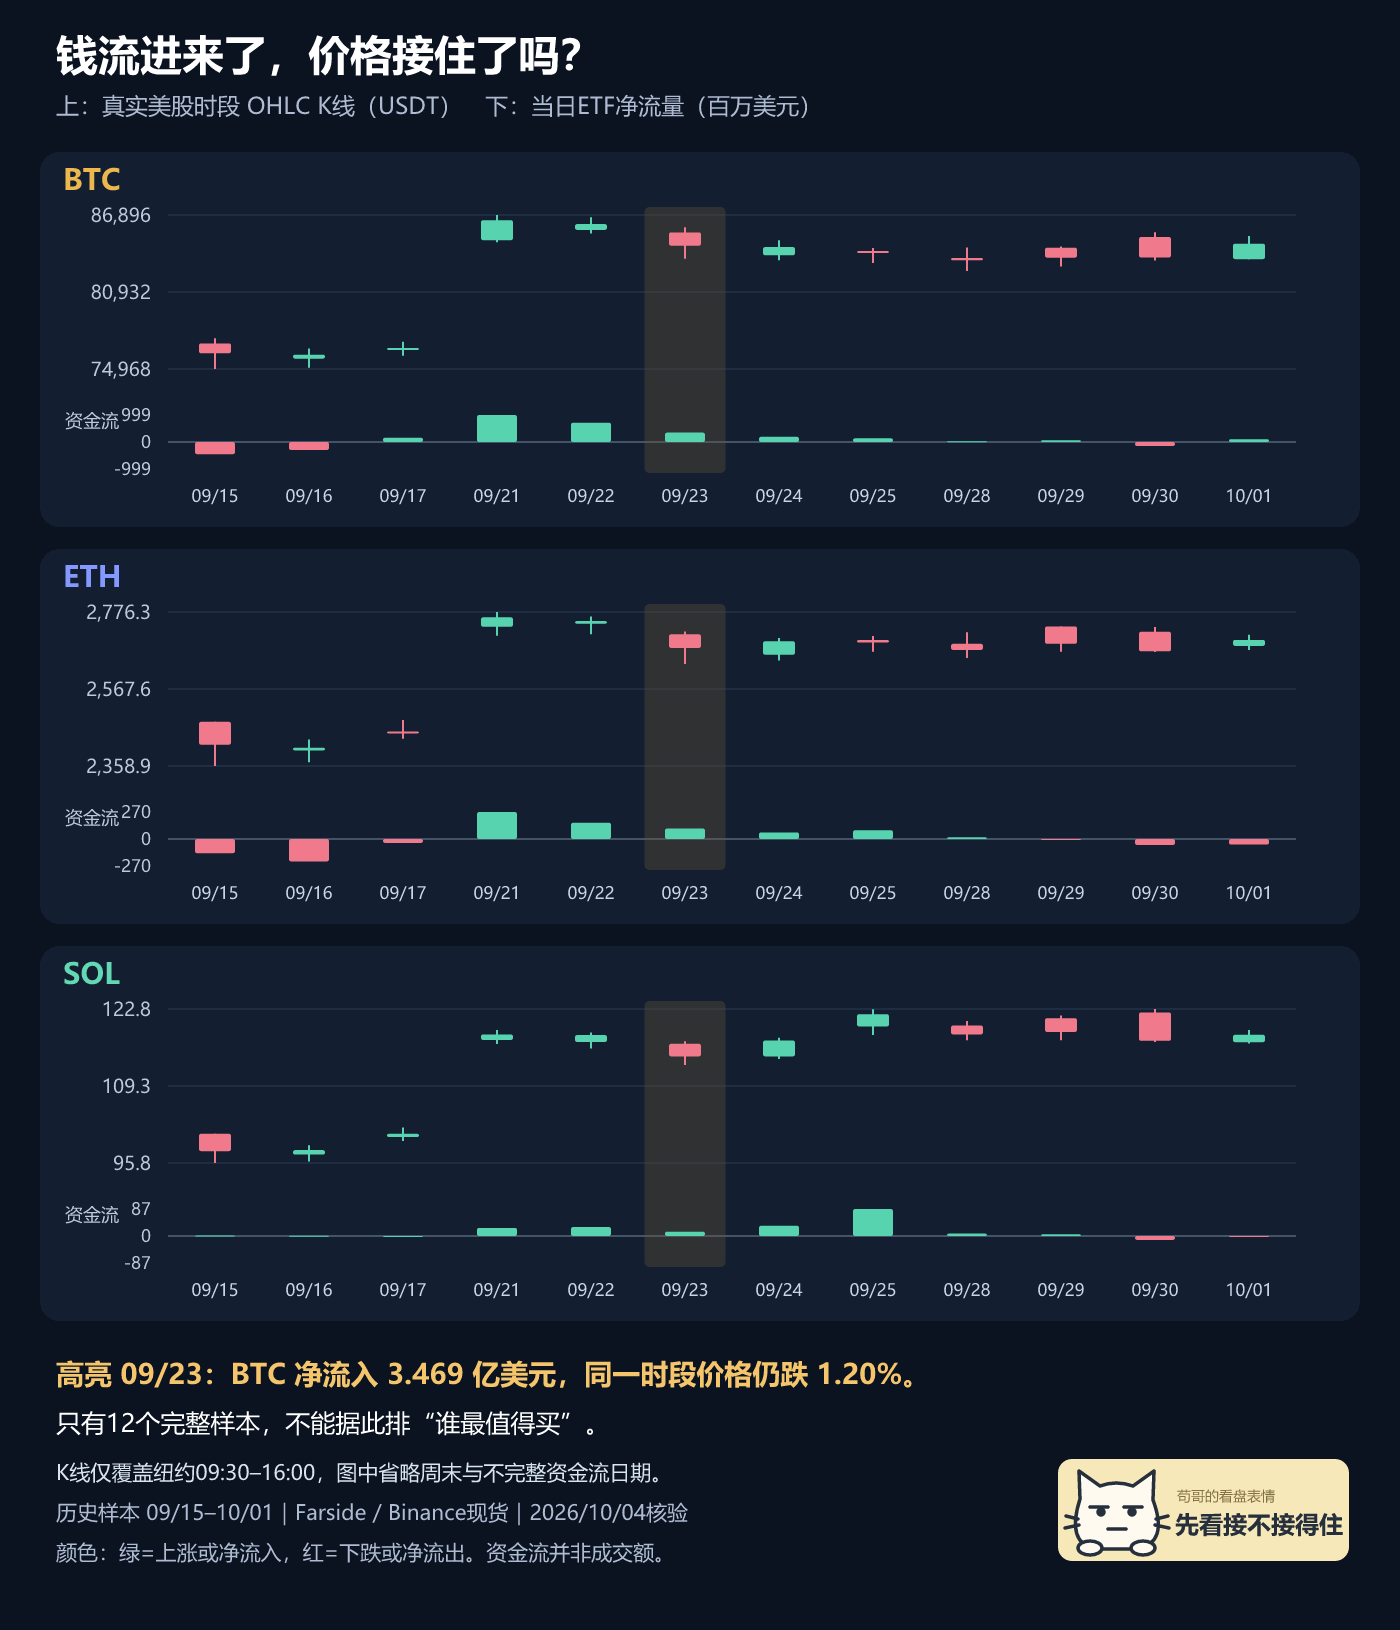
2
1.1k
·
--
How to find coins before they explode? Don’t start chasing from the top of the gainers list
“Can you find the next explosive coin in advance?”😏 I’ll first reframe the question: which coins are worth putting on a watchlist, and what signals mean you should take action? The goal is to filter out random chasing—without needing to know in advance who will explode. My sequence is: tighten the volatility, check relative strength, then wait for equal-price confirmation.
① First, look for accumulation: check whether the 1-hour Bollinger Band width has dropped to a low level for that coin over the past 30 days. When it retests the low, does it start to lift? Low-volume sideways consolidation can only get you onto the watchlist. You still need to verify order-book depth, bid-ask spread, and the unlock schedule. Thin, quiet trading can make the chart look “calm,” so don’t rely on that alone.
② Next, look for initiative: in the same timeframe, if BTC is moving sideways or pulling back, can this coin hold its range and decline less than the broader market? Then check whether spot trading volume heats up in sync. Increasing contract open interest doesn’t automatically mean more longs. If price stays flat while open interest spikes and the funding rate is relatively high, you should be extra careful—leverage can get crowded in the same direction.
③ Only then look for the trigger: for example, a 15-minute close breaks above the highs of the previous 20 candles, and volume exceeds 1.5 times the average volume of the previous 20 candles. After that, you pull back and hold it. This is an example of selection thresholds—you need to backtest per coin; it’s not a universal win-rate formula. A pullback with shrinking volume, followed by an upside push with increasing volume, is more worth following than chasing a single long upper wick intraday.
Here’s a counterexample: Beijing 23:00, the #1 coin AIN had a rolling 24-hour gain of 42.28%, but it had already retraced 33.48% from the window high. The hour’s volume ratio was only 0.35x, and the MACD negative histogram expanded. It looks strong on the list, but it may have already gone through the surge and the subsequent pullback—so don’t treat ranking as a direct “ignition” signal.
⚠️ Write the invalidation conditions before you take action: if, after the breakout, price closes back inside the original range, cancel the breakout assumption. Suppose entry is 10 and stop-loss is 9.7; the risk is 0.3. If the target is only 10.2, then the profit-to-risk ratio (before fees) is just 0.67—not worth forcing a trade just to avoid missing the move. Also, stop-loss orders may slip.
📊 Figure 1|AIN 1h (23:00 Beijing): close 0.0565 USDT, volume ratio 0.35x.
🔎 Figure 2|AIN 15m (23:00 Beijing): close 0.0565 USDT, volume ratio 0.66x.
💬 Do you more often run into “charging in without waiting for confirmation,” or “only noticing after the gainers list shows up”? For the next trade, which additional filter condition are you going to add?
I’ll keep the conditions above, and continue to cross-check using the AIN行情 below.
Source: Binance USDT perpetual market data and AIN’s closed candlesticks; Beijing 2026-10-04 23:00 snapshot. The method thresholds and the 10-yuan example are for teaching assumptions only. The three tags at the end are selected as the top three by rolling 24-hour gain right before release; they are for observation only and do not represent buy recommendations.
For communication only; not investment advice.
$COLLECT $AIN $STRK
How to find coins before they explode? Don’t start chasing from the top of the gainers list
“Can you find the next explosive coin in advance?”😏 I’ll first reframe the question: which coins are worth putting on a watchlist, and what signals mean you should take action? The goal is to filter out random chasing—without needing to know in advance who will explode. My sequence is: tighten the volatility, check relative strength, then wait for equal-price confirmation.
① First, look for accumulation: check whether the 1-hour Bollinger Band width has dropped to a low level for that coin over the past 30 days. When it retests the low, does it start to lift? Low-volume sideways consolidation can only get you onto the watchlist. You still need to verify order-book depth, bid-ask spread, and the unlock schedule. Thin, quiet trading can make the chart look “calm,” so don’t rely on that alone.
② Next, look for initiative: in the same timeframe, if BTC is moving sideways or pulling back, can this coin hold its range and decline less than the broader market? Then check whether spot trading volume heats up in sync. Increasing contract open interest doesn’t automatically mean more longs. If price stays flat while open interest spikes and the funding rate is relatively high, you should be extra careful—leverage can get crowded in the same direction.
③ Only then look for the trigger: for example, a 15-minute close breaks above the highs of the previous 20 candles, and volume exceeds 1.5 times the average volume of the previous 20 candles. After that, you pull back and hold it. This is an example of selection thresholds—you need to backtest per coin; it’s not a universal win-rate formula. A pullback with shrinking volume, followed by an upside push with increasing volume, is more worth following than chasing a single long upper wick intraday.
Here’s a counterexample: Beijing 23:00, the #1 coin AIN had a rolling 24-hour gain of 42.28%, but it had already retraced 33.48% from the window high. The hour’s volume ratio was only 0.35x, and the MACD negative histogram expanded. It looks strong on the list, but it may have already gone through the surge and the subsequent pullback—so don’t treat ranking as a direct “ignition” signal.
⚠️ Write the invalidation conditions before you take action: if, after the breakout, price closes back inside the original range, cancel the breakout assumption. Suppose entry is 10 and stop-loss is 9.7; the risk is 0.3. If the target is only 10.2, then the profit-to-risk ratio (before fees) is just 0.67—not worth forcing a trade just to avoid missing the move. Also, stop-loss orders may slip.
📊 Figure 1|AIN 1h (23:00 Beijing): close 0.0565 USDT, volume ratio 0.35x.
🔎 Figure 2|AIN 15m (23:00 Beijing): close 0.0565 USDT, volume ratio 0.66x.
💬 Do you more often run into “charging in without waiting for confirmation,” or “only noticing after the gainers list shows up”? For the next trade, which additional filter condition are you going to add?
I’ll keep the conditions above, and continue to cross-check using the AIN行情 below.
Source: Binance USDT perpetual market data and AIN’s closed candlesticks; Beijing 2026-10-04 23:00 snapshot. The method thresholds and the 10-yuan example are for teaching assumptions only. The three tags at the end are selected as the top three by rolling 24-hour gain right before release; they are for observation only and do not represent buy recommendations.
For communication only; not investment advice.
$COLLECT $AIN $STRK
“Can you find the next explosive coin in advance?”😏 I’ll first reframe the question: which coins are worth putting on a watchlist, and what signals mean you should take action? The goal is to filter out random chasing—without needing to know in advance who will explode. My sequence is: tighten the volatility, check relative strength, then wait for equal-price confirmation.
① First, look for accumulation: check whether the 1-hour Bollinger Band width has dropped to a low level for that coin over the past 30 days. When it retests the low, does it start to lift? Low-volume sideways consolidation can only get you onto the watchlist. You still need to verify order-book depth, bid-ask spread, and the unlock schedule. Thin, quiet trading can make the chart look “calm,” so don’t rely on that alone.
② Next, look for initiative: in the same timeframe, if BTC is moving sideways or pulling back, can this coin hold its range and decline less than the broader market? Then check whether spot trading volume heats up in sync. Increasing contract open interest doesn’t automatically mean more longs. If price stays flat while open interest spikes and the funding rate is relatively high, you should be extra careful—leverage can get crowded in the same direction.
③ Only then look for the trigger: for example, a 15-minute close breaks above the highs of the previous 20 candles, and volume exceeds 1.5 times the average volume of the previous 20 candles. After that, you pull back and hold it. This is an example of selection thresholds—you need to backtest per coin; it’s not a universal win-rate formula. A pullback with shrinking volume, followed by an upside push with increasing volume, is more worth following than chasing a single long upper wick intraday.
Here’s a counterexample: Beijing 23:00, the #1 coin AIN had a rolling 24-hour gain of 42.28%, but it had already retraced 33.48% from the window high. The hour’s volume ratio was only 0.35x, and the MACD negative histogram expanded. It looks strong on the list, but it may have already gone through the surge and the subsequent pullback—so don’t treat ranking as a direct “ignition” signal.
⚠️ Write the invalidation conditions before you take action: if, after the breakout, price closes back inside the original range, cancel the breakout assumption. Suppose entry is 10 and stop-loss is 9.7; the risk is 0.3. If the target is only 10.2, then the profit-to-risk ratio (before fees) is just 0.67—not worth forcing a trade just to avoid missing the move. Also, stop-loss orders may slip.
📊 Figure 1|AIN 1h (23:00 Beijing): close 0.0565 USDT, volume ratio 0.35x.
🔎 Figure 2|AIN 15m (23:00 Beijing): close 0.0565 USDT, volume ratio 0.66x.
💬 Do you more often run into “charging in without waiting for confirmation,” or “only noticing after the gainers list shows up”? For the next trade, which additional filter condition are you going to add?
I’ll keep the conditions above, and continue to cross-check using the AIN行情 below.
Source: Binance USDT perpetual market data and AIN’s closed candlesticks; Beijing 2026-10-04 23:00 snapshot. The method thresholds and the 10-yuan example are for teaching assumptions only. The three tags at the end are selected as the top three by rolling 24-hour gain right before release; they are for observation only and do not represent buy recommendations.
For communication only; not investment advice.
$COLLECT $AIN $STRK
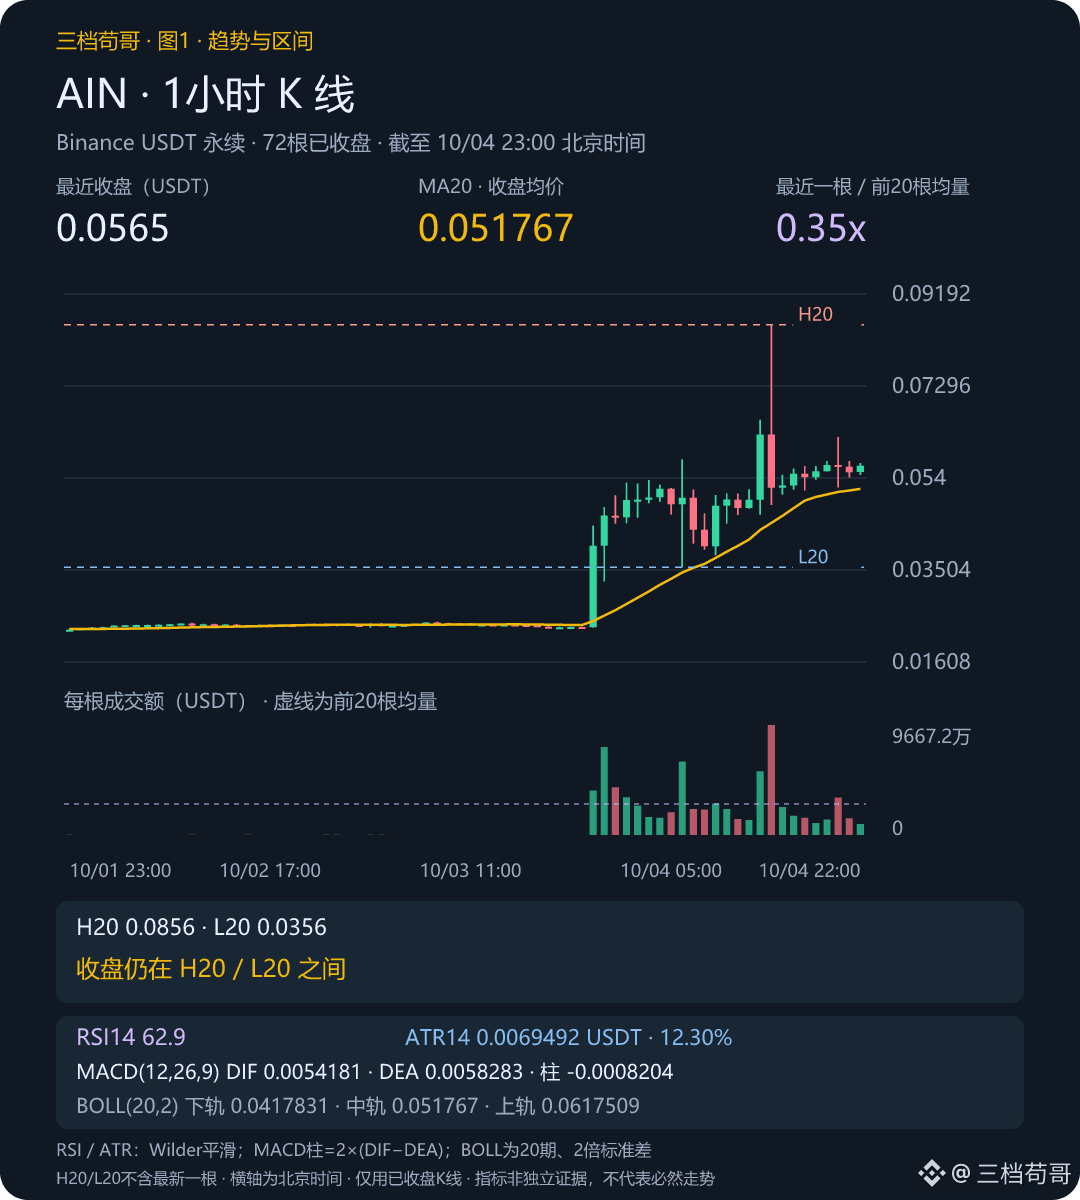
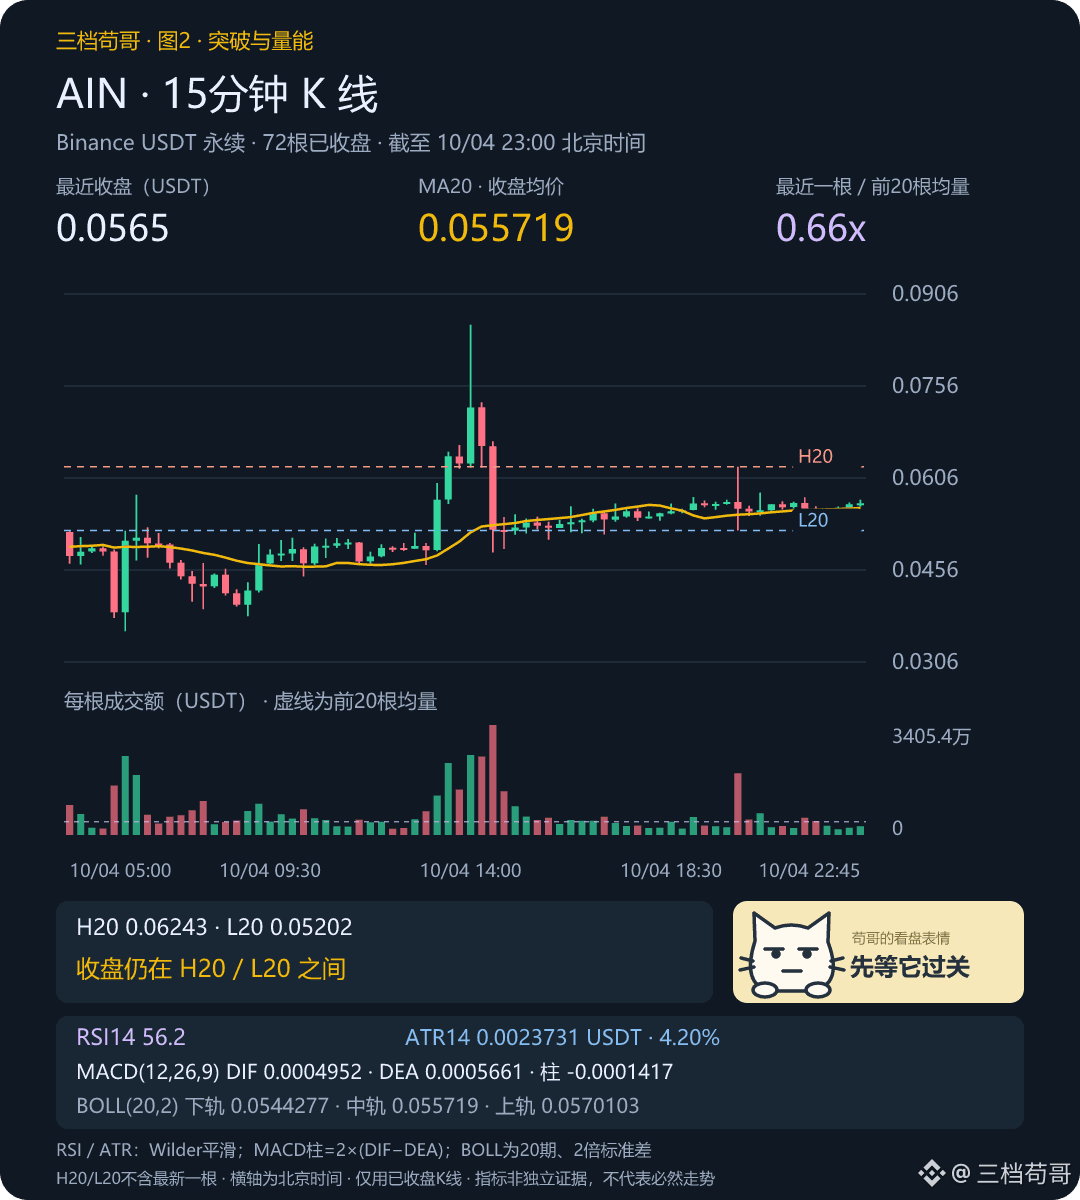
348
·
--
STRK: Bias towards continued upward probing; observe level STRK 0.05974 USDT
In the next 1–4 hours, I am more inclined to believe STRK will continue to probe upward. The first observation level is set at STRK 0.05974 USDT—when price gets close, verify the follow-through and volume/energy there. It looks promising, but let’s put the champagne in the fridge first.😏
In the same rolling 24 hours, STRK is up 30.23%, leading BTC by 29.73 percentage points. This advantage gives a reason to keep watching, but what I care more about is whether the advantage can be maintained when a pullback comes. If the advantage fades, then expectations for independent strength should be lowered.
📊 Chart 1|1-hour as of 23:00 Beijing time: The close has already broken above the highs of the previous 20 candles. The latest 3 MA20s are lifting, and the close is above them; volume is 2.64 times the average volume of the previous 20 candles—this time the change is accompanied by increased volume.
🔎 Chart 2|STRK 15-minute as of 23:00 Beijing time: The close is above MA20; volume is 1.57 times the average volume; the latest 3 MA20s are lifting. On the smaller timeframe, there’s no obvious contradiction—we’ll first see whether this alignment can carry into the next closing.
🧭 RSI14 73.4, MACD negative columns contracting: momentum is strong but it’s already a bit hot; don’t chase based on that. ATR14 is 0.0020424 USDT, about 3.56% of the closing price—used to gauge potential volatility range.
→ Main scenario: If the pullback does not break down below STRK 0.05696 USDT, bias towards testing up toward STRK 0.05974 USDT. The observation level is taken from the highest price of the latest 20 closed K-lines (including the most recent one). Once it gets close, judge the breakout strength again.
⚠️ If the close within the next 1 hour falls back below STRK 0.05696 USDT, then the original judgment is canceled. That line is based on the old highs of the previous 20 candles; at that point, switch focus to STRK 0.0498 USDT. Touching with the wicks isn’t enough—if it moves outside the time window, reassess.
💬 Do you agree more with probing upward first, or with the idea that bounces are likely to give back quickly? Also share what evidence on the chart makes you think that.
I’ll keep the conditions above and continue to cross-check using the STRK price action below.
Source: Binance USDT Perpetuals|Rolling 24 hours|2026/10/4 23:00:13 Beijing time.
For discussion only; not investment advice.
$BTC $ETH $STRK
STRK: Bias towards continued upward probing; observe level STRK 0.05974 USDT
In the next 1–4 hours, I am more inclined to believe STRK will continue to probe upward. The first observation level is set at STRK 0.05974 USDT—when price gets close, verify the follow-through and volume/energy there. It looks promising, but let’s put the champagne in the fridge first.😏
In the same rolling 24 hours, STRK is up 30.23%, leading BTC by 29.73 percentage points. This advantage gives a reason to keep watching, but what I care more about is whether the advantage can be maintained when a pullback comes. If the advantage fades, then expectations for independent strength should be lowered.
📊 Chart 1|1-hour as of 23:00 Beijing time: The close has already broken above the highs of the previous 20 candles. The latest 3 MA20s are lifting, and the close is above them; volume is 2.64 times the average volume of the previous 20 candles—this time the change is accompanied by increased volume.
🔎 Chart 2|STRK 15-minute as of 23:00 Beijing time: The close is above MA20; volume is 1.57 times the average volume; the latest 3 MA20s are lifting. On the smaller timeframe, there’s no obvious contradiction—we’ll first see whether this alignment can carry into the next closing.
🧭 RSI14 73.4, MACD negative columns contracting: momentum is strong but it’s already a bit hot; don’t chase based on that. ATR14 is 0.0020424 USDT, about 3.56% of the closing price—used to gauge potential volatility range.
→ Main scenario: If the pullback does not break down below STRK 0.05696 USDT, bias towards testing up toward STRK 0.05974 USDT. The observation level is taken from the highest price of the latest 20 closed K-lines (including the most recent one). Once it gets close, judge the breakout strength again.
⚠️ If the close within the next 1 hour falls back below STRK 0.05696 USDT, then the original judgment is canceled. That line is based on the old highs of the previous 20 candles; at that point, switch focus to STRK 0.0498 USDT. Touching with the wicks isn’t enough—if it moves outside the time window, reassess.
💬 Do you agree more with probing upward first, or with the idea that bounces are likely to give back quickly? Also share what evidence on the chart makes you think that.
I’ll keep the conditions above and continue to cross-check using the STRK price action below.
Source: Binance USDT Perpetuals|Rolling 24 hours|2026/10/4 23:00:13 Beijing time.
For discussion only; not investment advice.
$BTC $ETH $STRK
In the next 1–4 hours, I am more inclined to believe STRK will continue to probe upward. The first observation level is set at STRK 0.05974 USDT—when price gets close, verify the follow-through and volume/energy there. It looks promising, but let’s put the champagne in the fridge first.😏
In the same rolling 24 hours, STRK is up 30.23%, leading BTC by 29.73 percentage points. This advantage gives a reason to keep watching, but what I care more about is whether the advantage can be maintained when a pullback comes. If the advantage fades, then expectations for independent strength should be lowered.
📊 Chart 1|1-hour as of 23:00 Beijing time: The close has already broken above the highs of the previous 20 candles. The latest 3 MA20s are lifting, and the close is above them; volume is 2.64 times the average volume of the previous 20 candles—this time the change is accompanied by increased volume.
🔎 Chart 2|STRK 15-minute as of 23:00 Beijing time: The close is above MA20; volume is 1.57 times the average volume; the latest 3 MA20s are lifting. On the smaller timeframe, there’s no obvious contradiction—we’ll first see whether this alignment can carry into the next closing.
🧭 RSI14 73.4, MACD negative columns contracting: momentum is strong but it’s already a bit hot; don’t chase based on that. ATR14 is 0.0020424 USDT, about 3.56% of the closing price—used to gauge potential volatility range.
→ Main scenario: If the pullback does not break down below STRK 0.05696 USDT, bias towards testing up toward STRK 0.05974 USDT. The observation level is taken from the highest price of the latest 20 closed K-lines (including the most recent one). Once it gets close, judge the breakout strength again.
⚠️ If the close within the next 1 hour falls back below STRK 0.05696 USDT, then the original judgment is canceled. That line is based on the old highs of the previous 20 candles; at that point, switch focus to STRK 0.0498 USDT. Touching with the wicks isn’t enough—if it moves outside the time window, reassess.
💬 Do you agree more with probing upward first, or with the idea that bounces are likely to give back quickly? Also share what evidence on the chart makes you think that.
I’ll keep the conditions above and continue to cross-check using the STRK price action below.
Source: Binance USDT Perpetuals|Rolling 24 hours|2026/10/4 23:00:13 Beijing time.
For discussion only; not investment advice.
$BTC $ETH $STRK
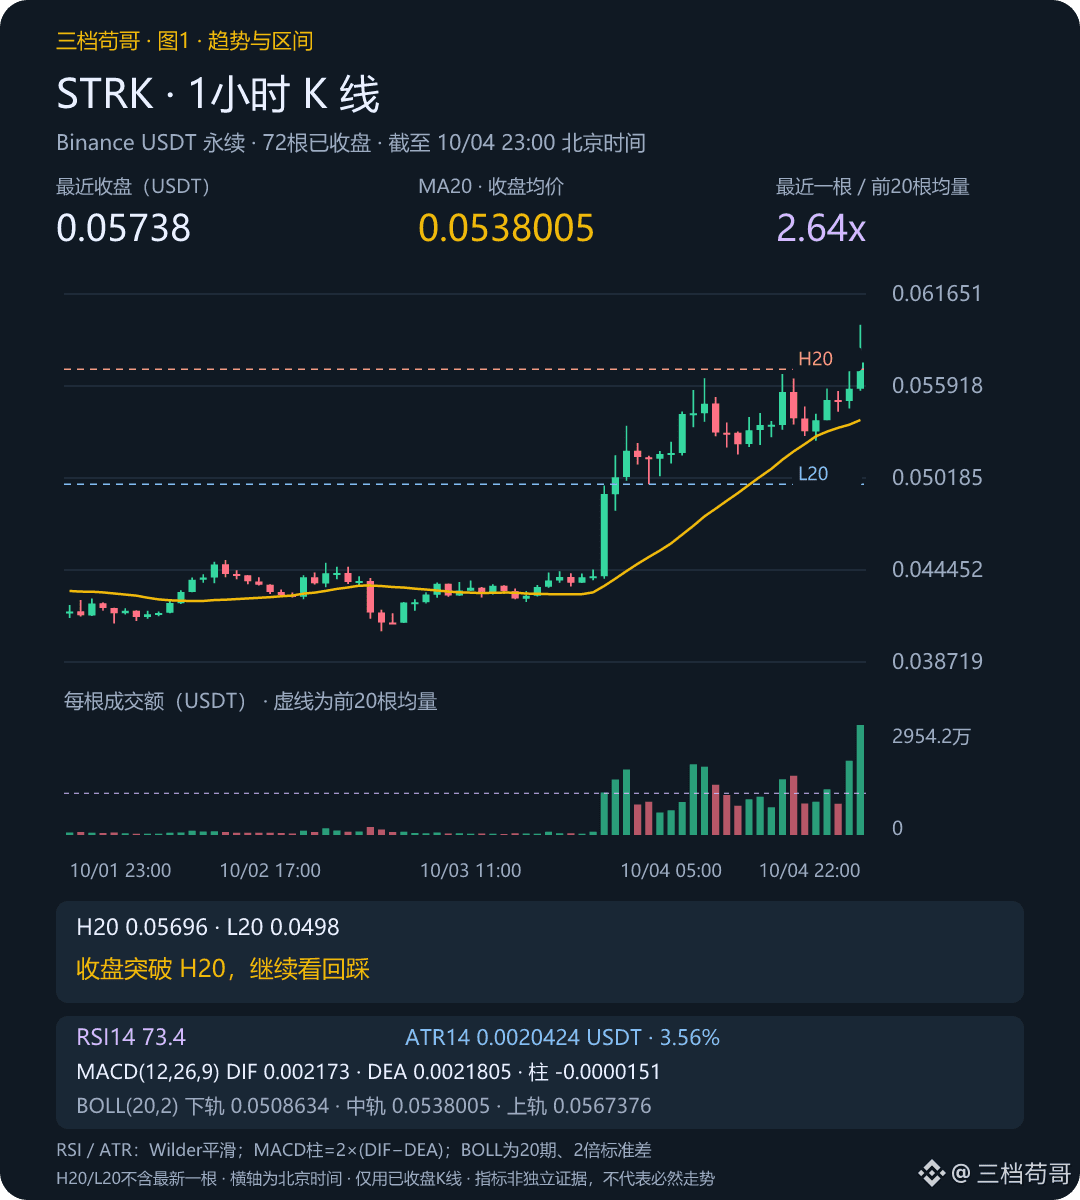
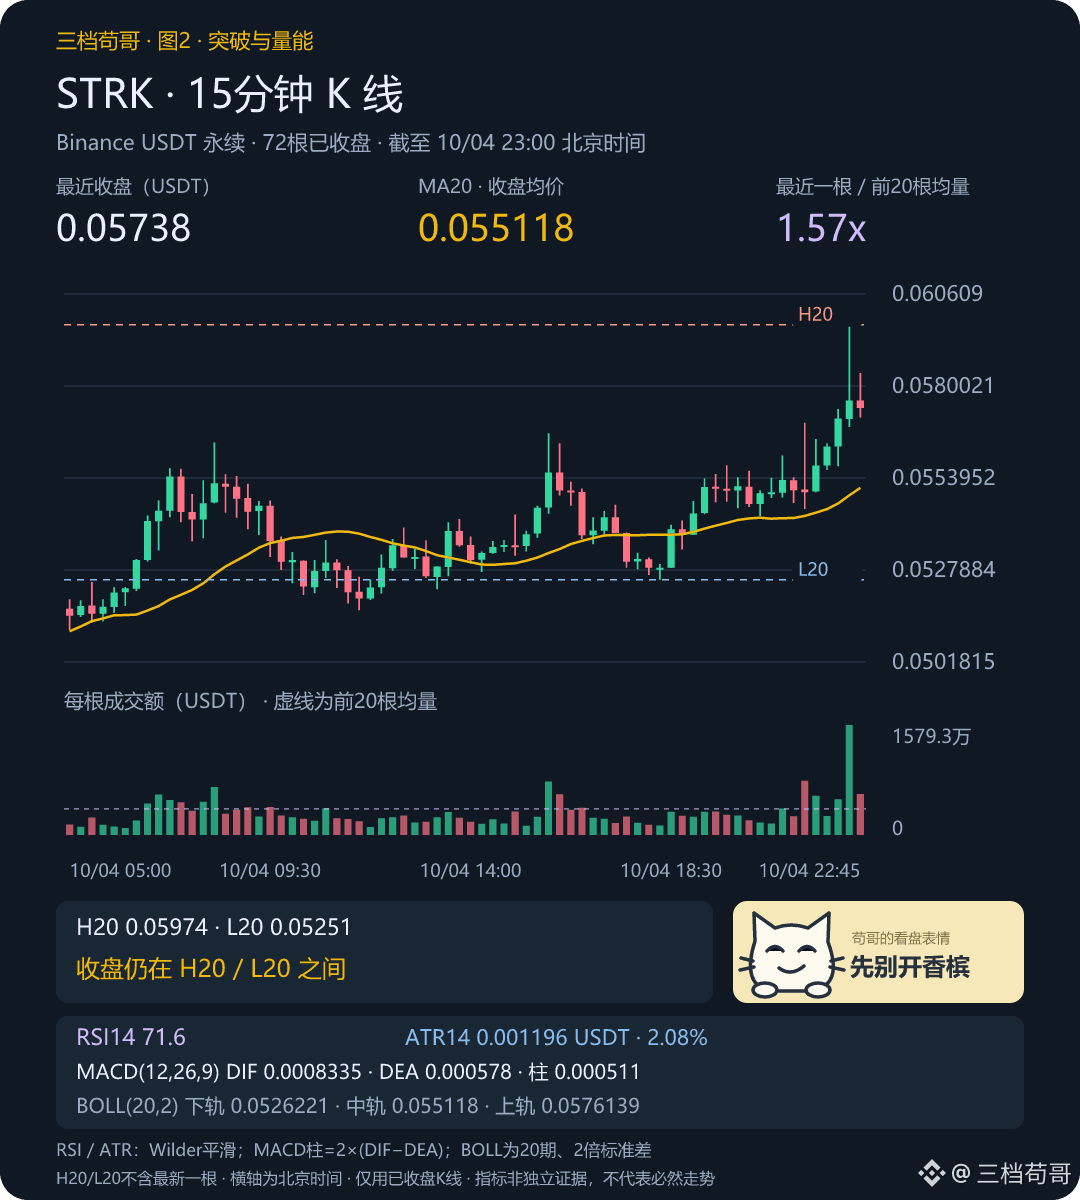
380
·
--
SNDK saw increased volume, but I’m not chasing this breakout yet
When you see the trade volume ramp up, the first thought is: should I jump in now? 😏 I’ll first calculate how much room is left—after all, even if volume comes, you still need the price to clear the level.
This article covers the Binance SNDKUSDT perpetual, with price levels in USDT units; it can’t be applied to the spot stock. The Beijing time report at 22:28 on Oct 4 was 1719, up 0.17% over the past 24 hours.
As of 22:00, the hour’s trading volume reached 1.87 times the average volume of the previous 20 candles. RSI returned to 51.7, and the MACD positive histogram bars expanded: it suggests the repair move has participation. However, the DIF is still below the zero line, and MA20 remains below MA50—so for now I’ll treat it as a bullish repair, but the trend hasn’t been confirmed.
The key is 1721.38—this was the previous 20 hourly candles’ high, and also the 24-hour high. From 1719 to here is only about 0.14%, not even accounting for fees and slippage. The 15-minute MACD positive histogram is also shrinking again; the smaller timeframe is cooling off, so chasing is not great in terms of cost-effectiveness.
→ Over the next 1–4 hours, I’ll first see whether 1718.17 can hold and absorb demand, then try again at 1721.38. Only if the 15-minute candle closes above the upper band, with volume greater than 1.2x the average volume of the prior 20 candles, and a pullback holds the level—then I’ll upgrade the assessment of a breakout extension.
If after breaking it, price falls back below 1721.38, I’ll cancel the breakout thesis and won’t interpret the move back as a “bull trap.”
⚠️ If a 15-minute close breaks below 1718.17, the hourly MA20 observation line, I’ll first look at the recent 15-minute range low at 1716.75. A wick touching isn’t enough—you still need a closing confirmation. Hourly ATR is about 2.62 USDT; it only indicates the recent volatility scale and can’t predict the upside magnitude. After the window ends, I’ll recalculate based on the new candles.
📊 Fig. 1|SNDK 1h (22:00 Beijing): close 1,720.57 USDT, volume ratio 1.87x.
🔎 Fig. 2|SNDK 15m (22:30 Beijing): close 1,719.11 USDT, volume ratio 0.99x.
💬 Will you wait for volume to come in and 1721.38 to hold steady, or will you only trade the pullback for confirmation/absorption? Which signal would make you cancel entering?
If you want to keep following, you can verify the conditions against the SNDK price action below.
Source: Binance SNDKUSDT perpetual; Beijing time 22:28 on 2026-10-04 quote, based on the 1-hour candle at 22:00 and the 15-minute candle at 22:15. Average volume is calculated from the previous 20 candles; the chart snapshot refreshes before release.
For discussion only; not investment advice.
$BTC $ETH $SNDK
SNDK saw increased volume, but I’m not chasing this breakout yet
When you see the trade volume ramp up, the first thought is: should I jump in now? 😏 I’ll first calculate how much room is left—after all, even if volume comes, you still need the price to clear the level.
This article covers the Binance SNDKUSDT perpetual, with price levels in USDT units; it can’t be applied to the spot stock. The Beijing time report at 22:28 on Oct 4 was 1719, up 0.17% over the past 24 hours.
As of 22:00, the hour’s trading volume reached 1.87 times the average volume of the previous 20 candles. RSI returned to 51.7, and the MACD positive histogram bars expanded: it suggests the repair move has participation. However, the DIF is still below the zero line, and MA20 remains below MA50—so for now I’ll treat it as a bullish repair, but the trend hasn’t been confirmed.
The key is 1721.38—this was the previous 20 hourly candles’ high, and also the 24-hour high. From 1719 to here is only about 0.14%, not even accounting for fees and slippage. The 15-minute MACD positive histogram is also shrinking again; the smaller timeframe is cooling off, so chasing is not great in terms of cost-effectiveness.
→ Over the next 1–4 hours, I’ll first see whether 1718.17 can hold and absorb demand, then try again at 1721.38. Only if the 15-minute candle closes above the upper band, with volume greater than 1.2x the average volume of the prior 20 candles, and a pullback holds the level—then I’ll upgrade the assessment of a breakout extension.
If after breaking it, price falls back below 1721.38, I’ll cancel the breakout thesis and won’t interpret the move back as a “bull trap.”
⚠️ If a 15-minute close breaks below 1718.17, the hourly MA20 observation line, I’ll first look at the recent 15-minute range low at 1716.75. A wick touching isn’t enough—you still need a closing confirmation. Hourly ATR is about 2.62 USDT; it only indicates the recent volatility scale and can’t predict the upside magnitude. After the window ends, I’ll recalculate based on the new candles.
📊 Fig. 1|SNDK 1h (22:00 Beijing): close 1,720.57 USDT, volume ratio 1.87x.
🔎 Fig. 2|SNDK 15m (22:30 Beijing): close 1,719.11 USDT, volume ratio 0.99x.
💬 Will you wait for volume to come in and 1721.38 to hold steady, or will you only trade the pullback for confirmation/absorption? Which signal would make you cancel entering?
If you want to keep following, you can verify the conditions against the SNDK price action below.
Source: Binance SNDKUSDT perpetual; Beijing time 22:28 on 2026-10-04 quote, based on the 1-hour candle at 22:00 and the 15-minute candle at 22:15. Average volume is calculated from the previous 20 candles; the chart snapshot refreshes before release.
For discussion only; not investment advice.
$BTC $ETH $SNDK
When you see the trade volume ramp up, the first thought is: should I jump in now? 😏 I’ll first calculate how much room is left—after all, even if volume comes, you still need the price to clear the level.
This article covers the Binance SNDKUSDT perpetual, with price levels in USDT units; it can’t be applied to the spot stock. The Beijing time report at 22:28 on Oct 4 was 1719, up 0.17% over the past 24 hours.
As of 22:00, the hour’s trading volume reached 1.87 times the average volume of the previous 20 candles. RSI returned to 51.7, and the MACD positive histogram bars expanded: it suggests the repair move has participation. However, the DIF is still below the zero line, and MA20 remains below MA50—so for now I’ll treat it as a bullish repair, but the trend hasn’t been confirmed.
The key is 1721.38—this was the previous 20 hourly candles’ high, and also the 24-hour high. From 1719 to here is only about 0.14%, not even accounting for fees and slippage. The 15-minute MACD positive histogram is also shrinking again; the smaller timeframe is cooling off, so chasing is not great in terms of cost-effectiveness.
→ Over the next 1–4 hours, I’ll first see whether 1718.17 can hold and absorb demand, then try again at 1721.38. Only if the 15-minute candle closes above the upper band, with volume greater than 1.2x the average volume of the prior 20 candles, and a pullback holds the level—then I’ll upgrade the assessment of a breakout extension.
If after breaking it, price falls back below 1721.38, I’ll cancel the breakout thesis and won’t interpret the move back as a “bull trap.”
⚠️ If a 15-minute close breaks below 1718.17, the hourly MA20 observation line, I’ll first look at the recent 15-minute range low at 1716.75. A wick touching isn’t enough—you still need a closing confirmation. Hourly ATR is about 2.62 USDT; it only indicates the recent volatility scale and can’t predict the upside magnitude. After the window ends, I’ll recalculate based on the new candles.
📊 Fig. 1|SNDK 1h (22:00 Beijing): close 1,720.57 USDT, volume ratio 1.87x.
🔎 Fig. 2|SNDK 15m (22:30 Beijing): close 1,719.11 USDT, volume ratio 0.99x.
💬 Will you wait for volume to come in and 1721.38 to hold steady, or will you only trade the pullback for confirmation/absorption? Which signal would make you cancel entering?
If you want to keep following, you can verify the conditions against the SNDK price action below.
Source: Binance SNDKUSDT perpetual; Beijing time 22:28 on 2026-10-04 quote, based on the 1-hour candle at 22:00 and the 15-minute candle at 22:15. Average volume is calculated from the previous 20 candles; the chart snapshot refreshes before release.
For discussion only; not investment advice.
$BTC $ETH $SNDK
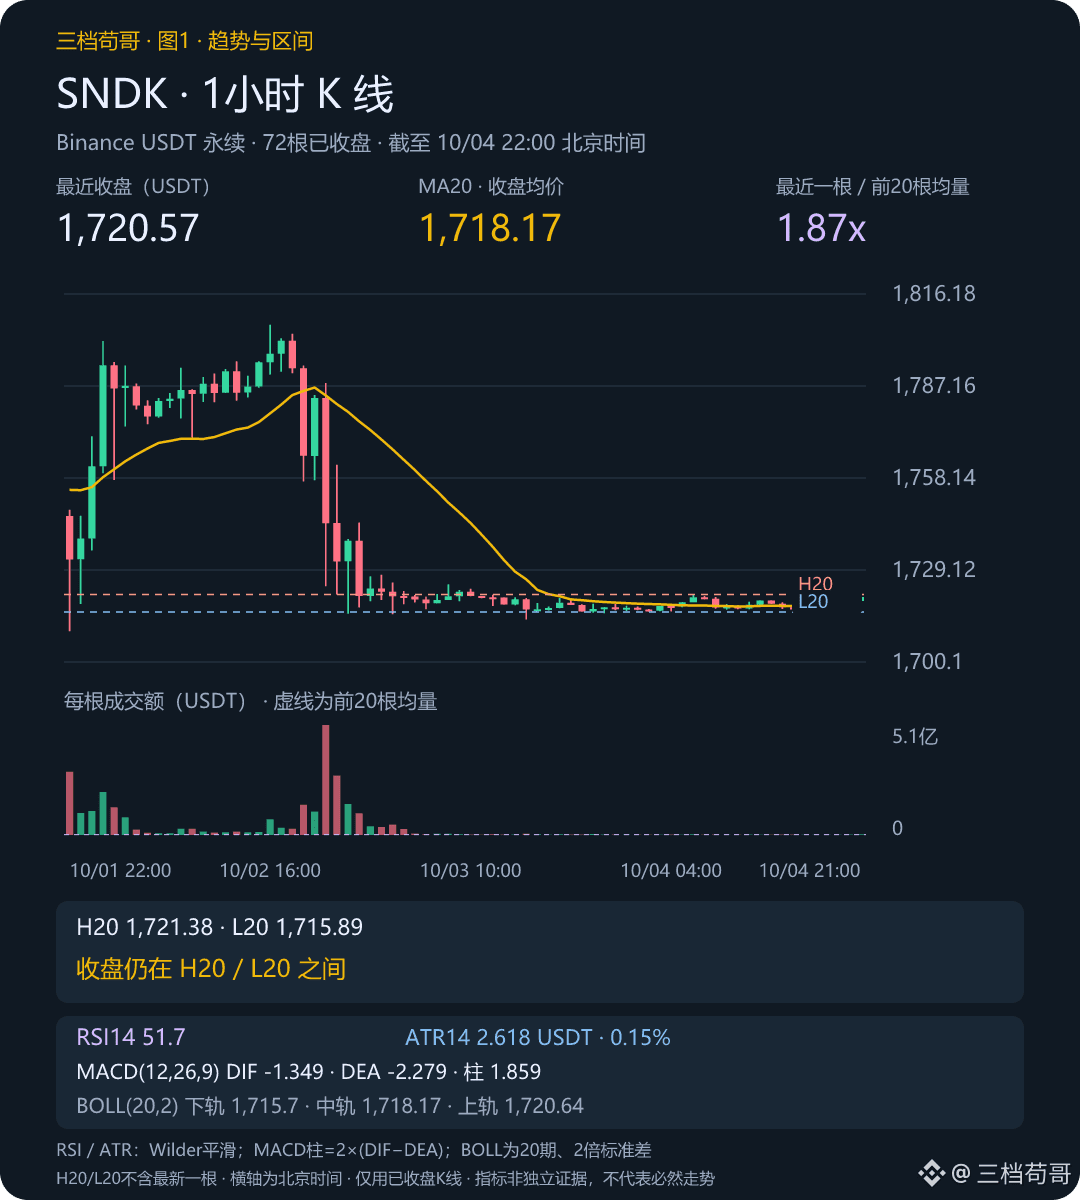
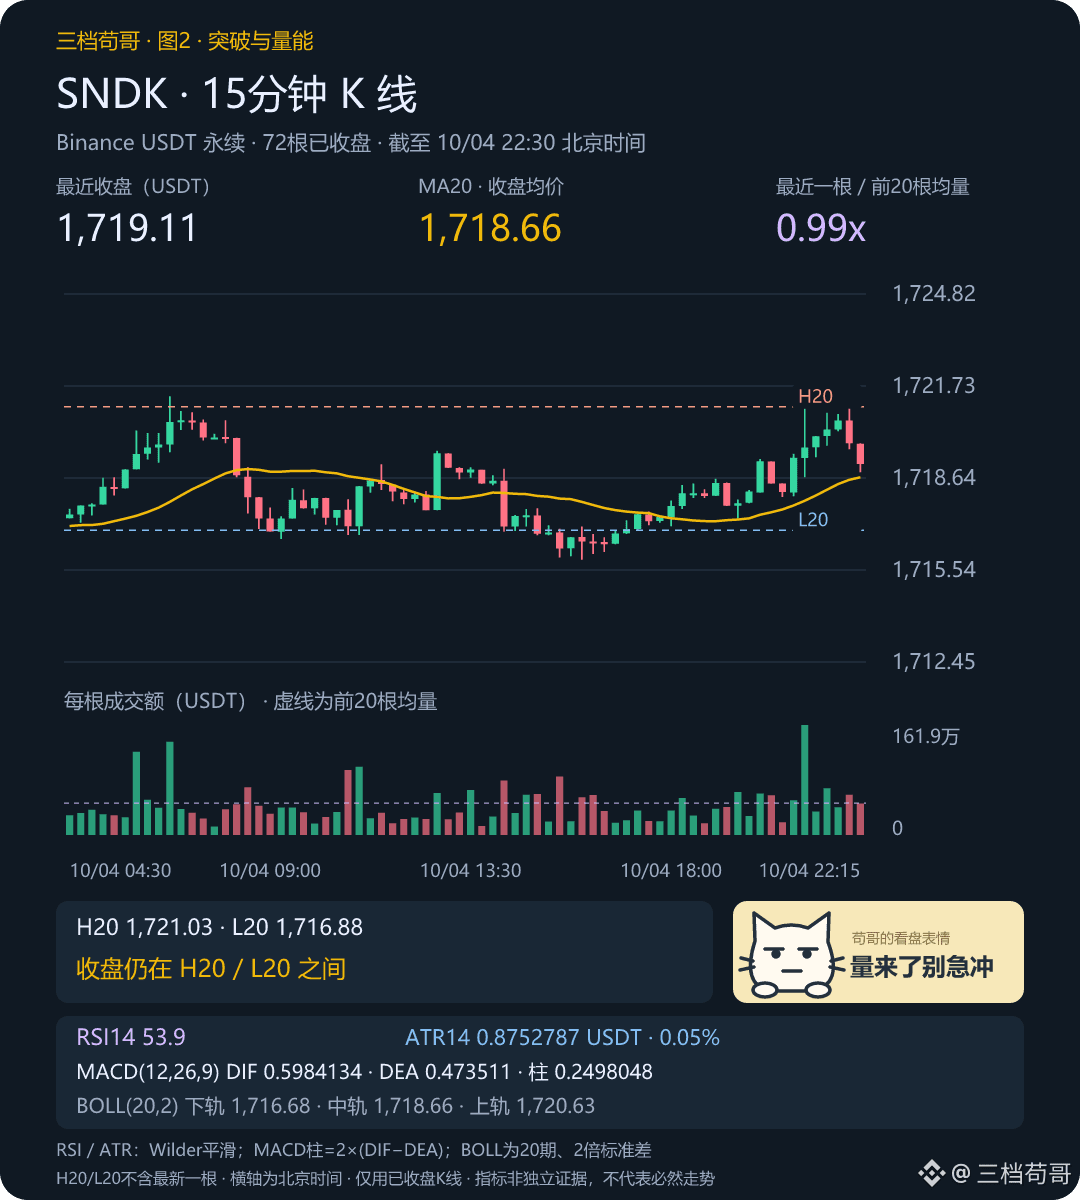
439
·
--
BEAMX: First oscillate, then try the upper range; watch the level. BEAMX 0.003043 USDT
In the next 1–4 hours, I’m more inclined to expect BEAMX to first range, then retest the upper move. The first observation level is at BEAMX 0.003043 USDT. Since the smaller timeframes haven’t lined up yet, it may first keep probing back and forth. It looks promising, but save the champagne for the fridge first. 😏
📊 Fig. 1|1-hour as of 22:00 Beijing time: The close is still within the top-20 range of candles. The last three MA20 lifts are pushing up, and the close is above it. Volume is 2.18× the average of the last top-20 candles; this time the position change has come with a volume expansion.
🔎 Fig. 2|BEAMX 15-minute as of 22:15 Beijing time: The close is below MA20. Volume is 0.48× the average, and MA20 is still trending downward. Since the smaller timeframe hasn’t coordinated with the main view yet, it’s more likely to tug and pull first rather than run straight to the observation level.
🧭 RSI14 is 68.0, and the MACD histogram bars are shrinking (positive bars contracting). Momentum is slightly bullish—check it together with the price structure. ATR14 is 0.0001192 USDT, about 4.39% of the closing price; used to gauge room for fluctuation.
→ Main scenario: If the pullback holds without breaking BEAMX 0.0023886 USDT, it favors testing upward toward BEAMX 0.003043 USDT. The observation level is taken from the highest price of the most recent 20 closed K-lines (including the latest one). Once it gets close, then judge the breakout strength.
⚠️ If, by the close of the next 1 hour, price falls back below BEAMX 0.0023886 USDT, the original view is canceled. That’s the MA20 baseline observation line; at that time we switch to watching BEAMX 0.002114 USDT. A wick touching it isn’t enough—once it goes beyond the time window, reassess.
💬 Do you agree more with trying upward first (probing), or with a rebound that’s easy to give back? Also share which piece of evidence on the chart makes you think that way.
If you want to keep following it, you can verify the conditions above with the BEAMX price action below.
Coin included in the day’s ranking list; current gain ranks 4th. Source: Binance USDT Perpetual|Rolling 24 hours|2026/10/4 22:27:37 Beijing time.
For discussion only; not investment advice.
$BTC $ETH $BEAMX
BEAMX: First oscillate, then try the upper range; watch the level. BEAMX 0.003043 USDT
In the next 1–4 hours, I’m more inclined to expect BEAMX to first range, then retest the upper move. The first observation level is at BEAMX 0.003043 USDT. Since the smaller timeframes haven’t lined up yet, it may first keep probing back and forth. It looks promising, but save the champagne for the fridge first. 😏
📊 Fig. 1|1-hour as of 22:00 Beijing time: The close is still within the top-20 range of candles. The last three MA20 lifts are pushing up, and the close is above it. Volume is 2.18× the average of the last top-20 candles; this time the position change has come with a volume expansion.
🔎 Fig. 2|BEAMX 15-minute as of 22:15 Beijing time: The close is below MA20. Volume is 0.48× the average, and MA20 is still trending downward. Since the smaller timeframe hasn’t coordinated with the main view yet, it’s more likely to tug and pull first rather than run straight to the observation level.
🧭 RSI14 is 68.0, and the MACD histogram bars are shrinking (positive bars contracting). Momentum is slightly bullish—check it together with the price structure. ATR14 is 0.0001192 USDT, about 4.39% of the closing price; used to gauge room for fluctuation.
→ Main scenario: If the pullback holds without breaking BEAMX 0.0023886 USDT, it favors testing upward toward BEAMX 0.003043 USDT. The observation level is taken from the highest price of the most recent 20 closed K-lines (including the latest one). Once it gets close, then judge the breakout strength.
⚠️ If, by the close of the next 1 hour, price falls back below BEAMX 0.0023886 USDT, the original view is canceled. That’s the MA20 baseline observation line; at that time we switch to watching BEAMX 0.002114 USDT. A wick touching it isn’t enough—once it goes beyond the time window, reassess.
💬 Do you agree more with trying upward first (probing), or with a rebound that’s easy to give back? Also share which piece of evidence on the chart makes you think that way.
If you want to keep following it, you can verify the conditions above with the BEAMX price action below.
Coin included in the day’s ranking list; current gain ranks 4th. Source: Binance USDT Perpetual|Rolling 24 hours|2026/10/4 22:27:37 Beijing time.
For discussion only; not investment advice.
$BTC $ETH $BEAMX
In the next 1–4 hours, I’m more inclined to expect BEAMX to first range, then retest the upper move. The first observation level is at BEAMX 0.003043 USDT. Since the smaller timeframes haven’t lined up yet, it may first keep probing back and forth. It looks promising, but save the champagne for the fridge first. 😏
📊 Fig. 1|1-hour as of 22:00 Beijing time: The close is still within the top-20 range of candles. The last three MA20 lifts are pushing up, and the close is above it. Volume is 2.18× the average of the last top-20 candles; this time the position change has come with a volume expansion.
🔎 Fig. 2|BEAMX 15-minute as of 22:15 Beijing time: The close is below MA20. Volume is 0.48× the average, and MA20 is still trending downward. Since the smaller timeframe hasn’t coordinated with the main view yet, it’s more likely to tug and pull first rather than run straight to the observation level.
🧭 RSI14 is 68.0, and the MACD histogram bars are shrinking (positive bars contracting). Momentum is slightly bullish—check it together with the price structure. ATR14 is 0.0001192 USDT, about 4.39% of the closing price; used to gauge room for fluctuation.
→ Main scenario: If the pullback holds without breaking BEAMX 0.0023886 USDT, it favors testing upward toward BEAMX 0.003043 USDT. The observation level is taken from the highest price of the most recent 20 closed K-lines (including the latest one). Once it gets close, then judge the breakout strength.
⚠️ If, by the close of the next 1 hour, price falls back below BEAMX 0.0023886 USDT, the original view is canceled. That’s the MA20 baseline observation line; at that time we switch to watching BEAMX 0.002114 USDT. A wick touching it isn’t enough—once it goes beyond the time window, reassess.
💬 Do you agree more with trying upward first (probing), or with a rebound that’s easy to give back? Also share which piece of evidence on the chart makes you think that way.
If you want to keep following it, you can verify the conditions above with the BEAMX price action below.
Coin included in the day’s ranking list; current gain ranks 4th. Source: Binance USDT Perpetual|Rolling 24 hours|2026/10/4 22:27:37 Beijing time.
For discussion only; not investment advice.
$BTC $ETH $BEAMX
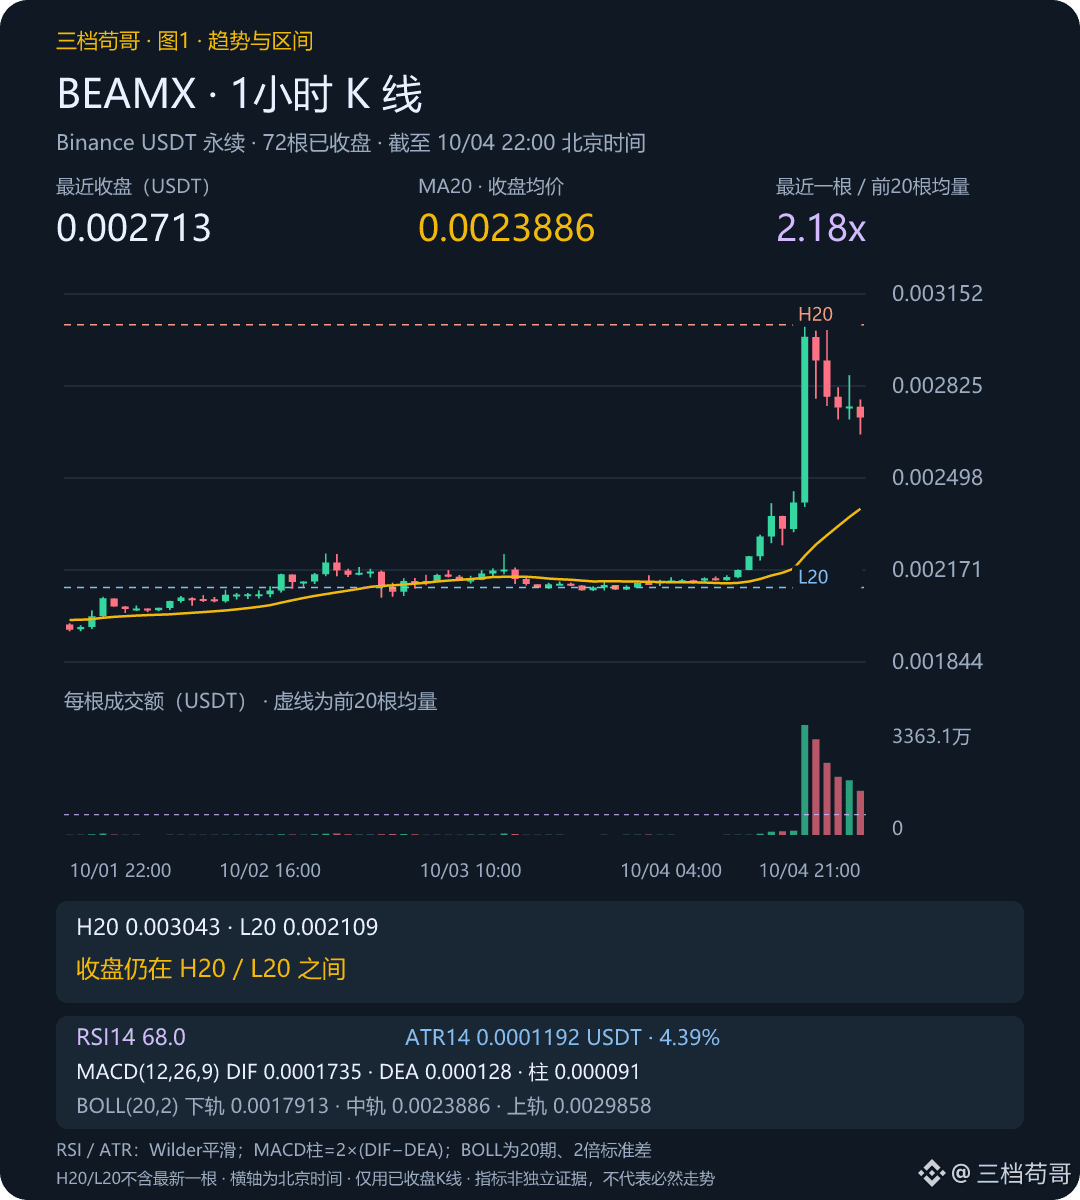
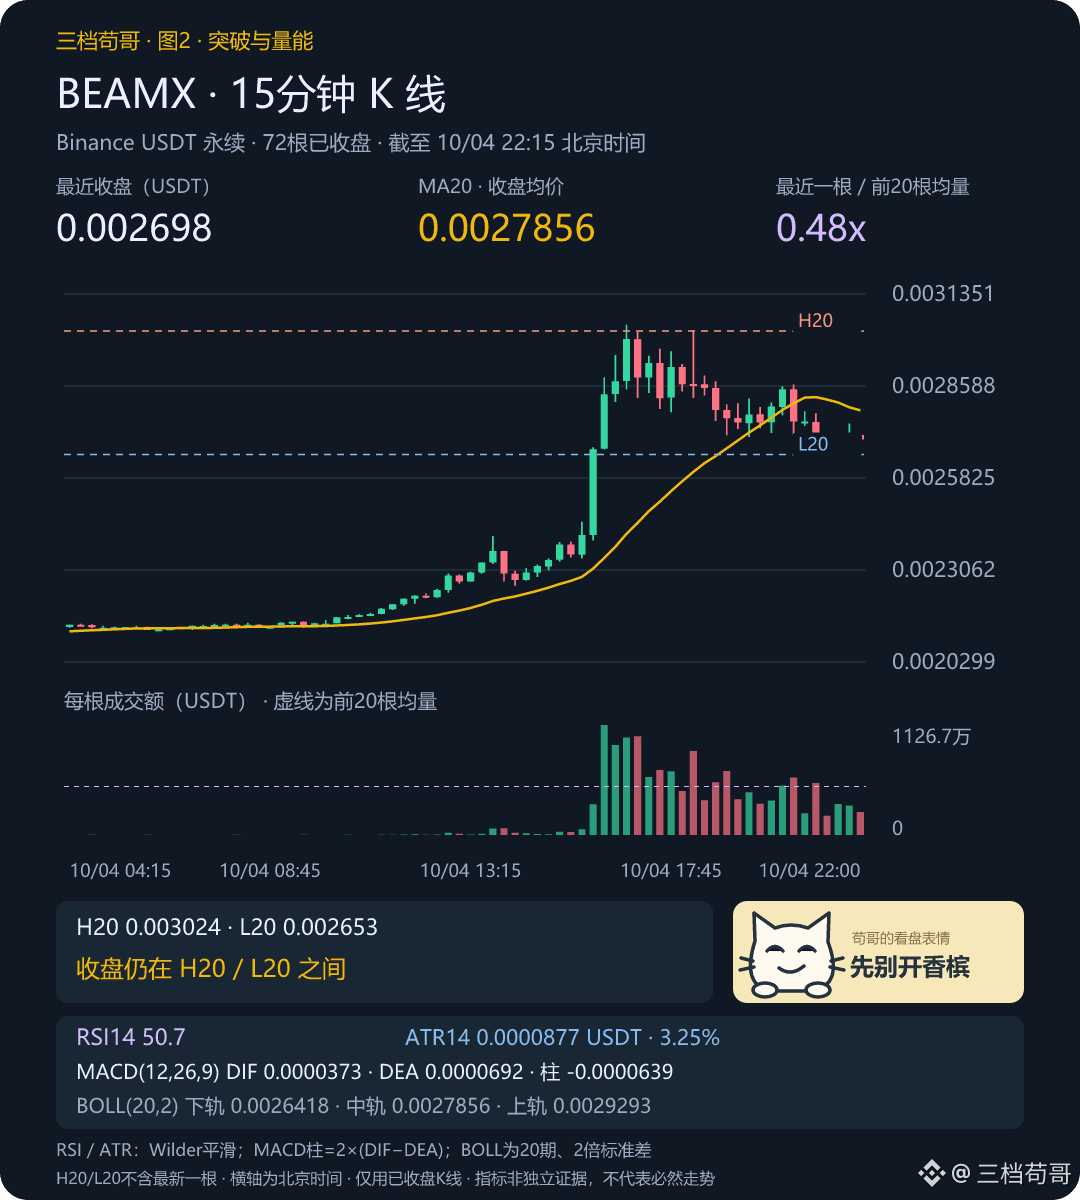
82
·
--
Can going long still collect funding fees? Top 5 on Binance with negative funding rates—I'll focus on these first
Shorts pay longs. Sounds sweet. 😏 But can you handle a funding-rate charge and still survive through a single bearish candle?
Among these five, I’ll prioritize watching GTC. LYN is my backup; the other three can wait until they show signs of repair.
On Oct 4 at 22:00 Beijing time, after scanning 591 coin-margined and USDT-margined positions on Binance USD-M and Coin-M perpetuals, deduplicated by coin, sorted from lowest to highest estimated single funding rate by currency:
1. GTCUSDT: -0.5542% / 8 hours
2. ONEUSDT: -0.3594% / 4 hours
3. QNTUSDT: -0.1591% / 8 hours
4. ARKUSDT: -0.1255% / 1 hour
5. LYNUSDT: -0.0726% / 4 hours
Don’t miss the timing details: ARK settles every hour. If we assume the funding rate stays unchanged, a simple conversion for 8 hours is about -1.00%; the negative value is larger than GTC’s—but this is only a standardized comparison, not a promise of when you’ll actually receive it.
For GTC: 1-hour RSI is 57; the MACD positive histogram bars are shortening—repair is still ongoing, but the acceleration isn’t enough. From 18:00 to 21:00, the number of open positions increased by 2.53%, which still doesn’t prove that longs are entering. I’ll consider going long only if the 1-hour close breaks above the previous 20 highs at 0.12828, with volume exceeding the average volume of the previous 20 candles by 1.2x, and a pullback that holds. If the price falls back below the line, I’ll cancel the thesis. The 24-hour high at 0.12957 overhead still brings resistance—don’t chase.
LYN as #2 for observation: the bearish volume spike on the 21:00 close is 8.42x. You can’t force-interpret it as accumulation. Wait for the price to reclaim within 15 minutes and hold above MA20 around 0.028735 before discussing any rebound; if it breaks below the recent low at 0.02737, I’ll give up.
For ONE, QNT, and ARK: their 1-hour closes are all below MA20. First, we need to see if they can reclaim the moving averages: ONE around 0.0024346, QNT around 261.69, and ARK around 0.22287. The trend hasn’t been repaired, and the negative funding rate may continue accompanying the price as it drifts lower.
📊 Figure 1|GTC 1h (22:00 Beijing): Close 0.1241 USDT, Volume ratio 1.02x.
🔎 Figure 2|LYN 1h (22:00 Beijing): Close 0.02854 USDT, Volume ratio 6.16x.
💬 Will you enter first because ARK’s 1-hour funding is negative, or will you wait for GTC to see volume expand? Share your confirmation conditions.
There’s a GTC market entry below you can compare with the ranges in the chart.
Source: Binance premiumIndex, fundingInfo, exchangeInfo, K-line data, and open-position statistics. Funding-rate snapshot at 22:00 Beijing time on 2026-10-04; 1-hour indicators through 22:00, 15-minute through 22:00. All are USDT-margined perpetual levels; funding rates change at any time, and the charts are refreshed before publishing.
For discussion only and does not constitute investment advice.
$BTC $ETH $GTC
Can going long still collect funding fees? Top 5 on Binance with negative funding rates—I'll focus on these first
Shorts pay longs. Sounds sweet. 😏 But can you handle a funding-rate charge and still survive through a single bearish candle?
Among these five, I’ll prioritize watching GTC. LYN is my backup; the other three can wait until they show signs of repair.
On Oct 4 at 22:00 Beijing time, after scanning 591 coin-margined and USDT-margined positions on Binance USD-M and Coin-M perpetuals, deduplicated by coin, sorted from lowest to highest estimated single funding rate by currency:
1. GTCUSDT: -0.5542% / 8 hours
2. ONEUSDT: -0.3594% / 4 hours
3. QNTUSDT: -0.1591% / 8 hours
4. ARKUSDT: -0.1255% / 1 hour
5. LYNUSDT: -0.0726% / 4 hours
Don’t miss the timing details: ARK settles every hour. If we assume the funding rate stays unchanged, a simple conversion for 8 hours is about -1.00%; the negative value is larger than GTC’s—but this is only a standardized comparison, not a promise of when you’ll actually receive it.
For GTC: 1-hour RSI is 57; the MACD positive histogram bars are shortening—repair is still ongoing, but the acceleration isn’t enough. From 18:00 to 21:00, the number of open positions increased by 2.53%, which still doesn’t prove that longs are entering. I’ll consider going long only if the 1-hour close breaks above the previous 20 highs at 0.12828, with volume exceeding the average volume of the previous 20 candles by 1.2x, and a pullback that holds. If the price falls back below the line, I’ll cancel the thesis. The 24-hour high at 0.12957 overhead still brings resistance—don’t chase.
LYN as #2 for observation: the bearish volume spike on the 21:00 close is 8.42x. You can’t force-interpret it as accumulation. Wait for the price to reclaim within 15 minutes and hold above MA20 around 0.028735 before discussing any rebound; if it breaks below the recent low at 0.02737, I’ll give up.
For ONE, QNT, and ARK: their 1-hour closes are all below MA20. First, we need to see if they can reclaim the moving averages: ONE around 0.0024346, QNT around 261.69, and ARK around 0.22287. The trend hasn’t been repaired, and the negative funding rate may continue accompanying the price as it drifts lower.
📊 Figure 1|GTC 1h (22:00 Beijing): Close 0.1241 USDT, Volume ratio 1.02x.
🔎 Figure 2|LYN 1h (22:00 Beijing): Close 0.02854 USDT, Volume ratio 6.16x.
💬 Will you enter first because ARK’s 1-hour funding is negative, or will you wait for GTC to see volume expand? Share your confirmation conditions.
There’s a GTC market entry below you can compare with the ranges in the chart.
Source: Binance premiumIndex, fundingInfo, exchangeInfo, K-line data, and open-position statistics. Funding-rate snapshot at 22:00 Beijing time on 2026-10-04; 1-hour indicators through 22:00, 15-minute through 22:00. All are USDT-margined perpetual levels; funding rates change at any time, and the charts are refreshed before publishing.
For discussion only and does not constitute investment advice.
$BTC $ETH $GTC
Shorts pay longs. Sounds sweet. 😏 But can you handle a funding-rate charge and still survive through a single bearish candle?
Among these five, I’ll prioritize watching GTC. LYN is my backup; the other three can wait until they show signs of repair.
On Oct 4 at 22:00 Beijing time, after scanning 591 coin-margined and USDT-margined positions on Binance USD-M and Coin-M perpetuals, deduplicated by coin, sorted from lowest to highest estimated single funding rate by currency:
1. GTCUSDT: -0.5542% / 8 hours
2. ONEUSDT: -0.3594% / 4 hours
3. QNTUSDT: -0.1591% / 8 hours
4. ARKUSDT: -0.1255% / 1 hour
5. LYNUSDT: -0.0726% / 4 hours
Don’t miss the timing details: ARK settles every hour. If we assume the funding rate stays unchanged, a simple conversion for 8 hours is about -1.00%; the negative value is larger than GTC’s—but this is only a standardized comparison, not a promise of when you’ll actually receive it.
For GTC: 1-hour RSI is 57; the MACD positive histogram bars are shortening—repair is still ongoing, but the acceleration isn’t enough. From 18:00 to 21:00, the number of open positions increased by 2.53%, which still doesn’t prove that longs are entering. I’ll consider going long only if the 1-hour close breaks above the previous 20 highs at 0.12828, with volume exceeding the average volume of the previous 20 candles by 1.2x, and a pullback that holds. If the price falls back below the line, I’ll cancel the thesis. The 24-hour high at 0.12957 overhead still brings resistance—don’t chase.
LYN as #2 for observation: the bearish volume spike on the 21:00 close is 8.42x. You can’t force-interpret it as accumulation. Wait for the price to reclaim within 15 minutes and hold above MA20 around 0.028735 before discussing any rebound; if it breaks below the recent low at 0.02737, I’ll give up.
For ONE, QNT, and ARK: their 1-hour closes are all below MA20. First, we need to see if they can reclaim the moving averages: ONE around 0.0024346, QNT around 261.69, and ARK around 0.22287. The trend hasn’t been repaired, and the negative funding rate may continue accompanying the price as it drifts lower.
📊 Figure 1|GTC 1h (22:00 Beijing): Close 0.1241 USDT, Volume ratio 1.02x.
🔎 Figure 2|LYN 1h (22:00 Beijing): Close 0.02854 USDT, Volume ratio 6.16x.
💬 Will you enter first because ARK’s 1-hour funding is negative, or will you wait for GTC to see volume expand? Share your confirmation conditions.
There’s a GTC market entry below you can compare with the ranges in the chart.
Source: Binance premiumIndex, fundingInfo, exchangeInfo, K-line data, and open-position statistics. Funding-rate snapshot at 22:00 Beijing time on 2026-10-04; 1-hour indicators through 22:00, 15-minute through 22:00. All are USDT-margined perpetual levels; funding rates change at any time, and the charts are refreshed before publishing.
For discussion only and does not constitute investment advice.
$BTC $ETH $GTC
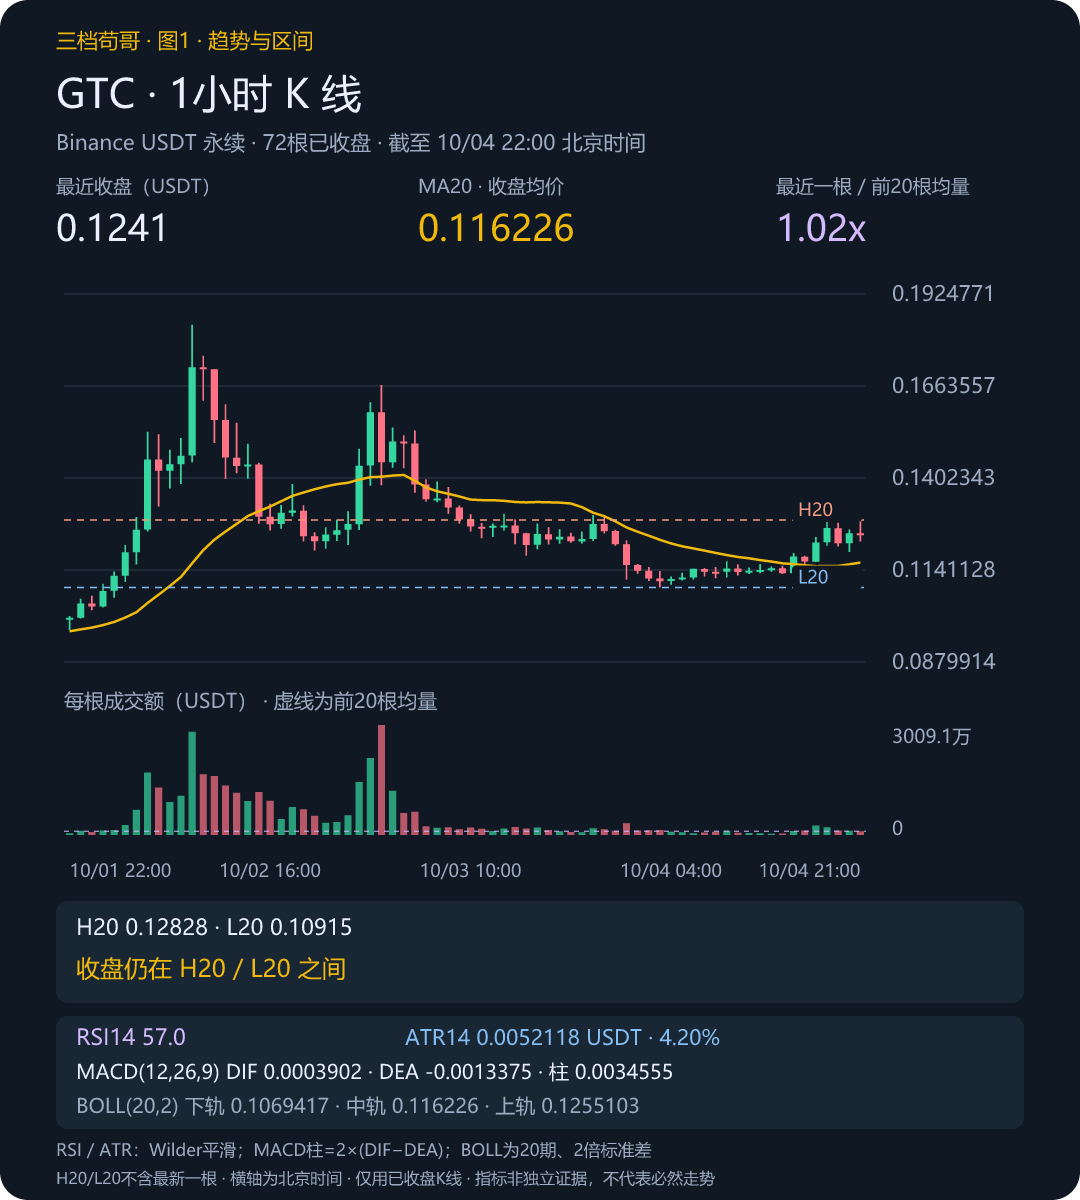
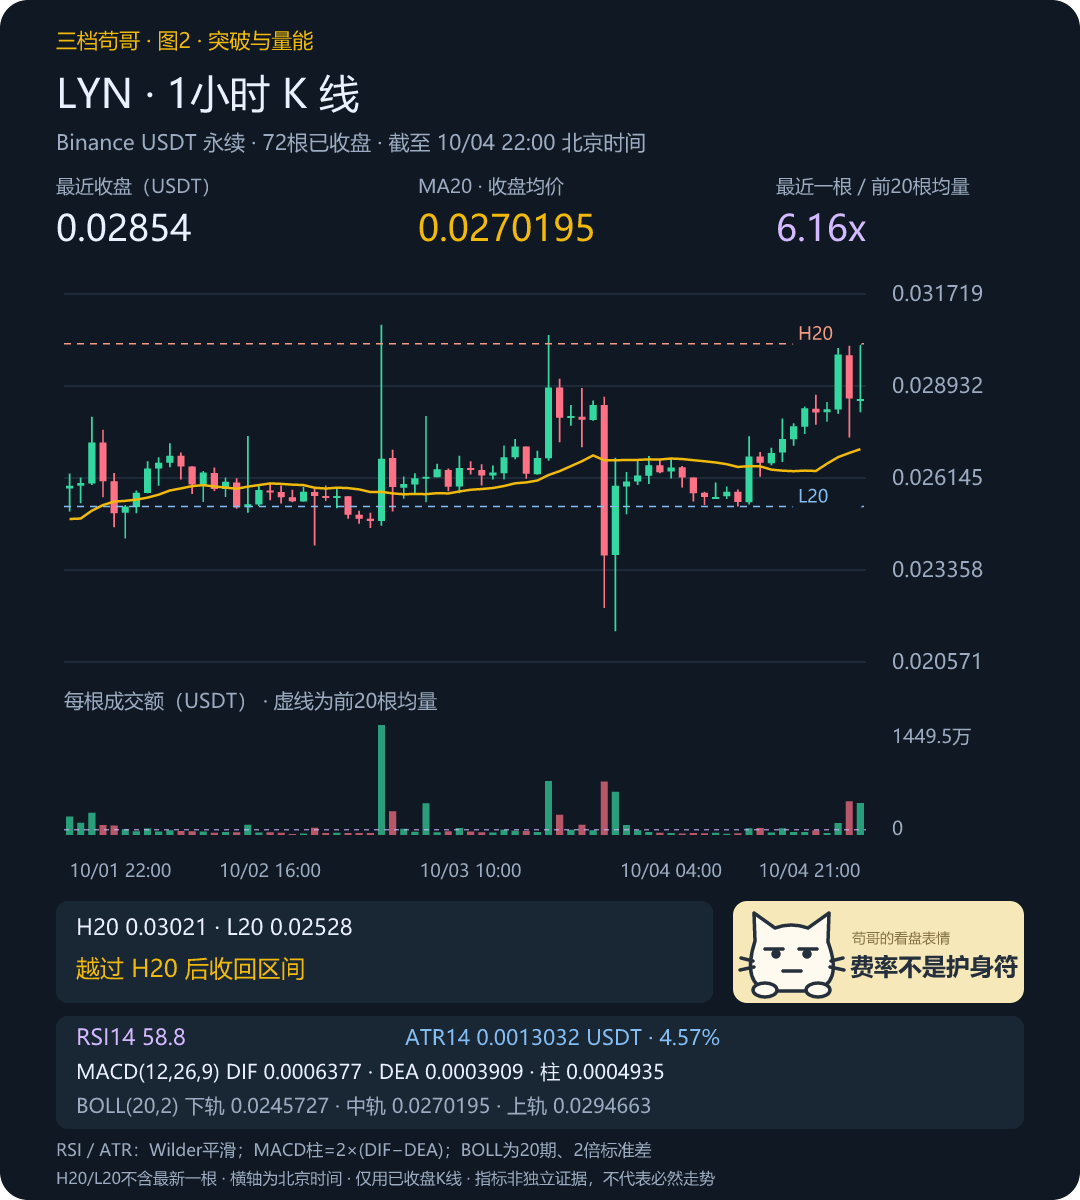
1
3
1.6k
·
--
COLLECT:Bias remains to continue probing higher, observing level COLLECT 0.02542 USDT
In the next 1–4 hours, I’m more inclined to maintain a bullish bias toward further upside probing. The first observation level is set at COLLECT 0.02542 USDT. If price comes close, then double-check the order flow and volume. It looks promising, but keep the champagne in the fridge first.😏
COLLECT current price is about 0.02391 USDT, up +32.03% over the past 24 hours. It has pulled back 5.94% from the window high. A retracement and a strengthening trend can exist at the same time, so I care more about whether the most recent closes are lifting higher—not simply extrapolating past gains.
📊 Figure 1|1-hour as of Beijing 21:00: the close is still within the range of the latest top 20 candles. The most recent 3 MA20 candles have been rising, and the close is above them. Volume is 1.53 times the average volume of the latest top 20 candles—this positioning change is supported by a pickup in volume.
🔎 Figure 2|COLLECT 15-minute as of Beijing 21:45: the close is above MA20, with volume at 0.98 times the average, and MA20’s most recent 3 candles have been rising. On the smaller timeframe there’s no clear “counter-signal.” Let’s first see whether this alignment can continue into the next close.
🧭 RSI14 at 71.6, and MACD histogram bars shrinking: momentum is strong but it’s already a bit overheated—so don’t chase based on this alone. ATR14 is 0.0011087 USDT, about 4.64% of the closing price, used to gauge potential volatility range.
→ Main scenario: if the pullback does not break below COLLECT 0.021435 USDT, then the bias is to try higher toward COLLECT 0.02542 USDT. The observation level is taken from the highest price of the latest 20 already-closed K-lines (including the most recent one). Once it’s near, judge the strength of any breakout.
⚠️ If the next 1-hour close falls back below COLLECT 0.021435 USDT, then we revoke the original assessment. This is the MA20 moving-average observation line; at that time, we switch to watching COLLECT 0.01883 USDT. A wick touching the level doesn’t count—if it goes beyond the time window, reassess.
💬 Do you agree more with the idea of probing upward first, or do you think the rebound is likely to give back quickly? Also share which evidence on the chart makes you think that.
Below there’s a COLLECT market entry—use it to compare against the range shown on the chart.
Coin selected in the daily leaderboard, currently up 2nd. Source: Binance USDT Perpetual|Rolling 24 hours|2026/10/4 21:46:50 Beijing time.
For discussion only; not investment advice.
$BTC $ETH $COLLECT
COLLECT:Bias remains to continue probing higher, observing level COLLECT 0.02542 USDT
In the next 1–4 hours, I’m more inclined to maintain a bullish bias toward further upside probing. The first observation level is set at COLLECT 0.02542 USDT. If price comes close, then double-check the order flow and volume. It looks promising, but keep the champagne in the fridge first.😏
COLLECT current price is about 0.02391 USDT, up +32.03% over the past 24 hours. It has pulled back 5.94% from the window high. A retracement and a strengthening trend can exist at the same time, so I care more about whether the most recent closes are lifting higher—not simply extrapolating past gains.
📊 Figure 1|1-hour as of Beijing 21:00: the close is still within the range of the latest top 20 candles. The most recent 3 MA20 candles have been rising, and the close is above them. Volume is 1.53 times the average volume of the latest top 20 candles—this positioning change is supported by a pickup in volume.
🔎 Figure 2|COLLECT 15-minute as of Beijing 21:45: the close is above MA20, with volume at 0.98 times the average, and MA20’s most recent 3 candles have been rising. On the smaller timeframe there’s no clear “counter-signal.” Let’s first see whether this alignment can continue into the next close.
🧭 RSI14 at 71.6, and MACD histogram bars shrinking: momentum is strong but it’s already a bit overheated—so don’t chase based on this alone. ATR14 is 0.0011087 USDT, about 4.64% of the closing price, used to gauge potential volatility range.
→ Main scenario: if the pullback does not break below COLLECT 0.021435 USDT, then the bias is to try higher toward COLLECT 0.02542 USDT. The observation level is taken from the highest price of the latest 20 already-closed K-lines (including the most recent one). Once it’s near, judge the strength of any breakout.
⚠️ If the next 1-hour close falls back below COLLECT 0.021435 USDT, then we revoke the original assessment. This is the MA20 moving-average observation line; at that time, we switch to watching COLLECT 0.01883 USDT. A wick touching the level doesn’t count—if it goes beyond the time window, reassess.
💬 Do you agree more with the idea of probing upward first, or do you think the rebound is likely to give back quickly? Also share which evidence on the chart makes you think that.
Below there’s a COLLECT market entry—use it to compare against the range shown on the chart.
Coin selected in the daily leaderboard, currently up 2nd. Source: Binance USDT Perpetual|Rolling 24 hours|2026/10/4 21:46:50 Beijing time.
For discussion only; not investment advice.
$BTC $ETH $COLLECT
In the next 1–4 hours, I’m more inclined to maintain a bullish bias toward further upside probing. The first observation level is set at COLLECT 0.02542 USDT. If price comes close, then double-check the order flow and volume. It looks promising, but keep the champagne in the fridge first.😏
COLLECT current price is about 0.02391 USDT, up +32.03% over the past 24 hours. It has pulled back 5.94% from the window high. A retracement and a strengthening trend can exist at the same time, so I care more about whether the most recent closes are lifting higher—not simply extrapolating past gains.
📊 Figure 1|1-hour as of Beijing 21:00: the close is still within the range of the latest top 20 candles. The most recent 3 MA20 candles have been rising, and the close is above them. Volume is 1.53 times the average volume of the latest top 20 candles—this positioning change is supported by a pickup in volume.
🔎 Figure 2|COLLECT 15-minute as of Beijing 21:45: the close is above MA20, with volume at 0.98 times the average, and MA20’s most recent 3 candles have been rising. On the smaller timeframe there’s no clear “counter-signal.” Let’s first see whether this alignment can continue into the next close.
🧭 RSI14 at 71.6, and MACD histogram bars shrinking: momentum is strong but it’s already a bit overheated—so don’t chase based on this alone. ATR14 is 0.0011087 USDT, about 4.64% of the closing price, used to gauge potential volatility range.
→ Main scenario: if the pullback does not break below COLLECT 0.021435 USDT, then the bias is to try higher toward COLLECT 0.02542 USDT. The observation level is taken from the highest price of the latest 20 already-closed K-lines (including the most recent one). Once it’s near, judge the strength of any breakout.
⚠️ If the next 1-hour close falls back below COLLECT 0.021435 USDT, then we revoke the original assessment. This is the MA20 moving-average observation line; at that time, we switch to watching COLLECT 0.01883 USDT. A wick touching the level doesn’t count—if it goes beyond the time window, reassess.
💬 Do you agree more with the idea of probing upward first, or do you think the rebound is likely to give back quickly? Also share which evidence on the chart makes you think that.
Below there’s a COLLECT market entry—use it to compare against the range shown on the chart.
Coin selected in the daily leaderboard, currently up 2nd. Source: Binance USDT Perpetual|Rolling 24 hours|2026/10/4 21:46:50 Beijing time.
For discussion only; not investment advice.
$BTC $ETH $COLLECT
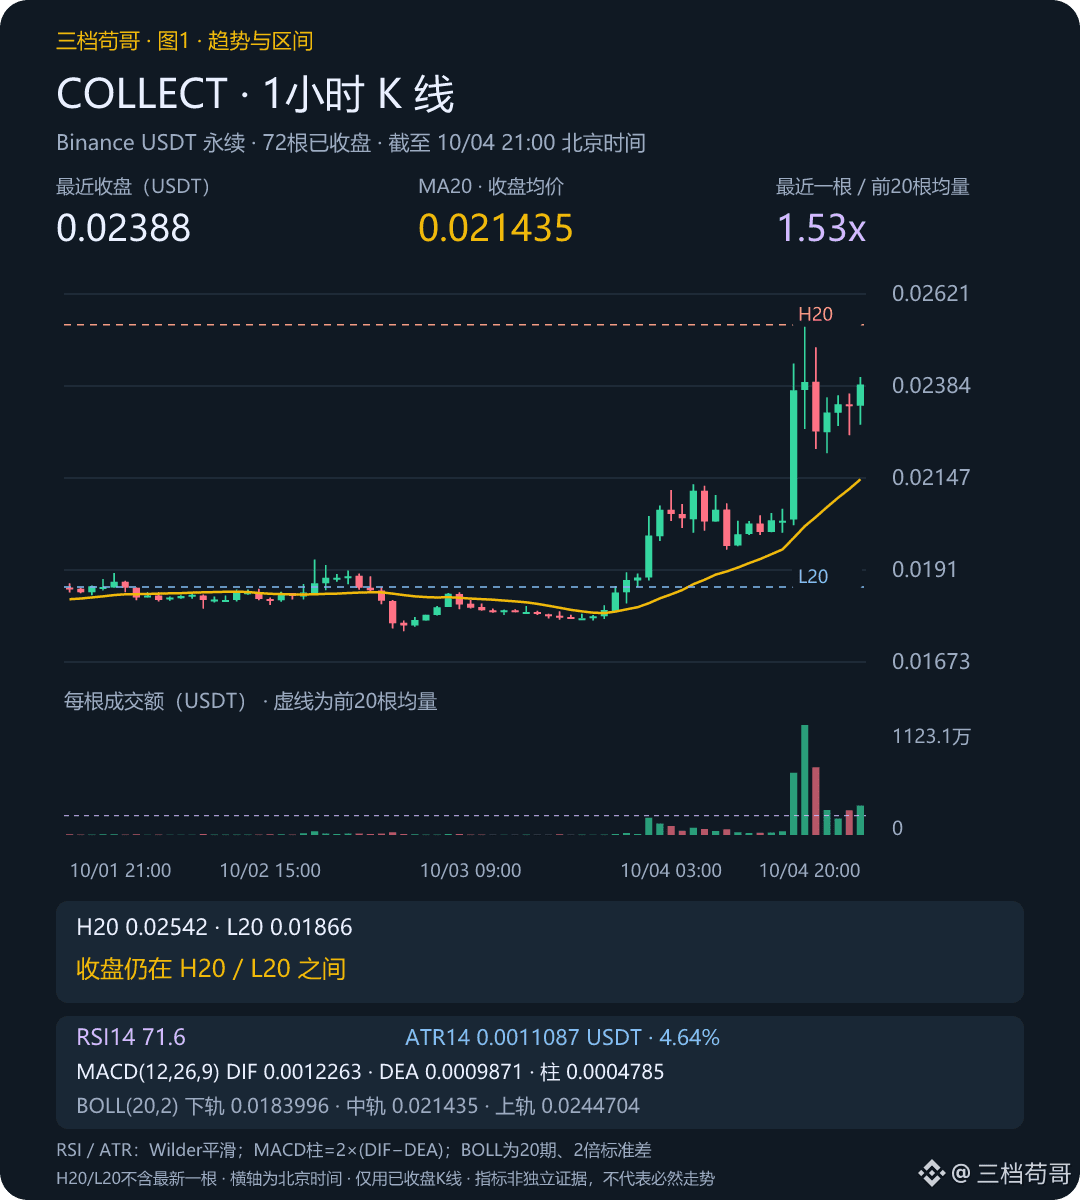
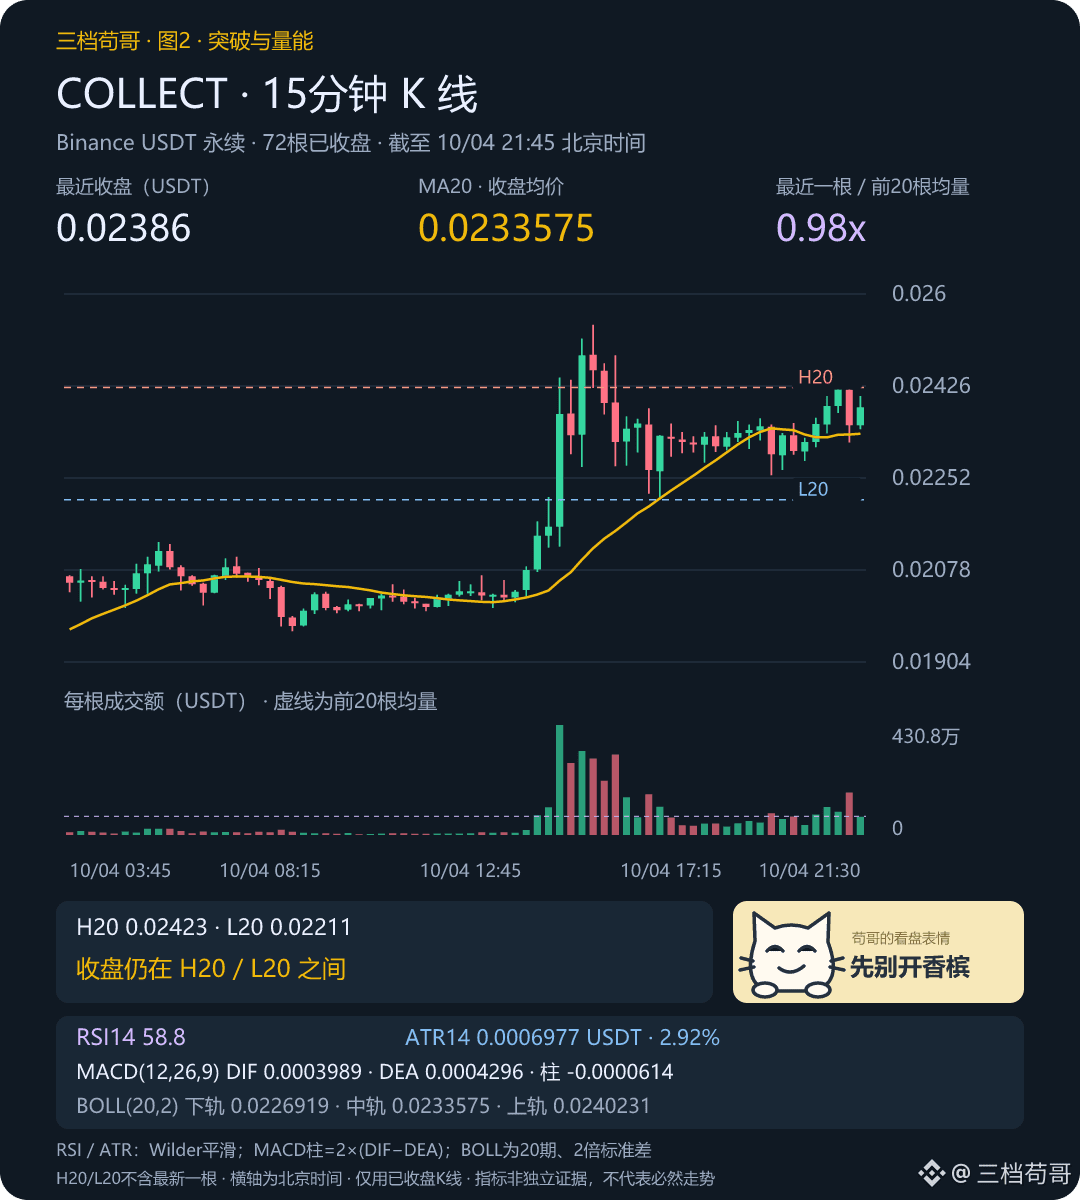
1
269
·
--
AIN: First consolidate, then try the upper range, observe the position AIN 0.0856 USDT
In the next 1–4 hours, I’m more inclined to see AIN consolidate first, then test the upper range. The first observation level is set at AIN 0.0856 USDT. Once price comes close, check for continuation/support and volume again. Looks promising, but champagne should be kept in the fridge first.😏
AIN current price is about 0.05681 USDT, up 145.08% in the past 24 hours. It has fallen back 33.63% from the window’s high point. A pullback and a strengthening move can coexist, so I care more about whether the most recent close has lifted, rather than simply extrapolating the past surge.
📊 Figure 1|1-hour as of Beijing 21:00: The close is still within the range of the previous 20 bars. The latest 3 MA20s have been rising, and the close is above them. Volume is 1.15x the average of the previous 20 bars—no clear breakout in volume yet—so I prefer to advance in stages.
🔎 Figure 2|AIN 15-minute as of Beijing 21:30: The close is above MA20, and volume is 0.50x the average. The latest 3 MA20s have been rising. On the smaller timeframe, there’s no obvious counter-signal. Let’s first see if this alignment can continue through the next close.
🧭 RSI14 at 63.3, MACD negative histogram expanding: momentum divergence—temporary disagreement, so I won’t treat a single signal as confirmation. ATR14 is 0.0075964 USDT, about 13.49% of the closing price, used to gauge room for volatility.
→ Main scenario: If the pullback does not lose AIN 0.05113 USDT, I lean toward testing AIN 0.0856 USDT to the upside. The observation level is taken from the highest price of the latest 20 closed K-lines (including the most recent one). After it approaches, decide again on the strength of any breakout.
⚠️ If the close within the next hour falls back below AIN 0.05113 USDT, I’ll отмен the original judgment. This is the MA20 moving-average observation line; at that time, watch AIN 0.0356 USDT instead. Touching the wick isn’t enough—if it goes beyond the time window, re-evaluate.
💬 Do you think it’s better to test upward first, or is it more likely to retrace after a bounce? Also share which evidence on the chart makes you think that.
I’ll keep the conditions above and continue to cross-check using the AIN行情 below.
Selected coin for the day’s leaderboard, current gain ranks #1. Source: Binance USDT Perpetual|Rolling 24 hours|2026/10/4 21:31:50 Beijing time.
For discussion only, not investment advice.
$BTC $ETH $AIN
AIN: First consolidate, then try the upper range, observe the position AIN 0.0856 USDT
In the next 1–4 hours, I’m more inclined to see AIN consolidate first, then test the upper range. The first observation level is set at AIN 0.0856 USDT. Once price comes close, check for continuation/support and volume again. Looks promising, but champagne should be kept in the fridge first.😏
AIN current price is about 0.05681 USDT, up 145.08% in the past 24 hours. It has fallen back 33.63% from the window’s high point. A pullback and a strengthening move can coexist, so I care more about whether the most recent close has lifted, rather than simply extrapolating the past surge.
📊 Figure 1|1-hour as of Beijing 21:00: The close is still within the range of the previous 20 bars. The latest 3 MA20s have been rising, and the close is above them. Volume is 1.15x the average of the previous 20 bars—no clear breakout in volume yet—so I prefer to advance in stages.
🔎 Figure 2|AIN 15-minute as of Beijing 21:30: The close is above MA20, and volume is 0.50x the average. The latest 3 MA20s have been rising. On the smaller timeframe, there’s no obvious counter-signal. Let’s first see if this alignment can continue through the next close.
🧭 RSI14 at 63.3, MACD negative histogram expanding: momentum divergence—temporary disagreement, so I won’t treat a single signal as confirmation. ATR14 is 0.0075964 USDT, about 13.49% of the closing price, used to gauge room for volatility.
→ Main scenario: If the pullback does not lose AIN 0.05113 USDT, I lean toward testing AIN 0.0856 USDT to the upside. The observation level is taken from the highest price of the latest 20 closed K-lines (including the most recent one). After it approaches, decide again on the strength of any breakout.
⚠️ If the close within the next hour falls back below AIN 0.05113 USDT, I’ll отмен the original judgment. This is the MA20 moving-average observation line; at that time, watch AIN 0.0356 USDT instead. Touching the wick isn’t enough—if it goes beyond the time window, re-evaluate.
💬 Do you think it’s better to test upward first, or is it more likely to retrace after a bounce? Also share which evidence on the chart makes you think that.
I’ll keep the conditions above and continue to cross-check using the AIN行情 below.
Selected coin for the day’s leaderboard, current gain ranks #1. Source: Binance USDT Perpetual|Rolling 24 hours|2026/10/4 21:31:50 Beijing time.
For discussion only, not investment advice.
$BTC $ETH $AIN
In the next 1–4 hours, I’m more inclined to see AIN consolidate first, then test the upper range. The first observation level is set at AIN 0.0856 USDT. Once price comes close, check for continuation/support and volume again. Looks promising, but champagne should be kept in the fridge first.😏
AIN current price is about 0.05681 USDT, up 145.08% in the past 24 hours. It has fallen back 33.63% from the window’s high point. A pullback and a strengthening move can coexist, so I care more about whether the most recent close has lifted, rather than simply extrapolating the past surge.
📊 Figure 1|1-hour as of Beijing 21:00: The close is still within the range of the previous 20 bars. The latest 3 MA20s have been rising, and the close is above them. Volume is 1.15x the average of the previous 20 bars—no clear breakout in volume yet—so I prefer to advance in stages.
🔎 Figure 2|AIN 15-minute as of Beijing 21:30: The close is above MA20, and volume is 0.50x the average. The latest 3 MA20s have been rising. On the smaller timeframe, there’s no obvious counter-signal. Let’s first see if this alignment can continue through the next close.
🧭 RSI14 at 63.3, MACD negative histogram expanding: momentum divergence—temporary disagreement, so I won’t treat a single signal as confirmation. ATR14 is 0.0075964 USDT, about 13.49% of the closing price, used to gauge room for volatility.
→ Main scenario: If the pullback does not lose AIN 0.05113 USDT, I lean toward testing AIN 0.0856 USDT to the upside. The observation level is taken from the highest price of the latest 20 closed K-lines (including the most recent one). After it approaches, decide again on the strength of any breakout.
⚠️ If the close within the next hour falls back below AIN 0.05113 USDT, I’ll отмен the original judgment. This is the MA20 moving-average observation line; at that time, watch AIN 0.0356 USDT instead. Touching the wick isn’t enough—if it goes beyond the time window, re-evaluate.
💬 Do you think it’s better to test upward first, or is it more likely to retrace after a bounce? Also share which evidence on the chart makes you think that.
I’ll keep the conditions above and continue to cross-check using the AIN行情 below.
Selected coin for the day’s leaderboard, current gain ranks #1. Source: Binance USDT Perpetual|Rolling 24 hours|2026/10/4 21:31:50 Beijing time.
For discussion only, not investment advice.
$BTC $ETH $AIN
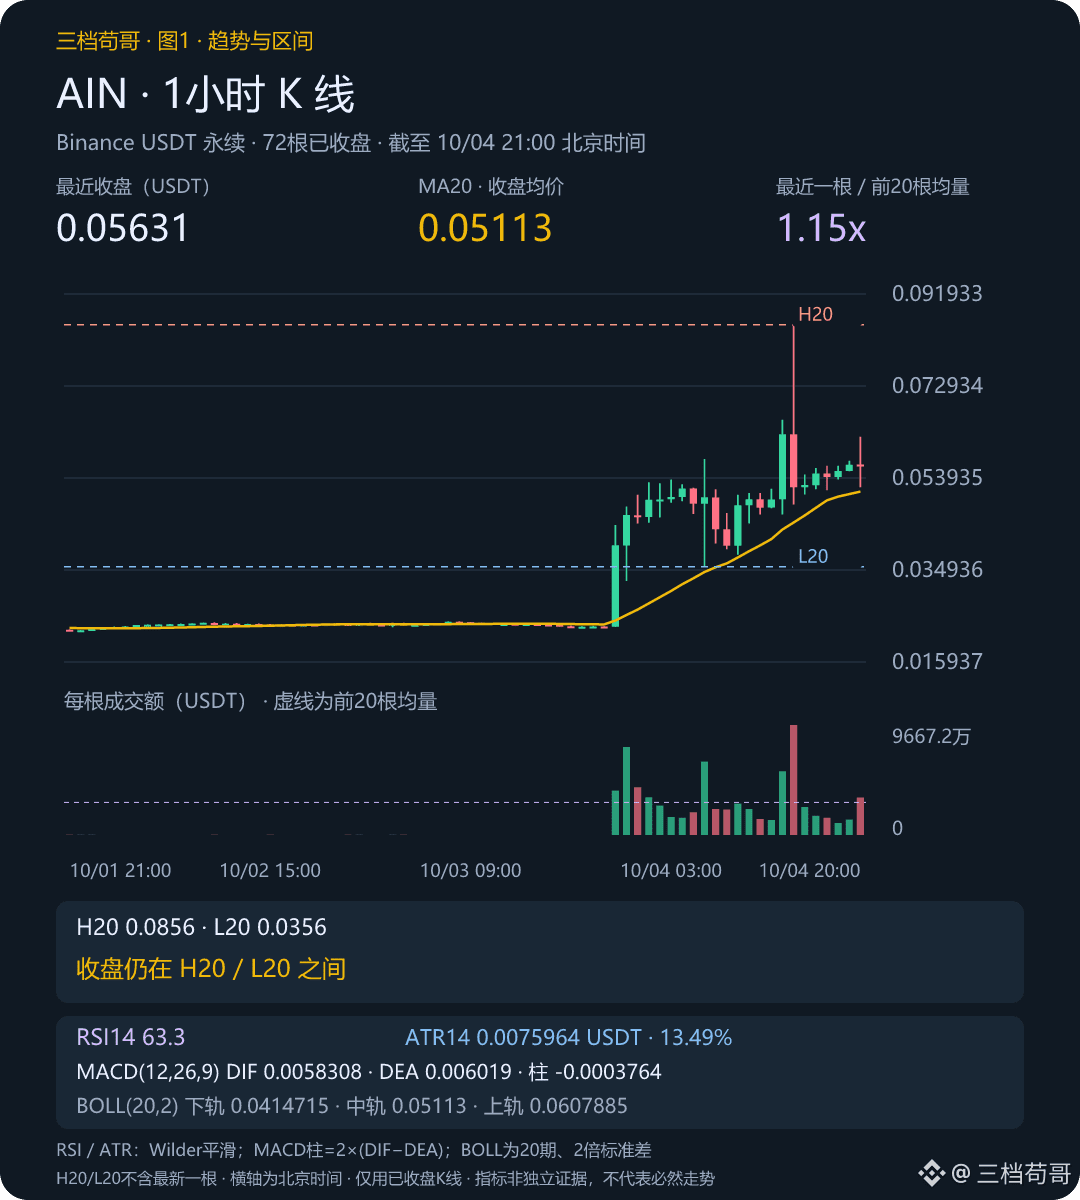
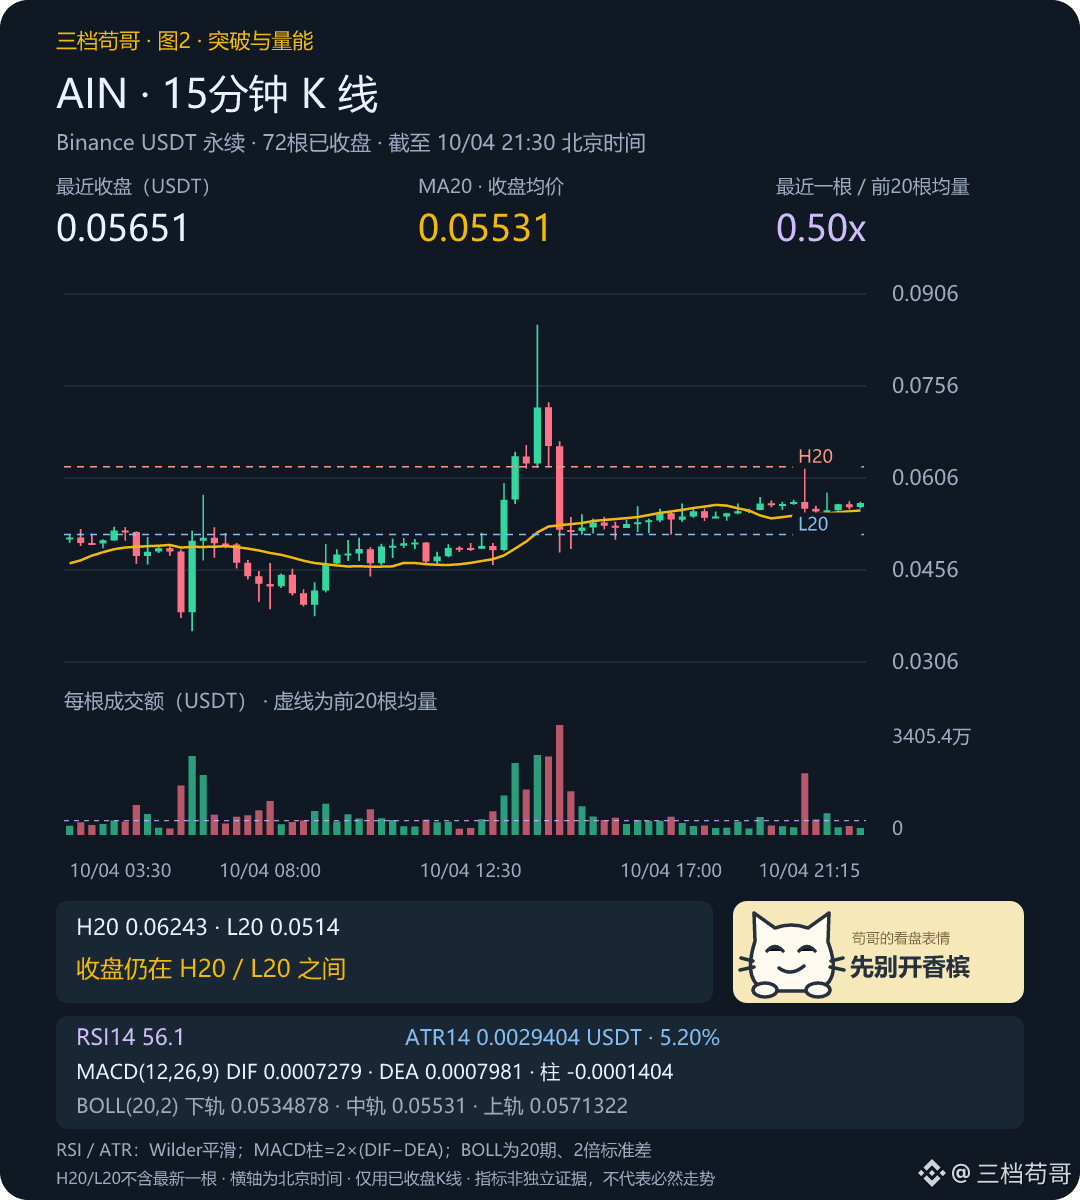
535
Log in to explore more content
Join global crypto users on Binance Square
⚡️ Get latest and useful information about crypto.
💬 Trusted by the world’s largest crypto exchange.
👍 Discover real insights from verified creators.
Email / Phone number
Trending Topics
ADAGains10%Above$0.27
4,628 views
119 Discussing
$ADA is making a strong move today jumping over 10 percent to around 027 and breaking into a new 90 day high
Trading volume has also surged above 1 billion showing strong market activity
The move comes as $ADA continues its recovery from the June lows while its recent technical structure has turned more bullish
The 027 to 028 zone is now the key area to watch A sustained breakout could open the door toward higher resistance levels
But after such a sharp daily move volatility could remain high
#ADAGains10%Above$0.27 #crypto #ADA #Cardano #crypto #Write2Earn
AbdullahAbid_7
·0 Likes
·223 views
ETHUp70%InQ3ButLiquidityFalls
56,713 views
657 Discussing
EthStakingExitQueueHits2026High
20,711 views
541 Discussing