NVDA Perpetual Contract: Choppy range, no clear trend yet; level to watch: NVDA 236.61 USDT
Over the next 1–4 hours, I’m leaning toward more back-and-forth within a range for the NVDA perpetual contract, with no clear one-way move yet. First, watch the NVDA 234.97 USDT–NVDA 236.61 USDT range. The price action feels a bit like “you move in, I move out,” so let’s not imagine a big move before it happens. 🫠
This analysis is based on Binance’s NVDAUSDT perpetual contract, quoted in USDT; the chart and volume data are both from this contract. The NVDA perpetual contract is currently around 235.64 USDT, up 0.38% over 24 hours and 0.41% below the high for this window. The price change hasn’t established a new directional advantage. Given the mixed signals on the chart, I’d rather interpret the next move as range-bound for now.
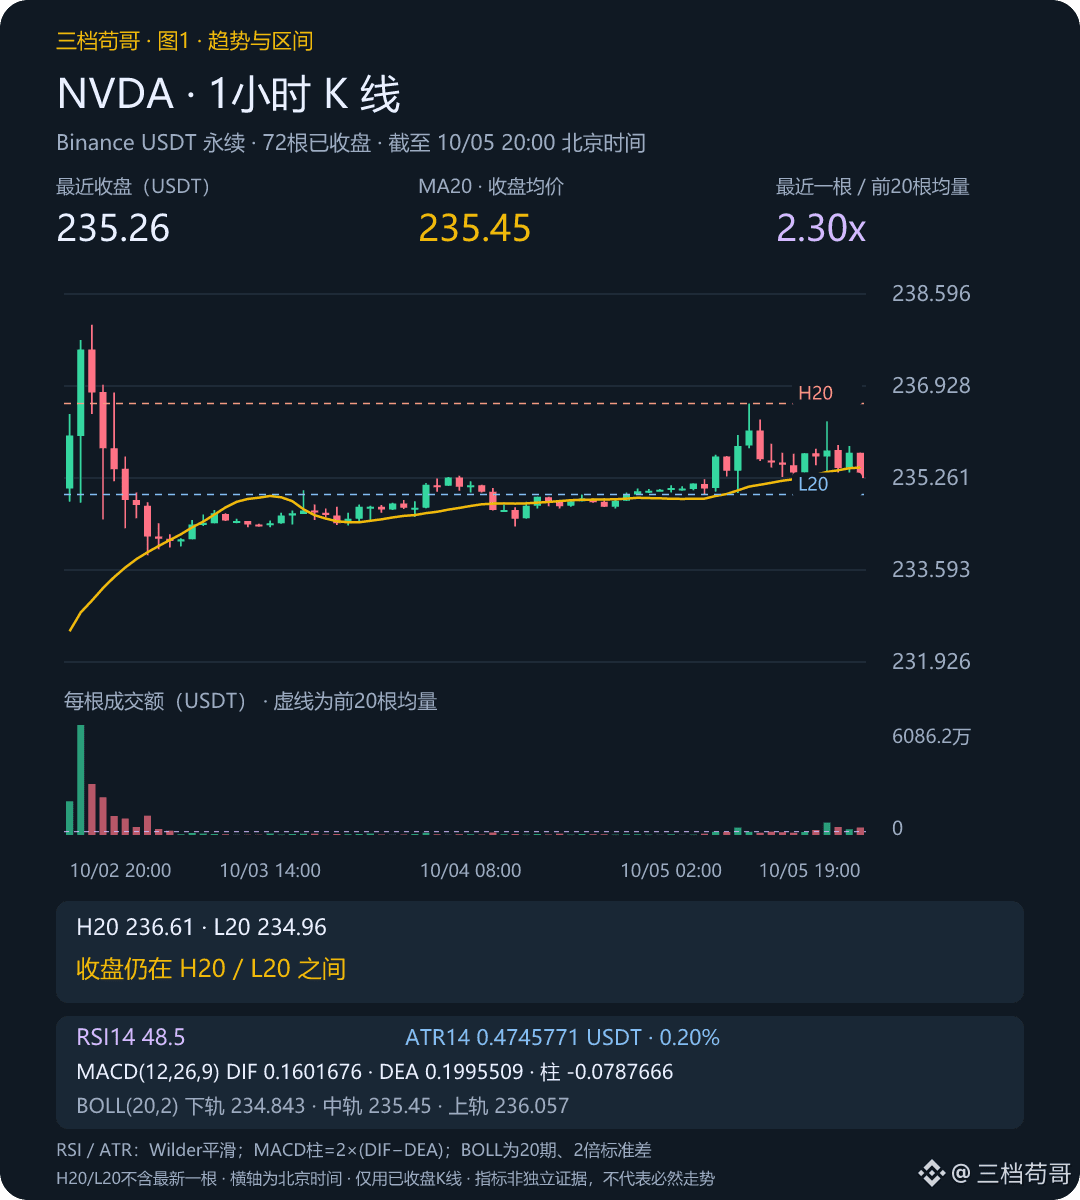
📊 Chart 1 | 1-hour, as of 20:00 Beijing time: The close remains within the range of the previous 20 candles. The MA20 has risen over the last 3 candles, with the close below it; volume is 2.30 times the average of the previous 20 candles, so this price move came with increased volume.
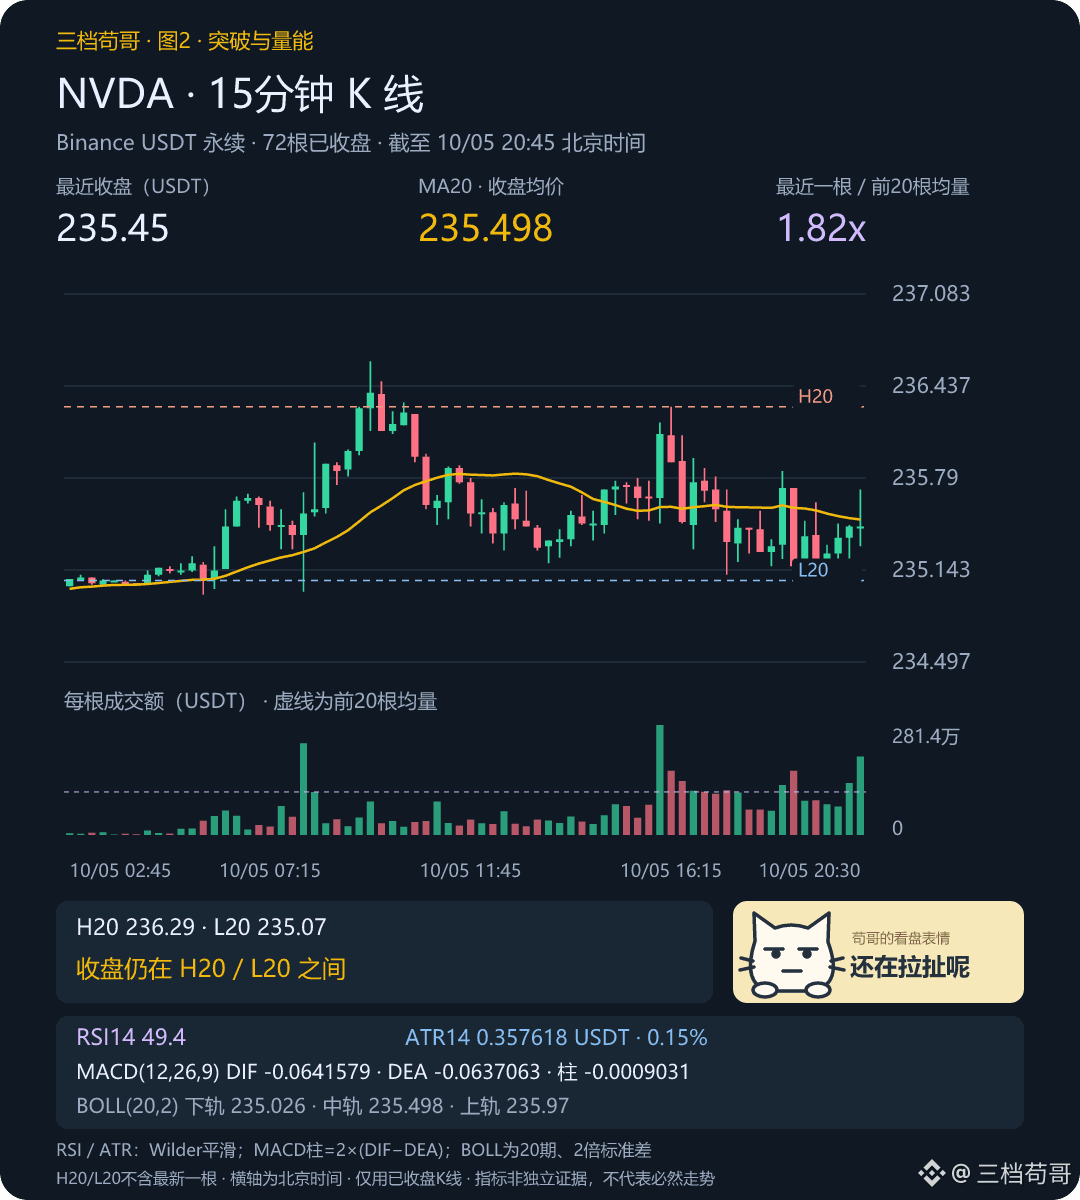
🔎 Chart 2 | NVDA 15-minute, as of 20:45 Beijing time: The close is below the MA20, volume is 1.82 times average, and the MA20 remains flat. The shorter timeframe isn’t clearly contradicting this picture, so let’s see whether this alignment holds through the next close.
🧭 RSI14 is 48.5, and the MACD negative histogram bars are expanding: momentum is bearish, and a rebound still needs price confirmation. ATR14 is 0.47458 USDT, about 0.20% of the closing price, and is used to gauge the potential volatility range.
→ The base case is continued back-and-forth within the range: if price tests NVDA 236.61 USDT but fails to hold above it at the close, it may return to the middle of the range; if it tests NVDA 234.97 USDT, watch whether the low holds.
⚠️ What would change my view: If a subsequent 1-hour candle closes above NVDA 236.61 USDT or below NVDA 234.97 USDT, with volume exceeding the average of the previous 20 candles, I’d switch to a view favoring the breakout direction. Without increased volume, beware of a false breakout and wait for the next candle to confirm. Reassess if we move beyond the time window.
💬 Do you think the price will keep ranging, or will the next close pick a direction? Feel free to share which chart signal leads you to that view.
To keep following along, check the NVDA market data below against the conditions above.
Source: Binance USDT Perpetual | Rolling 24 hours | 2026/10/5 20:55:55 Beijing time.
For discussion only; not investment advice.
$BTC $ETH $NVDA
Over the next 1–4 hours, I’m leaning toward more back-and-forth within a range for the NVDA perpetual contract, with no clear one-way move yet. First, watch the NVDA 234.97 USDT–NVDA 236.61 USDT range. The price action feels a bit like “you move in, I move out,” so let’s not imagine a big move before it happens. 🫠
This analysis is based on Binance’s NVDAUSDT perpetual contract, quoted in USDT; the chart and volume data are both from this contract. The NVDA perpetual contract is currently around 235.64 USDT, up 0.38% over 24 hours and 0.41% below the high for this window. The price change hasn’t established a new directional advantage. Given the mixed signals on the chart, I’d rather interpret the next move as range-bound for now.
📊 Chart 1 | 1-hour, as of 20:00 Beijing time: The close remains within the range of the previous 20 candles. The MA20 has risen over the last 3 candles, with the close below it; volume is 2.30 times the average of the previous 20 candles, so this price move came with increased volume.
🔎 Chart 2 | NVDA 15-minute, as of 20:45 Beijing time: The close is below the MA20, volume is 1.82 times average, and the MA20 remains flat. The shorter timeframe isn’t clearly contradicting this picture, so let’s see whether this alignment holds through the next close.
🧭 RSI14 is 48.5, and the MACD negative histogram bars are expanding: momentum is bearish, and a rebound still needs price confirmation. ATR14 is 0.47458 USDT, about 0.20% of the closing price, and is used to gauge the potential volatility range.
→ The base case is continued back-and-forth within the range: if price tests NVDA 236.61 USDT but fails to hold above it at the close, it may return to the middle of the range; if it tests NVDA 234.97 USDT, watch whether the low holds.
⚠️ What would change my view: If a subsequent 1-hour candle closes above NVDA 236.61 USDT or below NVDA 234.97 USDT, with volume exceeding the average of the previous 20 candles, I’d switch to a view favoring the breakout direction. Without increased volume, beware of a false breakout and wait for the next candle to confirm. Reassess if we move beyond the time window.
💬 Do you think the price will keep ranging, or will the next close pick a direction? Feel free to share which chart signal leads you to that view.
To keep following along, check the NVDA market data below against the conditions above.
Source: Binance USDT Perpetual | Rolling 24 hours | 2026/10/5 20:55:55 Beijing time.
For discussion only; not investment advice.
$BTC $ETH $NVDA