How to find coins before they explode? Don’t start chasing from the top of the gainers list
“Can you find the next explosive coin in advance?”😏 I’ll first reframe the question: which coins are worth putting on a watchlist, and what signals mean you should take action? The goal is to filter out random chasing—without needing to know in advance who will explode. My sequence is: tighten the volatility, check relative strength, then wait for equal-price confirmation.
① First, look for accumulation: check whether the 1-hour Bollinger Band width has dropped to a low level for that coin over the past 30 days. When it retests the low, does it start to lift? Low-volume sideways consolidation can only get you onto the watchlist. You still need to verify order-book depth, bid-ask spread, and the unlock schedule. Thin, quiet trading can make the chart look “calm,” so don’t rely on that alone.
② Next, look for initiative: in the same timeframe, if BTC is moving sideways or pulling back, can this coin hold its range and decline less than the broader market? Then check whether spot trading volume heats up in sync. Increasing contract open interest doesn’t automatically mean more longs. If price stays flat while open interest spikes and the funding rate is relatively high, you should be extra careful—leverage can get crowded in the same direction.
③ Only then look for the trigger: for example, a 15-minute close breaks above the highs of the previous 20 candles, and volume exceeds 1.5 times the average volume of the previous 20 candles. After that, you pull back and hold it. This is an example of selection thresholds—you need to backtest per coin; it’s not a universal win-rate formula. A pullback with shrinking volume, followed by an upside push with increasing volume, is more worth following than chasing a single long upper wick intraday.
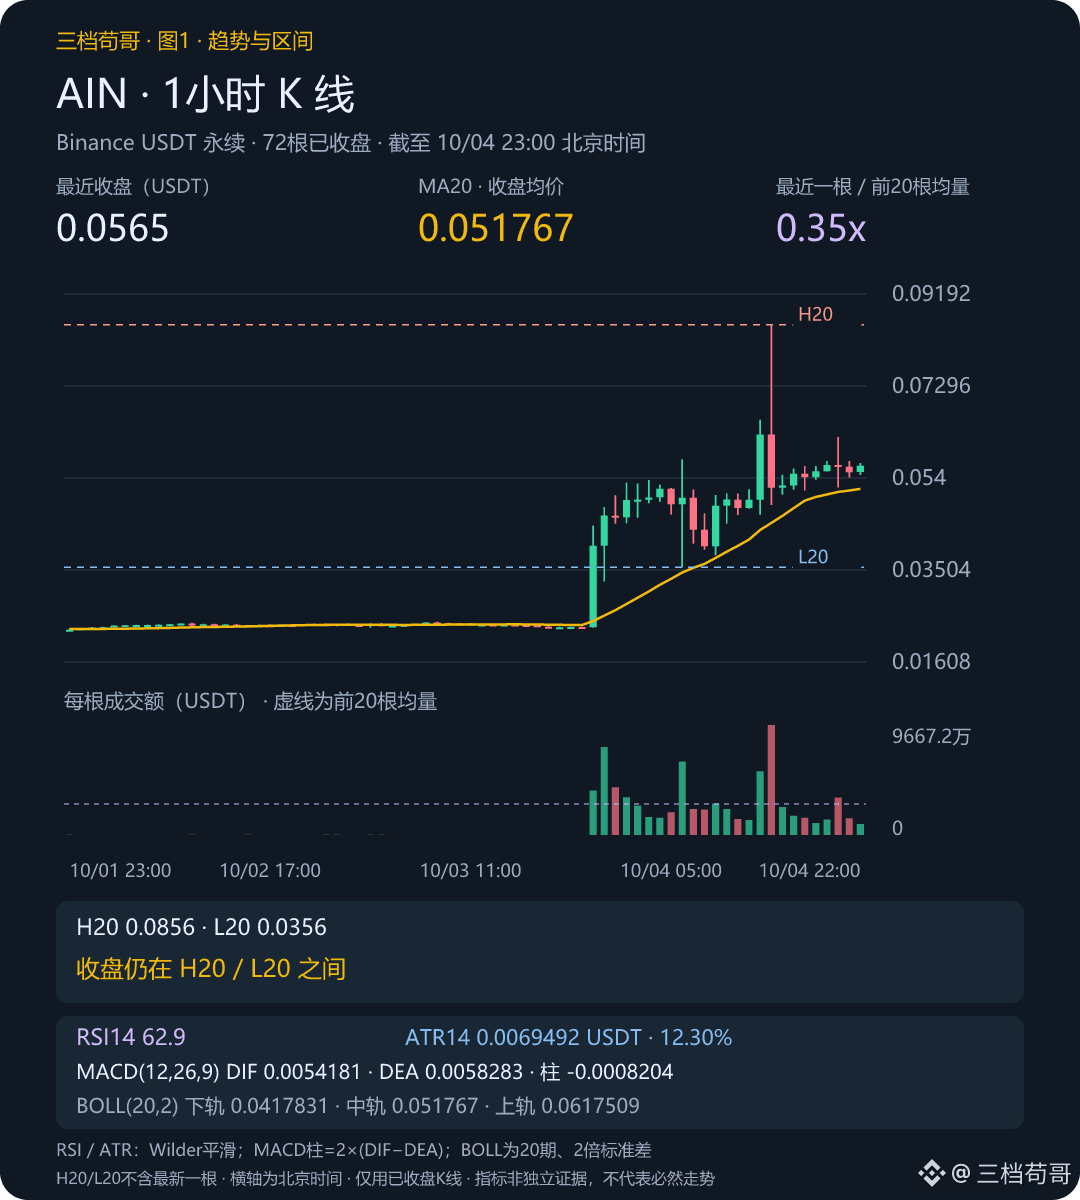
Here’s a counterexample: Beijing 23:00, the #1 coin AIN had a rolling 24-hour gain of 42.28%, but it had already retraced 33.48% from the window high. The hour’s volume ratio was only 0.35x, and the MACD negative histogram expanded. It looks strong on the list, but it may have already gone through the surge and the subsequent pullback—so don’t treat ranking as a direct “ignition” signal.
⚠️ Write the invalidation conditions before you take action: if, after the breakout, price closes back inside the original range, cancel the breakout assumption. Suppose entry is 10 and stop-loss is 9.7; the risk is 0.3. If the target is only 10.2, then the profit-to-risk ratio (before fees) is just 0.67—not worth forcing a trade just to avoid missing the move. Also, stop-loss orders may slip.
📊 Figure 1|AIN 1h (23:00 Beijing): close 0.0565 USDT, volume ratio 0.35x.
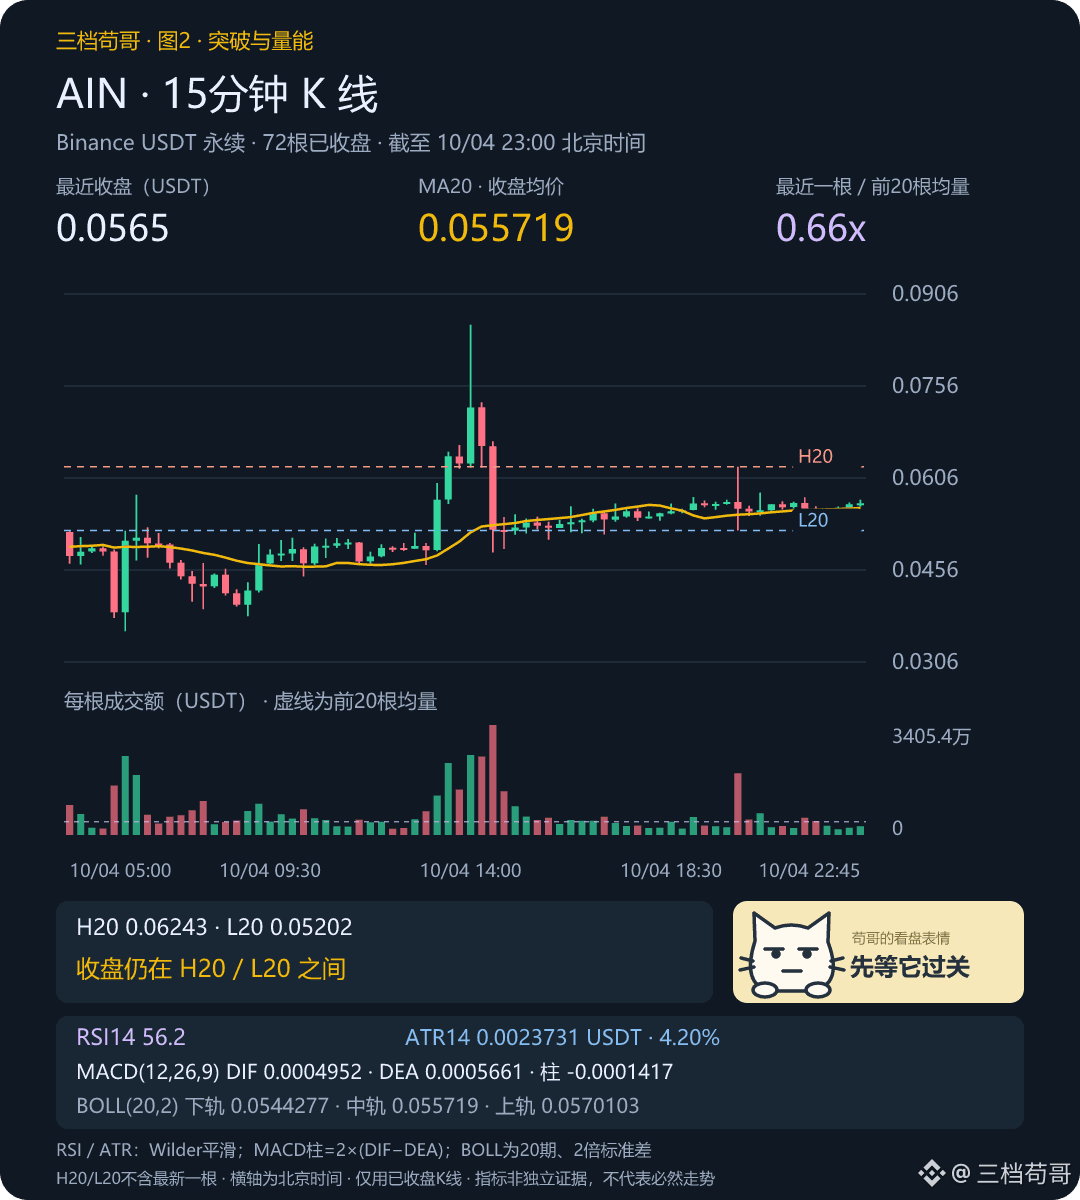
🔎 Figure 2|AIN 15m (23:00 Beijing): close 0.0565 USDT, volume ratio 0.66x.
💬 Do you more often run into “charging in without waiting for confirmation,” or “only noticing after the gainers list shows up”? For the next trade, which additional filter condition are you going to add?
I’ll keep the conditions above, and continue to cross-check using the AIN行情 below.
Source: Binance USDT perpetual market data and AIN’s closed candlesticks; Beijing 2026-10-04 23:00 snapshot. The method thresholds and the 10-yuan example are for teaching assumptions only. The three tags at the end are selected as the top three by rolling 24-hour gain right before release; they are for observation only and do not represent buy recommendations.
For communication only; not investment advice.
$COLLECT $AIN $STRK
“Can you find the next explosive coin in advance?”😏 I’ll first reframe the question: which coins are worth putting on a watchlist, and what signals mean you should take action? The goal is to filter out random chasing—without needing to know in advance who will explode. My sequence is: tighten the volatility, check relative strength, then wait for equal-price confirmation.
① First, look for accumulation: check whether the 1-hour Bollinger Band width has dropped to a low level for that coin over the past 30 days. When it retests the low, does it start to lift? Low-volume sideways consolidation can only get you onto the watchlist. You still need to verify order-book depth, bid-ask spread, and the unlock schedule. Thin, quiet trading can make the chart look “calm,” so don’t rely on that alone.
② Next, look for initiative: in the same timeframe, if BTC is moving sideways or pulling back, can this coin hold its range and decline less than the broader market? Then check whether spot trading volume heats up in sync. Increasing contract open interest doesn’t automatically mean more longs. If price stays flat while open interest spikes and the funding rate is relatively high, you should be extra careful—leverage can get crowded in the same direction.
③ Only then look for the trigger: for example, a 15-minute close breaks above the highs of the previous 20 candles, and volume exceeds 1.5 times the average volume of the previous 20 candles. After that, you pull back and hold it. This is an example of selection thresholds—you need to backtest per coin; it’s not a universal win-rate formula. A pullback with shrinking volume, followed by an upside push with increasing volume, is more worth following than chasing a single long upper wick intraday.
Here’s a counterexample: Beijing 23:00, the #1 coin AIN had a rolling 24-hour gain of 42.28%, but it had already retraced 33.48% from the window high. The hour’s volume ratio was only 0.35x, and the MACD negative histogram expanded. It looks strong on the list, but it may have already gone through the surge and the subsequent pullback—so don’t treat ranking as a direct “ignition” signal.
⚠️ Write the invalidation conditions before you take action: if, after the breakout, price closes back inside the original range, cancel the breakout assumption. Suppose entry is 10 and stop-loss is 9.7; the risk is 0.3. If the target is only 10.2, then the profit-to-risk ratio (before fees) is just 0.67—not worth forcing a trade just to avoid missing the move. Also, stop-loss orders may slip.
📊 Figure 1|AIN 1h (23:00 Beijing): close 0.0565 USDT, volume ratio 0.35x.
🔎 Figure 2|AIN 15m (23:00 Beijing): close 0.0565 USDT, volume ratio 0.66x.
💬 Do you more often run into “charging in without waiting for confirmation,” or “only noticing after the gainers list shows up”? For the next trade, which additional filter condition are you going to add?
I’ll keep the conditions above, and continue to cross-check using the AIN行情 below.
Source: Binance USDT perpetual market data and AIN’s closed candlesticks; Beijing 2026-10-04 23:00 snapshot. The method thresholds and the 10-yuan example are for teaching assumptions only. The three tags at the end are selected as the top three by rolling 24-hour gain right before release; they are for observation only and do not represent buy recommendations.
For communication only; not investment advice.
$COLLECT $AIN $STRK