
Raad imran
80 Posts

Raad imran
Report
Block User
2 Following
2 Followers
82 Liked
Posts
·
--
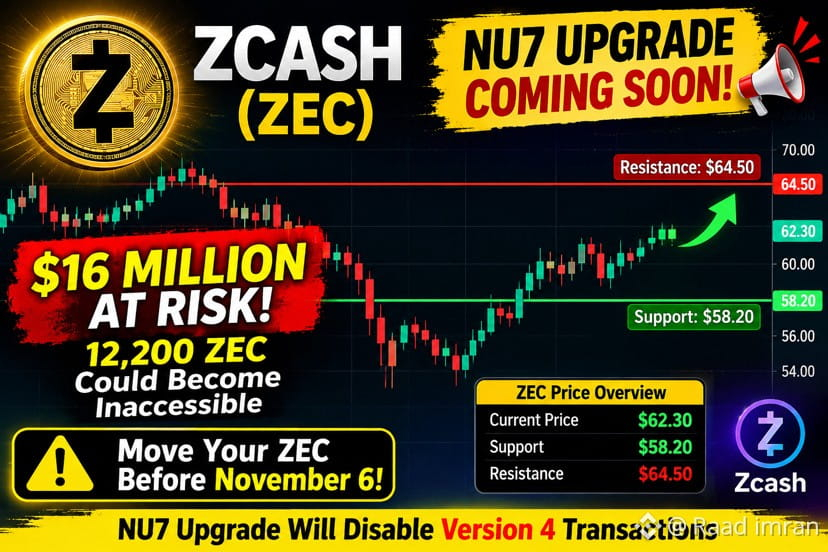
$ZEC is preparing for its upcoming NU7 network upgrade, which could permanently restrict access to approximately 12,200 ZEC held in the Sprout privacy pool. The upgrade will disable version 4 transactions, preventing holders from transferring these funds after activation. Users must move their ZEC before the scheduled November 6 upgrade. Although a future recovery may remain technically possible, access is not guaranteed.
⚠️ Important: ZEC holders should pay close attention to the upgrade deadline.
#Zcash #ZECUSDT #blockchain
{spot}(ZECUSDT)
$ZEC is preparing for its upcoming NU7 network upgrade, which could permanently restrict access to approximately 12,200 ZEC held in the Sprout privacy pool. The upgrade will disable version 4 transactions, preventing holders from transferring these funds after activation. Users must move their ZEC before the scheduled November 6 upgrade. Although a future recovery may remain technically possible, access is not guaranteed.
⚠️ Important: ZEC holders should pay close attention to the upgrade deadline.
#Zcash #ZECUSDT #blockchain
⚠️ Important: ZEC holders should pay close attention to the upgrade deadline.
#Zcash #ZECUSDT #blockchain
1
309
·
--
Article
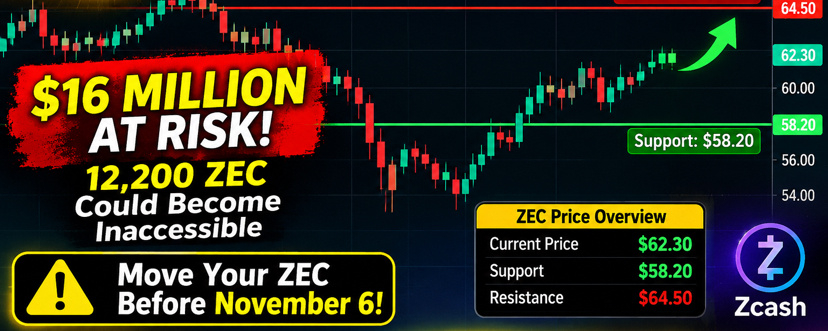
🚨 ZCASH (ZEC) ALERT: $16 MILLION IN ZEC COULD BECOME INACCESSIBLE!$ZEC is preparing to introduce its upcoming NU7 network upgrade, which could have a major impact on approximately 12,200 ZEC currently held in the Sprout privacy pool, valued at nearly $16 million.
The upgrade is expected to disable Version 4 transactions, the only transaction format capable of transferring funds out of the Sprout pool. Once the upgrade becomes active on November 6, holders who have not moved their ZEC beforehand may permanently lose access to their funds.
This development is particularly important for long-term ZEC holders, as even valid private keys may no longer be sufficient to transfer these tokens after activation. Although a future network upgrade could potentially restore access, there is no guarantee that transfers will ever be re-enabled.
#Zcash #zec #blockchain #PrivacyCoins
{future}(ZECUSDT)
🚨 ZCASH (ZEC) ALERT: $16 MILLION IN ZEC COULD BECOME INACCESSIBLE!
$ZEC is preparing to introduce its upcoming NU7 network upgrade, which could have a major impact on approximately 12,200 ZEC currently held in the Sprout privacy pool, valued at nearly $16 million.
The upgrade is expected to disable Version 4 transactions, the only transaction format capable of transferring funds out of the Sprout pool. Once the upgrade becomes active on November 6, holders who have not moved their ZEC beforehand may permanently lose access to their funds.
This development is particularly important for long-term ZEC holders, as even valid private keys may no longer be sufficient to transfer these tokens after activation. Although a future network upgrade could potentially restore access, there is no guarantee that transfers will ever be re-enabled.
#Zcash #zec #blockchain #PrivacyCoins
The upgrade is expected to disable Version 4 transactions, the only transaction format capable of transferring funds out of the Sprout pool. Once the upgrade becomes active on November 6, holders who have not moved their ZEC beforehand may permanently lose access to their funds.
This development is particularly important for long-term ZEC holders, as even valid private keys may no longer be sufficient to transfer these tokens after activation. Although a future network upgrade could potentially restore access, there is no guarantee that transfers will ever be re-enabled.
#Zcash #zec #blockchain #PrivacyCoins
1
394
·
--
🔥 $ETH $BULLISH MOMENTUM BUILDING
Ethereum (ETH) is showing strong recovery momentum, with buyers attempting to push the price toward higher resistance zones. The daily technical outlook remains bullish, supported by positive moving averages and improving momentum. ETH is trading around $2,421, with RSI near 54, suggesting room for further movement. A breakout above $2,453 could strengthen the bullish trend and open the way toward $2,496. However, losing $2,390 may trigger renewed selling pressure. Traders should watch volume and daily candle closes before entering positions.
ETH/USD — DAILY CANDLE CHART
📊 INDICATOR LEVELS
Indicator Level
Current reference price. $2,421
RSI (14). 53.8
Support. $2,390
Resistance. $2,453
Next resistance. $2,496
🚀 Market Strategy: Bullish above $2,453; caution below $2,390.
#Ethereum #ETH #CryptoAnalysis #CryptoTrading
🔥 $ETH $BULLISH MOMENTUM BUILDING
Ethereum (ETH) is showing strong recovery momentum, with buyers attempting to push the price toward higher resistance zones. The daily technical outlook remains bullish, supported by positive moving averages and improving momentum. ETH is trading around $2,421, with RSI near 54, suggesting room for further movement. A breakout above $2,453 could strengthen the bullish trend and open the way toward $2,496. However, losing $2,390 may trigger renewed selling pressure. Traders should watch volume and daily candle closes before entering positions.
ETH/USD — DAILY CANDLE CHART
📊 INDICATOR LEVELS
Indicator Level
Current reference price. $2,421
RSI (14). 53.8
Support. $2,390
Resistance. $2,453
Next resistance. $2,496
🚀 Market Strategy: Bullish above $2,453; caution below $2,390.
#Ethereum #ETH #CryptoAnalysis #CryptoTrading
Ethereum (ETH) is showing strong recovery momentum, with buyers attempting to push the price toward higher resistance zones. The daily technical outlook remains bullish, supported by positive moving averages and improving momentum. ETH is trading around $2,421, with RSI near 54, suggesting room for further movement. A breakout above $2,453 could strengthen the bullish trend and open the way toward $2,496. However, losing $2,390 may trigger renewed selling pressure. Traders should watch volume and daily candle closes before entering positions.
ETH/USD — DAILY CANDLE CHART
📊 INDICATOR LEVELS
Indicator Level
Current reference price. $2,421
RSI (14). 53.8
Support. $2,390
Resistance. $2,453
Next resistance. $2,496
🚀 Market Strategy: Bullish above $2,453; caution below $2,390.
#Ethereum #ETH #CryptoAnalysis #CryptoTrading
1
73
·
--

Article
🚨🔥 CRYPTO’S NEXT BIG WINNERS? ZEC, PEPE & HYPE ARE TAKING THE SPOTLIGHT!The market is heating up again! Zcash (ZEC) is attracting buyers with a powerful recovery, PEPE is gaining meme-coin momentum, and Hyperliquid (HYPE) is showing renewed strength.
📊 THE BIG OPPORTUNITY: DeFi tokens and selected altcoins are leading the latest recovery, but Bitcoin’s direction remains crucial for the next market move.
🚀 $ZEC –Privacy coin momentum
Bullish momentum is building as privacy-focused crypto attracts fresh attention.
🐸 $PEPE –Meme-coin comeback
Meme-coin excitement is returning, with traders watching for a potential breakout.
⚡ $HYPE – DeFi strength
DeFi strength is gaining attention as buyers look for the next upward move.
Which coin will lead the next rally? Pick your winner and tell us why in the comments!
#CryptoMarket #zec #PEPE #hype #altcoins
{spot}(ZECUSDT)
{spot}(PEPEUSDT)
{future}(HYPEUSDT)
🚨🔥 CRYPTO’S NEXT BIG WINNERS? ZEC, PEPE & HYPE ARE TAKING THE SPOTLIGHT!
The market is heating up again! Zcash (ZEC) is attracting buyers with a powerful recovery, PEPE is gaining meme-coin momentum, and Hyperliquid (HYPE) is showing renewed strength.
📊 THE BIG OPPORTUNITY: DeFi tokens and selected altcoins are leading the latest recovery, but Bitcoin’s direction remains crucial for the next market move.
🚀 $ZEC –Privacy coin momentum
Bullish momentum is building as privacy-focused crypto attracts fresh attention.
🐸 $PEPE –Meme-coin comeback
Meme-coin excitement is returning, with traders watching for a potential breakout.
⚡ $HYPE – DeFi strength
DeFi strength is gaining attention as buyers look for the next upward move.
Which coin will lead the next rally? Pick your winner and tell us why in the comments!
#CryptoMarket #zec #PEPE #hype #altcoins
📊 THE BIG OPPORTUNITY: DeFi tokens and selected altcoins are leading the latest recovery, but Bitcoin’s direction remains crucial for the next market move.
🚀 $ZEC –Privacy coin momentum
Bullish momentum is building as privacy-focused crypto attracts fresh attention.
🐸 $PEPE –Meme-coin comeback
Meme-coin excitement is returning, with traders watching for a potential breakout.
⚡ $HYPE – DeFi strength
DeFi strength is gaining attention as buyers look for the next upward move.
Which coin will lead the next rally? Pick your winner and tell us why in the comments!
#CryptoMarket #zec #PEPE #hype #altcoins
1
539
·
--
🐸🚀 $PEPE COIN: IS THE NEXT BIG PUMP COMING?
PEPE is catching traders’ attention as bullish momentum builds. A breakout above resistance could trigger a powerful rally, but losing support may bring a sharp pullback.
🔥 Are you buying, holding, or selling PEPE? Drop your prediction in the comments!
#PEPE #pepecoin #Binance #memecoins #Bullish
{spot}(PEPEUSDT)
{future}(1000PEPEUSDT)
🐸🚀 $PEPE COIN: IS THE NEXT BIG PUMP COMING?
PEPE is catching traders’ attention as bullish momentum builds. A breakout above resistance could trigger a powerful rally, but losing support may bring a sharp pullback.
🔥 Are you buying, holding, or selling PEPE? Drop your prediction in the comments!
#PEPE #pepecoin #Binance #memecoins #Bullish
PEPE is catching traders’ attention as bullish momentum builds. A breakout above resistance could trigger a powerful rally, but losing support may bring a sharp pullback.
🔥 Are you buying, holding, or selling PEPE? Drop your prediction in the comments!
#PEPE #pepecoin #Binance #memecoins #Bullish

1
79
·
--
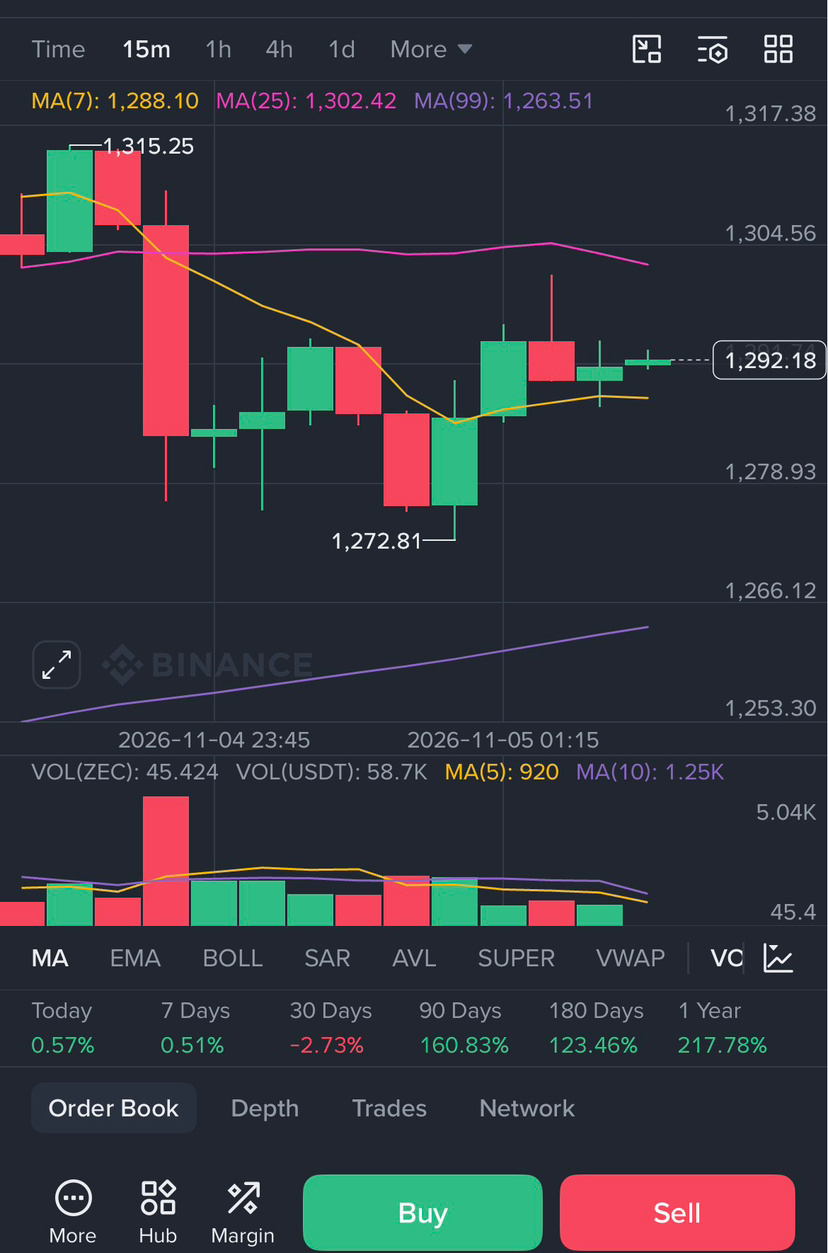
🚀 $ZEC (ZEC): THE NEXT BIG BREAKOUT OR A MASSIVE PRICE REVERSAL?
Zcash is attracting market attention as bullish momentum builds and buyers challenge key resistance levels. A strong breakout with rising volume could trigger another powerful rally, while rejection may create a short-term correction. Traders should watch RSI, MACD, and volume for confirmation. Is ZEC preparing for its next explosive move? 👀🔥
#zcash #ZECUSDT #Binance #BullishMomentum #cryptotradingpro
$ZEC
{future}(ZECUSDT)
🚀 $ZEC (ZEC): THE NEXT BIG BREAKOUT OR A MASSIVE PRICE REVERSAL?
Zcash is attracting market attention as bullish momentum builds and buyers challenge key resistance levels. A strong breakout with rising volume could trigger another powerful rally, while rejection may create a short-term correction. Traders should watch RSI, MACD, and volume for confirmation. Is ZEC preparing for its next explosive move? 👀🔥
#zcash #ZECUSDT #Binance #BullishMomentum #cryptotradingpro
$ZEC
Zcash is attracting market attention as bullish momentum builds and buyers challenge key resistance levels. A strong breakout with rising volume could trigger another powerful rally, while rejection may create a short-term correction. Traders should watch RSI, MACD, and volume for confirmation. Is ZEC preparing for its next explosive move? 👀🔥
#zcash #ZECUSDT #Binance #BullishMomentum #cryptotradingpro
$ZEC
1
440
·
--
Bullish
$BTC
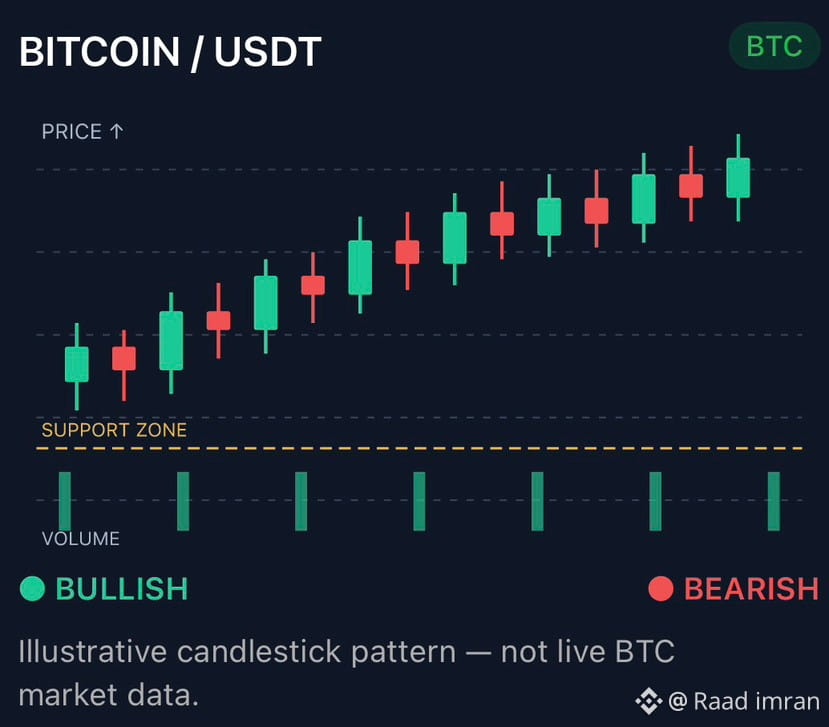
Bitcoin is approaching a critical market zone where the next move could determine short-term momentum. Bulls need a strong breakout above resistance with increasing trading volume to confirm further upside. However, failure to hold key support could trigger another bearish move. RSI and moving averages remain important indicators to watch as traders look for confirmation. BTC’s next major move depends on whether buyers can maintain control or sellers regain dominance.
Trading outlook: Watch $81,793 resistance and $76,768 support for breakout or breakdown confirmation.
#BTC #bitcoin #TechnicalAnalysis #CryptoMarketTrends #BullishMomentum
{future}(BTCUSDT)
$BTC
Bitcoin is approaching a critical market zone where the next move could determine short-term momentum. Bulls need a strong breakout above resistance with increasing trading volume to confirm further upside. However, failure to hold key support could trigger another bearish move. RSI and moving averages remain important indicators to watch as traders look for confirmation. BTC’s next major move depends on whether buyers can maintain control or sellers regain dominance.
Trading outlook: Watch $81,793 resistance and $76,768 support for breakout or breakdown confirmation.
#BTC #bitcoin #TechnicalAnalysis #CryptoMarketTrends #BullishMomentum
Bitcoin is approaching a critical market zone where the next move could determine short-term momentum. Bulls need a strong breakout above resistance with increasing trading volume to confirm further upside. However, failure to hold key support could trigger another bearish move. RSI and moving averages remain important indicators to watch as traders look for confirmation. BTC’s next major move depends on whether buyers can maintain control or sellers regain dominance.
Trading outlook: Watch $81,793 resistance and $76,768 support for breakout or breakdown confirmation.
#BTC #bitcoin #TechnicalAnalysis #CryptoMarketTrends #BullishMomentum
1
83
·
--
$BNB COIN – STRONG TECHNICAL ANALYSIS.
Binance Coin ( $BNB ) | Professional Trader's Market Outlook.
BNB continues to be one of the most important assets in the crypto market, with its price action closely watched by traders. From a technical perspective, the key factors to monitor are market structure, trading volume, support and resistance zones, and momentum. A strong bullish breakout supported by increasing volume could signal further upside, while rejection near resistance may trigger short-term profit-taking. Traders should watch for higher highs and higher lows to confirm bullish momentum. If buyers maintain control, BNB could attempt another upward move; however, a breakdown below key support would increase bearish pressure. The next decisive move will depend on volume confirmation and Bitcoin's overall market direction.
Trading outlook: Bullish above confirmed support; cautious if support breaks.
BNB/USDT – Key Trading Levels
Based on the November 4 market readings:
⚡ INDICATOR LEVEL
Latest reported close $718.88
Resistance (1) $726.12
Resistance (2) $753.90
Support (1) $711.77
Support (2) $688.42
Daily RSI 47
The indicators show mixed momentum, making confirmation important before entering a trade. 
#bnb #BNB_Market_Update #BNBUSDT #BullishMomentum #Altcoins
{future}(BNBUSDT)
$BNB COIN – STRONG TECHNICAL ANALYSIS.
Binance Coin ( $BNB ) | Professional Trader's Market Outlook.
BNB continues to be one of the most important assets in the crypto market, with its price action closely watched by traders. From a technical perspective, the key factors to monitor are market structure, trading volume, support and resistance zones, and momentum. A strong bullish breakout supported by increasing volume could signal further upside, while rejection near resistance may trigger short-term profit-taking. Traders should watch for higher highs and higher lows to confirm bullish momentum. If buyers maintain control, BNB could attempt another upward move; however, a breakdown below key support would increase bearish pressure. The next decisive move will depend on volume confirmation and Bitcoin's overall market direction.
Trading outlook: Bullish above confirmed support; cautious if support breaks.
BNB/USDT – Key Trading Levels
Based on the November 4 market readings:
⚡ INDICATOR LEVEL
Latest reported close $718.88
Resistance (1) $726.12
Resistance (2) $753.90
Support (1) $711.77
Support (2) $688.42
Daily RSI 47
The indicators show mixed momentum, making confirmation important before entering a trade. 
#bnb #BNB_Market_Update #BNBUSDT #BullishMomentum #Altcoins
Binance Coin ( $BNB ) | Professional Trader's Market Outlook.
BNB continues to be one of the most important assets in the crypto market, with its price action closely watched by traders. From a technical perspective, the key factors to monitor are market structure, trading volume, support and resistance zones, and momentum. A strong bullish breakout supported by increasing volume could signal further upside, while rejection near resistance may trigger short-term profit-taking. Traders should watch for higher highs and higher lows to confirm bullish momentum. If buyers maintain control, BNB could attempt another upward move; however, a breakdown below key support would increase bearish pressure. The next decisive move will depend on volume confirmation and Bitcoin's overall market direction.
Trading outlook: Bullish above confirmed support; cautious if support breaks.
BNB/USDT – Key Trading Levels
Based on the November 4 market readings:
⚡ INDICATOR LEVEL
Latest reported close $718.88
Resistance (1) $726.12
Resistance (2) $753.90
Support (1) $711.77
Support (2) $688.42
Daily RSI 47
The indicators show mixed momentum, making confirmation important before entering a trade. 
#bnb #BNB_Market_Update #BNBUSDT #BullishMomentum #Altcoins
1
75
·
--

Article
CRYPTO MARKET
CRASH OR COMEBACK?
THE NEXT BIG MOVE IS COMING?🚨 CRYPTO MARKET SHAKE-UP: THE NEXT BIG OPPORTUNITY IS COMING?
The crypto market is testing traders’ patience! Bitcoin is struggling around the $77K zone, institutional ETF outflows are creating pressure, and market sentiment remains cautious.
But here’s what smart traders should understand: Market fear doesn’t always mean the end of an opportunity.
🔥 Three things I’m watching closely:
📌 BITCOIN ( $BTC ): The $76K–$77K region is an important area to monitor. A strong recovery could restore market confidence.
📌 HYPERLIQUID ( $HYPE ): Relative strength makes this altcoin worth watching for potential momentum continuation.
📌 $PEPE : Meme coin activity remains interesting. Watch volume and resistance before expecting another breakout.
🎯 MY TRADER VIEW: Don’t blindly buy the dip or panic-sell the correction. Watch liquidity, volume, BTC dominance and key support levels. The next move will reward patience, not emotional trading.
💬 ONE BIG QUESTION:
Are we preparing for another major crypto crash, or is this the setup before the next bullish rally?
#bitcoin #hype #PEPE #CryptoMarketMoves #altcoins
{future}(BTCUSDT)
{future}(HYPEUSDT)
{spot}(PEPEUSDT)
CRYPTO MARKET CRASH OR COMEBACK? THE NEXT BIG MOVE IS COMING?
🚨 CRYPTO MARKET SHAKE-UP: THE NEXT BIG OPPORTUNITY IS COMING?
The crypto market is testing traders’ patience! Bitcoin is struggling around the $77K zone, institutional ETF outflows are creating pressure, and market sentiment remains cautious.
But here’s what smart traders should understand: Market fear doesn’t always mean the end of an opportunity.
🔥 Three things I’m watching closely:
📌 BITCOIN ( $BTC ): The $76K–$77K region is an important area to monitor. A strong recovery could restore market confidence.
📌 HYPERLIQUID ( $HYPE ): Relative strength makes this altcoin worth watching for potential momentum continuation.
📌 $PEPE : Meme coin activity remains interesting. Watch volume and resistance before expecting another breakout.
🎯 MY TRADER VIEW: Don’t blindly buy the dip or panic-sell the correction. Watch liquidity, volume, BTC dominance and key support levels. The next move will reward patience, not emotional trading.
💬 ONE BIG QUESTION:
Are we preparing for another major crypto crash, or is this the setup before the next bullish rally?
#bitcoin #hype #PEPE #CryptoMarketMoves #altcoins
The crypto market is testing traders’ patience! Bitcoin is struggling around the $77K zone, institutional ETF outflows are creating pressure, and market sentiment remains cautious.
But here’s what smart traders should understand: Market fear doesn’t always mean the end of an opportunity.
🔥 Three things I’m watching closely:
📌 BITCOIN ( $BTC ): The $76K–$77K region is an important area to monitor. A strong recovery could restore market confidence.
📌 HYPERLIQUID ( $HYPE ): Relative strength makes this altcoin worth watching for potential momentum continuation.
📌 $PEPE : Meme coin activity remains interesting. Watch volume and resistance before expecting another breakout.
🎯 MY TRADER VIEW: Don’t blindly buy the dip or panic-sell the correction. Watch liquidity, volume, BTC dominance and key support levels. The next move will reward patience, not emotional trading.
💬 ONE BIG QUESTION:
Are we preparing for another major crypto crash, or is this the setup before the next bullish rally?
#bitcoin #hype #PEPE #CryptoMarketMoves #altcoins
1
252
·
--
Bullish
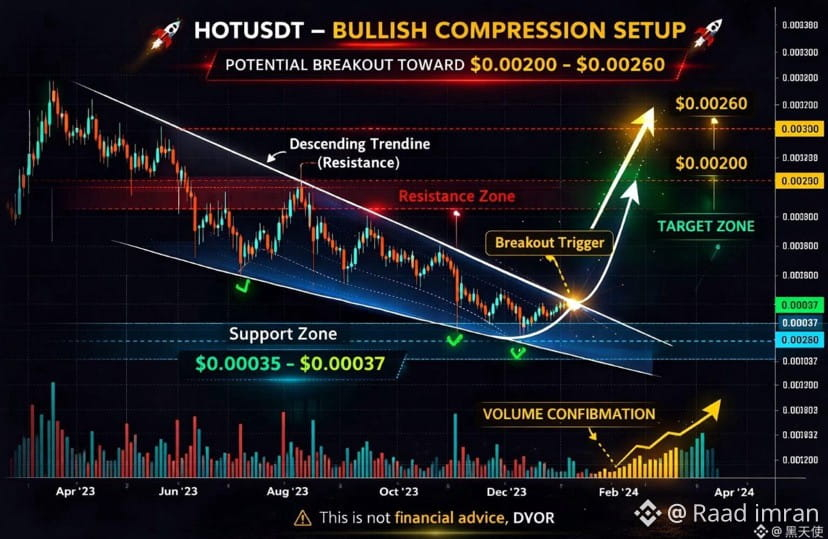
$HOT
#HOT is attracting attention as traders watch for a potential bullish reversal. A breakout above recent resistance, supported by strong trading volume, could trigger another upward move. However, rejection at resistance may bring renewed selling pressure toward the previous support zone. RSI and MACD confirmation will be important before taking a position.
Trader's strategy: Watch for a confirmed breakout and retest before entering long. Keep a tight stop-loss and avoid chasing sudden price spikes.
Market outlook: Cautiously bullish if buyers maintain support; bearish if support breaks.
#HOT #Holo #HOT/USDT $HOT
{future}(HOTUSDT)
$HOT
#HOT is attracting attention as traders watch for a potential bullish reversal. A breakout above recent resistance, supported by strong trading volume, could trigger another upward move. However, rejection at resistance may bring renewed selling pressure toward the previous support zone. RSI and MACD confirmation will be important before taking a position.
Trader's strategy: Watch for a confirmed breakout and retest before entering long. Keep a tight stop-loss and avoid chasing sudden price spikes.
Market outlook: Cautiously bullish if buyers maintain support; bearish if support breaks.
#HOT #Holo #HOT/USDT $HOT
#HOT is attracting attention as traders watch for a potential bullish reversal. A breakout above recent resistance, supported by strong trading volume, could trigger another upward move. However, rejection at resistance may bring renewed selling pressure toward the previous support zone. RSI and MACD confirmation will be important before taking a position.
Trader's strategy: Watch for a confirmed breakout and retest before entering long. Keep a tight stop-loss and avoid chasing sudden price spikes.
Market outlook: Cautiously bullish if buyers maintain support; bearish if support breaks.
#HOT #Holo #HOT/USDT $HOT
2
271
·
--
Bullish
BUBBLEMAPS
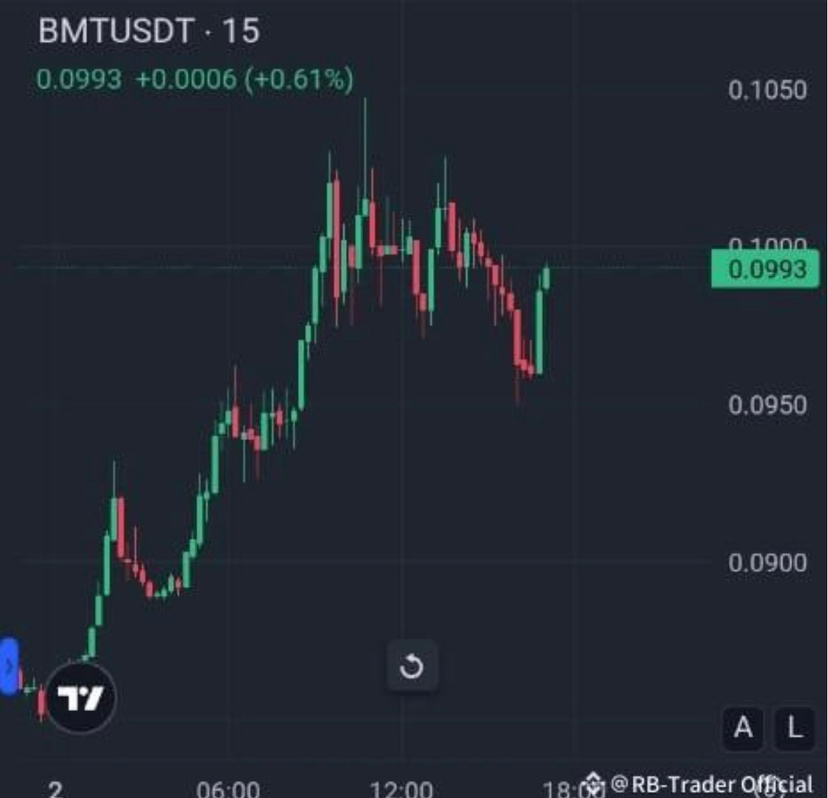
$BMT
BMT is a speculative altcoin worth watching for a potential bullish breakout. Buyers need to defend the current support zone and build volume to challenge the next resistance. A strong breakout with sustained buying pressure could trigger further upside, while rejection may lead to another correction.
Trading strategy: Wait for breakout confirmation, monitor volume and RSI, and use a strict stop-loss. Avoid entering during sudden price spikes.
Market outlook: Bullish above support; bearish if support breaks.
#BMT #Bubblemaps #Memecoins🤑🤑 #TradingCommunity
{future}(BMTUSDT)
BUBBLEMAPS
$BMT
BMT is a speculative altcoin worth watching for a potential bullish breakout. Buyers need to defend the current support zone and build volume to challenge the next resistance. A strong breakout with sustained buying pressure could trigger further upside, while rejection may lead to another correction.
Trading strategy: Wait for breakout confirmation, monitor volume and RSI, and use a strict stop-loss. Avoid entering during sudden price spikes.
Market outlook: Bullish above support; bearish if support breaks.
#BMT #Bubblemaps #Memecoins🤑🤑 #TradingCommunity
$BMT
BMT is a speculative altcoin worth watching for a potential bullish breakout. Buyers need to defend the current support zone and build volume to challenge the next resistance. A strong breakout with sustained buying pressure could trigger further upside, while rejection may lead to another correction.
Trading strategy: Wait for breakout confirmation, monitor volume and RSI, and use a strict stop-loss. Avoid entering during sudden price spikes.
Market outlook: Bullish above support; bearish if support breaks.
#BMT #Bubblemaps #Memecoins🤑🤑 #TradingCommunity
1
121
·
--
$ZEC (Zcash)
ZEC is showing high-volatility trading potential, with buyers attempting to regain bullish momentum. The key level to watch is resistance near $1,270. A strong breakout backed by rising volume could trigger another upward move, while rejection may push the price back toward $1,125 support. RSI and MACD confirmation will be important before entering a trade.
Trader's strategy: Wait for a confirmed breakout and retest. Avoid chasing green candles, use a strict stop-loss, and manage risk carefully.
Market outlook: Cautiously bullish above support; bearish if support breaks.
#zec #ZcashUSDT #BinanceSquareTalks $ZEC
{future}(ZECUSDT)
$ZEC (Zcash)
ZEC is showing high-volatility trading potential, with buyers attempting to regain bullish momentum. The key level to watch is resistance near $1,270. A strong breakout backed by rising volume could trigger another upward move, while rejection may push the price back toward $1,125 support. RSI and MACD confirmation will be important before entering a trade.
Trader's strategy: Wait for a confirmed breakout and retest. Avoid chasing green candles, use a strict stop-loss, and manage risk carefully.
Market outlook: Cautiously bullish above support; bearish if support breaks.
#zec #ZcashUSDT #BinanceSquareTalks $ZEC
ZEC is showing high-volatility trading potential, with buyers attempting to regain bullish momentum. The key level to watch is resistance near $1,270. A strong breakout backed by rising volume could trigger another upward move, while rejection may push the price back toward $1,125 support. RSI and MACD confirmation will be important before entering a trade.
Trader's strategy: Wait for a confirmed breakout and retest. Avoid chasing green candles, use a strict stop-loss, and manage risk carefully.
Market outlook: Cautiously bullish above support; bearish if support breaks.
#zec #ZcashUSDT #BinanceSquareTalks $ZEC
1
480
·
--
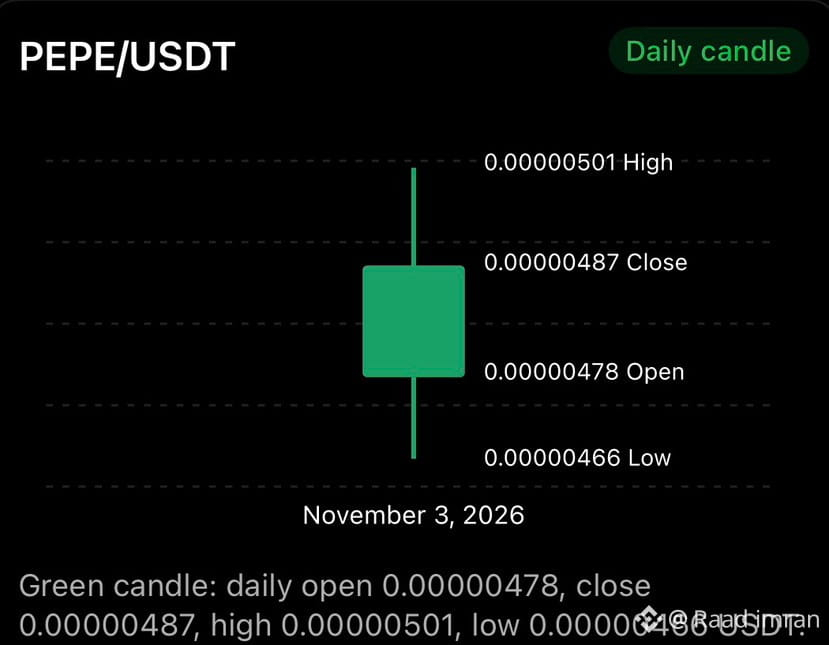
$PEPE Coin – Technical Analysis
$PEPE/USDT | Binance | Short-Term Outlook
PEPE is a high-volatility meme coin where momentum and trading volume play a major role. Technically, traders should watch for a breakout above nearby resistance, supported by strong buying volume, to confirm bullish momentum. If PEPE fails to hold its support zone, further downside pressure may develop. RSI and MACD confirmation can help identify the next potential move. A disciplined entry and stop-loss strategy remain essential.
Key levels to watch (USDT)
Support: $0.00000459–$0.00000466
Resistance: $0.00000501–$0.00000506
Bullish confirmation: Daily close above resistance with rising volume. 
Trading view: Watch for a confirmed breakout before considering a long entry. PEPE remains highly volatile, so avoid chasing sudden price spikes.
#PEPE #memecoins #BinanceIncidentReport
{spot}(PEPEUSDT)
$PEPE Coin – Technical Analysis
$PEPE /USDT | Binance | Short-Term Outlook
PEPE is a high-volatility meme coin where momentum and trading volume play a major role. Technically, traders should watch for a breakout above nearby resistance, supported by strong buying volume, to confirm bullish momentum. If PEPE fails to hold its support zone, further downside pressure may develop. RSI and MACD confirmation can help identify the next potential move. A disciplined entry and stop-loss strategy remain essential.
Key levels to watch (USDT)
Support: $0.00000459–$0.00000466
Resistance: $0.00000501–$0.00000506
Bullish confirmation: Daily close above resistance with rising volume. 
Trading view: Watch for a confirmed breakout before considering a long entry. PEPE remains highly volatile, so avoid chasing sudden price spikes.
#PEPE #memecoins #BinanceIncidentReport
$PEPE /USDT | Binance | Short-Term Outlook
PEPE is a high-volatility meme coin where momentum and trading volume play a major role. Technically, traders should watch for a breakout above nearby resistance, supported by strong buying volume, to confirm bullish momentum. If PEPE fails to hold its support zone, further downside pressure may develop. RSI and MACD confirmation can help identify the next potential move. A disciplined entry and stop-loss strategy remain essential.
Key levels to watch (USDT)
Support: $0.00000459–$0.00000466
Resistance: $0.00000501–$0.00000506
Bullish confirmation: Daily close above resistance with rising volume. 
Trading view: Watch for a confirmed breakout before considering a long entry. PEPE remains highly volatile, so avoid chasing sudden price spikes.
#PEPE #memecoins #BinanceIncidentReport
118
·
--
$HOT
HOT is showing potential for a bullish recovery, but traders should watch price action carefully before entering a position. A breakout above nearby resistance, supported by strong trading volume, could trigger further upside momentum. However, rejection at resistance may lead to another short-term correction.
Trading outlook: Bullish above support, with confirmation needed from volume and candle closes. Watch for a breakout or a retest before taking a trade. Risk management remains essential.
Key levels to watch (November 3, 2026):
Current reference price: $0.0004282
Support: $0.000386
Resistance: $0.000465
Breakout above resistance could strengthen bullish momentum; losing support could trigger another decline.
#HOT
{future}(HOTUSDT)
$HOT
HOT is showing potential for a bullish recovery, but traders should watch price action carefully before entering a position. A breakout above nearby resistance, supported by strong trading volume, could trigger further upside momentum. However, rejection at resistance may lead to another short-term correction.
Trading outlook: Bullish above support, with confirmation needed from volume and candle closes. Watch for a breakout or a retest before taking a trade. Risk management remains essential.
Key levels to watch (November 3, 2026):
Current reference price: $0.0004282
Support: $0.000386
Resistance: $0.000465
Breakout above resistance could strengthen bullish momentum; losing support could trigger another decline.
#HOT
HOT is showing potential for a bullish recovery, but traders should watch price action carefully before entering a position. A breakout above nearby resistance, supported by strong trading volume, could trigger further upside momentum. However, rejection at resistance may lead to another short-term correction.
Trading outlook: Bullish above support, with confirmation needed from volume and candle closes. Watch for a breakout or a retest before taking a trade. Risk management remains essential.
Key levels to watch (November 3, 2026):
Current reference price: $0.0004282
Support: $0.000386
Resistance: $0.000465
Breakout above resistance could strengthen bullish momentum; losing support could trigger another decline.
#HOT
171
·
--
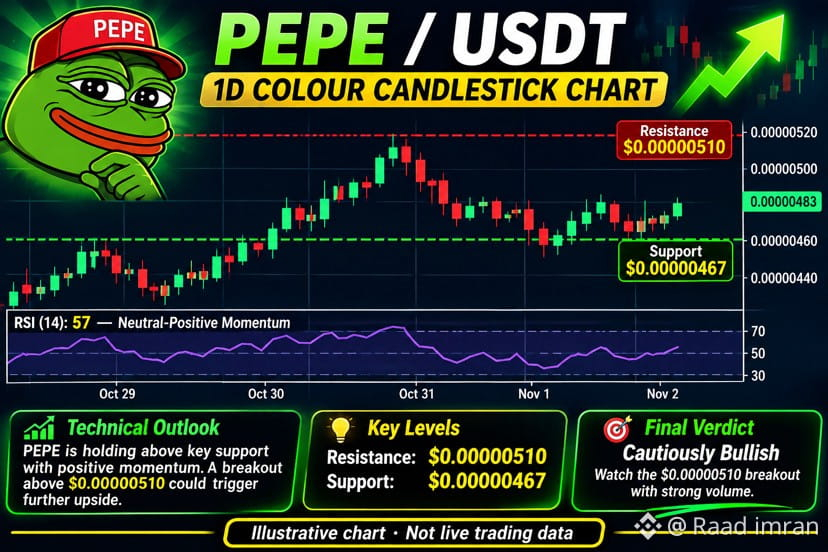
$PEPE (Pepe Coin) 🐸
PEPE/USDT is showing a bullish overall trend, but recent selling pressure suggests short-term caution. The daily RSI is around 57, indicating positive momentum without being overbought. Immediate support is near $0.00000467, while resistance stands around $0.00000510. A strong daily candle closing above resistance with rising volume could trigger another upward move. However, losing support may bring further downside toward $0.00000438.
PEPE Colour Candlestick Chart
 
#PEPE #pepecoin #memecoins #BullishMomentum
{alpha}(CT_195TMacq4TDUw5q8NFBwmbY4RLXvzvG5JTkvi)
$PEPE (Pepe Coin) 🐸
PEPE/USDT is showing a bullish overall trend, but recent selling pressure suggests short-term caution. The daily RSI is around 57, indicating positive momentum without being overbought. Immediate support is near $0.00000467, while resistance stands around $0.00000510. A strong daily candle closing above resistance with rising volume could trigger another upward move. However, losing support may bring further downside toward $0.00000438.
PEPE Colour Candlestick Chart
 
#PEPE #pepecoin #memecoins #BullishMomentum
PEPE/USDT is showing a bullish overall trend, but recent selling pressure suggests short-term caution. The daily RSI is around 57, indicating positive momentum without being overbought. Immediate support is near $0.00000467, while resistance stands around $0.00000510. A strong daily candle closing above resistance with rising volume could trigger another upward move. However, losing support may bring further downside toward $0.00000438.
PEPE Colour Candlestick Chart
 
#PEPE #pepecoin #memecoins #BullishMomentum
1
235
·
--

Article
Official Trump (TRUMP) & TSLAB ELON– Technical AnalysisOfficial Trump (TRUMP): $TRUMP remains a highly volatile political meme coin, with price movements strongly influenced by market sentiment and trading volume. Buyers need to defend key support levels to maintain bullish momentum. A strong breakout above resistance with increasing volume could trigger a fresh upward move, while rejection may lead to further correction.
Tesla (TSLAB): $TSLAB , representing tokenized Tesla stock exposure, offers a different trading opportunity driven by Tesla's market performance and broader investor sentiment. Traders should monitor support and resistance, moving-average trends, and volume confirmation. A sustained breakout could attract fresh buying interest, while weakness below support may signal further downside.
Technical Outlook: Official TRUMP is showing fragile momentum after a recent volume-driven rally. The key support zone is around $1.63, while resistance stands near $1.73–$1.80. A confirmed breakout could attract fresh buyers, but losing support may trigger another correction. Meanwhile, TSLAB (Tesla Tokenized Stock) is trading around $399–$403, with positive weekly momentum. The $397–$398 area is an important support zone, while $410–$412 is the next resistance area. A breakout above resistance could strengthen bullish sentiment, whereas a breakdown below support may increase selling pressure.
#TRUMP #TSLAB #Binance #CryptoAnalysis #memecoin
{future}(TRUMPUSDT)
{future}(TSLAUSDT)
Official Trump (TRUMP) & TSLAB ELON– Technical Analysis
Official Trump (TRUMP): $TRUMP remains a highly volatile political meme coin, with price movements strongly influenced by market sentiment and trading volume. Buyers need to defend key support levels to maintain bullish momentum. A strong breakout above resistance with increasing volume could trigger a fresh upward move, while rejection may lead to further correction.
Tesla (TSLAB): $TSLAB , representing tokenized Tesla stock exposure, offers a different trading opportunity driven by Tesla's market performance and broader investor sentiment. Traders should monitor support and resistance, moving-average trends, and volume confirmation. A sustained breakout could attract fresh buying interest, while weakness below support may signal further downside.
Technical Outlook: Official TRUMP is showing fragile momentum after a recent volume-driven rally. The key support zone is around $1.63, while resistance stands near $1.73–$1.80. A confirmed breakout could attract fresh buyers, but losing support may trigger another correction. Meanwhile, TSLAB (Tesla Tokenized Stock) is trading around $399–$403, with positive weekly momentum. The $397–$398 area is an important support zone, while $410–$412 is the next resistance area. A breakout above resistance could strengthen bullish sentiment, whereas a breakdown below support may increase selling pressure.
#TRUMP #TSLAB #Binance #CryptoAnalysis #memecoin
Tesla (TSLAB): $TSLAB , representing tokenized Tesla stock exposure, offers a different trading opportunity driven by Tesla's market performance and broader investor sentiment. Traders should monitor support and resistance, moving-average trends, and volume confirmation. A sustained breakout could attract fresh buying interest, while weakness below support may signal further downside.
Technical Outlook: Official TRUMP is showing fragile momentum after a recent volume-driven rally. The key support zone is around $1.63, while resistance stands near $1.73–$1.80. A confirmed breakout could attract fresh buyers, but losing support may trigger another correction. Meanwhile, TSLAB (Tesla Tokenized Stock) is trading around $399–$403, with positive weekly momentum. The $397–$398 area is an important support zone, while $410–$412 is the next resistance area. A breakout above resistance could strengthen bullish sentiment, whereas a breakdown below support may increase selling pressure.
#TRUMP #TSLAB #Binance #CryptoAnalysis #memecoin
1
878
·
--
Bullish
$HOT (Holo) Coin – Bullish Momentum Building? 🚀
Holo (HOT) is showing signs of recovery after recent selling pressure. HOT has gained positive momentum, with buyers attempting to push the price toward higher resistance levels. The key challenge is sustaining this recovery with strong trading volume.
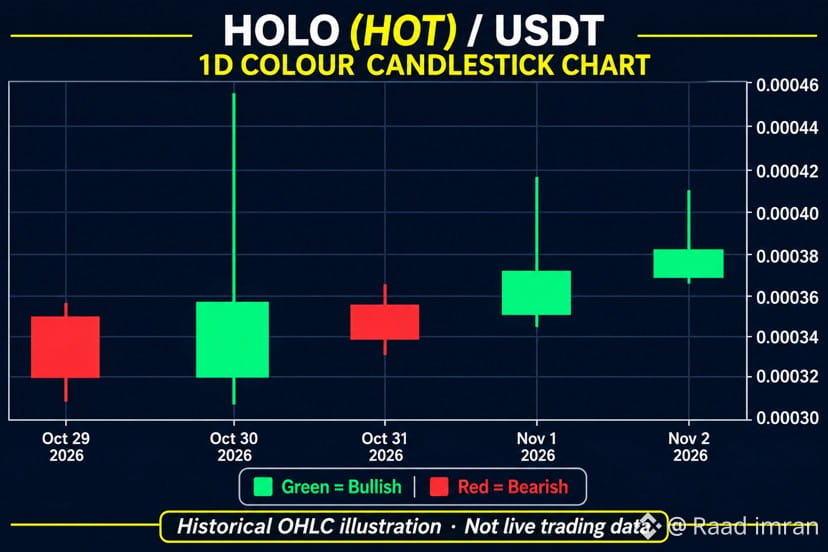
Technical Analysis: HOT is trading around $0.000381, with nearby resistance at $0.000390–$0.000410. Immediate support stands around $0.000368. A strong breakout above resistance could open the door for further upside, while losing support may trigger another pullback. RSI near 52 indicates neutral momentum with room for further movement.
HOT/USDT 1D · Historical OHLC
Illustrative candlestick visualization using reported daily OHLC data for Oct 29–Nov 2, 2026. Green = bullish candle; red = bearish candle. 
Final Verdict: HOT could offer a recovery opportunity if buyers maintain control and volume increases. Watch the $0.000390 breakout level carefully. Always manage risk and avoid entering on hype alone.
#HOT #Holo #HotTrends #CryptoAnalysis
{future}(HOTUSDT)
$HOT (Holo) Coin – Bullish Momentum Building? 🚀
Holo (HOT) is showing signs of recovery after recent selling pressure. HOT has gained positive momentum, with buyers attempting to push the price toward higher resistance levels. The key challenge is sustaining this recovery with strong trading volume.
Technical Analysis: HOT is trading around $0.000381, with nearby resistance at $0.000390–$0.000410. Immediate support stands around $0.000368. A strong breakout above resistance could open the door for further upside, while losing support may trigger another pullback. RSI near 52 indicates neutral momentum with room for further movement.
HOT/USDT 1D · Historical OHLC
Illustrative candlestick visualization using reported daily OHLC data for Oct 29–Nov 2, 2026. Green = bullish candle; red = bearish candle. 
Final Verdict: HOT could offer a recovery opportunity if buyers maintain control and volume increases. Watch the $0.000390 breakout level carefully. Always manage risk and avoid entering on hype alone.
#HOT #Holo #HotTrends #CryptoAnalysis
Holo (HOT) is showing signs of recovery after recent selling pressure. HOT has gained positive momentum, with buyers attempting to push the price toward higher resistance levels. The key challenge is sustaining this recovery with strong trading volume.
Technical Analysis: HOT is trading around $0.000381, with nearby resistance at $0.000390–$0.000410. Immediate support stands around $0.000368. A strong breakout above resistance could open the door for further upside, while losing support may trigger another pullback. RSI near 52 indicates neutral momentum with room for further movement.
HOT/USDT 1D · Historical OHLC
Illustrative candlestick visualization using reported daily OHLC data for Oct 29–Nov 2, 2026. Green = bullish candle; red = bearish candle. 
Final Verdict: HOT could offer a recovery opportunity if buyers maintain control and volume increases. Watch the $0.000390 breakout level carefully. Always manage risk and avoid entering on hype alone.
#HOT #Holo #HotTrends #CryptoAnalysis
1
315
·
--

Article
Binance Crypto Market Outlook – November 2026: A Month of Opportunity and VolatilityNovember could be a decisive month for the cryptocurrency market, with Bitcoin (BTC), Ethereum (ETH), and BNB likely to play major roles in determining overall market direction.
Bitcoin (BTC) remains the key market leader. A sustained breakout with strong trading volume could improve investor confidence and create opportunities across major altcoins. However, failure to maintain important support levels could bring increased selling pressure.
Ethereum (ETH) deserves close attention as investors monitor its momentum and network activity. A stronger ETH trend could encourage capital rotation into promising altcoins.
BNB remains an important asset to watch because of its Binance ecosystem, utility, and market demand. Strong buying pressure could support further upside, although resistance levels and trading volume will be critical.
November market predictions
➡️Bullish scenario: Strong BTC momentum, increasing volume, and improving sentiment could trigger a broader market rally.➡️Bearish scenario: Macroeconomic uncertainty, profit-taking, or a BTC breakdown could lead to corrections.➡️Altcoin opportunity: Selective altcoins may outperform if Bitcoin stabilizes and market liquidity improves.
↗️Final trading outlook
November 2026 could bring significant opportunities, but traders should avoid blindly chasing green candles. Focus on BTC direction, volume confirmation, support and resistance, and disciplined risk management.
My market view: Cautiously optimistic, with a strong focus on Bitcoin, Ethereum, BNB, and high-potential altcoins. The next major market move will depend on whether buyers can sustain momentum.
#Binance #CryptoMarketMoves #bitcoin #BNB_Market_Update #CryptoPredictions
{future}(BTCUSDT)
{future}(ETHUSDT)
{future}(BNBUSDT)
Binance Crypto Market Outlook – November 2026: A Month of Opportunity and Volatility
November could be a decisive month for the cryptocurrency market, with Bitcoin (BTC), Ethereum (ETH), and BNB likely to play major roles in determining overall market direction.
Bitcoin (BTC) remains the key market leader. A sustained breakout with strong trading volume could improve investor confidence and create opportunities across major altcoins. However, failure to maintain important support levels could bring increased selling pressure.
Ethereum (ETH) deserves close attention as investors monitor its momentum and network activity. A stronger ETH trend could encourage capital rotation into promising altcoins.
BNB remains an important asset to watch because of its Binance ecosystem, utility, and market demand. Strong buying pressure could support further upside, although resistance levels and trading volume will be critical.
November market predictions
➡️Bullish scenario: Strong BTC momentum, increasing volume, and improving sentiment could trigger a broader market rally.➡️Bearish scenario: Macroeconomic uncertainty, profit-taking, or a BTC breakdown could lead to corrections.➡️Altcoin opportunity: Selective altcoins may outperform if Bitcoin stabilizes and market liquidity improves.
↗️Final trading outlook
November 2026 could bring significant opportunities, but traders should avoid blindly chasing green candles. Focus on BTC direction, volume confirmation, support and resistance, and disciplined risk management.
My market view: Cautiously optimistic, with a strong focus on Bitcoin, Ethereum, BNB, and high-potential altcoins. The next major market move will depend on whether buyers can sustain momentum.
#Binance #CryptoMarketMoves #bitcoin #BNB_Market_Update #CryptoPredictions
Bitcoin (BTC) remains the key market leader. A sustained breakout with strong trading volume could improve investor confidence and create opportunities across major altcoins. However, failure to maintain important support levels could bring increased selling pressure.
Ethereum (ETH) deserves close attention as investors monitor its momentum and network activity. A stronger ETH trend could encourage capital rotation into promising altcoins.
BNB remains an important asset to watch because of its Binance ecosystem, utility, and market demand. Strong buying pressure could support further upside, although resistance levels and trading volume will be critical.
November market predictions
➡️Bullish scenario: Strong BTC momentum, increasing volume, and improving sentiment could trigger a broader market rally.➡️Bearish scenario: Macroeconomic uncertainty, profit-taking, or a BTC breakdown could lead to corrections.➡️Altcoin opportunity: Selective altcoins may outperform if Bitcoin stabilizes and market liquidity improves.
↗️Final trading outlook
November 2026 could bring significant opportunities, but traders should avoid blindly chasing green candles. Focus on BTC direction, volume confirmation, support and resistance, and disciplined risk management.
My market view: Cautiously optimistic, with a strong focus on Bitcoin, Ethereum, BNB, and high-potential altcoins. The next major market move will depend on whether buyers can sustain momentum.
#Binance #CryptoMarketMoves #bitcoin #BNB_Market_Update #CryptoPredictions
1
103
·
--
$ZEC (ZEC) Technical Analysis – Bullish Momentum Building
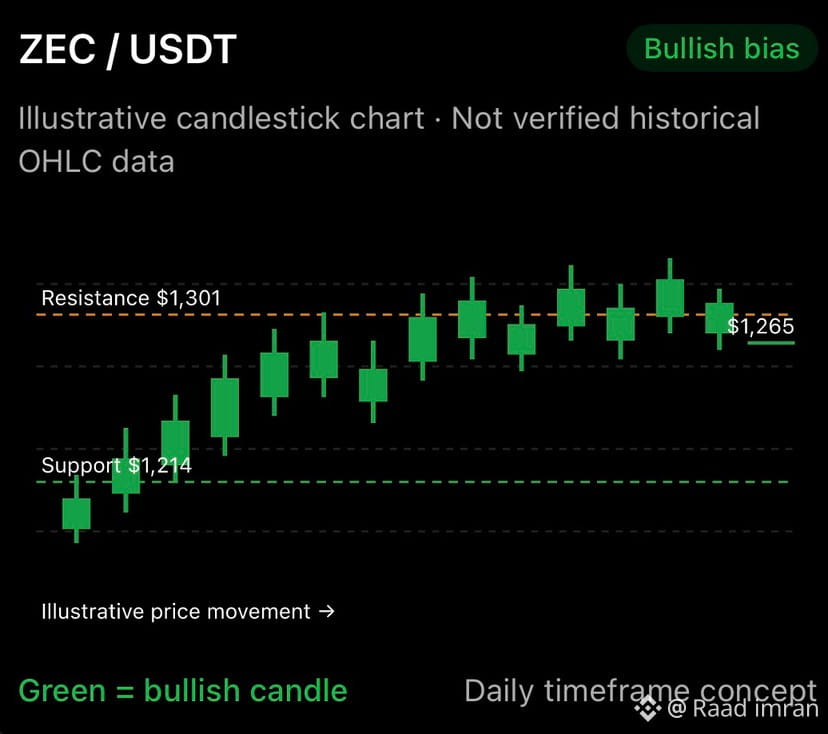
Zcash (ZEC) is showing encouraging bullish momentum, with buyers maintaining control across major timeframes. As of November 2, 2026, ZEC is trading around $1,265, supported by positive moving-average signals and improving market sentiment.
The daily RSI is around 51.5, indicating neutral momentum with room for further upside. The key resistance levels are $1,301 and $1,365. On the downside, $1,214 and $1,176 are important support zones.
A confirmed daily breakout above $1,301 could strengthen bullish momentum and open the door toward higher levels. However, losing $1,214 could trigger additional selling pressure.
Trading outlook: Bullish bias while price holds above support. Watch volume and candle-closing confirmation before entering a trade. ZEC remains a volatile asset, so proper risk management is essential.
#Zcash #ZECUSDT #CryptoAnalysis #TechnicalAnalysisPost
{future}(ZECUSDT)
$ZEC (ZEC) Technical Analysis – Bullish Momentum Building
Zcash (ZEC) is showing encouraging bullish momentum, with buyers maintaining control across major timeframes. As of November 2, 2026, ZEC is trading around $1,265, supported by positive moving-average signals and improving market sentiment.
The daily RSI is around 51.5, indicating neutral momentum with room for further upside. The key resistance levels are $1,301 and $1,365. On the downside, $1,214 and $1,176 are important support zones.
A confirmed daily breakout above $1,301 could strengthen bullish momentum and open the door toward higher levels. However, losing $1,214 could trigger additional selling pressure.
Trading outlook: Bullish bias while price holds above support. Watch volume and candle-closing confirmation before entering a trade. ZEC remains a volatile asset, so proper risk management is essential.
#Zcash #ZECUSDT #CryptoAnalysis #TechnicalAnalysisPost
Zcash (ZEC) is showing encouraging bullish momentum, with buyers maintaining control across major timeframes. As of November 2, 2026, ZEC is trading around $1,265, supported by positive moving-average signals and improving market sentiment.
The daily RSI is around 51.5, indicating neutral momentum with room for further upside. The key resistance levels are $1,301 and $1,365. On the downside, $1,214 and $1,176 are important support zones.
A confirmed daily breakout above $1,301 could strengthen bullish momentum and open the door toward higher levels. However, losing $1,214 could trigger additional selling pressure.
Trading outlook: Bullish bias while price holds above support. Watch volume and candle-closing confirmation before entering a trade. ZEC remains a volatile asset, so proper risk management is essential.
#Zcash #ZECUSDT #CryptoAnalysis #TechnicalAnalysisPost
245
Log in to explore more content
Join global crypto users on Binance Square
⚡️ Get latest and useful information about crypto.
💬 Trusted by the world’s largest crypto exchange.
👍 Discover real insights from verified creators.
Email / Phone number
Trending Topics
BinanceReopensWithdrawalsForMoreAssets
681,255 views
3,412 Discussing
Security Incident | Recovery Update #8: Withdrawals for More Assets to Reopen (2026-11-05)
Binance Announcement
·229 Likes
·820.8k views
BTCRebounds80K
179,084 views
1,651 Discussing
Binance98PercentReplenished
94,567 views
1,118 Discussing