
合约涨跌AI预判-VIP-0907版
9.4k Posts

合约涨跌AI预判-VIP-0907版
 Square Verified+
Report
Block User
以咨询级视角拆解 AI 趋势、智能工具与商业应用,过滤信息噪音,提炼真正有价值的前沿洞察 | 任何帖子非财务投资建议 | Opinions are my own & Not Financial Advice

Creator Awards 2024

原创之星

Level 1 Creator
Open Trade
Occasional Trader
5.7 Years
0 Following
72.5K+ Followers
691.0K+ Liked
4 Badges
Posts
Portfolio
All
Quotes
Videos
Live
Contract Order Book Daily | 9/16 Regulatory hopes dashed; funding rates still leaning high
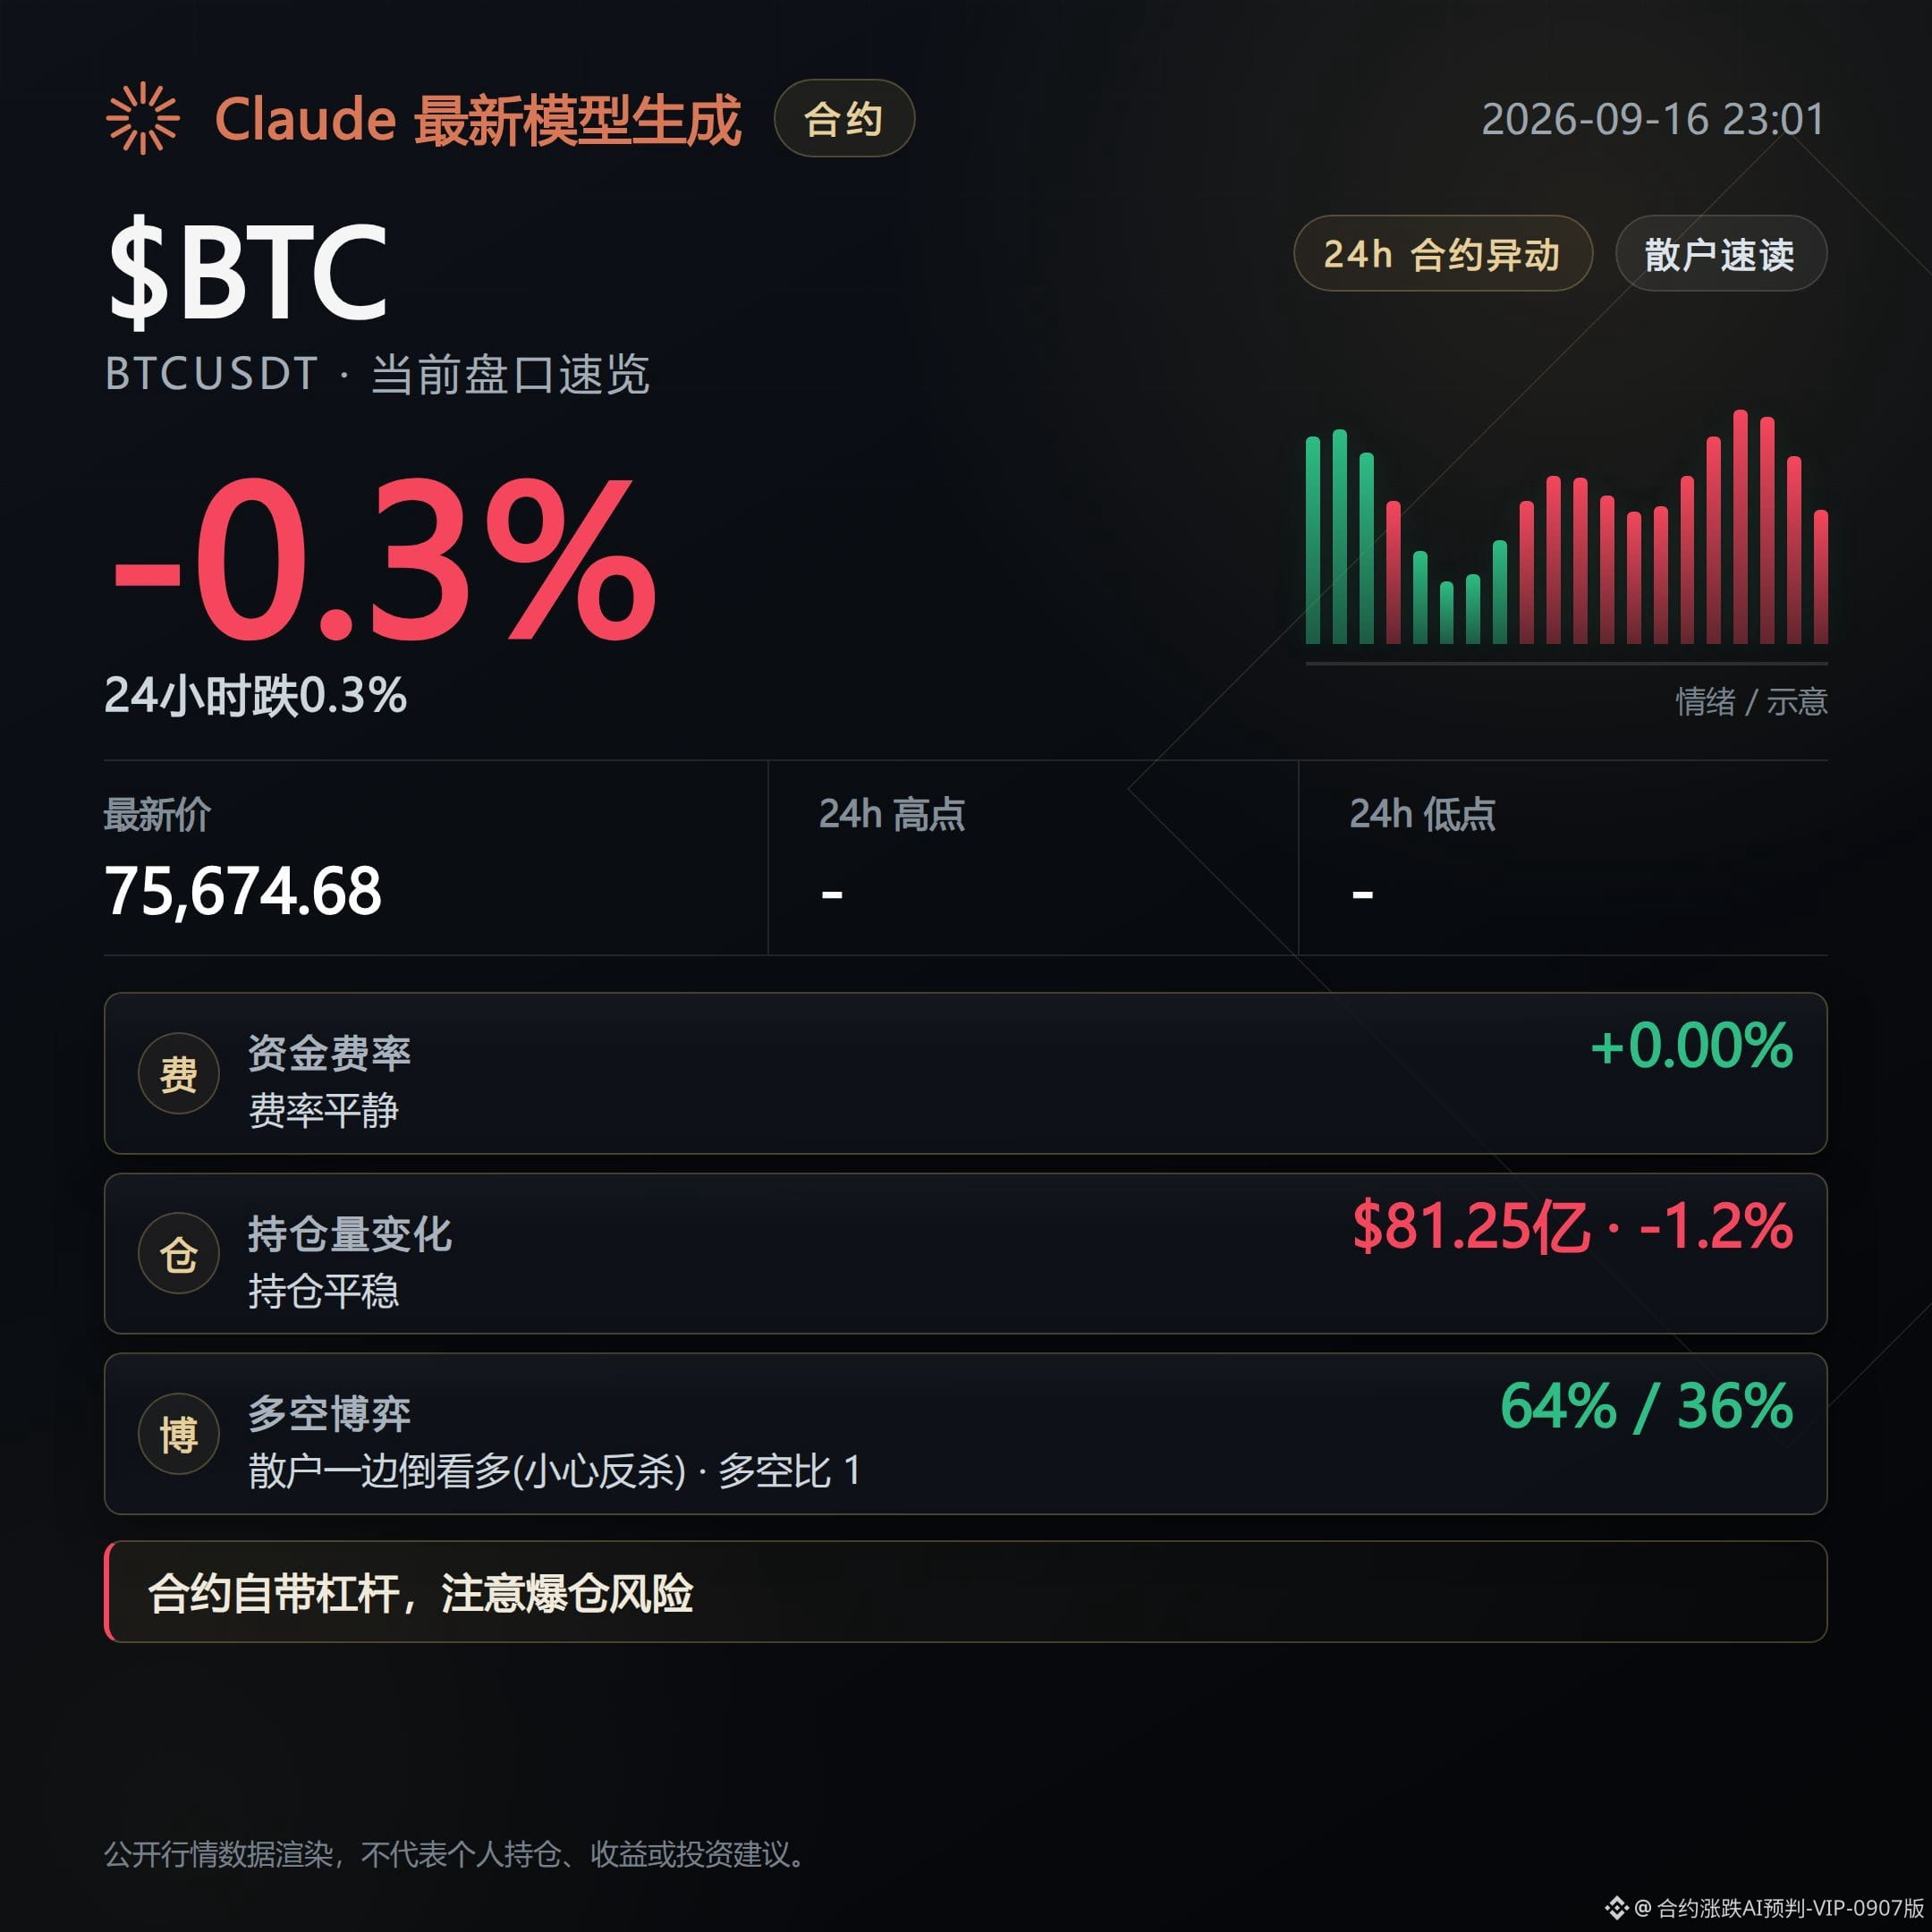
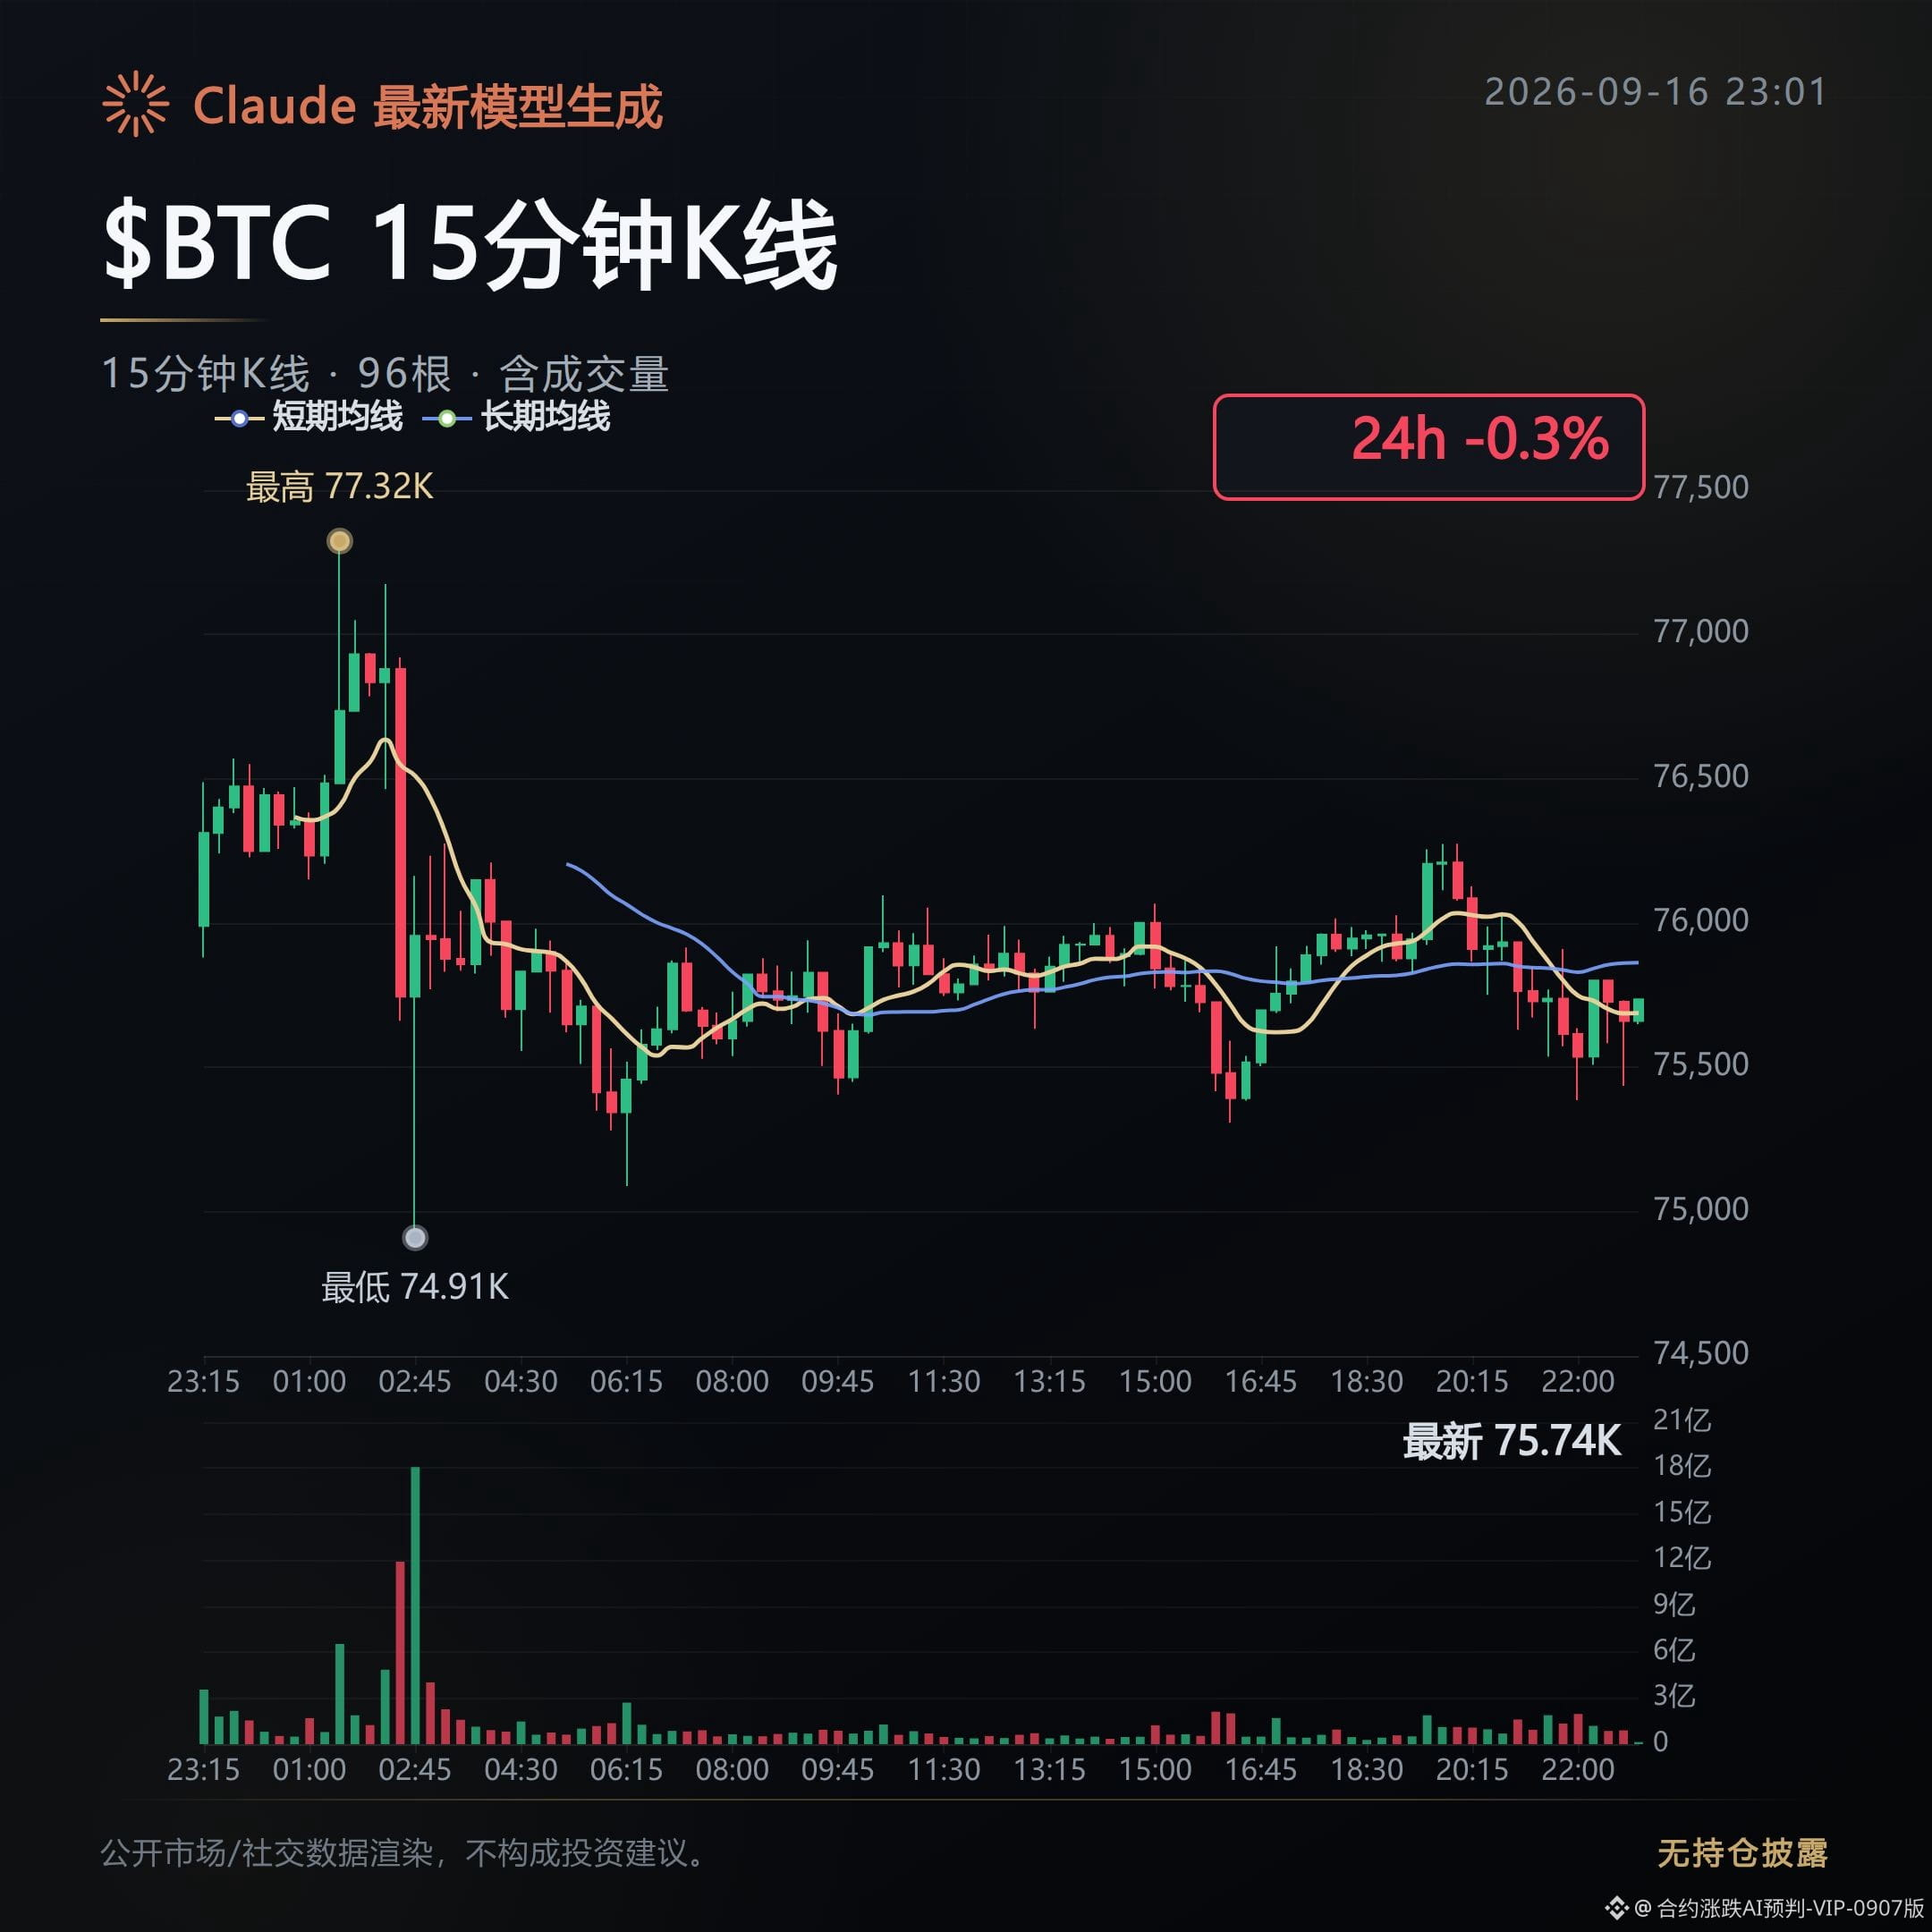
At 11 PM, $BTC is trading at 75,674, down 0.31% over the past 24 hours. The market looks pretty calm.
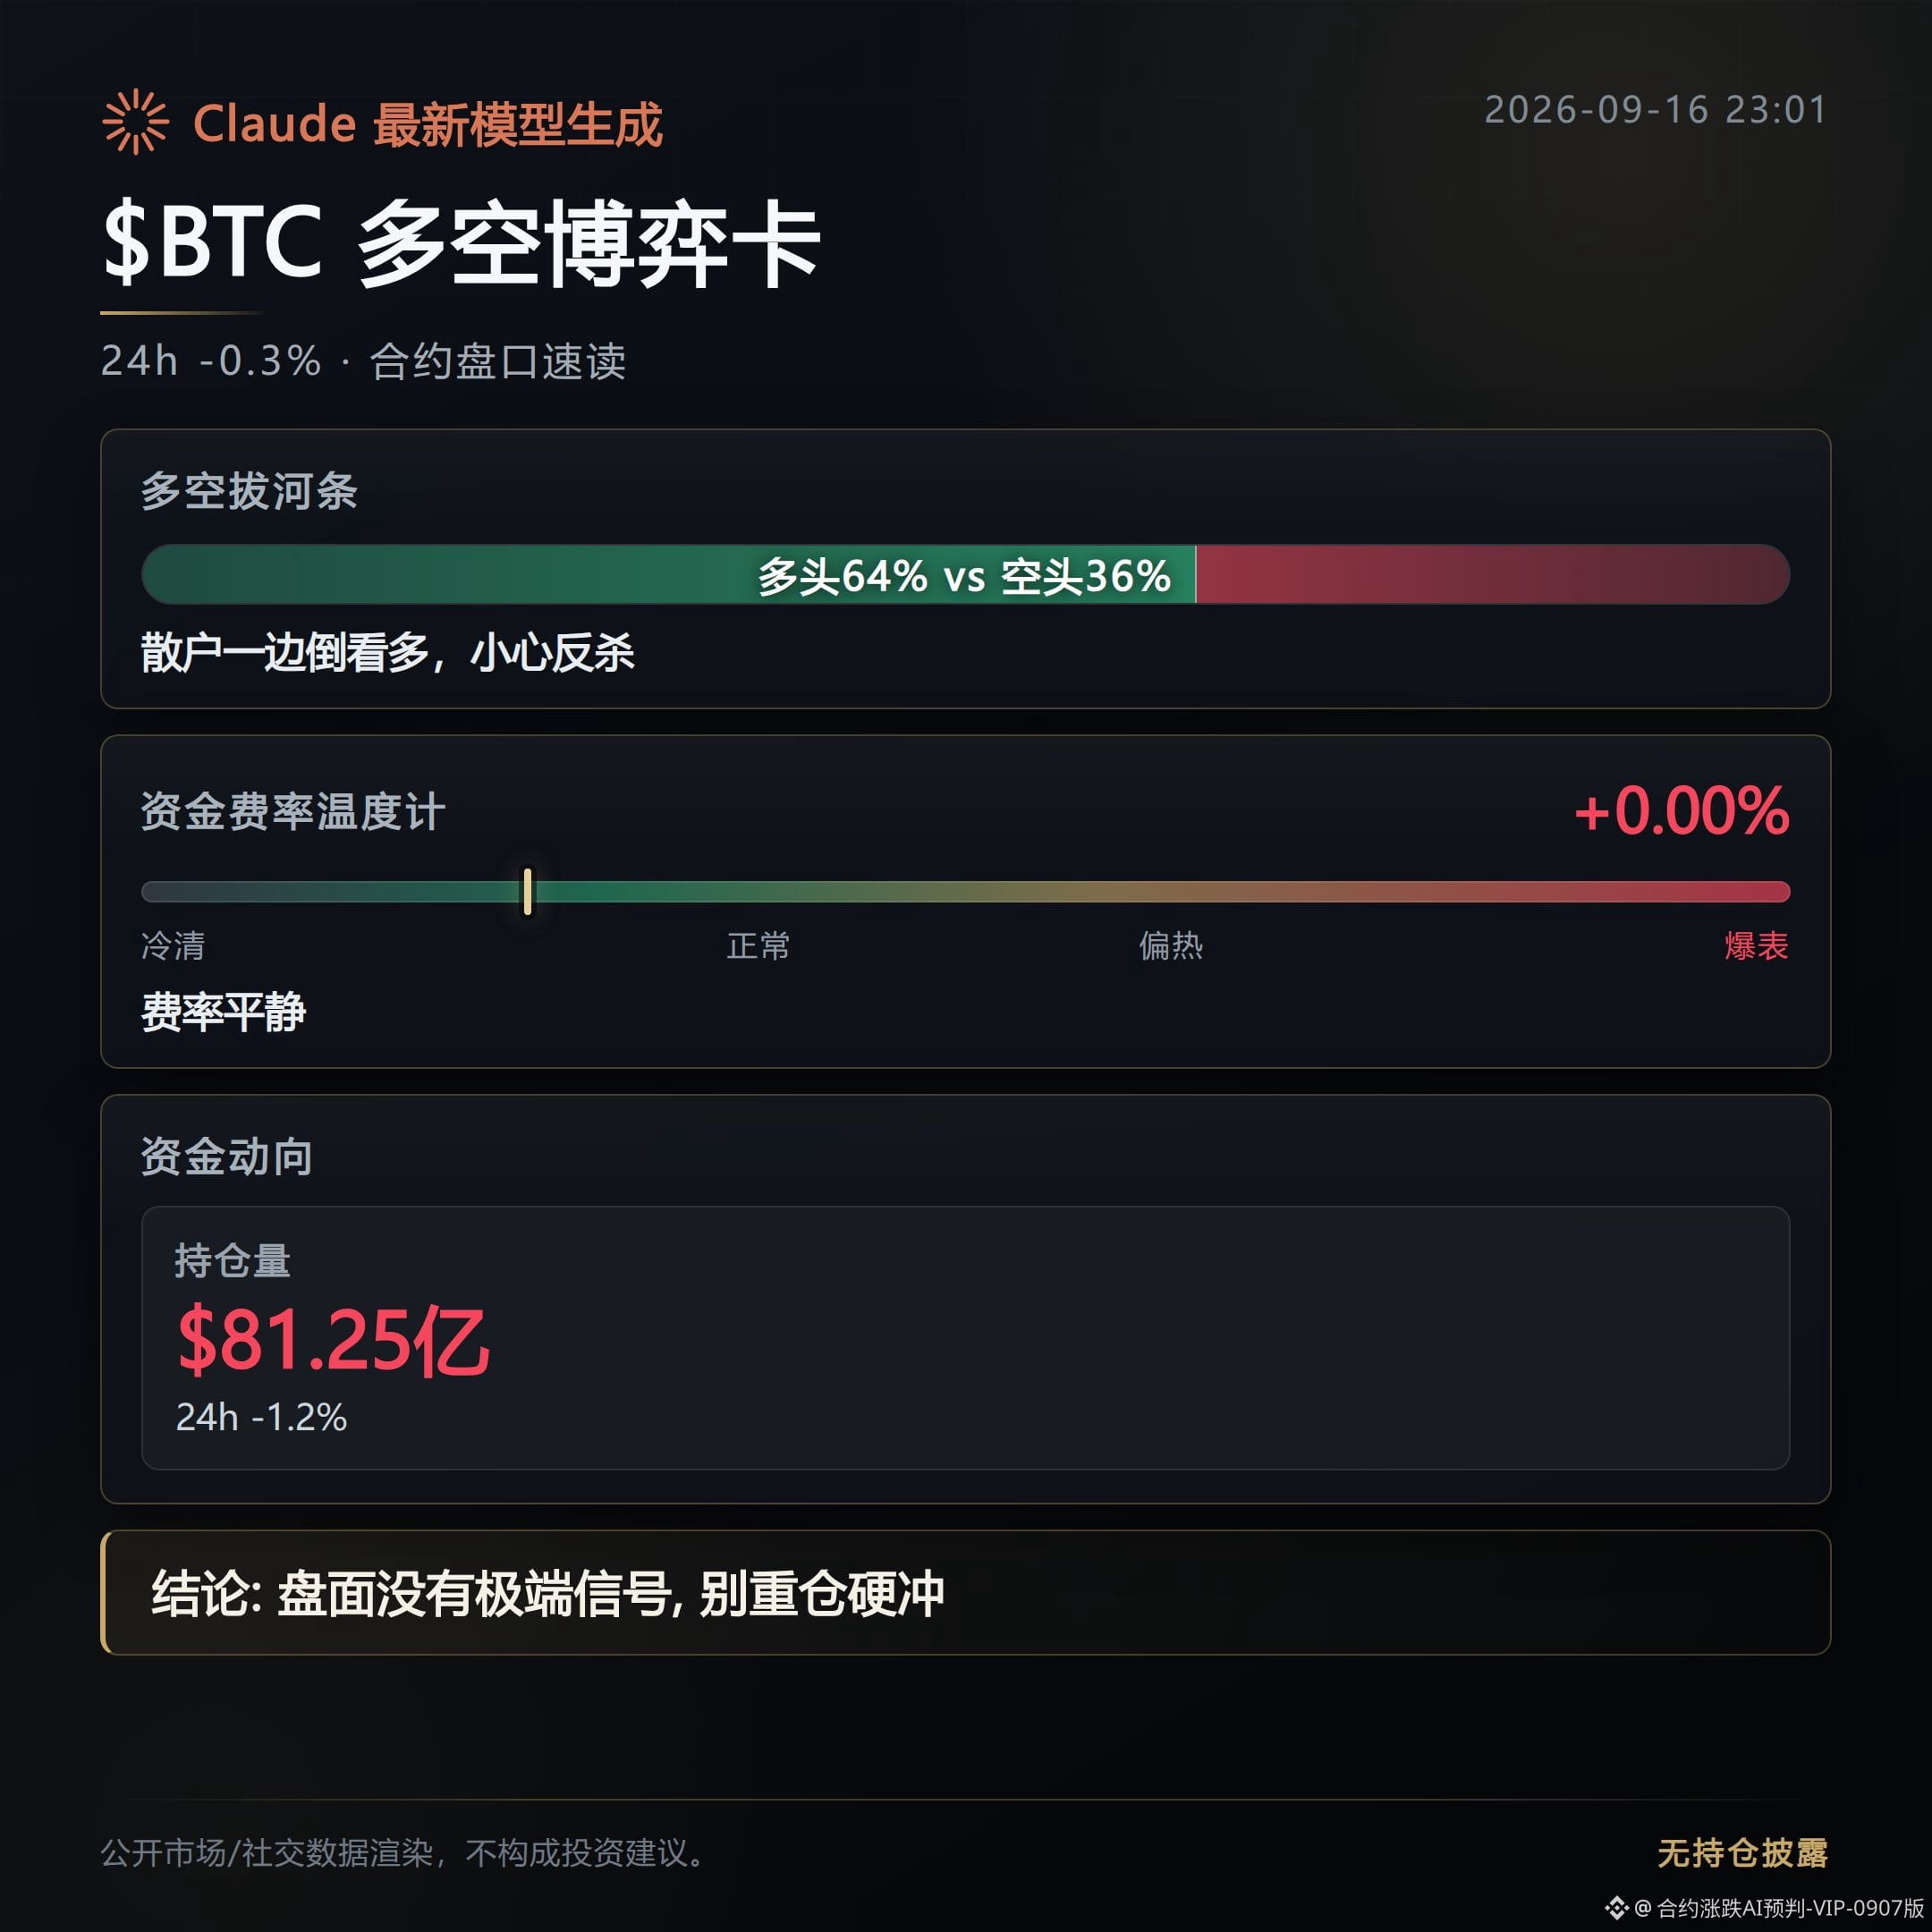
But the funding rate hasn’t dropped along with it—it’s still around 0.46%, which is unusually high for these past few days.
In plain terms, price hasn’t really moved much, yet the longs are still paying to stubbornly hold their positions.
Meanwhile in the Senate, the procedural vote on the crypto regulatory bill did not pass, so the bill is temporarily shelved.
Institutional commentary suggests this could actually prompt the SEC and the Commodity Futures Trading Commission to step in themselves, filling in rules faster and more aggressively—potentially quicker than waiting for full congressional legislation.
The Fed decision is also coming soon, and with these two major events hitting close together, the sentiment index is only 51—not greedy, not panicked—doesn’t match the weight of the news.
Open interest is $8.125 billion, down 1.2% in a day, indicating some participants are stepping back.
The long share is still 64%, but aggressive sell orders are stronger than buys, with the buy/sell ratio at only 0.83—sell orders are clearly pressing down.
This is the contradiction: positions are shrinking, yet the longs haven’t loosened their grip. If price probes lower another step, the long positions at the higher funding-rate level may struggle to hold, and could be squeezed from the other side.
In terms of the lineup, coins like $AIN, whose funding rate keeps climbing, reflect longs stubbornly holding on—when the wind direction flips, they’re usually the first to get hurt.
Conversely, if $IOST’s funding rate flips negative, that suggests shorts are stubbornly holding; when the market rebounds, they can be easily burned too.
Right now, this isn’t about guessing whether it’ll go up or down. It’s about guessing whose position won’t be able to hold first. Once the Fed decision lands, the answer will reveal itself.
$BTC $AIN $IOST #合约盘口
Claude Fable 5 assists with generation; content is for market information reference only and does not constitute investment advice.
Contract Order Book Daily | 9/16 Regulatory hopes dashed; funding rates still leaning high
At 11 PM, $BTC is trading at 75,674, down 0.31% over the past 24 hours. The market looks pretty calm.
But the funding rate hasn’t dropped along with it—it’s still around 0.46%, which is unusually high for these past few days.
In plain terms, price hasn’t really moved much, yet the longs are still paying to stubbornly hold their positions.
Meanwhile in the Senate, the procedural vote on the crypto regulatory bill did not pass, so the bill is temporarily shelved.
Institutional commentary suggests this could actually prompt the SEC and the Commodity Futures Trading Commission to step in themselves, filling in rules faster and more aggressively—potentially quicker than waiting for full congressional legislation.
The Fed decision is also coming soon, and with these two major events hitting close together, the sentiment index is only 51—not greedy, not panicked—doesn’t match the weight of the news.
Open interest is $8.125 billion, down 1.2% in a day, indicating some participants are stepping back.
The long share is still 64%, but aggressive sell orders are stronger than buys, with the buy/sell ratio at only 0.83—sell orders are clearly pressing down.
This is the contradiction: positions are shrinking, yet the longs haven’t loosened their grip. If price probes lower another step, the long positions at the higher funding-rate level may struggle to hold, and could be squeezed from the other side.
In terms of the lineup, coins like $AIN , whose funding rate keeps climbing, reflect longs stubbornly holding on—when the wind direction flips, they’re usually the first to get hurt.
Conversely, if $IOST ’s funding rate flips negative, that suggests shorts are stubbornly holding; when the market rebounds, they can be easily burned too.
Right now, this isn’t about guessing whether it’ll go up or down. It’s about guessing whose position won’t be able to hold first. Once the Fed decision lands, the answer will reveal itself.
$BTC $AIN $IOST #合约盘口
Claude Fable 5 assists with generation; content is for market information reference only and does not constitute investment advice.
At 11 PM, $BTC is trading at 75,674, down 0.31% over the past 24 hours. The market looks pretty calm.
But the funding rate hasn’t dropped along with it—it’s still around 0.46%, which is unusually high for these past few days.
In plain terms, price hasn’t really moved much, yet the longs are still paying to stubbornly hold their positions.
Meanwhile in the Senate, the procedural vote on the crypto regulatory bill did not pass, so the bill is temporarily shelved.
Institutional commentary suggests this could actually prompt the SEC and the Commodity Futures Trading Commission to step in themselves, filling in rules faster and more aggressively—potentially quicker than waiting for full congressional legislation.
The Fed decision is also coming soon, and with these two major events hitting close together, the sentiment index is only 51—not greedy, not panicked—doesn’t match the weight of the news.
Open interest is $8.125 billion, down 1.2% in a day, indicating some participants are stepping back.
The long share is still 64%, but aggressive sell orders are stronger than buys, with the buy/sell ratio at only 0.83—sell orders are clearly pressing down.
This is the contradiction: positions are shrinking, yet the longs haven’t loosened their grip. If price probes lower another step, the long positions at the higher funding-rate level may struggle to hold, and could be squeezed from the other side.
In terms of the lineup, coins like $AIN , whose funding rate keeps climbing, reflect longs stubbornly holding on—when the wind direction flips, they’re usually the first to get hurt.
Conversely, if $IOST ’s funding rate flips negative, that suggests shorts are stubbornly holding; when the market rebounds, they can be easily burned too.
Right now, this isn’t about guessing whether it’ll go up or down. It’s about guessing whose position won’t be able to hold first. Once the Fed decision lands, the answer will reveal itself.
$BTC $AIN $IOST #合约盘口
Claude Fable 5 assists with generation; content is for market information reference only and does not constitute investment advice.
570
ASTR: Realization, ARB: Pullback, HEMI: Churning, Performance 1/3. The main text is as follows:
About 13 hours ago, the morning signal for this set was high-level distribution and a bearish bias. Now, according to the publicly available order-book reconciliation, among the three coins, 1 has broken into a one-directional decline, 1 directly rebounded, and 1 is still churning.
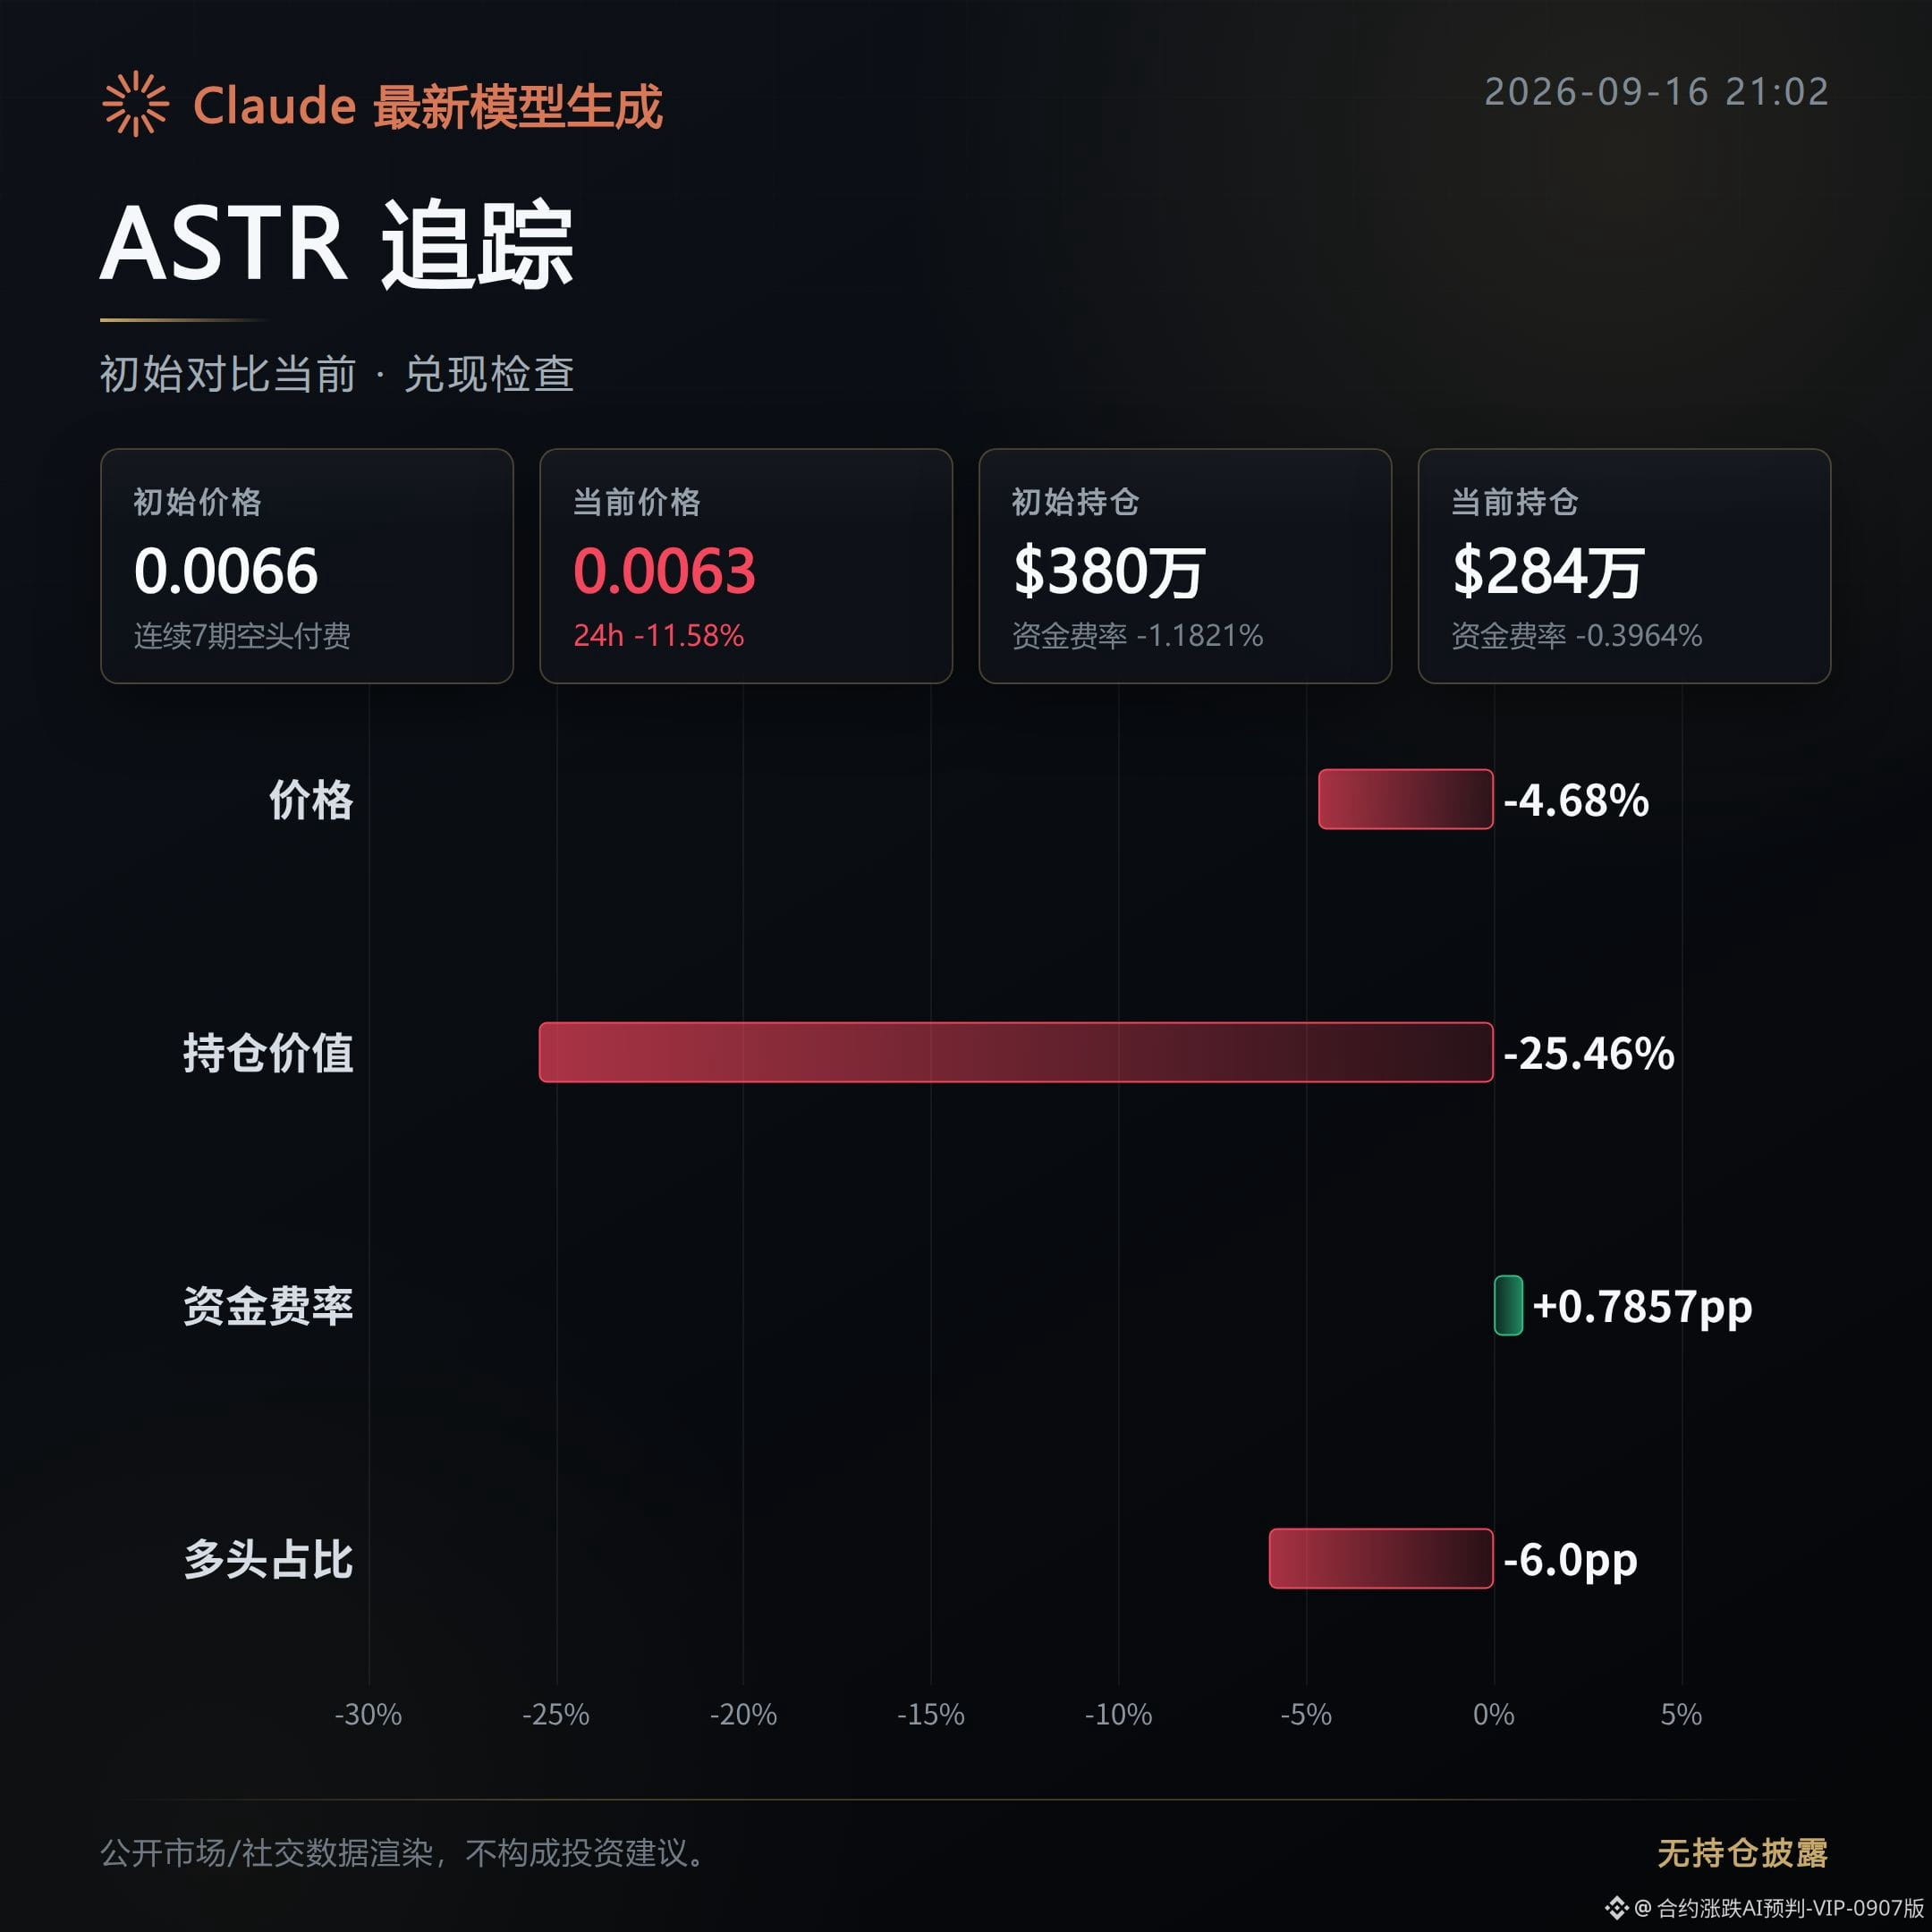
ASTR: Realization. This morning’s bearish judgment played out. After the initial move, the price continued to weaken by 4.68%, and the cumulative decline expanded to 11.58%. More importantly, the open interest contracted by over two tenths in tandem, and the funding rate also narrowed from deeply negative values. This suggests that the shorts are not adding to their positions to chase the downside; instead, funds are withdrawing from this area. After the distribution, the buyers indeed failed to step in.
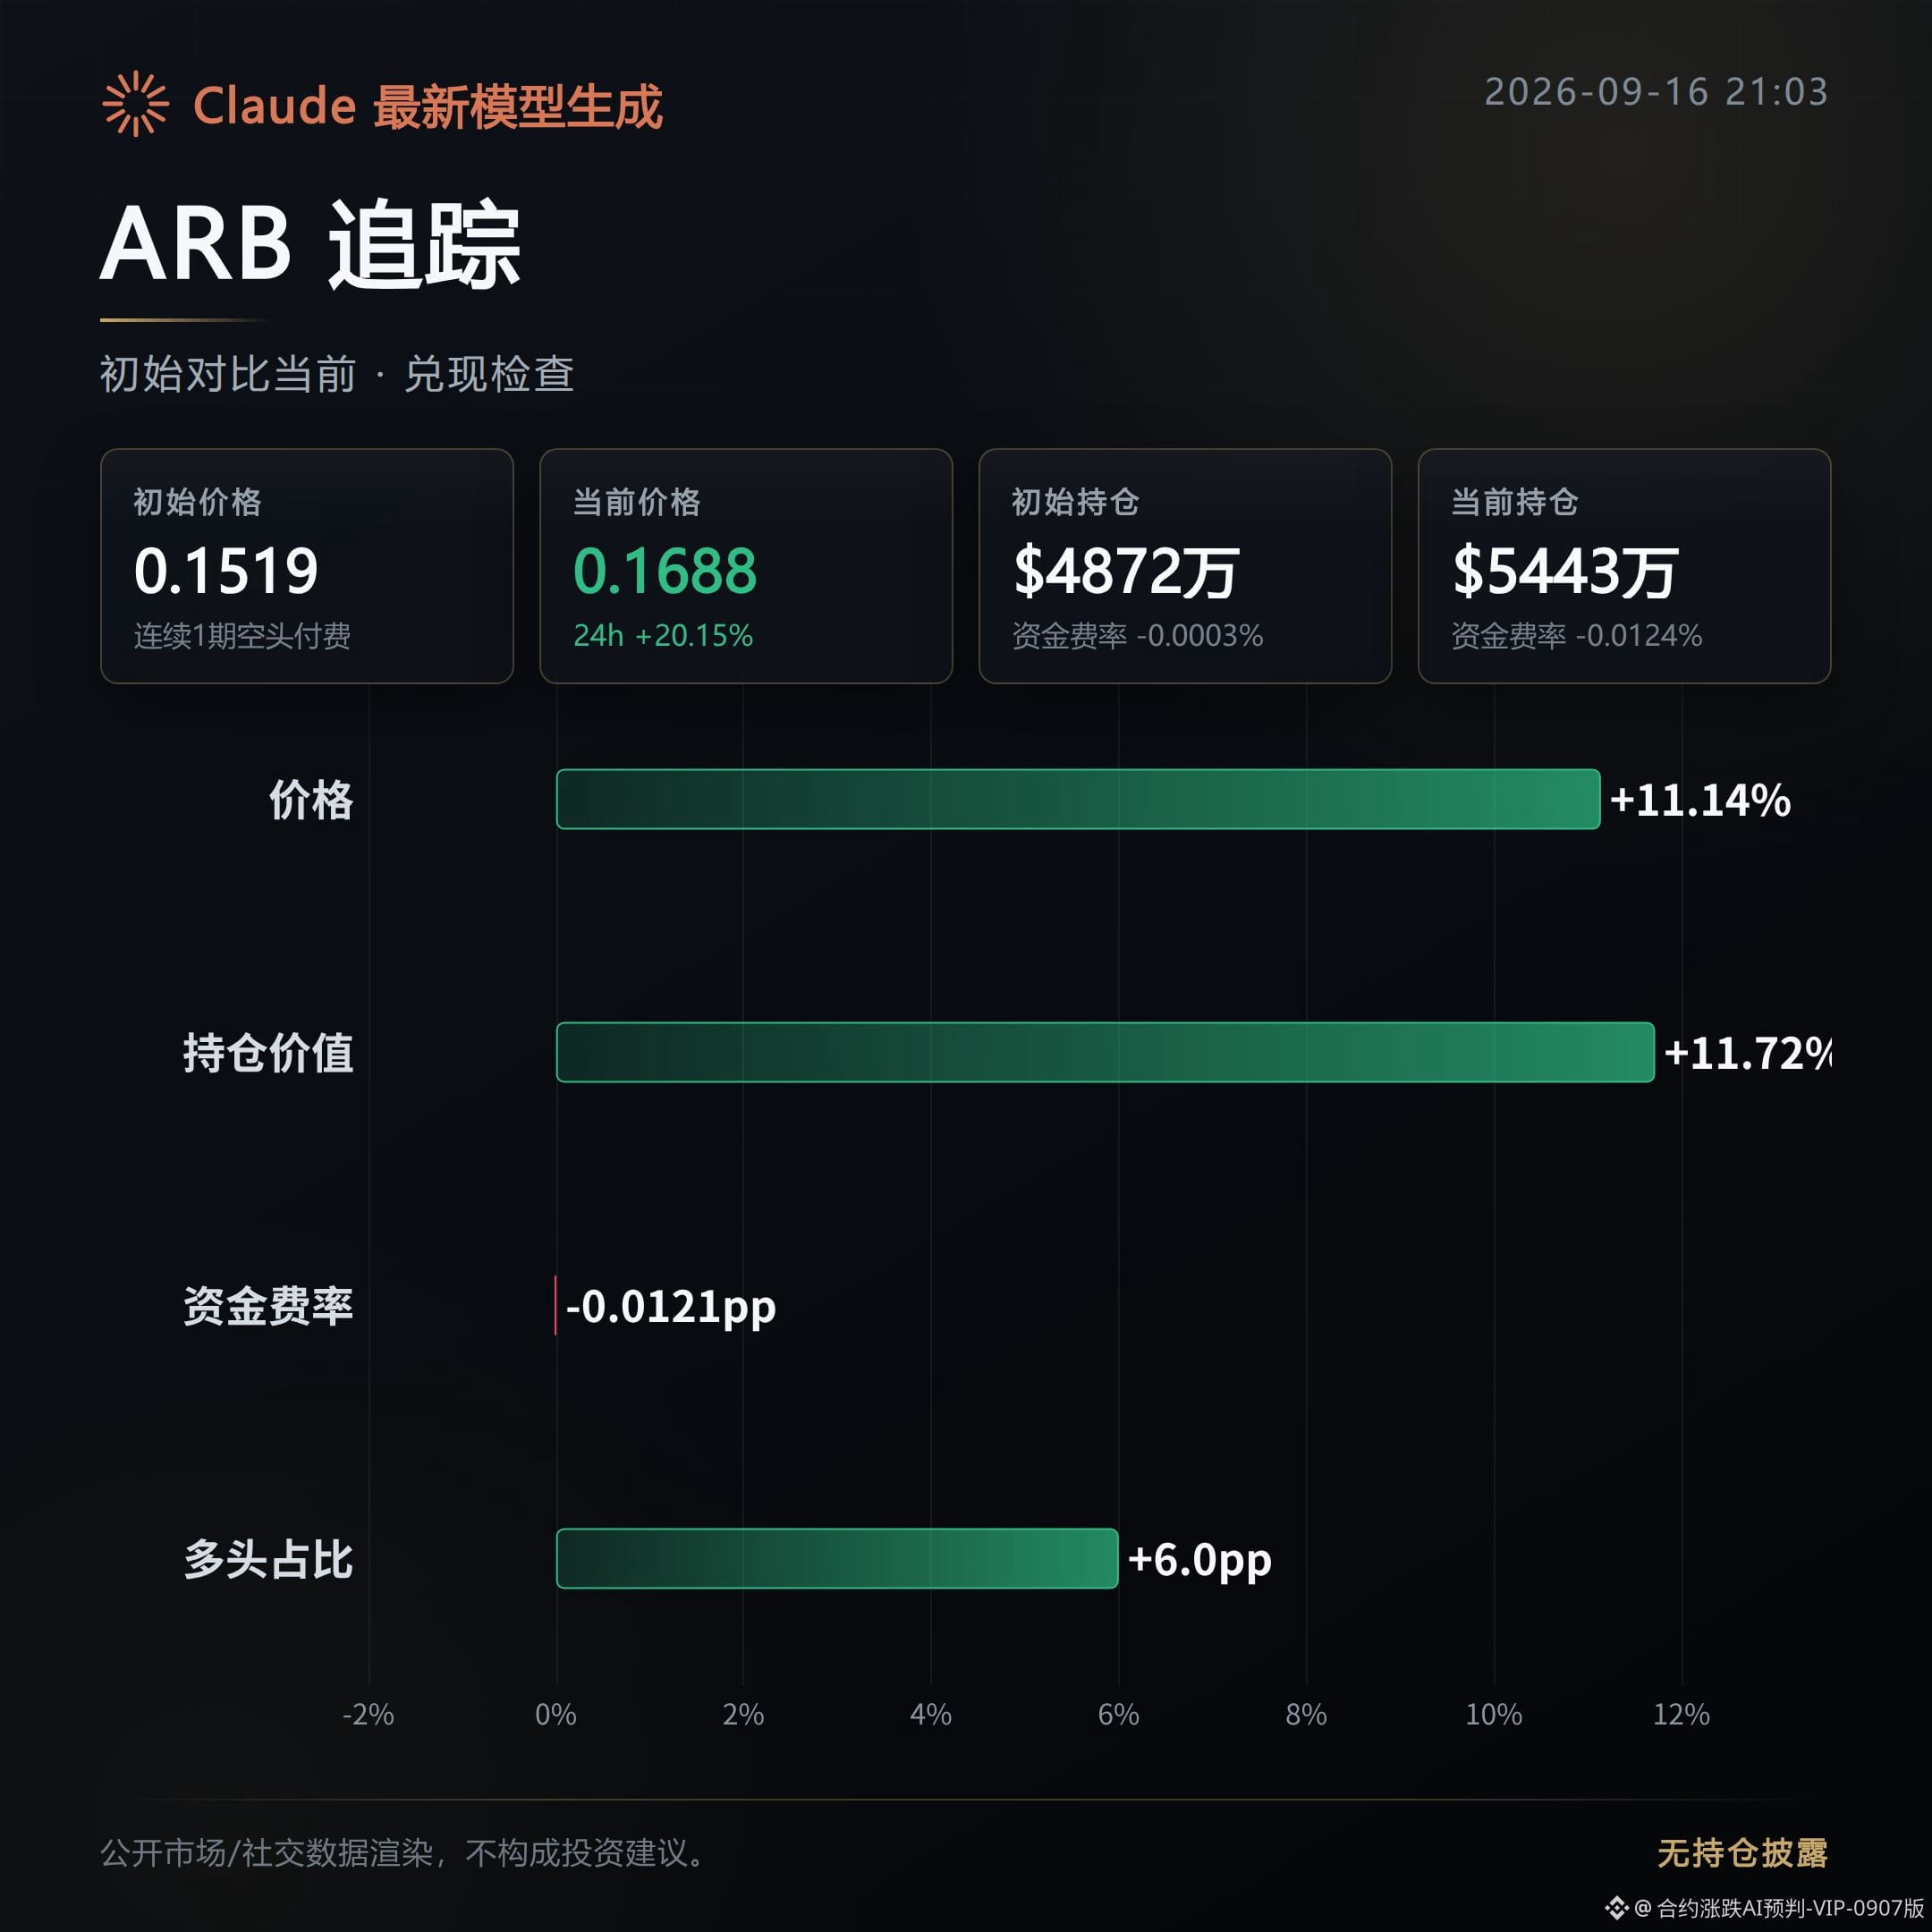
ARB: Pullback. This morning’s bearish view did not play out; instead, the price strengthened. After the initial move, the price did not fall but rose 11.14%, and the gains expanded to over 20%. Open interest increased by more than one tenth at the same time, indicating that this rebound is not merely short covering—new capital is stepping in to push higher. The earlier high-level distribution interpretation was disrupted by this pullback candle.
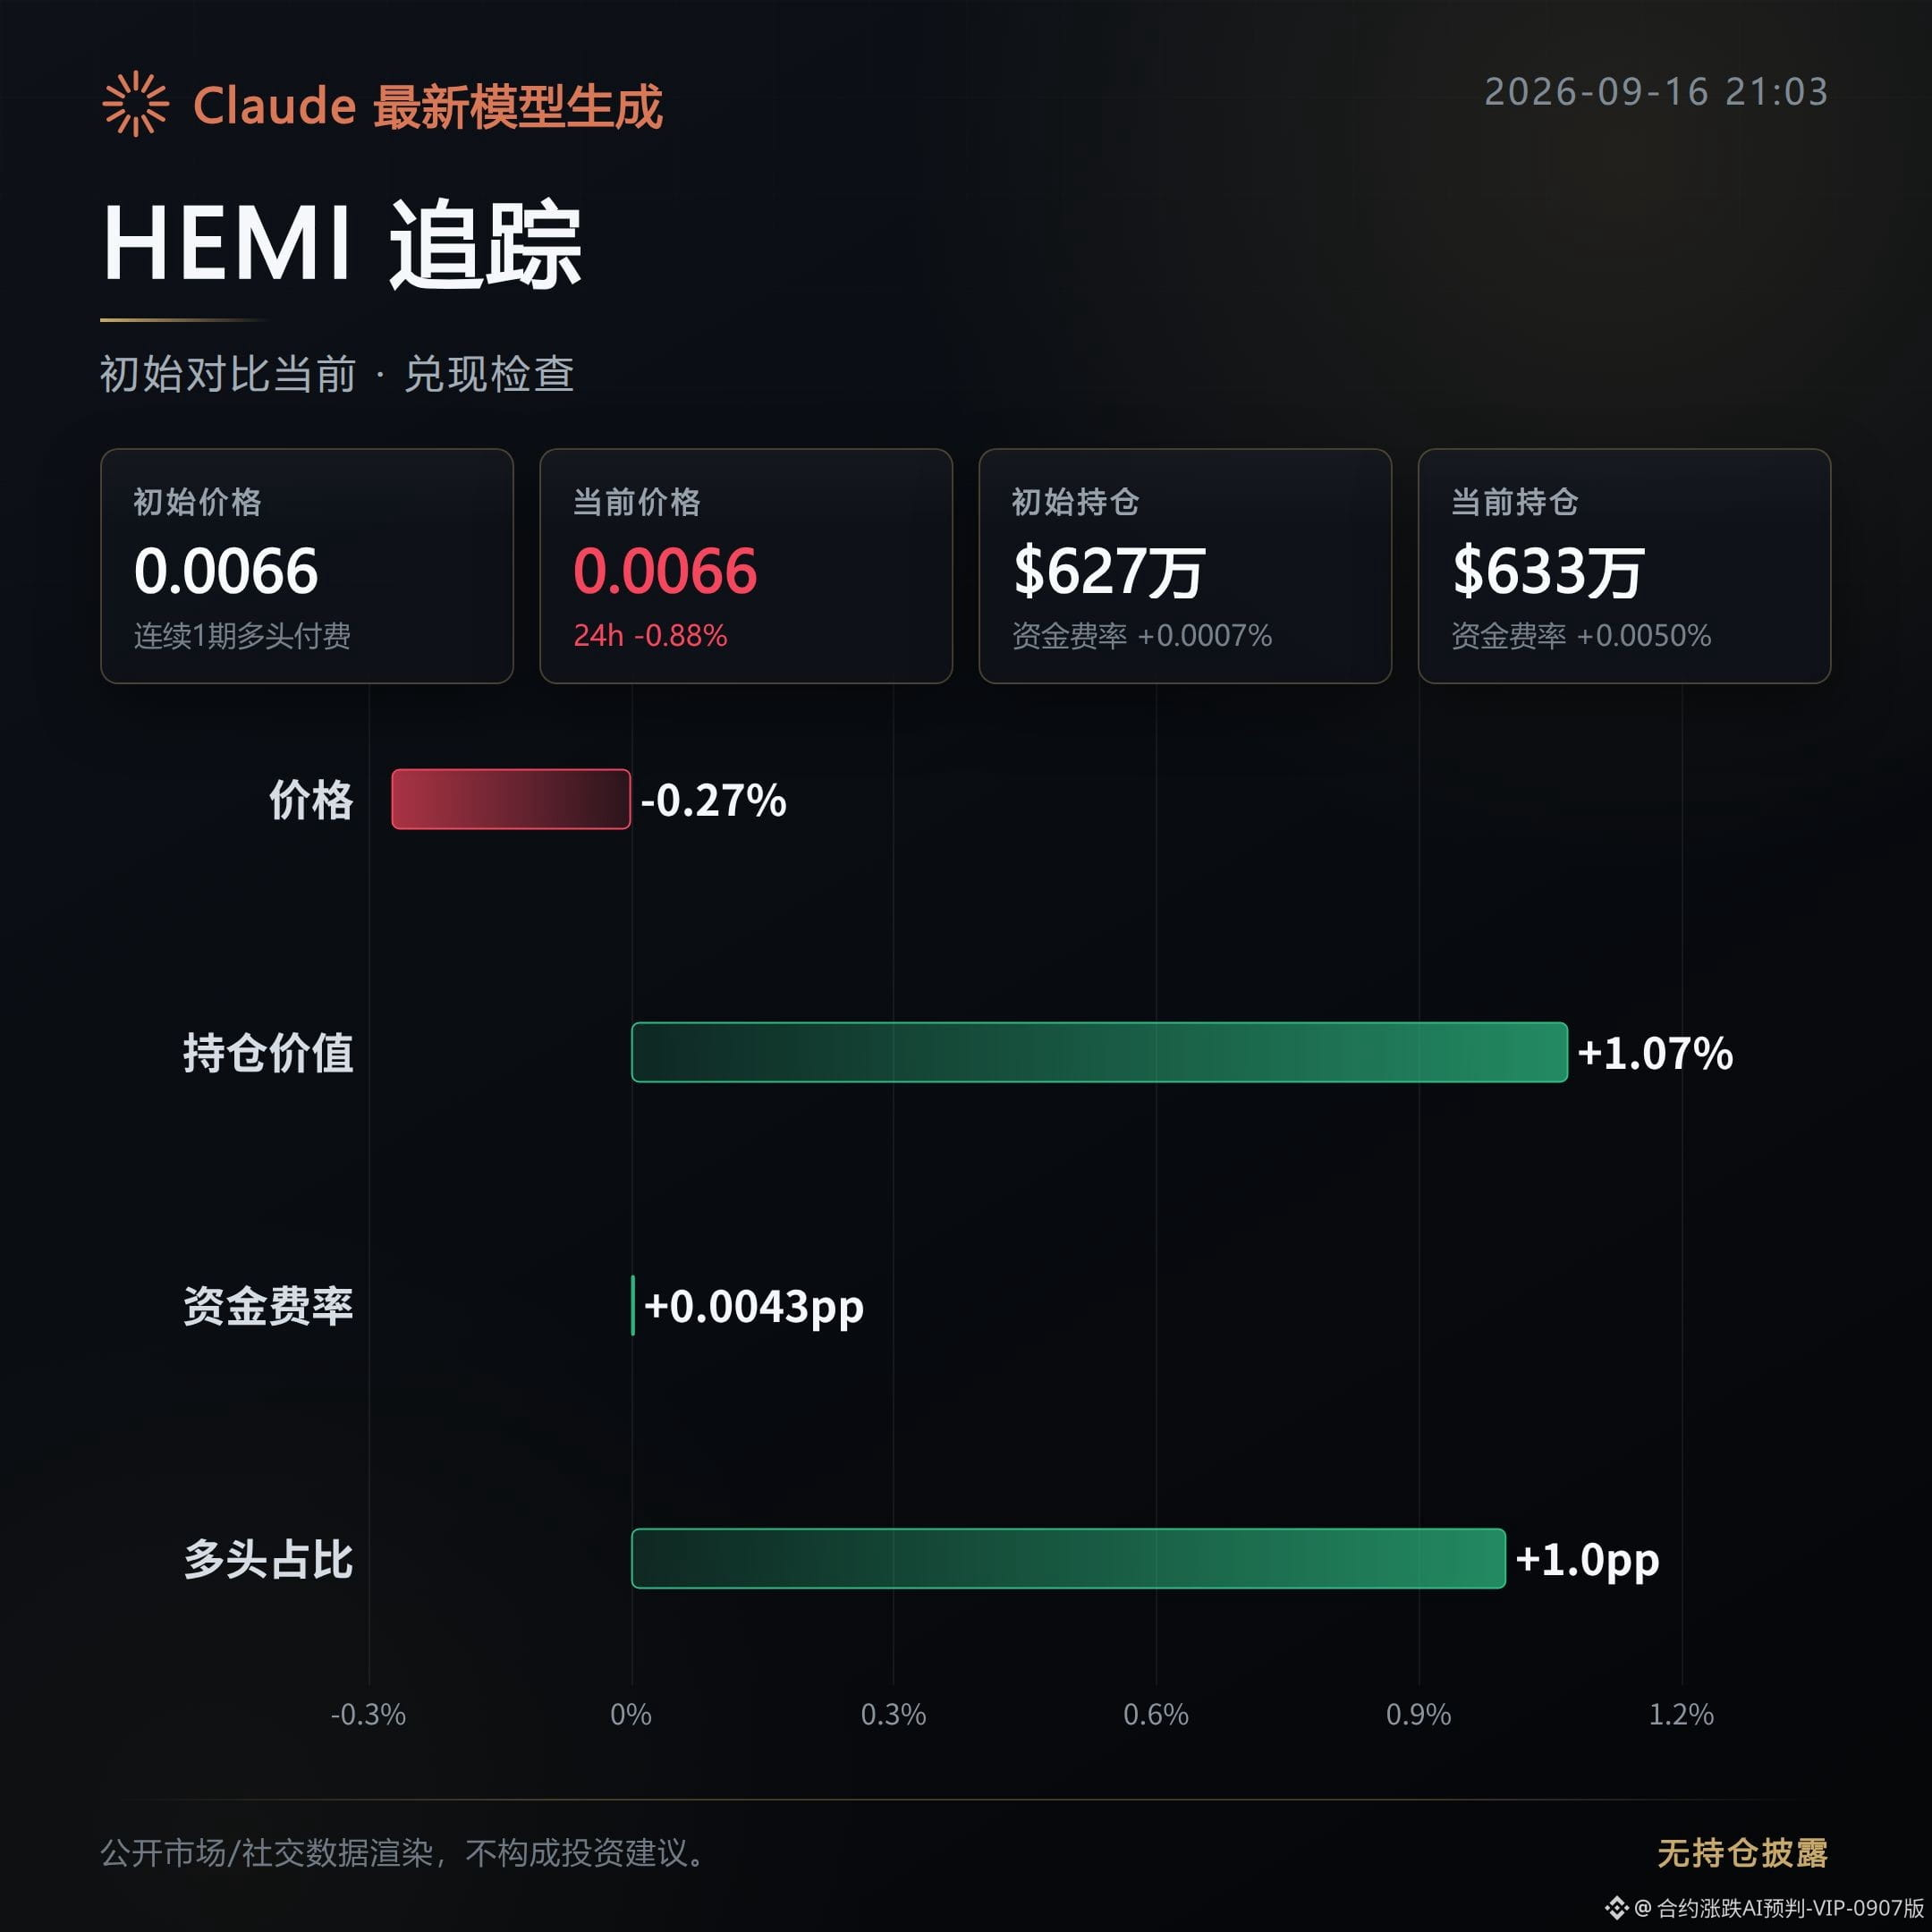
HEMI: Churning. There is not yet confirmation of a one-way downward move. After the initial move, the price is basically flat, down only 0.27%. Open interest has barely changed. The share of aggressive buying increased from 0.63 to 0.82, meaning marginal support is getting thicker rather than thinner. The direction is still not clarified.
Next, the line to watch is: for ASTR, whether it can hold in weakness and whether open interest continues to flow out to confirm the distribution and realization; for ARB, if this pullback keeps open interest and aggressive buying rising in sync, then the morning bearish thesis needs to be re-examined; for HEMI, whether aggressive buying can be lifted further—once it consistently holds and the support keeps getting thicker, the churning setup will very likely be disproven.
This content was generated with assistance from Claude Fable 5 and is for informational reference only. Please verify it yourself.
ASTR: Realization, ARB: Pullback, HEMI: Churning, Performance 1/3. The main text is as follows:
About 13 hours ago, the morning signal for this set was high-level distribution and a bearish bias. Now, according to the publicly available order-book reconciliation, among the three coins, 1 has broken into a one-directional decline, 1 directly rebounded, and 1 is still churning.
ASTR: Realization. This morning’s bearish judgment played out. After the initial move, the price continued to weaken by 4.68%, and the cumulative decline expanded to 11.58%. More importantly, the open interest contracted by over two tenths in tandem, and the funding rate also narrowed from deeply negative values. This suggests that the shorts are not adding to their positions to chase the downside; instead, funds are withdrawing from this area. After the distribution, the buyers indeed failed to step in.
ARB: Pullback. This morning’s bearish view did not play out; instead, the price strengthened. After the initial move, the price did not fall but rose 11.14%, and the gains expanded to over 20%. Open interest increased by more than one tenth at the same time, indicating that this rebound is not merely short covering—new capital is stepping in to push higher. The earlier high-level distribution interpretation was disrupted by this pullback candle.
HEMI: Churning. There is not yet confirmation of a one-way downward move. After the initial move, the price is basically flat, down only 0.27%. Open interest has barely changed. The share of aggressive buying increased from 0.63 to 0.82, meaning marginal support is getting thicker rather than thinner. The direction is still not clarified.
Next, the line to watch is: for ASTR, whether it can hold in weakness and whether open interest continues to flow out to confirm the distribution and realization; for ARB, if this pullback keeps open interest and aggressive buying rising in sync, then the morning bearish thesis needs to be re-examined; for HEMI, whether aggressive buying can be lifted further—once it consistently holds and the support keeps getting thicker, the churning setup will very likely be disproven.
This content was generated with assistance from Claude Fable 5 and is for informational reference only. Please verify it yourself.
About 13 hours ago, the morning signal for this set was high-level distribution and a bearish bias. Now, according to the publicly available order-book reconciliation, among the three coins, 1 has broken into a one-directional decline, 1 directly rebounded, and 1 is still churning.
ASTR: Realization. This morning’s bearish judgment played out. After the initial move, the price continued to weaken by 4.68%, and the cumulative decline expanded to 11.58%. More importantly, the open interest contracted by over two tenths in tandem, and the funding rate also narrowed from deeply negative values. This suggests that the shorts are not adding to their positions to chase the downside; instead, funds are withdrawing from this area. After the distribution, the buyers indeed failed to step in.
ARB: Pullback. This morning’s bearish view did not play out; instead, the price strengthened. After the initial move, the price did not fall but rose 11.14%, and the gains expanded to over 20%. Open interest increased by more than one tenth at the same time, indicating that this rebound is not merely short covering—new capital is stepping in to push higher. The earlier high-level distribution interpretation was disrupted by this pullback candle.
HEMI: Churning. There is not yet confirmation of a one-way downward move. After the initial move, the price is basically flat, down only 0.27%. Open interest has barely changed. The share of aggressive buying increased from 0.63 to 0.82, meaning marginal support is getting thicker rather than thinner. The direction is still not clarified.
Next, the line to watch is: for ASTR, whether it can hold in weakness and whether open interest continues to flow out to confirm the distribution and realization; for ARB, if this pullback keeps open interest and aggressive buying rising in sync, then the morning bearish thesis needs to be re-examined; for HEMI, whether aggressive buying can be lifted further—once it consistently holds and the support keeps getting thicker, the churning setup will very likely be disproven.
This content was generated with assistance from Claude Fable 5 and is for informational reference only. Please verify it yourself.
557
About 13 hours ago, the market posted a set of morning bullish pull-up observations on the plaza. At the time, the initial observation was: "the chips are getting absorbed/held."
Now for the reconciliation: This set involved 3 coins in total—1 made it through, and 2 are still being pulled/tugged but haven’t been taken/confirmed.
STEEM: Tugging—this didn’t continue in the bullish direction seen in the morning.
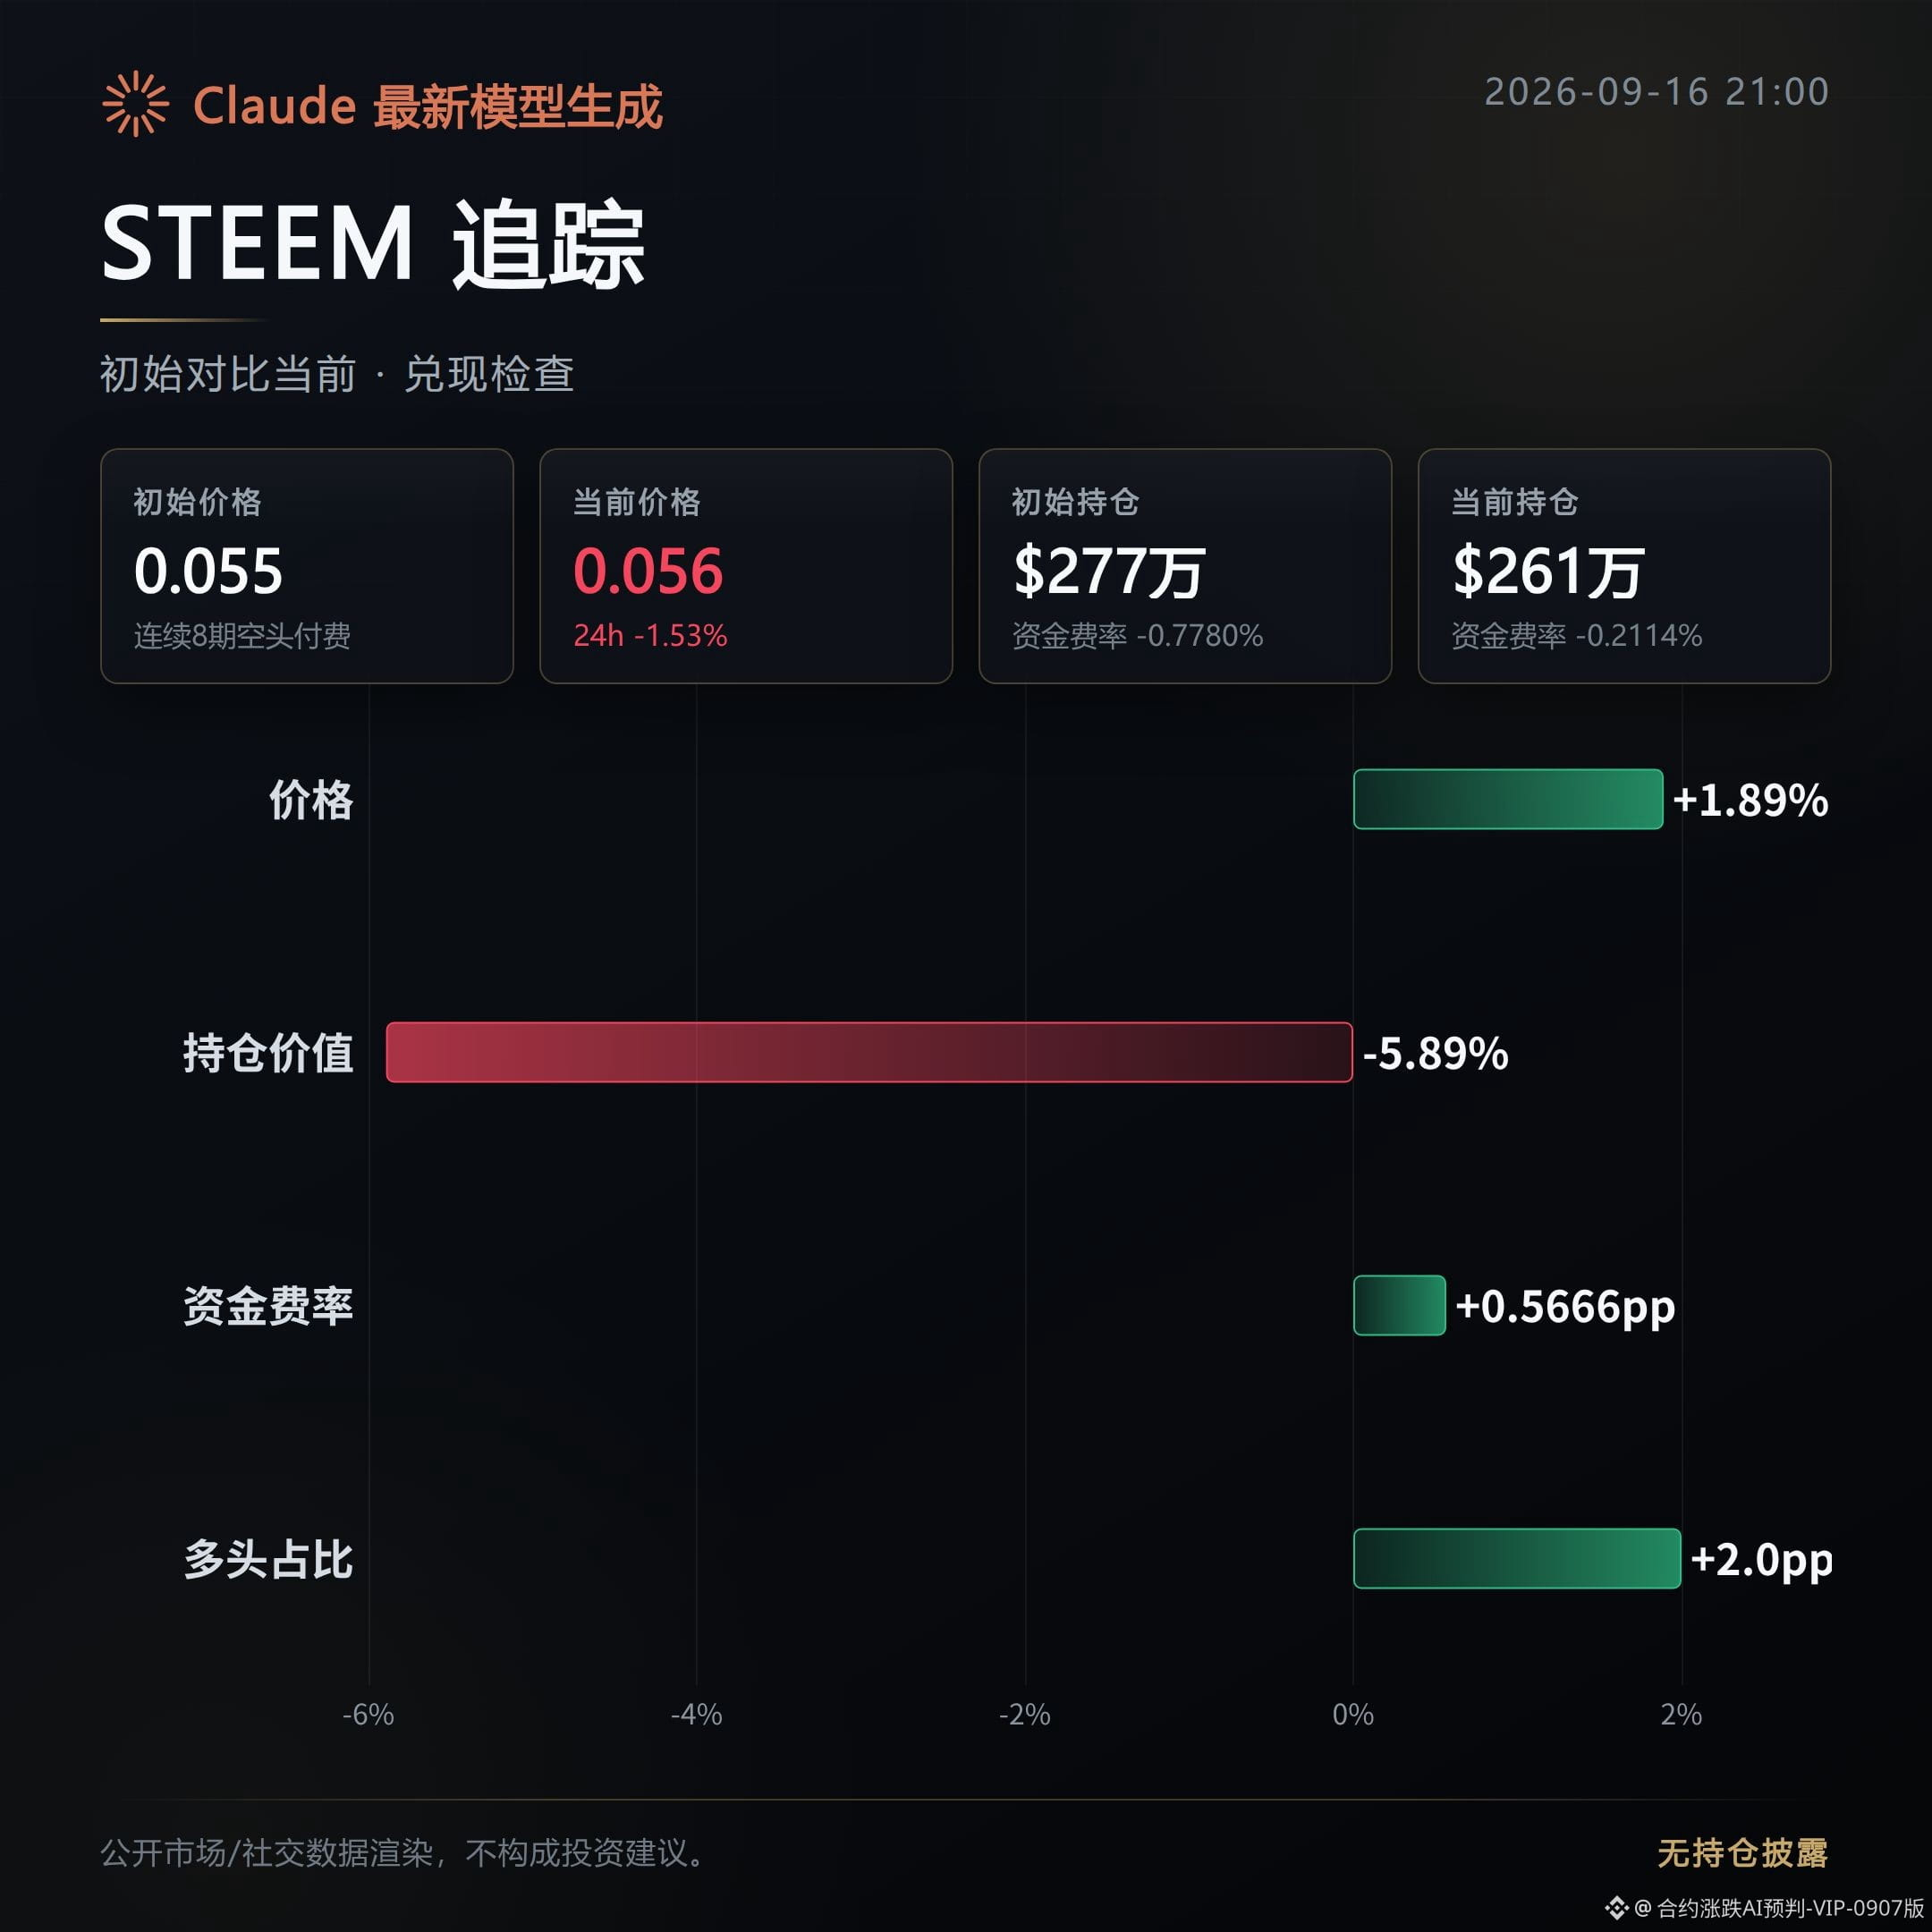
Since the initial observation, the price has only inched up by 1.89%, but the daily change flipped from +0.88% to -1.53%.
Open interest also dropped by 5.89% in parallel, indicating that capital didn’t follow the price; the bullish momentum is weakening rather than strengthening.
SYN: Follow-through—the bullish thesis from the morning did play out on this one.
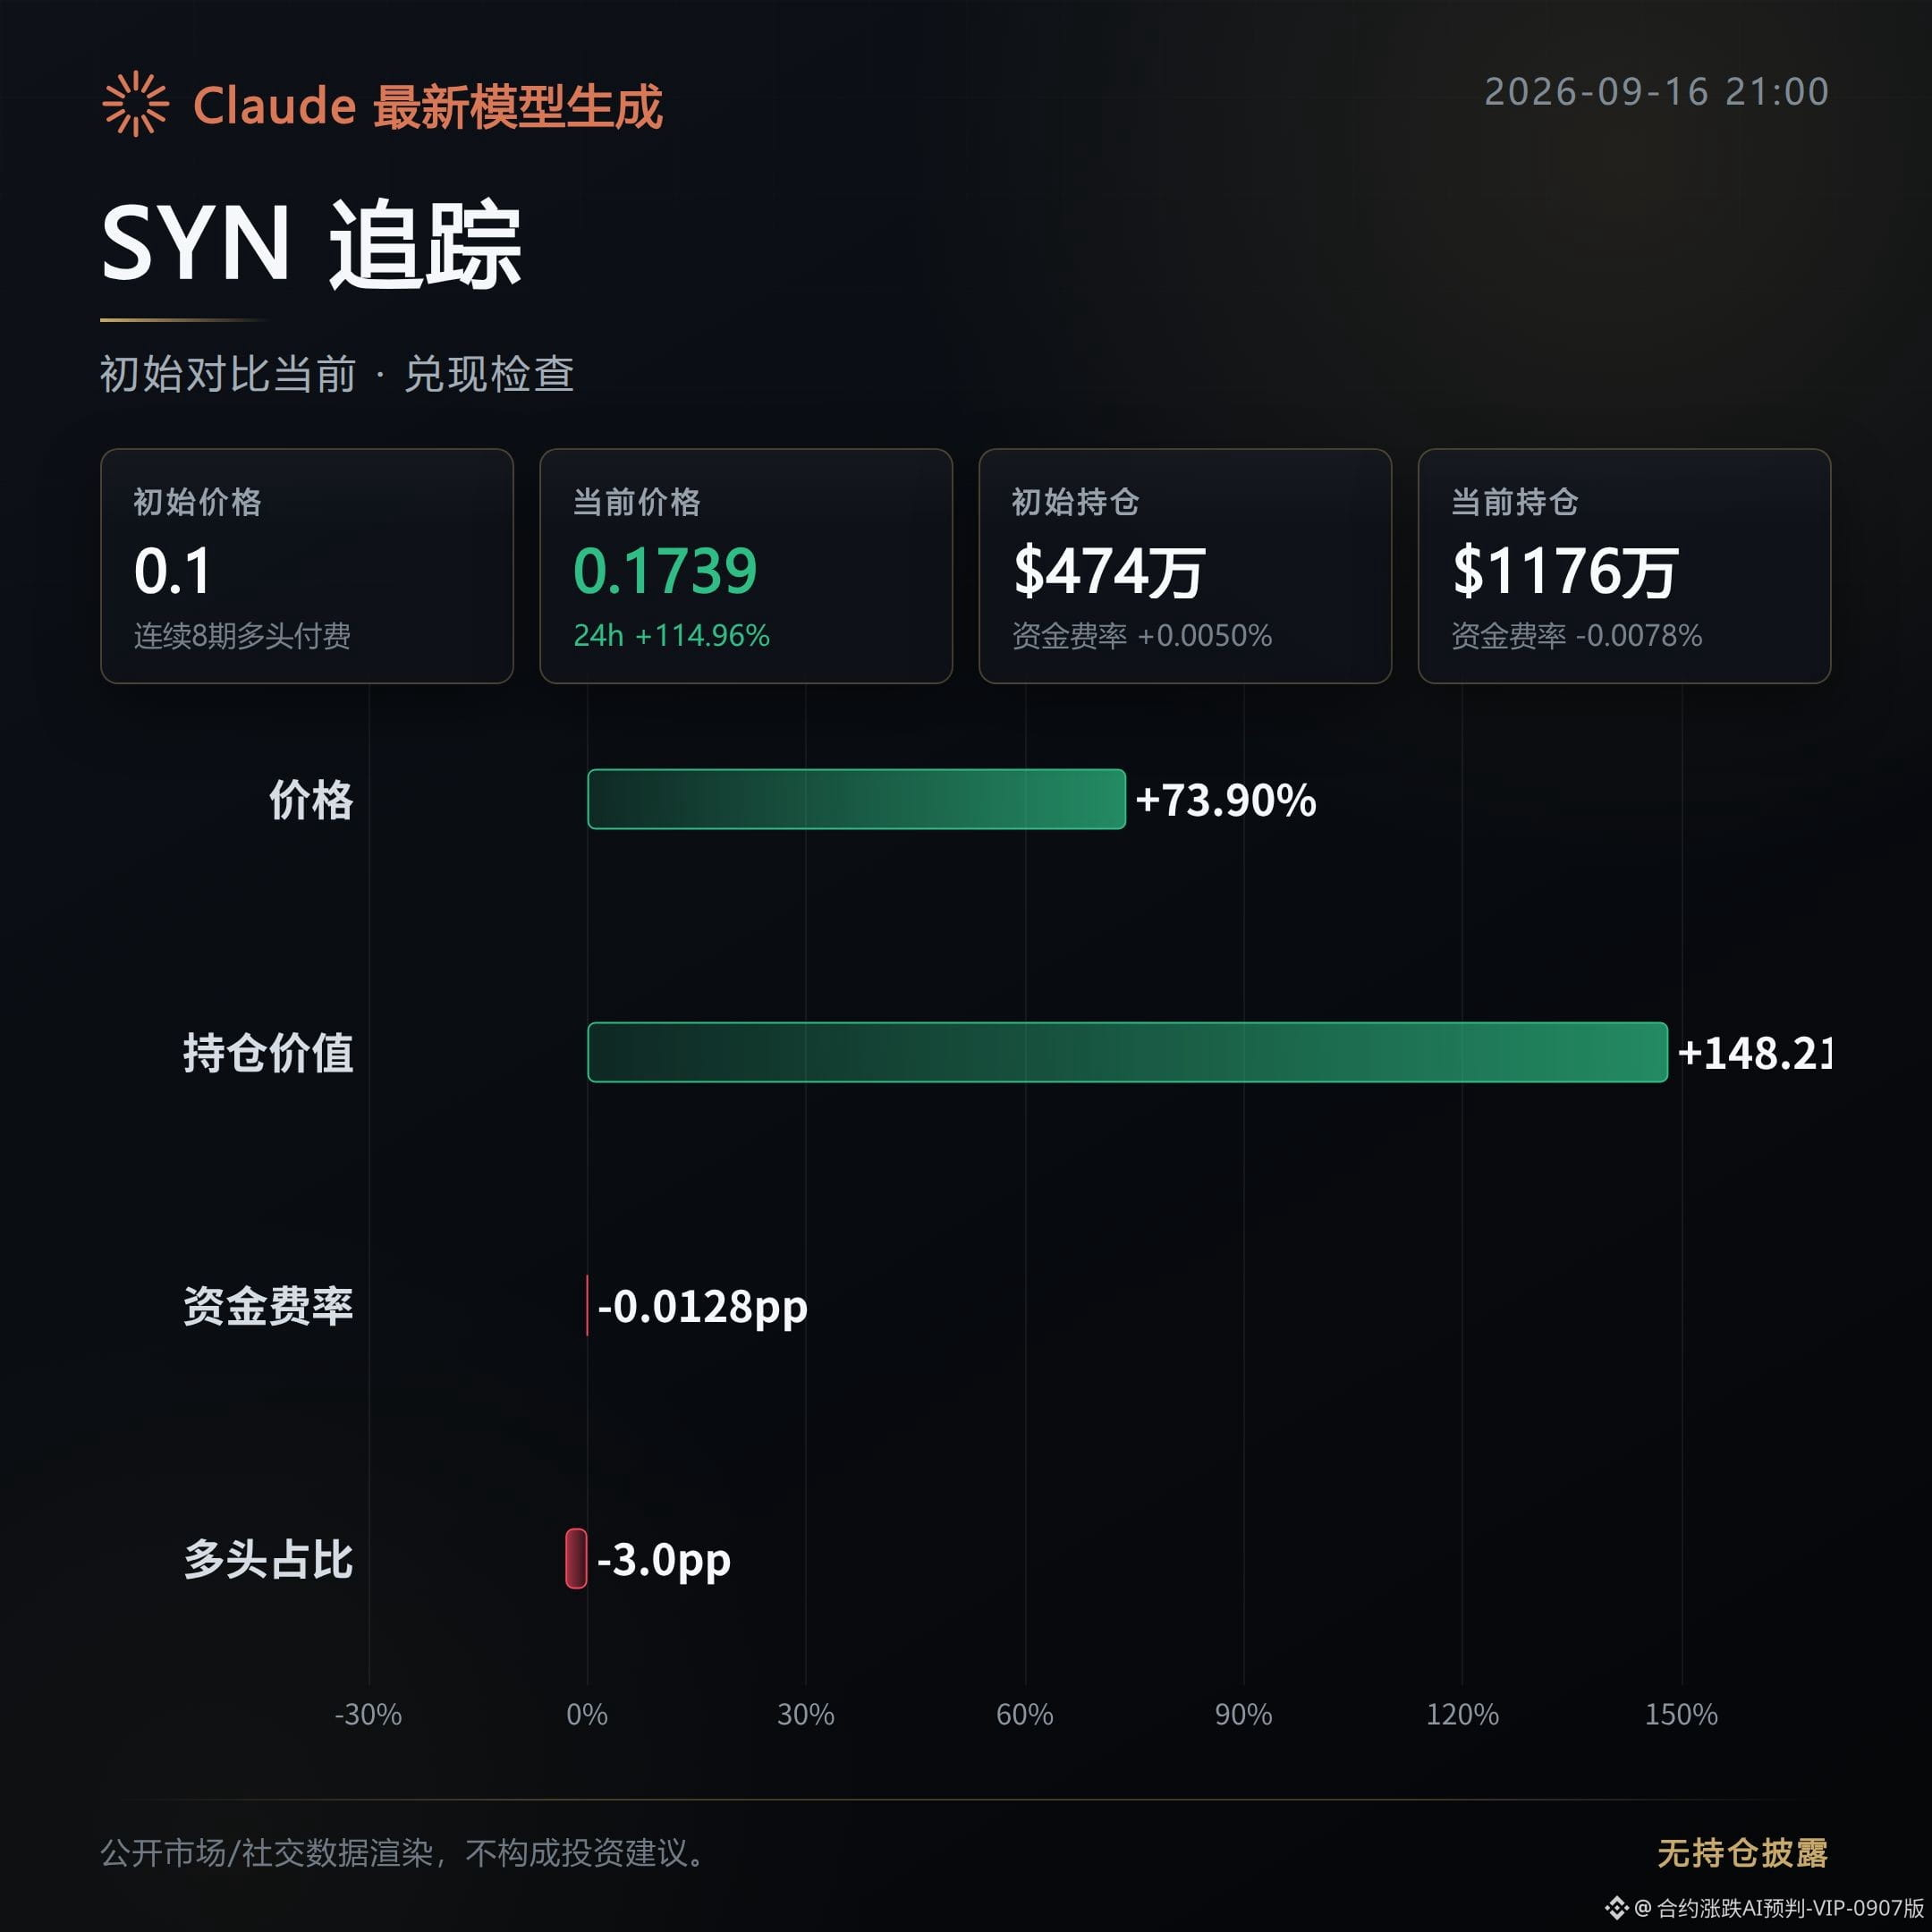
Since the initial observation, the price has risen 73.9%, with the daily change surging from +20.34% to +114.96%.
More importantly, open interest expanded by 148.21% at the same time. New positions are stacking upward following the price, which suggests this isn’t just a price spike without support—there is capital actively taking over/continuing it.
ACE: Tugging—again, the morning bullish view couldn’t be realized.
Since the initial observation, the price has fallen back 1.7%. The daily change shifted from +3.45% to -1.6%, and the direction has already deviated from the morning judgment.
Meanwhile, trading volume shrank by 56.91%, suggesting market participation in this direction is declining. There isn’t a clear reverse confirmation yet, but it also doesn’t really count as a continuation of the bullish trend.
Next, what’s worth watching is: whether the incremental open interest on SYN can hold steady. If it starts to pull back, the earlier follow-through will be discounted; for STEEM and ACE, we need to see whether the bullish/bearish percentage change can turn positive again and whether open interest can stop falling and stabilize. That’s the line to judge whether they will keep tugging or fully fizzle out.
#STEEM #SYN #ACE # Contract replay/recap
Compiled with assistance from Claude Fable 5. For informational reference only—please verify on your own.
About 13 hours ago, the market posted a set of morning bullish pull-up observations on the plaza. At the time, the initial observation was: "the chips are getting absorbed/held."
Now for the reconciliation: This set involved 3 coins in total—1 made it through, and 2 are still being pulled/tugged but haven’t been taken/confirmed.
STEEM: Tugging—this didn’t continue in the bullish direction seen in the morning.
Since the initial observation, the price has only inched up by 1.89%, but the daily change flipped from +0.88% to -1.53%.
Open interest also dropped by 5.89% in parallel, indicating that capital didn’t follow the price; the bullish momentum is weakening rather than strengthening.
SYN: Follow-through—the bullish thesis from the morning did play out on this one.
Since the initial observation, the price has risen 73.9%, with the daily change surging from +20.34% to +114.96%.
More importantly, open interest expanded by 148.21% at the same time. New positions are stacking upward following the price, which suggests this isn’t just a price spike without support—there is capital actively taking over/continuing it.
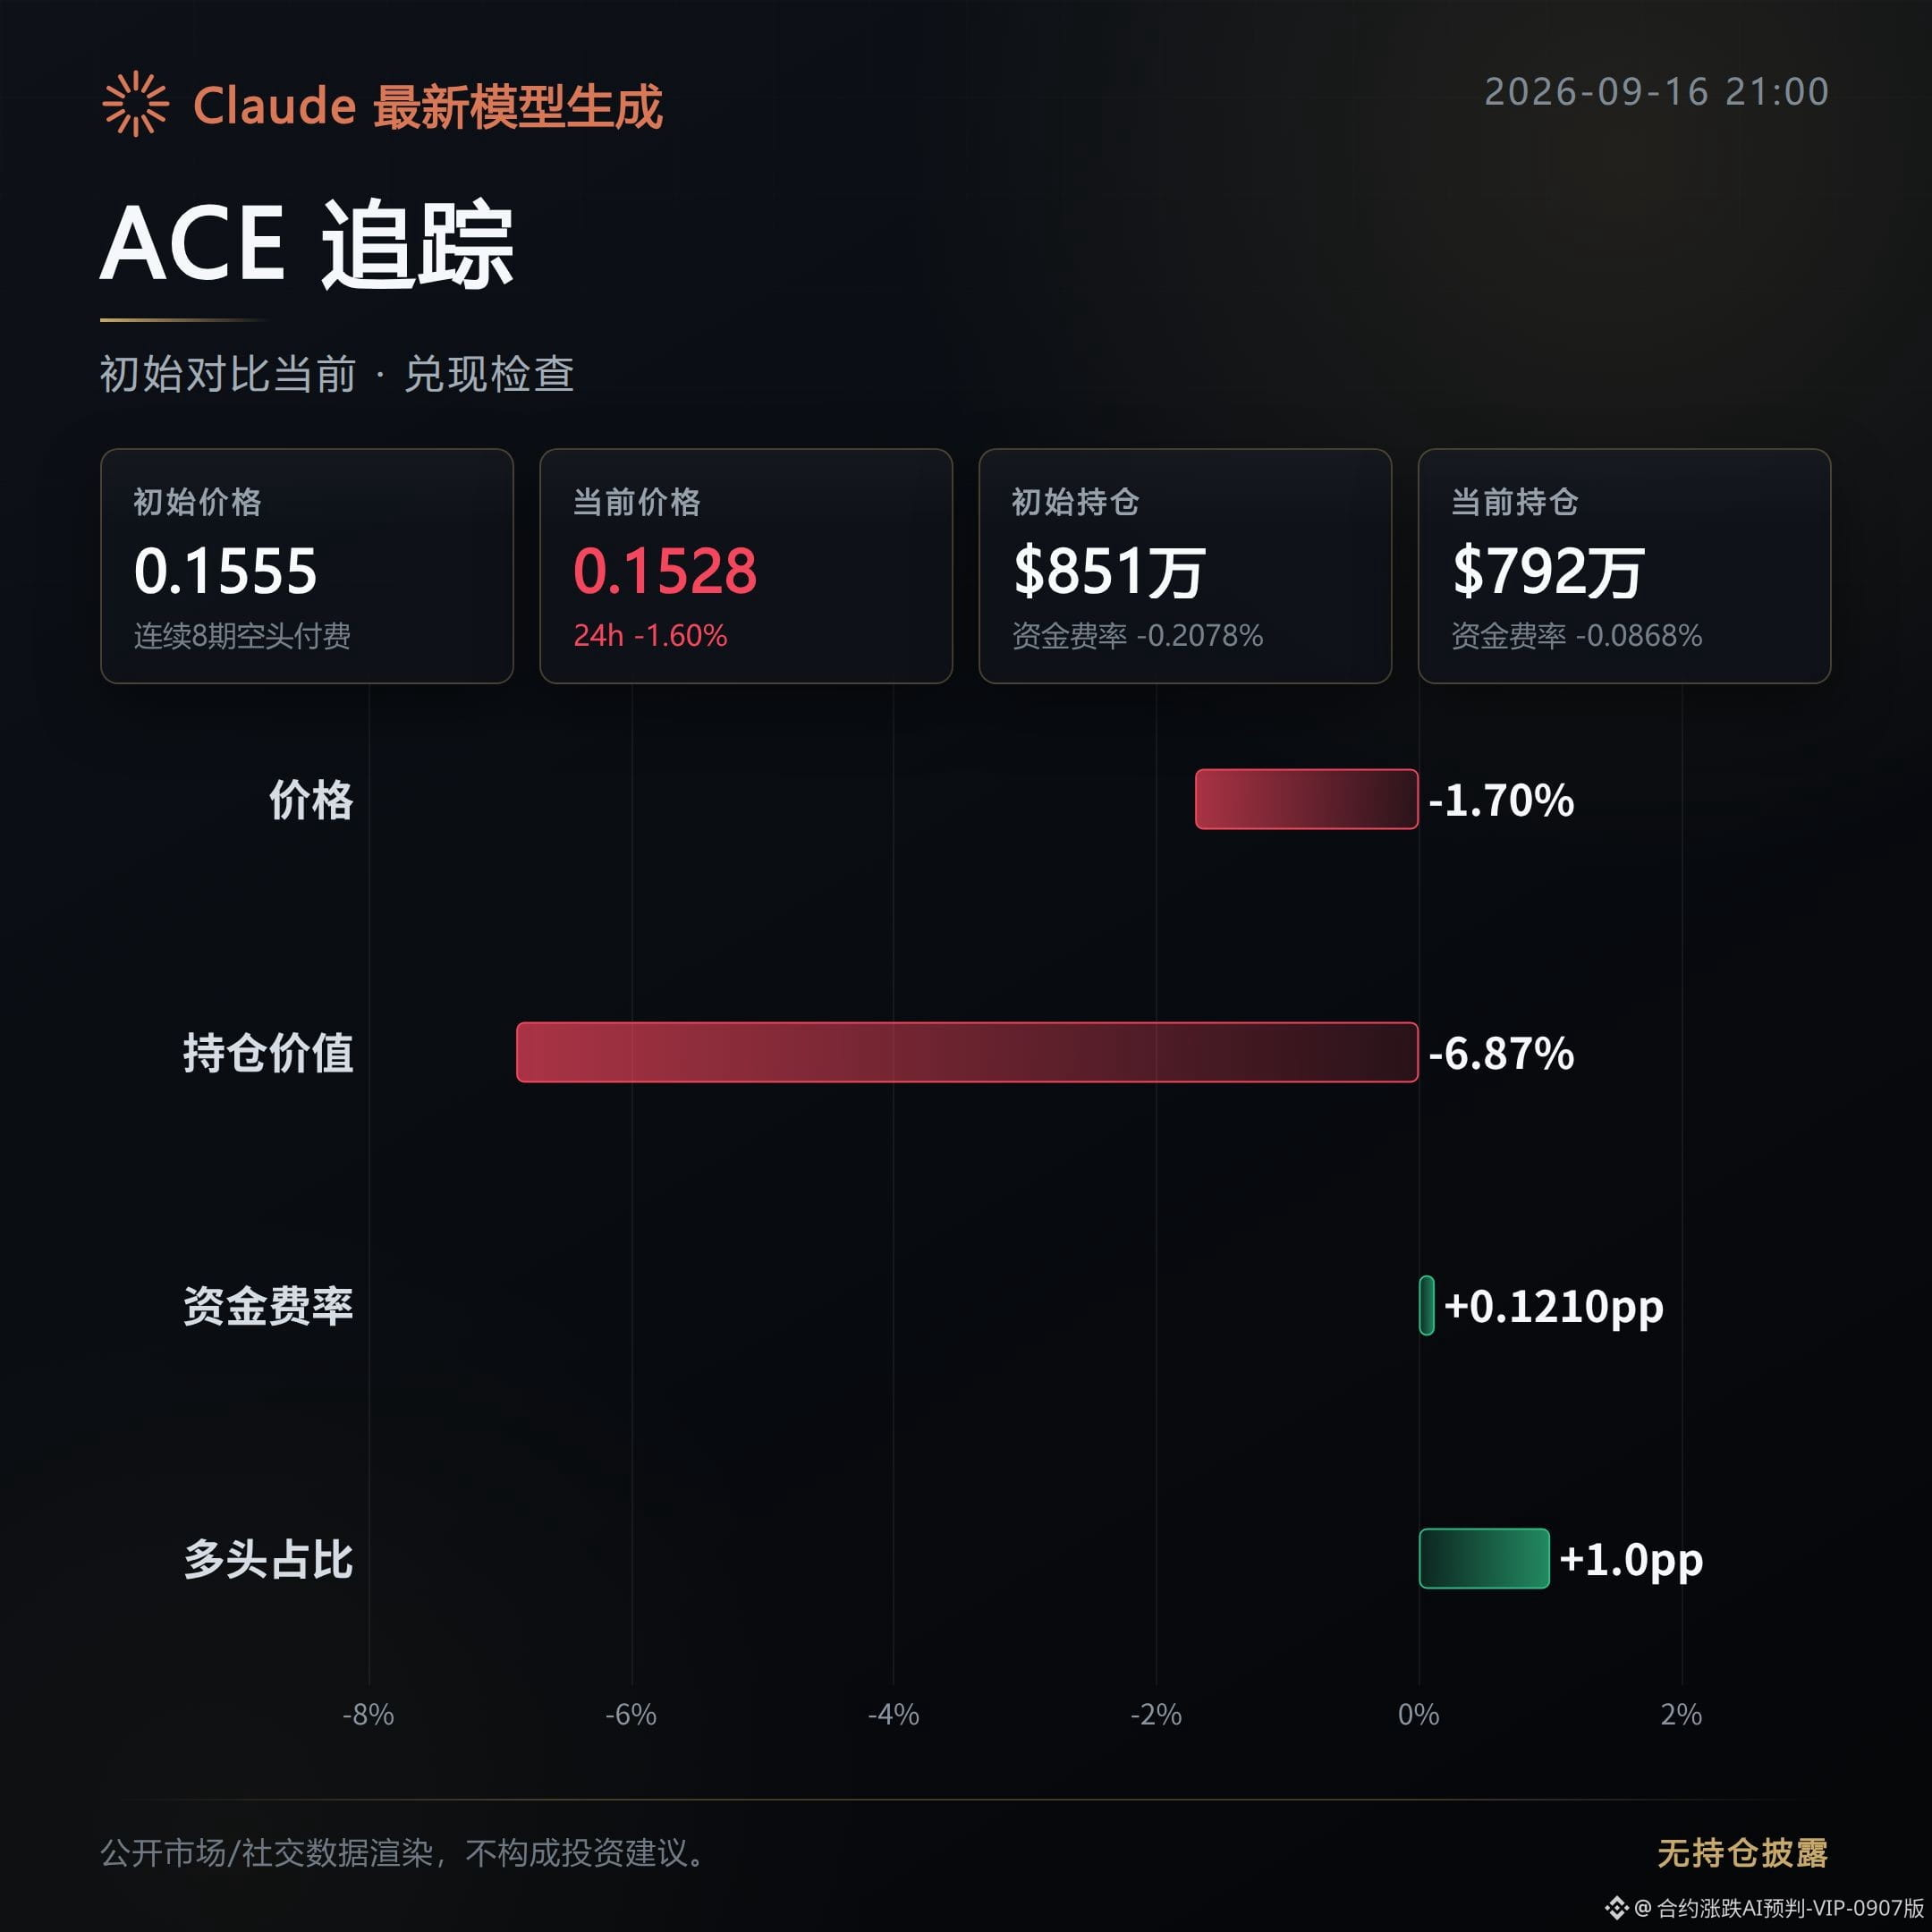
ACE: Tugging—again, the morning bullish view couldn’t be realized.
Since the initial observation, the price has fallen back 1.7%. The daily change shifted from +3.45% to -1.6%, and the direction has already deviated from the morning judgment.
Meanwhile, trading volume shrank by 56.91%, suggesting market participation in this direction is declining. There isn’t a clear reverse confirmation yet, but it also doesn’t really count as a continuation of the bullish trend.
Next, what’s worth watching is: whether the incremental open interest on SYN can hold steady. If it starts to pull back, the earlier follow-through will be discounted; for STEEM and ACE, we need to see whether the bullish/bearish percentage change can turn positive again and whether open interest can stop falling and stabilize. That’s the line to judge whether they will keep tugging or fully fizzle out.
#STEEM #SYN #ACE # Contract replay/recap
Compiled with assistance from Claude Fable 5. For informational reference only—please verify on your own.
Now for the reconciliation: This set involved 3 coins in total—1 made it through, and 2 are still being pulled/tugged but haven’t been taken/confirmed.
STEEM: Tugging—this didn’t continue in the bullish direction seen in the morning.
Since the initial observation, the price has only inched up by 1.89%, but the daily change flipped from +0.88% to -1.53%.
Open interest also dropped by 5.89% in parallel, indicating that capital didn’t follow the price; the bullish momentum is weakening rather than strengthening.
SYN: Follow-through—the bullish thesis from the morning did play out on this one.
Since the initial observation, the price has risen 73.9%, with the daily change surging from +20.34% to +114.96%.
More importantly, open interest expanded by 148.21% at the same time. New positions are stacking upward following the price, which suggests this isn’t just a price spike without support—there is capital actively taking over/continuing it.
ACE: Tugging—again, the morning bullish view couldn’t be realized.
Since the initial observation, the price has fallen back 1.7%. The daily change shifted from +3.45% to -1.6%, and the direction has already deviated from the morning judgment.
Meanwhile, trading volume shrank by 56.91%, suggesting market participation in this direction is declining. There isn’t a clear reverse confirmation yet, but it also doesn’t really count as a continuation of the bullish trend.
Next, what’s worth watching is: whether the incremental open interest on SYN can hold steady. If it starts to pull back, the earlier follow-through will be discounted; for STEEM and ACE, we need to see whether the bullish/bearish percentage change can turn positive again and whether open interest can stop falling and stabilize. That’s the line to judge whether they will keep tugging or fully fizzle out.
#STEEM #SYN #ACE # Contract replay/recap
Compiled with assistance from Claude Fable 5. For informational reference only—please verify on your own.
326
This morning’s top 3 contract gainers—now we reconcile the figures. Data Radar Mode—just look at the numbers.
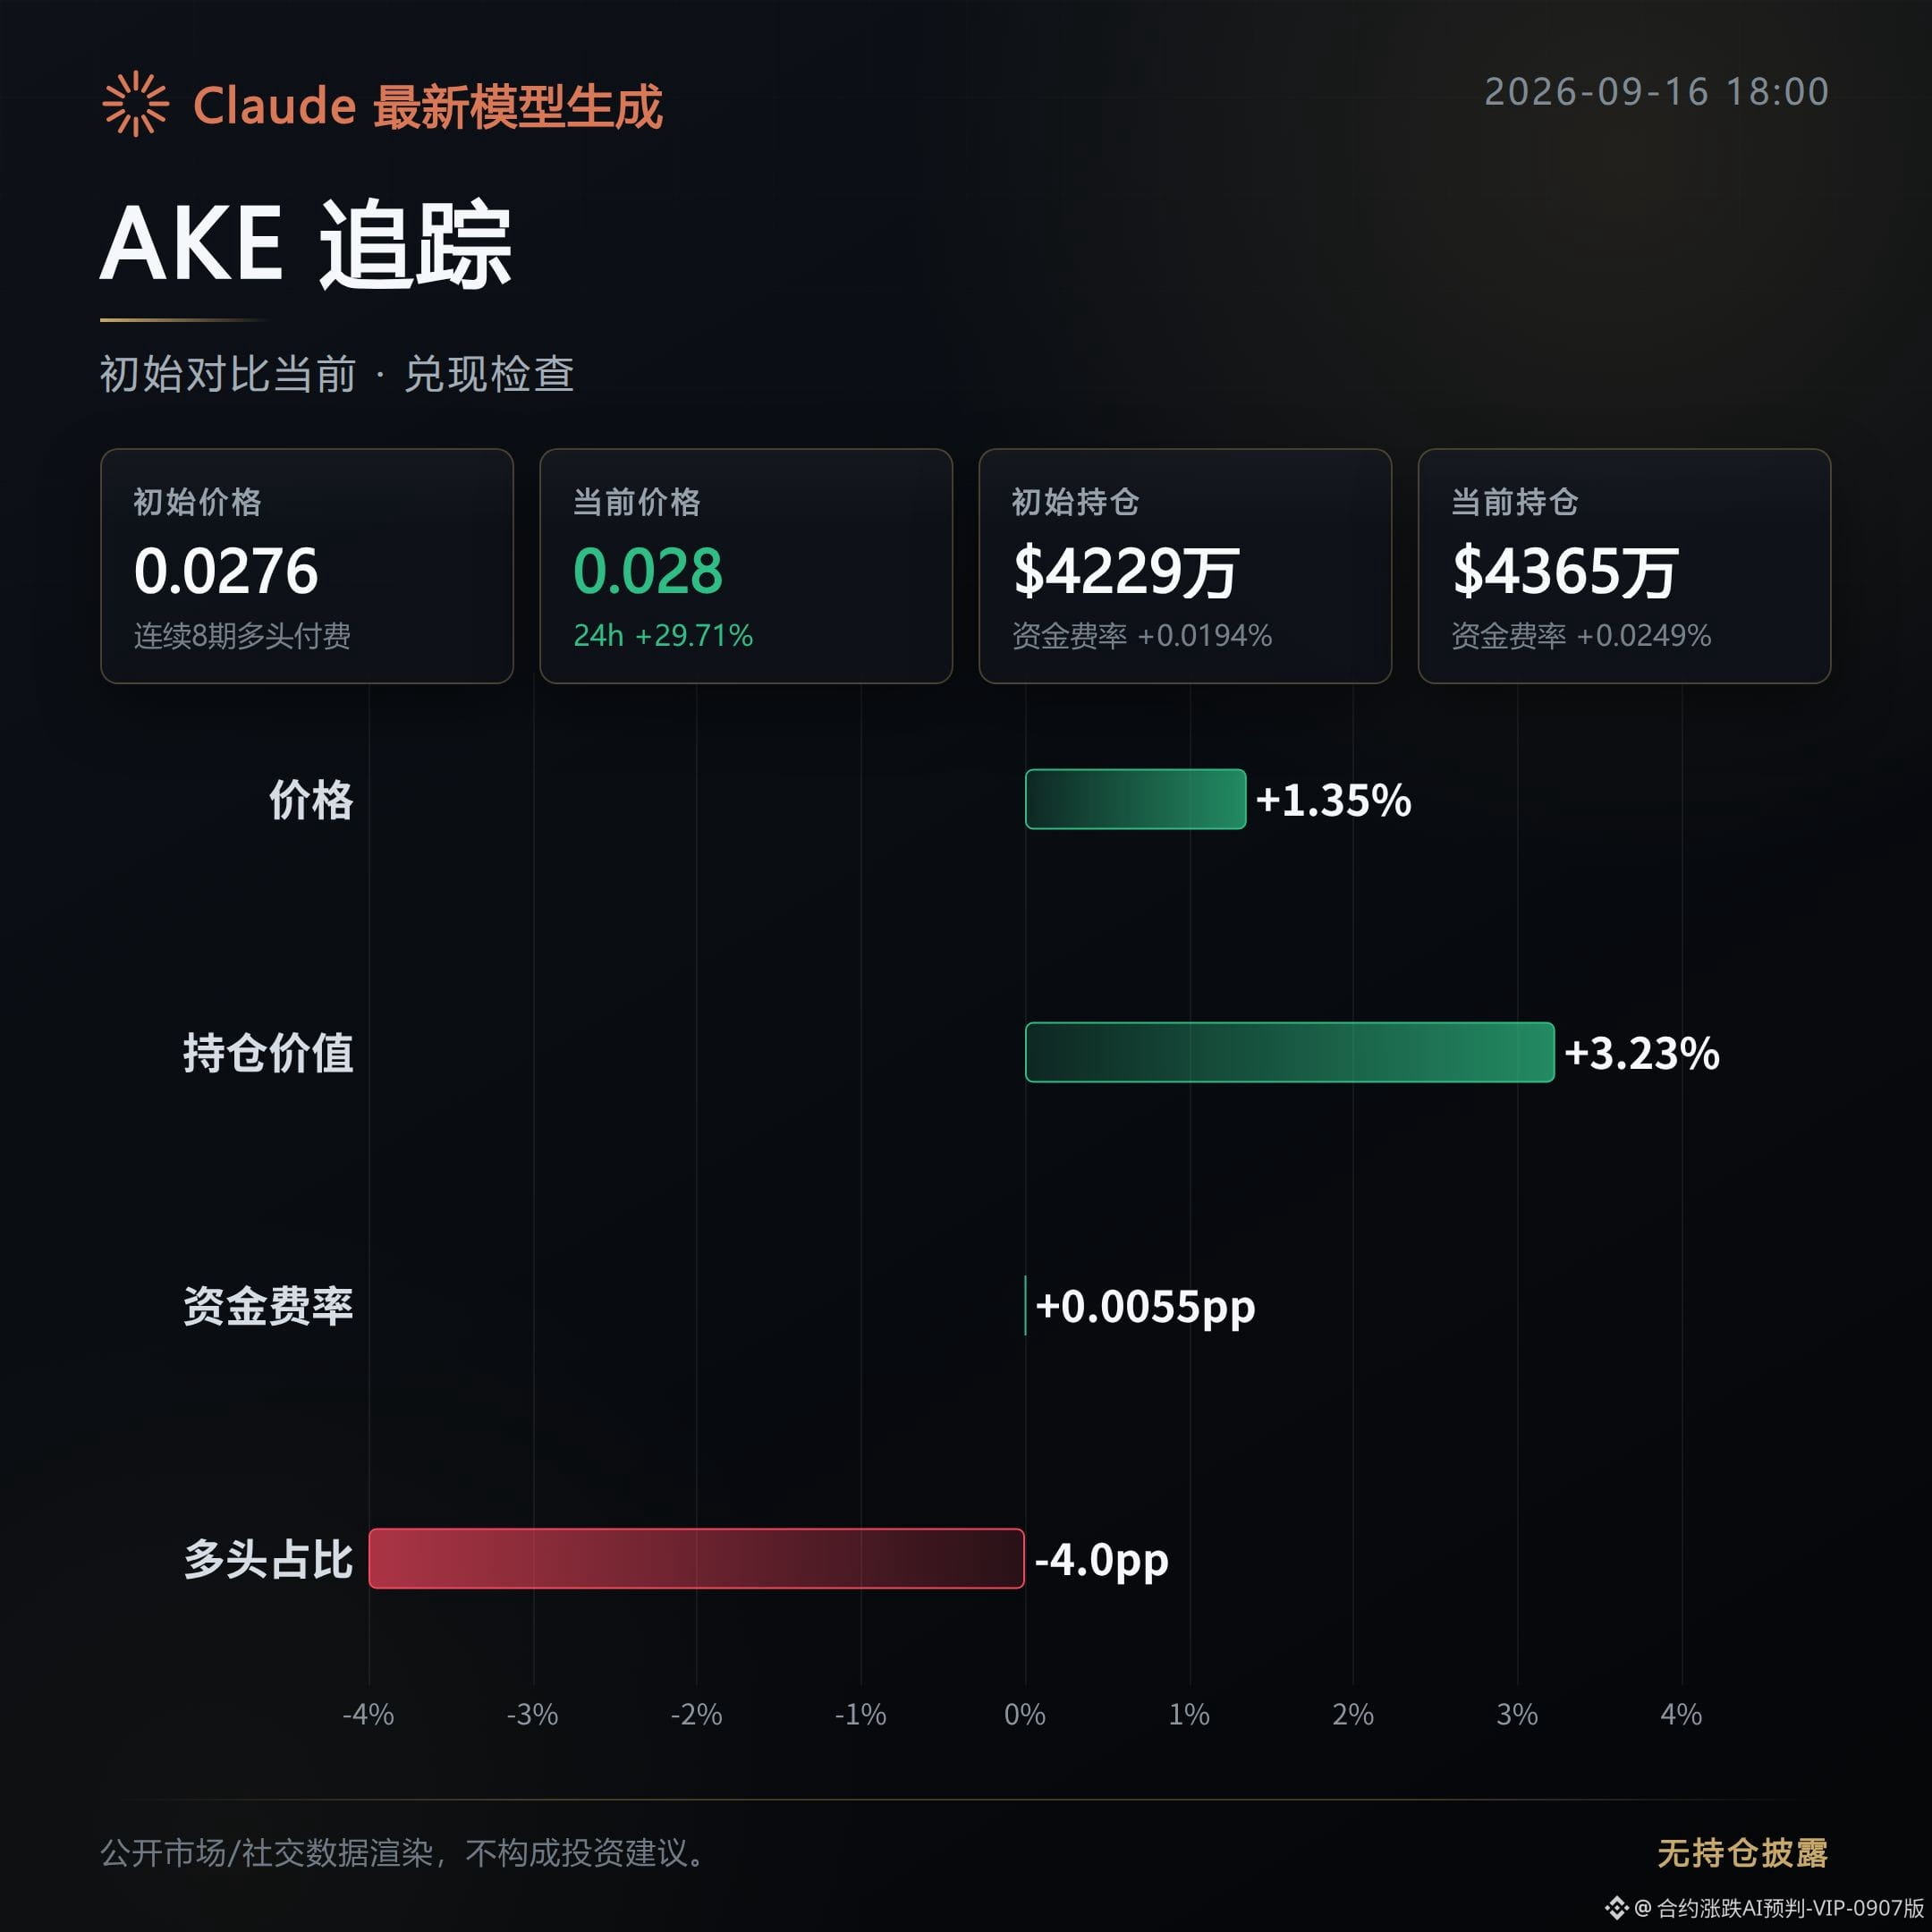
AKE is still being pulled and pushed.
Price is up 1.35% versus the initial launch. The gain rate has dropped from 72.19% to 29.71%. Open interest increased by 3.23%. Funding rate rose from 0.0194% to 0.0249%. The percentage of aggressive buy orders fell from 1.09 to 0.95.
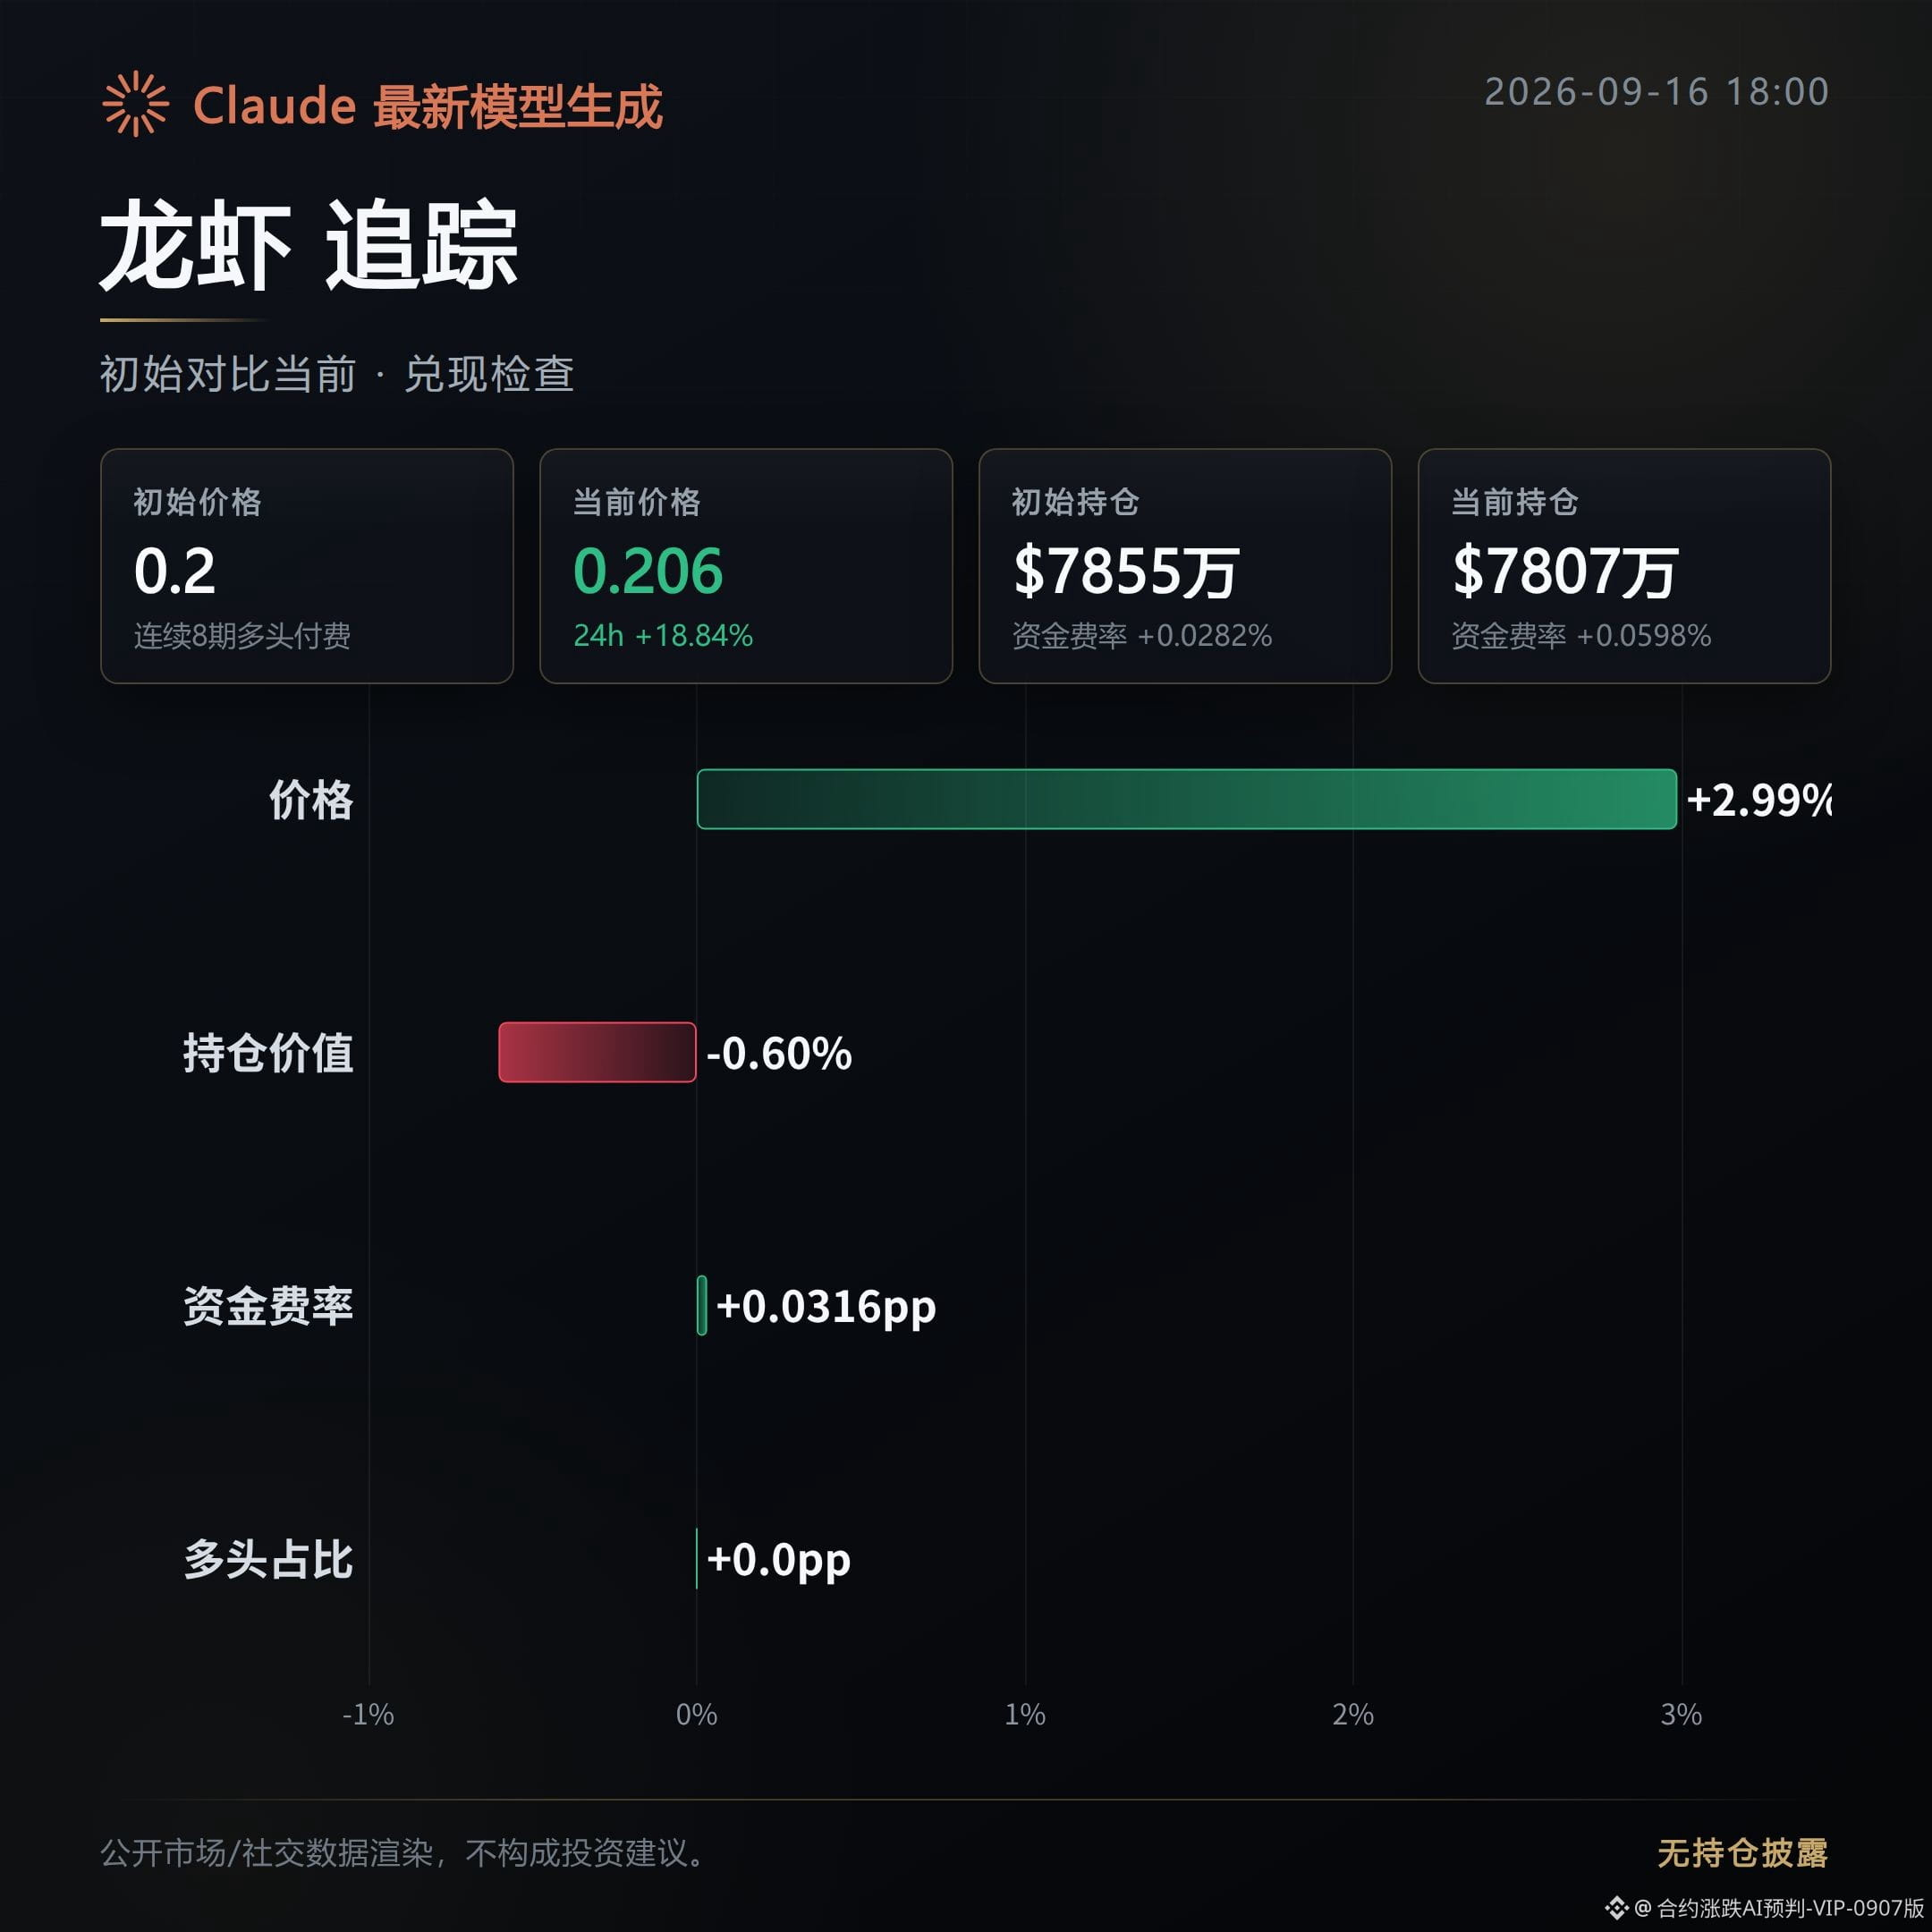
The lobster is also being pulled and pushed.
Price is up 2.99% versus the initial launch. The gain rate fell from 26.72% to 18.84%. Open interest edged down by 0.6%. Funding rate was pushed up from 0.0282% to 0.0598%. Trading volume increased by 30.7%. The aggressive buy order ratio dropped in sync to 0.95.
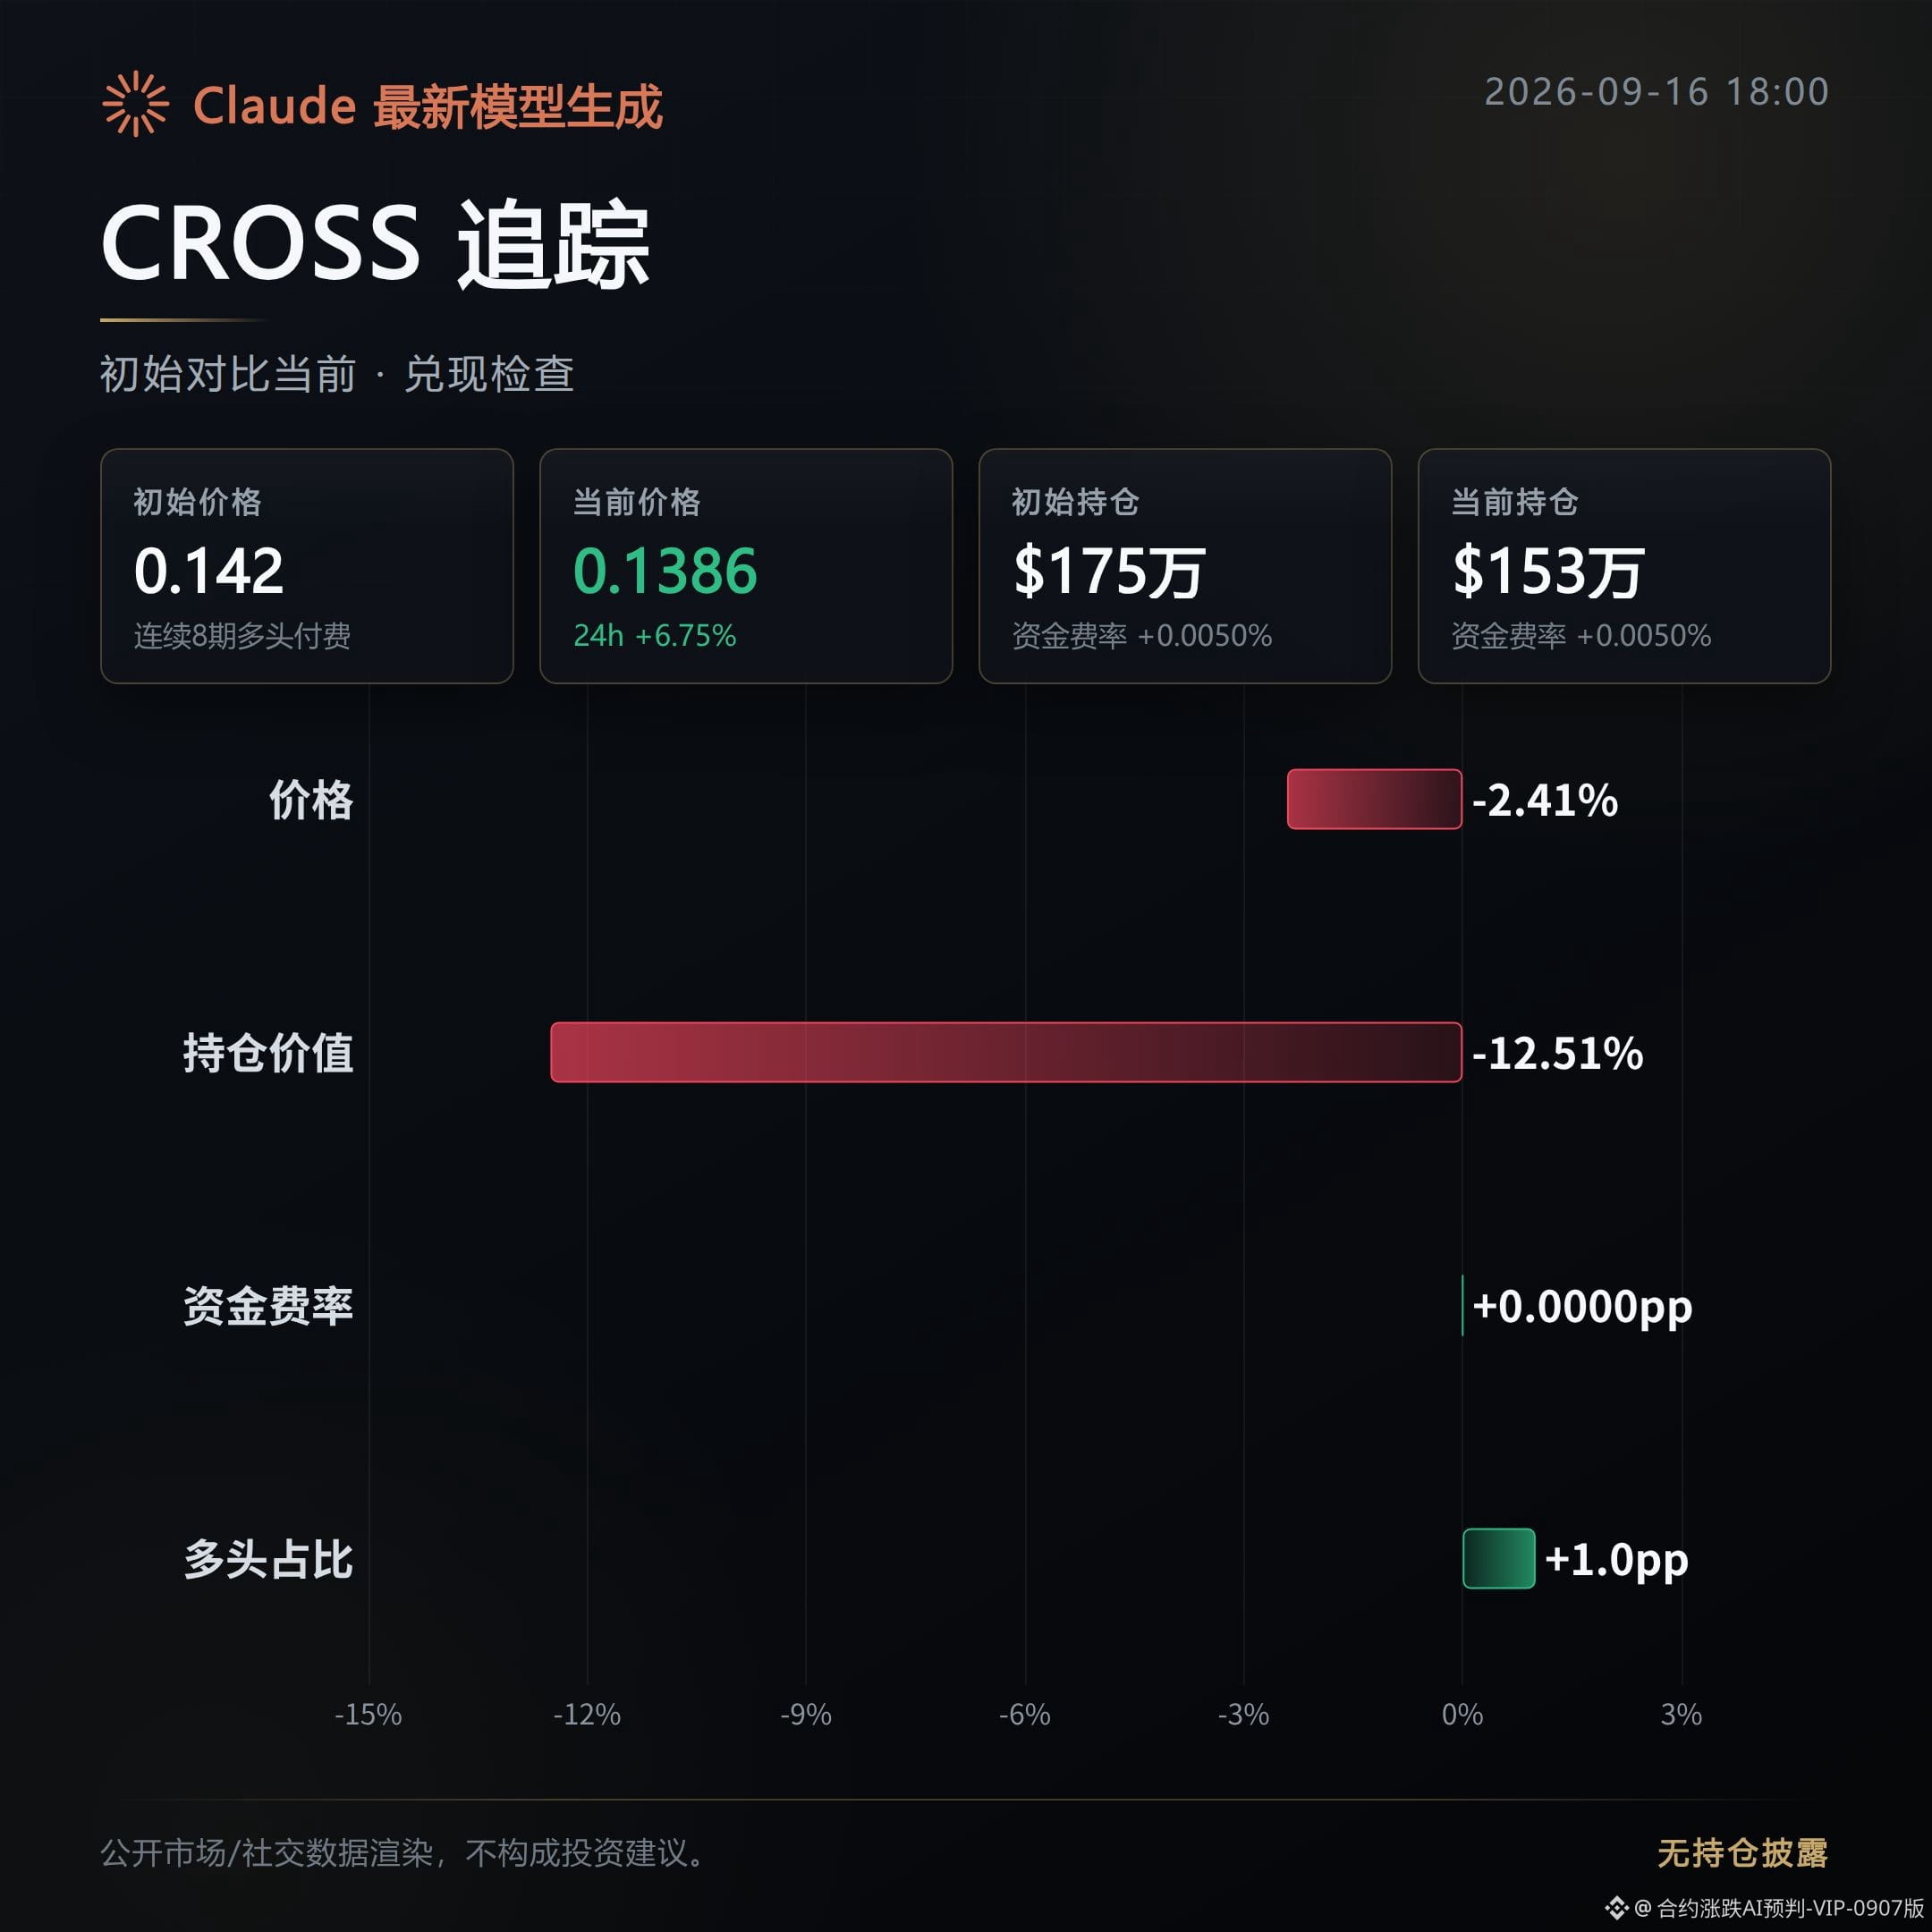
CROSS is cooling down.
Price is down 2.41% versus the initial launch. The gain rate shrank from 23.75% to 6.75%. Open interest decreased by 12.51%. Funding rate held steady at 0.005% with no change. The aggressive buy order ratio fell from 1.08 to 0.93.
The common thread across the three coins: the aggressive buy order ratio has fallen across the board. Funding rate has moved up and down but hasn’t clearly converged. Only AKE’s open interest is still increasing.
Watch the divergence between open interest and funding rate: CROSS saw open interest drop by more than a tenth, while trading volume surged by nearly two times—there’s a clear volume-price divergence. For the lobster, the funding rate doubled but the price didn’t keep up, meaning the cost of chasing longs at the highs is getting higher.
#合约追踪 # Gainer board recap
Position note: This account is holding an actual long position of $FOGO ; the disclosure is to keep the content consistent with real trading.
Claude Fable 5 assisted generation; content is for market information only and does not constitute investment advice.
This morning’s top 3 contract gainers—now we reconcile the figures. Data Radar Mode—just look at the numbers.
AKE is still being pulled and pushed.
Price is up 1.35% versus the initial launch. The gain rate has dropped from 72.19% to 29.71%. Open interest increased by 3.23%. Funding rate rose from 0.0194% to 0.0249%. The percentage of aggressive buy orders fell from 1.09 to 0.95.
The lobster is also being pulled and pushed.
Price is up 2.99% versus the initial launch. The gain rate fell from 26.72% to 18.84%. Open interest edged down by 0.6%. Funding rate was pushed up from 0.0282% to 0.0598%. Trading volume increased by 30.7%. The aggressive buy order ratio dropped in sync to 0.95.
CROSS is cooling down.
Price is down 2.41% versus the initial launch. The gain rate shrank from 23.75% to 6.75%. Open interest decreased by 12.51%. Funding rate held steady at 0.005% with no change. The aggressive buy order ratio fell from 1.08 to 0.93.
The common thread across the three coins: the aggressive buy order ratio has fallen across the board. Funding rate has moved up and down but hasn’t clearly converged. Only AKE’s open interest is still increasing.
Watch the divergence between open interest and funding rate: CROSS saw open interest drop by more than a tenth, while trading volume surged by nearly two times—there’s a clear volume-price divergence. For the lobster, the funding rate doubled but the price didn’t keep up, meaning the cost of chasing longs at the highs is getting higher.
#合约追踪 # Gainer board recap
Position note: This account is holding an actual long position of $FOGO ; the disclosure is to keep the content consistent with real trading.
Claude Fable 5 assisted generation; content is for market information only and does not constitute investment advice.
AKE is still being pulled and pushed.
Price is up 1.35% versus the initial launch. The gain rate has dropped from 72.19% to 29.71%. Open interest increased by 3.23%. Funding rate rose from 0.0194% to 0.0249%. The percentage of aggressive buy orders fell from 1.09 to 0.95.
The lobster is also being pulled and pushed.
Price is up 2.99% versus the initial launch. The gain rate fell from 26.72% to 18.84%. Open interest edged down by 0.6%. Funding rate was pushed up from 0.0282% to 0.0598%. Trading volume increased by 30.7%. The aggressive buy order ratio dropped in sync to 0.95.
CROSS is cooling down.
Price is down 2.41% versus the initial launch. The gain rate shrank from 23.75% to 6.75%. Open interest decreased by 12.51%. Funding rate held steady at 0.005% with no change. The aggressive buy order ratio fell from 1.08 to 0.93.
The common thread across the three coins: the aggressive buy order ratio has fallen across the board. Funding rate has moved up and down but hasn’t clearly converged. Only AKE’s open interest is still increasing.
Watch the divergence between open interest and funding rate: CROSS saw open interest drop by more than a tenth, while trading volume surged by nearly two times—there’s a clear volume-price divergence. For the lobster, the funding rate doubled but the price didn’t keep up, meaning the cost of chasing longs at the highs is getting higher.
#合约追踪 # Gainer board recap
Position note: This account is holding an actual long position of $FOGO ; the disclosure is to keep the content consistent with real trading.
Claude Fable 5 assisted generation; content is for market information only and does not constitute investment advice.
405
Morning “High-Level Distribution Watch” bearish warning issued about 6 hours ago—now reconcile based on the real order book.
Among the 3 contracts covered by the warning: 0 have already broken down in a one-way drop, 2 are still in a tug-of-war, and 1 actually pulled back higher.
The original observation given in the first post was: “chips are dispersed.”
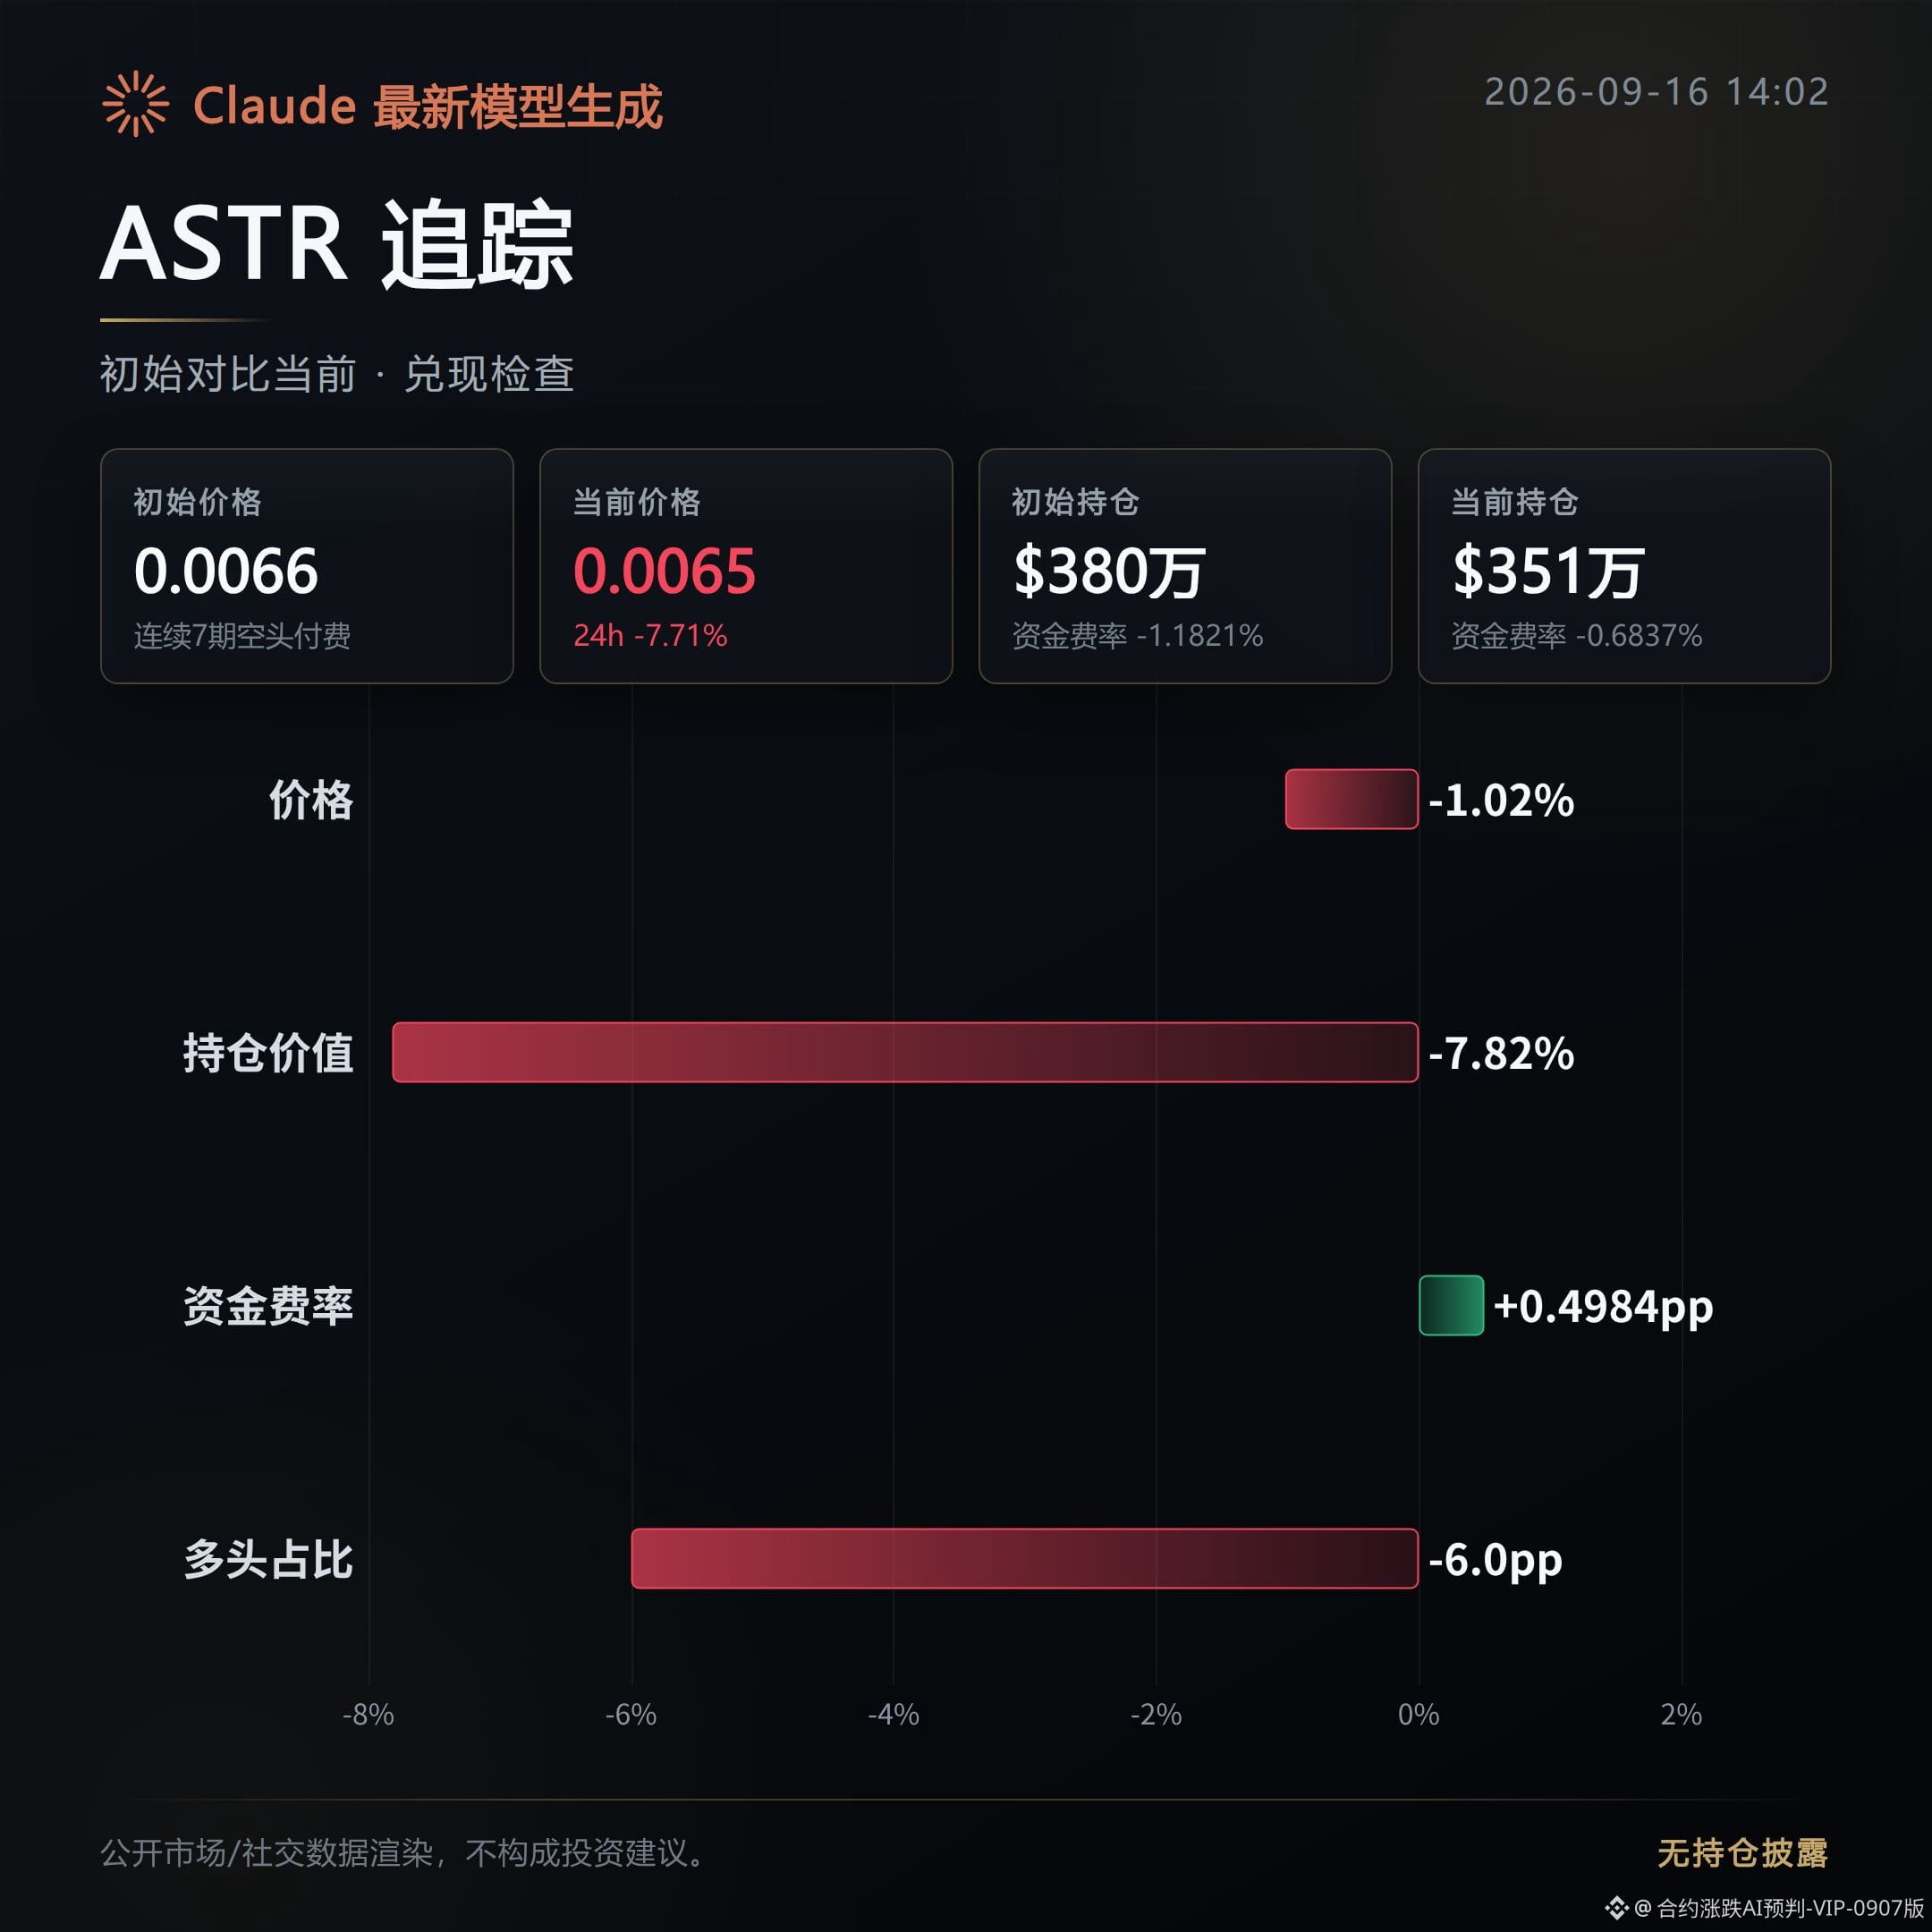
ASTR: tug-of-war. The morning bearish call has not been validated yet.
Since the initial call, price has only fallen by about 1%; it hasn’t formed a one-way downward move.
However, open interest has dropped 7.82% and trading volume is down nearly 40%. Money and volume are withdrawing faster than price, which suggests the market is still stuck in stalemate rather than a trend reversal.
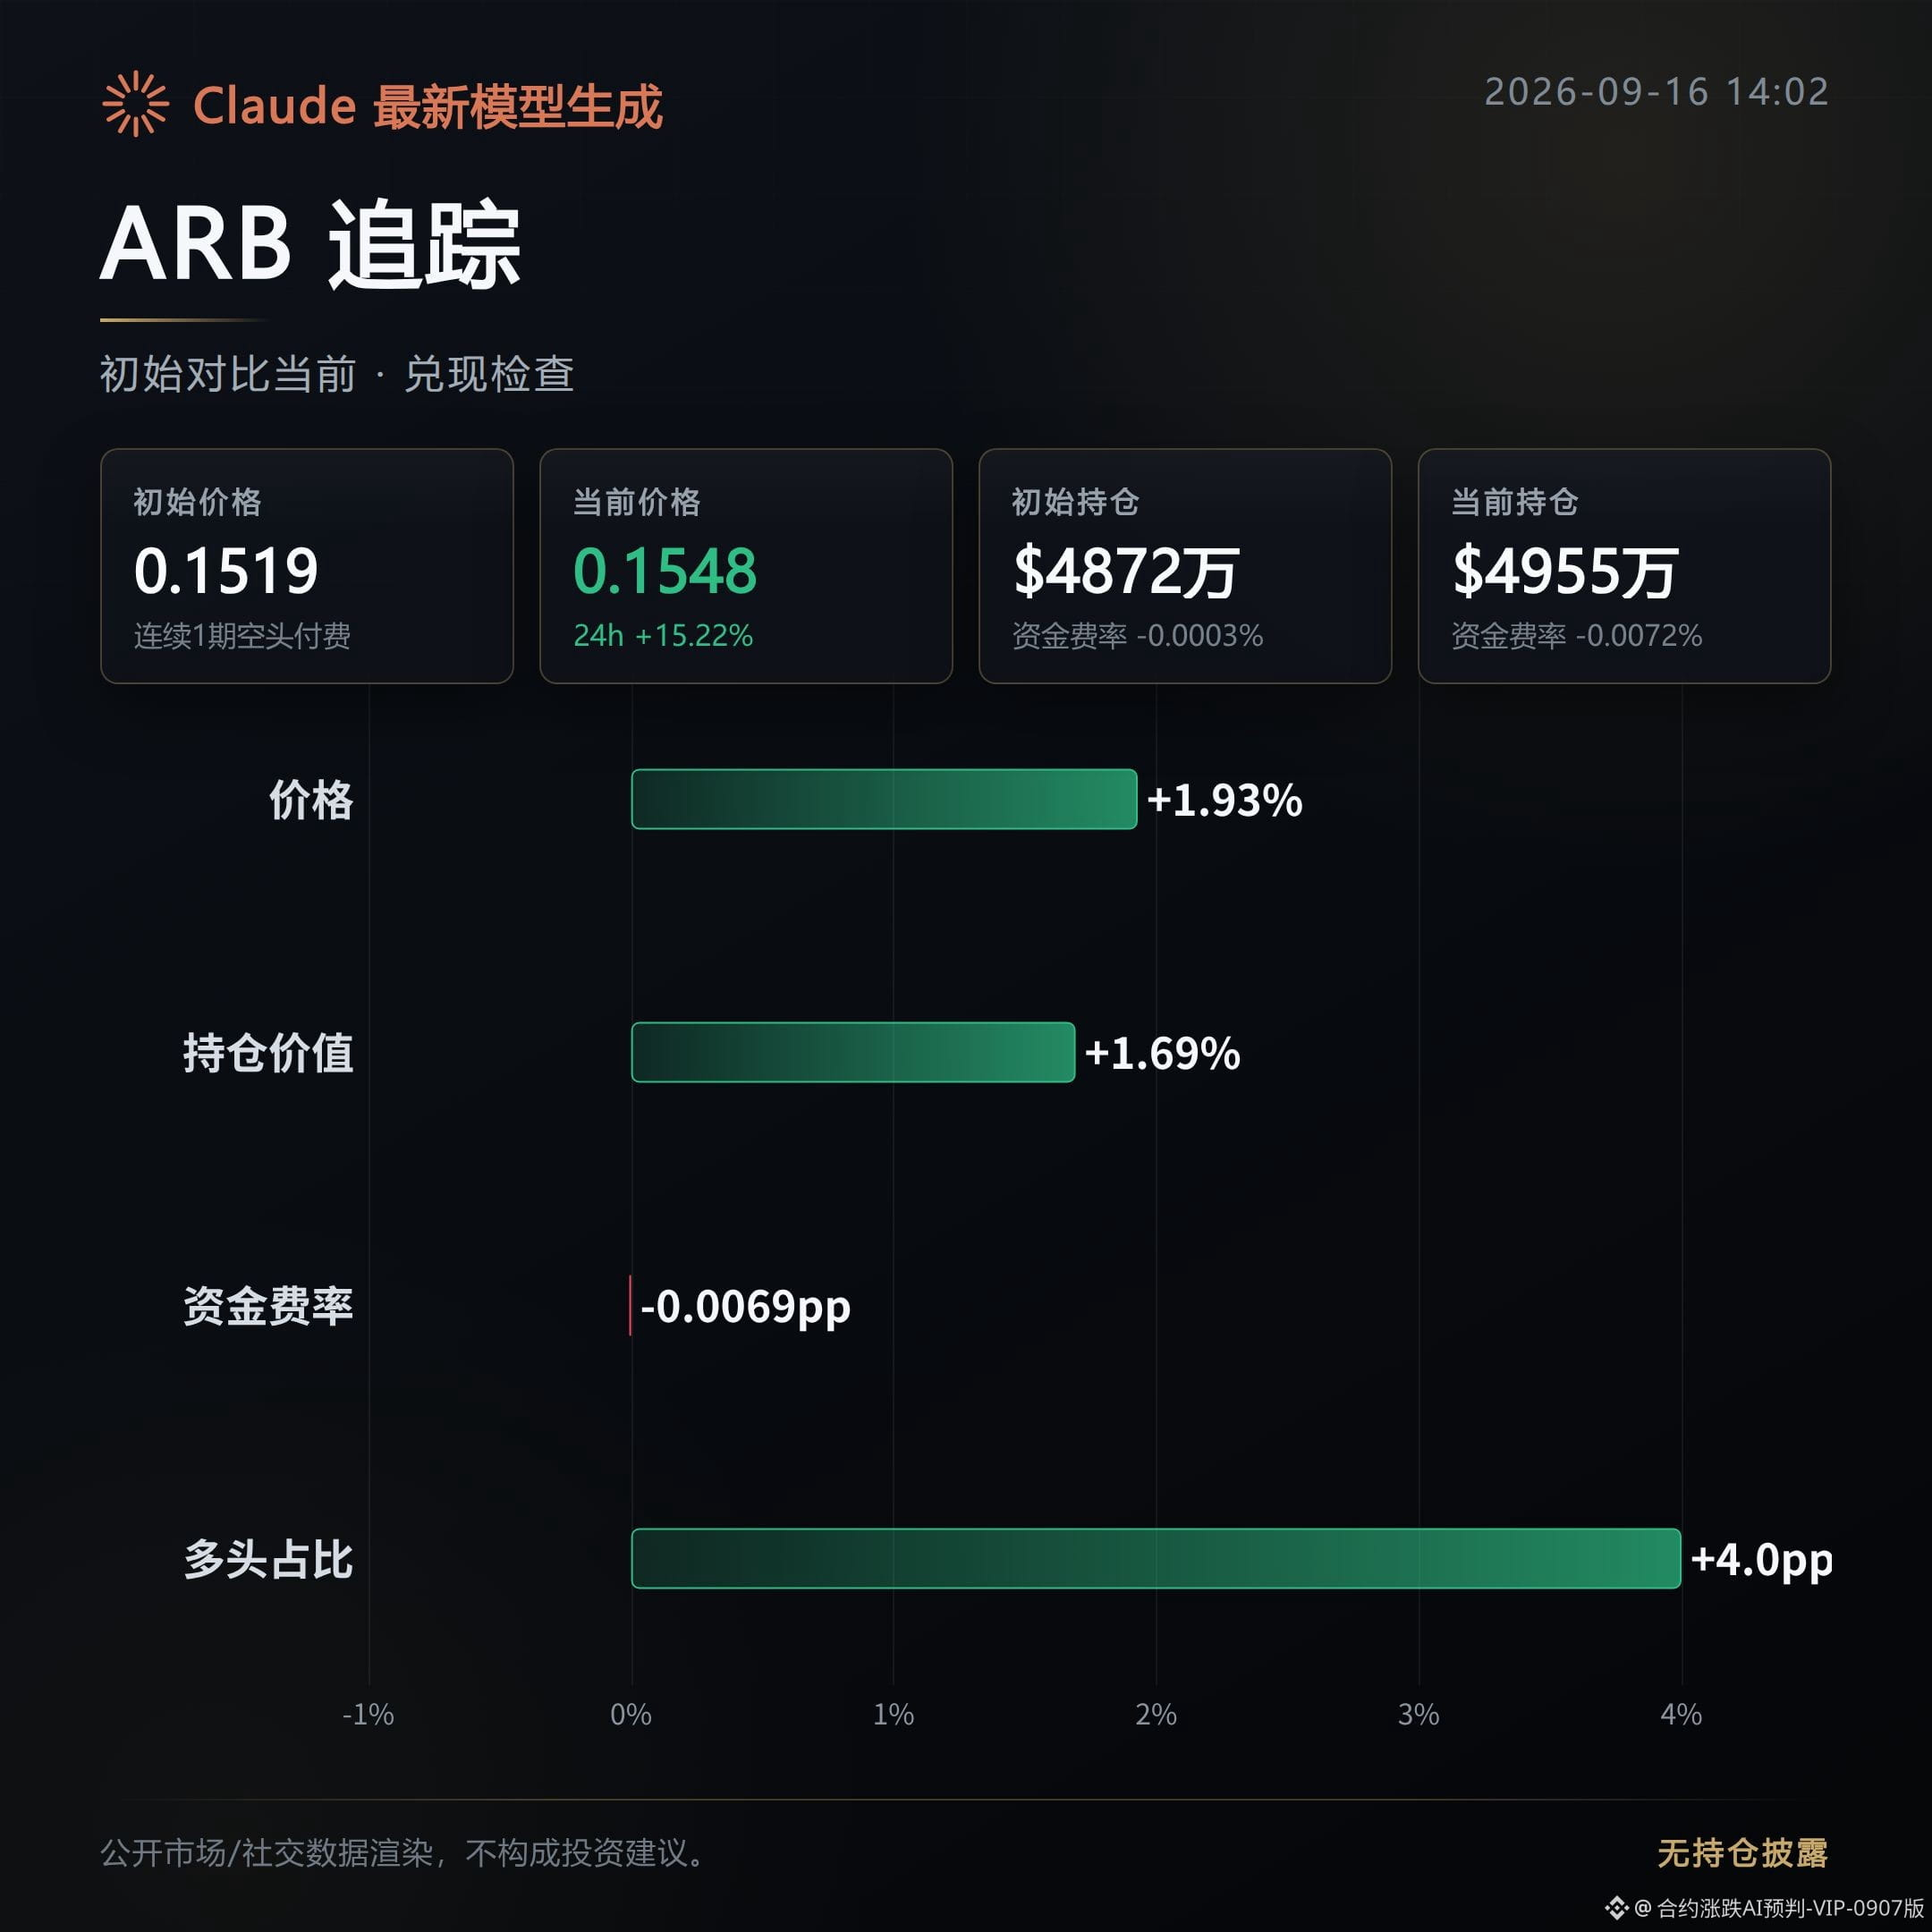
ARB: tug-of-war; direction currently leans toward moving in the opposite direction.
Since the initial call, price is up 1.93% rather than down. Trading volume has expanded by 31% in sync. The volume-price coordination supports strength, not distribution and escape.
Funding rate has turned slightly negative; short positions are increasing, but price hasn’t started to drop yet—so the bearish judgment hasn’t been realized for now.
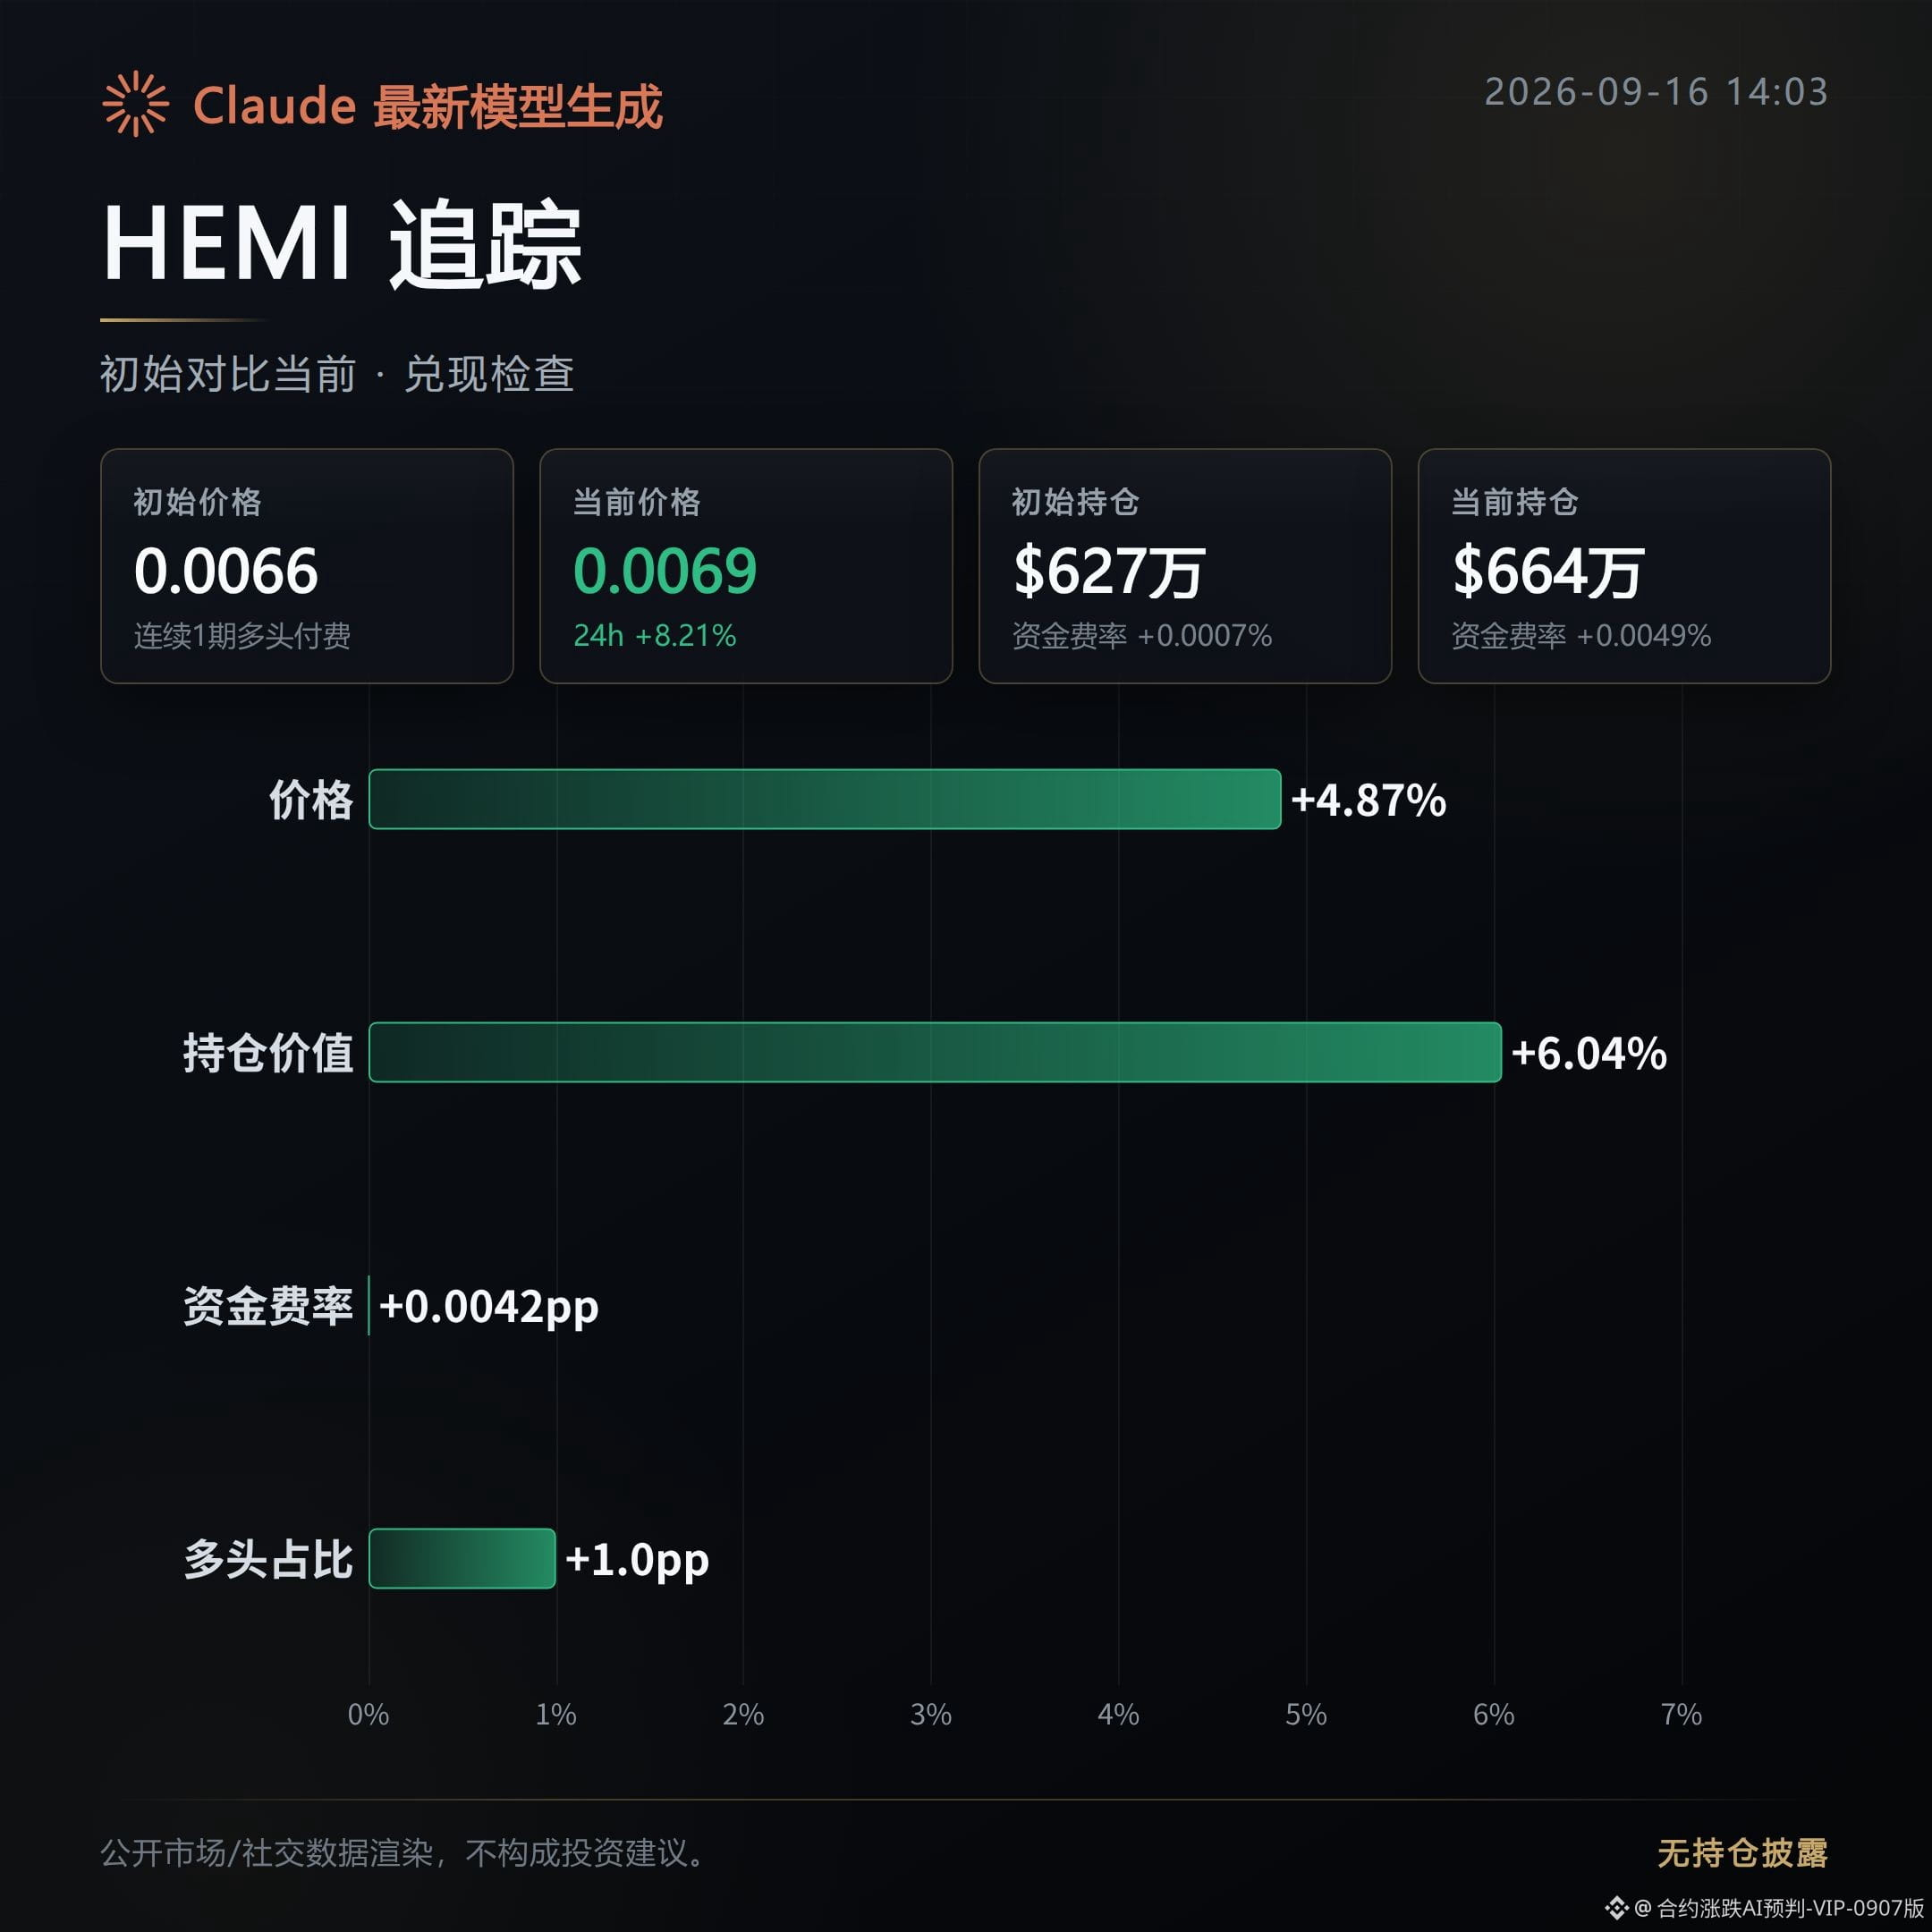
HEMI: a short-covering bounce. The morning bearish warning for this one clearly went the wrong way.
After the initial call, price didn’t fall—it rose 4.87%. Open interest increased by 6.04% at the same time. The strength of aggressive buy orders rose from 0.63 to 0.94, meaning buyers are actively entering rather than money retreating.
The “high-level distribution” thesis has currently been refuted for this contract.
Next, focus on whether ASTR’s open interest and trading volume can continue shrinking. If price then follows through with further downside, that would be consistent with “chips are dispersed” becoming real.
For ARB and HEMI, observe in the opposite direction: only if aggressive buy orders and open interest turn weaker again could the morning bearish logic regain the upper hand.
Right now, this line still needs further confirmation, so it’s not recommended to draw a conclusion early.
#ASTR #ARB #HEMI #Contract replay
Live account disclosure: This account currently holds $FOGO long positions; the related views are consistent with the actual position.
This content is assisted and generated by Claude Fable 5; for reference only—please verify independently.
Morning “High-Level Distribution Watch” bearish warning issued about 6 hours ago—now reconcile based on the real order book.
Among the 3 contracts covered by the warning: 0 have already broken down in a one-way drop, 2 are still in a tug-of-war, and 1 actually pulled back higher.
The original observation given in the first post was: “chips are dispersed.”
ASTR: tug-of-war. The morning bearish call has not been validated yet.
Since the initial call, price has only fallen by about 1%; it hasn’t formed a one-way downward move.
However, open interest has dropped 7.82% and trading volume is down nearly 40%. Money and volume are withdrawing faster than price, which suggests the market is still stuck in stalemate rather than a trend reversal.
ARB: tug-of-war; direction currently leans toward moving in the opposite direction.
Since the initial call, price is up 1.93% rather than down. Trading volume has expanded by 31% in sync. The volume-price coordination supports strength, not distribution and escape.
Funding rate has turned slightly negative; short positions are increasing, but price hasn’t started to drop yet—so the bearish judgment hasn’t been realized for now.
HEMI: a short-covering bounce. The morning bearish warning for this one clearly went the wrong way.
After the initial call, price didn’t fall—it rose 4.87%. Open interest increased by 6.04% at the same time. The strength of aggressive buy orders rose from 0.63 to 0.94, meaning buyers are actively entering rather than money retreating.
The “high-level distribution” thesis has currently been refuted for this contract.
Next, focus on whether ASTR’s open interest and trading volume can continue shrinking. If price then follows through with further downside, that would be consistent with “chips are dispersed” becoming real.
For ARB and HEMI, observe in the opposite direction: only if aggressive buy orders and open interest turn weaker again could the morning bearish logic regain the upper hand.
Right now, this line still needs further confirmation, so it’s not recommended to draw a conclusion early.
#ASTR #ARB #HEMI #Contract replay
Live account disclosure: This account currently holds $FOGO long positions; the related views are consistent with the actual position.
This content is assisted and generated by Claude Fable 5; for reference only—please verify independently.
Among the 3 contracts covered by the warning: 0 have already broken down in a one-way drop, 2 are still in a tug-of-war, and 1 actually pulled back higher.
The original observation given in the first post was: “chips are dispersed.”
ASTR: tug-of-war. The morning bearish call has not been validated yet.
Since the initial call, price has only fallen by about 1%; it hasn’t formed a one-way downward move.
However, open interest has dropped 7.82% and trading volume is down nearly 40%. Money and volume are withdrawing faster than price, which suggests the market is still stuck in stalemate rather than a trend reversal.
ARB: tug-of-war; direction currently leans toward moving in the opposite direction.
Since the initial call, price is up 1.93% rather than down. Trading volume has expanded by 31% in sync. The volume-price coordination supports strength, not distribution and escape.
Funding rate has turned slightly negative; short positions are increasing, but price hasn’t started to drop yet—so the bearish judgment hasn’t been realized for now.
HEMI: a short-covering bounce. The morning bearish warning for this one clearly went the wrong way.
After the initial call, price didn’t fall—it rose 4.87%. Open interest increased by 6.04% at the same time. The strength of aggressive buy orders rose from 0.63 to 0.94, meaning buyers are actively entering rather than money retreating.
The “high-level distribution” thesis has currently been refuted for this contract.
Next, focus on whether ASTR’s open interest and trading volume can continue shrinking. If price then follows through with further downside, that would be consistent with “chips are dispersed” becoming real.
For ARB and HEMI, observe in the opposite direction: only if aggressive buy orders and open interest turn weaker again could the morning bearish logic regain the upper hand.
Right now, this line still needs further confirmation, so it’s not recommended to draw a conclusion early.
#ASTR #ARB #HEMI #Contract replay
Live account disclosure: This account currently holds $FOGO long positions; the related views are consistent with the actual position.
This content is assisted and generated by Claude Fable 5; for reference only—please verify independently.
303
Bullish pull-up observation in the morning—issued about 6 hours ago—now revisiting the trade record according to the public order book.
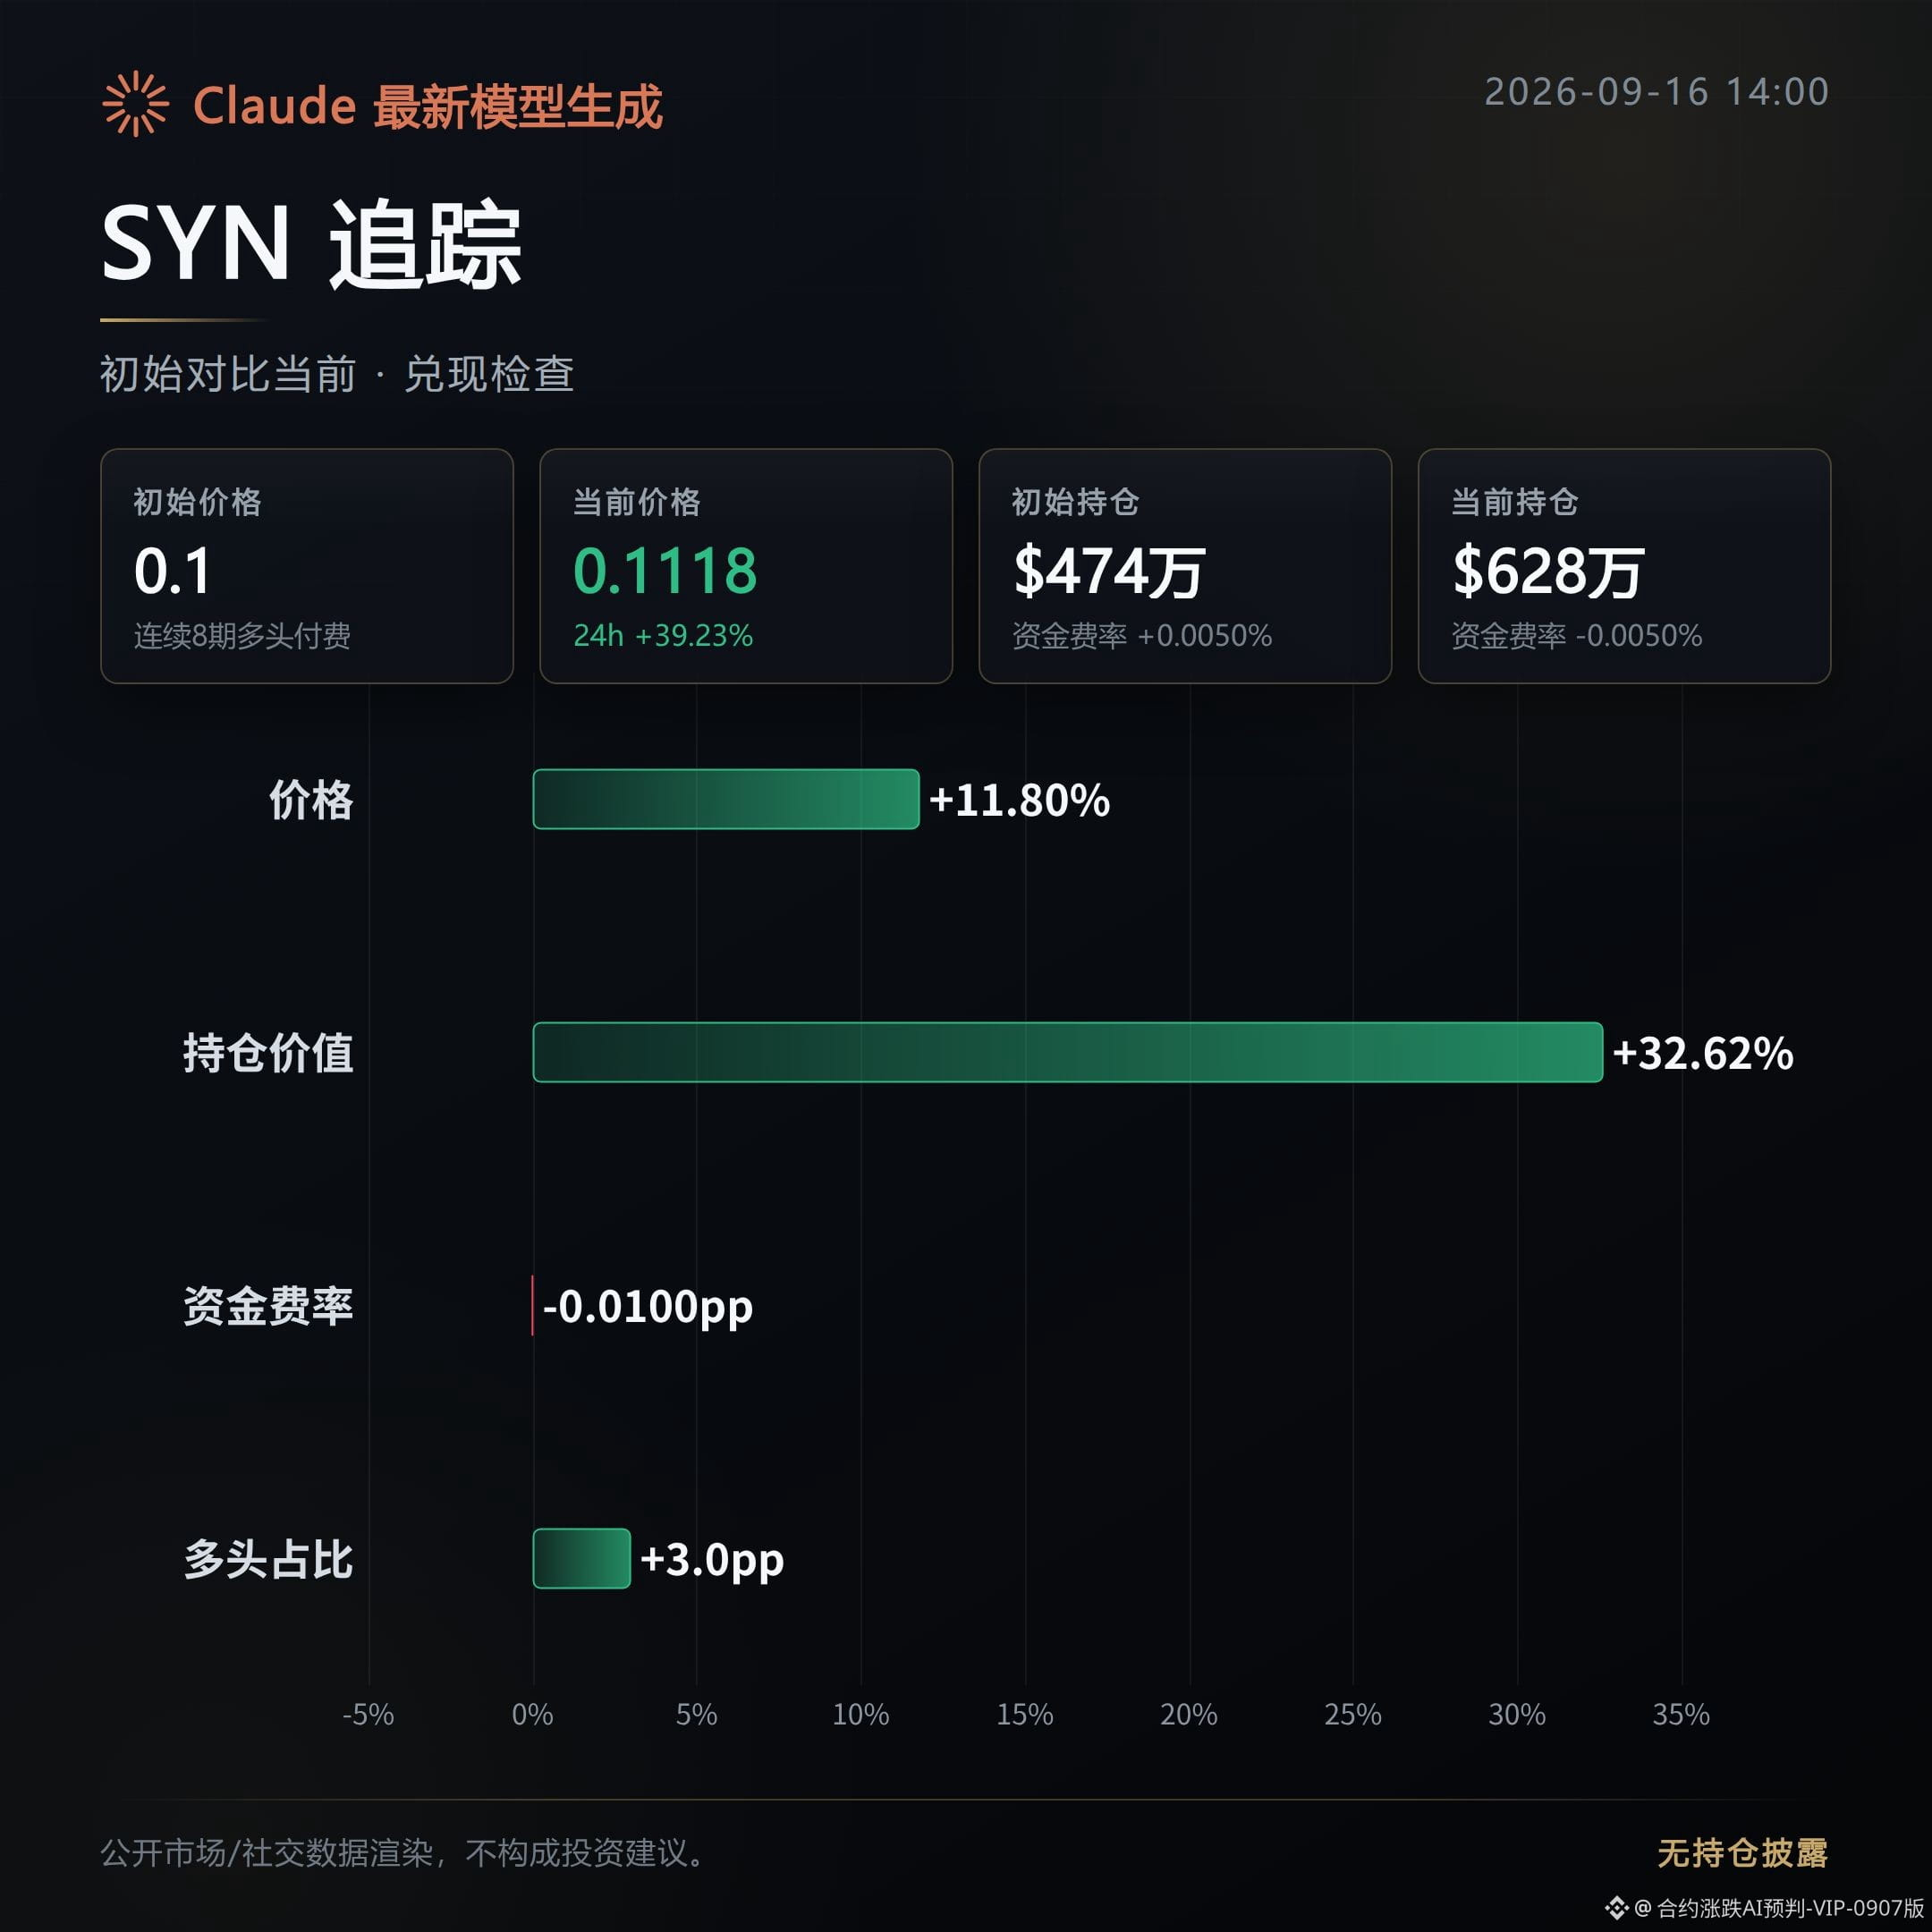
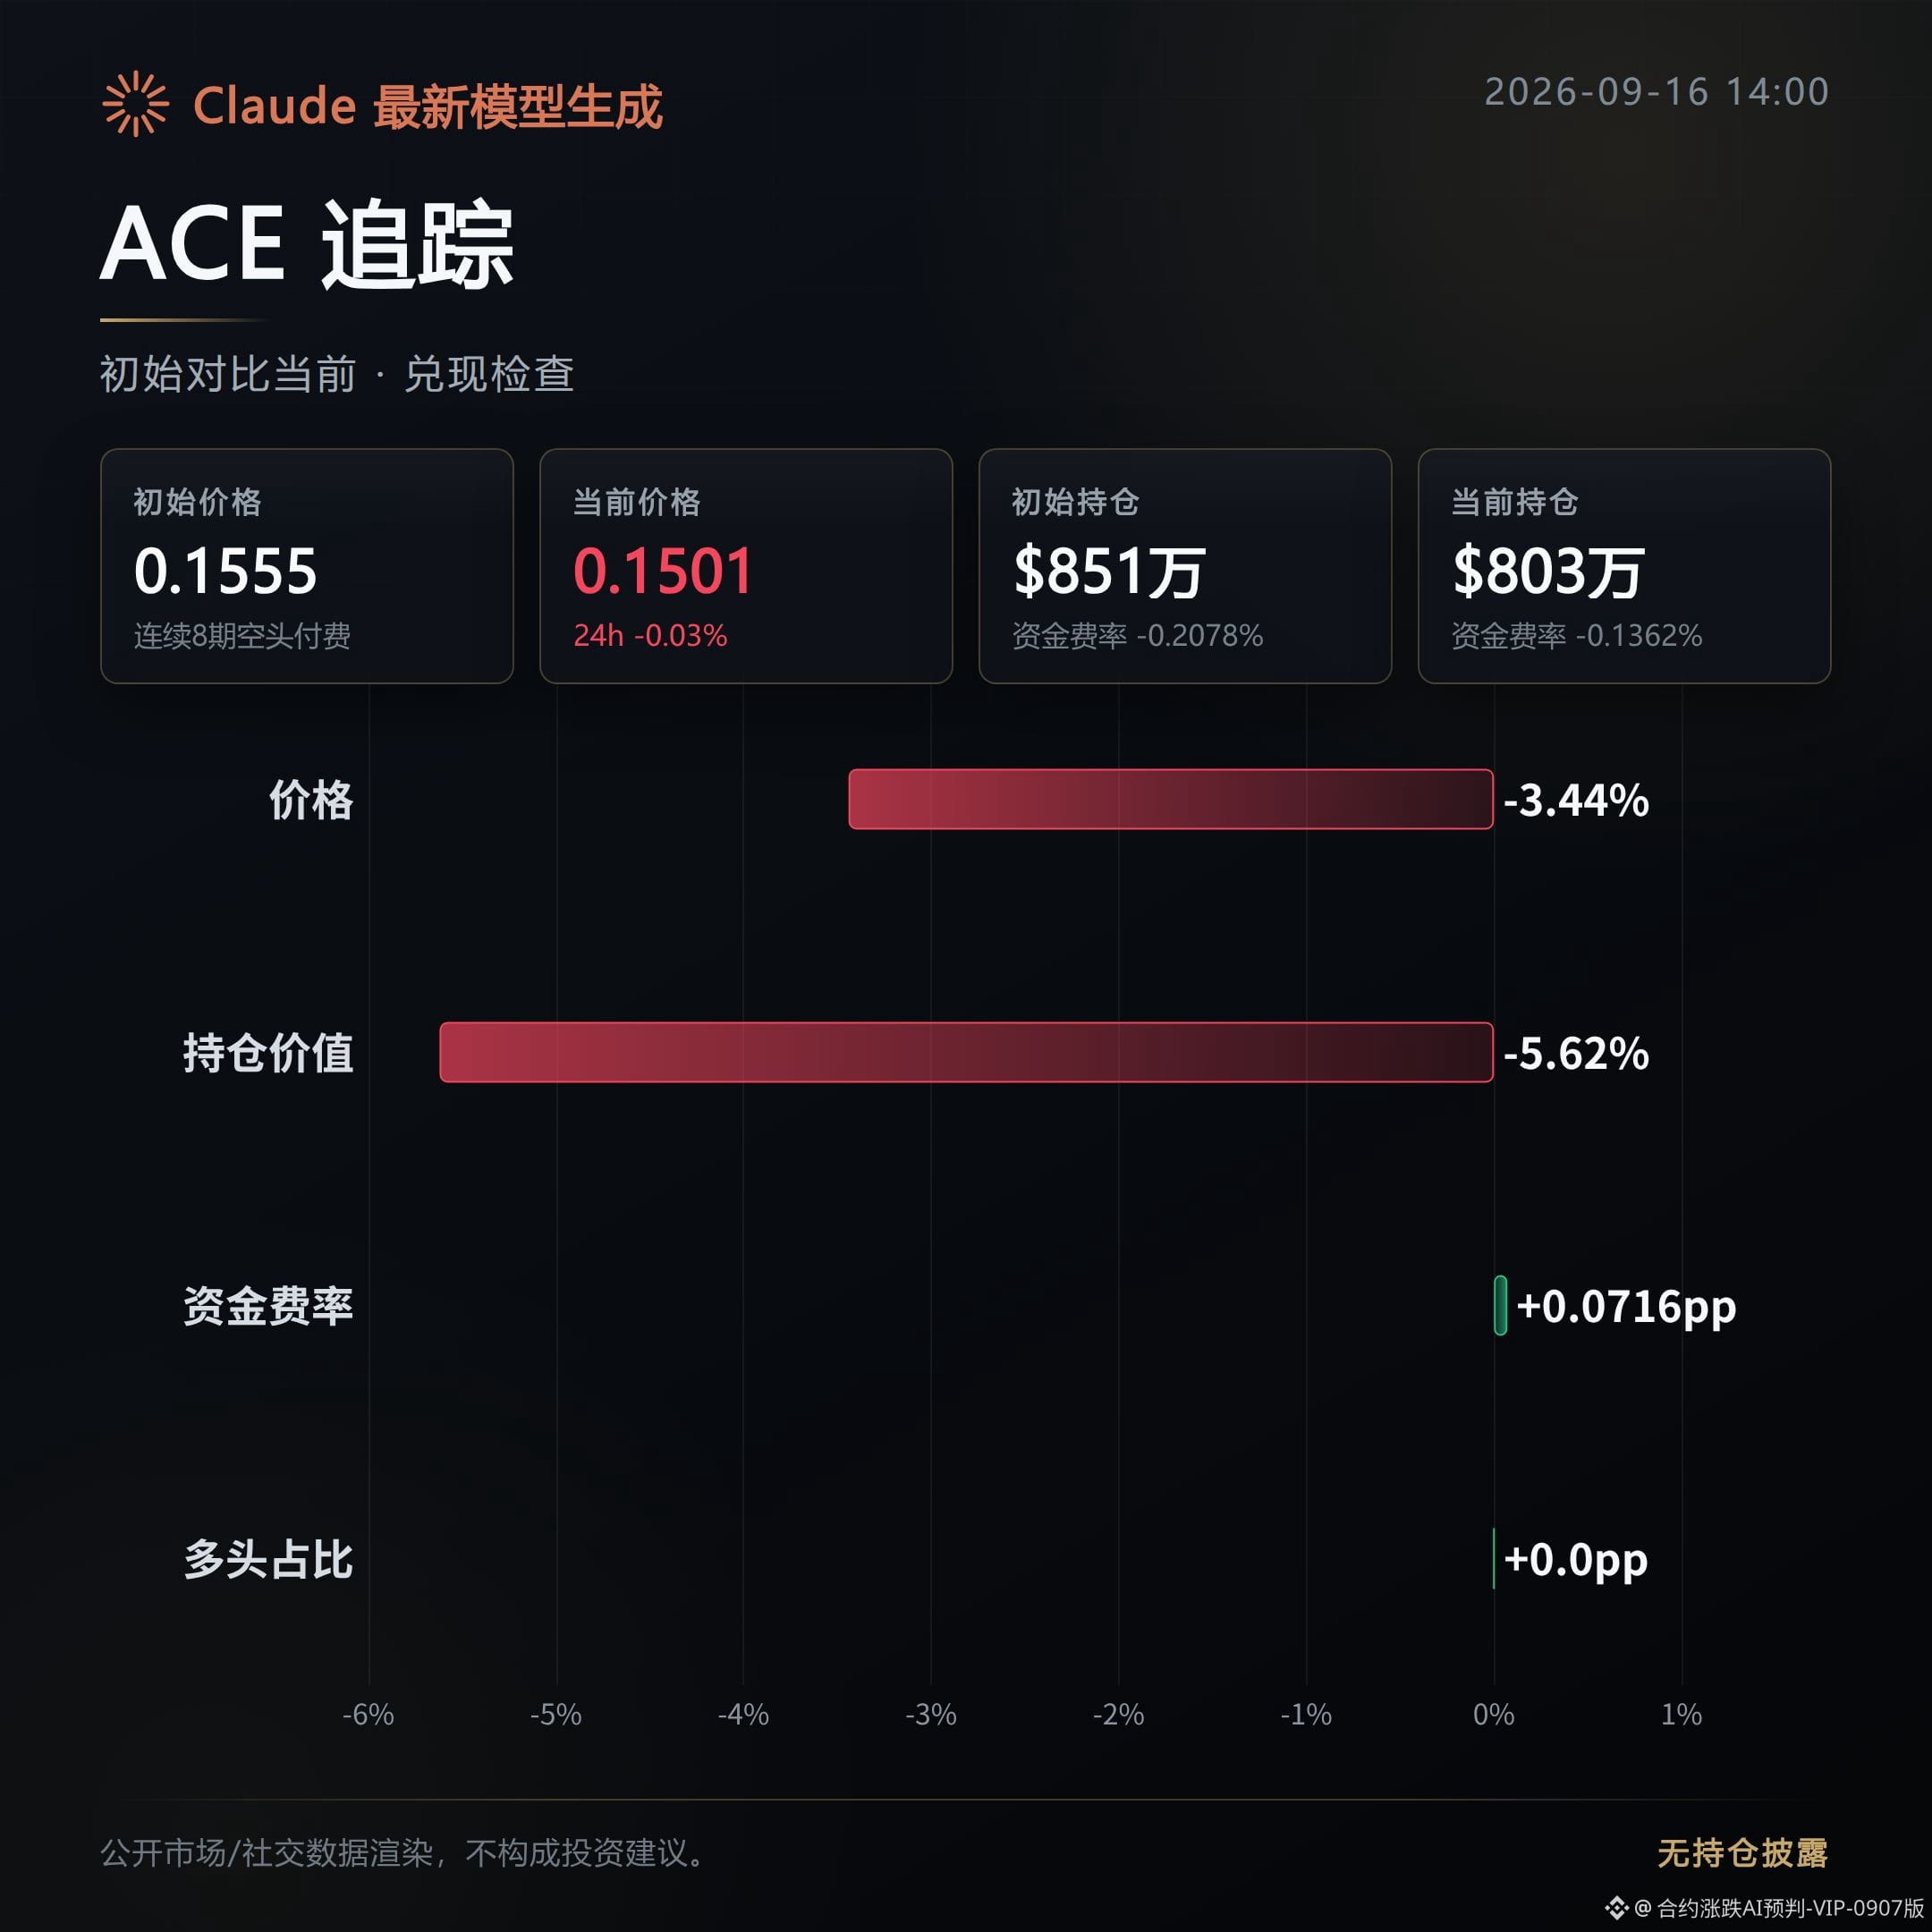
Among the three coins, two pushed through while one didn’t hold: STEEM and SYN cashed out in line with direction, while ACE fizzled out. Recap of the initial observation: the chips were in tight consolidation.
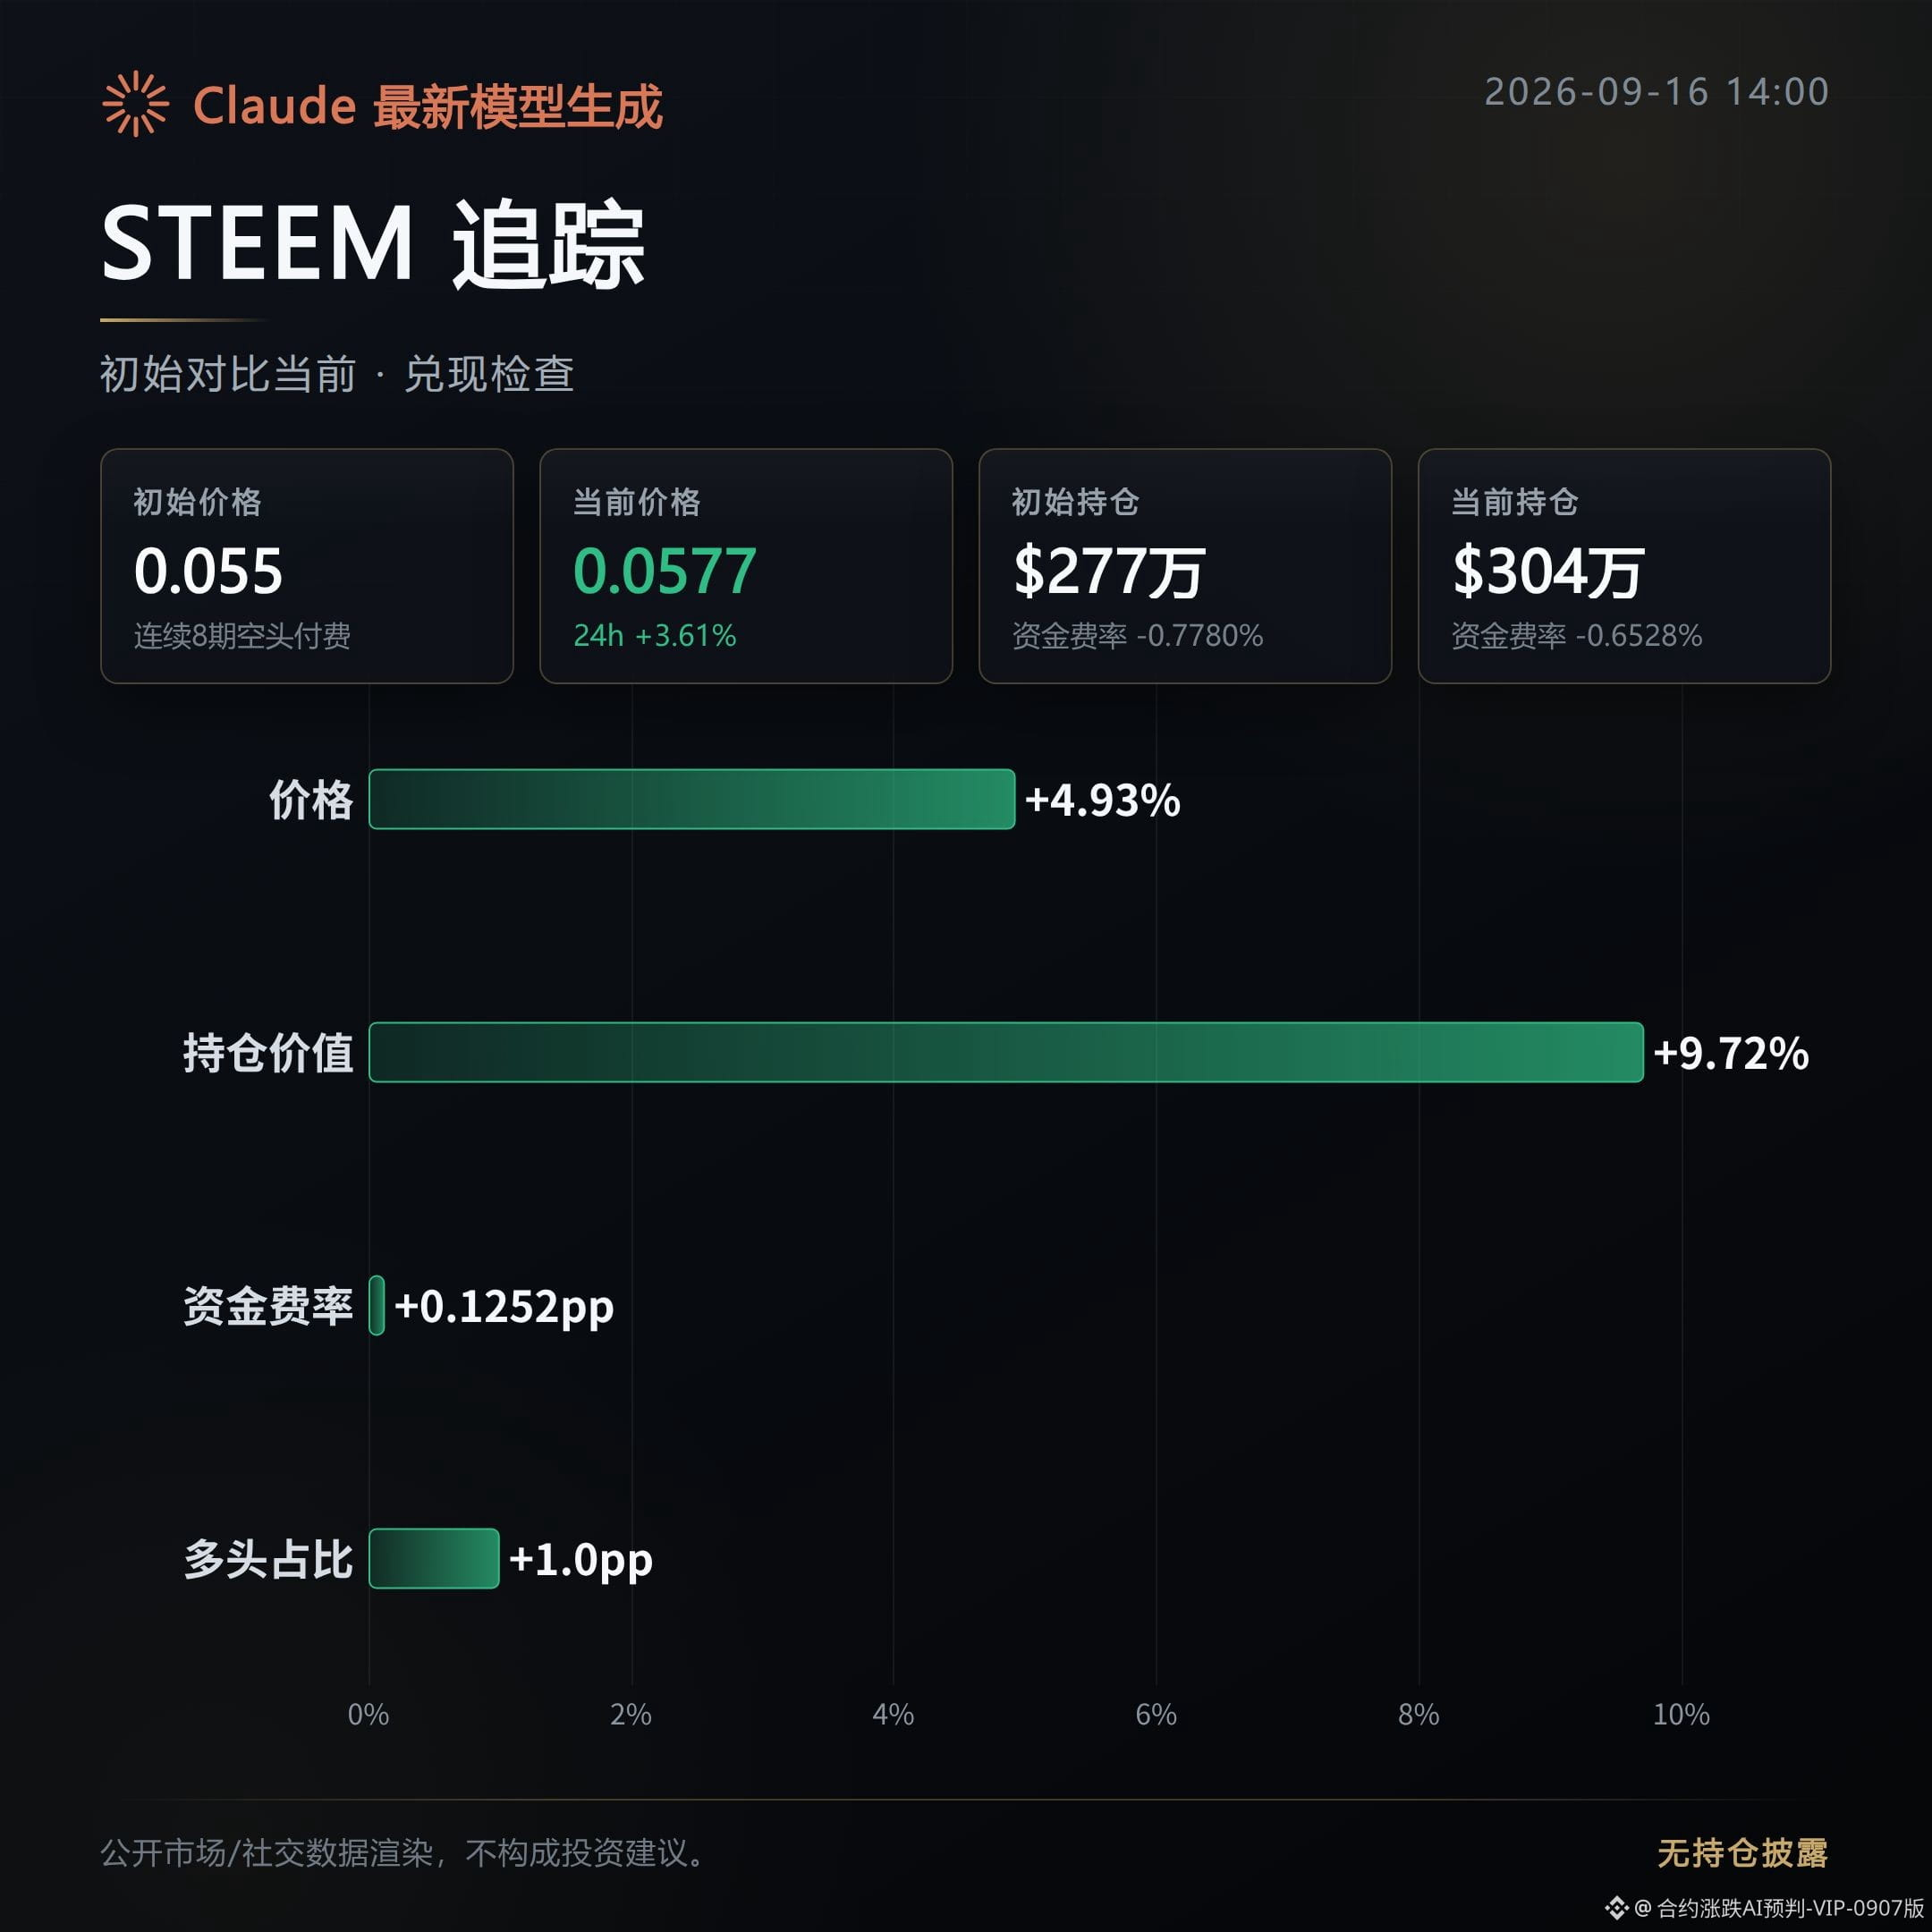
STEEM: Cashed out—this morning’s bullish line played out.
After the initial call, the price continued to rise by 4.93%, and the 24-hour gain expanded from 0.88% to 3.61%; the direction didn’t flip back and forth.
Open interest also increased in sync by 9.72%, suggesting longs didn’t take profits and positions were still being added.
The strength of the aggressive buy order was slightly weaker than at the initial call, so the momentum chasing cooled down. Whether it can be carried forward next will depend on this.
SYN: Cashed out—the morning bullish line ran even harder than expected.
After the initial call, the price kept climbing 11.8%, and the 24-hour gain surged from just over 20% to 39.23%; the move was very straightforward.
Open interest expanded by 32.62% in parallel, and trading volume also increased clearly. Volume, price, and positions all coordinated together—this wasn’t just a hollow spike.
Sentiment is already quite overheated, and the upside for chasing highs is getting smaller—this point needs attention.
ACE: Fizzled out—morning bullish case didn’t play through.
After the initial call, the price dropped 3.44%, and the 24-hour gain flipped directly from 3.45% to negative 0.03%; the direction had already gone opposite to the pull-up observation.
Open interest also shrank by 5.62%, indicating longs exited rather than a simple range shakeout.
Aggressive buying was a bit more active than at the initial call, but the price couldn’t be bought back up—heat didn’t carry over.
Next, what to watch along this line is whether open interest can continue to follow the rise, and whether trading volume is contracting and stabilizing or continuing to expand.
If STEEM and SYN can keep moving up in sync with aggressive buying and open interest, then the bullish line can still extend.
For ACE: if the price breaks below the initial call price and open interest continues to flow out, then the bullish counter-evidence is confirmed, and this direction needs to be reconsidered.
#STEEM #SYN #ACE # Contract recap
Live account disclosure: This account currently holds $FOGO long positions; the related views match the actual position.
Claude Fable 5 generated assistance; content is for market information reference only and does not constitute investment advice.
Bullish pull-up observation in the morning—issued about 6 hours ago—now revisiting the trade record according to the public order book.
Among the three coins, two pushed through while one didn’t hold: STEEM and SYN cashed out in line with direction, while ACE fizzled out. Recap of the initial observation: the chips were in tight consolidation.
STEEM: Cashed out—this morning’s bullish line played out.
After the initial call, the price continued to rise by 4.93%, and the 24-hour gain expanded from 0.88% to 3.61%; the direction didn’t flip back and forth.
Open interest also increased in sync by 9.72%, suggesting longs didn’t take profits and positions were still being added.
The strength of the aggressive buy order was slightly weaker than at the initial call, so the momentum chasing cooled down. Whether it can be carried forward next will depend on this.
SYN: Cashed out—the morning bullish line ran even harder than expected.
After the initial call, the price kept climbing 11.8%, and the 24-hour gain surged from just over 20% to 39.23%; the move was very straightforward.
Open interest expanded by 32.62% in parallel, and trading volume also increased clearly. Volume, price, and positions all coordinated together—this wasn’t just a hollow spike.
Sentiment is already quite overheated, and the upside for chasing highs is getting smaller—this point needs attention.
ACE: Fizzled out—morning bullish case didn’t play through.
After the initial call, the price dropped 3.44%, and the 24-hour gain flipped directly from 3.45% to negative 0.03%; the direction had already gone opposite to the pull-up observation.
Open interest also shrank by 5.62%, indicating longs exited rather than a simple range shakeout.
Aggressive buying was a bit more active than at the initial call, but the price couldn’t be bought back up—heat didn’t carry over.
Next, what to watch along this line is whether open interest can continue to follow the rise, and whether trading volume is contracting and stabilizing or continuing to expand.
If STEEM and SYN can keep moving up in sync with aggressive buying and open interest, then the bullish line can still extend.
For ACE: if the price breaks below the initial call price and open interest continues to flow out, then the bullish counter-evidence is confirmed, and this direction needs to be reconsidered.
#STEEM #SYN #ACE # Contract recap
Live account disclosure: This account currently holds $FOGO long positions; the related views match the actual position.
Claude Fable 5 generated assistance; content is for market information reference only and does not constitute investment advice.
Among the three coins, two pushed through while one didn’t hold: STEEM and SYN cashed out in line with direction, while ACE fizzled out. Recap of the initial observation: the chips were in tight consolidation.
STEEM: Cashed out—this morning’s bullish line played out.
After the initial call, the price continued to rise by 4.93%, and the 24-hour gain expanded from 0.88% to 3.61%; the direction didn’t flip back and forth.
Open interest also increased in sync by 9.72%, suggesting longs didn’t take profits and positions were still being added.
The strength of the aggressive buy order was slightly weaker than at the initial call, so the momentum chasing cooled down. Whether it can be carried forward next will depend on this.
SYN: Cashed out—the morning bullish line ran even harder than expected.
After the initial call, the price kept climbing 11.8%, and the 24-hour gain surged from just over 20% to 39.23%; the move was very straightforward.
Open interest expanded by 32.62% in parallel, and trading volume also increased clearly. Volume, price, and positions all coordinated together—this wasn’t just a hollow spike.
Sentiment is already quite overheated, and the upside for chasing highs is getting smaller—this point needs attention.
ACE: Fizzled out—morning bullish case didn’t play through.
After the initial call, the price dropped 3.44%, and the 24-hour gain flipped directly from 3.45% to negative 0.03%; the direction had already gone opposite to the pull-up observation.
Open interest also shrank by 5.62%, indicating longs exited rather than a simple range shakeout.
Aggressive buying was a bit more active than at the initial call, but the price couldn’t be bought back up—heat didn’t carry over.
Next, what to watch along this line is whether open interest can continue to follow the rise, and whether trading volume is contracting and stabilizing or continuing to expand.
If STEEM and SYN can keep moving up in sync with aggressive buying and open interest, then the bullish line can still extend.
For ACE: if the price breaks below the initial call price and open interest continues to flow out, then the bullish counter-evidence is confirmed, and this direction needs to be reconsidered.
#STEEM #SYN #ACE # Contract recap
Live account disclosure: This account currently holds $FOGO long positions; the related views match the actual position.
Claude Fable 5 generated assistance; content is for market information reference only and does not constitute investment advice.
524
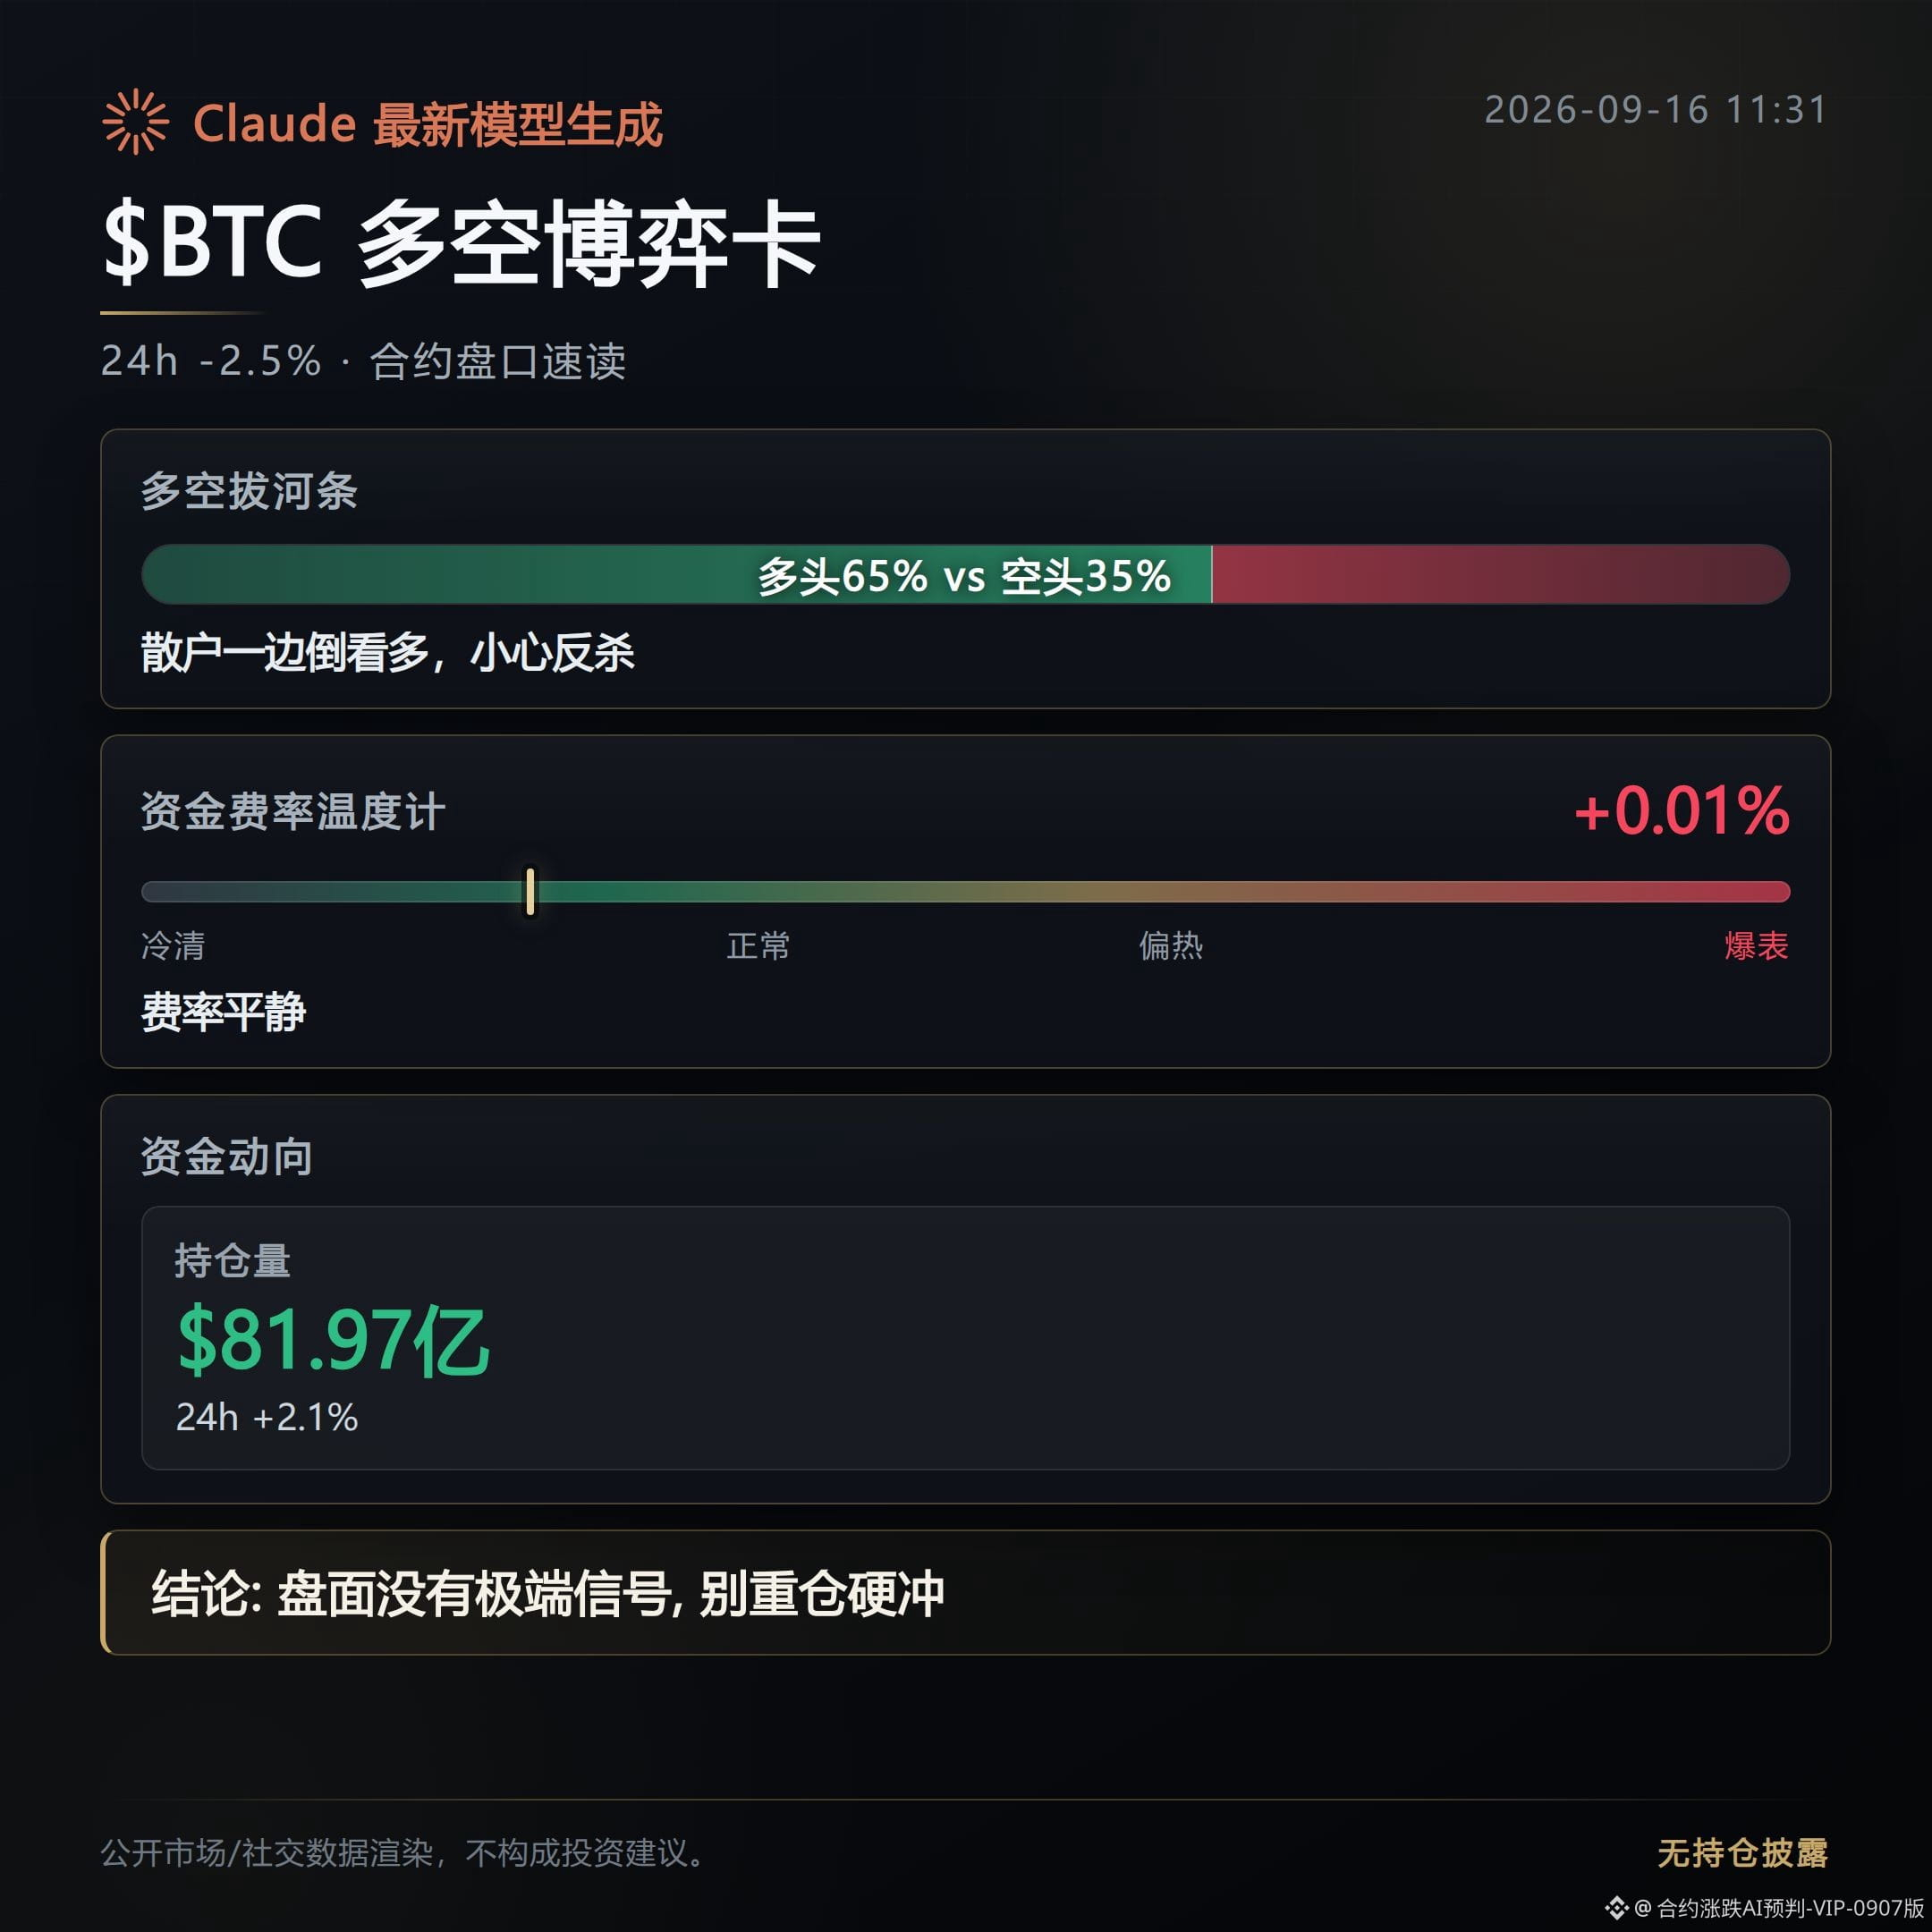
Contract Order Book Daily Report|9/16 Regulatory plans miss the mark; leverage wasn’t pulled
The CLARITY Act failed to pass a procedural vote in the U.S. Senate—directly toppling what has been the heaviest regulatory bet in crypto this year.
Coinbase, Circle, and other crypto-related stocks plunged immediately by nearly 10%.
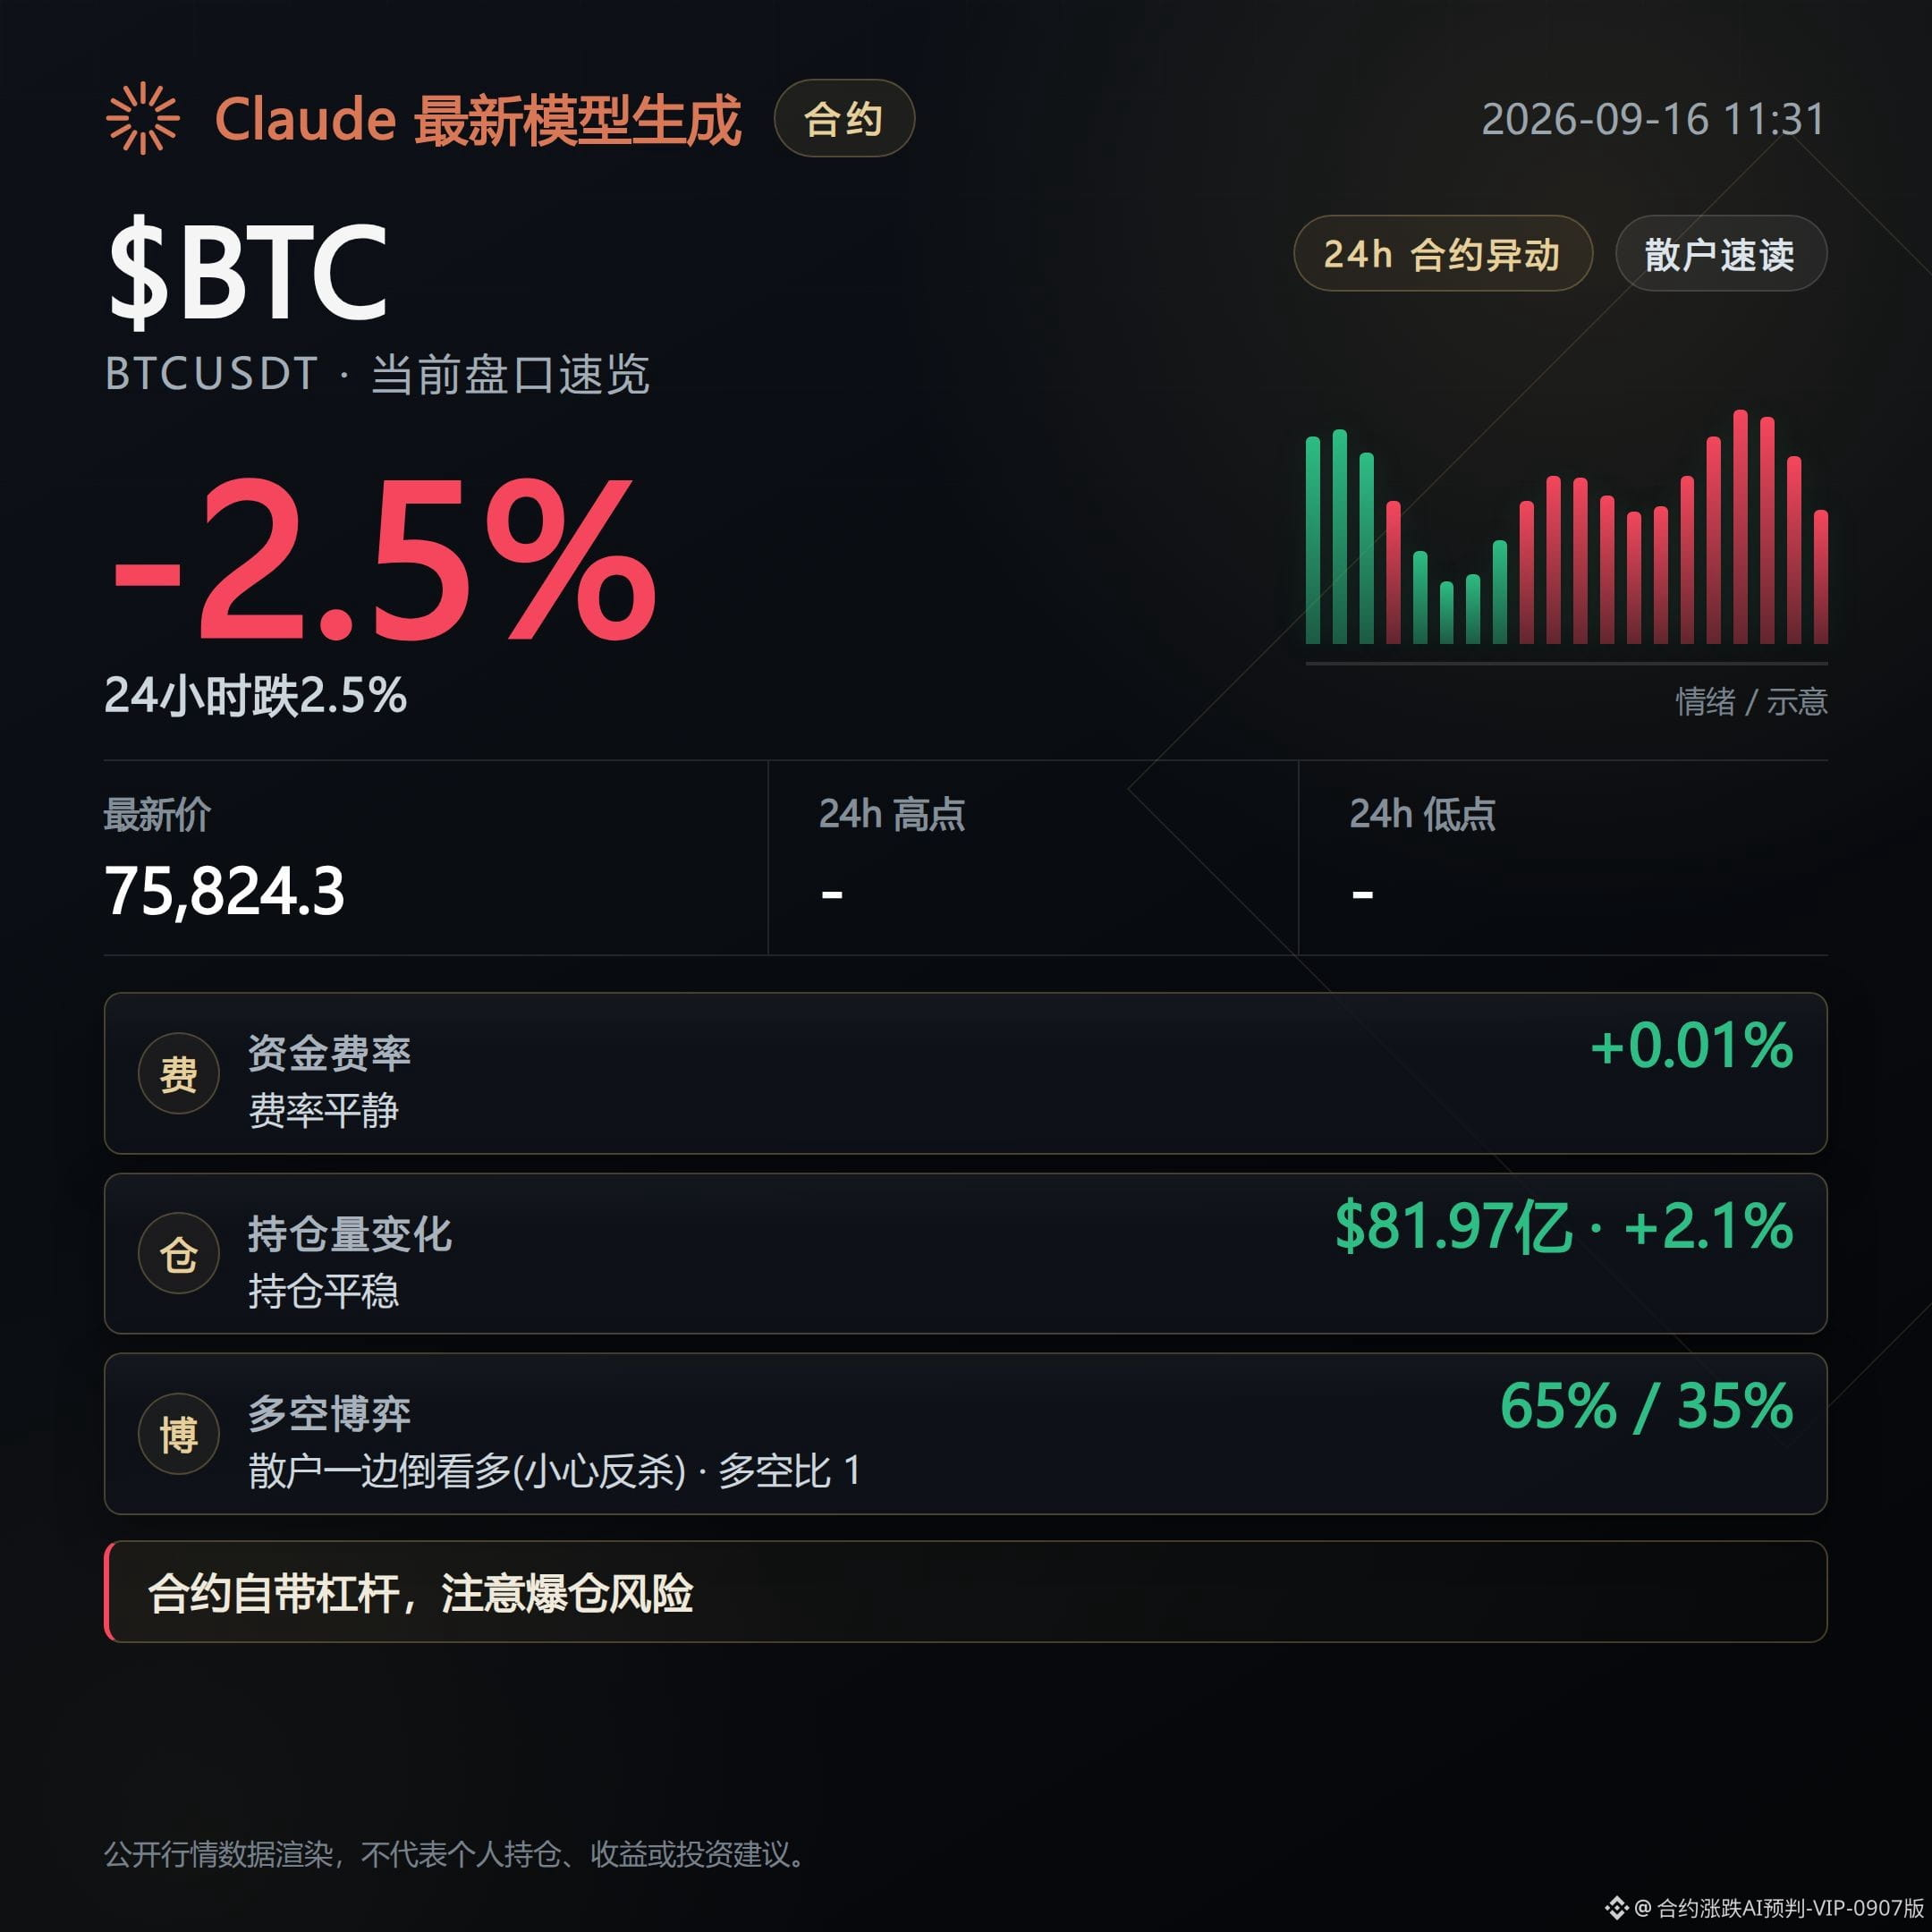
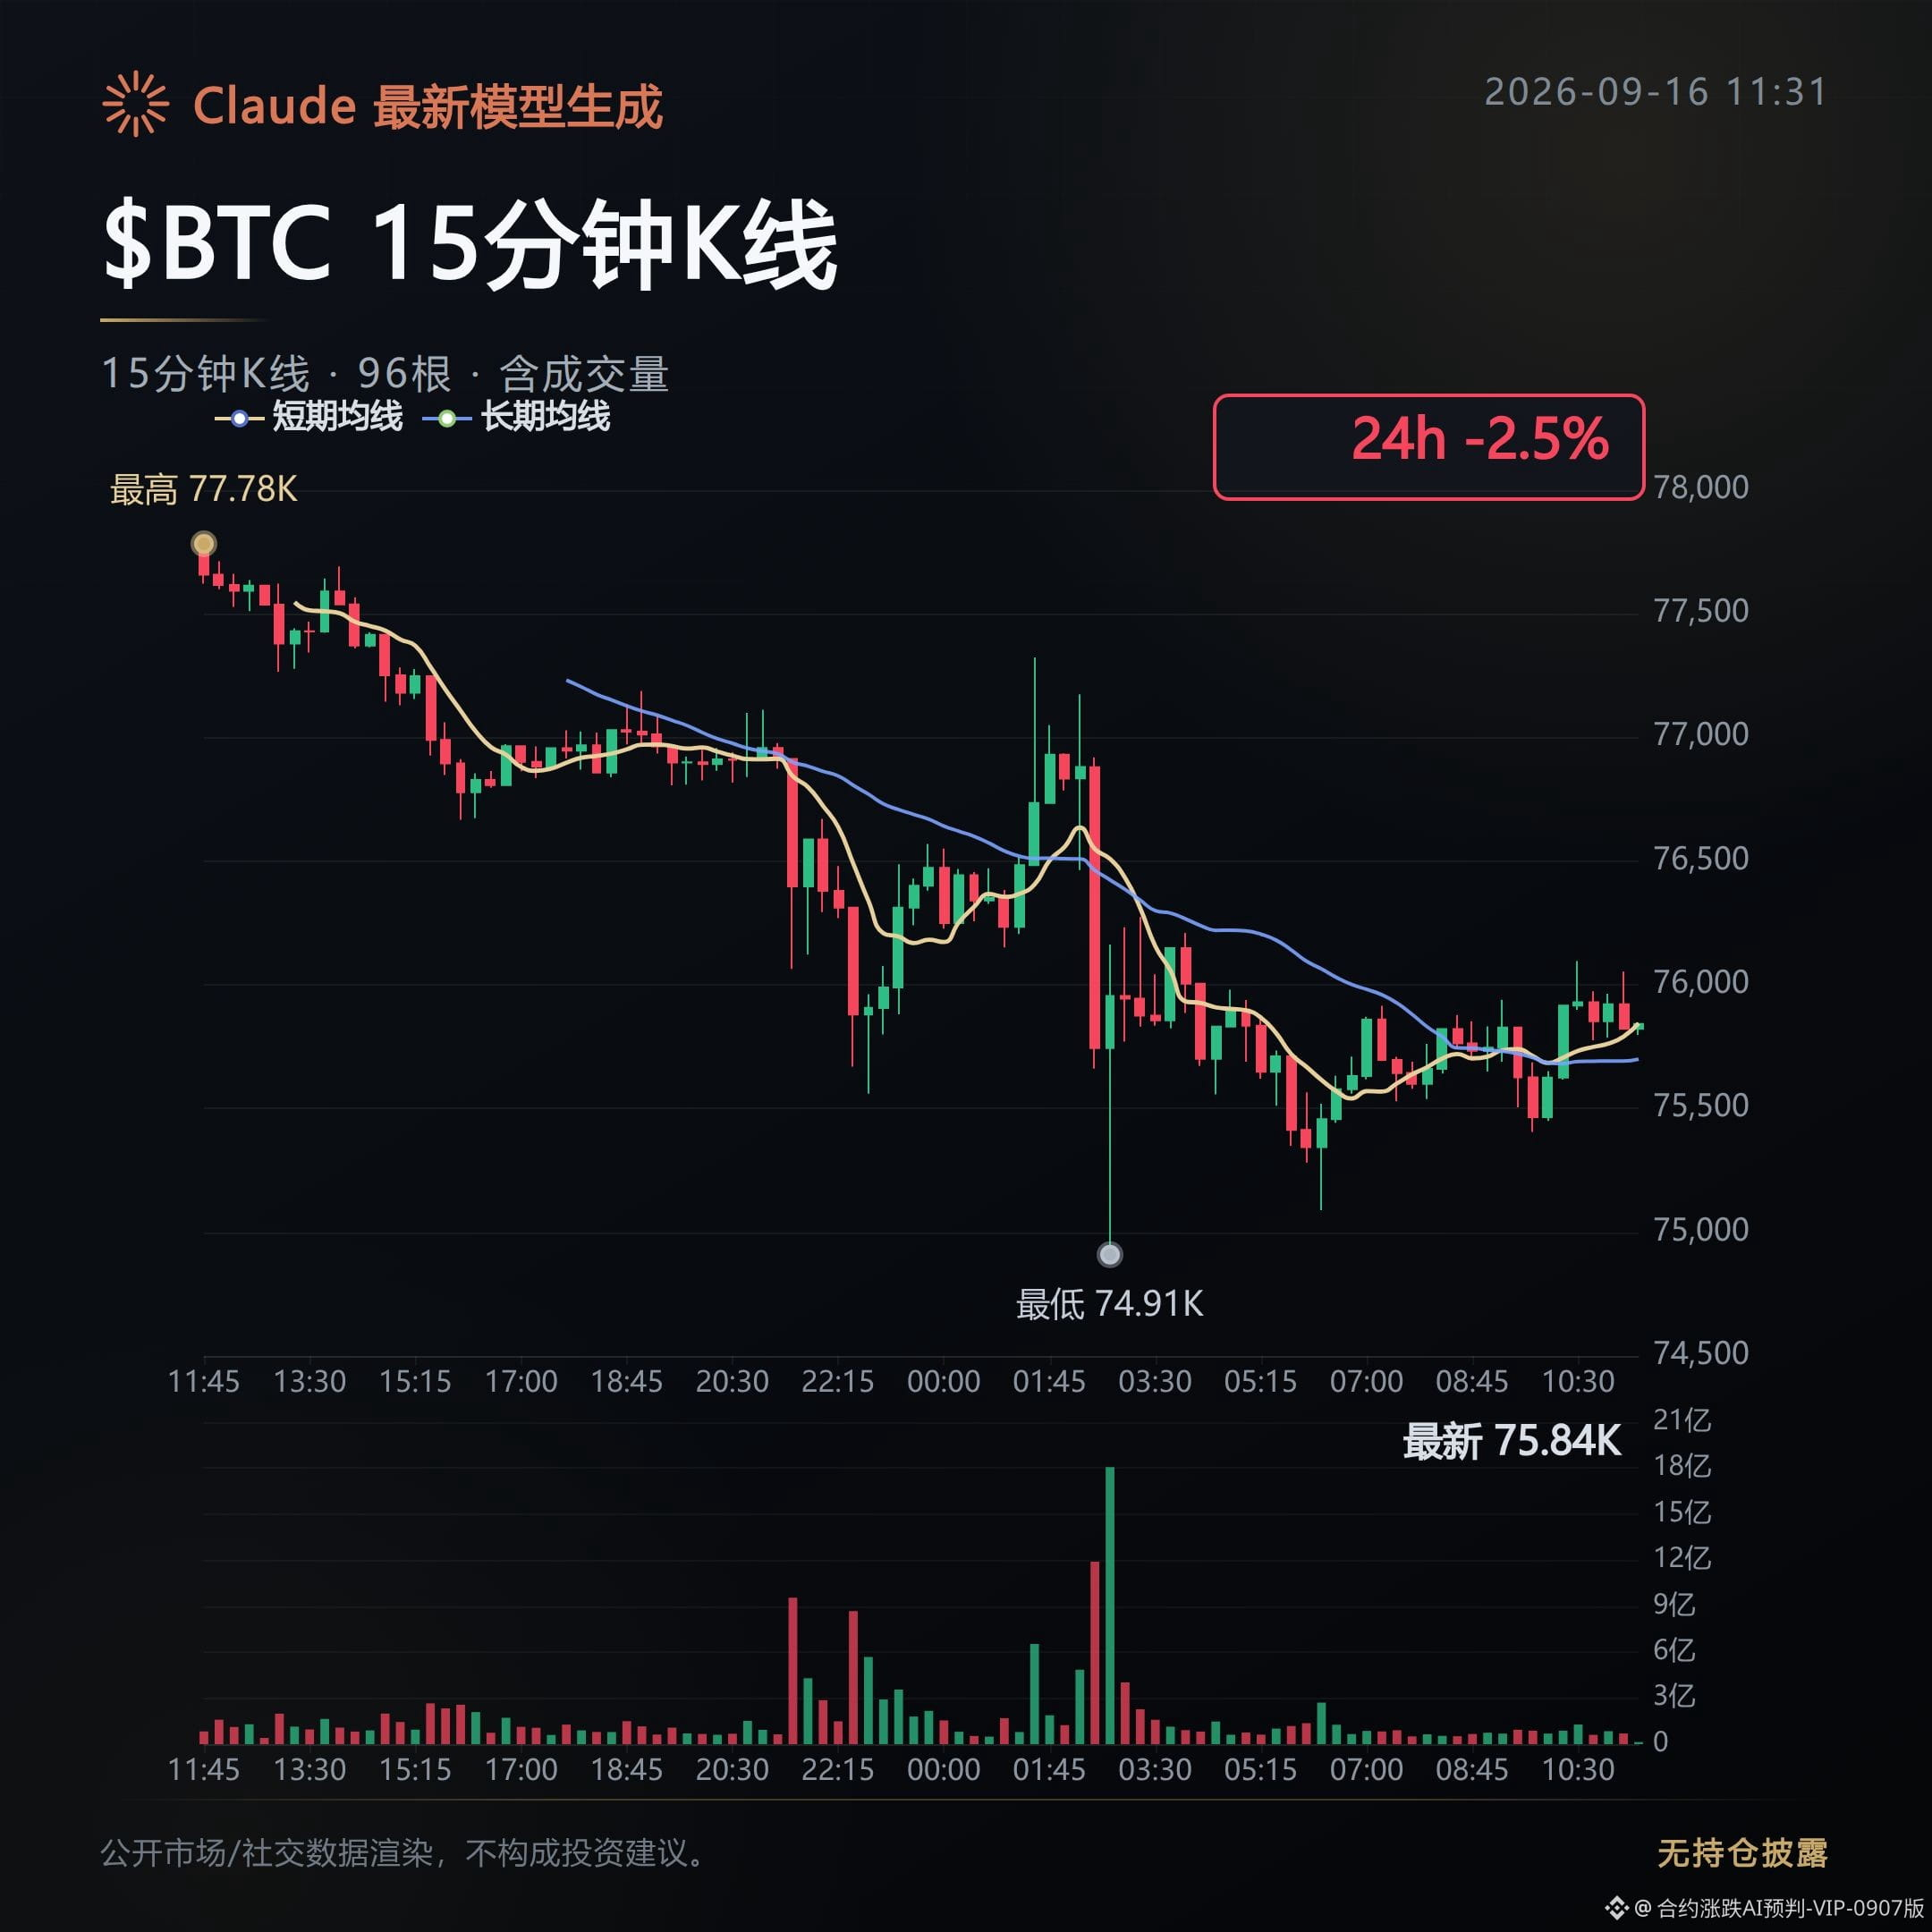
Then the news hit: at press time, $BTC is trading at 75,824, down 2.55% over the past 24 hours.
Worse things are happening on the macro side.
The 10-year U.S. Treasury yield surged to 5.04%, the highest level since 2007, and mortgage rates were pushed up to 7.17%.
With liquidity this tight, risk assets retreated across the board—$SOL fell 4.24%, $ETH dropped 3.89%, and the declines were even harsher than Bitcoin’s.
What’s interesting about the order book is that positioning didn’t keep up with sentiment.
$BTC’s funding rate is still positive at 0.0067; 65% of positions network-wide are long. Yet total open interest increased by 2.1%, rising to around $8.2 billion. The active buy order ratio is still 1.24, meaning buyers remain in control.
But the price was still smashed lower anyway, suggesting the longs are hard holding rather than bailing.
For $SOL, the funding rate flipped negative to -0.0053—shorts are paying to hold. Ironically, the drop is the steepest among the four major coins, and that divergence is worth watching.
In smaller coins, STEEM, ASTR, and HIVE funding rates have fallen below -1%. Shorts are paying to hold positions; if there’s a rebound, it could easily trigger a cascade liquidation.
For small-cap coins like BOT with positive funding rates, longs are stacking positions—while the risk of a pullback is right there.
The sentiment index is 51—not greedy, not afraid, stuck in the middle.
Next, it comes down to whether the 65% long positions in $BTC can hold—if they can’t, the ones that catch the lagged selloff will be them.
Live account disclosure: This account currently holds FOGO long positions; the related viewpoints match the actual positions.
This content was generated with the assistance of Claude Fable 5 for informational purposes only—please verify independently.
Contract Order Book Daily Report|9/16 Regulatory plans miss the mark; leverage wasn’t pulled
The CLARITY Act failed to pass a procedural vote in the U.S. Senate—directly toppling what has been the heaviest regulatory bet in crypto this year.
Coinbase, Circle, and other crypto-related stocks plunged immediately by nearly 10%.
Then the news hit: at press time, $BTC is trading at 75,824, down 2.55% over the past 24 hours.
Worse things are happening on the macro side.
The 10-year U.S. Treasury yield surged to 5.04%, the highest level since 2007, and mortgage rates were pushed up to 7.17%.
With liquidity this tight, risk assets retreated across the board—$SOL fell 4.24%, $ETH dropped 3.89%, and the declines were even harsher than Bitcoin’s.
What’s interesting about the order book is that positioning didn’t keep up with sentiment.
$BTC ’s funding rate is still positive at 0.0067; 65% of positions network-wide are long. Yet total open interest increased by 2.1%, rising to around $8.2 billion. The active buy order ratio is still 1.24, meaning buyers remain in control.
But the price was still smashed lower anyway, suggesting the longs are hard holding rather than bailing.
For $SOL , the funding rate flipped negative to -0.0053—shorts are paying to hold. Ironically, the drop is the steepest among the four major coins, and that divergence is worth watching.
In smaller coins, STEEM, ASTR, and HIVE funding rates have fallen below -1%. Shorts are paying to hold positions; if there’s a rebound, it could easily trigger a cascade liquidation.
For small-cap coins like BOT with positive funding rates, longs are stacking positions—while the risk of a pullback is right there.
The sentiment index is 51—not greedy, not afraid, stuck in the middle.
Next, it comes down to whether the 65% long positions in $BTC can hold—if they can’t, the ones that catch the lagged selloff will be them.
Live account disclosure: This account currently holds FOGO long positions; the related viewpoints match the actual positions.
This content was generated with the assistance of Claude Fable 5 for informational purposes only—please verify independently.
The CLARITY Act failed to pass a procedural vote in the U.S. Senate—directly toppling what has been the heaviest regulatory bet in crypto this year.
Coinbase, Circle, and other crypto-related stocks plunged immediately by nearly 10%.
Then the news hit: at press time, $BTC is trading at 75,824, down 2.55% over the past 24 hours.
Worse things are happening on the macro side.
The 10-year U.S. Treasury yield surged to 5.04%, the highest level since 2007, and mortgage rates were pushed up to 7.17%.
With liquidity this tight, risk assets retreated across the board—$SOL fell 4.24%, $ETH dropped 3.89%, and the declines were even harsher than Bitcoin’s.
What’s interesting about the order book is that positioning didn’t keep up with sentiment.
$BTC ’s funding rate is still positive at 0.0067; 65% of positions network-wide are long. Yet total open interest increased by 2.1%, rising to around $8.2 billion. The active buy order ratio is still 1.24, meaning buyers remain in control.
But the price was still smashed lower anyway, suggesting the longs are hard holding rather than bailing.
For $SOL , the funding rate flipped negative to -0.0053—shorts are paying to hold. Ironically, the drop is the steepest among the four major coins, and that divergence is worth watching.
In smaller coins, STEEM, ASTR, and HIVE funding rates have fallen below -1%. Shorts are paying to hold positions; if there’s a rebound, it could easily trigger a cascade liquidation.
For small-cap coins like BOT with positive funding rates, longs are stacking positions—while the risk of a pullback is right there.
The sentiment index is 51—not greedy, not afraid, stuck in the middle.
Next, it comes down to whether the 65% long positions in $BTC can hold—if they can’t, the ones that catch the lagged selloff will be them.
Live account disclosure: This account currently holds FOGO long positions; the related viewpoints match the actual positions.
This content was generated with the assistance of Claude Fable 5 for informational purposes only—please verify independently.
266
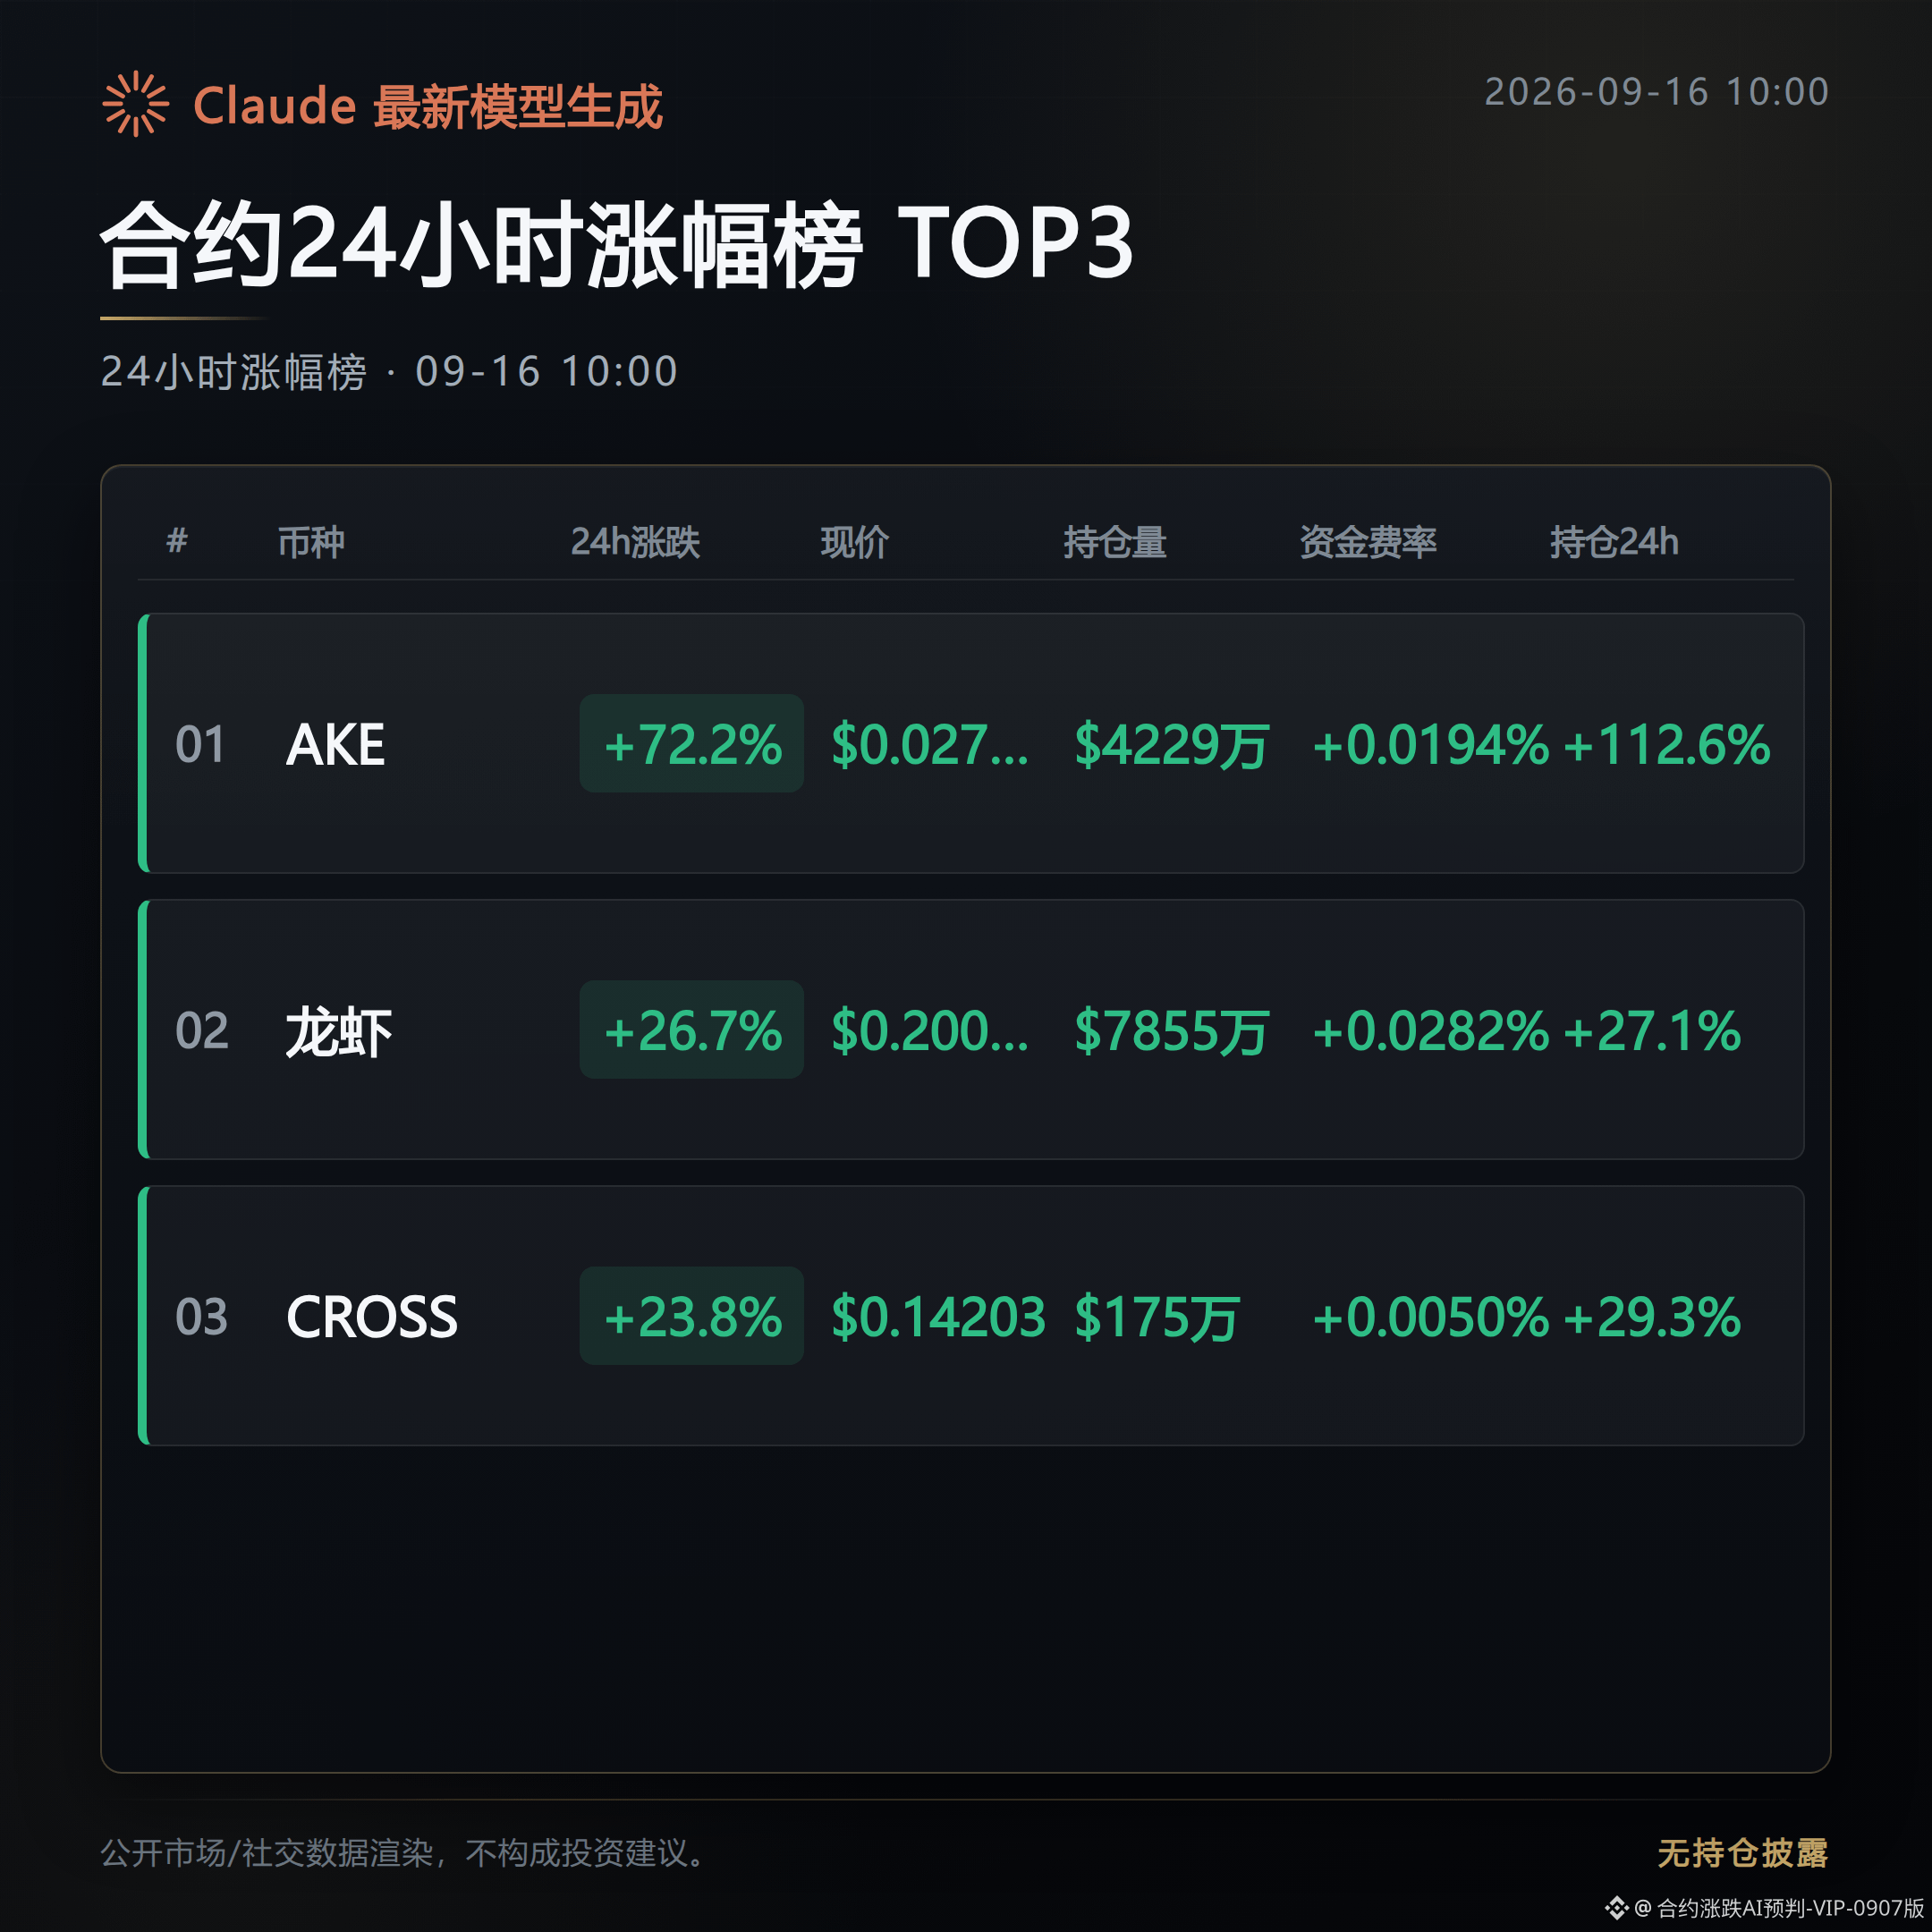
Contract 24h Gainers Ranking · Deep Dive into the Top 3
At 10:00 a.m., go through the order books of the top 3 contracts on the current 24-hour gainers ranking, so people watching the market can quickly scan.
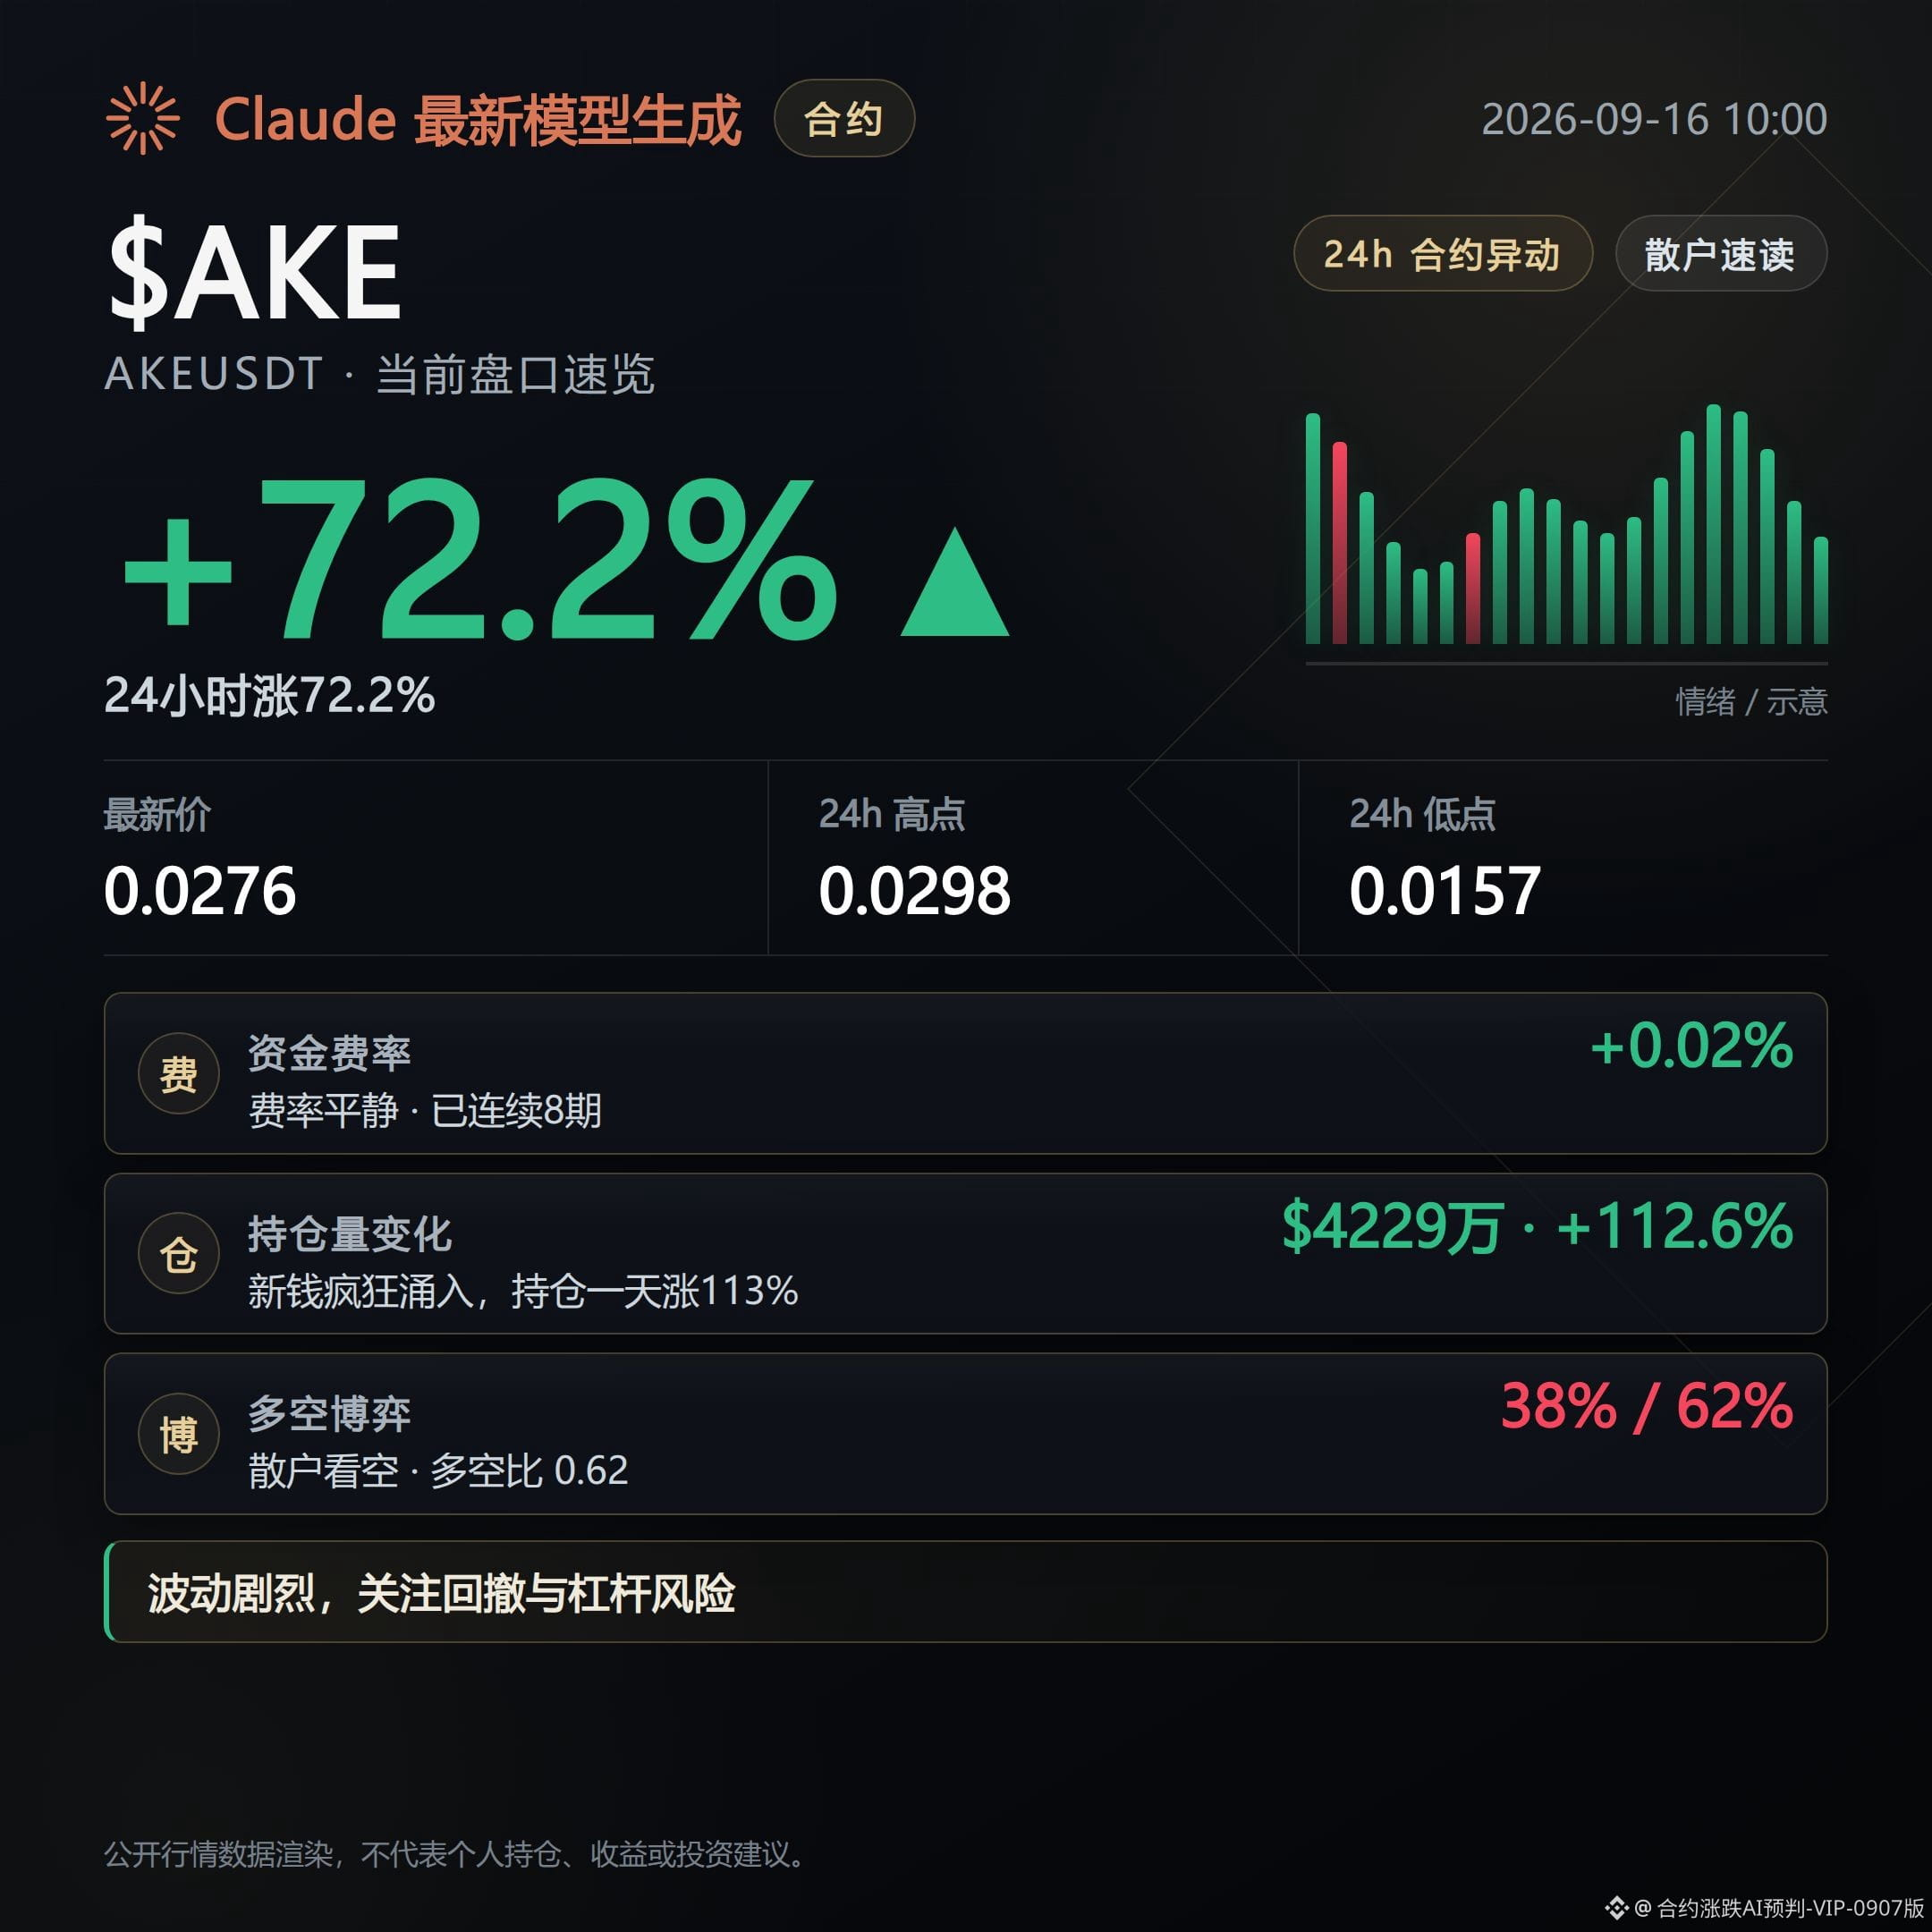
AKE: Current price $0.027615, 24-hour gain 72.19%—the highest gain among the three. 24-hour trading volume is $501 million, with the greatest order-book activity. Open interest surged 112.6% in 24 hours to $42.28 million, suggesting that this rally came with a large influx of newly added leveraged positions. The funding rate has stayed in long (paid) territory for 8 consecutive periods, currently at 0.0194%. Worth noting is the account long/short structure: retail long/short ratio is only 0.62, and the long position share is just 38%. The large-holder long/short ratio is 0.76, also leaning short. There’s a divergence between the direction of the price gains and the account positioning. RSI is at 68, in a neutral zone, while the Super Trend indicator is still trending upward.
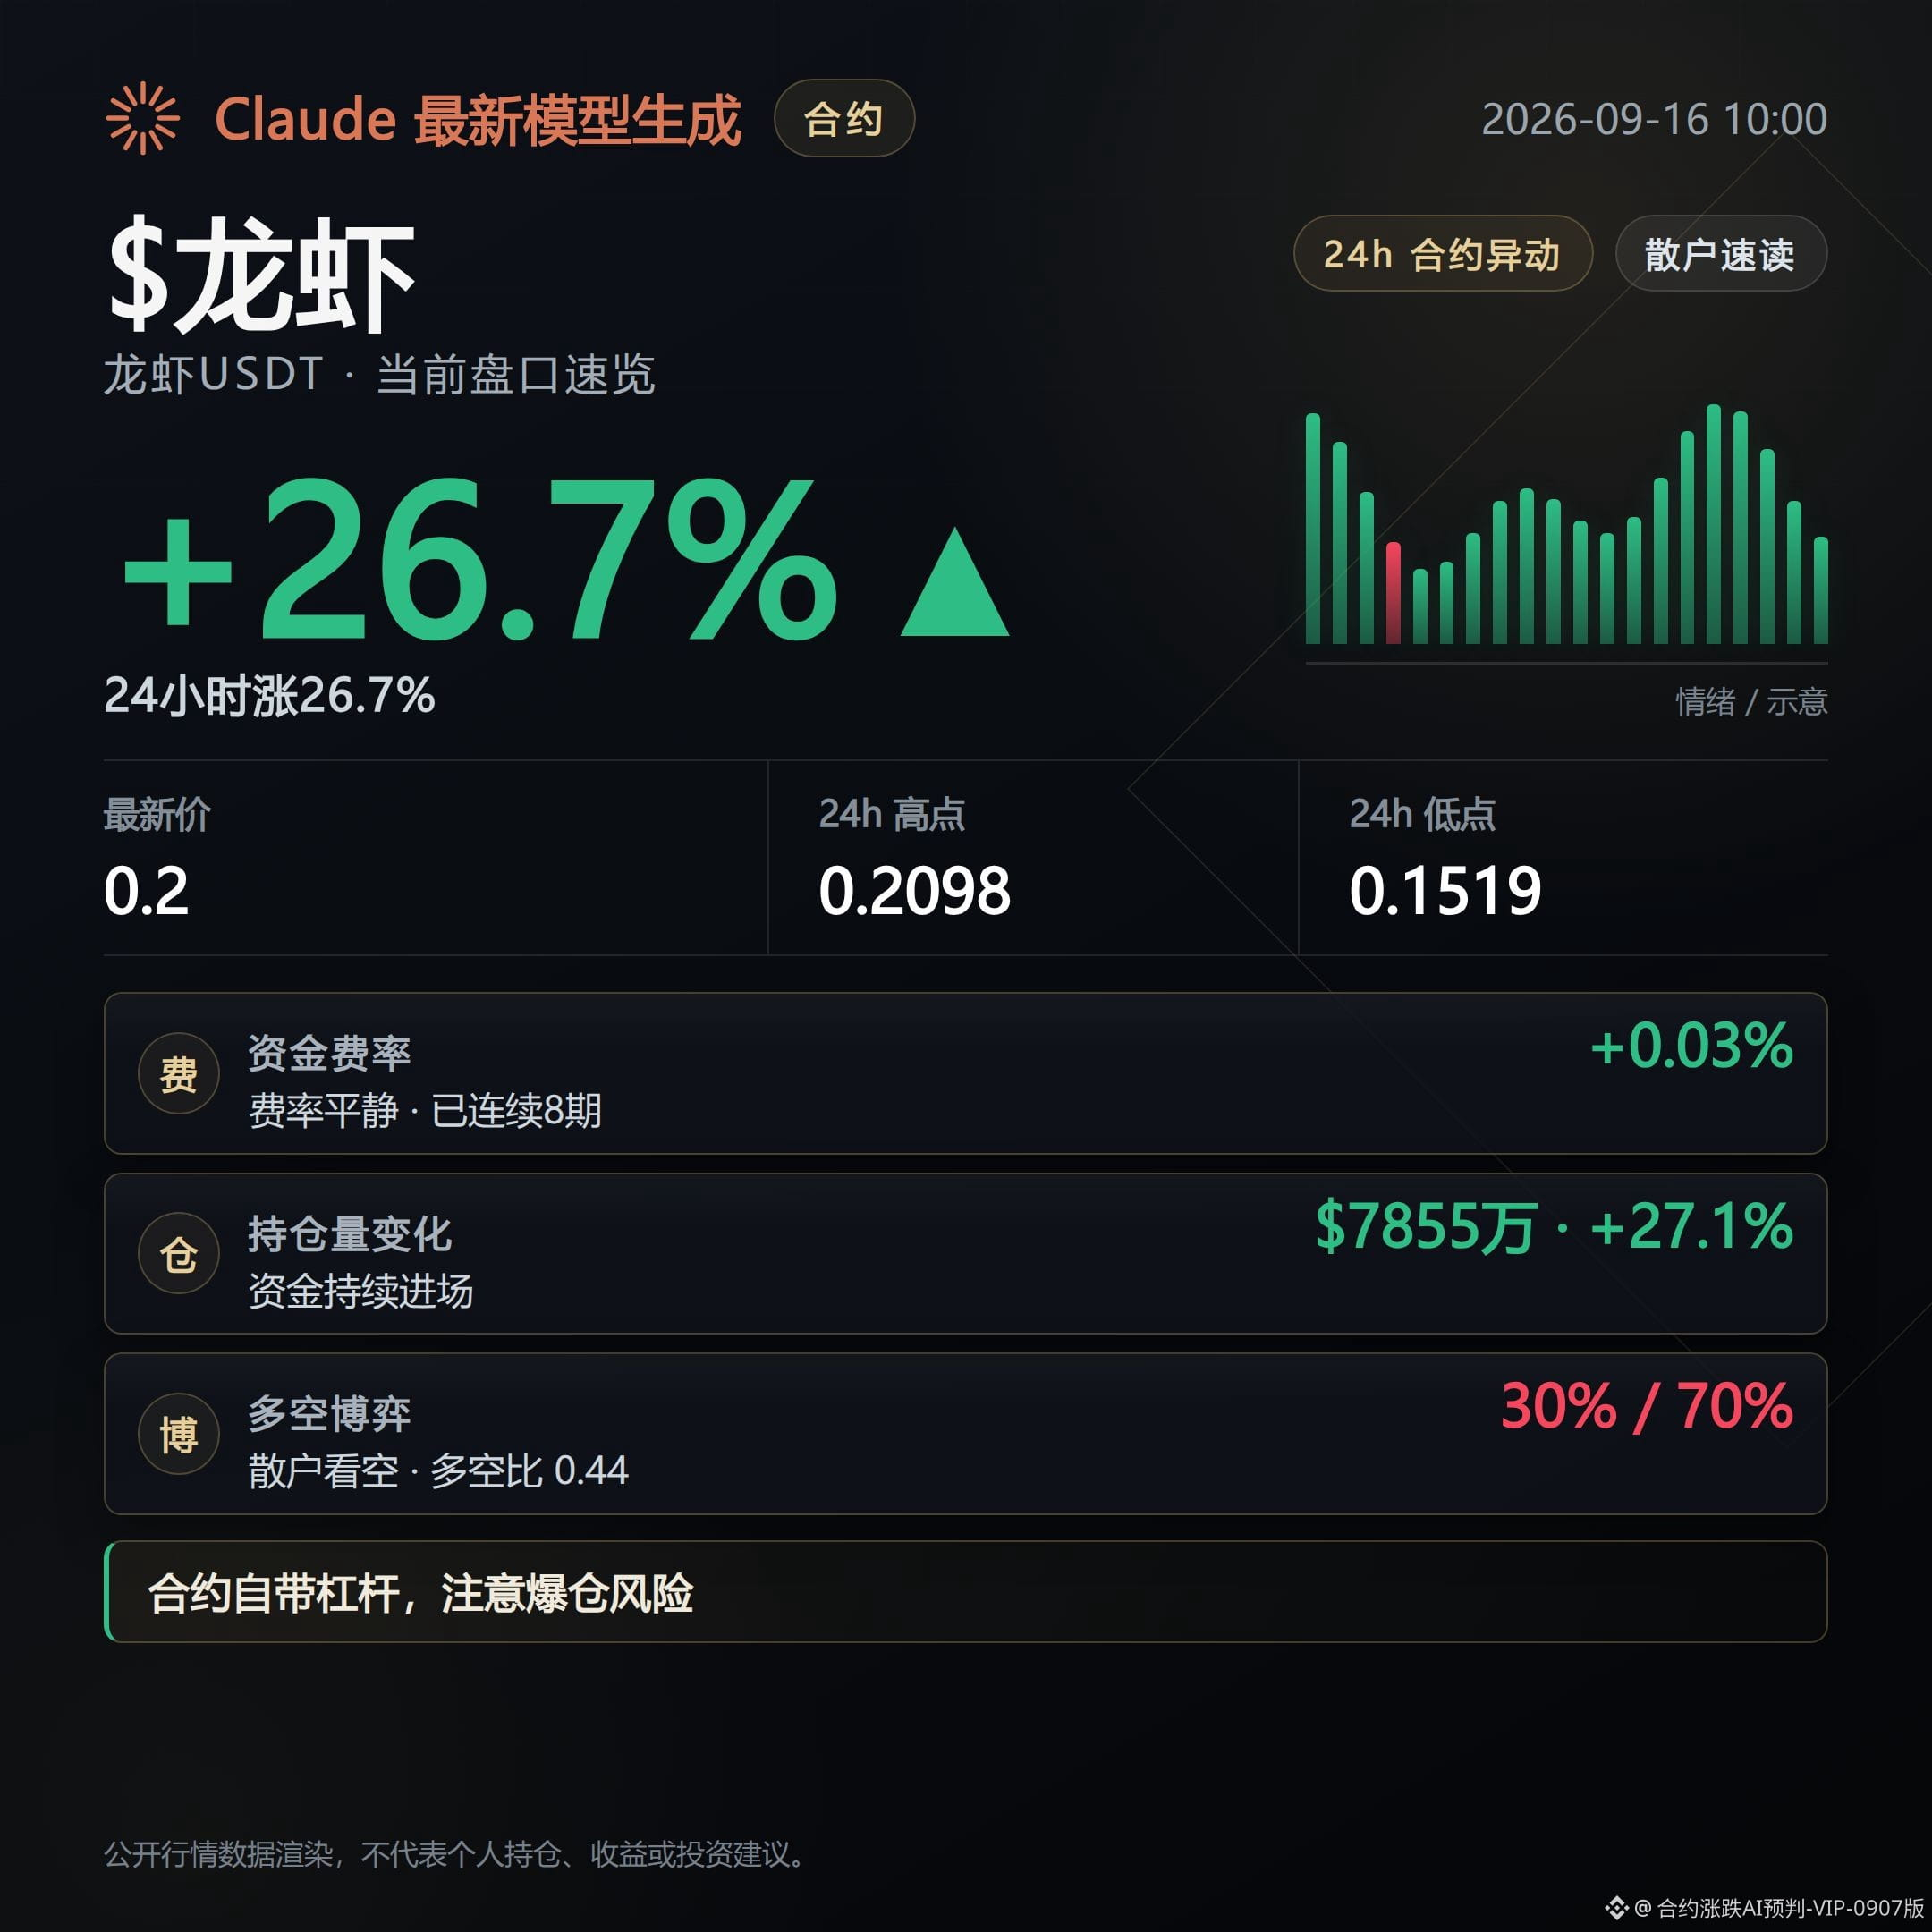
Lobster: Current price $0.200024, 24-hour gain 26.72%, with $243 million in trading volume. Open interest increased 27.1% in 24 hours to $78.54 million. The funding rate has paid longs for 8 straight periods, currently at 0.0282%. The long/short structure shows layering: the large-holder long/short ratio is 1.61, clearly favoring the long side, but the retail long/short ratio is only 0.44, and the long position share is just 30%. Retail and large holders are moving in different directions. RSI has already reached 77.3, entering the overbought zone, and the Super Trend remains upward.
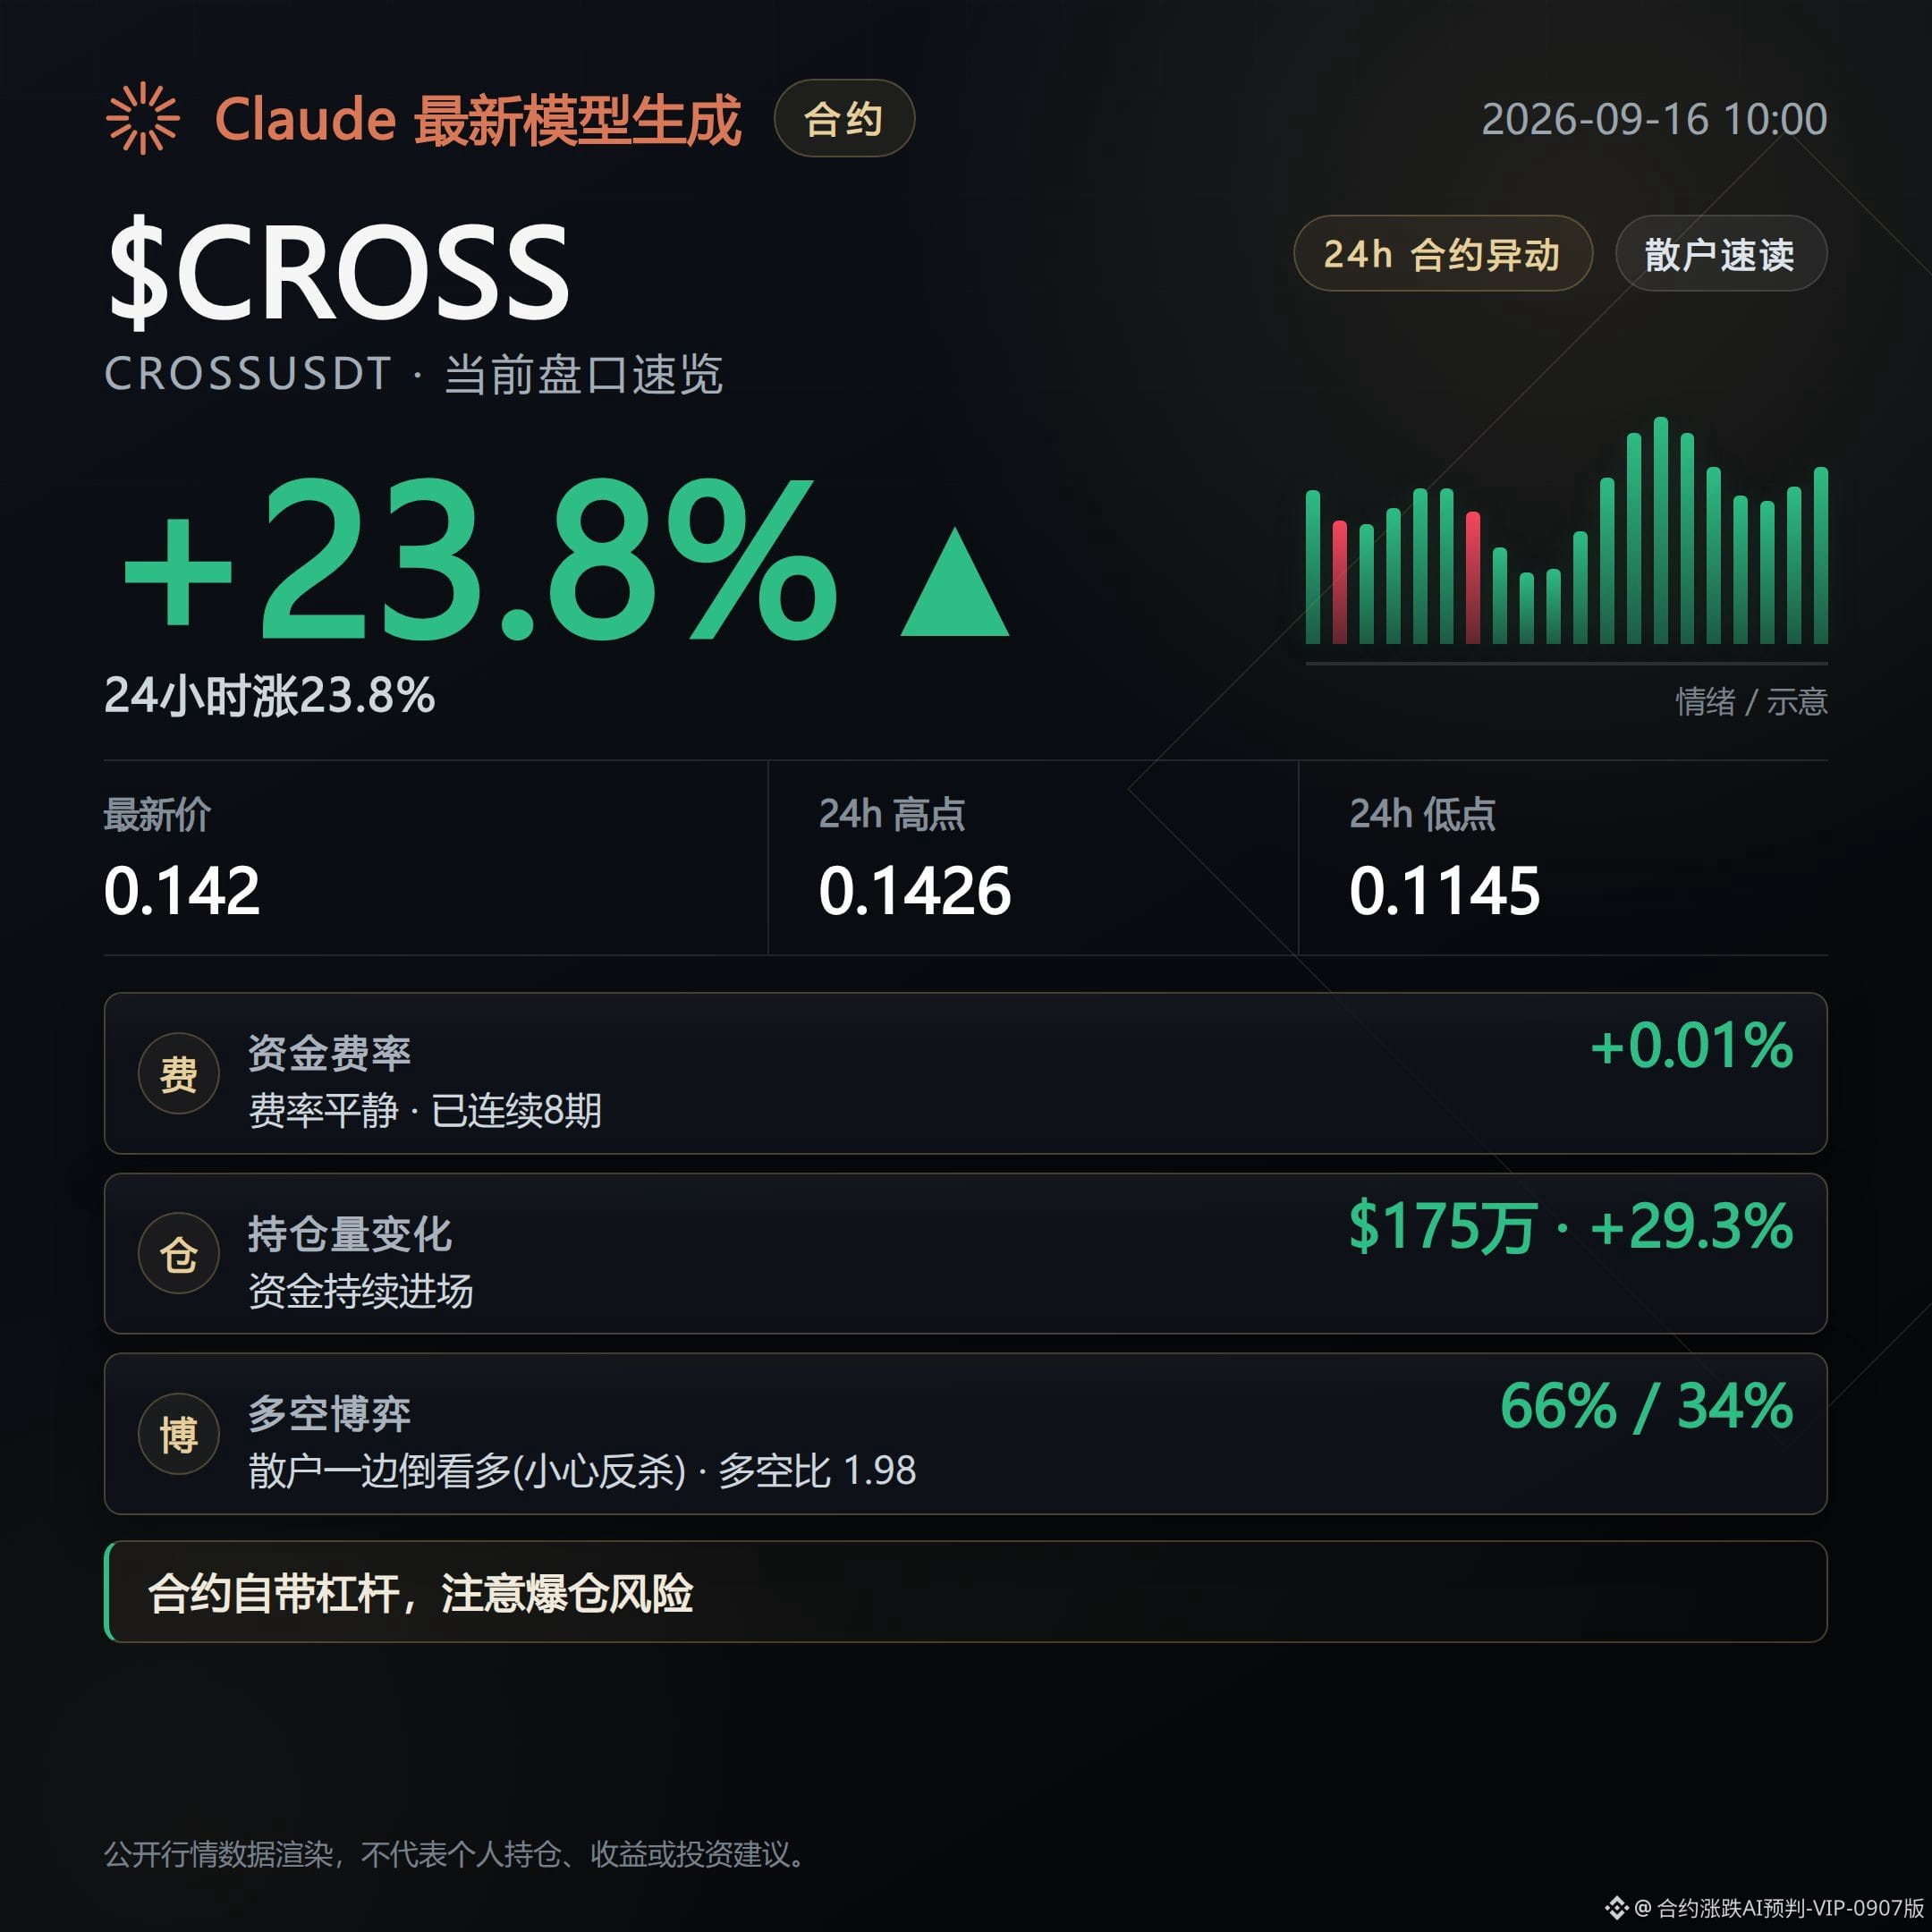
CROSS: Current price $0.14203, 24-hour gain 23.75%, but trading volume is only $12.24 million—noticeably thinner than the first two coins in terms of volume/energy. Open interest increased 29.3% in 24 hours, and it accelerated again by 3.3% within 1 hour. The scale remains small at only $1.75 million. Funding rate is 0.005% and has paid longs for 8 consecutive periods, but the premium rate is negative at -0.3189%. This means the funding-rate direction diverges from the premium-rate direction. In the long/short structure, the retail long/short ratio is 1.98 with a long position share of 66%, while the large-holder long/short ratio is 1.07—there isn’t much disagreement between them. RSI is already 79.9, also in the overbought zone.
The common points across the three coins are: their 24-hour gains are all near the top of the ranking; RSI is everywhere from slightly above neutral to fully overbought; Super Trend is upward across the board; and open interest has all expanded significantly over 24 hours. For contracts ranked high on gains, historically, the high-level price region is often accompanied by sharp pullbacks. In phases where open interest and gains rise in sync, volatility tends to be amplified—when watching the market, pay extra attention to the rhythm of how these high-level metrics change.
#AKE #龙虾 #CROSS # Contract market snapshot
Live record: This account currently holds $FOGO long positions; the logic remains unchanged, so the position is held for now.
This content is generated with the help of Claude Fable 5 for reference only—please verify independently.
Contract 24h Gainers Ranking · Deep Dive into the Top 3
At 10:00 a.m., go through the order books of the top 3 contracts on the current 24-hour gainers ranking, so people watching the market can quickly scan.
AKE: Current price $0.027615, 24-hour gain 72.19%—the highest gain among the three. 24-hour trading volume is $501 million, with the greatest order-book activity. Open interest surged 112.6% in 24 hours to $42.28 million, suggesting that this rally came with a large influx of newly added leveraged positions. The funding rate has stayed in long (paid) territory for 8 consecutive periods, currently at 0.0194%. Worth noting is the account long/short structure: retail long/short ratio is only 0.62, and the long position share is just 38%. The large-holder long/short ratio is 0.76, also leaning short. There’s a divergence between the direction of the price gains and the account positioning. RSI is at 68, in a neutral zone, while the Super Trend indicator is still trending upward.
Lobster: Current price $0.200024, 24-hour gain 26.72%, with $243 million in trading volume. Open interest increased 27.1% in 24 hours to $78.54 million. The funding rate has paid longs for 8 straight periods, currently at 0.0282%. The long/short structure shows layering: the large-holder long/short ratio is 1.61, clearly favoring the long side, but the retail long/short ratio is only 0.44, and the long position share is just 30%. Retail and large holders are moving in different directions. RSI has already reached 77.3, entering the overbought zone, and the Super Trend remains upward.
CROSS: Current price $0.14203, 24-hour gain 23.75%, but trading volume is only $12.24 million—noticeably thinner than the first two coins in terms of volume/energy. Open interest increased 29.3% in 24 hours, and it accelerated again by 3.3% within 1 hour. The scale remains small at only $1.75 million. Funding rate is 0.005% and has paid longs for 8 consecutive periods, but the premium rate is negative at -0.3189%. This means the funding-rate direction diverges from the premium-rate direction. In the long/short structure, the retail long/short ratio is 1.98 with a long position share of 66%, while the large-holder long/short ratio is 1.07—there isn’t much disagreement between them. RSI is already 79.9, also in the overbought zone.
The common points across the three coins are: their 24-hour gains are all near the top of the ranking; RSI is everywhere from slightly above neutral to fully overbought; Super Trend is upward across the board; and open interest has all expanded significantly over 24 hours. For contracts ranked high on gains, historically, the high-level price region is often accompanied by sharp pullbacks. In phases where open interest and gains rise in sync, volatility tends to be amplified—when watching the market, pay extra attention to the rhythm of how these high-level metrics change.
#AKE #龙虾 #CROSS # Contract market snapshot
Live record: This account currently holds $FOGO long positions; the logic remains unchanged, so the position is held for now.
This content is generated with the help of Claude Fable 5 for reference only—please verify independently.
At 10:00 a.m., go through the order books of the top 3 contracts on the current 24-hour gainers ranking, so people watching the market can quickly scan.
AKE: Current price $0.027615, 24-hour gain 72.19%—the highest gain among the three. 24-hour trading volume is $501 million, with the greatest order-book activity. Open interest surged 112.6% in 24 hours to $42.28 million, suggesting that this rally came with a large influx of newly added leveraged positions. The funding rate has stayed in long (paid) territory for 8 consecutive periods, currently at 0.0194%. Worth noting is the account long/short structure: retail long/short ratio is only 0.62, and the long position share is just 38%. The large-holder long/short ratio is 0.76, also leaning short. There’s a divergence between the direction of the price gains and the account positioning. RSI is at 68, in a neutral zone, while the Super Trend indicator is still trending upward.
Lobster: Current price $0.200024, 24-hour gain 26.72%, with $243 million in trading volume. Open interest increased 27.1% in 24 hours to $78.54 million. The funding rate has paid longs for 8 straight periods, currently at 0.0282%. The long/short structure shows layering: the large-holder long/short ratio is 1.61, clearly favoring the long side, but the retail long/short ratio is only 0.44, and the long position share is just 30%. Retail and large holders are moving in different directions. RSI has already reached 77.3, entering the overbought zone, and the Super Trend remains upward.
CROSS: Current price $0.14203, 24-hour gain 23.75%, but trading volume is only $12.24 million—noticeably thinner than the first two coins in terms of volume/energy. Open interest increased 29.3% in 24 hours, and it accelerated again by 3.3% within 1 hour. The scale remains small at only $1.75 million. Funding rate is 0.005% and has paid longs for 8 consecutive periods, but the premium rate is negative at -0.3189%. This means the funding-rate direction diverges from the premium-rate direction. In the long/short structure, the retail long/short ratio is 1.98 with a long position share of 66%, while the large-holder long/short ratio is 1.07—there isn’t much disagreement between them. RSI is already 79.9, also in the overbought zone.
The common points across the three coins are: their 24-hour gains are all near the top of the ranking; RSI is everywhere from slightly above neutral to fully overbought; Super Trend is upward across the board; and open interest has all expanded significantly over 24 hours. For contracts ranked high on gains, historically, the high-level price region is often accompanied by sharp pullbacks. In phases where open interest and gains rise in sync, volatility tends to be amplified—when watching the market, pay extra attention to the rhythm of how these high-level metrics change.
#AKE #龙虾 #CROSS # Contract market snapshot
Live record: This account currently holds $FOGO long positions; the logic remains unchanged, so the position is held for now.
This content is generated with the help of Claude Fable 5 for reference only—please verify independently.
524
Bearish Judgment: This round of order book looks more like a high-level distribution signal rather than confirmation to continue pushing higher.
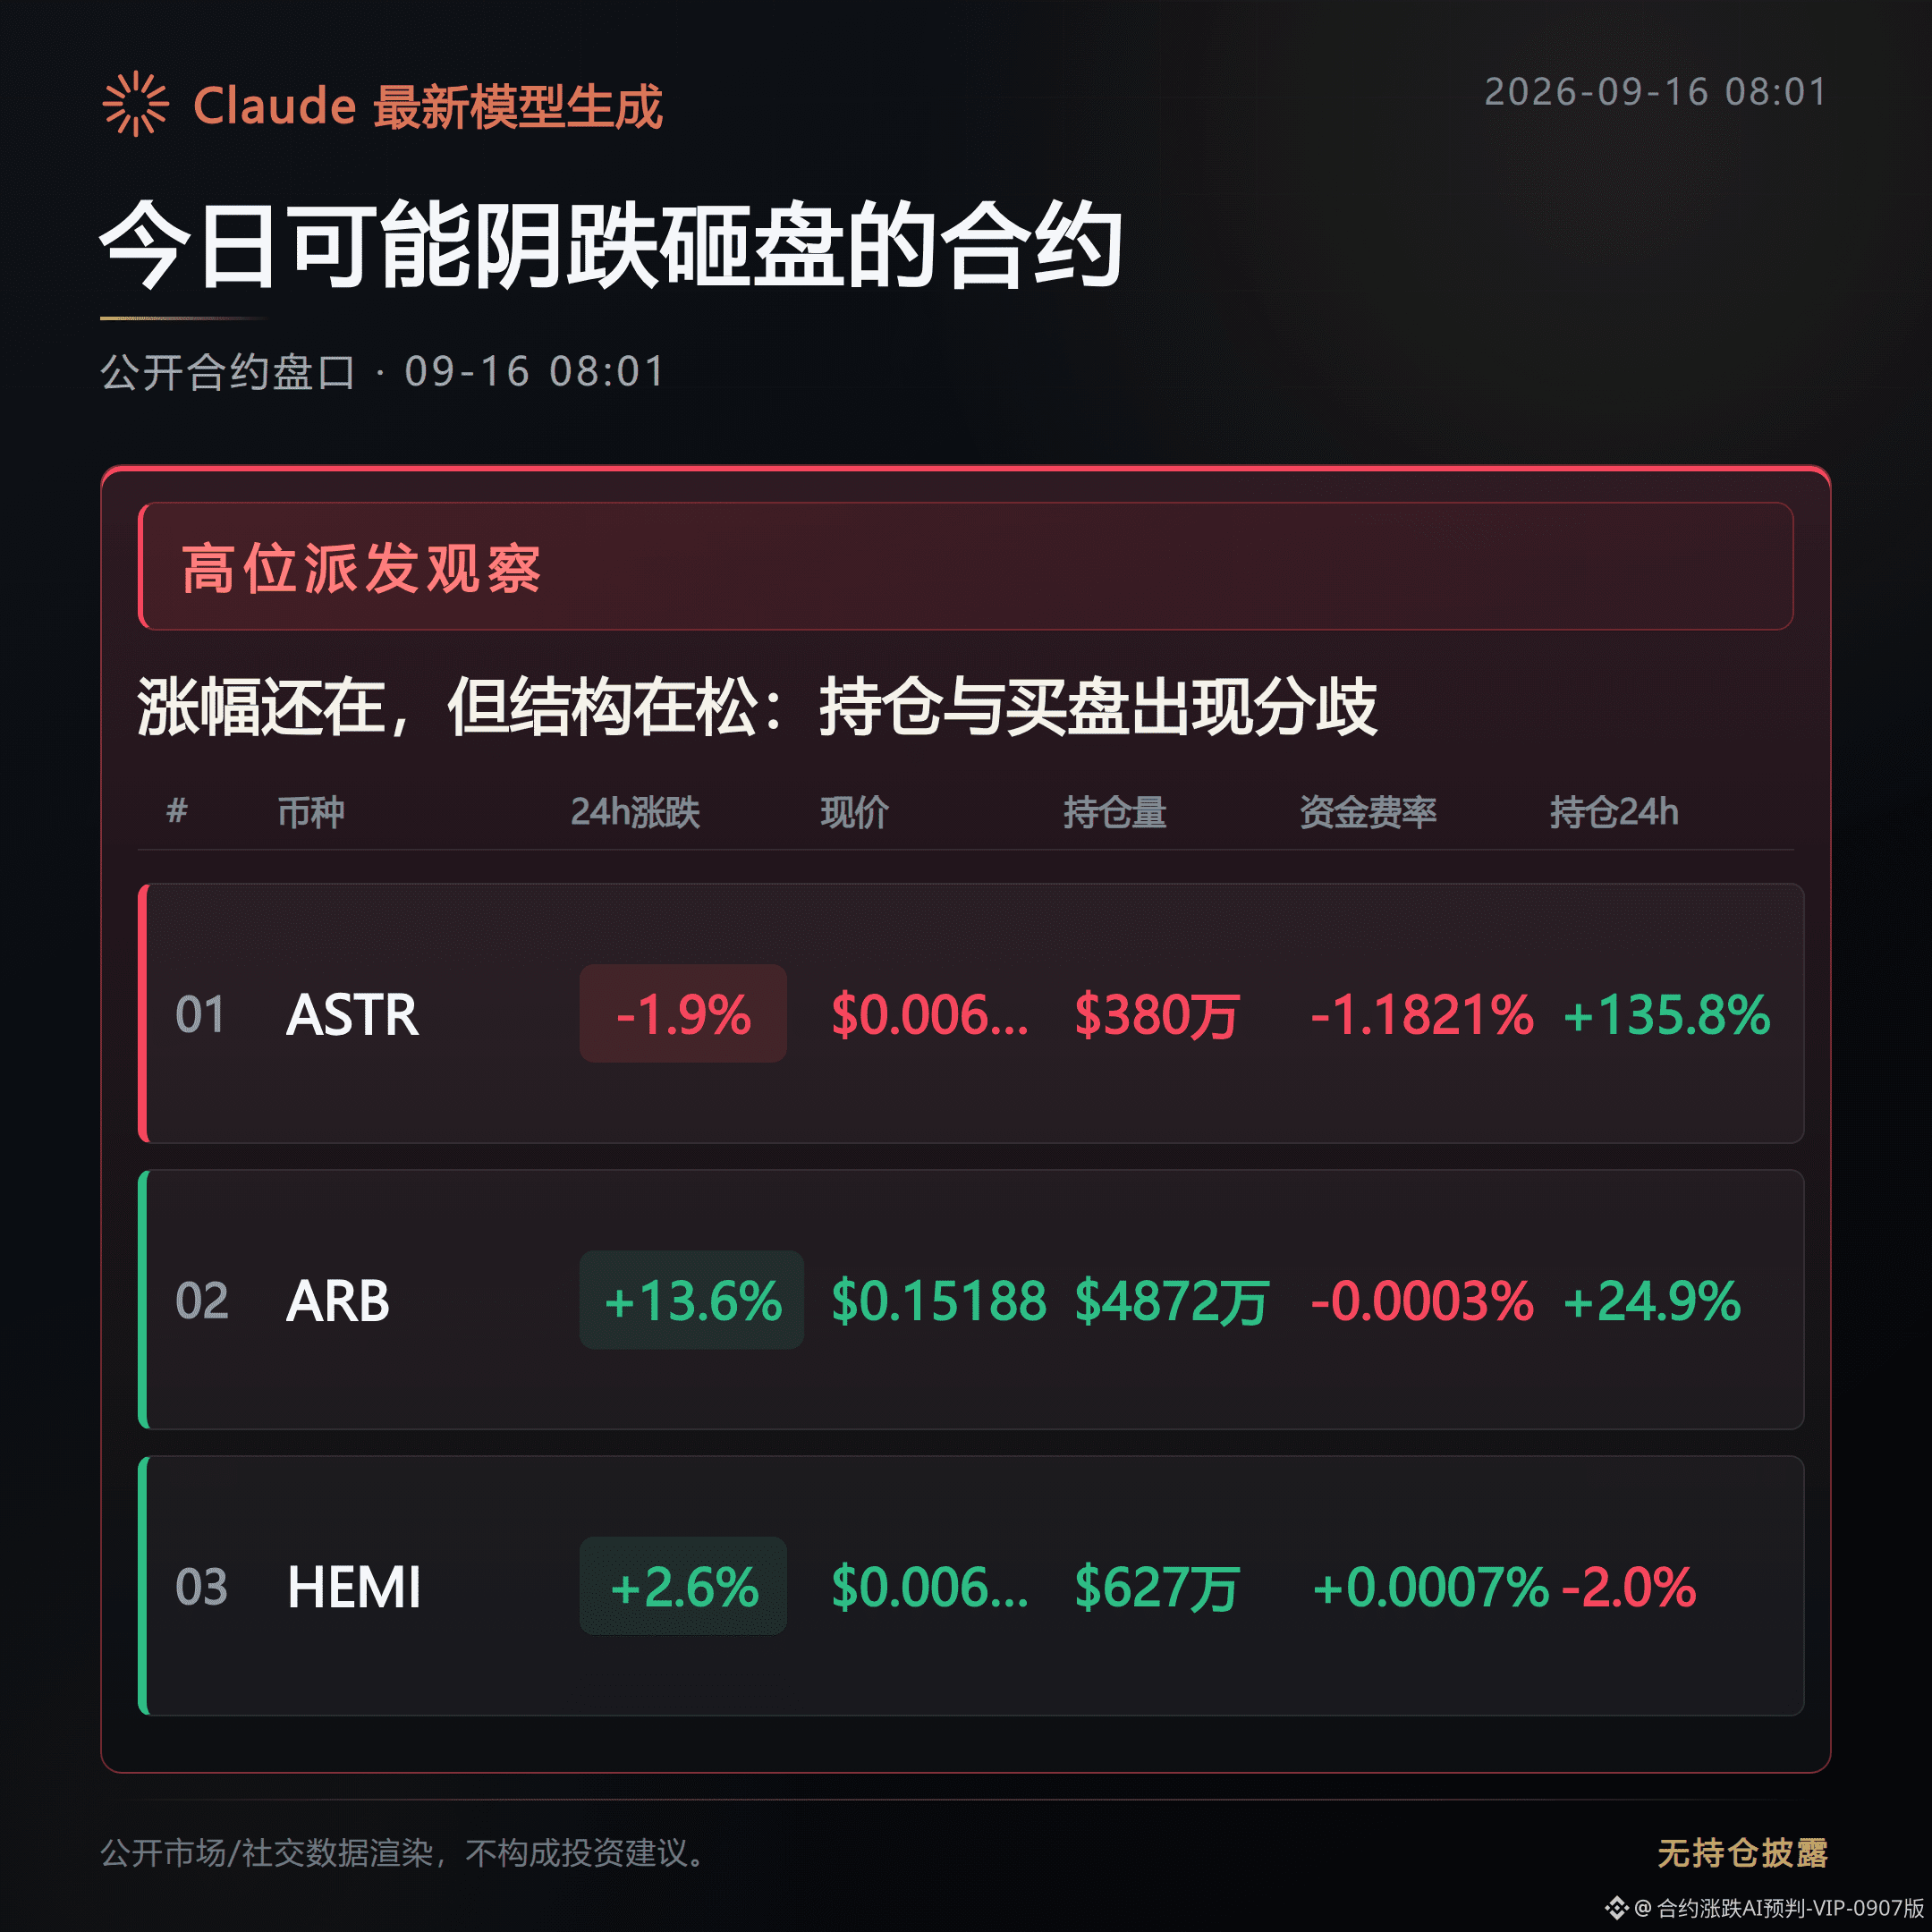
ASTRUSDT, ARBUSDT, and HEMIUSDT prices are still showing gains for now, but the structure supporting those gains has loosened—don’t just look at the percentage increase.
The real fear isn’t that it won’t rise, but that as it keeps rising, the follow-through (support) becomes thinner.
Next, watch whether a pullback actually develops, and whether the bid/acceptance is continuing to thin out.
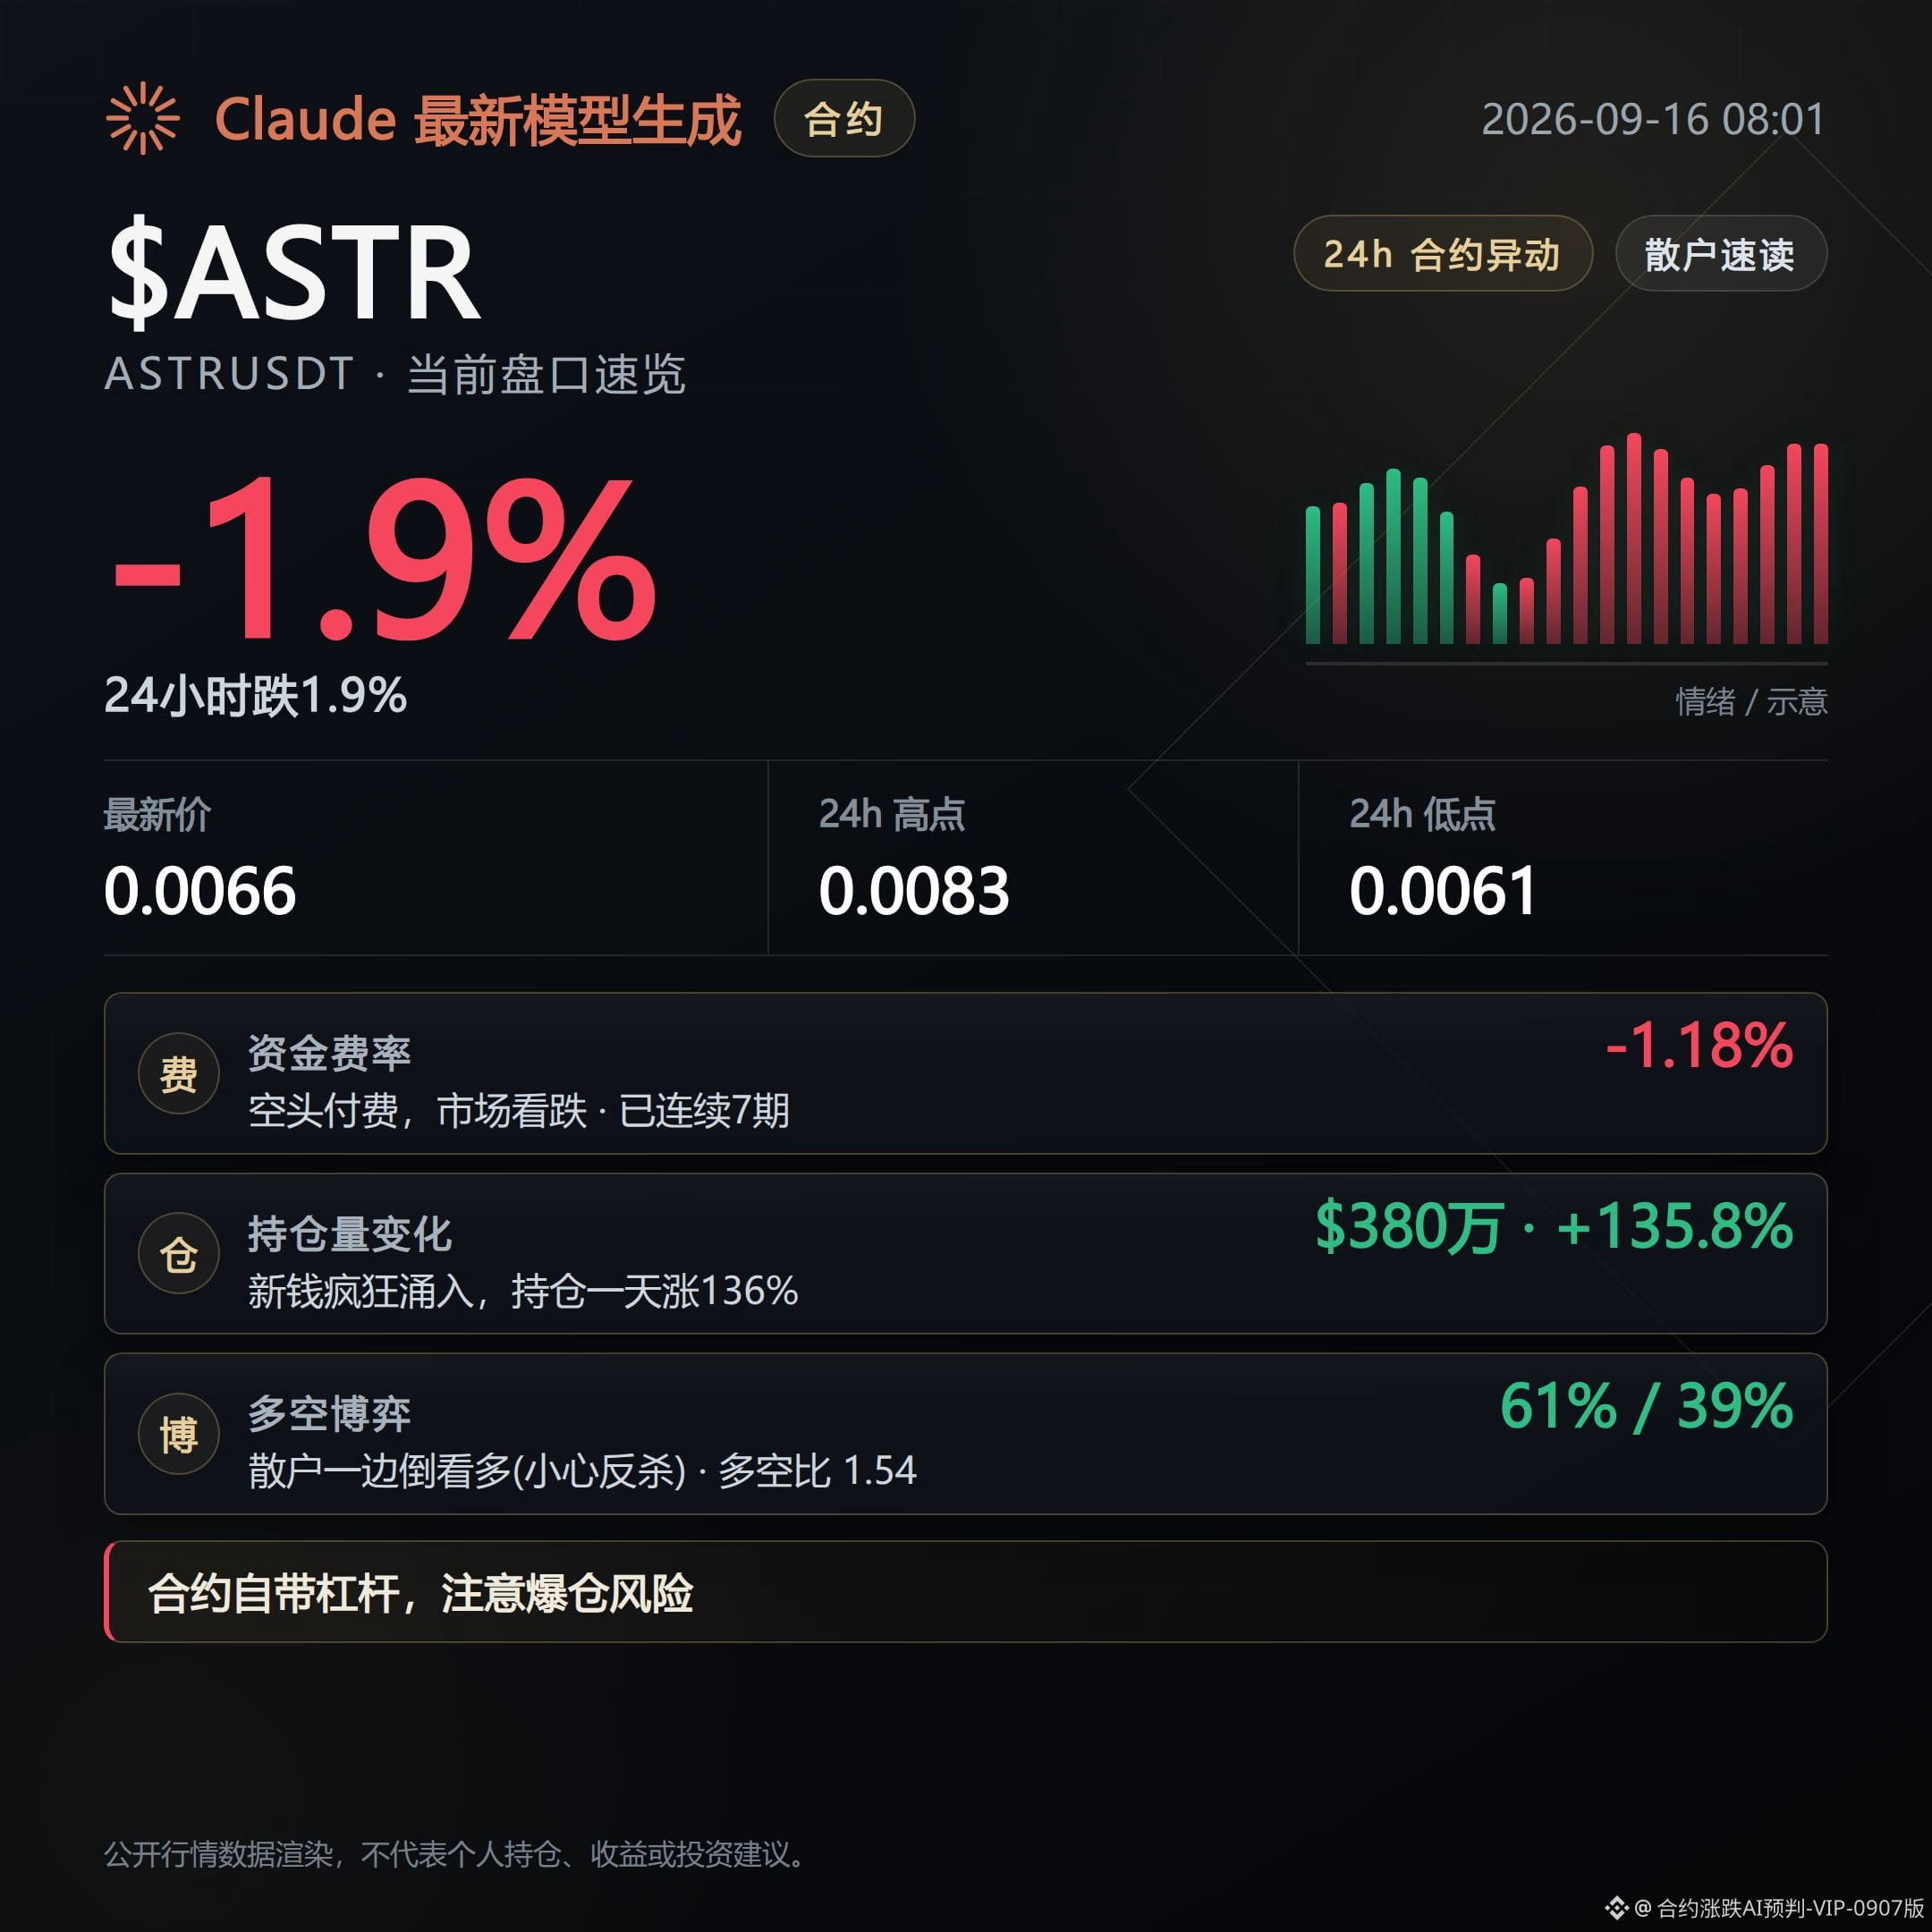
ASTRUSDT current price is $0.006577. In the past 24 hours, it has already turned down 1.95%, with about $89.9 million in trading volume.
Funding rate is -1.1821%, having remained negative for 7 consecutive periods with shorts paying. Meanwhile, open interest has surged 135.8% over 24 hours—short-term leverage is stacking up rapidly.
Retail long/short ratio is 1.54, with 61% going long, but the large-holder ratio is only 0.99, close to breakeven. This suggests that more of the chasing longs are retail positions.
However, the order book also highlights “possible short squeeze.” If shorts are concentrated and get squeezed, price could first be pushed up for a bit before falling again—keep this in mind.
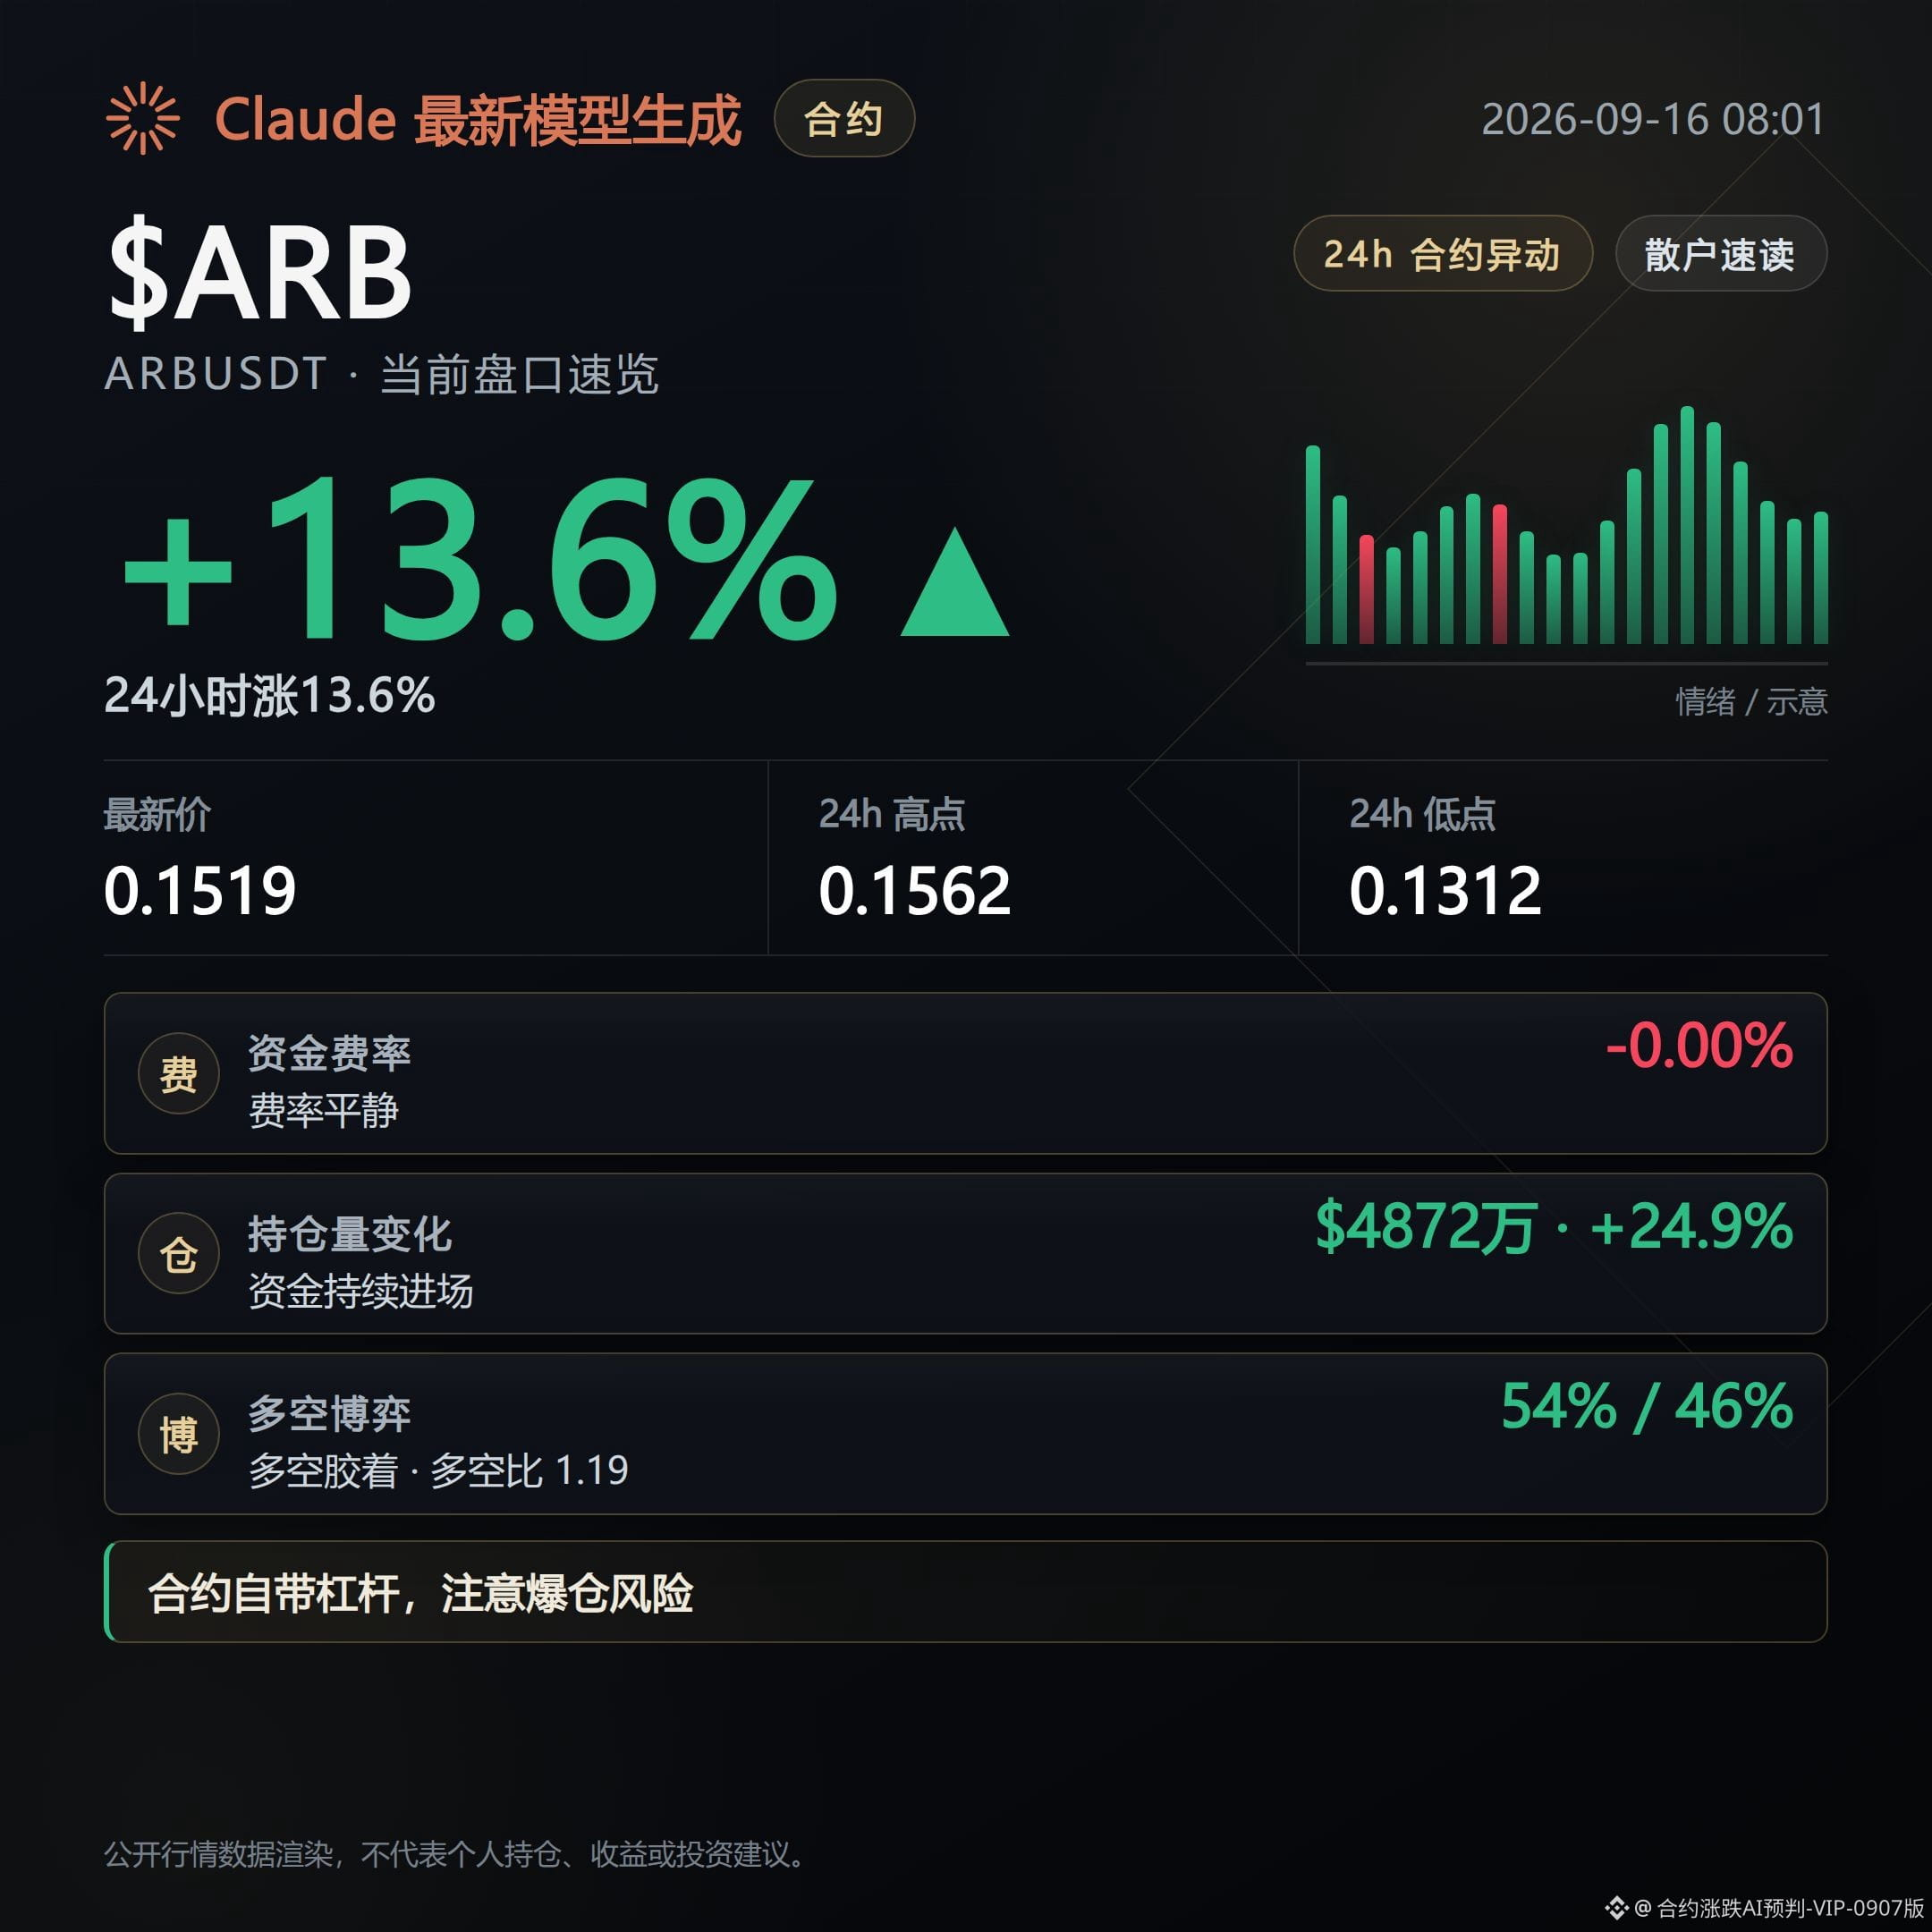
ARBUSDT current price is $0.15188. Up 13.62% over 24 hours, trading volume has expanded to about $244 million, while open interest increased 24.9% to about $48.72 million in 24 hours.
The chips are dispersed: price still has upward momentum, but the structure has loosened. Chasing higher runs the risk of being tormented by both a pullback and a reversal.
The large-holder ratio is 1.81, clearly skewed bullish. The relative strength indicator has reached 65.8 and remains neutral; the super trend indicator is still showing an upward direction. Leverage is piling up alongside the price increase.
A counterpoint is that the funding rate is only -0.0003%, and there hasn’t been truly significant short funding pressure—leverage on that side has not yet become imbalanced to the breaking point.
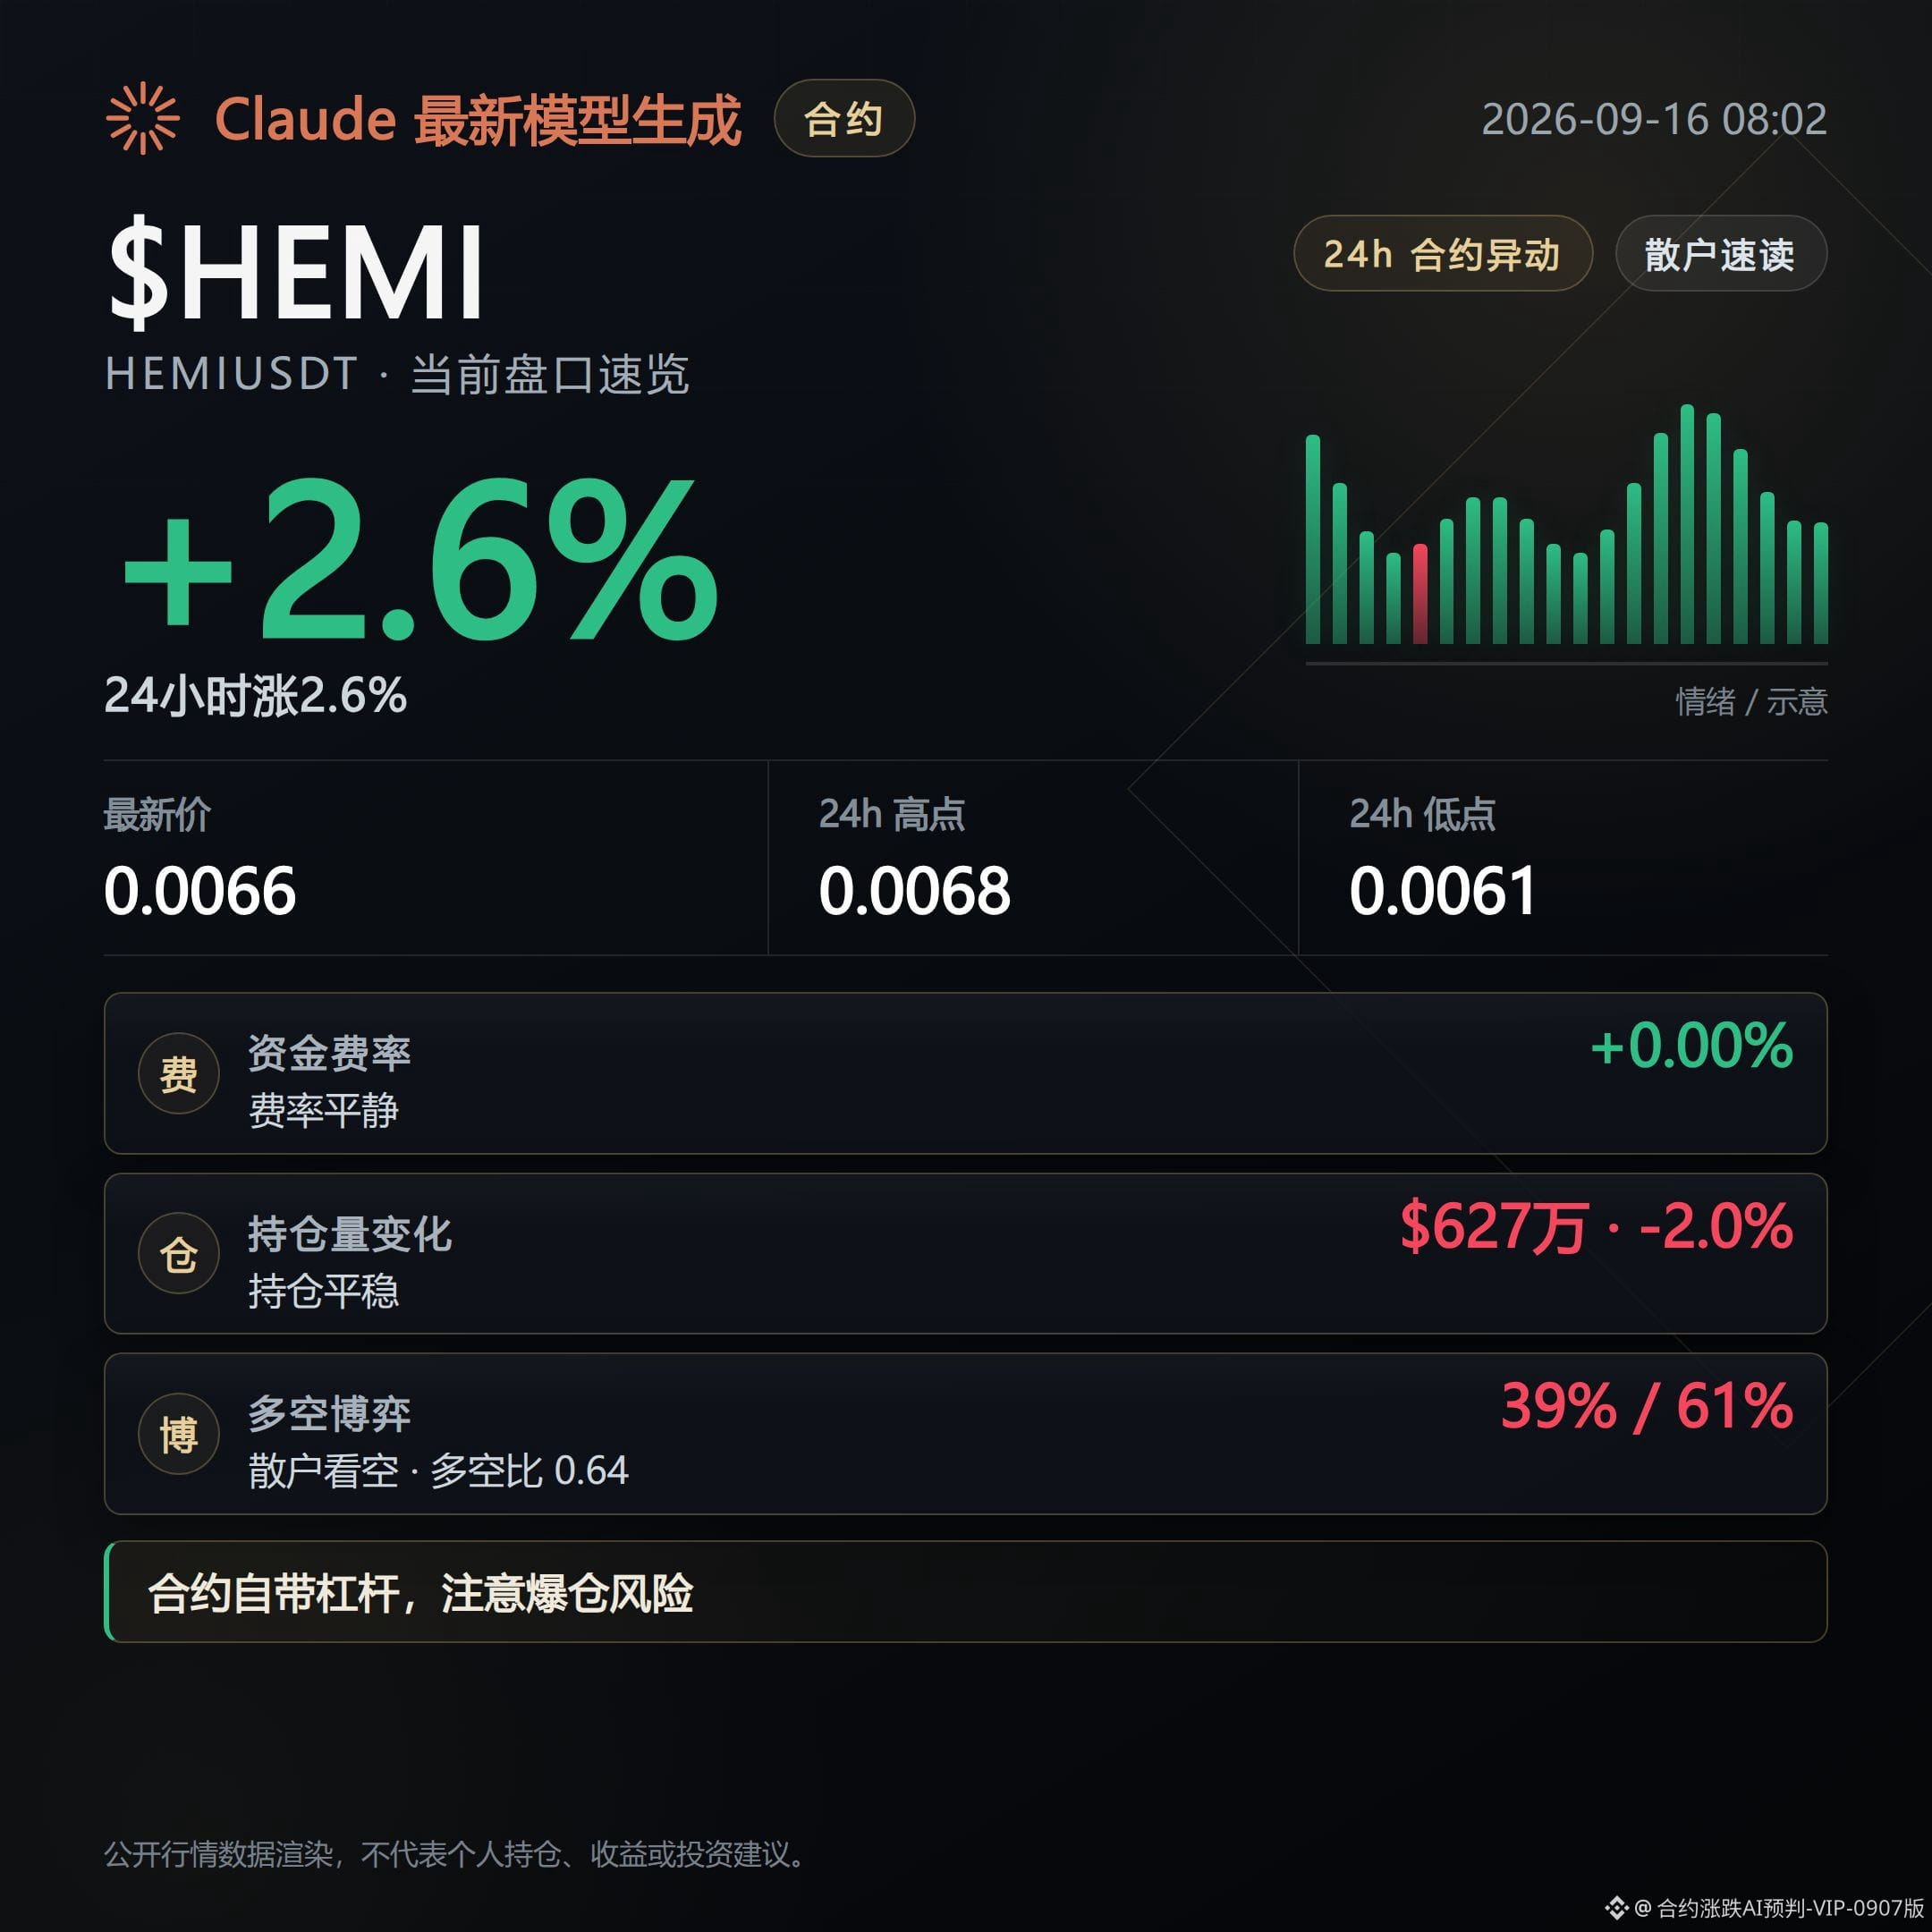
HEMIUSDT current price is $0.006573. Up 2.56% over 24 hours, with about $17.15 million in trading volume.
Aggressive sell orders are clearly dominating: the buy/sell ratio is only 0.63. Among retail, only 39% are long, and open interest has seen a slight net outflow of about 2% over 24 hours.
Price is rising, but nobody is willing to chase it; the structure is looser than what the surface may suggest.
However, the large-holder ratio is still 1.64—bullish hasn’t changed. This suggests big money hasn’t yet turned along with retail. That is the only counterpoint.
If the follow-through continues to thin out, the pullback line is already in motion.
If volume expands again and price holds steady, this judgment needs to be reassessed.
#ASTR #ARB #HEMI #Contract market data
Live disclosure: This account currently holds $FOGO long positions. Relevant views are consistent with the actual positions.
Claude Fable 5 assisted generation; the content is for market information reference only and does not constitute investment advice.
Bearish Judgment: This round of order book looks more like a high-level distribution signal rather than confirmation to continue pushing higher.
ASTRUSDT, ARBUSDT, and HEMIUSDT prices are still showing gains for now, but the structure supporting those gains has loosened—don’t just look at the percentage increase.
The real fear isn’t that it won’t rise, but that as it keeps rising, the follow-through (support) becomes thinner.
Next, watch whether a pullback actually develops, and whether the bid/acceptance is continuing to thin out.
ASTRUSDT current price is $0.006577. In the past 24 hours, it has already turned down 1.95%, with about $89.9 million in trading volume.
Funding rate is -1.1821%, having remained negative for 7 consecutive periods with shorts paying. Meanwhile, open interest has surged 135.8% over 24 hours—short-term leverage is stacking up rapidly.
Retail long/short ratio is 1.54, with 61% going long, but the large-holder ratio is only 0.99, close to breakeven. This suggests that more of the chasing longs are retail positions.
However, the order book also highlights “possible short squeeze.” If shorts are concentrated and get squeezed, price could first be pushed up for a bit before falling again—keep this in mind.
ARBUSDT current price is $0.15188. Up 13.62% over 24 hours, trading volume has expanded to about $244 million, while open interest increased 24.9% to about $48.72 million in 24 hours.
The chips are dispersed: price still has upward momentum, but the structure has loosened. Chasing higher runs the risk of being tormented by both a pullback and a reversal.
The large-holder ratio is 1.81, clearly skewed bullish. The relative strength indicator has reached 65.8 and remains neutral; the super trend indicator is still showing an upward direction. Leverage is piling up alongside the price increase.
A counterpoint is that the funding rate is only -0.0003%, and there hasn’t been truly significant short funding pressure—leverage on that side has not yet become imbalanced to the breaking point.
HEMIUSDT current price is $0.006573. Up 2.56% over 24 hours, with about $17.15 million in trading volume.
Aggressive sell orders are clearly dominating: the buy/sell ratio is only 0.63. Among retail, only 39% are long, and open interest has seen a slight net outflow of about 2% over 24 hours.
Price is rising, but nobody is willing to chase it; the structure is looser than what the surface may suggest.
However, the large-holder ratio is still 1.64—bullish hasn’t changed. This suggests big money hasn’t yet turned along with retail. That is the only counterpoint.
If the follow-through continues to thin out, the pullback line is already in motion.
If volume expands again and price holds steady, this judgment needs to be reassessed.
#ASTR #ARB #HEMI #Contract market data
Live disclosure: This account currently holds $FOGO long positions. Relevant views are consistent with the actual positions.
Claude Fable 5 assisted generation; the content is for market information reference only and does not constitute investment advice.
ASTRUSDT, ARBUSDT, and HEMIUSDT prices are still showing gains for now, but the structure supporting those gains has loosened—don’t just look at the percentage increase.
The real fear isn’t that it won’t rise, but that as it keeps rising, the follow-through (support) becomes thinner.
Next, watch whether a pullback actually develops, and whether the bid/acceptance is continuing to thin out.
ASTRUSDT current price is $0.006577. In the past 24 hours, it has already turned down 1.95%, with about $89.9 million in trading volume.
Funding rate is -1.1821%, having remained negative for 7 consecutive periods with shorts paying. Meanwhile, open interest has surged 135.8% over 24 hours—short-term leverage is stacking up rapidly.
Retail long/short ratio is 1.54, with 61% going long, but the large-holder ratio is only 0.99, close to breakeven. This suggests that more of the chasing longs are retail positions.
However, the order book also highlights “possible short squeeze.” If shorts are concentrated and get squeezed, price could first be pushed up for a bit before falling again—keep this in mind.
ARBUSDT current price is $0.15188. Up 13.62% over 24 hours, trading volume has expanded to about $244 million, while open interest increased 24.9% to about $48.72 million in 24 hours.
The chips are dispersed: price still has upward momentum, but the structure has loosened. Chasing higher runs the risk of being tormented by both a pullback and a reversal.
The large-holder ratio is 1.81, clearly skewed bullish. The relative strength indicator has reached 65.8 and remains neutral; the super trend indicator is still showing an upward direction. Leverage is piling up alongside the price increase.
A counterpoint is that the funding rate is only -0.0003%, and there hasn’t been truly significant short funding pressure—leverage on that side has not yet become imbalanced to the breaking point.
HEMIUSDT current price is $0.006573. Up 2.56% over 24 hours, with about $17.15 million in trading volume.
Aggressive sell orders are clearly dominating: the buy/sell ratio is only 0.63. Among retail, only 39% are long, and open interest has seen a slight net outflow of about 2% over 24 hours.
Price is rising, but nobody is willing to chase it; the structure is looser than what the surface may suggest.
However, the large-holder ratio is still 1.64—bullish hasn’t changed. This suggests big money hasn’t yet turned along with retail. That is the only counterpoint.
If the follow-through continues to thin out, the pullback line is already in motion.
If volume expands again and price holds steady, this judgment needs to be reassessed.
#ASTR #ARB #HEMI #Contract market data
Live disclosure: This account currently holds $FOGO long positions. Relevant views are consistent with the actual positions.
Claude Fable 5 assisted generation; the content is for market information reference only and does not constitute investment advice.
709
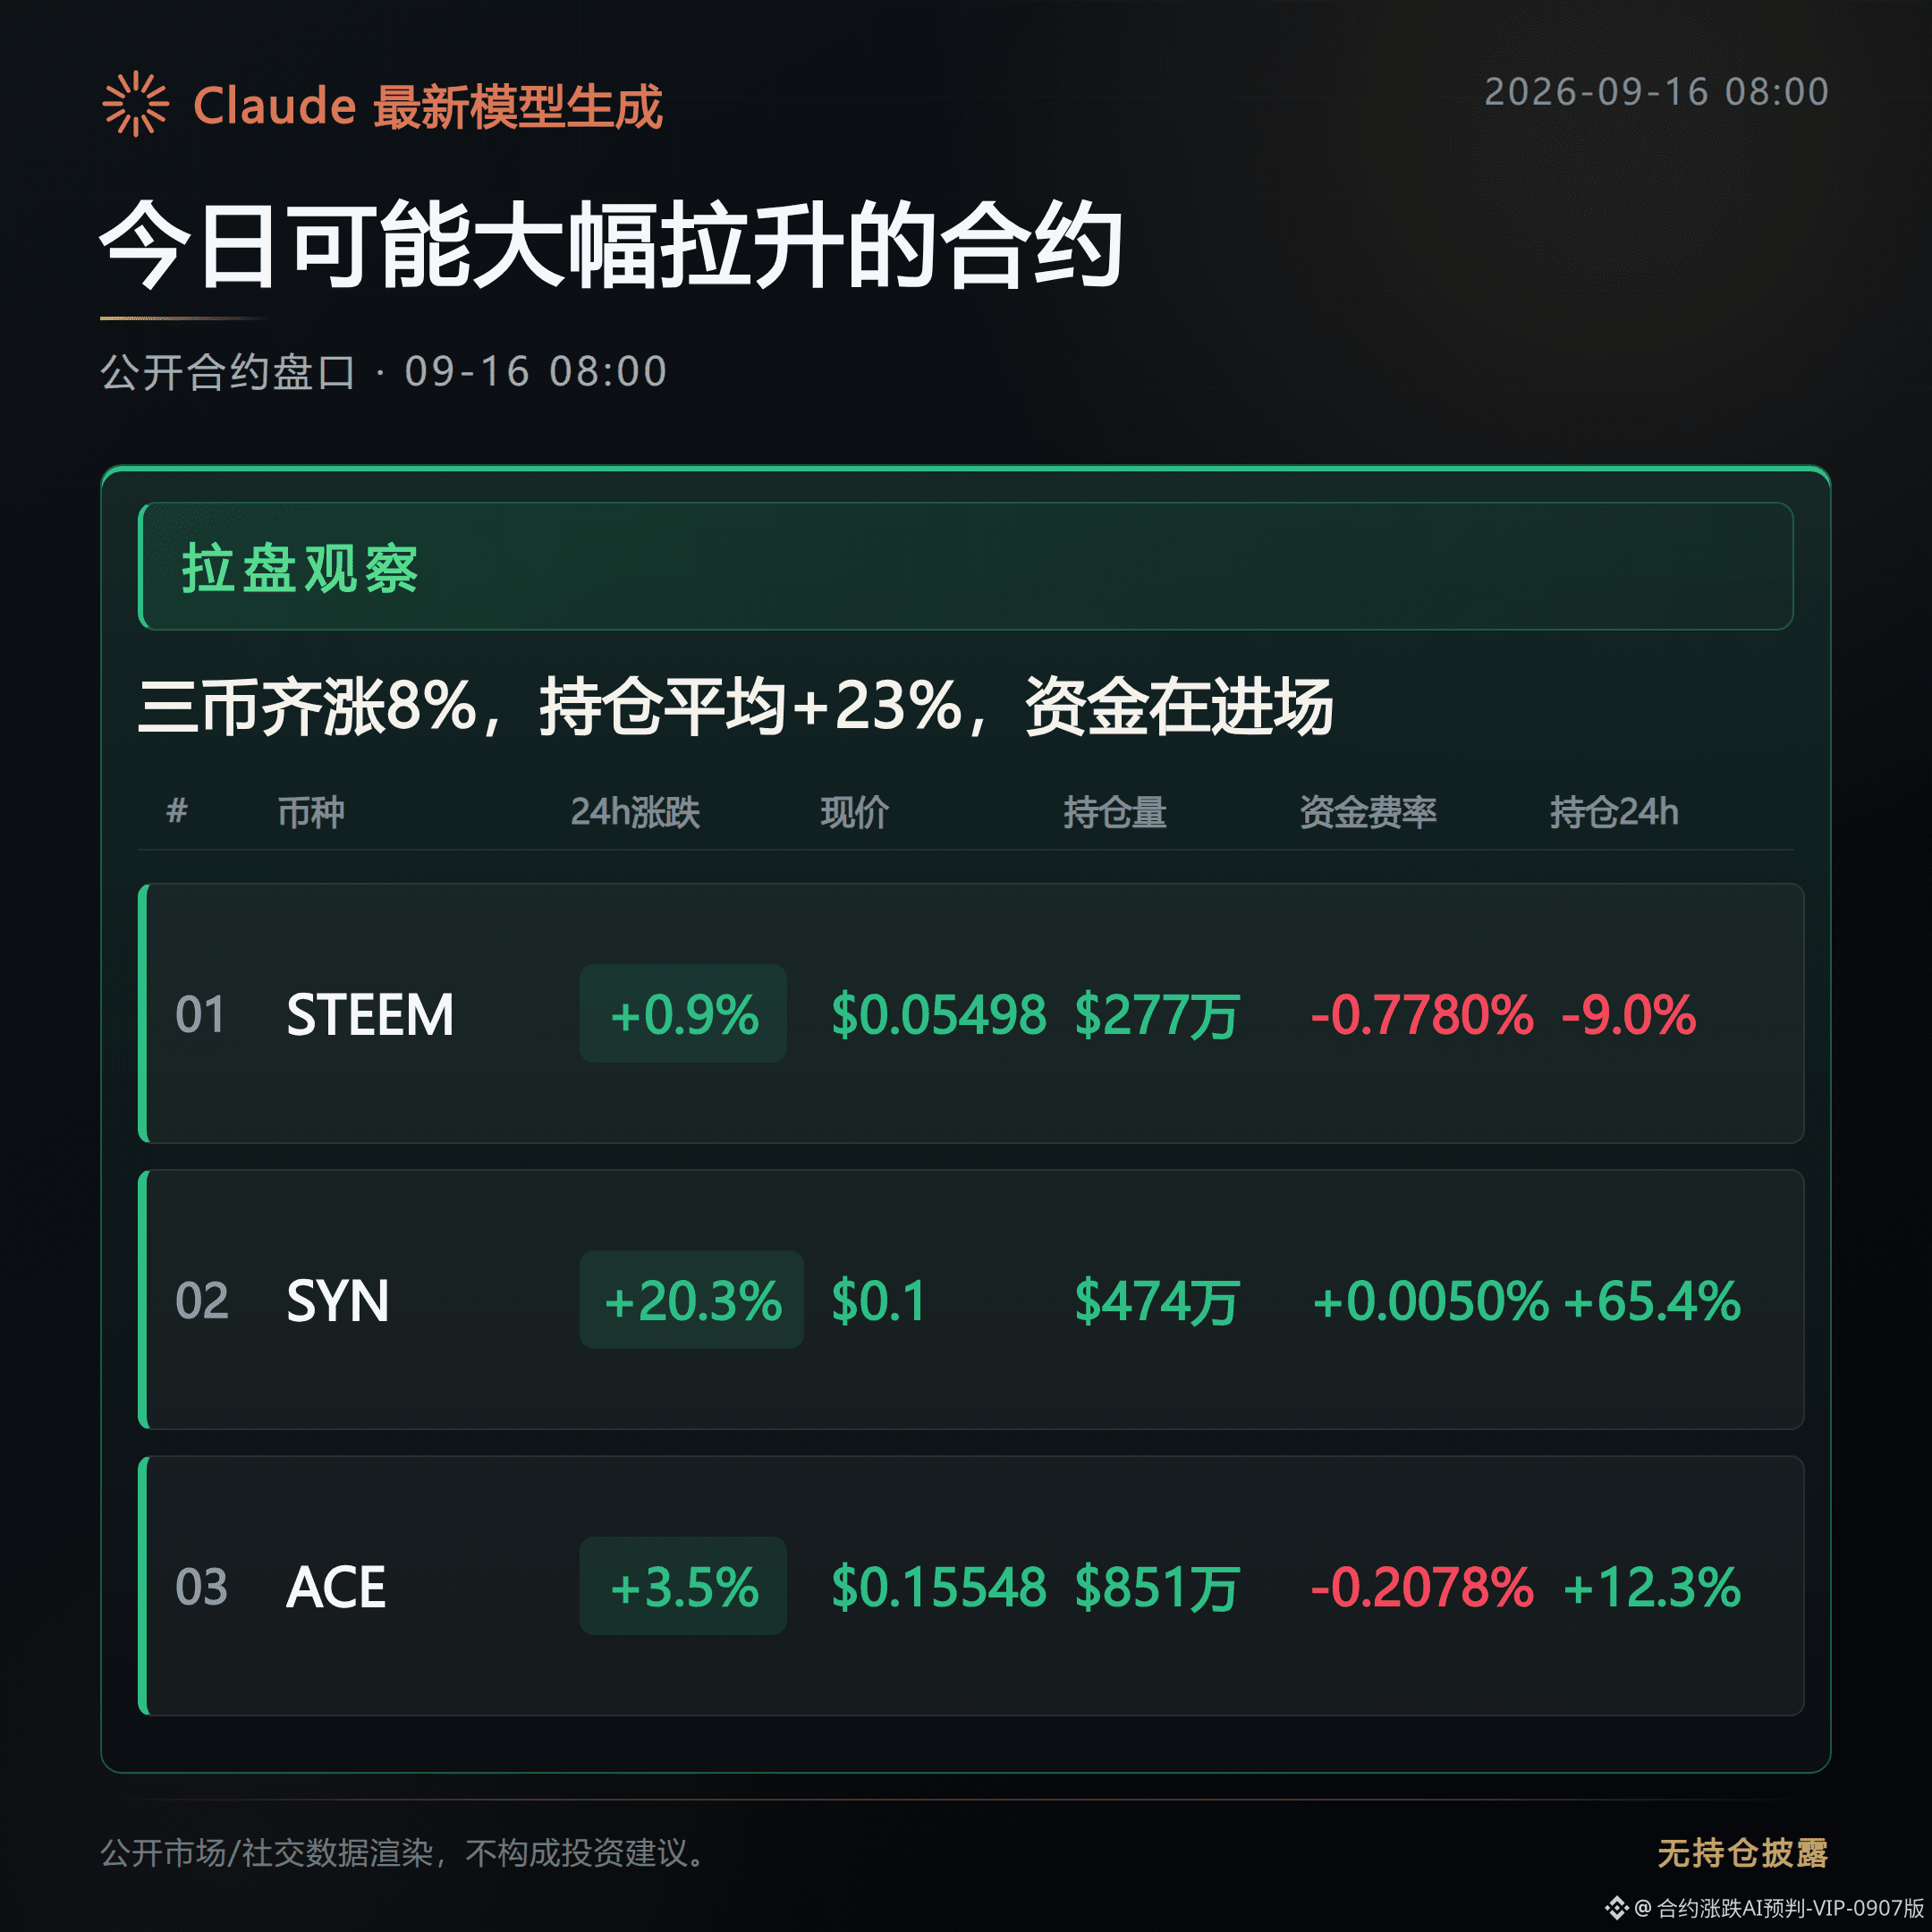
Bullish. For the three contracts STEEMUSDT, SYNUSDT, and ACEUSDT, the signals shown in the early-morning order book today all point in the same direction: the price is moving upward along the 24-hour trend, open interest is rising in step, and the active buy side is clearly stronger on some of the underlying assets.
What I’m looking at in this order book setup is whether the price and open interest can continue to move in sync.
Next, I’ll watch whether two data points—funding rate and buy/sell ratio—continue to match the price direction.
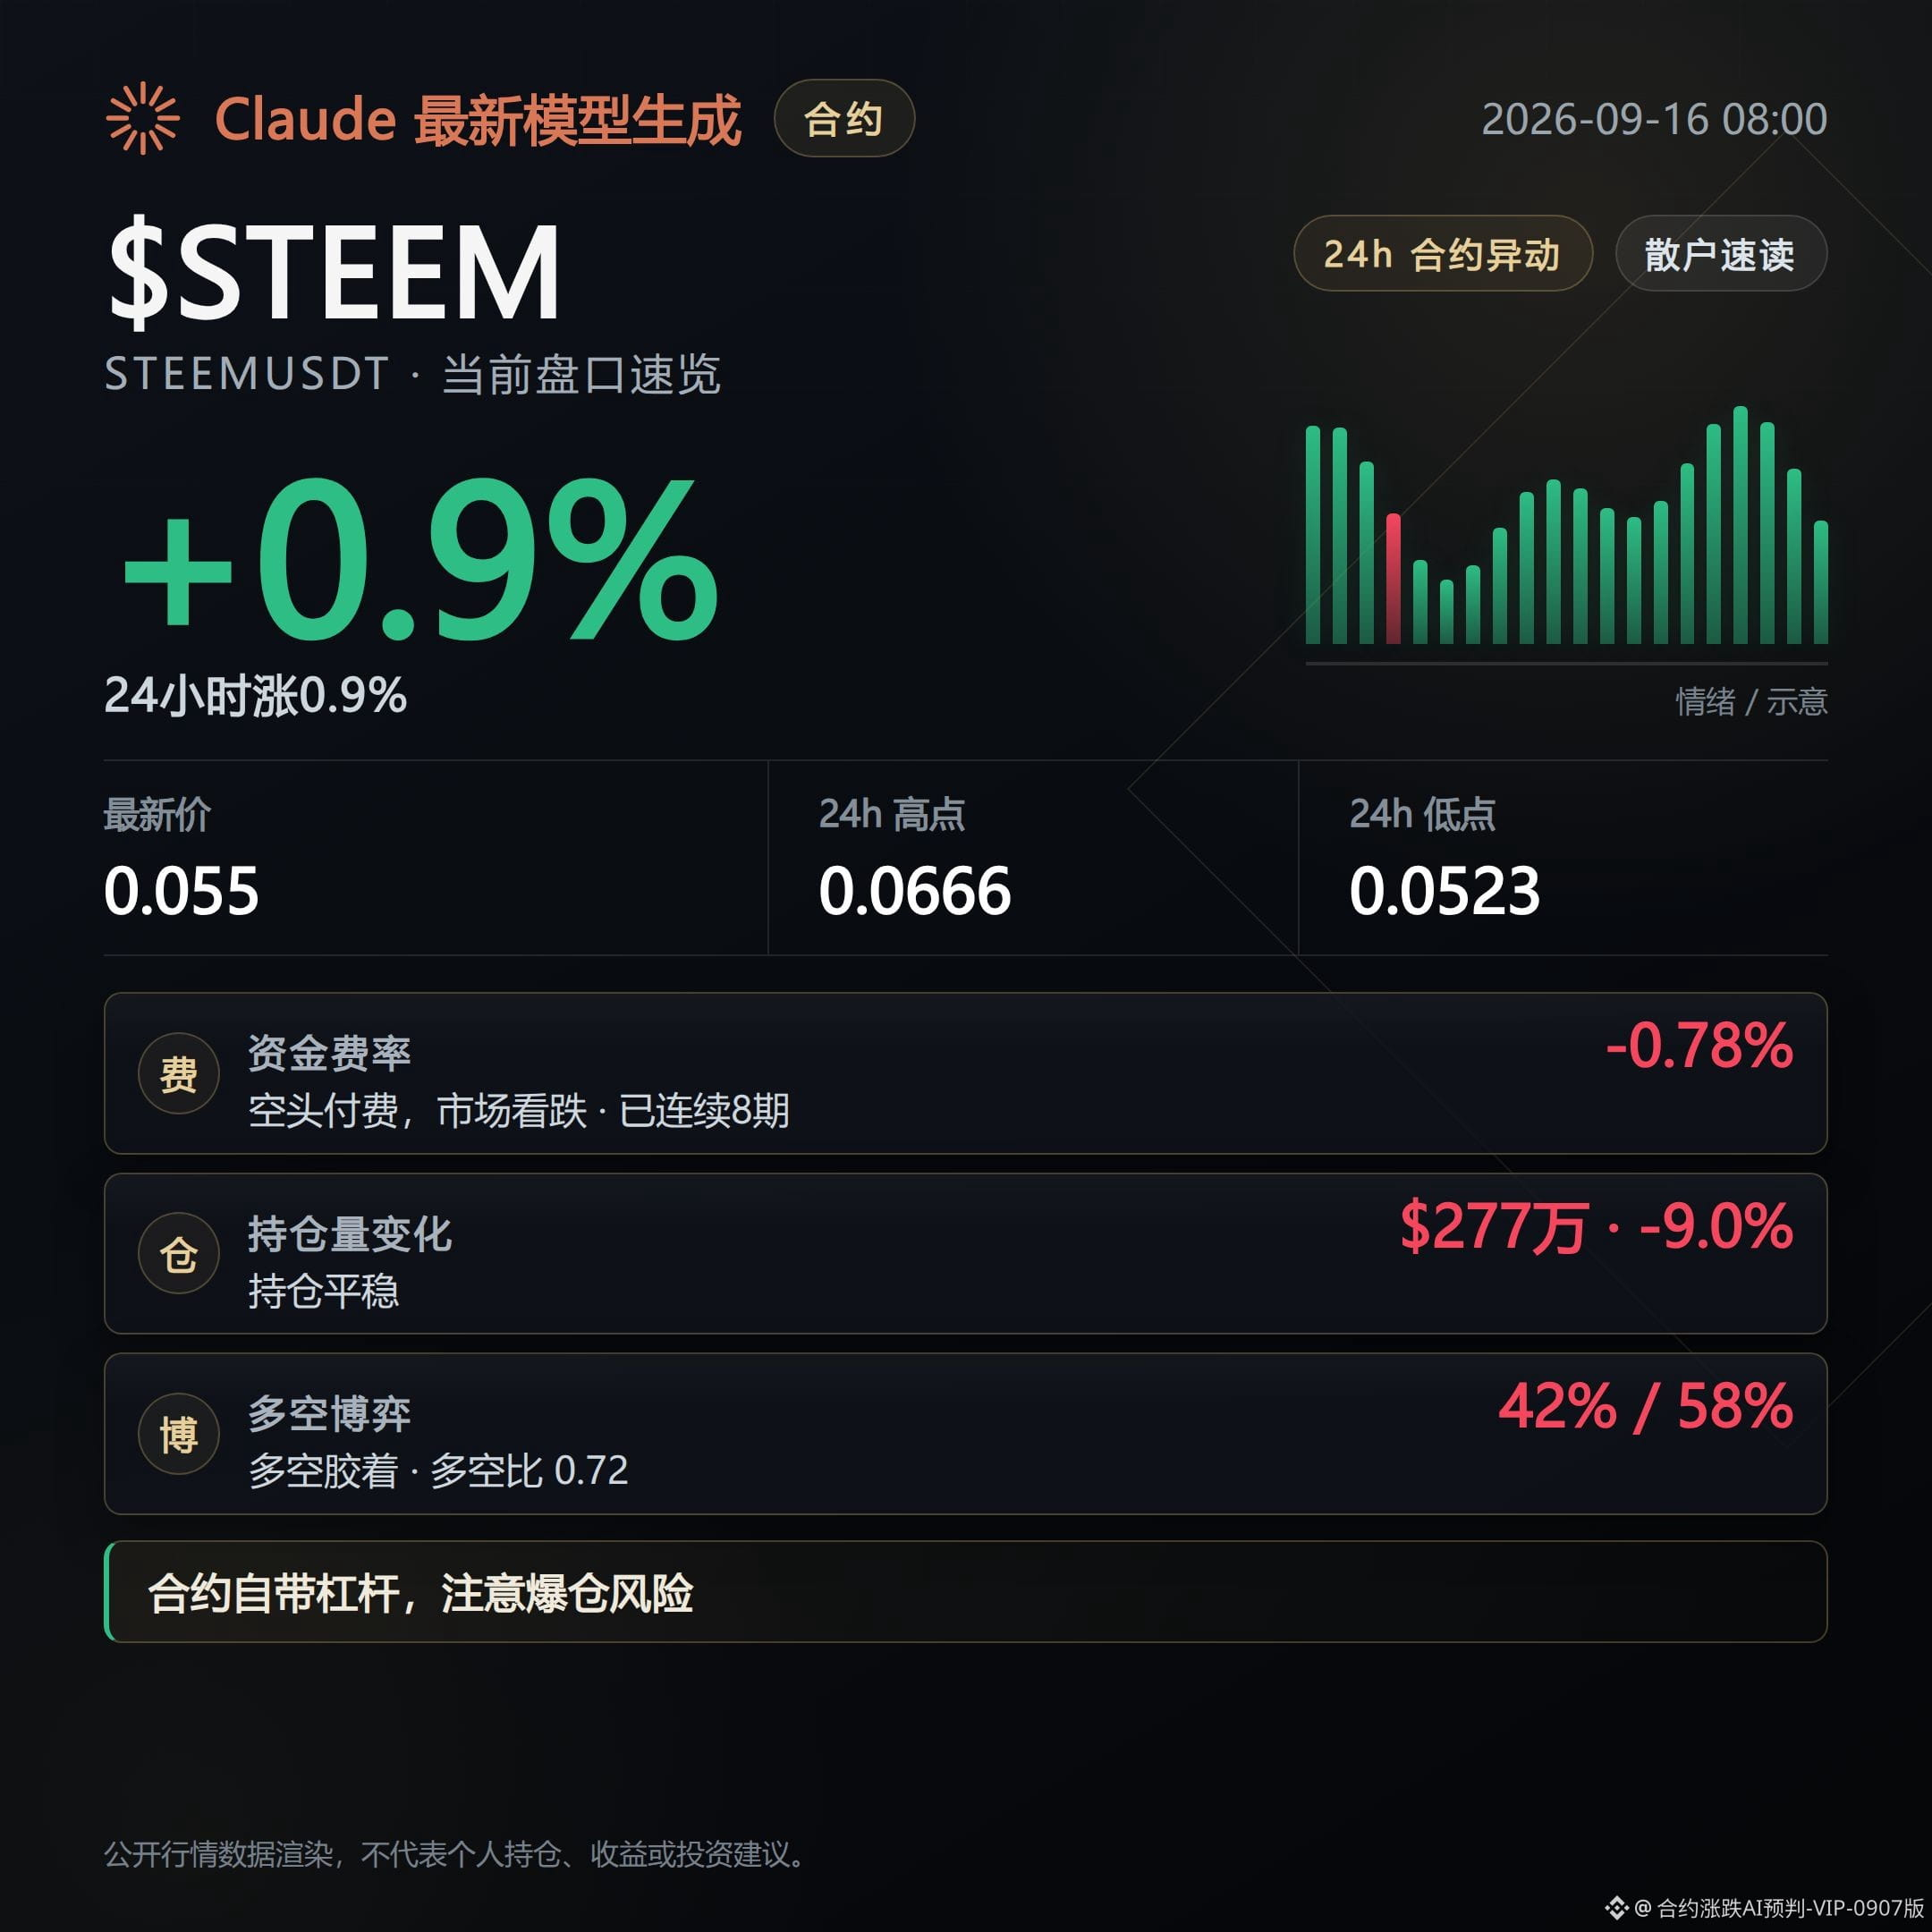
STEEMUSDT is up 0.88%, and the buy/sell ratio is 1.31, indicating the active buy side is dominant.
The funding rate has been paying shorts for 8 consecutive periods, meaning shorts have been paying the cost for their positions.
A counterpoint is that the Supertrend indicator is showing a downward move, which is not fully consistent with the price’s modest trend-following rise—this one needs an extra step of observation.
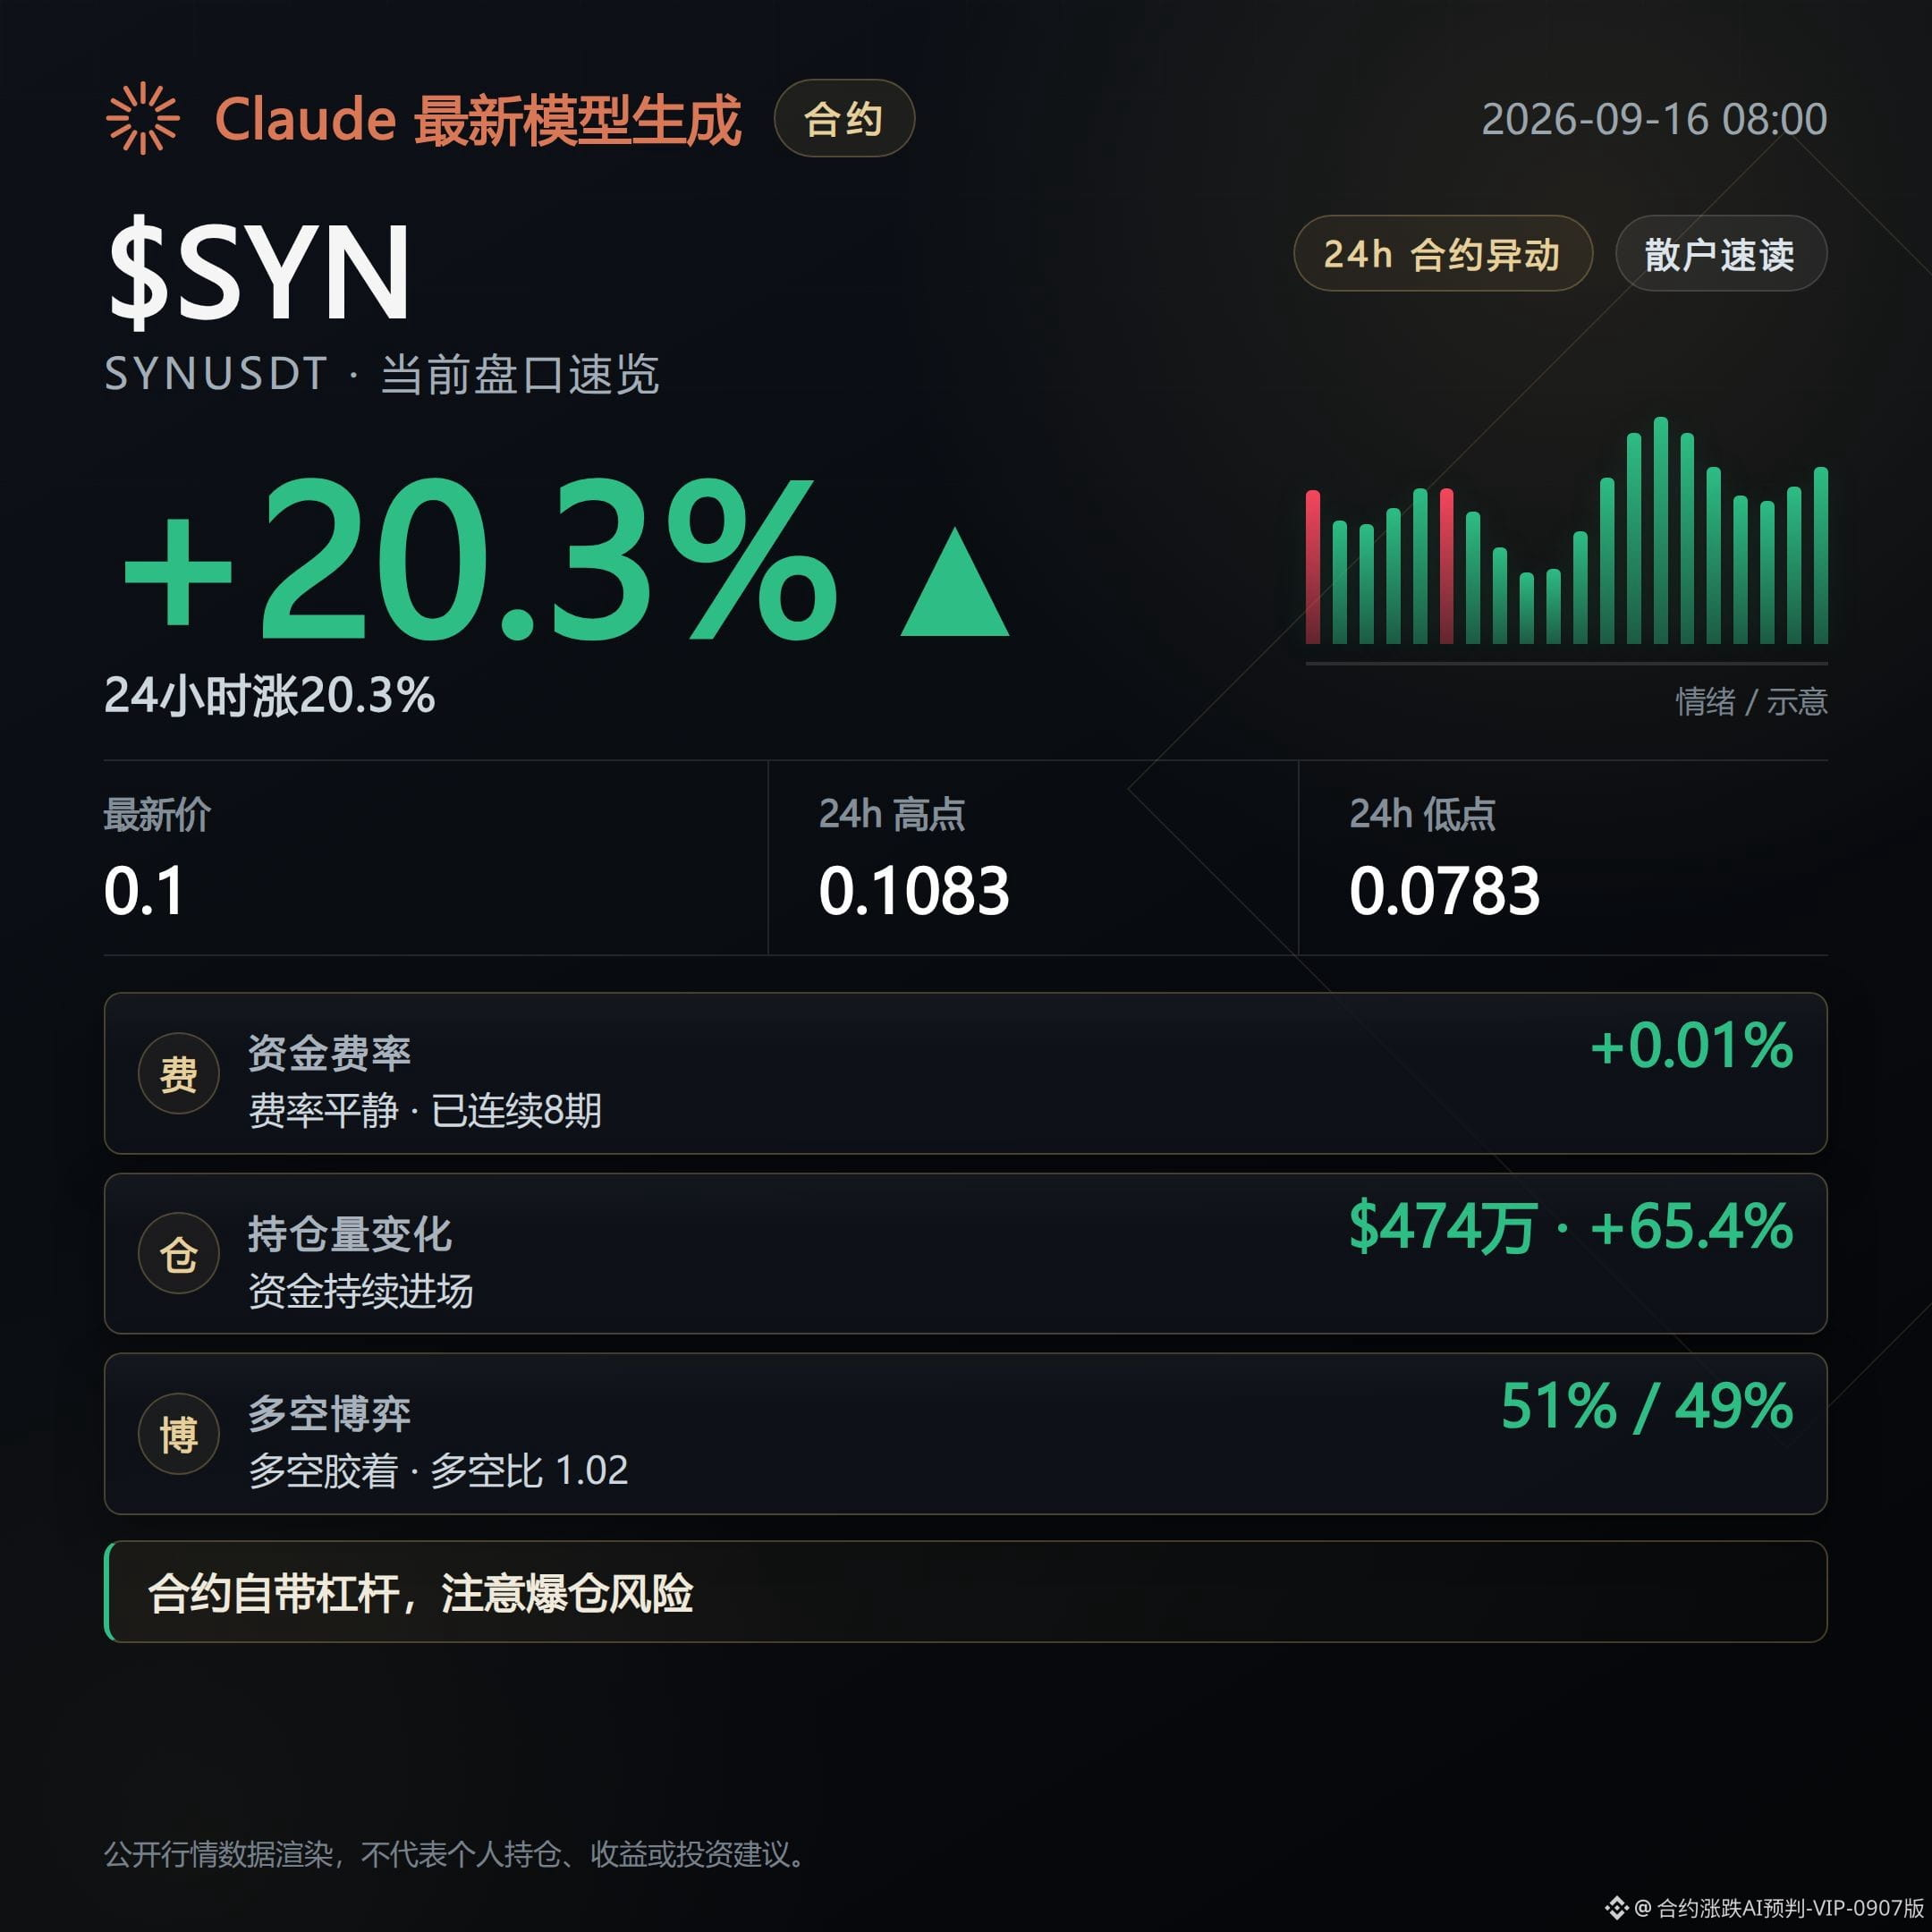
SYNUSDT has the largest increase: up 20.34% over 24 hours. Open interest has surged 65.4% in 24 hours, and it’s also adding positions within an hour (+66.3%), indicating positions are rushing in quickly.
The Supertrend shows an up move, which aligns with the price direction.
A counterpoint is that the Relative Strength indicator is already at 73.2, placing it in the overbought zone—so the upside for chasing higher should be questioned.
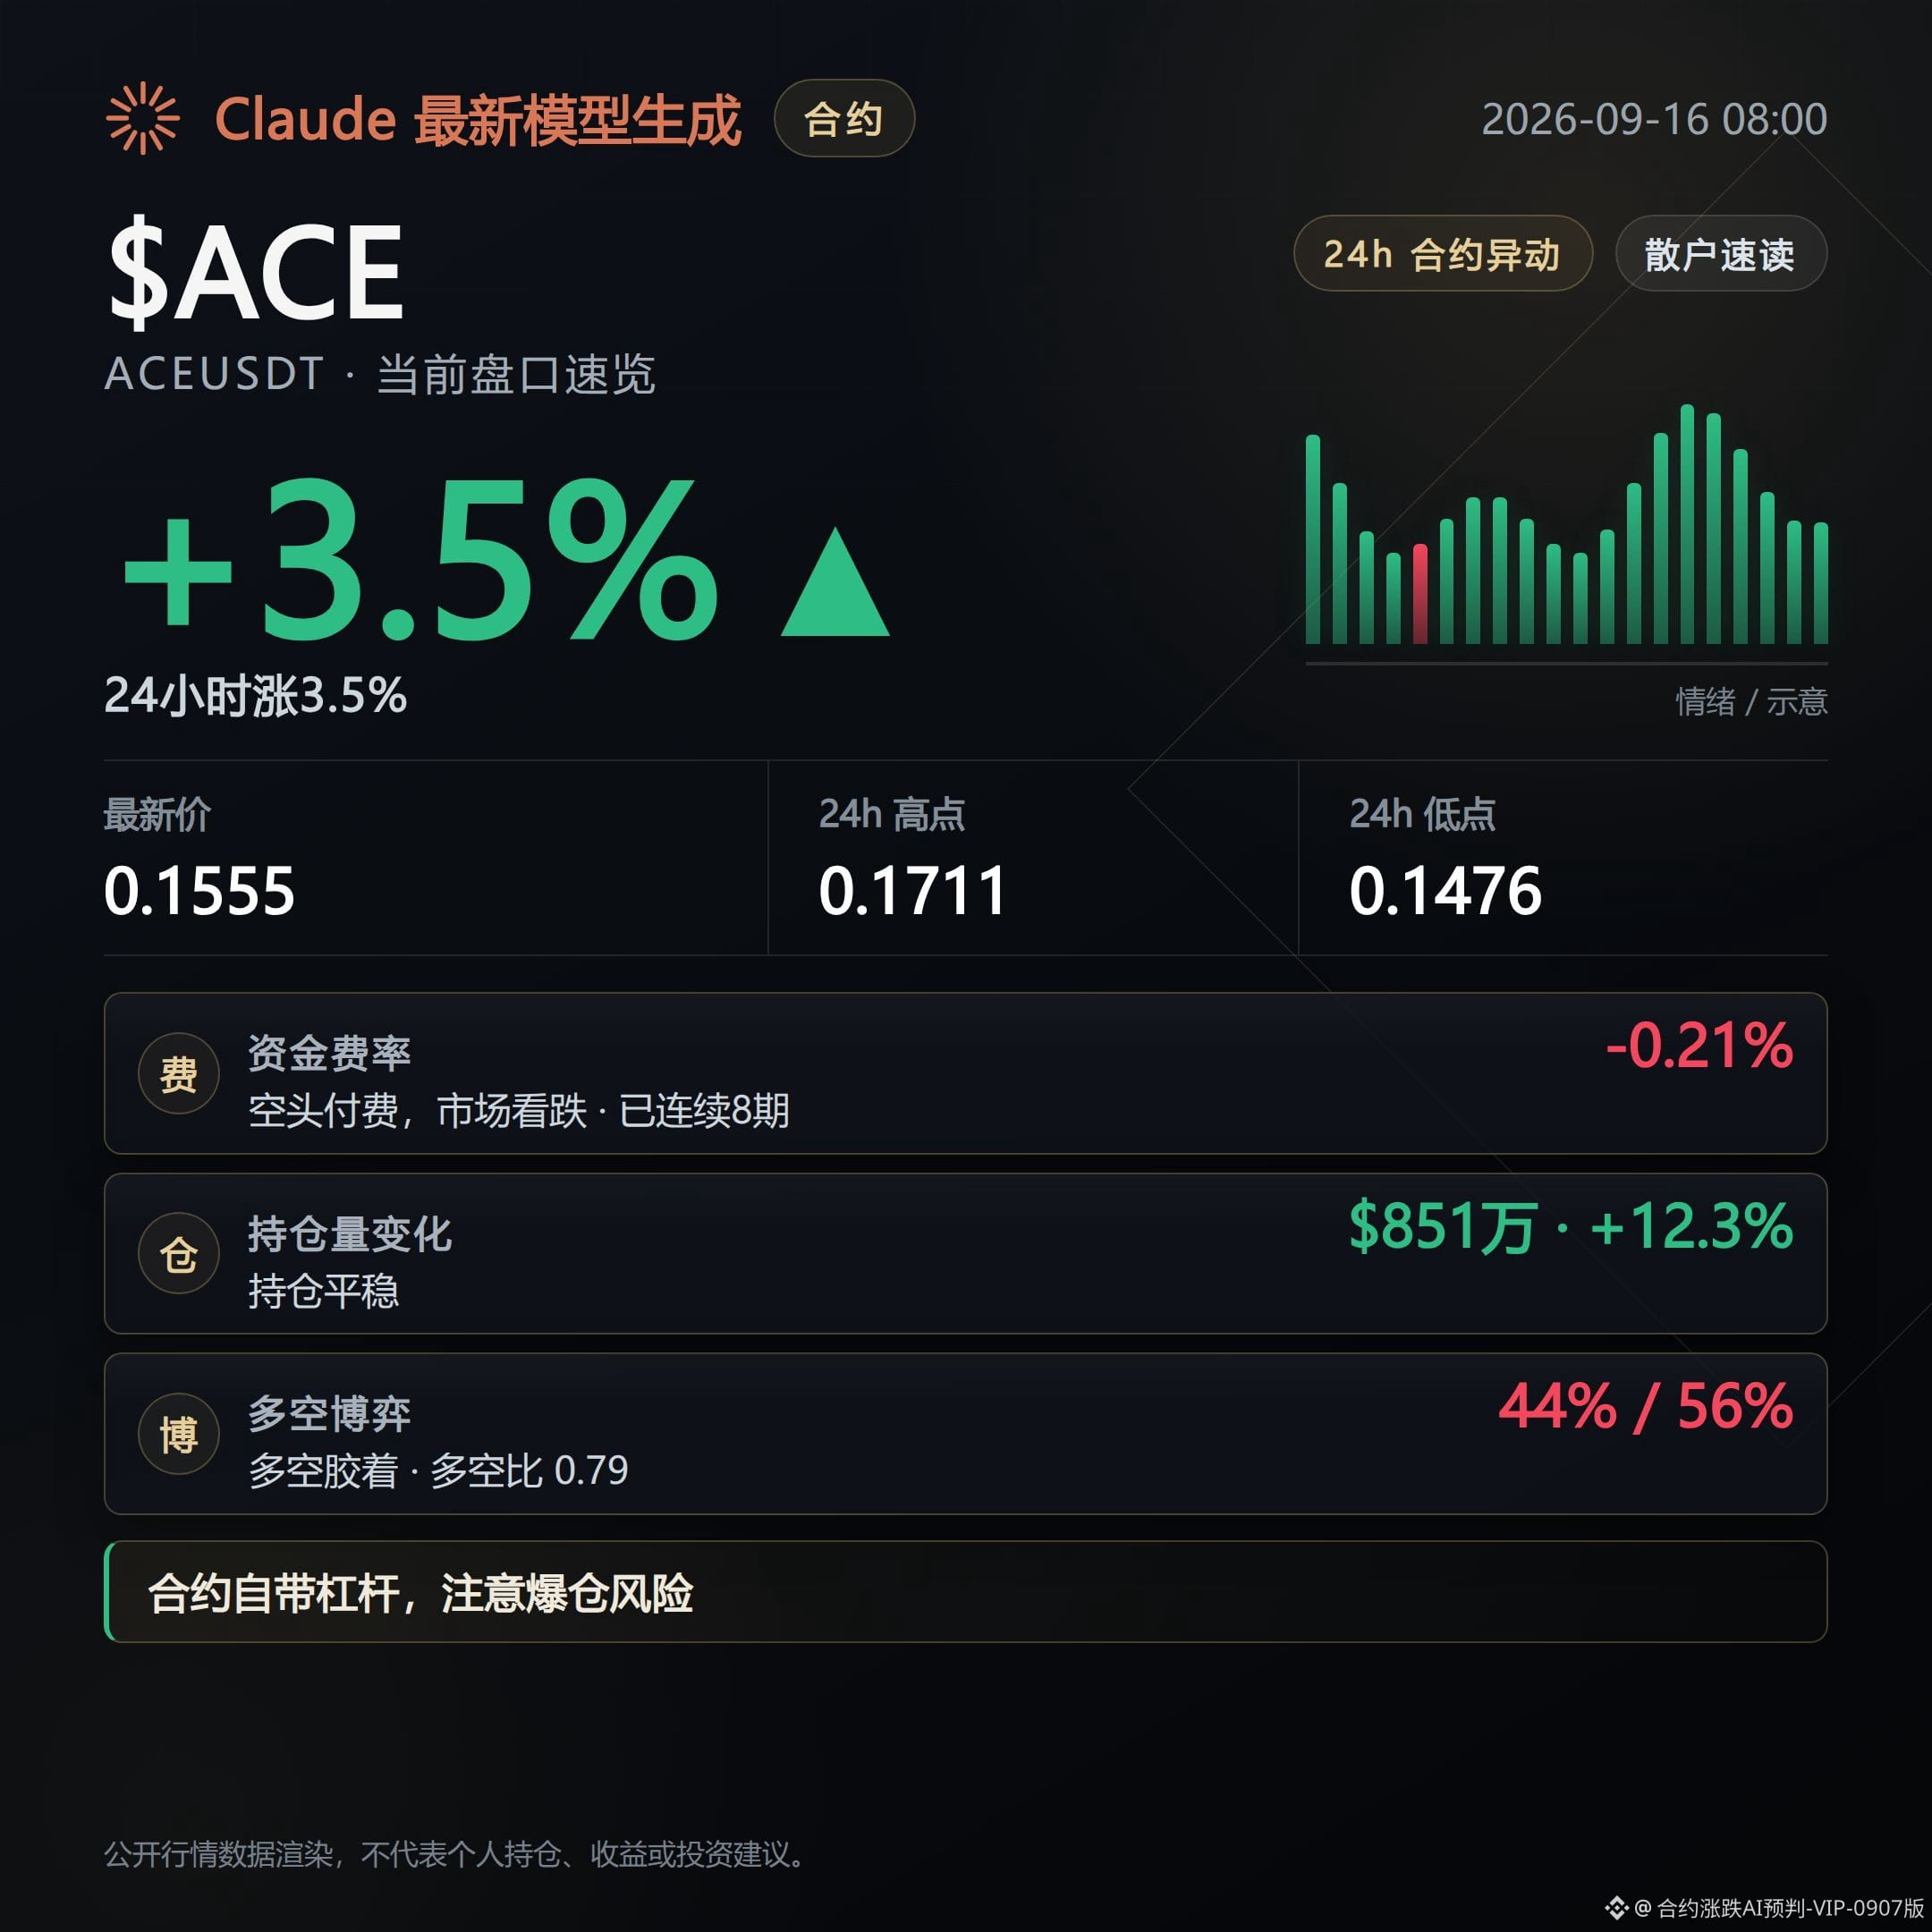
ACEUSDT is up 3.45%, open interest is up 12.3% over 24 hours, and the funding rate has been paying shorts for 8 straight periods; the order book marks it as “possible short squeeze.”
A buy/sell ratio of 0.65 suggests the active sell side is stronger, which conflicts with the “short squeeze” label—this point also needs attention.
The chips are tightening.
If the price of these three coins rises and the open interest increase can keep confirming each other, and if the buy/sell ratio continues to lean toward the active buy side, then this bullish trend line can keep going. If open interest turns and contracts, or if the buy/sell ratio shifts toward the sell side as dominant, then the direction will need to be reassessed.
#合约盘口 #STEEM #SYN #ACE
Live trading disclosure: This account currently holds $FOGO long positions; the relevant views are consistent with the actual position size.
Compiled with help from Claude Fable 5. For informational purposes only—please verify independently.
Bullish. For the three contracts STEEMUSDT, SYNUSDT, and ACEUSDT, the signals shown in the early-morning order book today all point in the same direction: the price is moving upward along the 24-hour trend, open interest is rising in step, and the active buy side is clearly stronger on some of the underlying assets.
What I’m looking at in this order book setup is whether the price and open interest can continue to move in sync.
Next, I’ll watch whether two data points—funding rate and buy/sell ratio—continue to match the price direction.
STEEMUSDT is up 0.88%, and the buy/sell ratio is 1.31, indicating the active buy side is dominant.
The funding rate has been paying shorts for 8 consecutive periods, meaning shorts have been paying the cost for their positions.
A counterpoint is that the Supertrend indicator is showing a downward move, which is not fully consistent with the price’s modest trend-following rise—this one needs an extra step of observation.
SYNUSDT has the largest increase: up 20.34% over 24 hours. Open interest has surged 65.4% in 24 hours, and it’s also adding positions within an hour (+66.3%), indicating positions are rushing in quickly.
The Supertrend shows an up move, which aligns with the price direction.
A counterpoint is that the Relative Strength indicator is already at 73.2, placing it in the overbought zone—so the upside for chasing higher should be questioned.
ACEUSDT is up 3.45%, open interest is up 12.3% over 24 hours, and the funding rate has been paying shorts for 8 straight periods; the order book marks it as “possible short squeeze.”
A buy/sell ratio of 0.65 suggests the active sell side is stronger, which conflicts with the “short squeeze” label—this point also needs attention.
The chips are tightening.
If the price of these three coins rises and the open interest increase can keep confirming each other, and if the buy/sell ratio continues to lean toward the active buy side, then this bullish trend line can keep going. If open interest turns and contracts, or if the buy/sell ratio shifts toward the sell side as dominant, then the direction will need to be reassessed.
#合约盘口 #STEEM #SYN #ACE
Live trading disclosure: This account currently holds $FOGO long positions; the relevant views are consistent with the actual position size.
Compiled with help from Claude Fable 5. For informational purposes only—please verify independently.
What I’m looking at in this order book setup is whether the price and open interest can continue to move in sync.
Next, I’ll watch whether two data points—funding rate and buy/sell ratio—continue to match the price direction.
STEEMUSDT is up 0.88%, and the buy/sell ratio is 1.31, indicating the active buy side is dominant.
The funding rate has been paying shorts for 8 consecutive periods, meaning shorts have been paying the cost for their positions.
A counterpoint is that the Supertrend indicator is showing a downward move, which is not fully consistent with the price’s modest trend-following rise—this one needs an extra step of observation.
SYNUSDT has the largest increase: up 20.34% over 24 hours. Open interest has surged 65.4% in 24 hours, and it’s also adding positions within an hour (+66.3%), indicating positions are rushing in quickly.
The Supertrend shows an up move, which aligns with the price direction.
A counterpoint is that the Relative Strength indicator is already at 73.2, placing it in the overbought zone—so the upside for chasing higher should be questioned.
ACEUSDT is up 3.45%, open interest is up 12.3% over 24 hours, and the funding rate has been paying shorts for 8 straight periods; the order book marks it as “possible short squeeze.”
A buy/sell ratio of 0.65 suggests the active sell side is stronger, which conflicts with the “short squeeze” label—this point also needs attention.
The chips are tightening.
If the price of these three coins rises and the open interest increase can keep confirming each other, and if the buy/sell ratio continues to lean toward the active buy side, then this bullish trend line can keep going. If open interest turns and contracts, or if the buy/sell ratio shifts toward the sell side as dominant, then the direction will need to be reassessed.
#合约盘口 #STEEM #SYN #ACE
Live trading disclosure: This account currently holds $FOGO long positions; the relevant views are consistent with the actual position size.
Compiled with help from Claude Fable 5. For informational purposes only—please verify independently.
657
Contract Order Book Daily Report|9/16 Yesterday’s short-ETH signals came true, and the whole market followed with further declines
At this point yesterday, the funding rate just turned negative, and big players were adding shorts on Ethereum. They said this signal should be watched for another day.
Today we verified it: the $ETH funding rate is still negative, at -0.15%.
In the past 24 hours, the price dropped 5.35% to 2396.99, and the shorts really did take a solid bite of profit this round.
$BTC didn’t follow this script.
Down 3.63% in the past 24 hours to 75680.5, yet the funding rate flipped positive to 0.49%. The longs are still paying, propping things up at a cost.
When price falls but the funding rate rises, it suggests the main force behind this sell-off isn’t the original long positions cutting and dumping. It looks more like shorts are pushing the price down while longs are hard-fighting to hold. Neither side has conceded, and the money is still trapped in the market—no one has fully left.
Open interest stands at $8.142 billion, down only 0.2% over 24 hours. Positions haven’t been largely broken up by forced liquidations.
Longs still make up 64%, but passive sell orders dominate. The positioning structure doesn’t match the direction of actual executed trades. This kind of divergence usually indicates energy being accumulated—not the end of the move.
With the market down this much, the Fear & Greed Index is still stuck at 69—greed hasn’t moved.
Sentiment hasn’t caved in along with the price, which means leverage hasn’t truly exited. There are still people betting on a rebound inside the venue. If the rebound fails, the room for further “follow-through” declines will open.
The broader environment also didn’t provide relief.
That procedural vote in the Senate on crypto market structure legislation failed to pass. The 60-vote threshold wasn’t met, getting stuck on an ethical dispute tied to Trump himself and crypto wealth. Once the news broke, related concept stocks weakened on the spot.
What’s even more painful is that Wall Street has been positioning over the past couple of days for the next move from the Fed: rate hikes, not cuts. The probability implied by market forecasts is approaching 90%. Combined with the 10-year US Treasury yield climbing to 5.04%—a high since 2007—the signals of tightening liquidity are getting clearer by the day.
In smaller-cap coin futures, ASTR, CVC, and SHAZ funding rates are negative and below -1%, meaning shorts are packed to the extreme. A reversal in the wind direction could trigger a short-squeeze行情;
LYTE, SIREN, and ON funding rates have turned positive, and longs are quietly stacking positions too—neither side is in a safe zone.
Next, just watch one thing: whether this bearish ETH signal will transmit to Bitcoin. Once the funding rate synchronizes and turns negative, that would mark the start of a full-market coordinated downside move.
#合约资金费率 #Order Book Volatility
Live record: At present, this account holds $FOGO long contracts. As long as the logic hasn’t changed, the position will be kept.
This content was assisted and generated with Claude Fable 5 for reference only. Please verify independently.
Contract Order Book Daily Report|9/16 Yesterday’s short-ETH signals came true, and the whole market followed with further declines
At this point yesterday, the funding rate just turned negative, and big players were adding shorts on Ethereum. They said this signal should be watched for another day.
Today we verified it: the $ETH funding rate is still negative, at -0.15%.
In the past 24 hours, the price dropped 5.35% to 2396.99, and the shorts really did take a solid bite of profit this round.
$BTC didn’t follow this script.
Down 3.63% in the past 24 hours to 75680.5, yet the funding rate flipped positive to 0.49%. The longs are still paying, propping things up at a cost.
When price falls but the funding rate rises, it suggests the main force behind this sell-off isn’t the original long positions cutting and dumping. It looks more like shorts are pushing the price down while longs are hard-fighting to hold. Neither side has conceded, and the money is still trapped in the market—no one has fully left.
Open interest stands at $8.142 billion, down only 0.2% over 24 hours. Positions haven’t been largely broken up by forced liquidations.
Longs still make up 64%, but passive sell orders dominate. The positioning structure doesn’t match the direction of actual executed trades. This kind of divergence usually indicates energy being accumulated—not the end of the move.
With the market down this much, the Fear & Greed Index is still stuck at 69—greed hasn’t moved.
Sentiment hasn’t caved in along with the price, which means leverage hasn’t truly exited. There are still people betting on a rebound inside the venue. If the rebound fails, the room for further “follow-through” declines will open.
The broader environment also didn’t provide relief.
That procedural vote in the Senate on crypto market structure legislation failed to pass. The 60-vote threshold wasn’t met, getting stuck on an ethical dispute tied to Trump himself and crypto wealth. Once the news broke, related concept stocks weakened on the spot.
What’s even more painful is that Wall Street has been positioning over the past couple of days for the next move from the Fed: rate hikes, not cuts. The probability implied by market forecasts is approaching 90%. Combined with the 10-year US Treasury yield climbing to 5.04%—a high since 2007—the signals of tightening liquidity are getting clearer by the day.
In smaller-cap coin futures, ASTR, CVC, and SHAZ funding rates are negative and below -1%, meaning shorts are packed to the extreme. A reversal in the wind direction could trigger a short-squeeze行情;
LYTE, SIREN, and ON funding rates have turned positive, and longs are quietly stacking positions too—neither side is in a safe zone.
Next, just watch one thing: whether this bearish ETH signal will transmit to Bitcoin. Once the funding rate synchronizes and turns negative, that would mark the start of a full-market coordinated downside move.
#合约资金费率 #Order Book Volatility
Live record: At present, this account holds $FOGO long contracts. As long as the logic hasn’t changed, the position will be kept.
This content was assisted and generated with Claude Fable 5 for reference only. Please verify independently.
At this point yesterday, the funding rate just turned negative, and big players were adding shorts on Ethereum. They said this signal should be watched for another day.
Today we verified it: the $ETH funding rate is still negative, at -0.15%.
In the past 24 hours, the price dropped 5.35% to 2396.99, and the shorts really did take a solid bite of profit this round.
$BTC didn’t follow this script.
Down 3.63% in the past 24 hours to 75680.5, yet the funding rate flipped positive to 0.49%. The longs are still paying, propping things up at a cost.
When price falls but the funding rate rises, it suggests the main force behind this sell-off isn’t the original long positions cutting and dumping. It looks more like shorts are pushing the price down while longs are hard-fighting to hold. Neither side has conceded, and the money is still trapped in the market—no one has fully left.
Open interest stands at $8.142 billion, down only 0.2% over 24 hours. Positions haven’t been largely broken up by forced liquidations.
Longs still make up 64%, but passive sell orders dominate. The positioning structure doesn’t match the direction of actual executed trades. This kind of divergence usually indicates energy being accumulated—not the end of the move.
With the market down this much, the Fear & Greed Index is still stuck at 69—greed hasn’t moved.
Sentiment hasn’t caved in along with the price, which means leverage hasn’t truly exited. There are still people betting on a rebound inside the venue. If the rebound fails, the room for further “follow-through” declines will open.
The broader environment also didn’t provide relief.
That procedural vote in the Senate on crypto market structure legislation failed to pass. The 60-vote threshold wasn’t met, getting stuck on an ethical dispute tied to Trump himself and crypto wealth. Once the news broke, related concept stocks weakened on the spot.
What’s even more painful is that Wall Street has been positioning over the past couple of days for the next move from the Fed: rate hikes, not cuts. The probability implied by market forecasts is approaching 90%. Combined with the 10-year US Treasury yield climbing to 5.04%—a high since 2007—the signals of tightening liquidity are getting clearer by the day.
In smaller-cap coin futures, ASTR, CVC, and SHAZ funding rates are negative and below -1%, meaning shorts are packed to the extreme. A reversal in the wind direction could trigger a short-squeeze行情;
LYTE, SIREN, and ON funding rates have turned positive, and longs are quietly stacking positions too—neither side is in a safe zone.
Next, just watch one thing: whether this bearish ETH signal will transmit to Bitcoin. Once the funding rate synchronizes and turns negative, that would mark the start of a full-market coordinated downside move.
#合约资金费率 #Order Book Volatility
Live record: At present, this account holds $FOGO long contracts. As long as the logic hasn’t changed, the position will be kept.
This content was assisted and generated with Claude Fable 5 for reference only. Please verify independently.
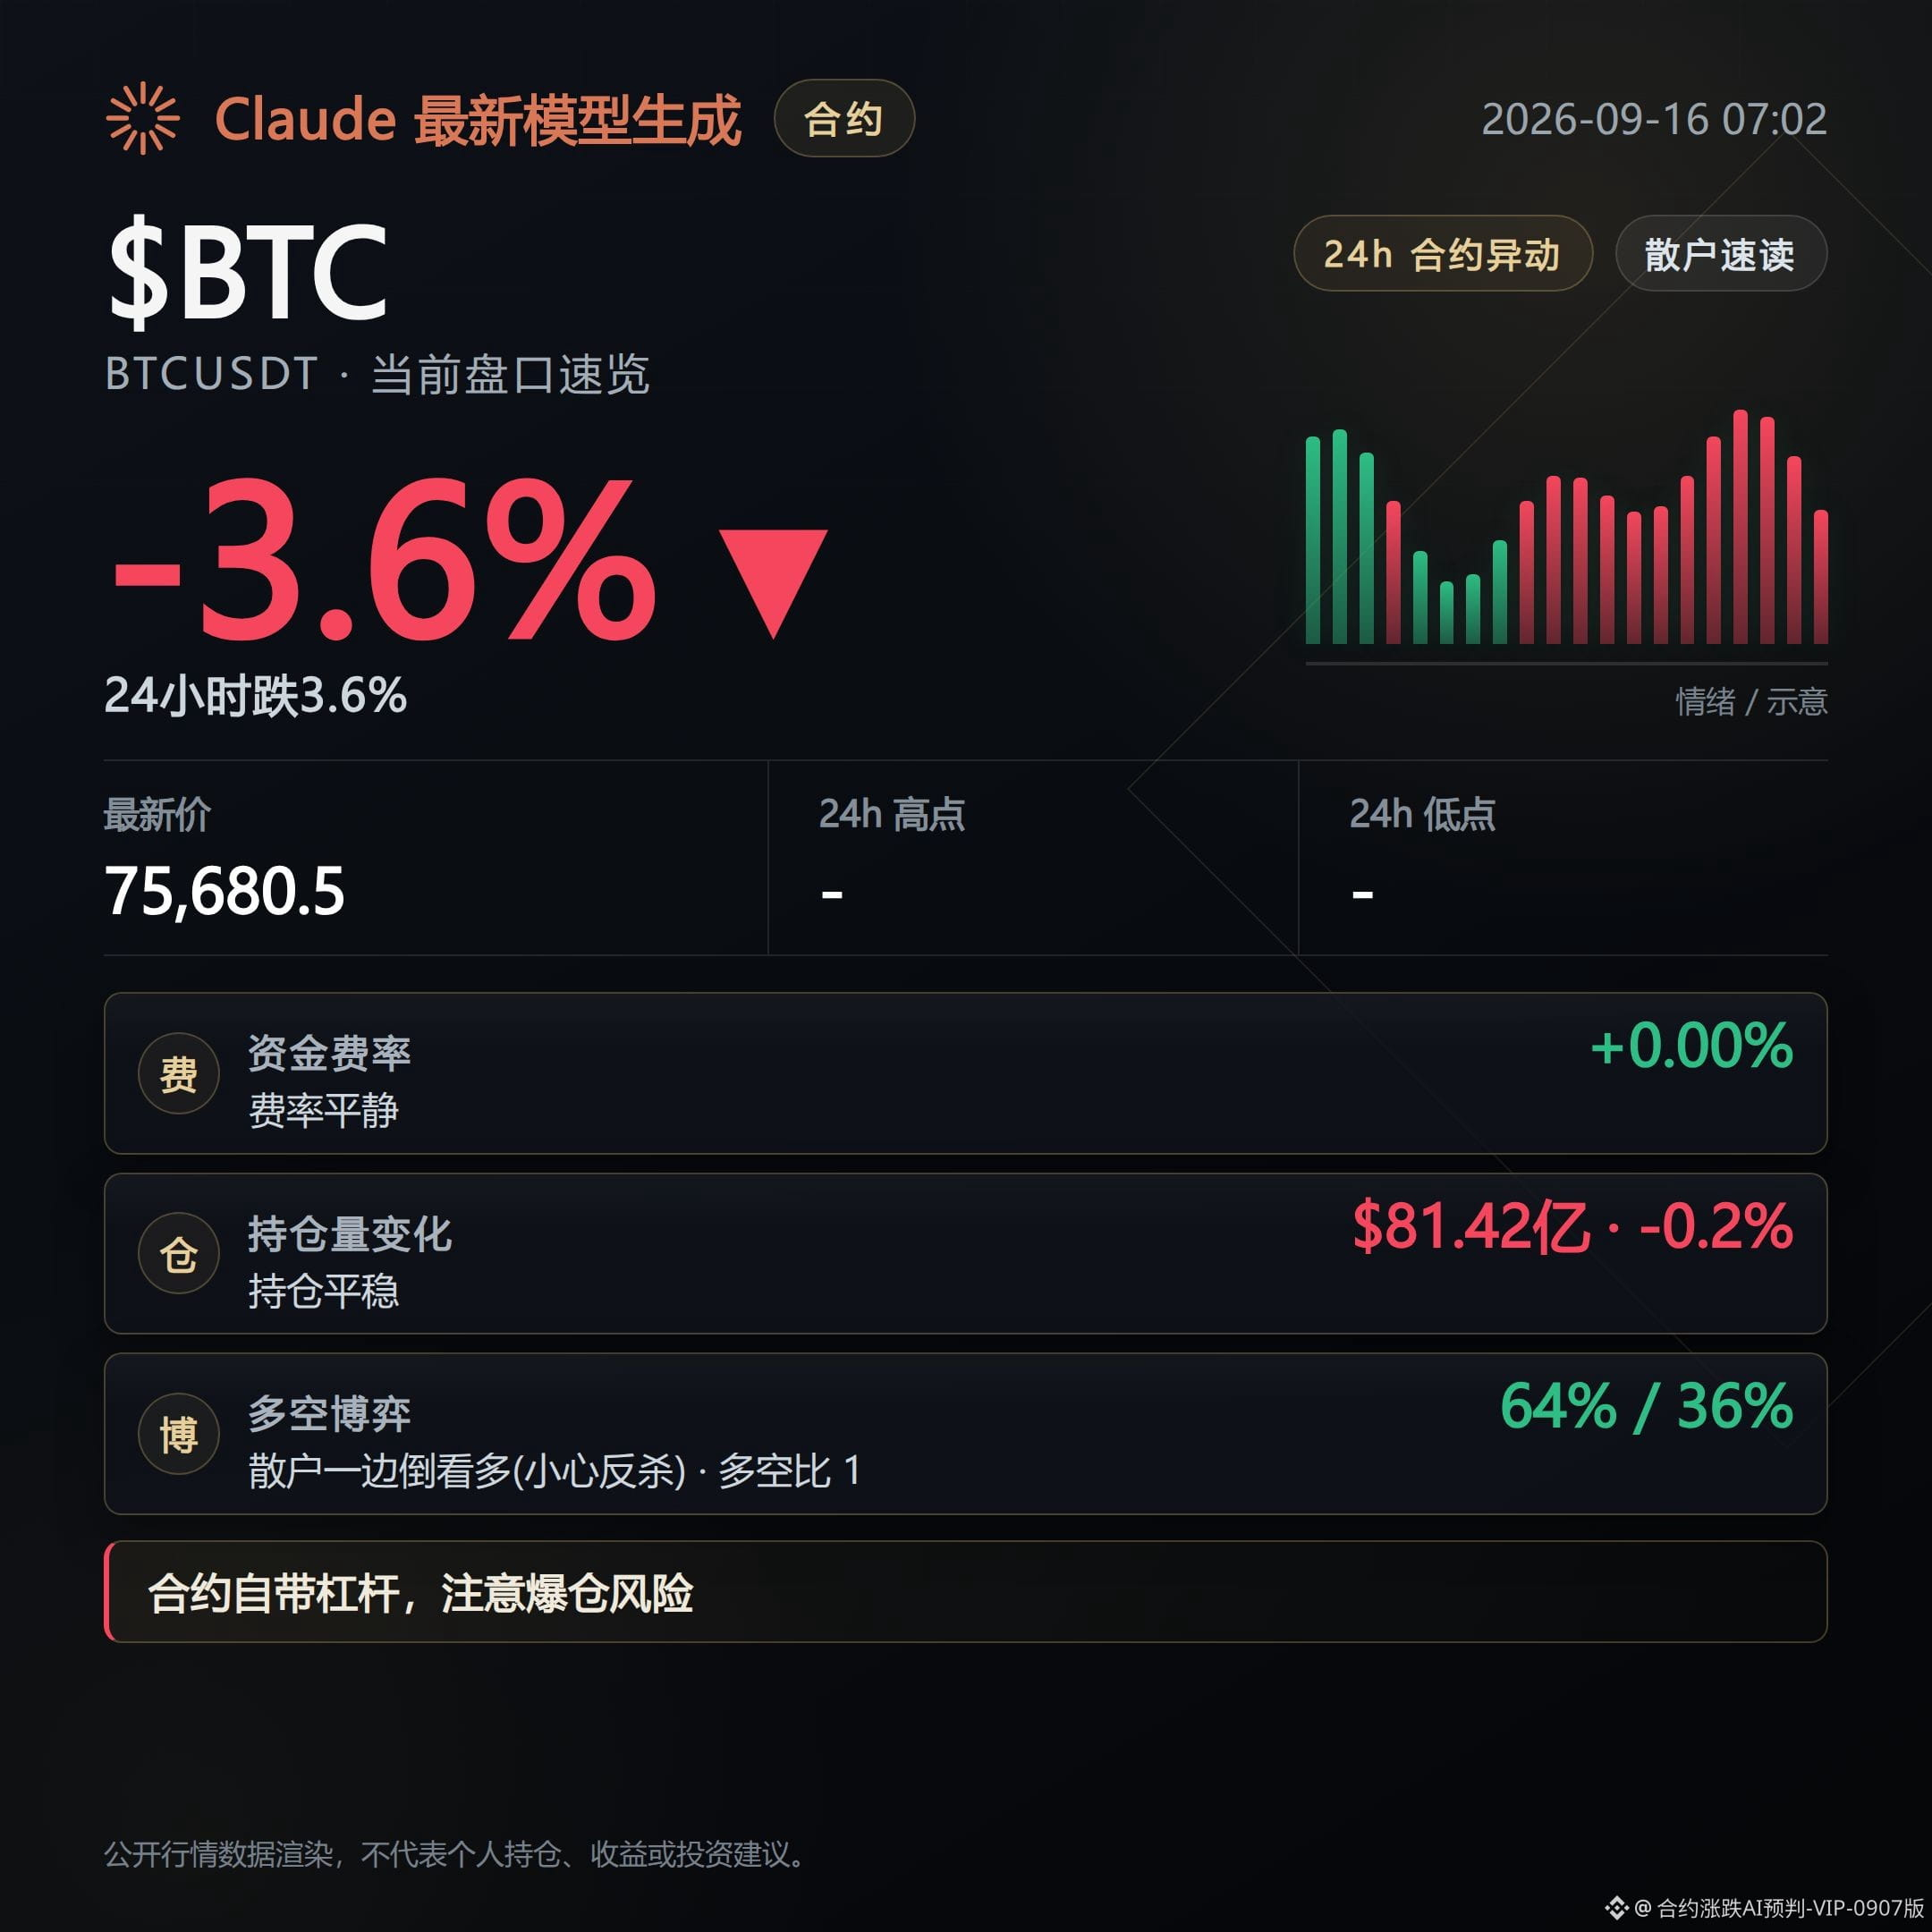
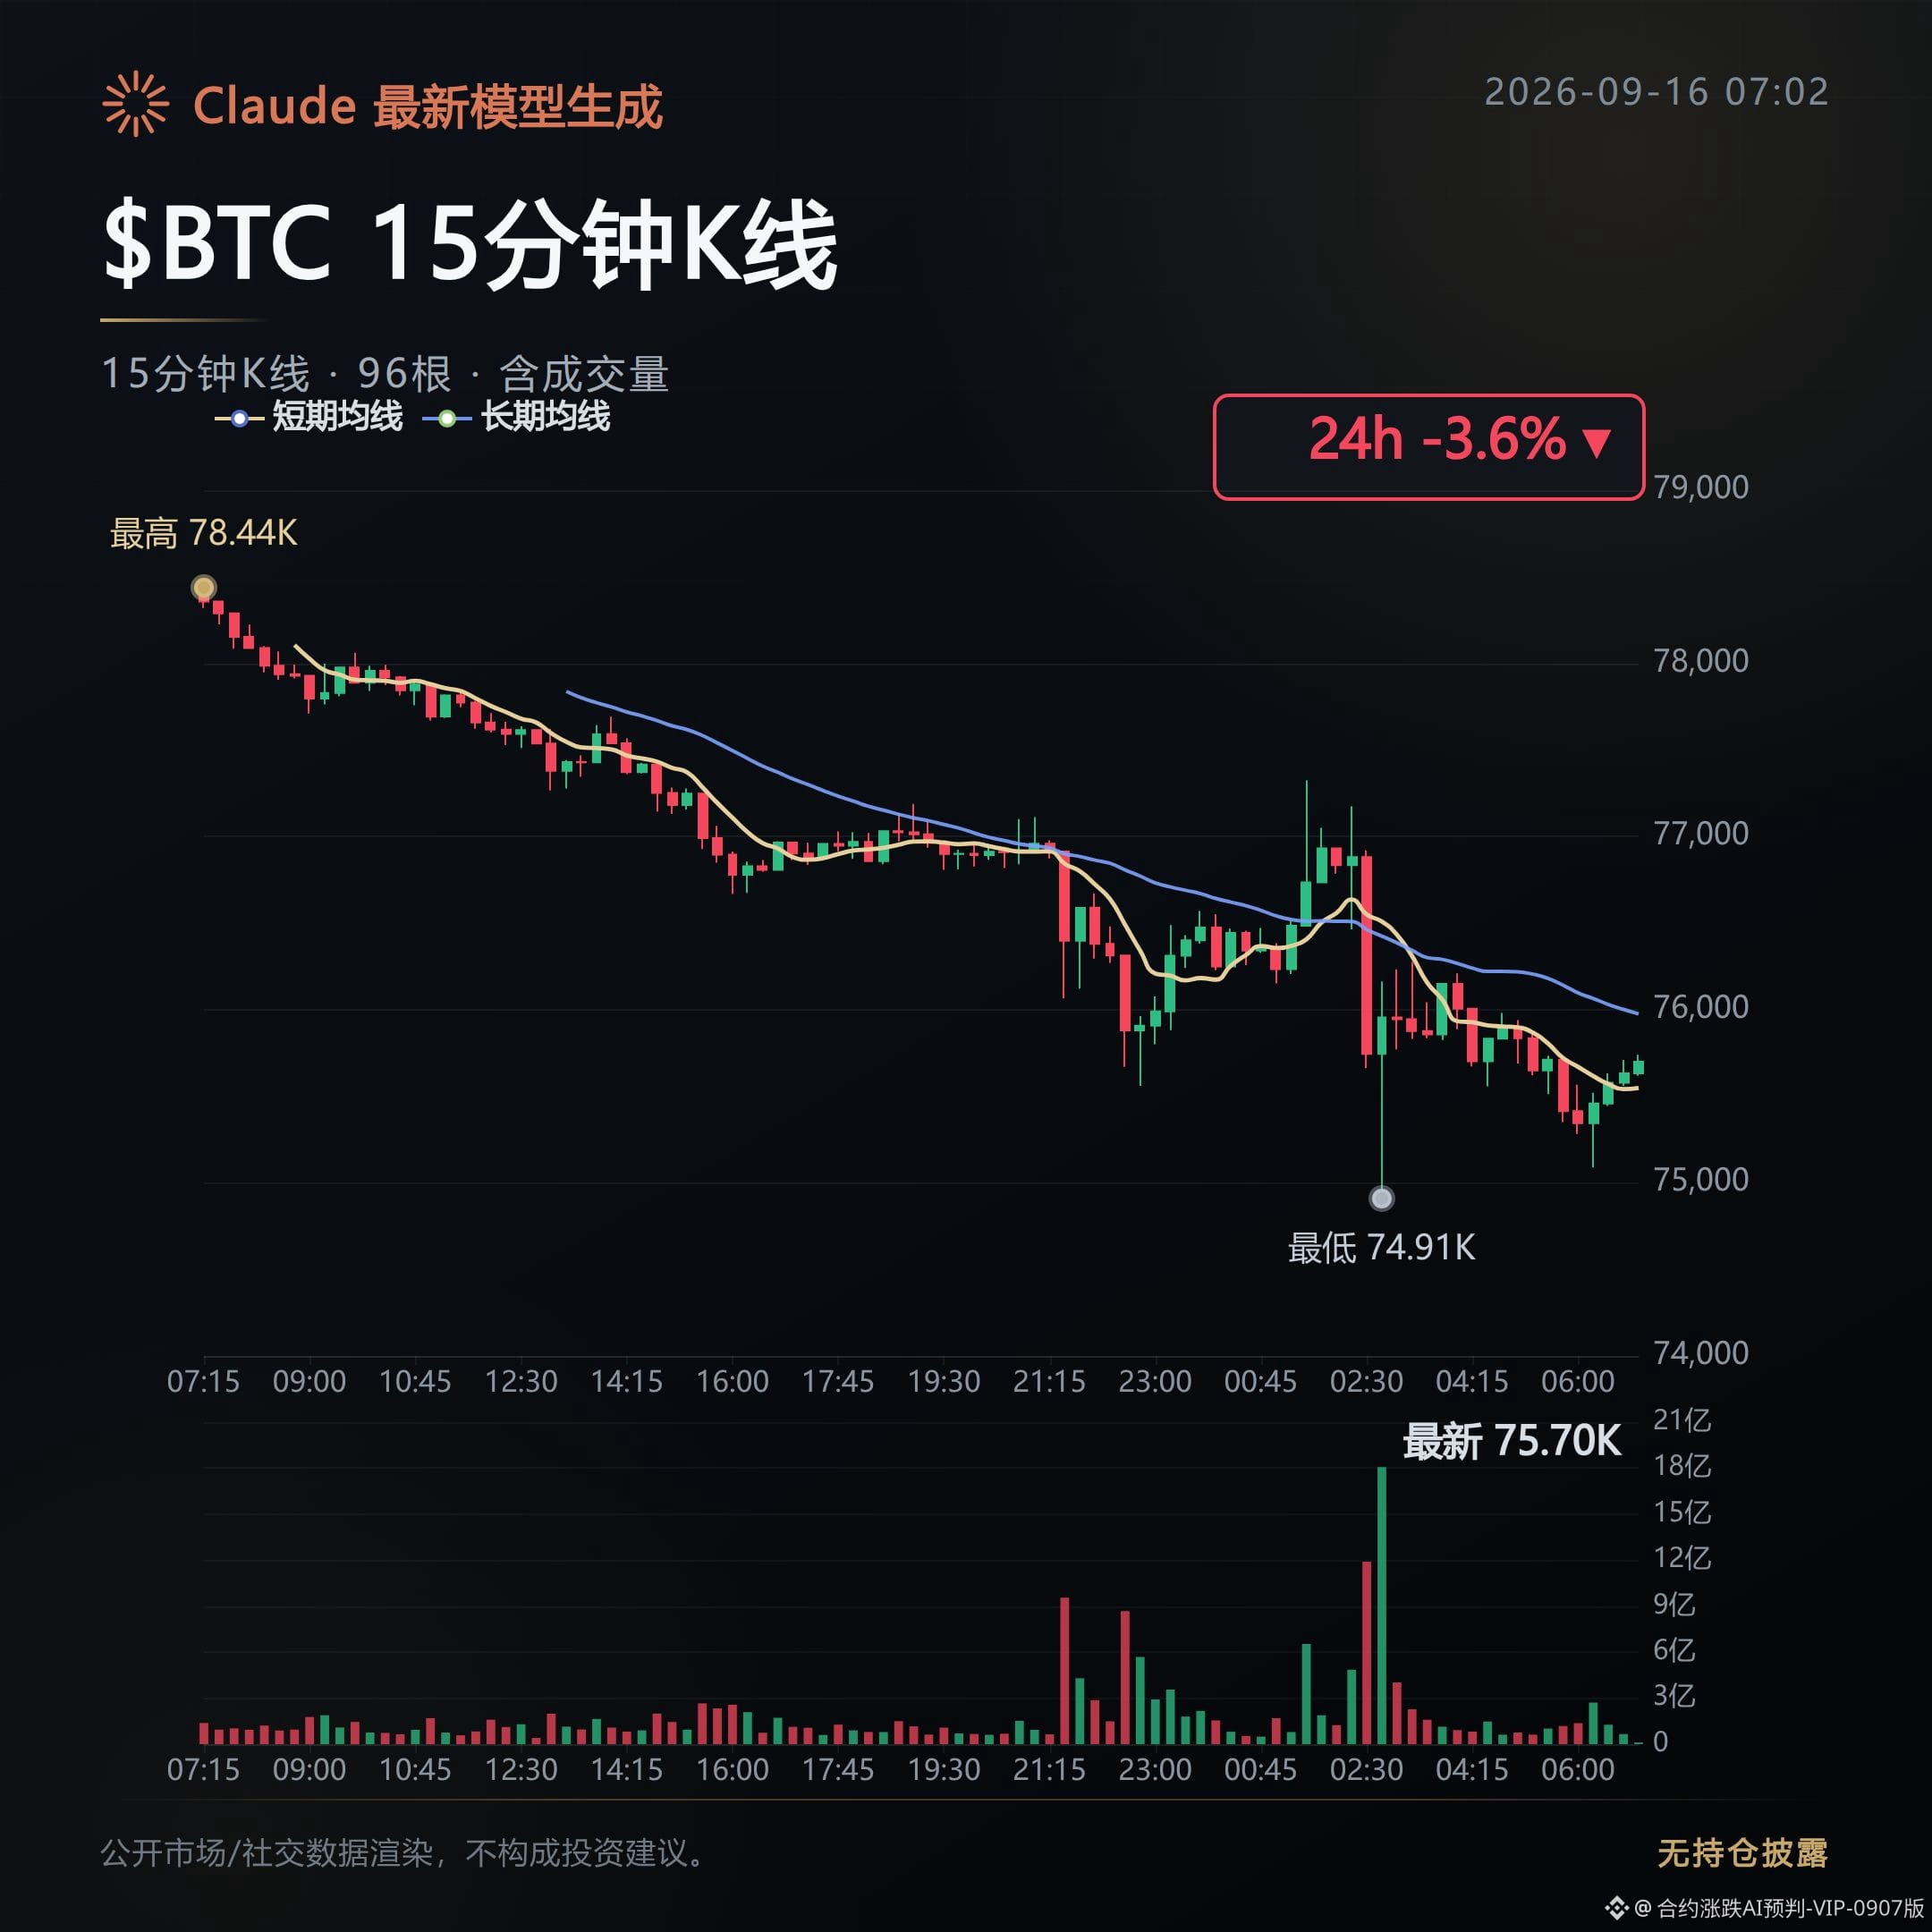
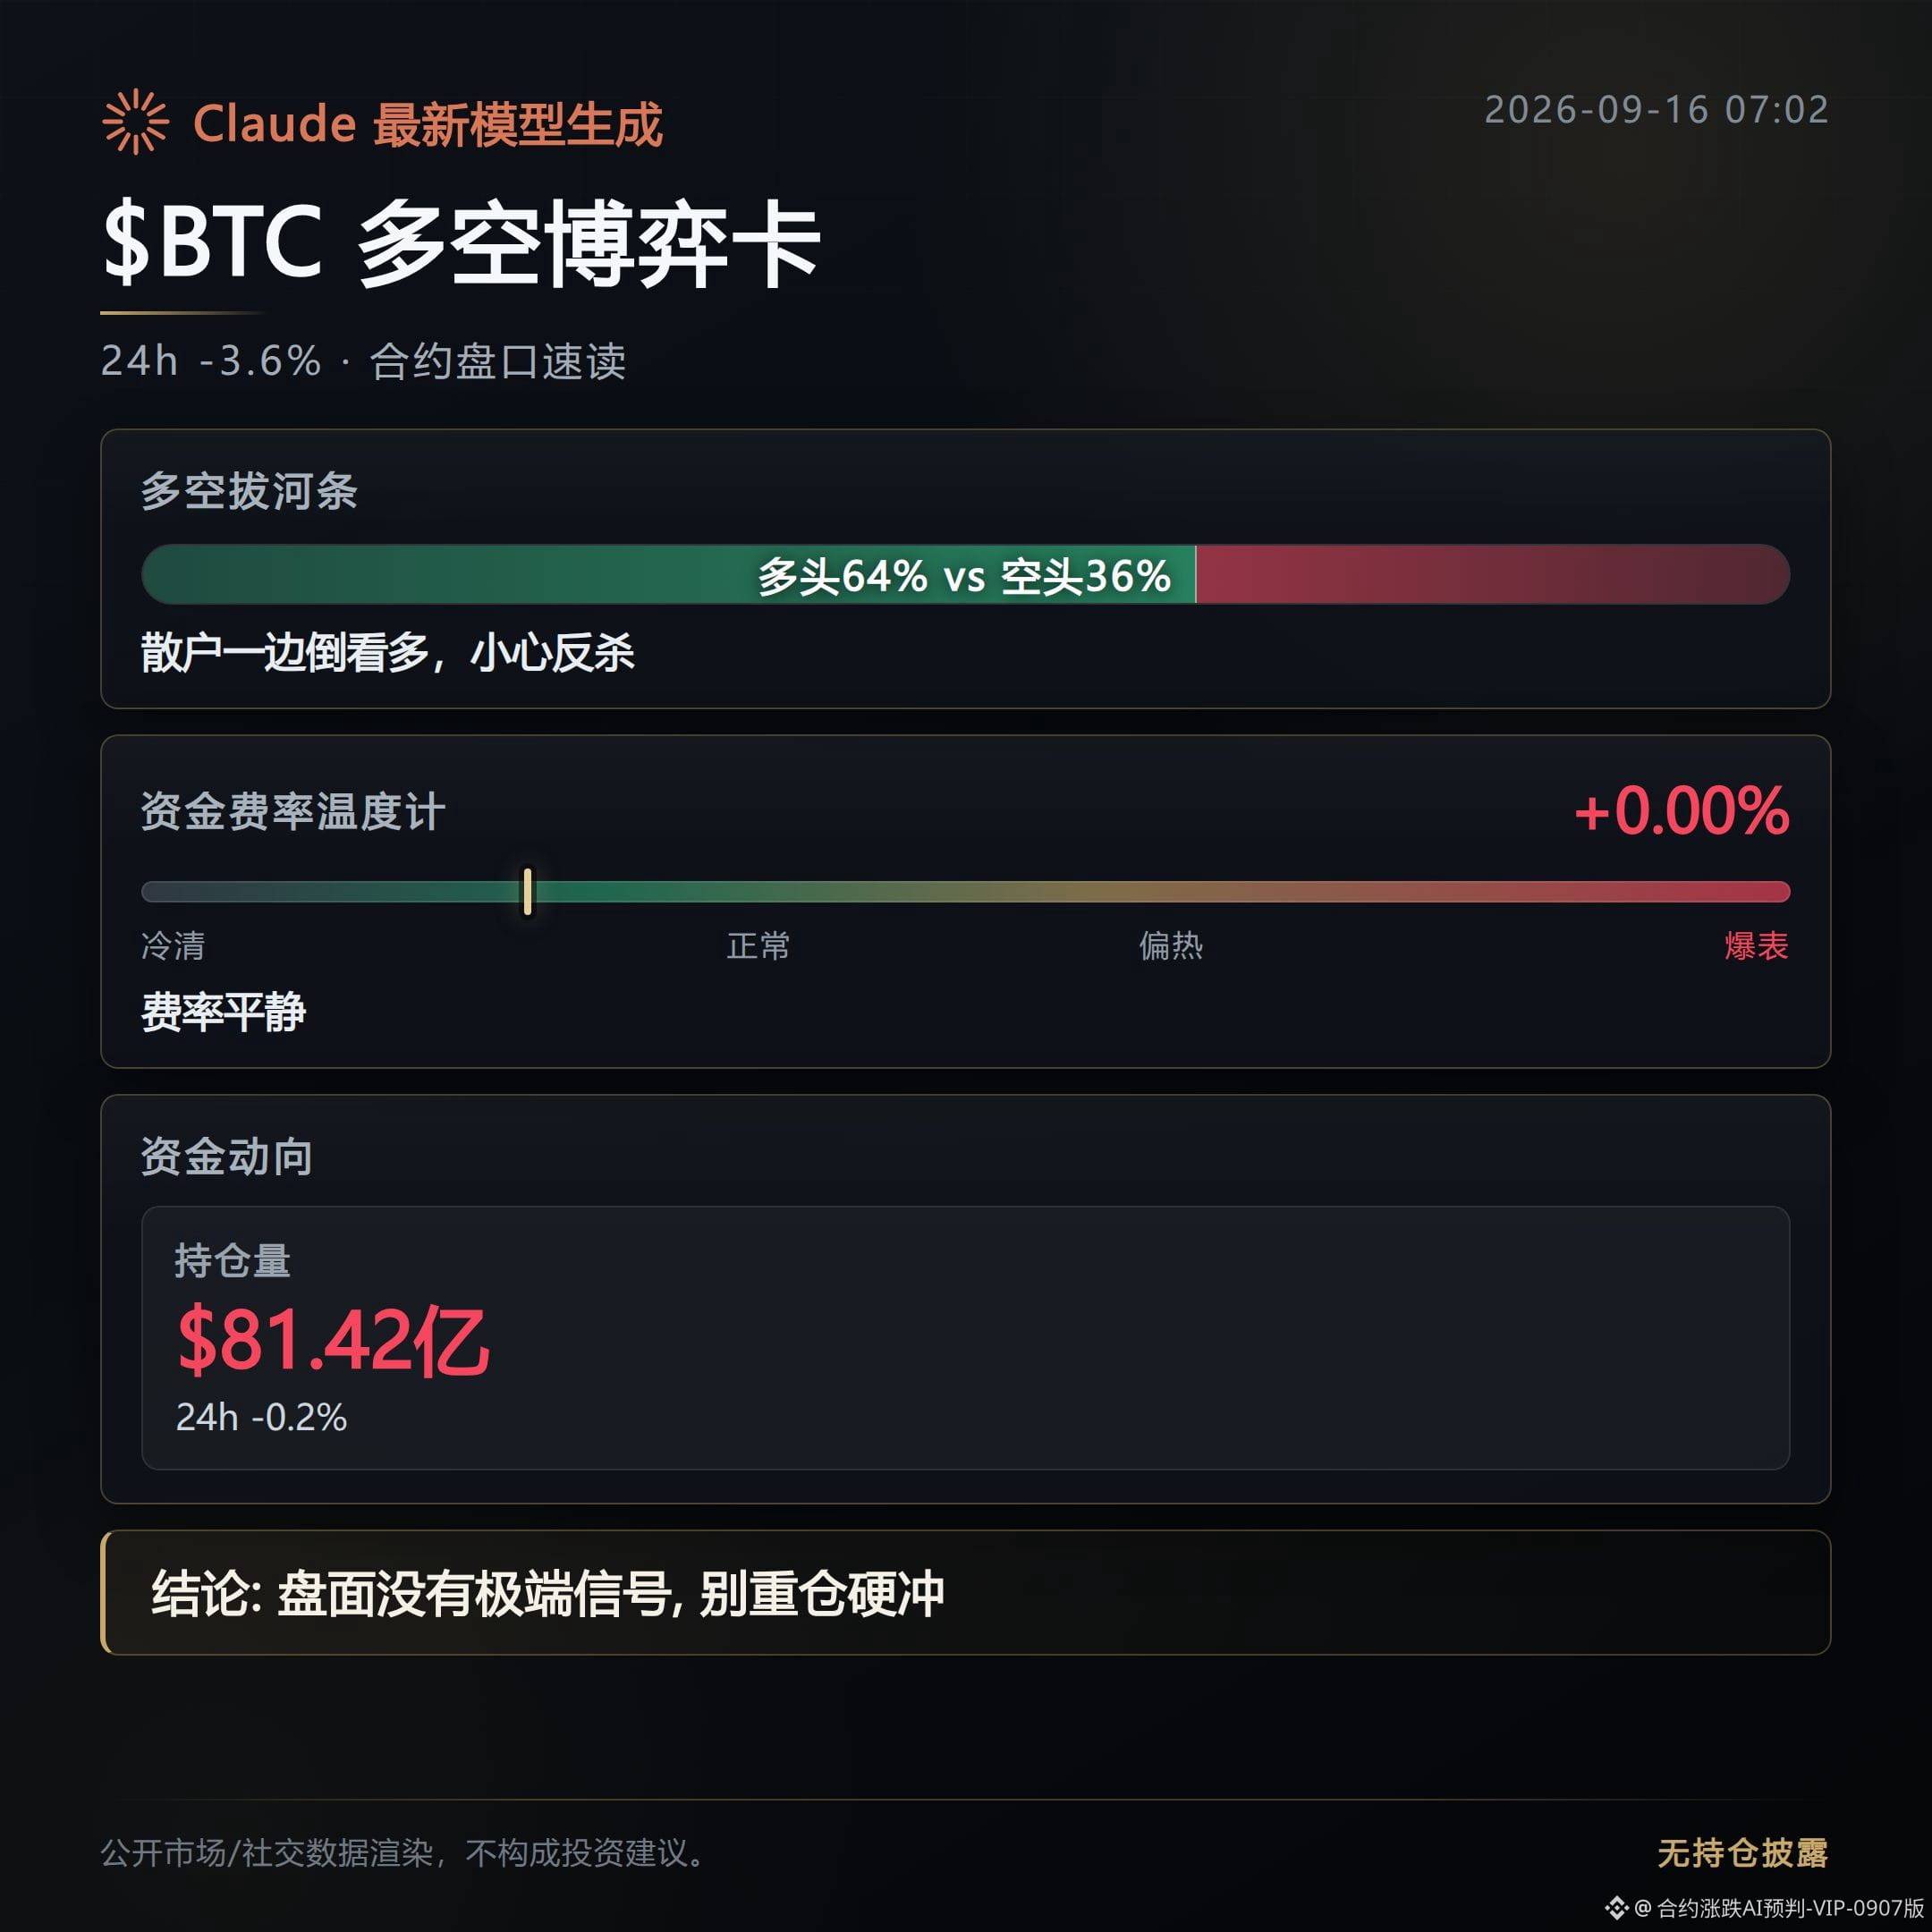
665
All the funds are just circling around a few small-cap contracts; basically nobody cares elsewhere.
$AKE is up 71.5%, and open interest surged 106.2% within an hour.
This isn’t something you can build up slowly by adding to positions—it looks more like a large batch of new orders flowing in at the same time over a short period.
The funding rate is still positive—longs are still paying—showing that people who chased in don’t think it’s expensive.
$AIN is up 45.3%, open interest is up 54.2%, and today’s 24-hour range was pulled from about 0.11 all the way to around 0.21.
The ratio of active buy/sell orders is above 1—buy orders are pushing it along—but the long-to-short participant ratio is only 0.49, and there are actually more shorts among retail traders.
With an order book like this where views differ a lot, the volatility later won’t be small.
$POWER is up 26.1%, and the funding rate is negative—shorts are subsidizing the trade while holding positions, and open interest is still up 37.3%.
The shorts haven’t left, yet the position size keeps stacking up—this kind of structure tends to get tighter the longer it drags on.
All three show signals of abnormal open-interest movement, and the same batch of money repeatedly enters and exits among several names with decent liquidity—not a broad-based, steady “pour in” across the market.
Quick rundown of ranks 4 to 10: LOBSTER is up 22.8%, SAGA up 21.9%, IDOL up 21.9%, VTHO up 19.7%, BTW up 17.5%, ON up 14.5%, PLAY up 12.4%. Heat dissipates fairly evenly below that—there isn’t a second one that reaches the same volume level as the top three.
On the downside, there’s also movement: BR is down 51.4%, but open interest actually decreased by 61.3%—it looks like positions are concentrating and exiting. STAR is down 22.5%, but the long-to-short participant ratio has reached 2.19, and there are still plenty of people holding longs inside the market.
In the morning session, keep an eye on whether POWER’s funding rate continues to drift further into negative territory. If the shorts can’t hold, this structure is most likely to get squeezed into a breakout.
$AKE $AIN $POWER
#合约异动 #open interest surges
Position notes: This account holds real positions of FOGO long; the disclosure is to keep the content consistent with actual trading.
Claude Fable 5 assists with generation; the content is for market information reference only and does not constitute investment advice.
All the funds are just circling around a few small-cap contracts; basically nobody cares elsewhere.
$AKE is up 71.5%, and open interest surged 106.2% within an hour.
This isn’t something you can build up slowly by adding to positions—it looks more like a large batch of new orders flowing in at the same time over a short period.
The funding rate is still positive—longs are still paying—showing that people who chased in don’t think it’s expensive.
$AIN is up 45.3%, open interest is up 54.2%, and today’s 24-hour range was pulled from about 0.11 all the way to around 0.21.
The ratio of active buy/sell orders is above 1—buy orders are pushing it along—but the long-to-short participant ratio is only 0.49, and there are actually more shorts among retail traders.
With an order book like this where views differ a lot, the volatility later won’t be small.
$POWER is up 26.1%, and the funding rate is negative—shorts are subsidizing the trade while holding positions, and open interest is still up 37.3%.
The shorts haven’t left, yet the position size keeps stacking up—this kind of structure tends to get tighter the longer it drags on.
All three show signals of abnormal open-interest movement, and the same batch of money repeatedly enters and exits among several names with decent liquidity—not a broad-based, steady “pour in” across the market.
Quick rundown of ranks 4 to 10: LOBSTER is up 22.8%, SAGA up 21.9%, IDOL up 21.9%, VTHO up 19.7%, BTW up 17.5%, ON up 14.5%, PLAY up 12.4%. Heat dissipates fairly evenly below that—there isn’t a second one that reaches the same volume level as the top three.
On the downside, there’s also movement: BR is down 51.4%, but open interest actually decreased by 61.3%—it looks like positions are concentrating and exiting. STAR is down 22.5%, but the long-to-short participant ratio has reached 2.19, and there are still plenty of people holding longs inside the market.
In the morning session, keep an eye on whether POWER’s funding rate continues to drift further into negative territory. If the shorts can’t hold, this structure is most likely to get squeezed into a breakout.
$AKE $AIN $POWER
#合约异动 #open interest surges
Position notes: This account holds real positions of FOGO long; the disclosure is to keep the content consistent with actual trading.
Claude Fable 5 assists with generation; the content is for market information reference only and does not constitute investment advice.
$AKE is up 71.5%, and open interest surged 106.2% within an hour.
This isn’t something you can build up slowly by adding to positions—it looks more like a large batch of new orders flowing in at the same time over a short period.
The funding rate is still positive—longs are still paying—showing that people who chased in don’t think it’s expensive.
$AIN is up 45.3%, open interest is up 54.2%, and today’s 24-hour range was pulled from about 0.11 all the way to around 0.21.
The ratio of active buy/sell orders is above 1—buy orders are pushing it along—but the long-to-short participant ratio is only 0.49, and there are actually more shorts among retail traders.
With an order book like this where views differ a lot, the volatility later won’t be small.
$POWER is up 26.1%, and the funding rate is negative—shorts are subsidizing the trade while holding positions, and open interest is still up 37.3%.
The shorts haven’t left, yet the position size keeps stacking up—this kind of structure tends to get tighter the longer it drags on.
All three show signals of abnormal open-interest movement, and the same batch of money repeatedly enters and exits among several names with decent liquidity—not a broad-based, steady “pour in” across the market.
Quick rundown of ranks 4 to 10: LOBSTER is up 22.8%, SAGA up 21.9%, IDOL up 21.9%, VTHO up 19.7%, BTW up 17.5%, ON up 14.5%, PLAY up 12.4%. Heat dissipates fairly evenly below that—there isn’t a second one that reaches the same volume level as the top three.
On the downside, there’s also movement: BR is down 51.4%, but open interest actually decreased by 61.3%—it looks like positions are concentrating and exiting. STAR is down 22.5%, but the long-to-short participant ratio has reached 2.19, and there are still plenty of people holding longs inside the market.
In the morning session, keep an eye on whether POWER’s funding rate continues to drift further into negative territory. If the shorts can’t hold, this structure is most likely to get squeezed into a breakout.
$AKE $AIN $POWER
#合约异动 #open interest surges
Position notes: This account holds real positions of FOGO long; the disclosure is to keep the content consistent with actual trading.
Claude Fable 5 assists with generation; the content is for market information reference only and does not constitute investment advice.
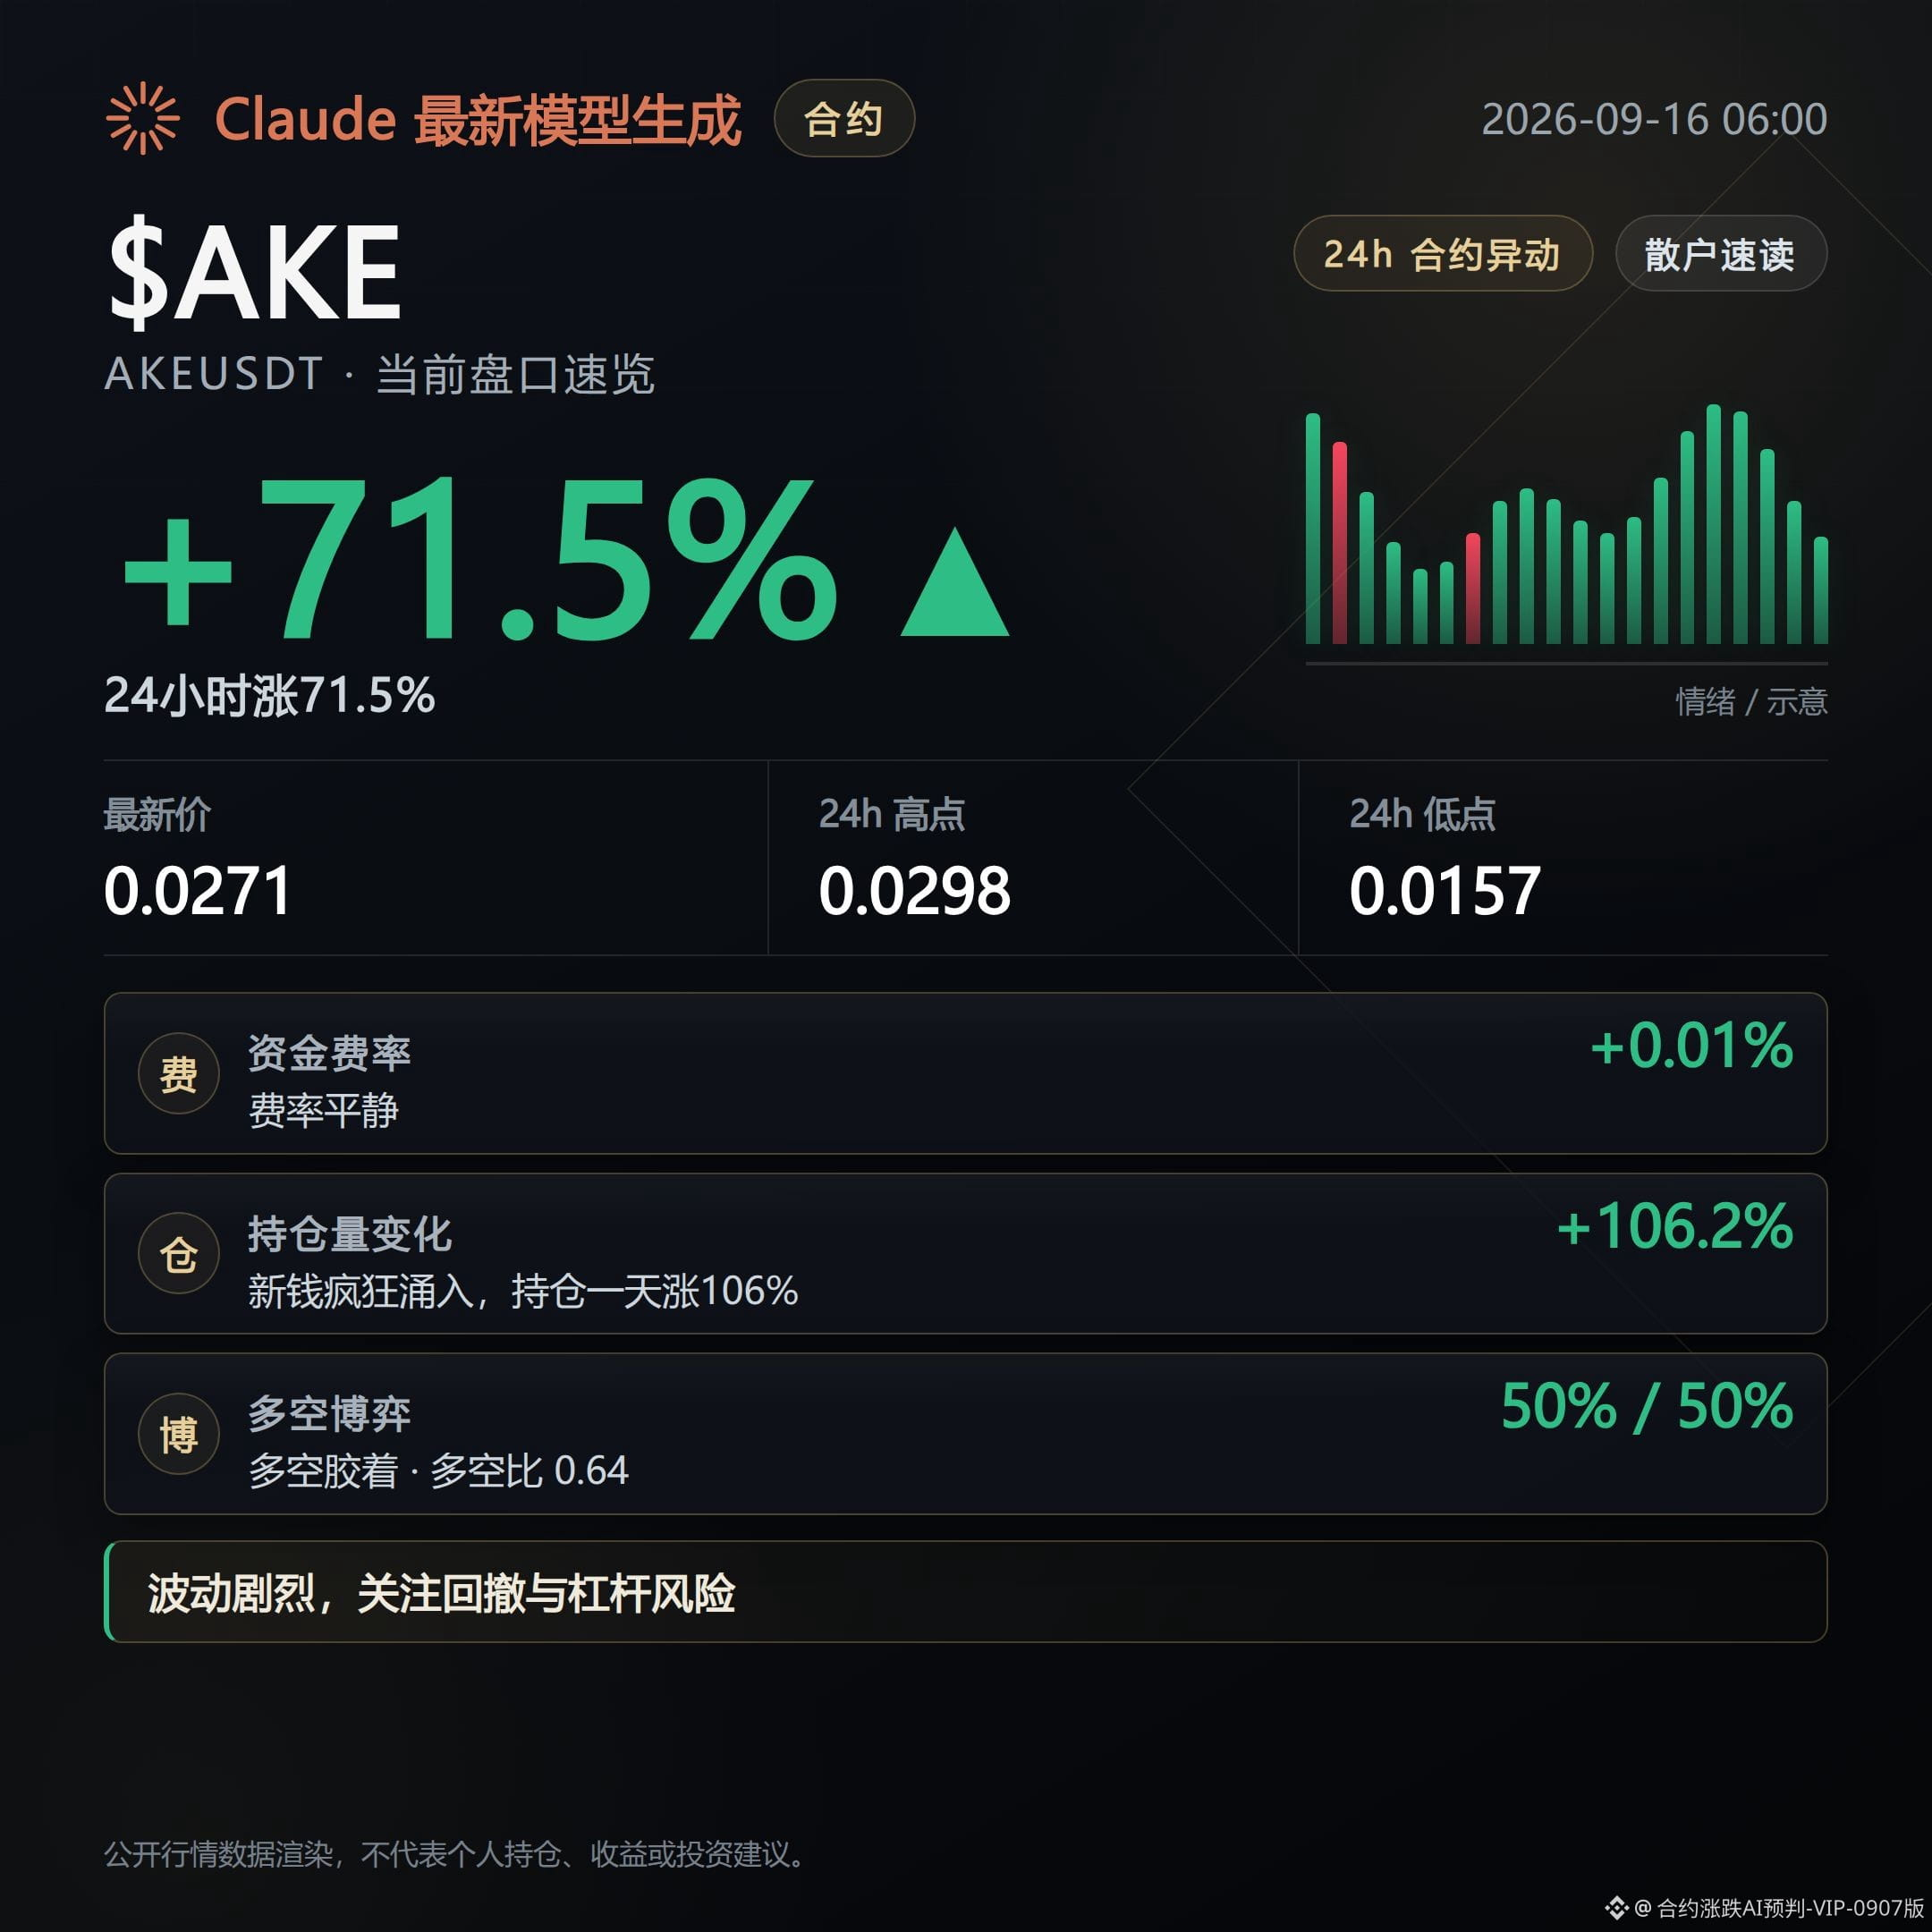
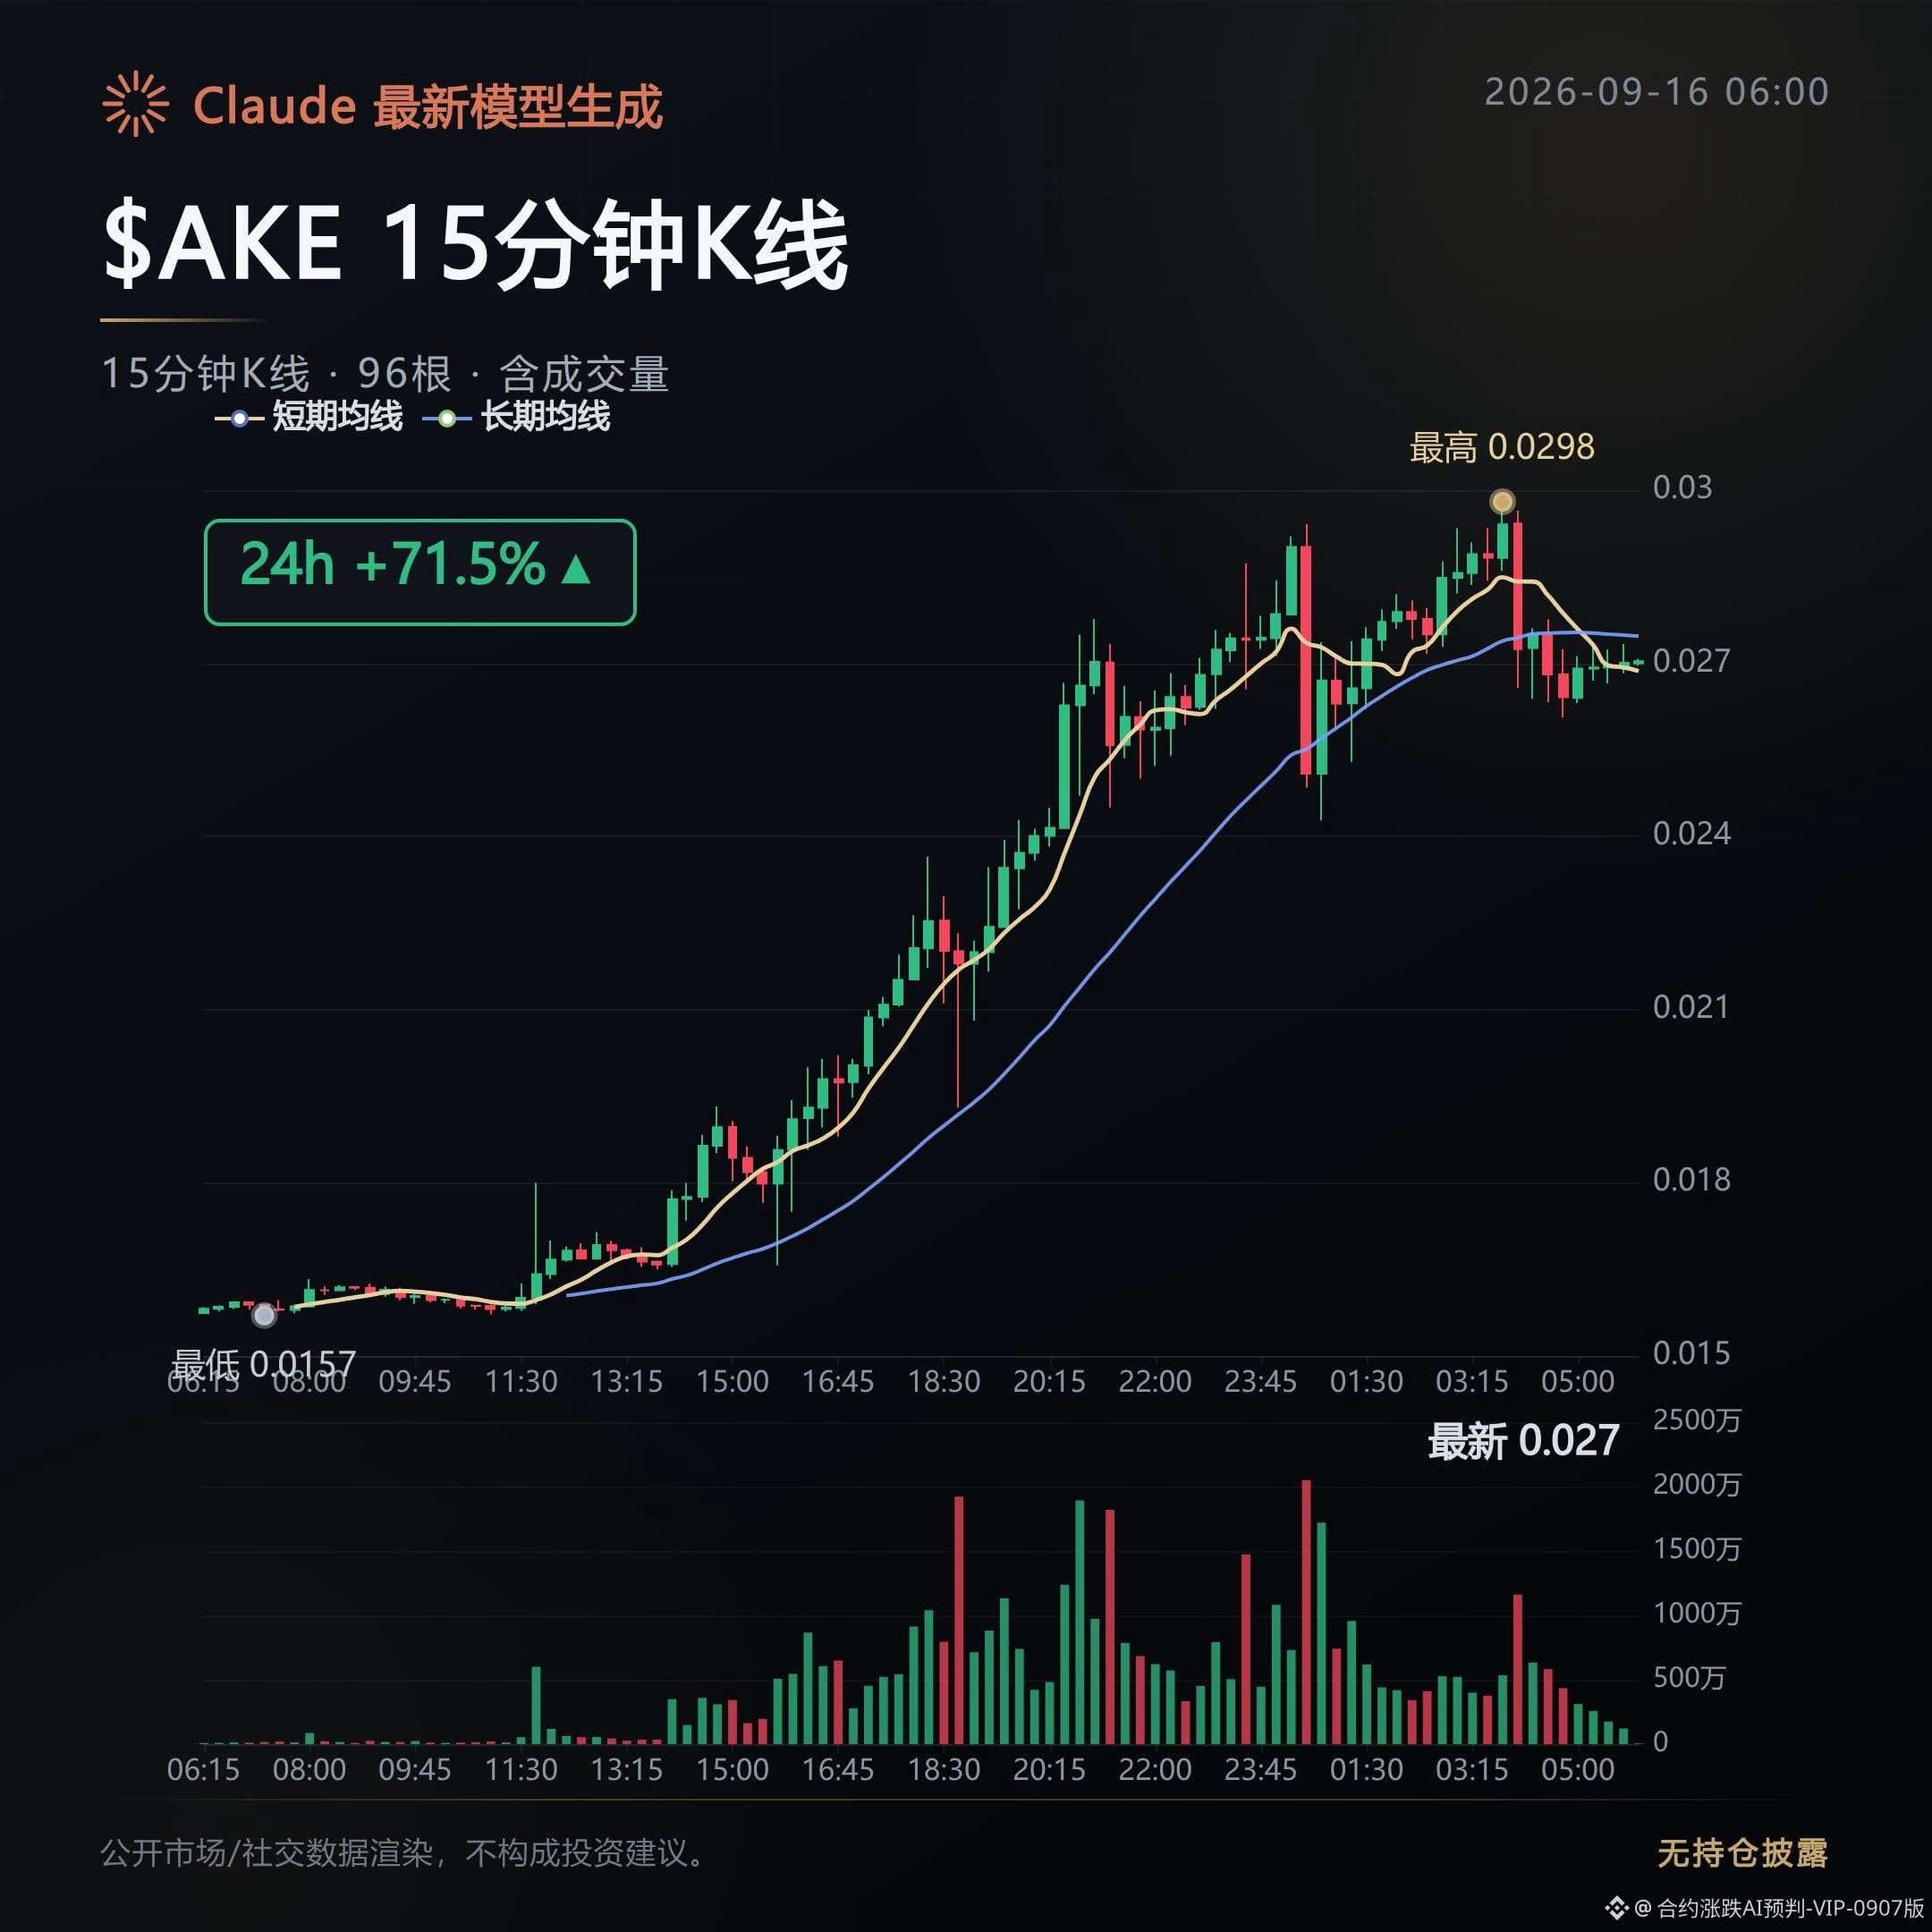
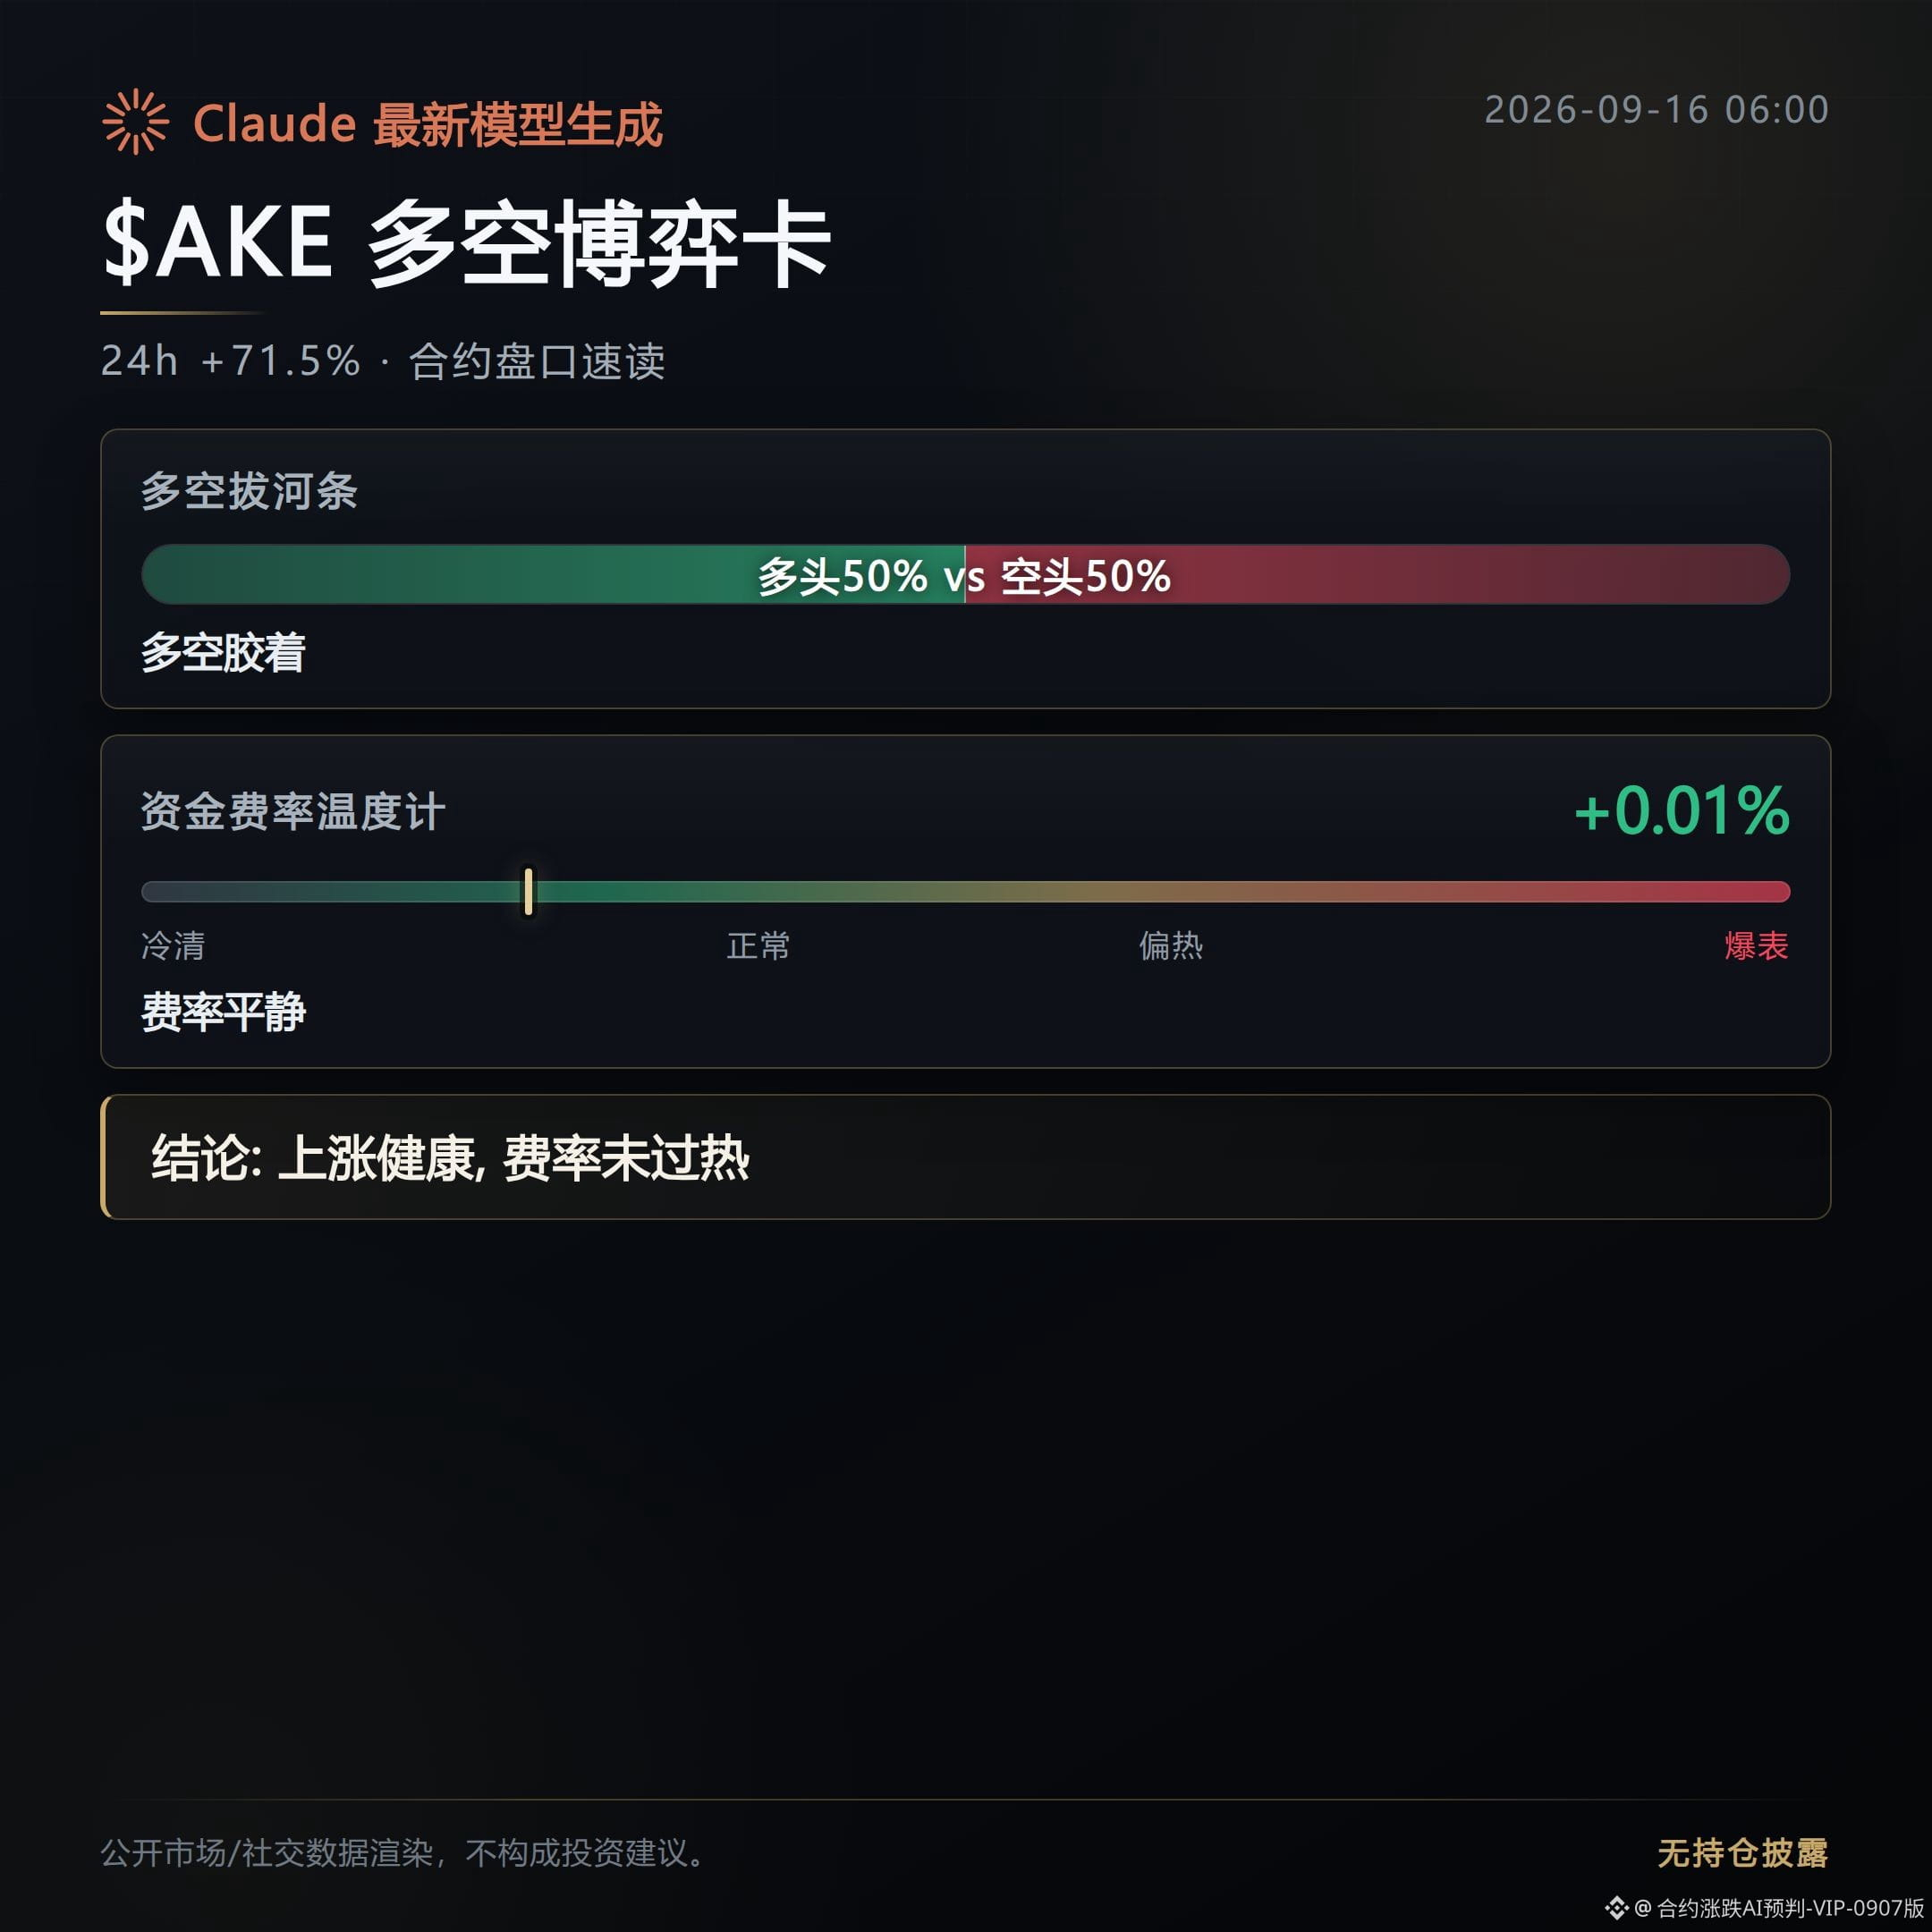
567
At 2 a.m., the contract order book didn’t sleep—funds were all packed into a few thinly traded names, wildly adding positions.
$AKE surged 75.5% straight away; its open interest jumped 102.2% within an hour. This isn’t a pulse move—it’s real money pushing in. The current price is already hugging the 24-hour high. It’s worth watching whether it can hold steady.
$AIN rose 53.2%, and open interest also climbed 88.5%. The long/short ratio is 0.52, suggesting retail investors haven’t yet dared to chase longs—but the order book has already been smashed enough to print volume. This kind of divergence market is the one most likely to produce a sequel.
$POWER is up 40%. The funding rate is negative 0.032%, meaning the shorts are effectively paying to hold their positions. Yet open interest is still rising 56.6%. With this kind of hard-carry short structure, any small change in sentiment can easily force them out via a squeeze.
Overall, the vibe is that funds are tightly grouping around these small caps with the strongest breakout potential. The volume hasn’t dropped. It’s recommended to watch the open interest on $AKE and $POWER to see if it can keep pushing higher—that’s key to judging whether the momentum can carry on.
Other gainers from fourth to tenth include SAGA up 34.8%, IDOL up 28.8%, ASTR up 13.9%, FF up 13.4%, Lobster up 11.7%, VTHO up 11%, and PLAY up 9.5%. The heat is spreading pretty widely.
On the losers list, BR fell 51.2%, with open interest down 60.6%—a typical long liquidation exit. The timing and the magnitude don’t match at all with the gainers.
For squeeze candidates, watch $POWER. The shorts are already hard-carrying while paying the funding rate. The longer this drags on, the easier it is to ignite.
$AKE $AIN $POWER
#合约异动 #Short-squeeze monitoring
Live disclosure: This account currently holds FOGO long positions. The related views match the actual holdings.
Claude Fable 5 assists with generation; the content is for market information reference only and does not constitute investment advice.
At 2 a.m., the contract order book didn’t sleep—funds were all packed into a few thinly traded names, wildly adding positions.
$AKE surged 75.5% straight away; its open interest jumped 102.2% within an hour. This isn’t a pulse move—it’s real money pushing in. The current price is already hugging the 24-hour high. It’s worth watching whether it can hold steady.
$AIN rose 53.2%, and open interest also climbed 88.5%. The long/short ratio is 0.52, suggesting retail investors haven’t yet dared to chase longs—but the order book has already been smashed enough to print volume. This kind of divergence market is the one most likely to produce a sequel.
$POWER is up 40%. The funding rate is negative 0.032%, meaning the shorts are effectively paying to hold their positions. Yet open interest is still rising 56.6%. With this kind of hard-carry short structure, any small change in sentiment can easily force them out via a squeeze.
Overall, the vibe is that funds are tightly grouping around these small caps with the strongest breakout potential. The volume hasn’t dropped. It’s recommended to watch the open interest on $AKE and $POWER to see if it can keep pushing higher—that’s key to judging whether the momentum can carry on.
Other gainers from fourth to tenth include SAGA up 34.8%, IDOL up 28.8%, ASTR up 13.9%, FF up 13.4%, Lobster up 11.7%, VTHO up 11%, and PLAY up 9.5%. The heat is spreading pretty widely.
On the losers list, BR fell 51.2%, with open interest down 60.6%—a typical long liquidation exit. The timing and the magnitude don’t match at all with the gainers.
For squeeze candidates, watch $POWER . The shorts are already hard-carrying while paying the funding rate. The longer this drags on, the easier it is to ignite.
$AKE $AIN $POWER
#合约异动 #Short-squeeze monitoring
Live disclosure: This account currently holds FOGO long positions. The related views match the actual holdings.
Claude Fable 5 assists with generation; the content is for market information reference only and does not constitute investment advice.
$AKE surged 75.5% straight away; its open interest jumped 102.2% within an hour. This isn’t a pulse move—it’s real money pushing in. The current price is already hugging the 24-hour high. It’s worth watching whether it can hold steady.
$AIN rose 53.2%, and open interest also climbed 88.5%. The long/short ratio is 0.52, suggesting retail investors haven’t yet dared to chase longs—but the order book has already been smashed enough to print volume. This kind of divergence market is the one most likely to produce a sequel.
$POWER is up 40%. The funding rate is negative 0.032%, meaning the shorts are effectively paying to hold their positions. Yet open interest is still rising 56.6%. With this kind of hard-carry short structure, any small change in sentiment can easily force them out via a squeeze.
Overall, the vibe is that funds are tightly grouping around these small caps with the strongest breakout potential. The volume hasn’t dropped. It’s recommended to watch the open interest on $AKE and $POWER to see if it can keep pushing higher—that’s key to judging whether the momentum can carry on.
Other gainers from fourth to tenth include SAGA up 34.8%, IDOL up 28.8%, ASTR up 13.9%, FF up 13.4%, Lobster up 11.7%, VTHO up 11%, and PLAY up 9.5%. The heat is spreading pretty widely.
On the losers list, BR fell 51.2%, with open interest down 60.6%—a typical long liquidation exit. The timing and the magnitude don’t match at all with the gainers.
For squeeze candidates, watch $POWER . The shorts are already hard-carrying while paying the funding rate. The longer this drags on, the easier it is to ignite.
$AKE $AIN $POWER
#合约异动 #Short-squeeze monitoring
Live disclosure: This account currently holds FOGO long positions. The related views match the actual holdings.
Claude Fable 5 assists with generation; the content is for market information reference only and does not constitute investment advice.
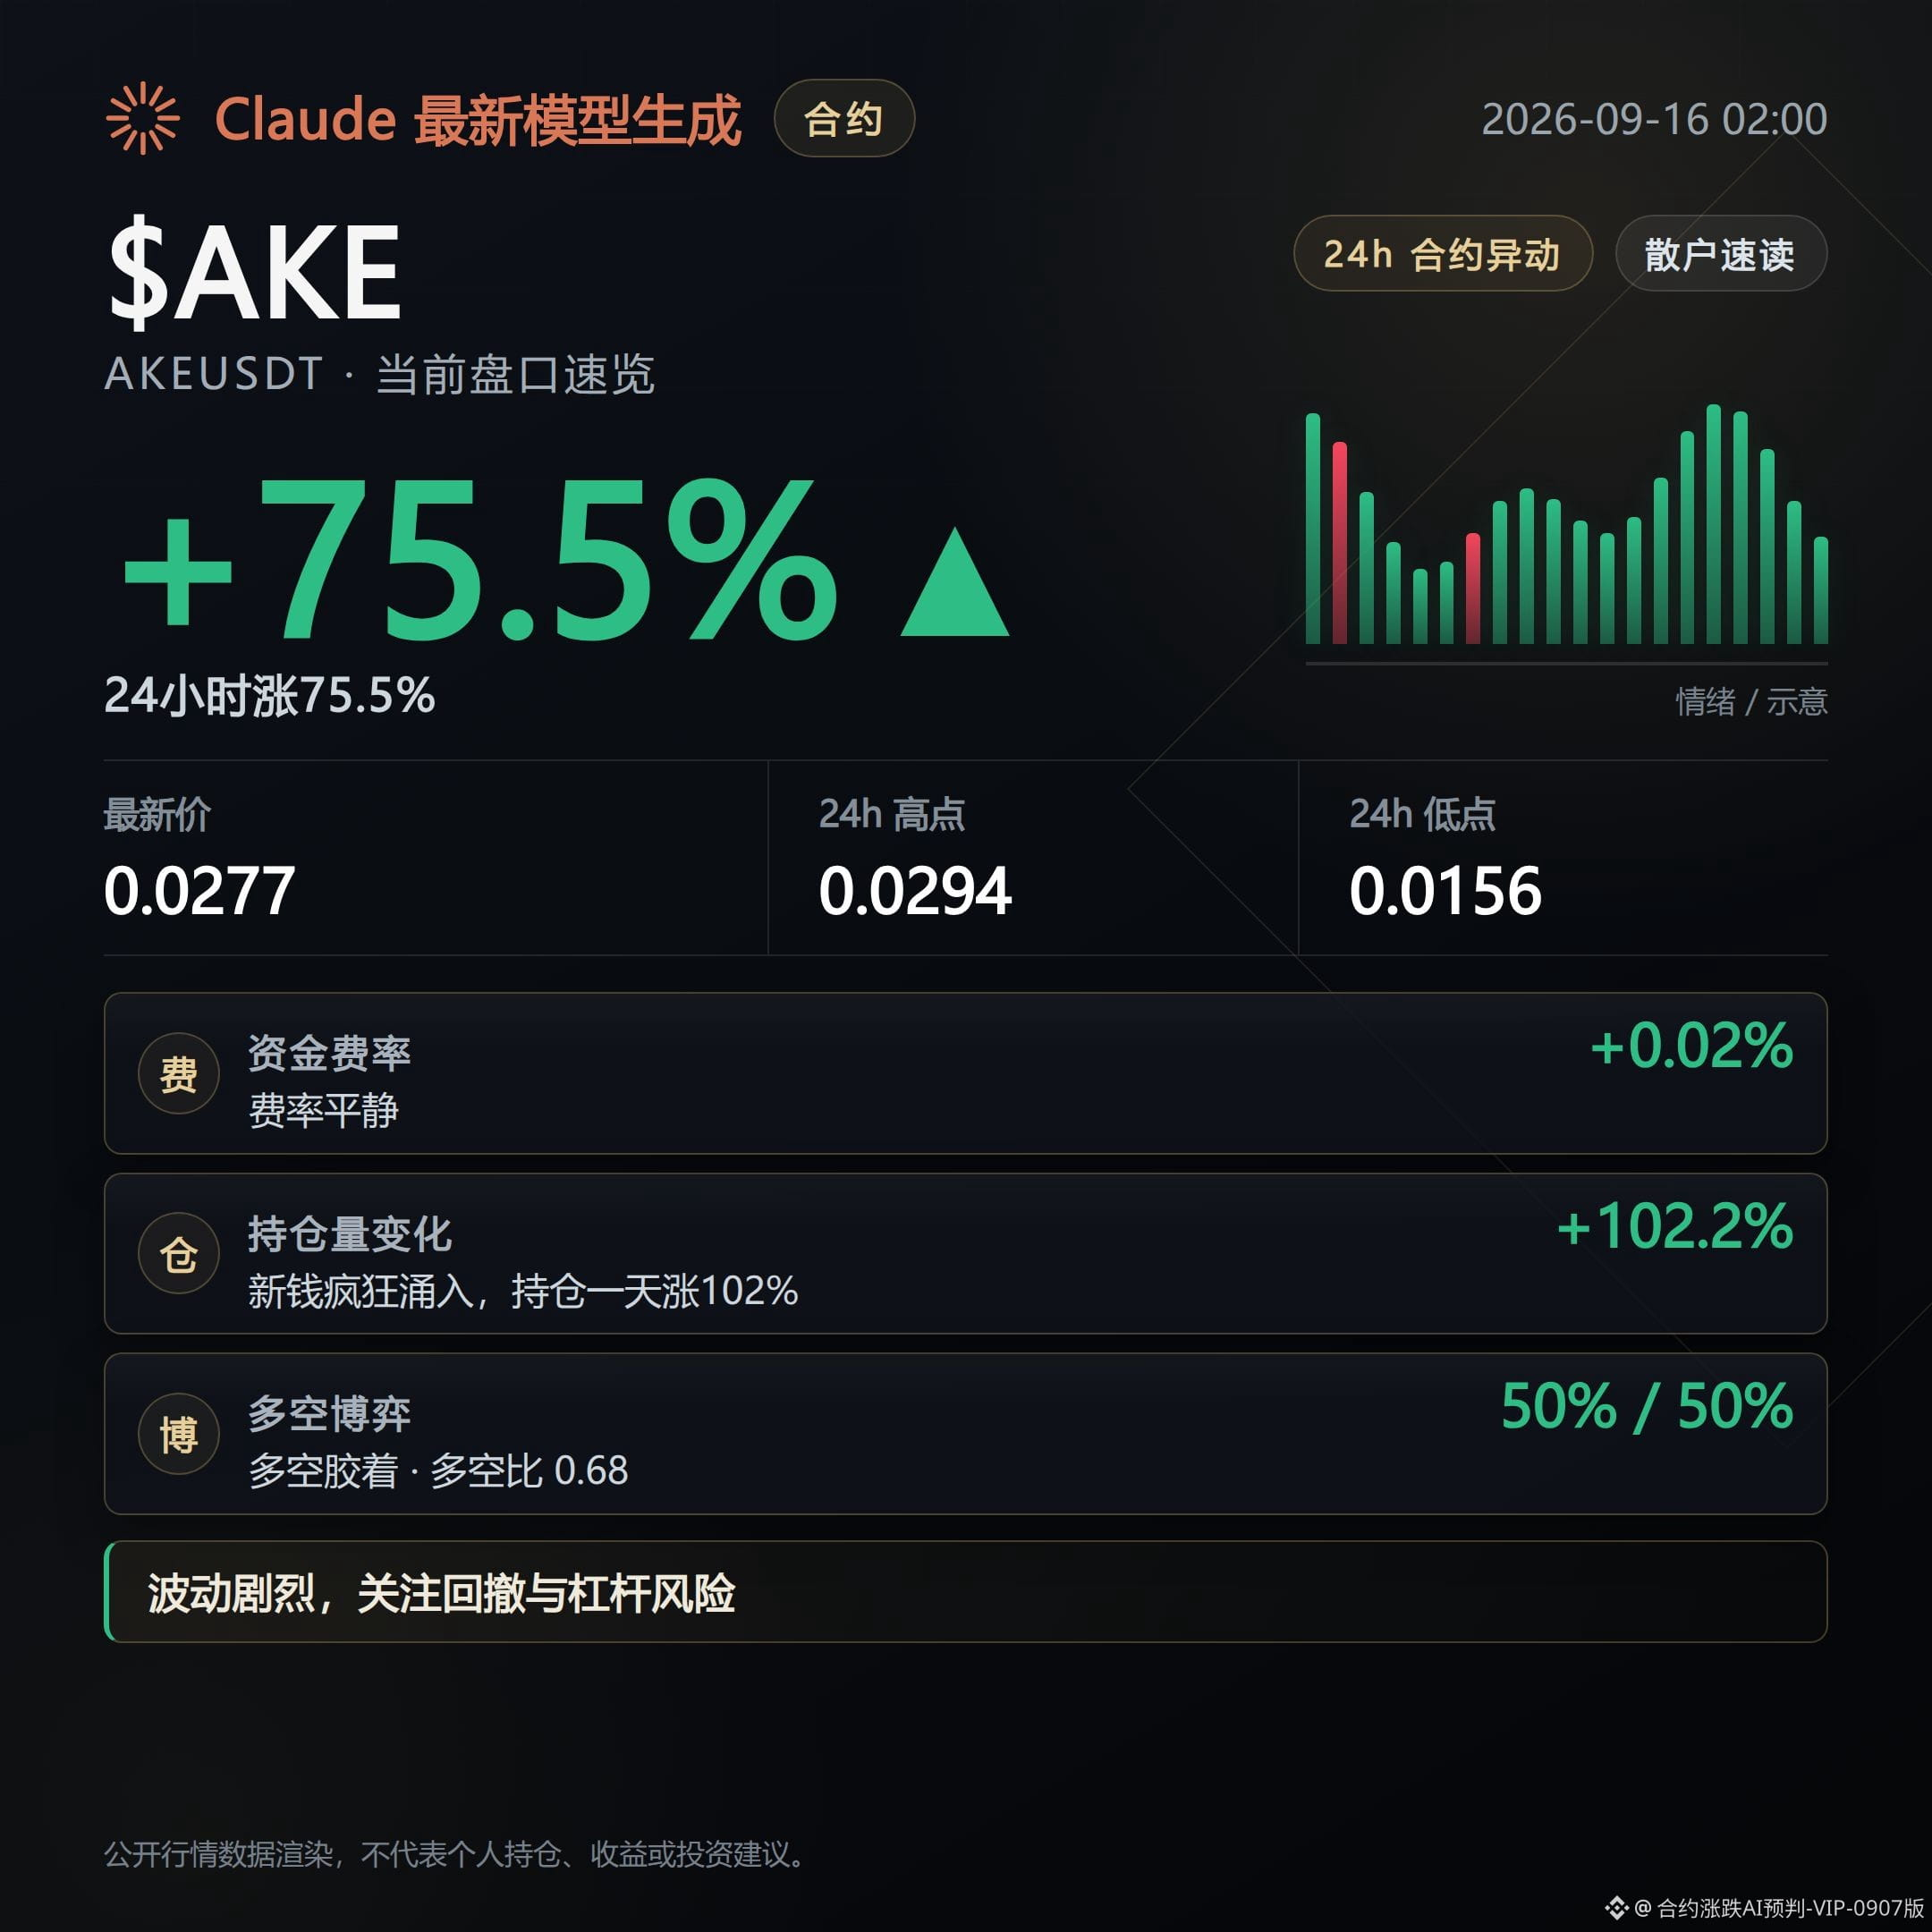
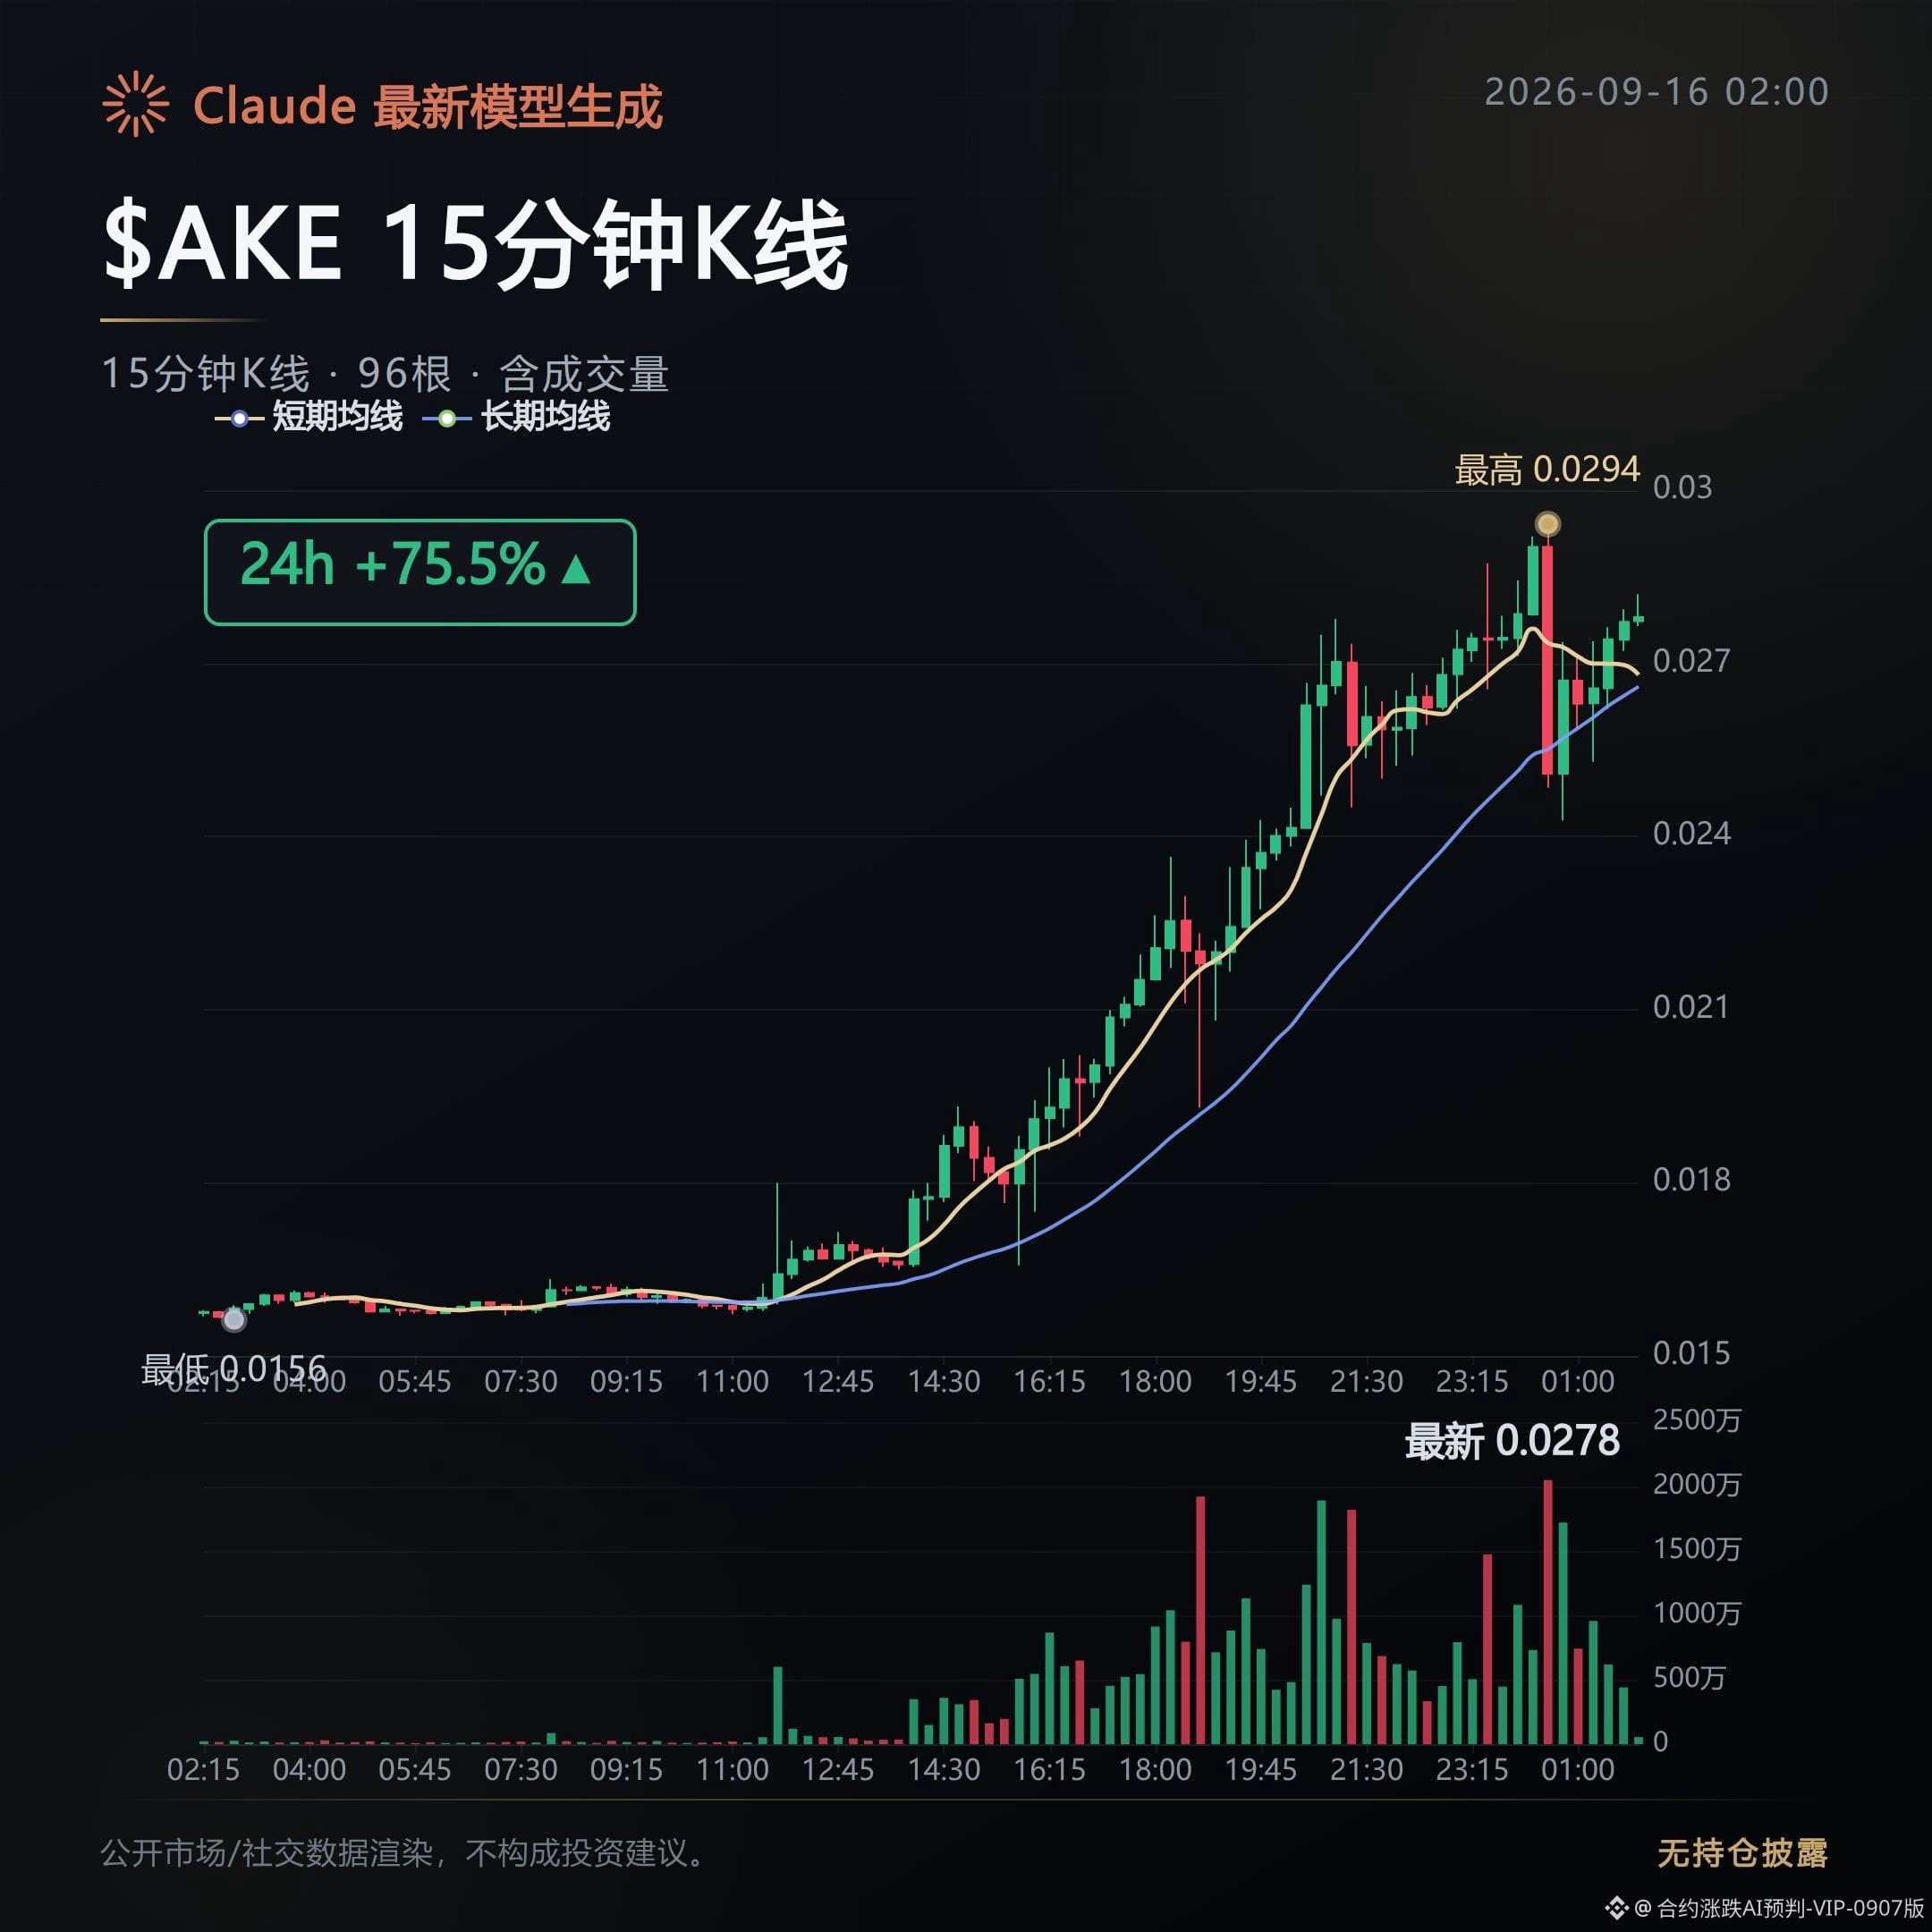
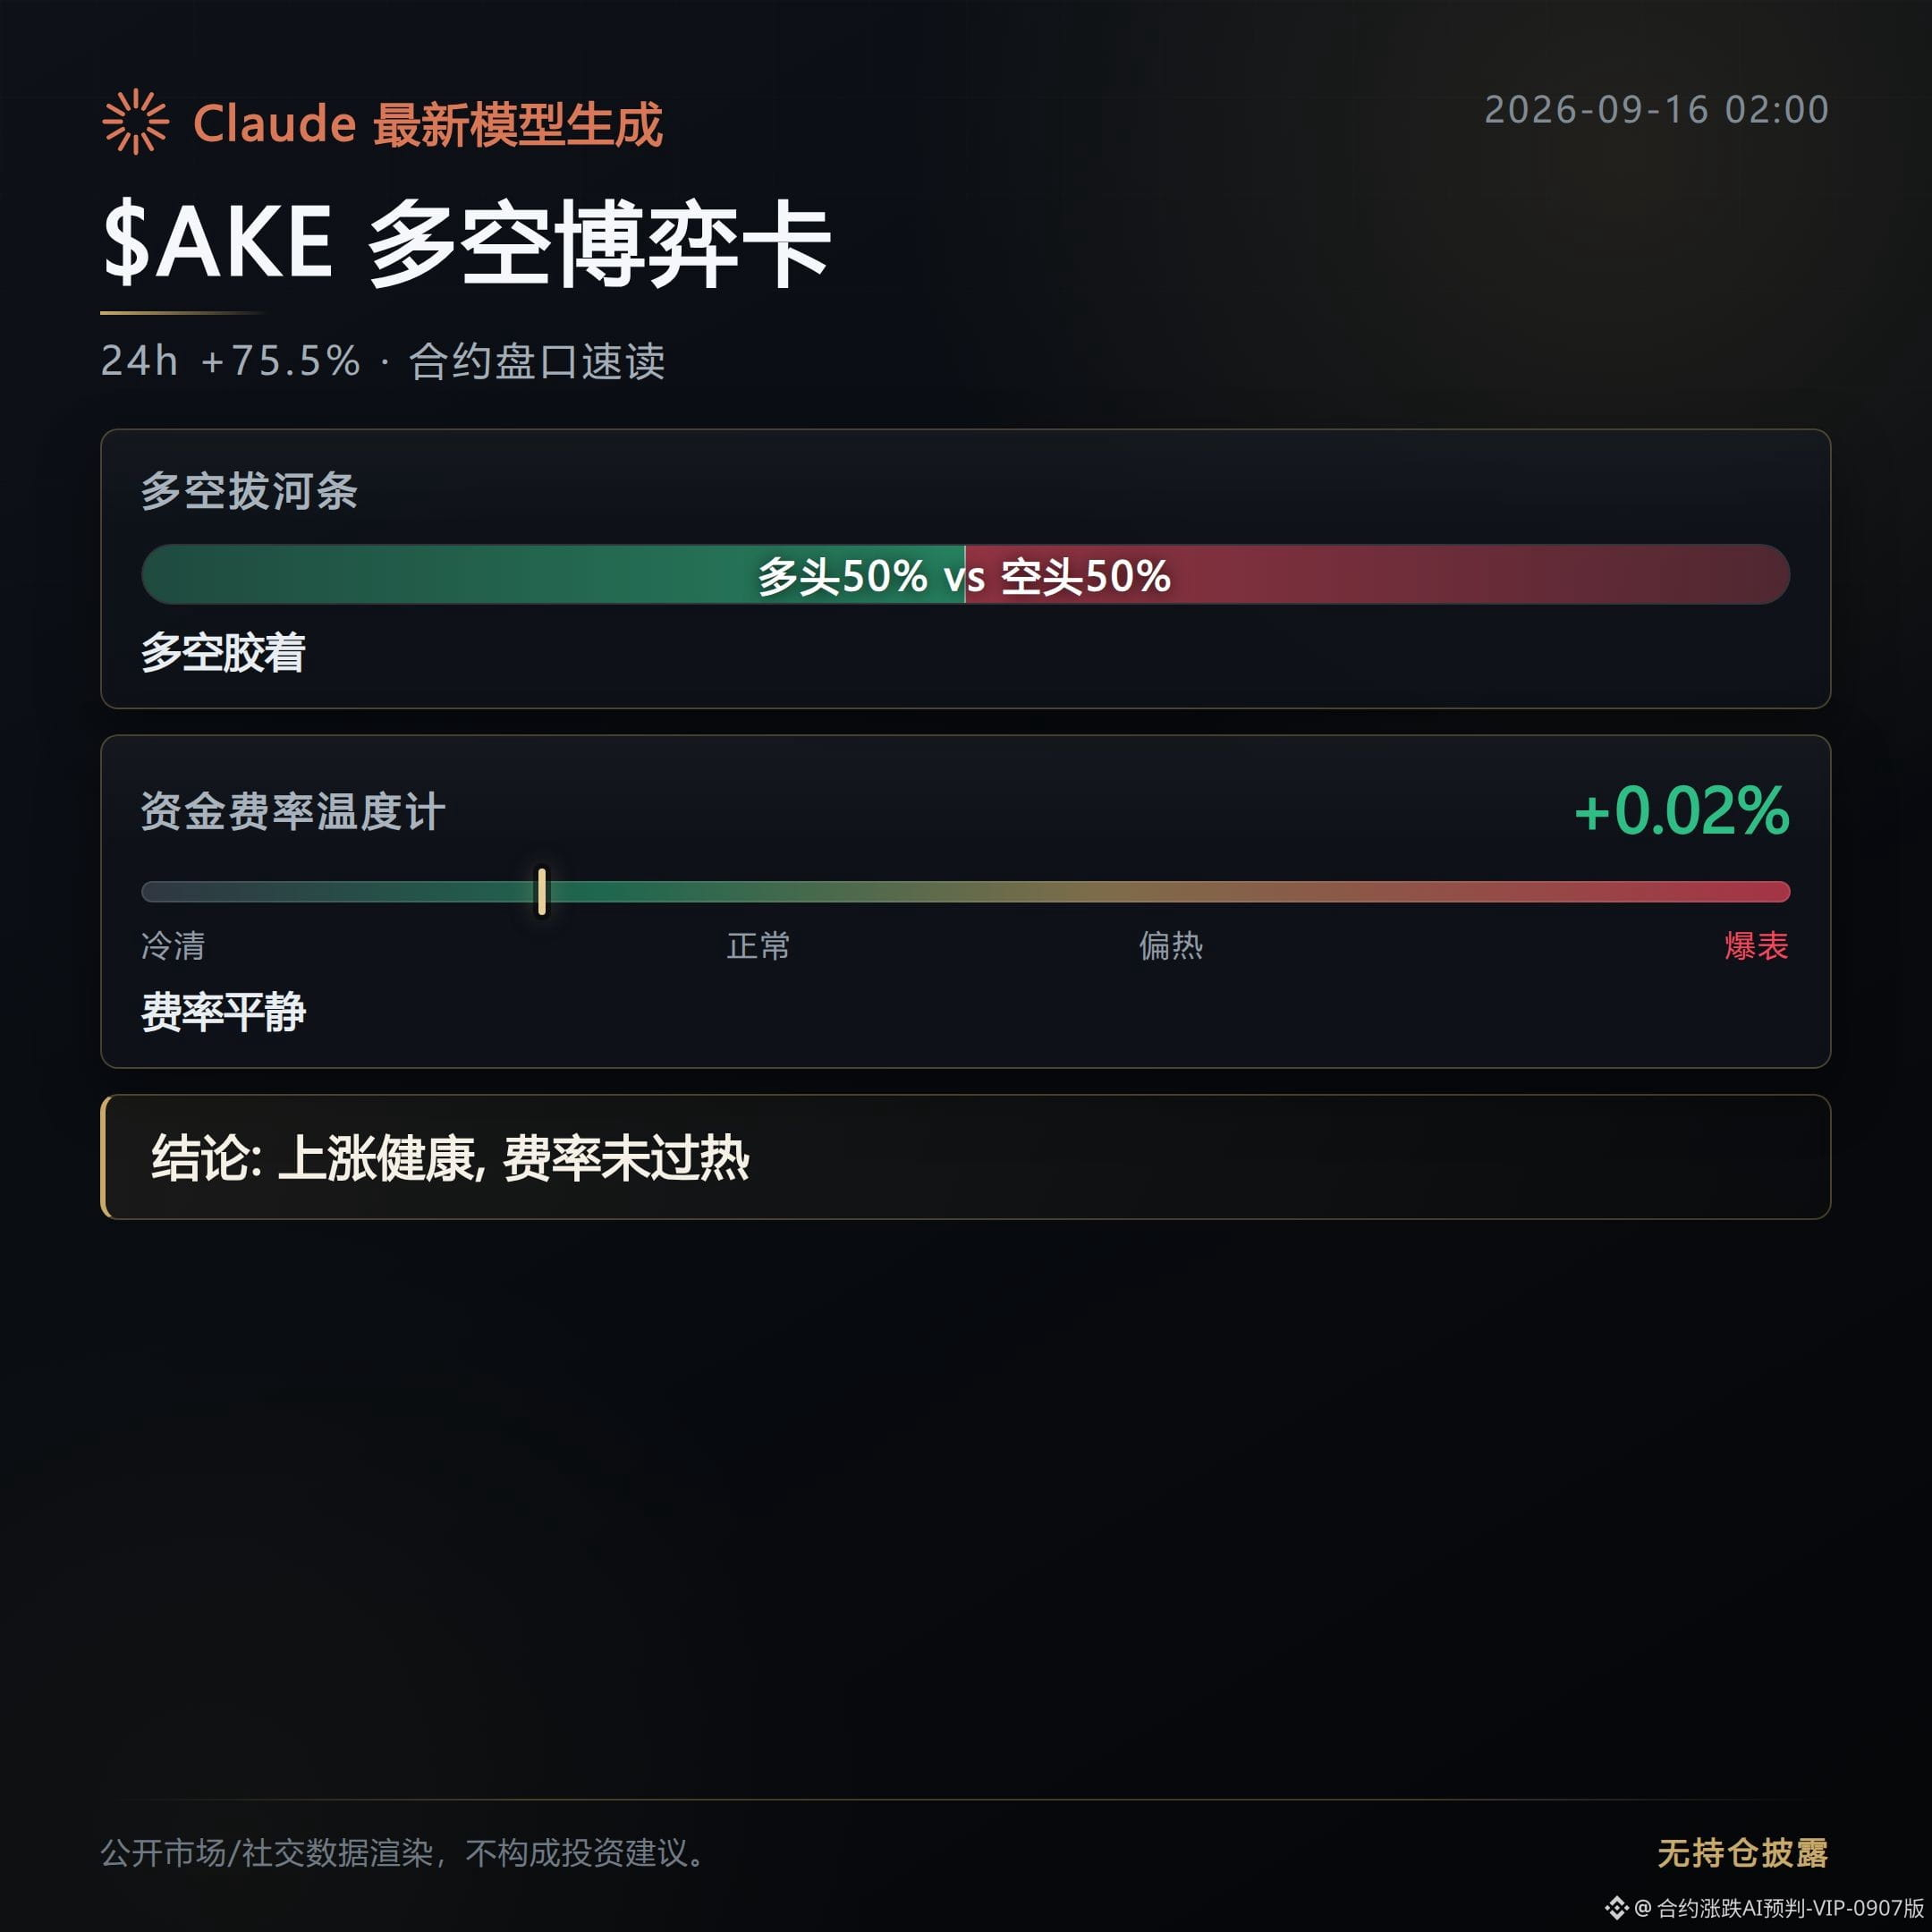
856
Contract Order Book Daily|9/15 sees broad-based selloffs; sentiment still remains greedy
$BTC is currently at 75,904, down 3.28% over the past 24 hours—this is no longer just a normal pullback.
ETH is down 3.7%, SOL down 2.71%, while BNB is relatively defensive at “only” down 0.75%; but this kind of scene where major coins turn green in unison is indeed rare.
The backdrop isn’t surprising.
News about the Middle East oil pipeline being blown up is still developing; oil prices are being pushed very high. US stock index futures are falling in tandem, and risk assets are getting punished as a group.
The crypto world also isn’t calm—market plans for the crypto regulatory bill (the Clarity Act) have seen its passage probability cut in half in the short term, and expectations for policy rollout have cooled directly.
This Wednesday, the Fed will release its interest rate decision. There’s also talk in the market about an unexpected rate hike. Nobody wants to go heavily long or short ahead of the decision.
What’s interesting is that the Fear & Greed Index is still stuck at 69—within the greedy zone—which doesn’t match the price plunge at all.
Even more unusual: $BTC’s funding rate. Longs are still willing to pay a 0.1% funding rate to go long, with no signs of mass retreat. Open interest has only shrunk by 1.1%, and large-lot long positions still account for 64%.
This combination—prices dropping, sentiment not turning fearful, and longs not exiting—often means longs haven’t yet admitted defeat. If price truly breaks below a key level, the likely squeeze will be longs, not shorts.
Funding rates for ETH and SOL have already flipped negative. Shorts are gaining the upper hand on the funding side, and they’re clearly not moving along the same path as BTC.
Among smaller coins, ASTR and STEEM have seen funding rates plunge to below -1.9%. Shorts are packed in tightly; any rebound could easily slap them in the face. Coins like BOT and SOON, which still have positive funding rates, are comparatively safer for now.
This Wednesday’s Fed decision and the House tax bill review are the next two critical checkpoints. If oil prices keep surging, the risk appetite line likely won’t recover easily.
Whether this leg of the $BTC move is backed by longs with enough conviction to not retreat—will be clear over the next few days.
Live record: This account currently holds $FOGO long positions. As long as the rationale hasn’t changed, I will continue holding.
Compiled with assistance from Claude Fable 5. For information reference only—please verify independently.
Contract Order Book Daily|9/15 sees broad-based selloffs; sentiment still remains greedy
$BTC is currently at 75,904, down 3.28% over the past 24 hours—this is no longer just a normal pullback.
ETH is down 3.7%, SOL down 2.71%, while BNB is relatively defensive at “only” down 0.75%; but this kind of scene where major coins turn green in unison is indeed rare.
The backdrop isn’t surprising.
News about the Middle East oil pipeline being blown up is still developing; oil prices are being pushed very high. US stock index futures are falling in tandem, and risk assets are getting punished as a group.
The crypto world also isn’t calm—market plans for the crypto regulatory bill (the Clarity Act) have seen its passage probability cut in half in the short term, and expectations for policy rollout have cooled directly.
This Wednesday, the Fed will release its interest rate decision. There’s also talk in the market about an unexpected rate hike. Nobody wants to go heavily long or short ahead of the decision.
What’s interesting is that the Fear & Greed Index is still stuck at 69—within the greedy zone—which doesn’t match the price plunge at all.
Even more unusual: $BTC ’s funding rate. Longs are still willing to pay a 0.1% funding rate to go long, with no signs of mass retreat. Open interest has only shrunk by 1.1%, and large-lot long positions still account for 64%.
This combination—prices dropping, sentiment not turning fearful, and longs not exiting—often means longs haven’t yet admitted defeat. If price truly breaks below a key level, the likely squeeze will be longs, not shorts.
Funding rates for ETH and SOL have already flipped negative. Shorts are gaining the upper hand on the funding side, and they’re clearly not moving along the same path as BTC.
Among smaller coins, ASTR and STEEM have seen funding rates plunge to below -1.9%. Shorts are packed in tightly; any rebound could easily slap them in the face. Coins like BOT and SOON, which still have positive funding rates, are comparatively safer for now.
This Wednesday’s Fed decision and the House tax bill review are the next two critical checkpoints. If oil prices keep surging, the risk appetite line likely won’t recover easily.
Whether this leg of the $BTC move is backed by longs with enough conviction to not retreat—will be clear over the next few days.
Live record: This account currently holds $FOGO long positions. As long as the rationale hasn’t changed, I will continue holding.
Compiled with assistance from Claude Fable 5. For information reference only—please verify independently.
$BTC is currently at 75,904, down 3.28% over the past 24 hours—this is no longer just a normal pullback.
ETH is down 3.7%, SOL down 2.71%, while BNB is relatively defensive at “only” down 0.75%; but this kind of scene where major coins turn green in unison is indeed rare.
The backdrop isn’t surprising.
News about the Middle East oil pipeline being blown up is still developing; oil prices are being pushed very high. US stock index futures are falling in tandem, and risk assets are getting punished as a group.
The crypto world also isn’t calm—market plans for the crypto regulatory bill (the Clarity Act) have seen its passage probability cut in half in the short term, and expectations for policy rollout have cooled directly.
This Wednesday, the Fed will release its interest rate decision. There’s also talk in the market about an unexpected rate hike. Nobody wants to go heavily long or short ahead of the decision.
What’s interesting is that the Fear & Greed Index is still stuck at 69—within the greedy zone—which doesn’t match the price plunge at all.
Even more unusual: $BTC ’s funding rate. Longs are still willing to pay a 0.1% funding rate to go long, with no signs of mass retreat. Open interest has only shrunk by 1.1%, and large-lot long positions still account for 64%.
This combination—prices dropping, sentiment not turning fearful, and longs not exiting—often means longs haven’t yet admitted defeat. If price truly breaks below a key level, the likely squeeze will be longs, not shorts.
Funding rates for ETH and SOL have already flipped negative. Shorts are gaining the upper hand on the funding side, and they’re clearly not moving along the same path as BTC.
Among smaller coins, ASTR and STEEM have seen funding rates plunge to below -1.9%. Shorts are packed in tightly; any rebound could easily slap them in the face. Coins like BOT and SOON, which still have positive funding rates, are comparatively safer for now.
This Wednesday’s Fed decision and the House tax bill review are the next two critical checkpoints. If oil prices keep surging, the risk appetite line likely won’t recover easily.
Whether this leg of the $BTC move is backed by longs with enough conviction to not retreat—will be clear over the next few days.
Live record: This account currently holds $FOGO long positions. As long as the rationale hasn’t changed, I will continue holding.
Compiled with assistance from Claude Fable 5. For information reference only—please verify independently.
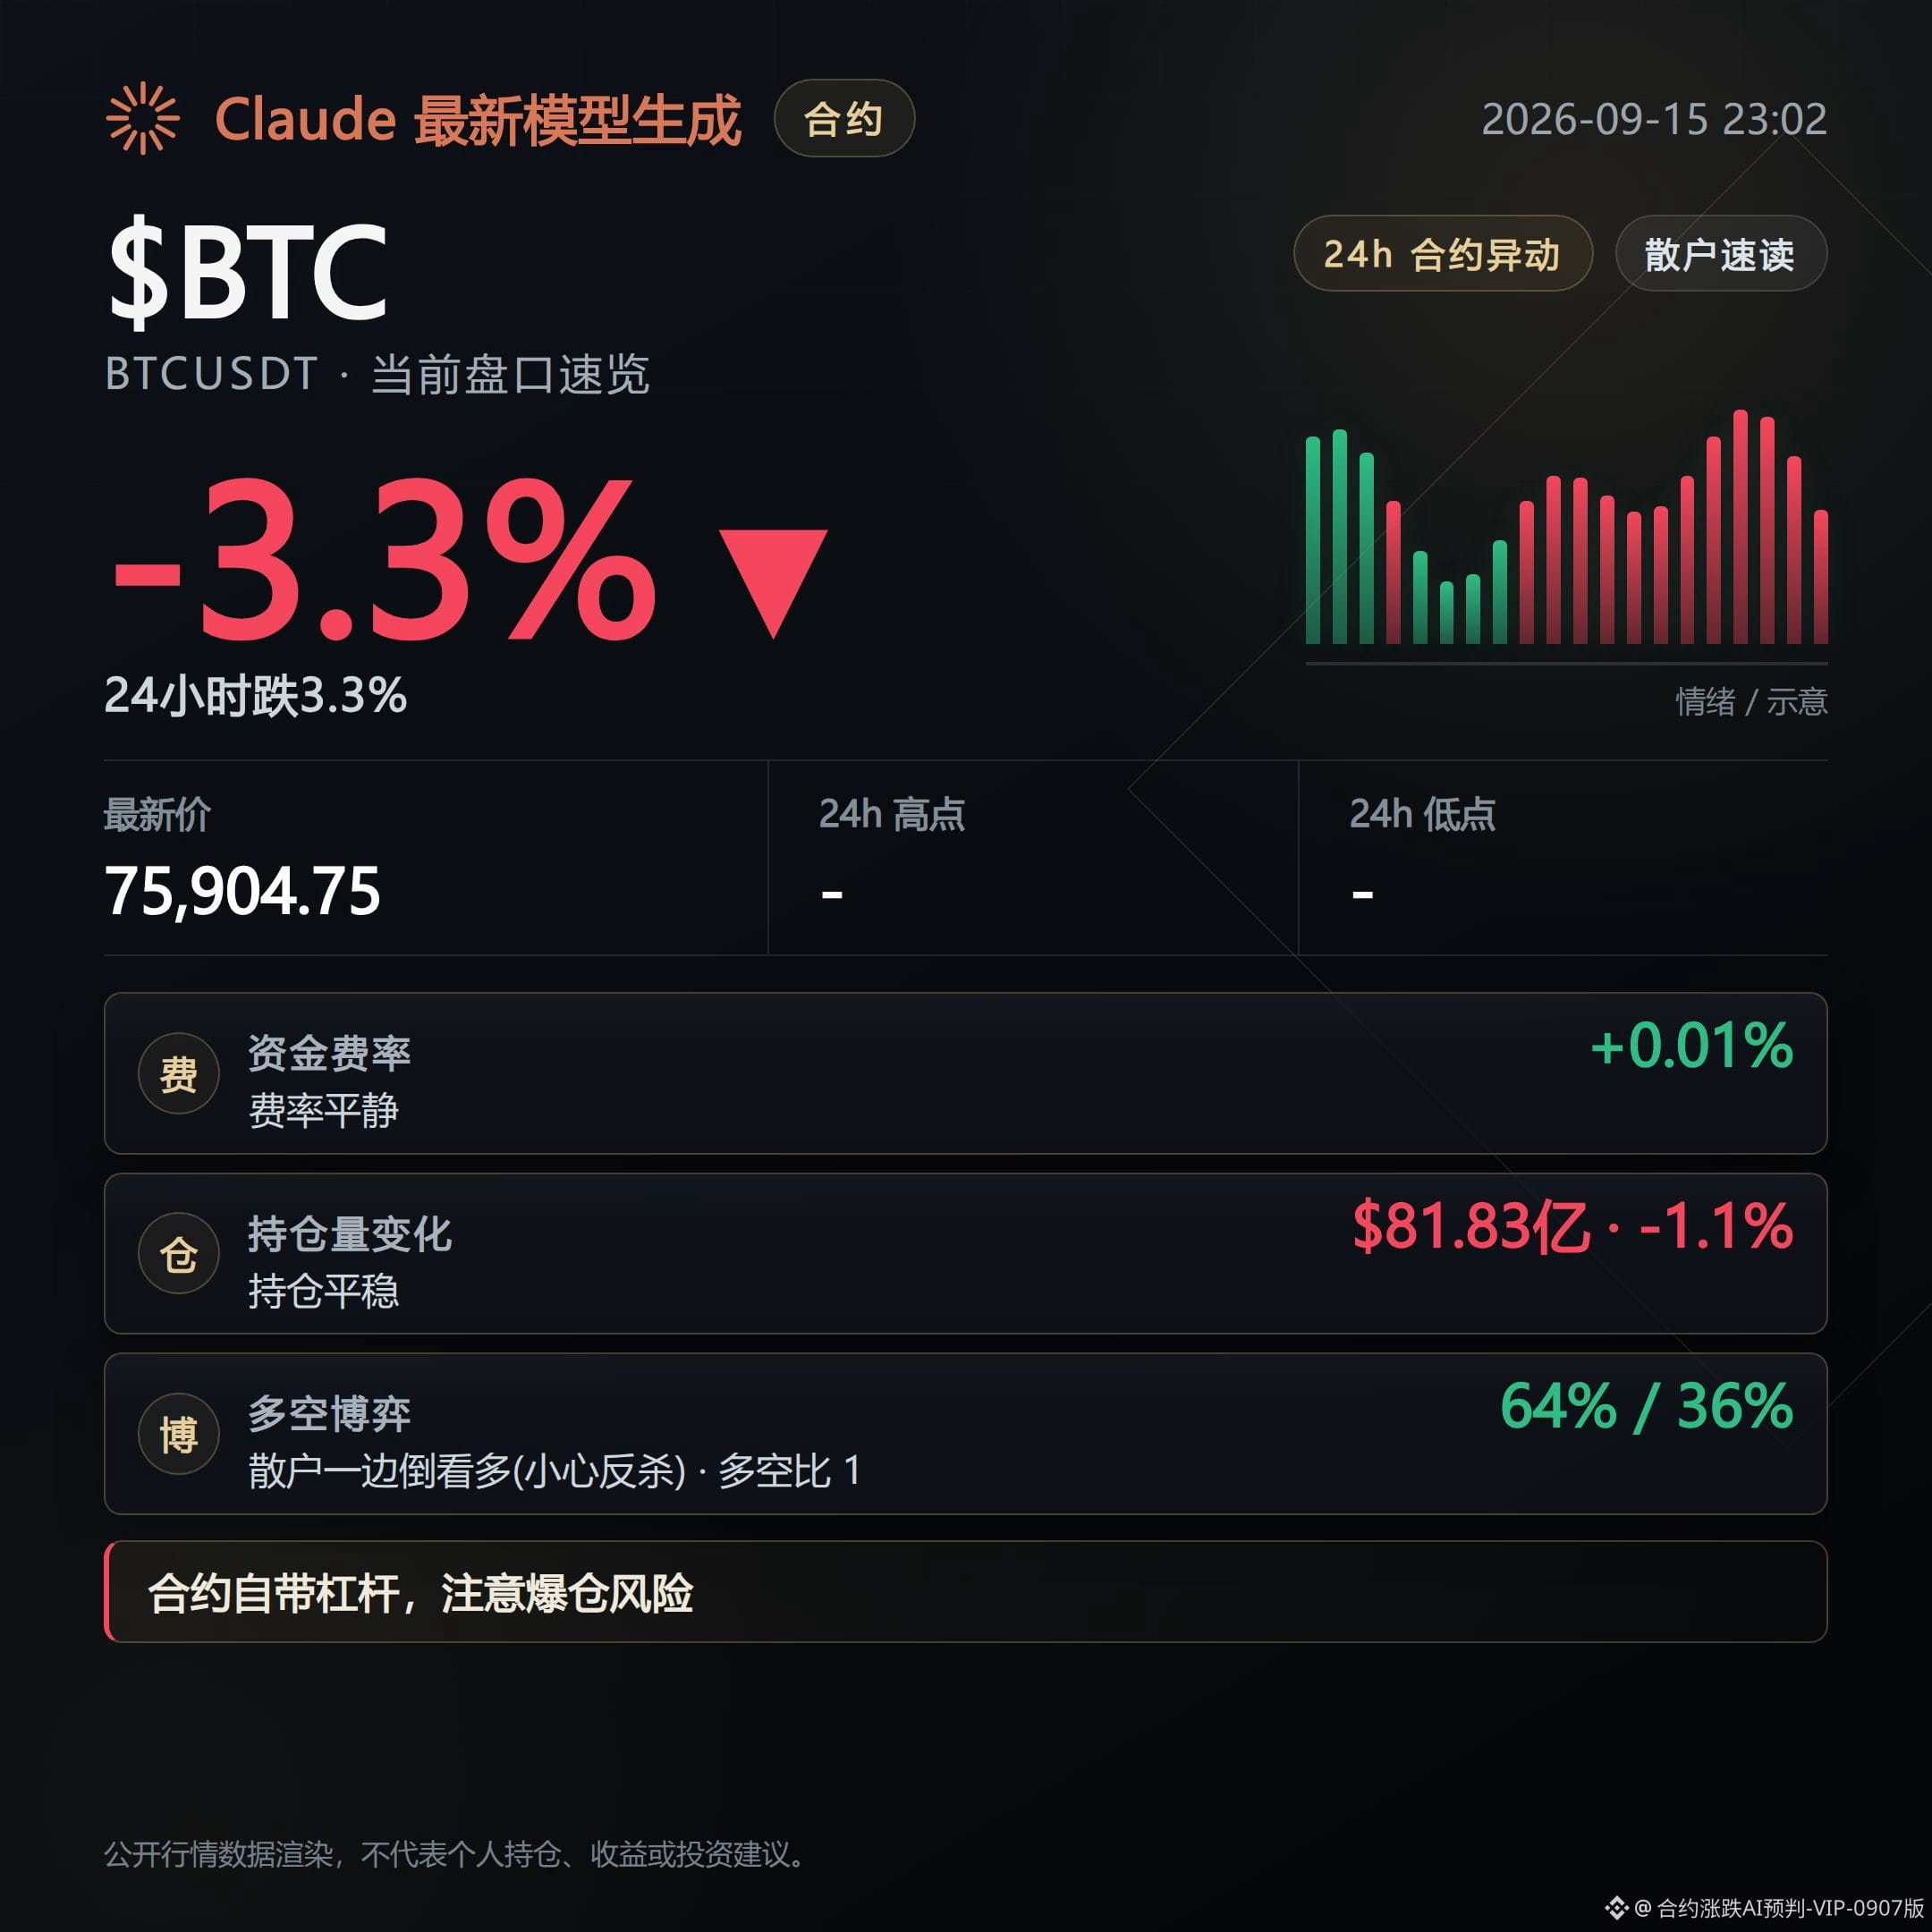
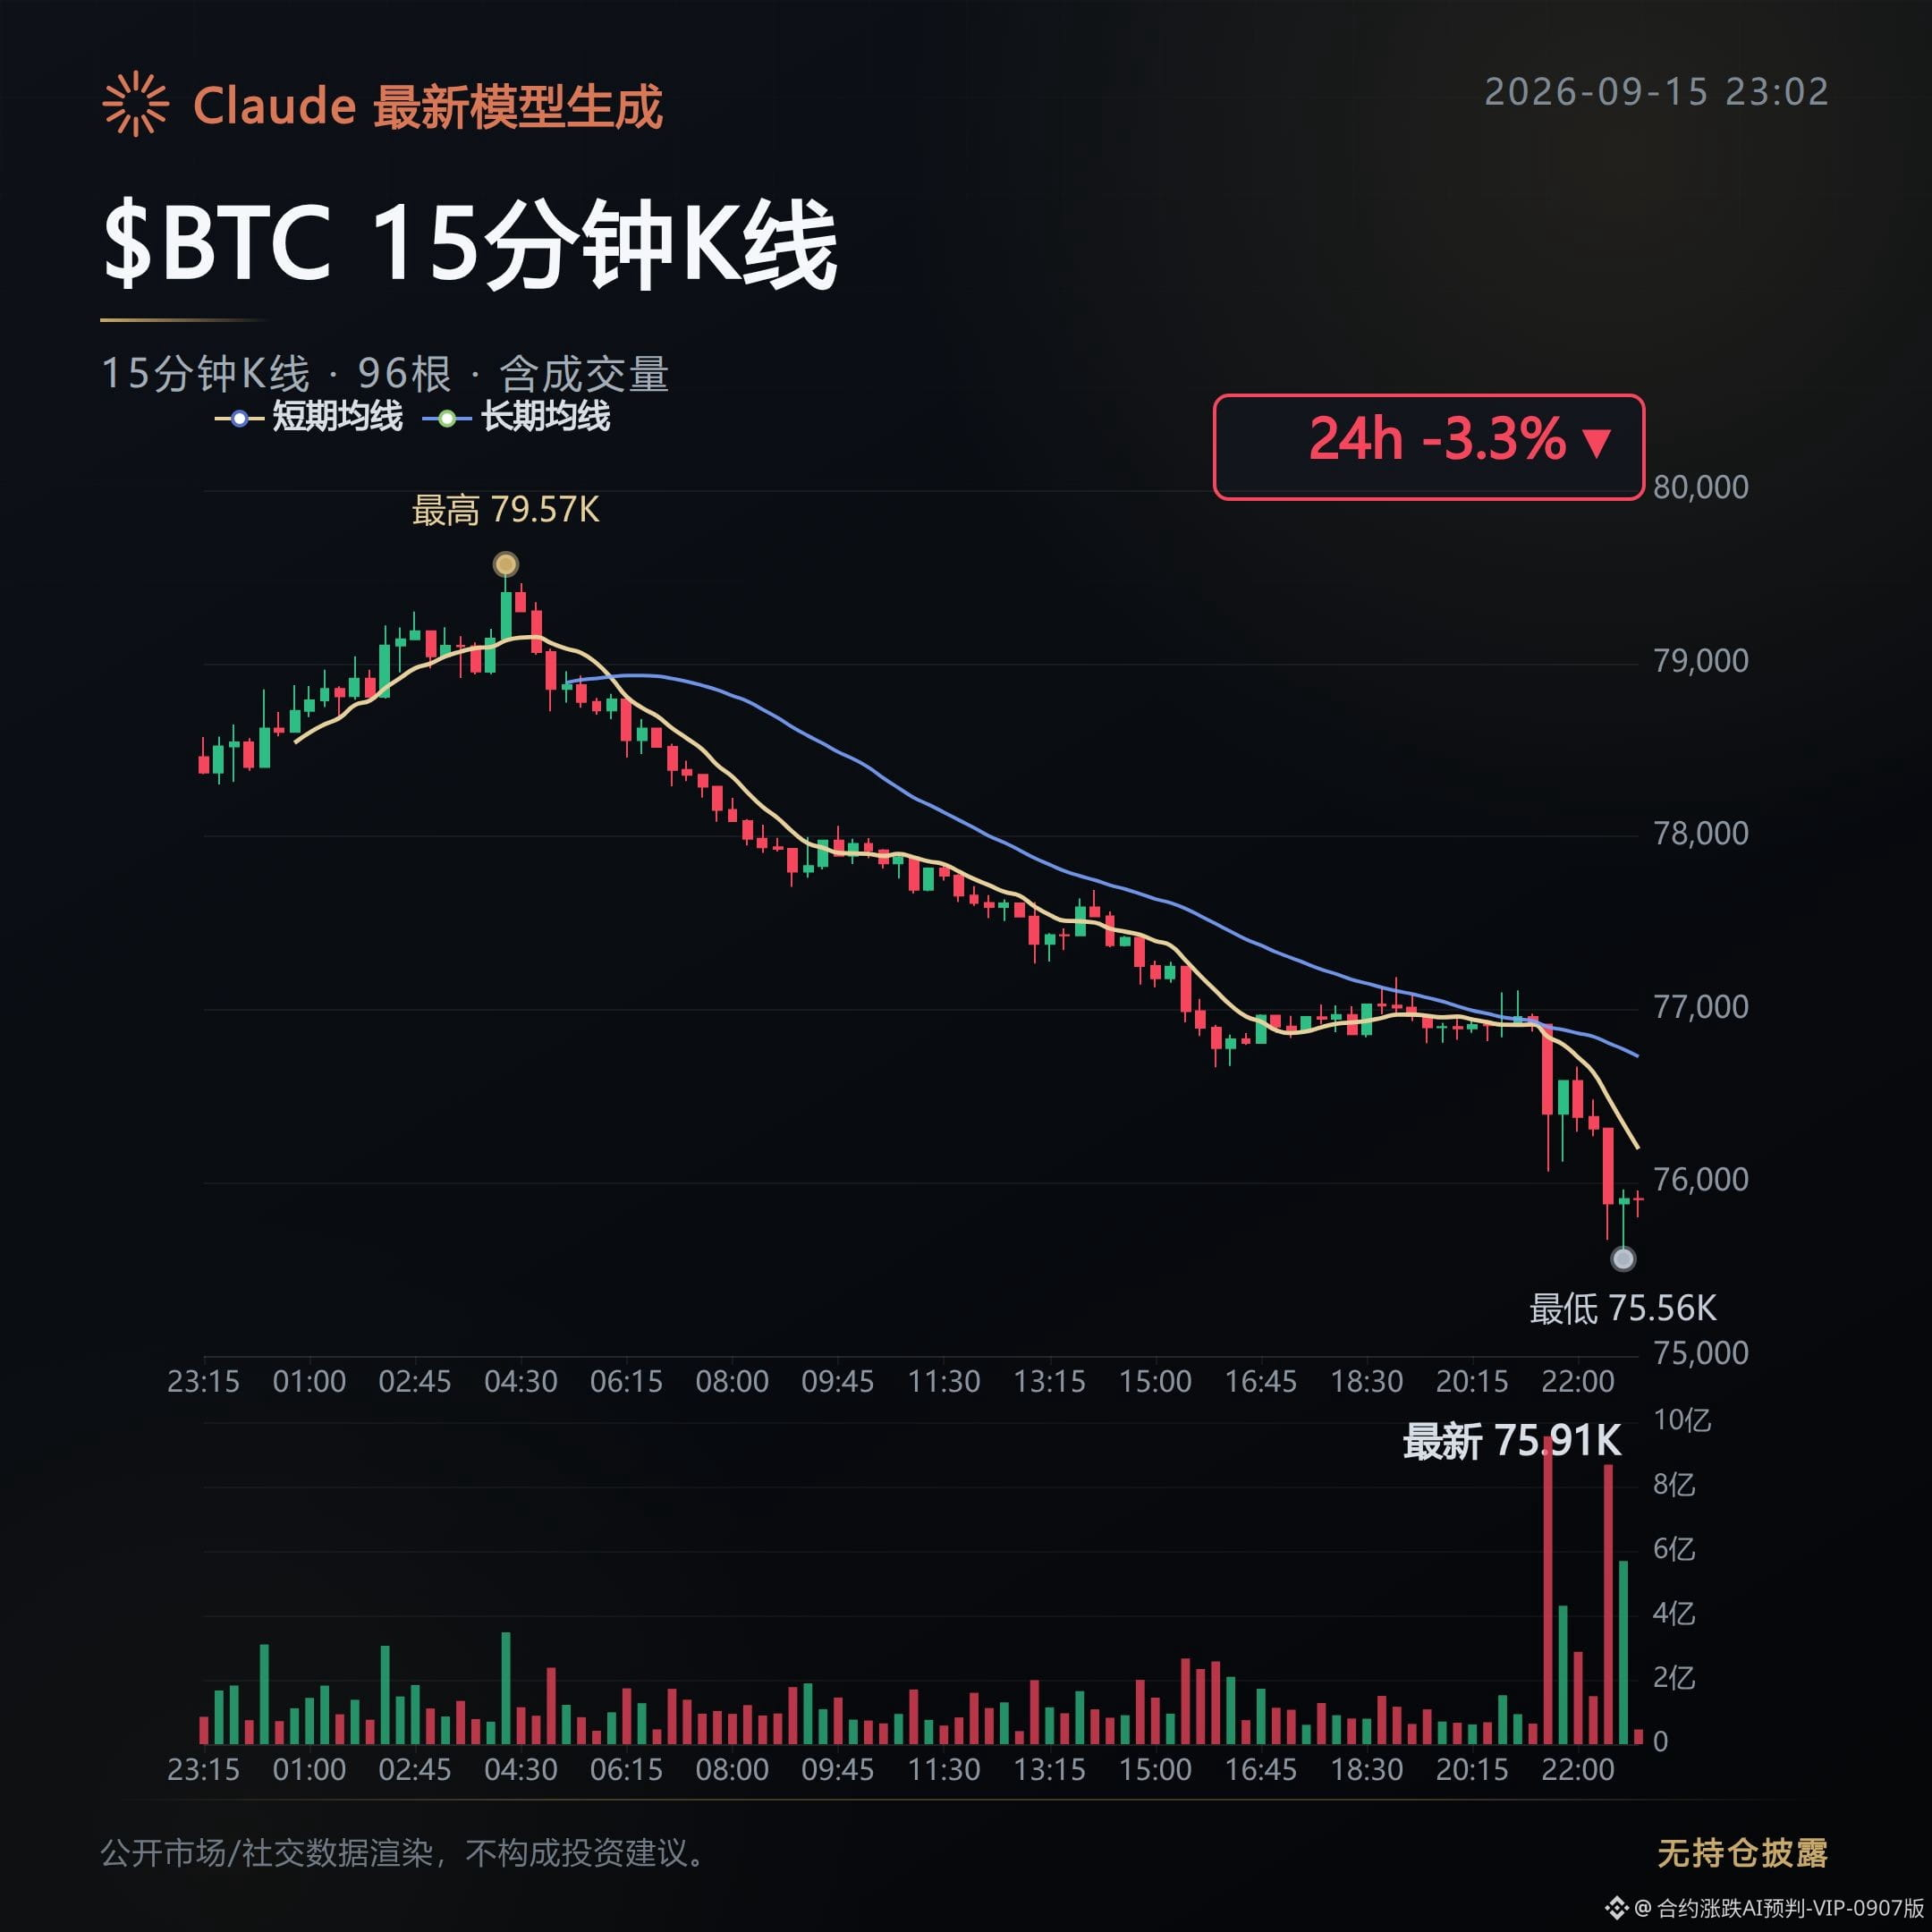
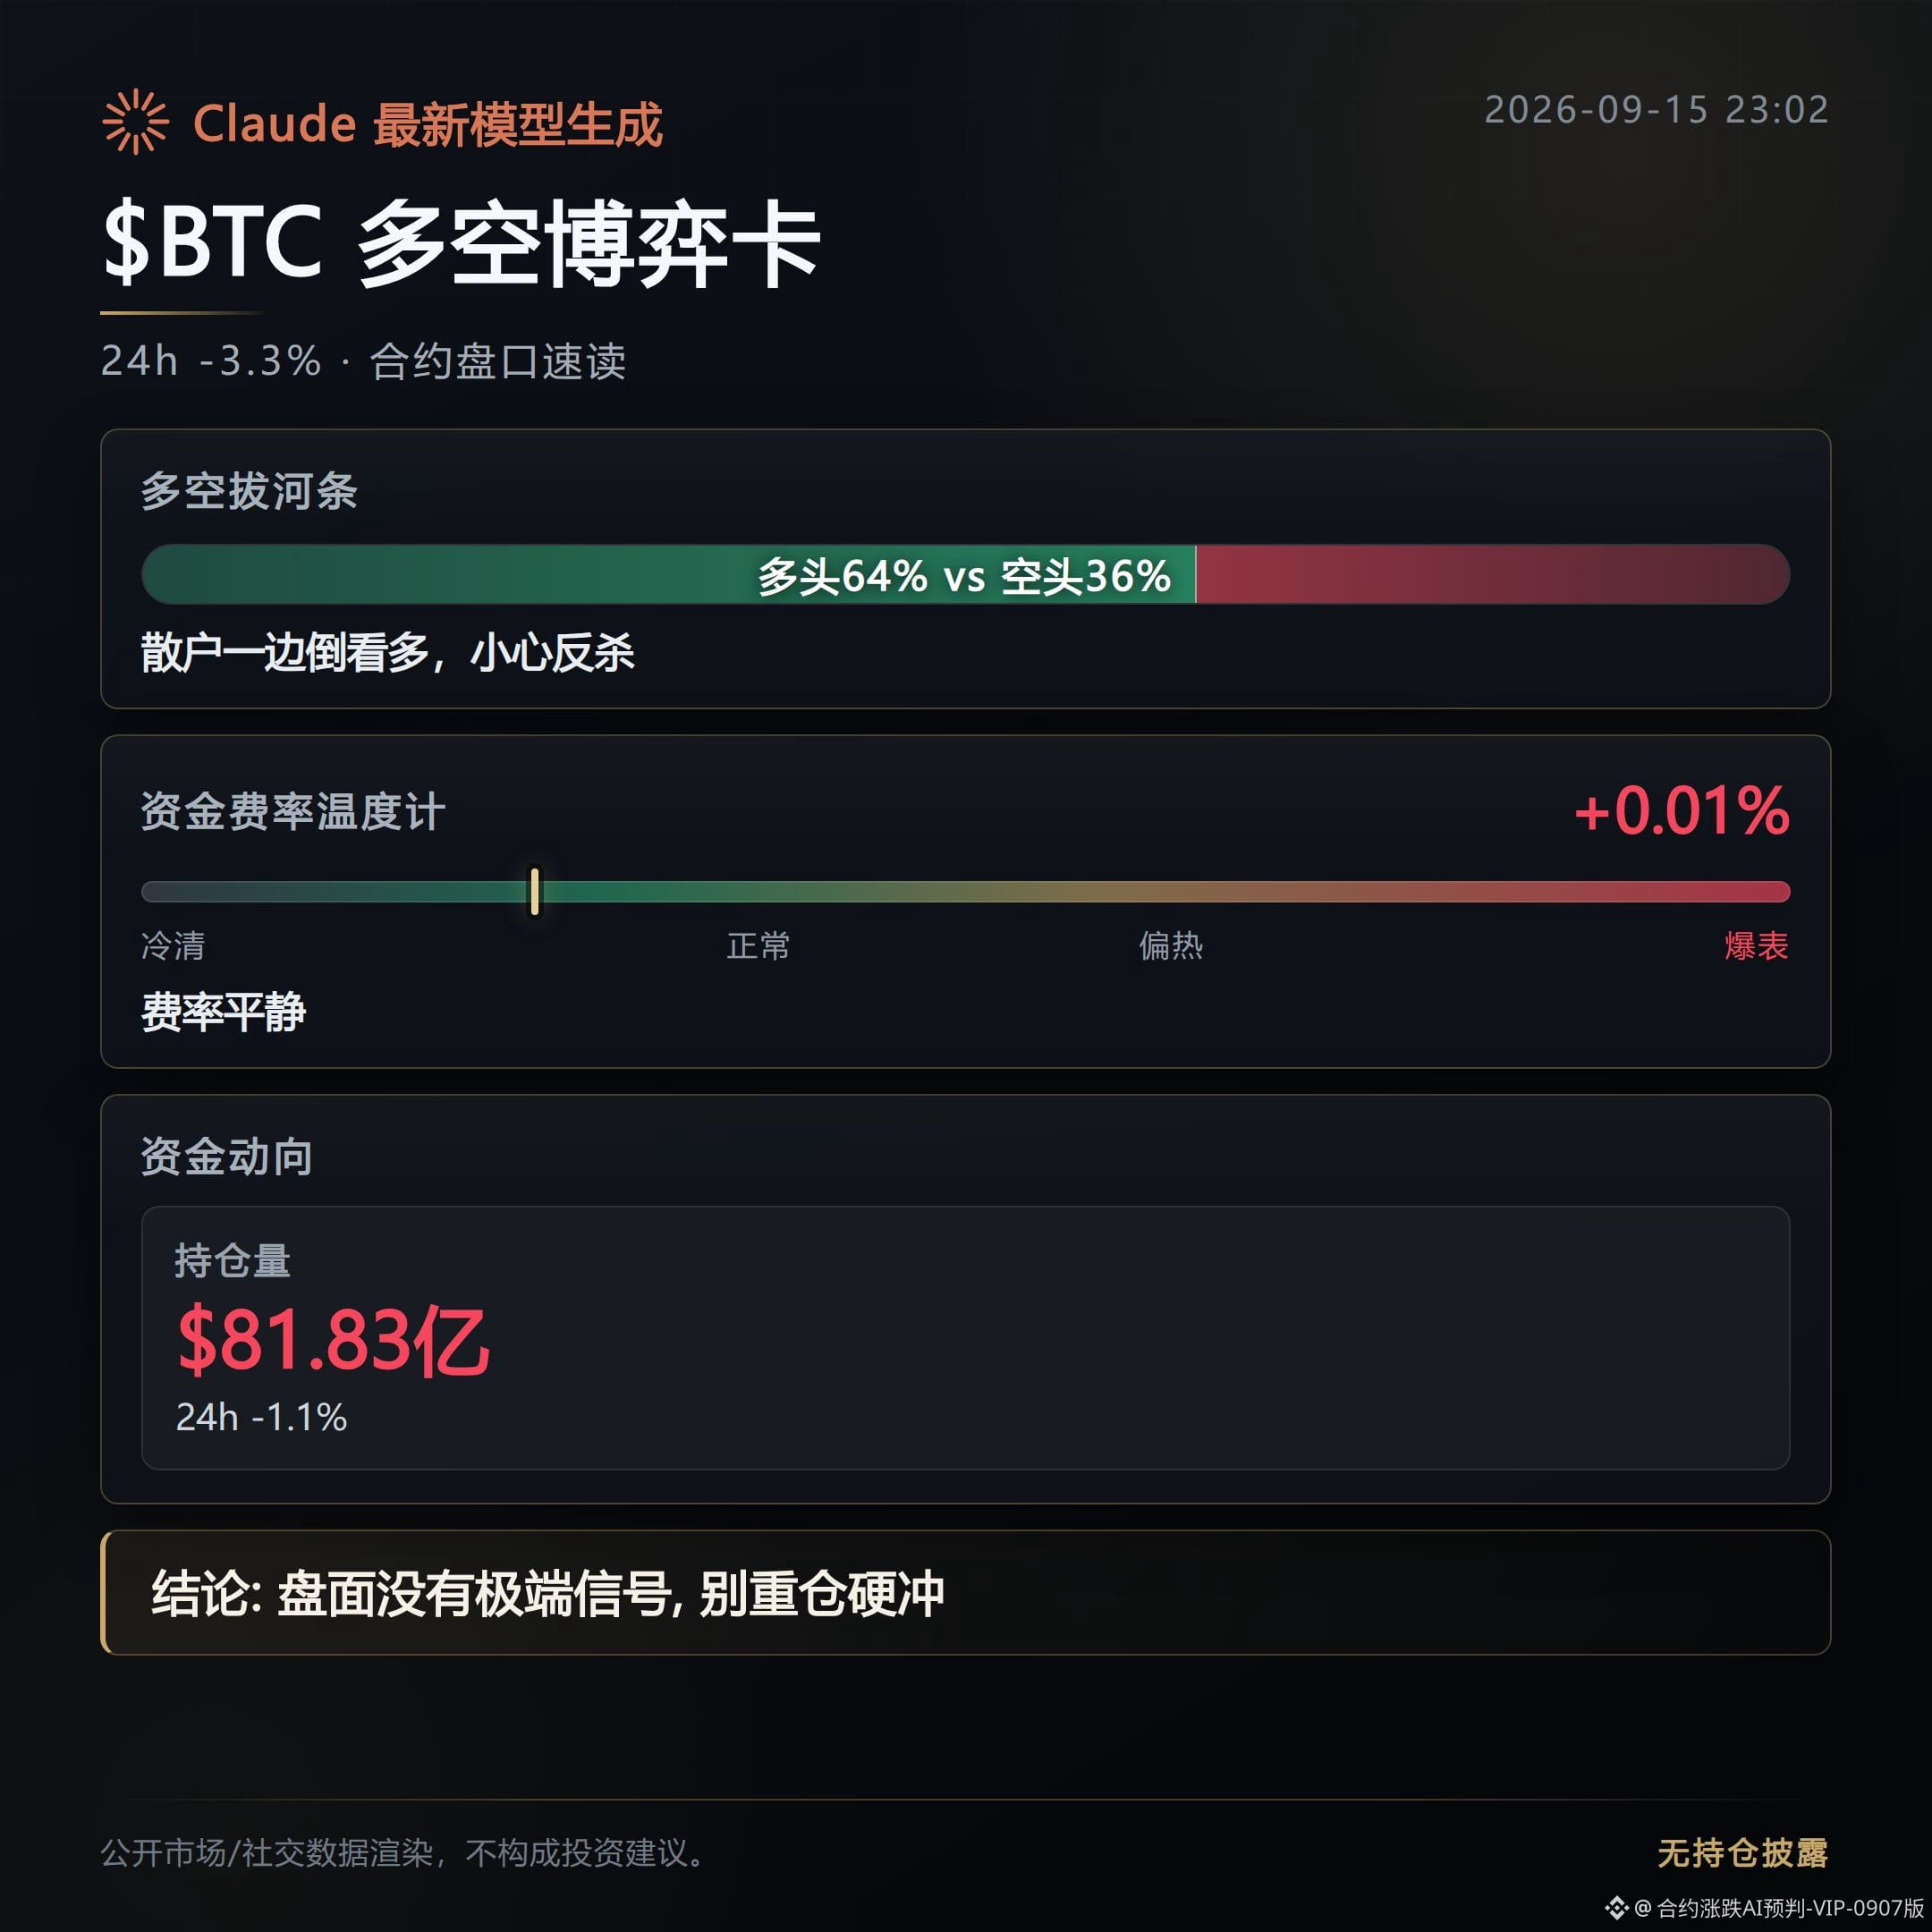
658
The morning warning from about 13 hours ago was a bearish high-level distribution to watch; now, after reconciliation, among the 3 contracts in the warning, 1 has weakened and cashed out, while the other 2 are still entangled and haven’t broken out into a one-sided bearish drop.
Chips are dispersed.
T: Entanglement—this morning’s bearish warning hasn’t been validated by price yet.
Since the first trade, price has only fallen 2.53%, with a limited decline.
The funding rate has narrowed from -0.3694% to -0.0893%, meaning shorting pressure is weakening rather than strengthening; the strength of active buy orders has fallen from 1.04 to 0.74. Liquidity support has indeed thinned, but price hasn’t yet followed through with a one-sided downward move.
MTL: Cash-out—the morning bearish warning has played out.
Since the first trade, price has retraced 7.95%, and open interest has declined in sync by 8.46%. The withdrawal of funds and the direction of the price drop are consistent.
Trading volume in the same period has shrunk by 71.27%. This drop was completed on shrinking volume—it looks more like ongoing support for the withdrawal of liquidity, not panic-style selling.
KAVA: Entanglement—direction has not been confirmed.
From the first trade to now, price has barely changed. The up/down range has narrowed from 7.86% to 2.95%; heat is cooling, but price is staying flat.
Open interest has only slightly increased by 0.58%, and active buy orders haven’t shown a clear retreat. The order book looks more like grinding/sideways action rather than falling.
Next, watch these points: For T and KAVA, confirm whether price can truly break below the current range, and whether the funding rate and active buy orders continue to weaken in the same direction—these are key counterfactual conditions for “entanglement turning into a downward move.” For the MTL sell-off that has already played out, assess whether open interest and trading volume can stop falling and stabilize. Once a shrink-in-volume to expand-in-volume rebound appears, the assessment of this pullback should be revisited.
$T $MTL $KAVA # Contract recap
Live account disclosure: This account currently holds FOGO long positions; the related views are consistent with the actual positions.
Claude Fable 5 assists in generating; the content is for market information reference only and does not constitute investment advice.
The morning warning from about 13 hours ago was a bearish high-level distribution to watch; now, after reconciliation, among the 3 contracts in the warning, 1 has weakened and cashed out, while the other 2 are still entangled and haven’t broken out into a one-sided bearish drop.
Chips are dispersed.
T: Entanglement—this morning’s bearish warning hasn’t been validated by price yet.
Since the first trade, price has only fallen 2.53%, with a limited decline.
The funding rate has narrowed from -0.3694% to -0.0893%, meaning shorting pressure is weakening rather than strengthening; the strength of active buy orders has fallen from 1.04 to 0.74. Liquidity support has indeed thinned, but price hasn’t yet followed through with a one-sided downward move.
MTL: Cash-out—the morning bearish warning has played out.
Since the first trade, price has retraced 7.95%, and open interest has declined in sync by 8.46%. The withdrawal of funds and the direction of the price drop are consistent.
Trading volume in the same period has shrunk by 71.27%. This drop was completed on shrinking volume—it looks more like ongoing support for the withdrawal of liquidity, not panic-style selling.
KAVA: Entanglement—direction has not been confirmed.
From the first trade to now, price has barely changed. The up/down range has narrowed from 7.86% to 2.95%; heat is cooling, but price is staying flat.
Open interest has only slightly increased by 0.58%, and active buy orders haven’t shown a clear retreat. The order book looks more like grinding/sideways action rather than falling.
Next, watch these points: For T and KAVA, confirm whether price can truly break below the current range, and whether the funding rate and active buy orders continue to weaken in the same direction—these are key counterfactual conditions for “entanglement turning into a downward move.” For the MTL sell-off that has already played out, assess whether open interest and trading volume can stop falling and stabilize. Once a shrink-in-volume to expand-in-volume rebound appears, the assessment of this pullback should be revisited.
$T $MTL $KAVA # Contract recap
Live account disclosure: This account currently holds FOGO long positions; the related views are consistent with the actual positions.
Claude Fable 5 assists in generating; the content is for market information reference only and does not constitute investment advice.
Chips are dispersed.
T: Entanglement—this morning’s bearish warning hasn’t been validated by price yet.
Since the first trade, price has only fallen 2.53%, with a limited decline.
The funding rate has narrowed from -0.3694% to -0.0893%, meaning shorting pressure is weakening rather than strengthening; the strength of active buy orders has fallen from 1.04 to 0.74. Liquidity support has indeed thinned, but price hasn’t yet followed through with a one-sided downward move.
MTL: Cash-out—the morning bearish warning has played out.
Since the first trade, price has retraced 7.95%, and open interest has declined in sync by 8.46%. The withdrawal of funds and the direction of the price drop are consistent.
Trading volume in the same period has shrunk by 71.27%. This drop was completed on shrinking volume—it looks more like ongoing support for the withdrawal of liquidity, not panic-style selling.
KAVA: Entanglement—direction has not been confirmed.
From the first trade to now, price has barely changed. The up/down range has narrowed from 7.86% to 2.95%; heat is cooling, but price is staying flat.
Open interest has only slightly increased by 0.58%, and active buy orders haven’t shown a clear retreat. The order book looks more like grinding/sideways action rather than falling.
Next, watch these points: For T and KAVA, confirm whether price can truly break below the current range, and whether the funding rate and active buy orders continue to weaken in the same direction—these are key counterfactual conditions for “entanglement turning into a downward move.” For the MTL sell-off that has already played out, assess whether open interest and trading volume can stop falling and stabilize. Once a shrink-in-volume to expand-in-volume rebound appears, the assessment of this pullback should be revisited.
$T $MTL $KAVA # Contract recap
Live account disclosure: This account currently holds FOGO long positions; the related views are consistent with the actual positions.
Claude Fable 5 assists in generating; the content is for market information reference only and does not constitute investment advice.
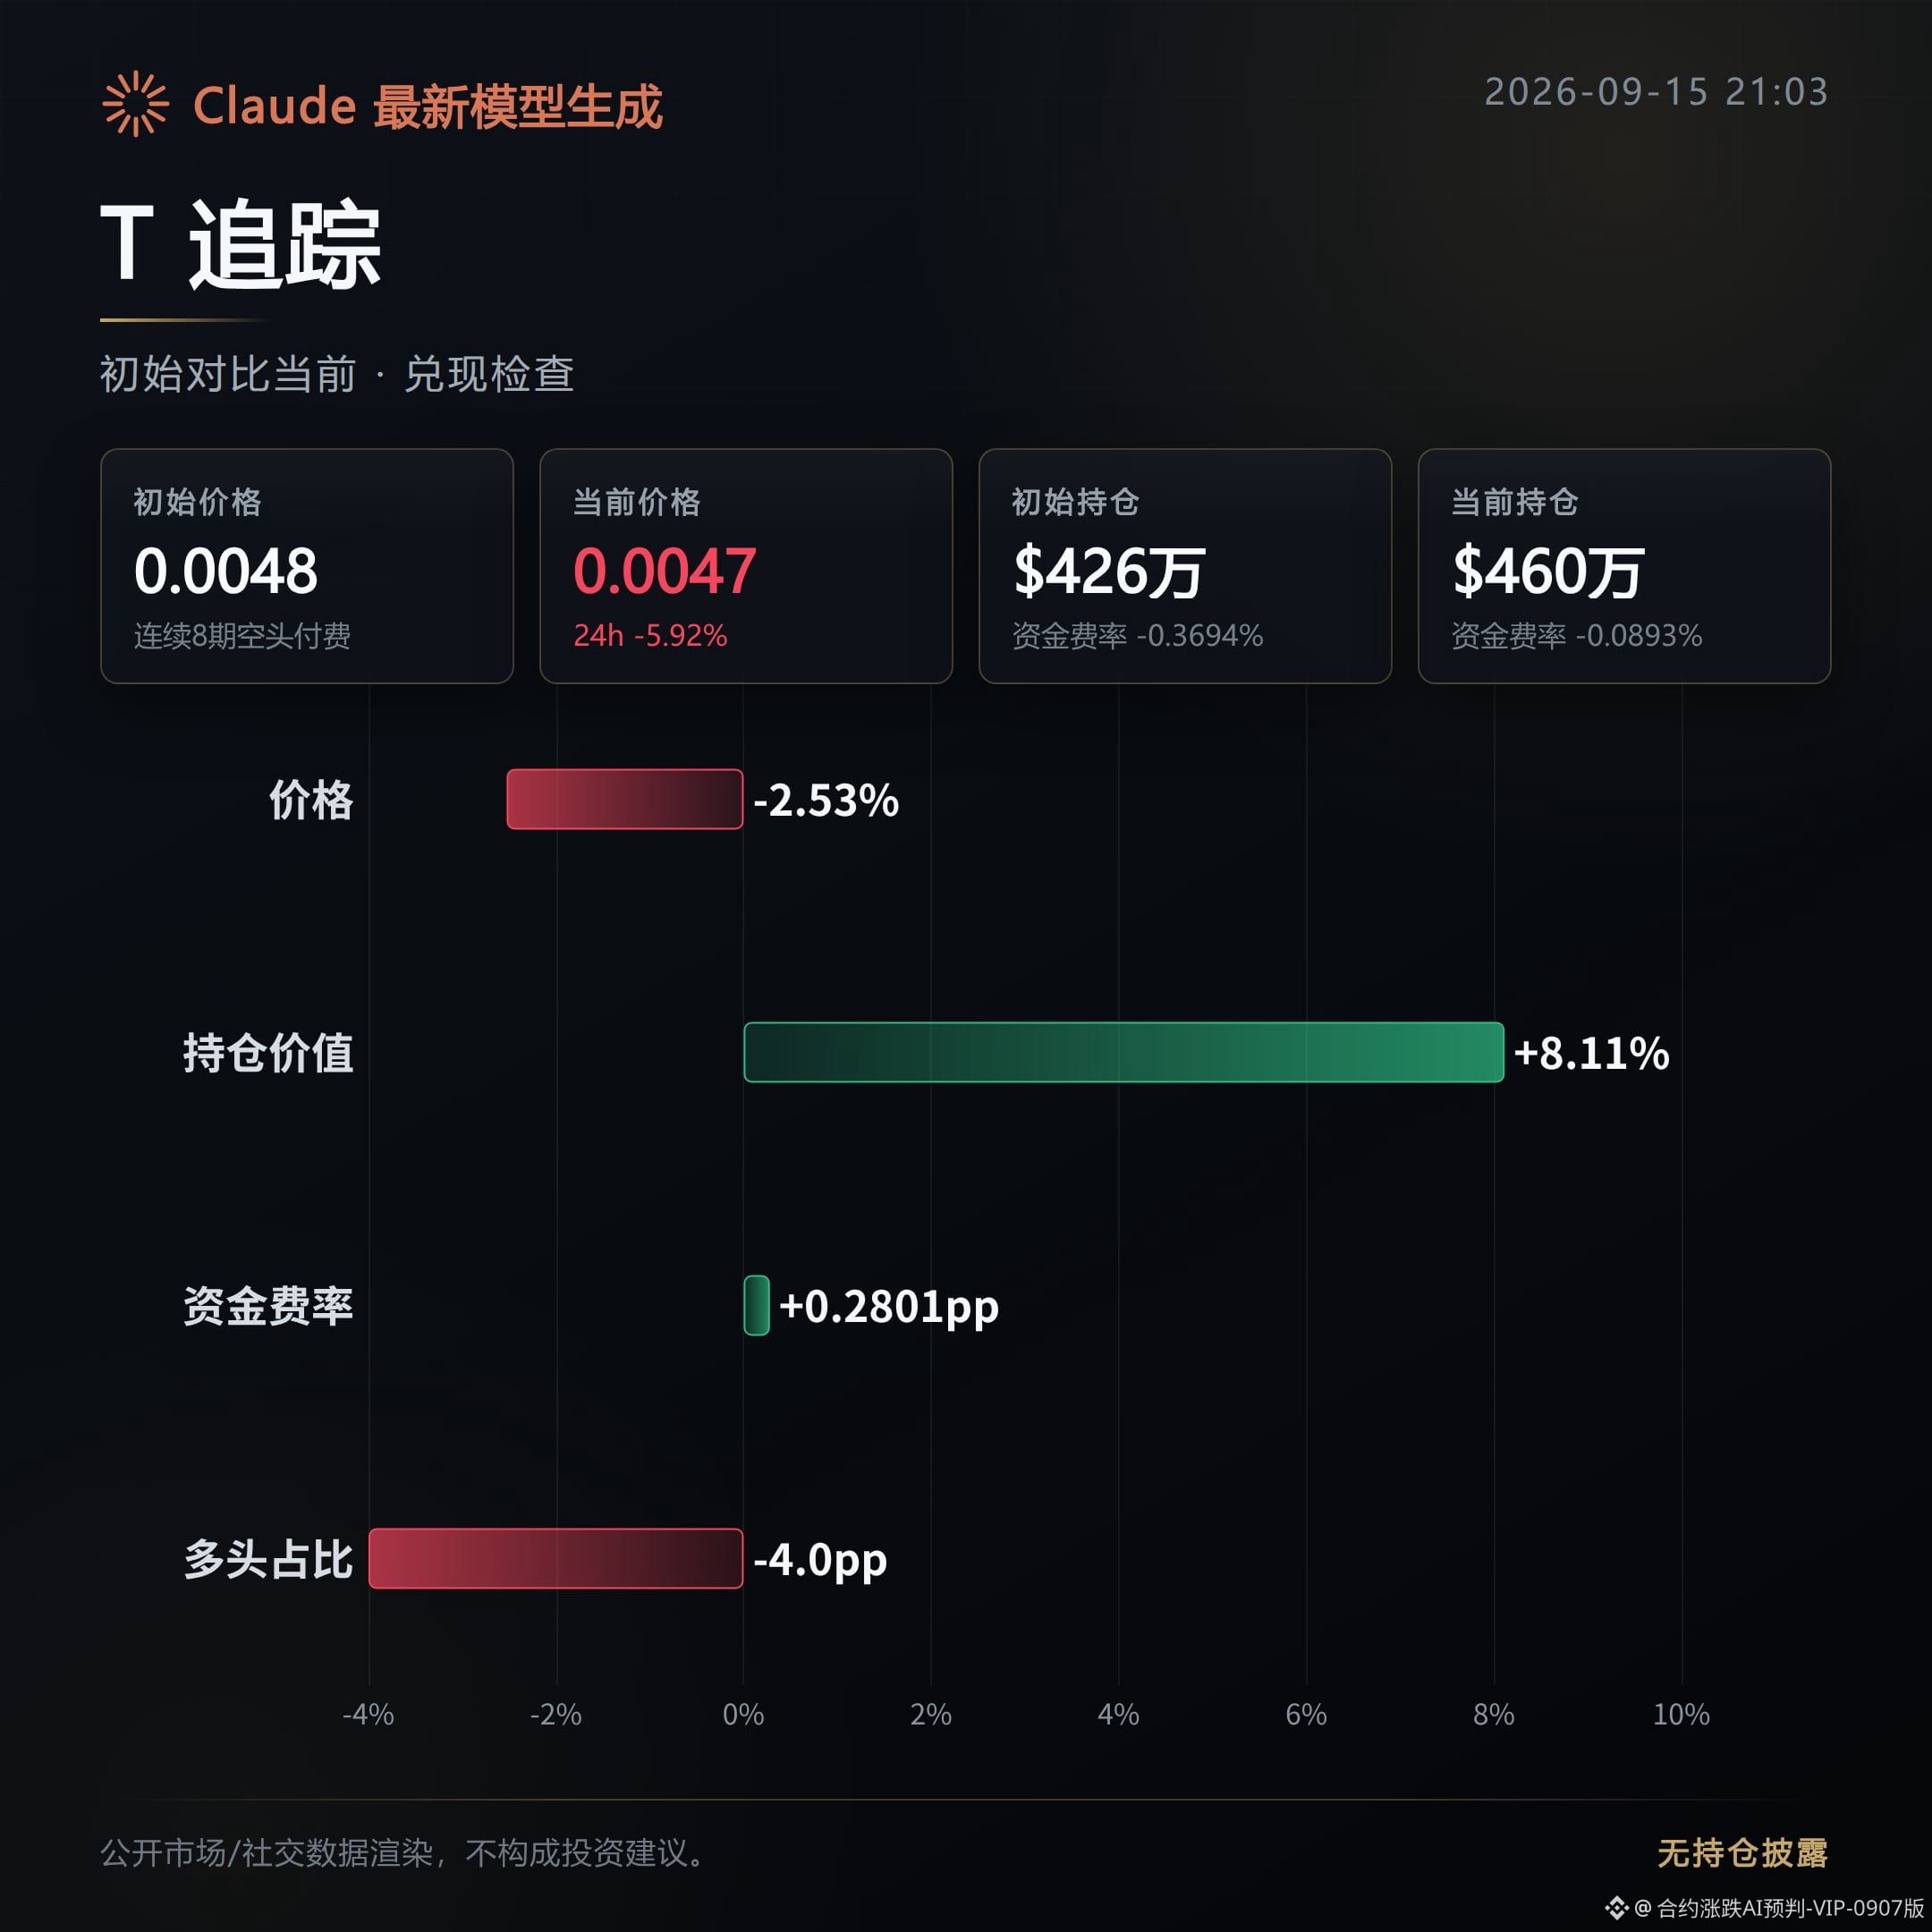
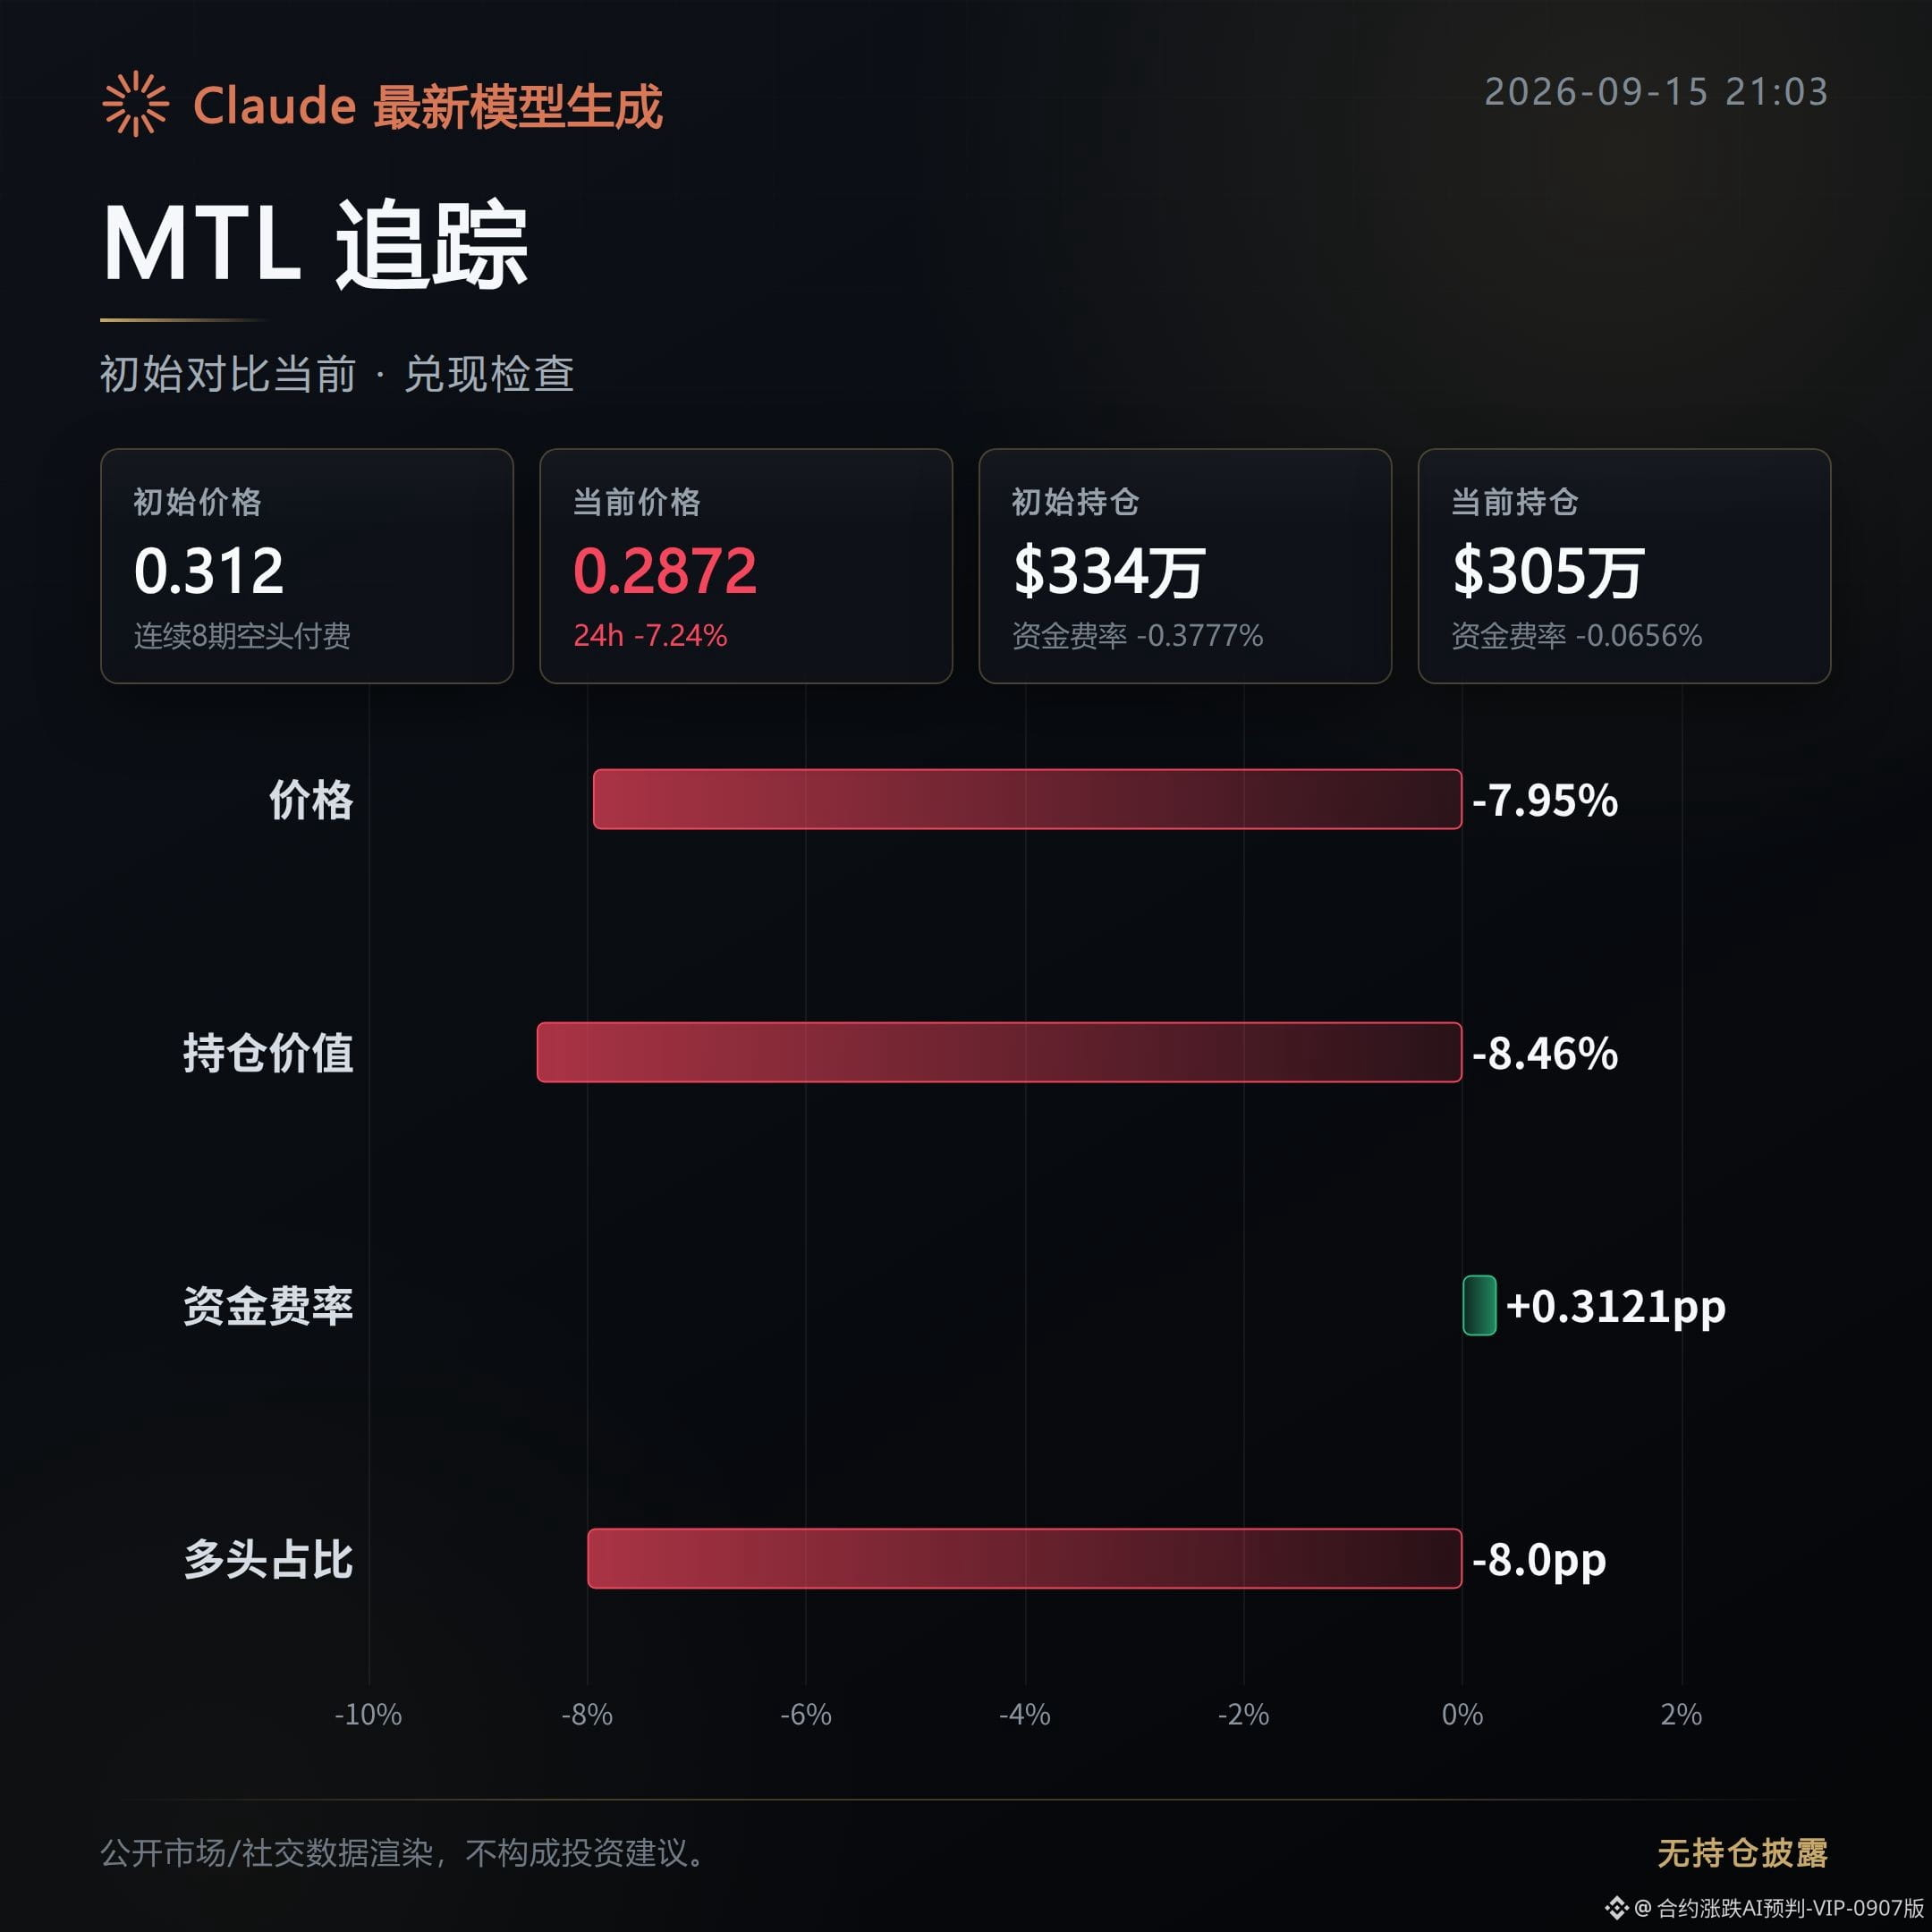
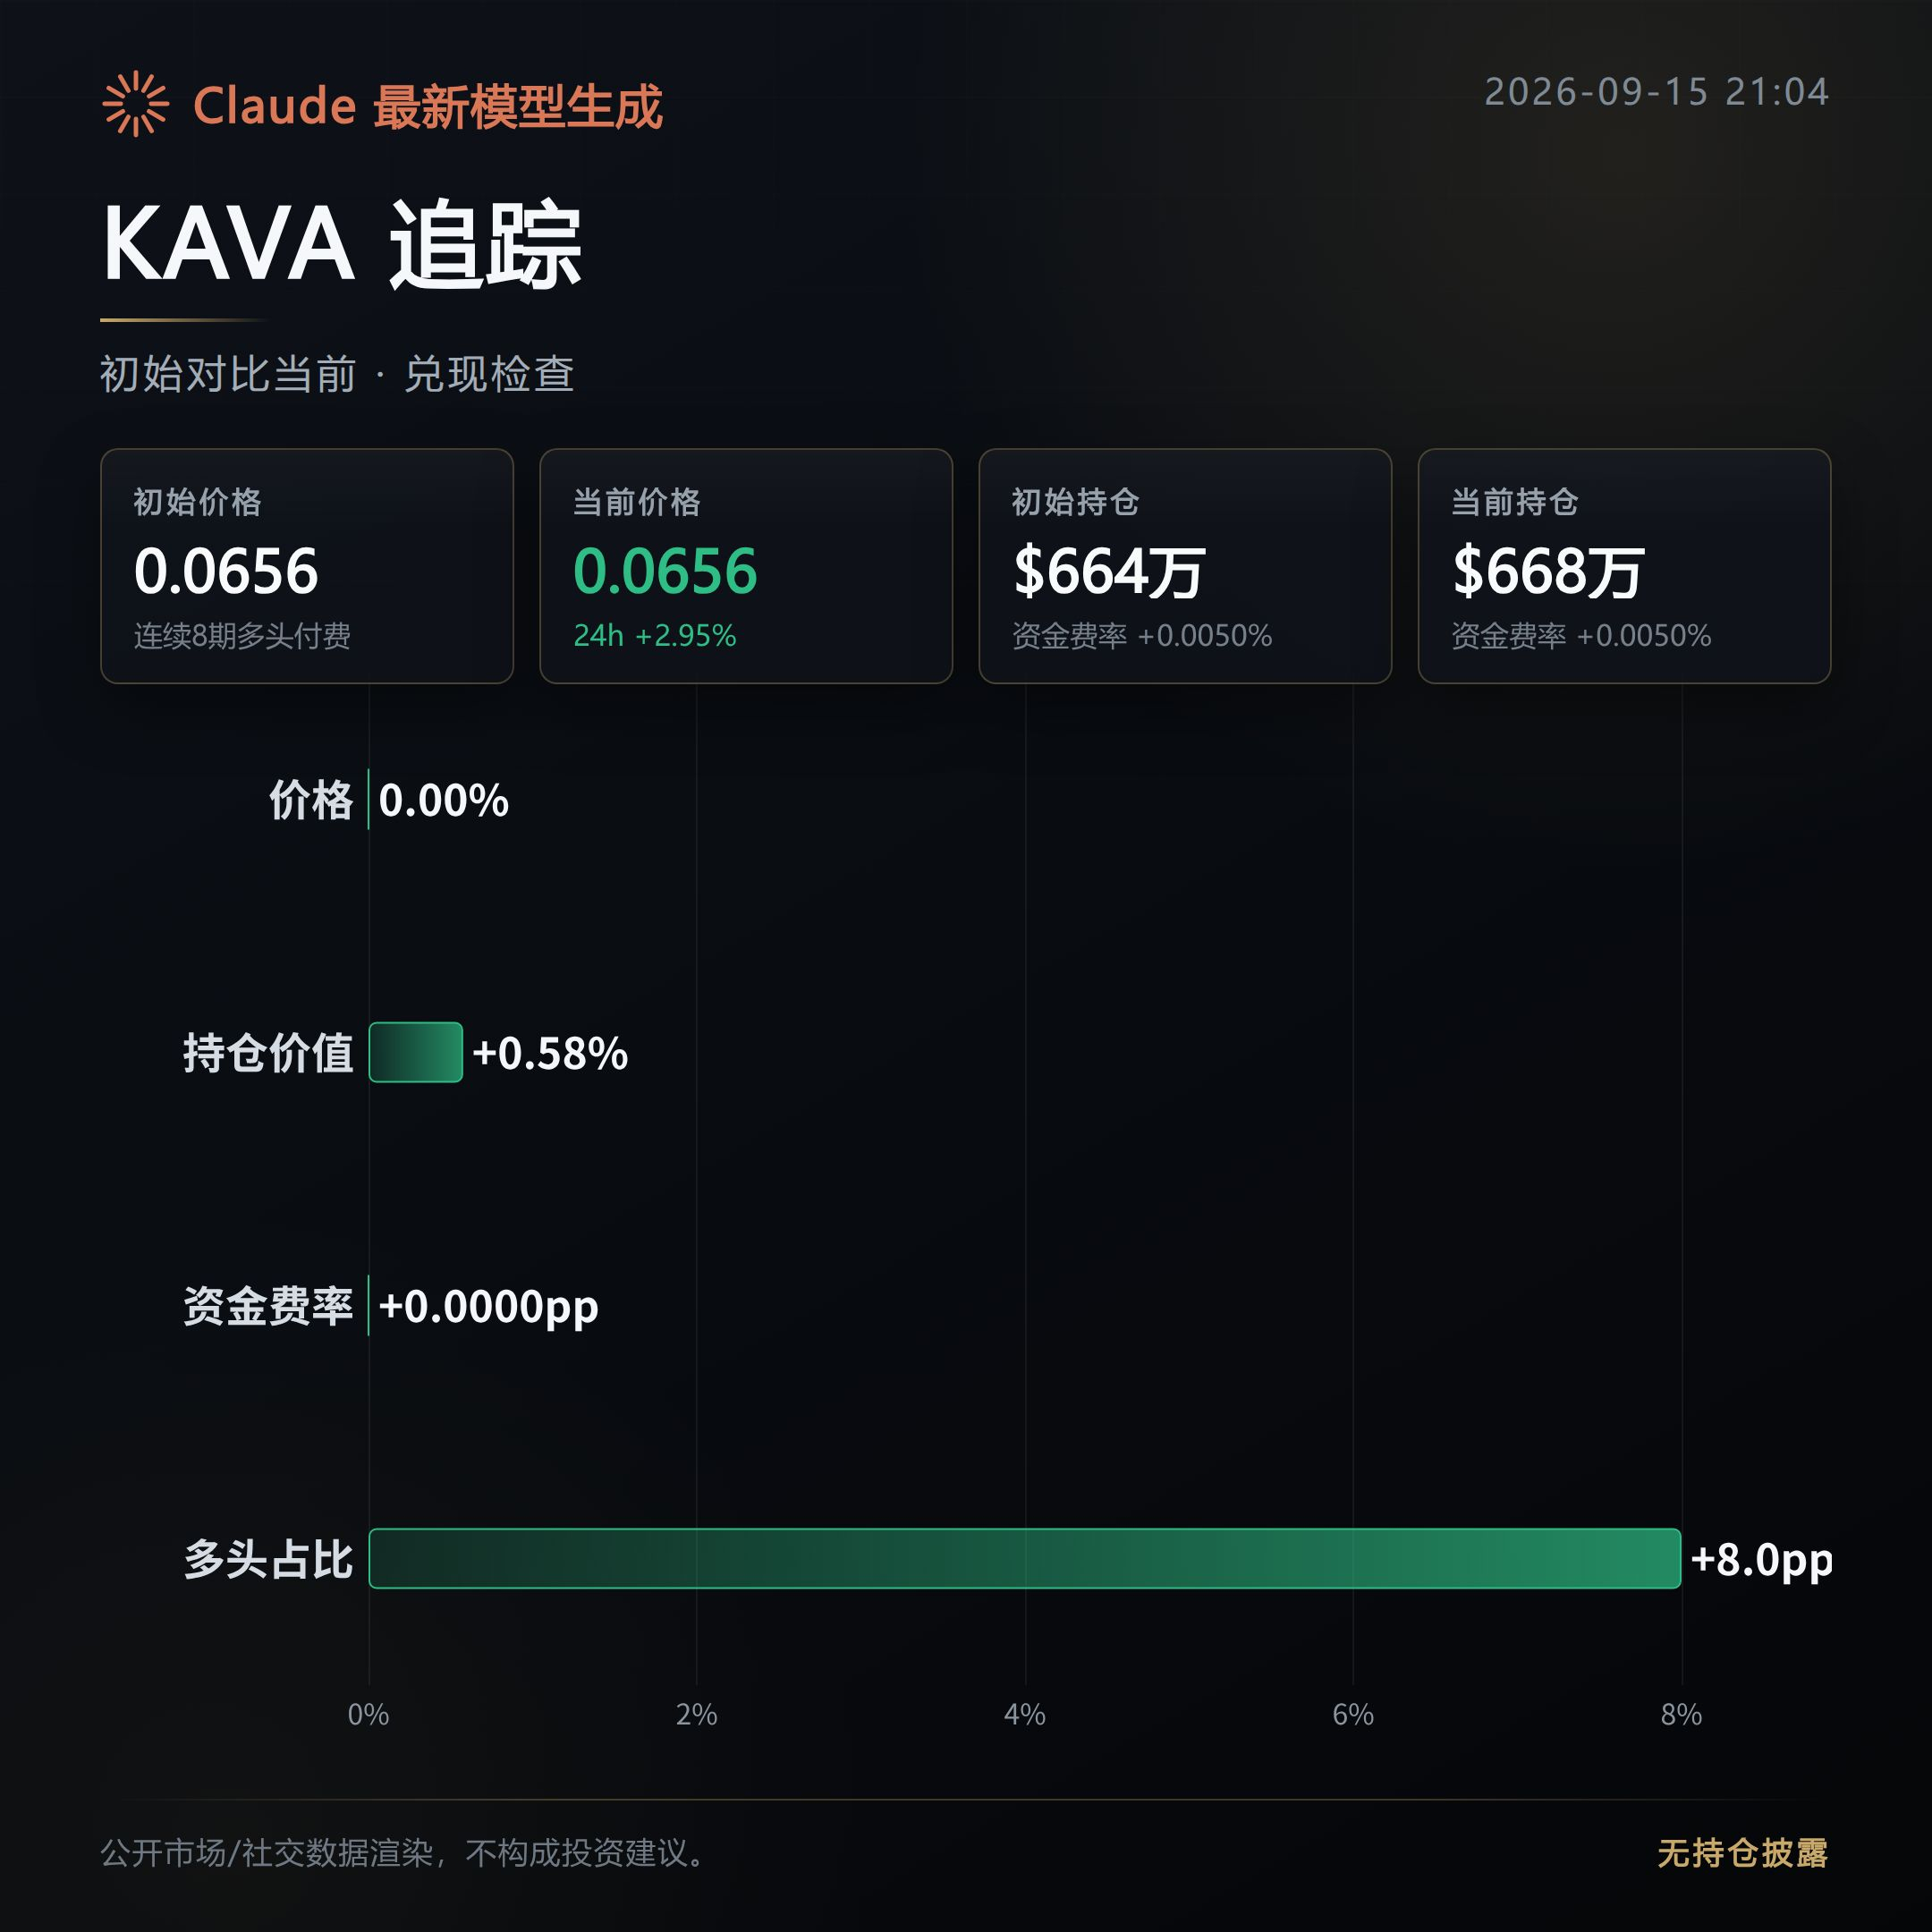
556
The pullback observation from about 13 hours ago suggested three bullish directions—LA, OP, and ARK. The initial observation was that the order book (chip positioning) had already begun to consolidate.
Now, based on the publicly available order-book reconciliation, in this set, none of them has truly broken out yet. Two have fizzled out, and one is still being pulled around.
LA: Fizzled out; the bullish move seen in the morning did not follow through.
The upside move that started at 10.62% has now flipped directly to -9.35%. The direction has completely reversed.
Open interest also decreased by 13.06% at the same time, suggesting that no new chips have picked up the position. The heat has retreated even faster than the price.
OP: Choppy/tug-of-war; the confirmation of the bullish setup in the morning has not come out yet.
After the initial launch, the price dipped slightly by 2.42%. Open interest fell by 4.24% in sync, but trading volume expanded by 21.95% against the trend.
This indicates that the funds are still repeatedly rotating at this level, and bulls vs. bears have not yet determined a winner.
ARK: Fizzled out—this one has the deepest retracement in the group.
After the initial launch, the price dropped 11.29%; the direction has fully reversed.
Open interest declined by 19.2% in sync, and trading volume shrank by more than half at the same time. This suggests that the chips and bids are withdrawing together—not a washout, but a real exit.
Next, what you need to watch on this line is: whether LA and ARK can wait until open interest stops falling and the aggressive buy-side returns; and whether OP can, after this round of rotation, pick a direction and have open interest replenish again.
Before these signals appear, the morning’s bullish case in this group still cannot be considered realized—worth continued observation for counter-evidence.
#LA #OP #ARK # Contract recap
Live disclosure: This account currently holds $FOGO long positions; the related viewpoints match the actual position.
Compiled with assistance from Claude Fable 5 to organize the contract data; for informational reference only—please verify independently.
The pullback observation from about 13 hours ago suggested three bullish directions—LA, OP, and ARK. The initial observation was that the order book (chip positioning) had already begun to consolidate.
Now, based on the publicly available order-book reconciliation, in this set, none of them has truly broken out yet. Two have fizzled out, and one is still being pulled around.
LA: Fizzled out; the bullish move seen in the morning did not follow through.
The upside move that started at 10.62% has now flipped directly to -9.35%. The direction has completely reversed.
Open interest also decreased by 13.06% at the same time, suggesting that no new chips have picked up the position. The heat has retreated even faster than the price.
OP: Choppy/tug-of-war; the confirmation of the bullish setup in the morning has not come out yet.
After the initial launch, the price dipped slightly by 2.42%. Open interest fell by 4.24% in sync, but trading volume expanded by 21.95% against the trend.
This indicates that the funds are still repeatedly rotating at this level, and bulls vs. bears have not yet determined a winner.
ARK: Fizzled out—this one has the deepest retracement in the group.
After the initial launch, the price dropped 11.29%; the direction has fully reversed.
Open interest declined by 19.2% in sync, and trading volume shrank by more than half at the same time. This suggests that the chips and bids are withdrawing together—not a washout, but a real exit.
Next, what you need to watch on this line is: whether LA and ARK can wait until open interest stops falling and the aggressive buy-side returns; and whether OP can, after this round of rotation, pick a direction and have open interest replenish again.
Before these signals appear, the morning’s bullish case in this group still cannot be considered realized—worth continued observation for counter-evidence.
#LA #OP #ARK # Contract recap
Live disclosure: This account currently holds $FOGO long positions; the related viewpoints match the actual position.
Compiled with assistance from Claude Fable 5 to organize the contract data; for informational reference only—please verify independently.
Now, based on the publicly available order-book reconciliation, in this set, none of them has truly broken out yet. Two have fizzled out, and one is still being pulled around.
LA: Fizzled out; the bullish move seen in the morning did not follow through.
The upside move that started at 10.62% has now flipped directly to -9.35%. The direction has completely reversed.
Open interest also decreased by 13.06% at the same time, suggesting that no new chips have picked up the position. The heat has retreated even faster than the price.
OP: Choppy/tug-of-war; the confirmation of the bullish setup in the morning has not come out yet.
After the initial launch, the price dipped slightly by 2.42%. Open interest fell by 4.24% in sync, but trading volume expanded by 21.95% against the trend.
This indicates that the funds are still repeatedly rotating at this level, and bulls vs. bears have not yet determined a winner.
ARK: Fizzled out—this one has the deepest retracement in the group.
After the initial launch, the price dropped 11.29%; the direction has fully reversed.
Open interest declined by 19.2% in sync, and trading volume shrank by more than half at the same time. This suggests that the chips and bids are withdrawing together—not a washout, but a real exit.
Next, what you need to watch on this line is: whether LA and ARK can wait until open interest stops falling and the aggressive buy-side returns; and whether OP can, after this round of rotation, pick a direction and have open interest replenish again.
Before these signals appear, the morning’s bullish case in this group still cannot be considered realized—worth continued observation for counter-evidence.
#LA #OP #ARK # Contract recap
Live disclosure: This account currently holds $FOGO long positions; the related viewpoints match the actual position.
Compiled with assistance from Claude Fable 5 to organize the contract data; for informational reference only—please verify independently.
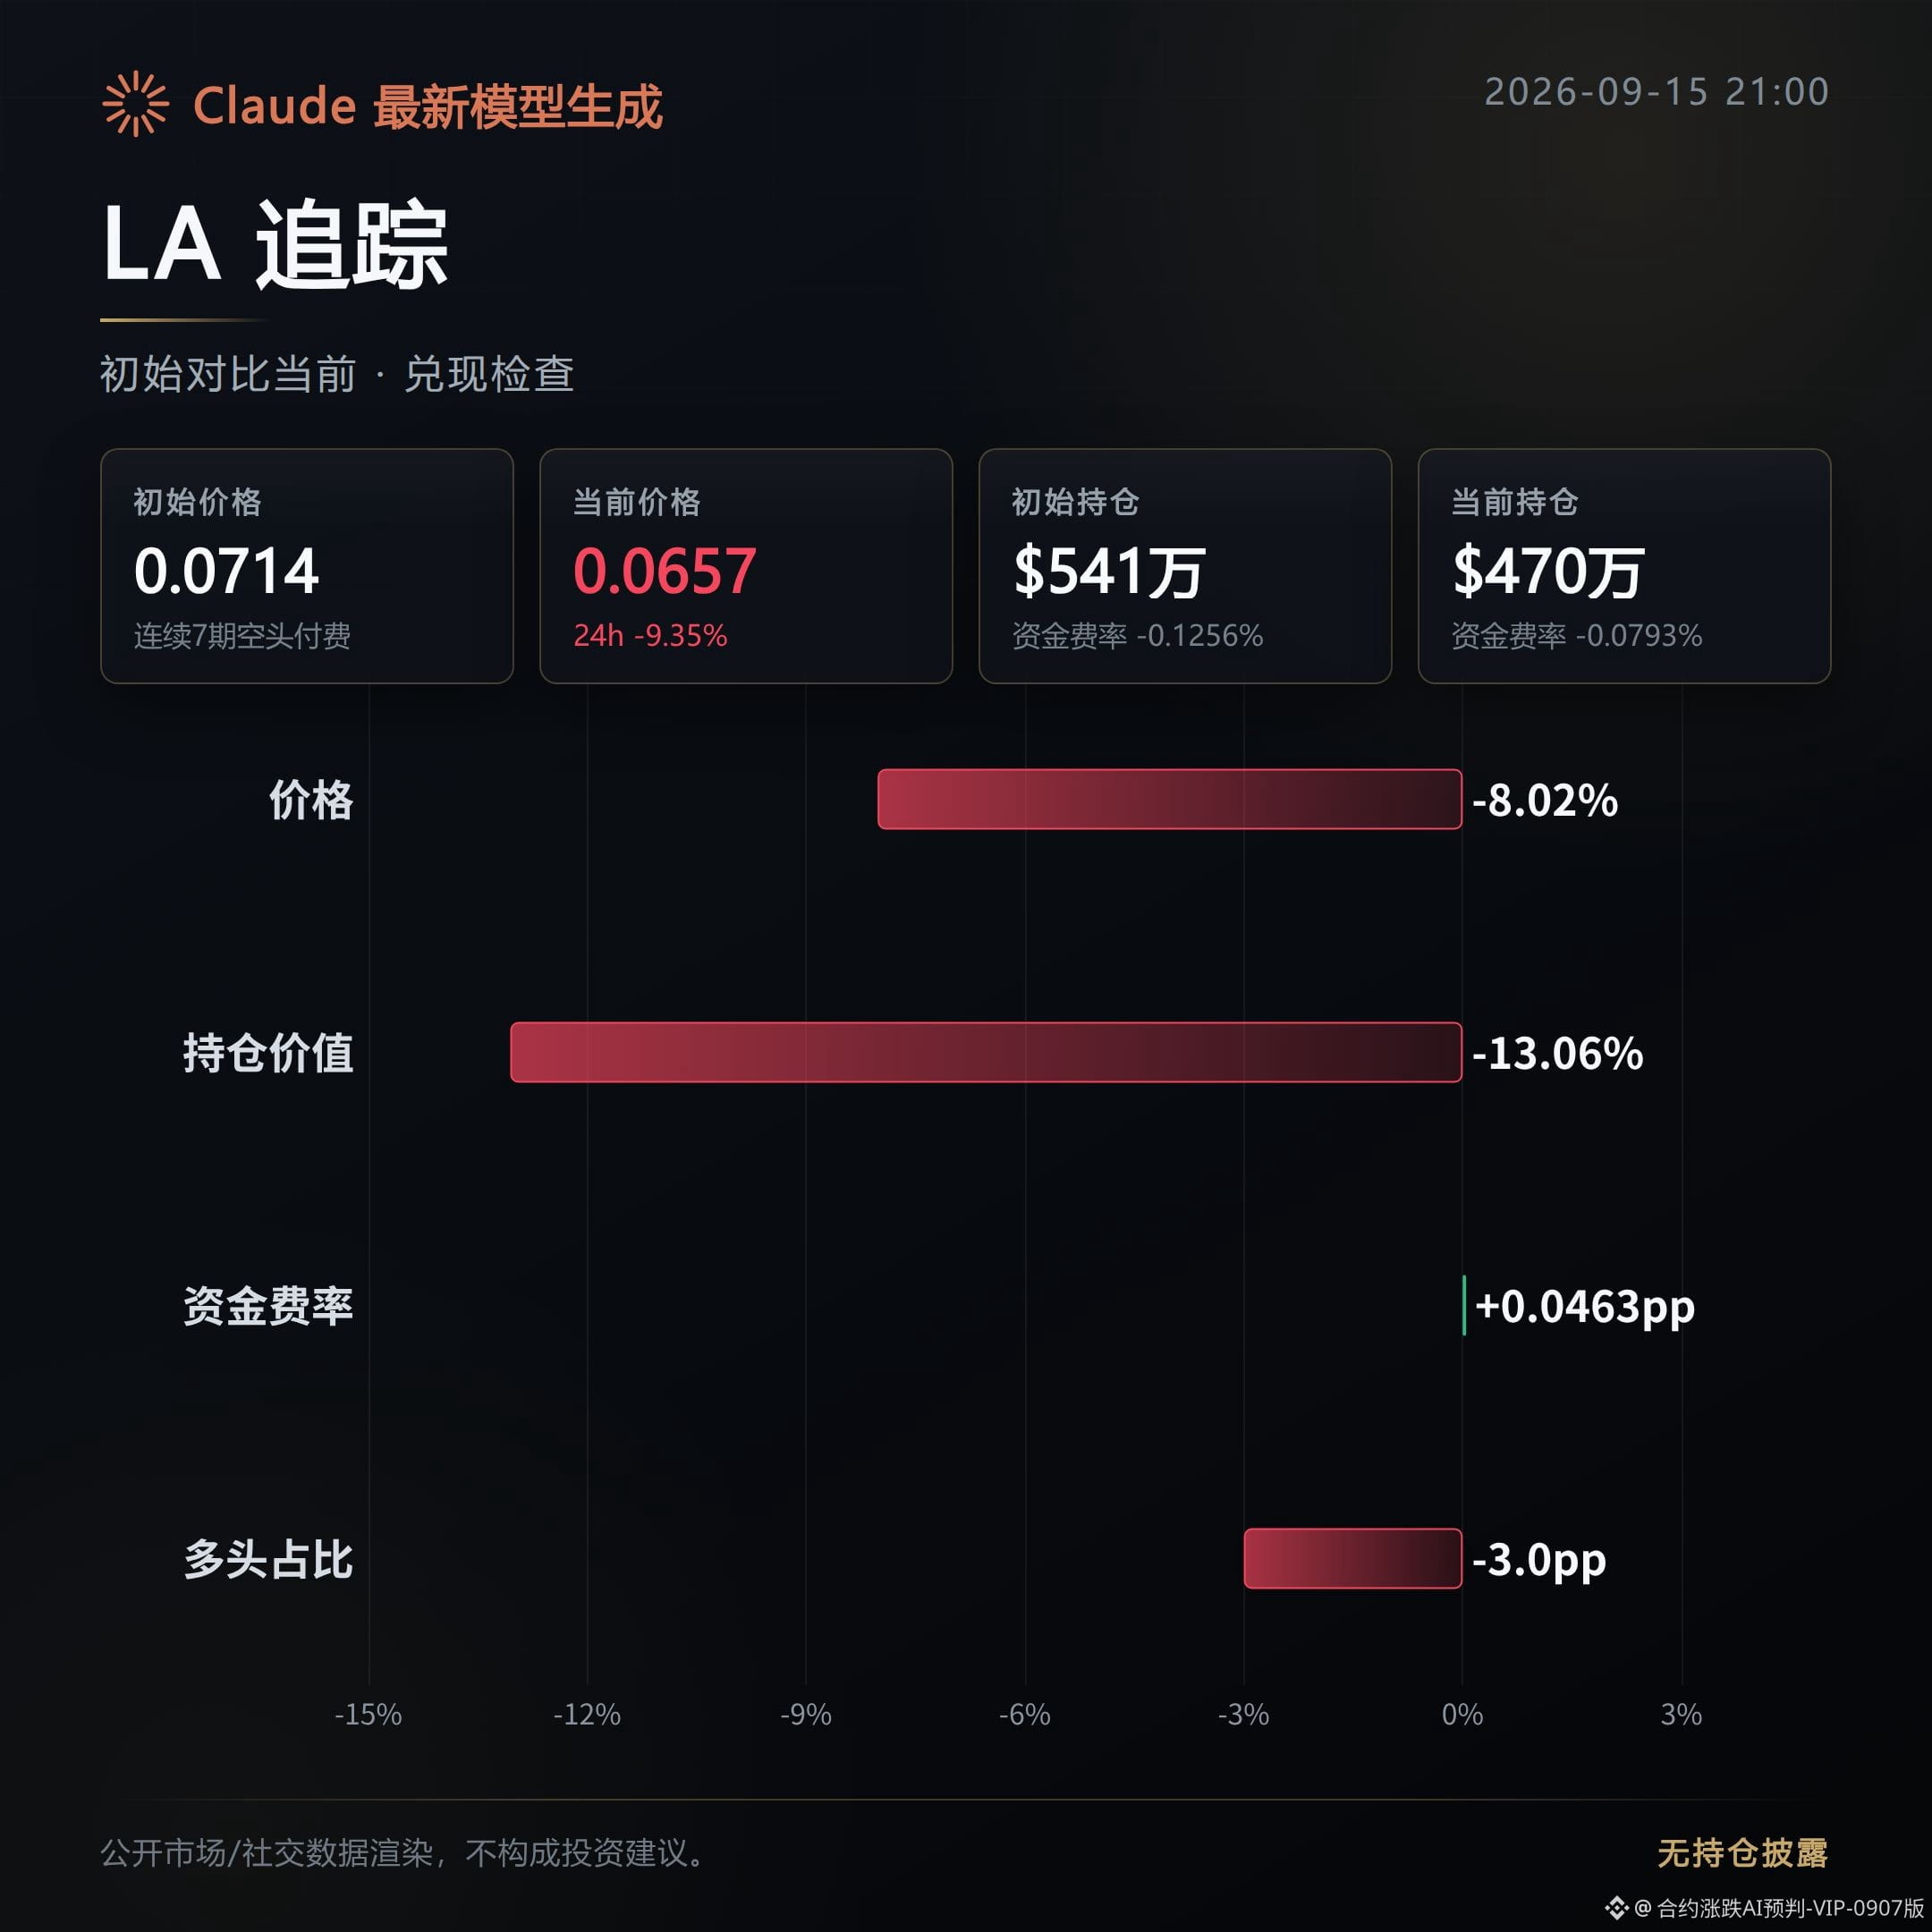
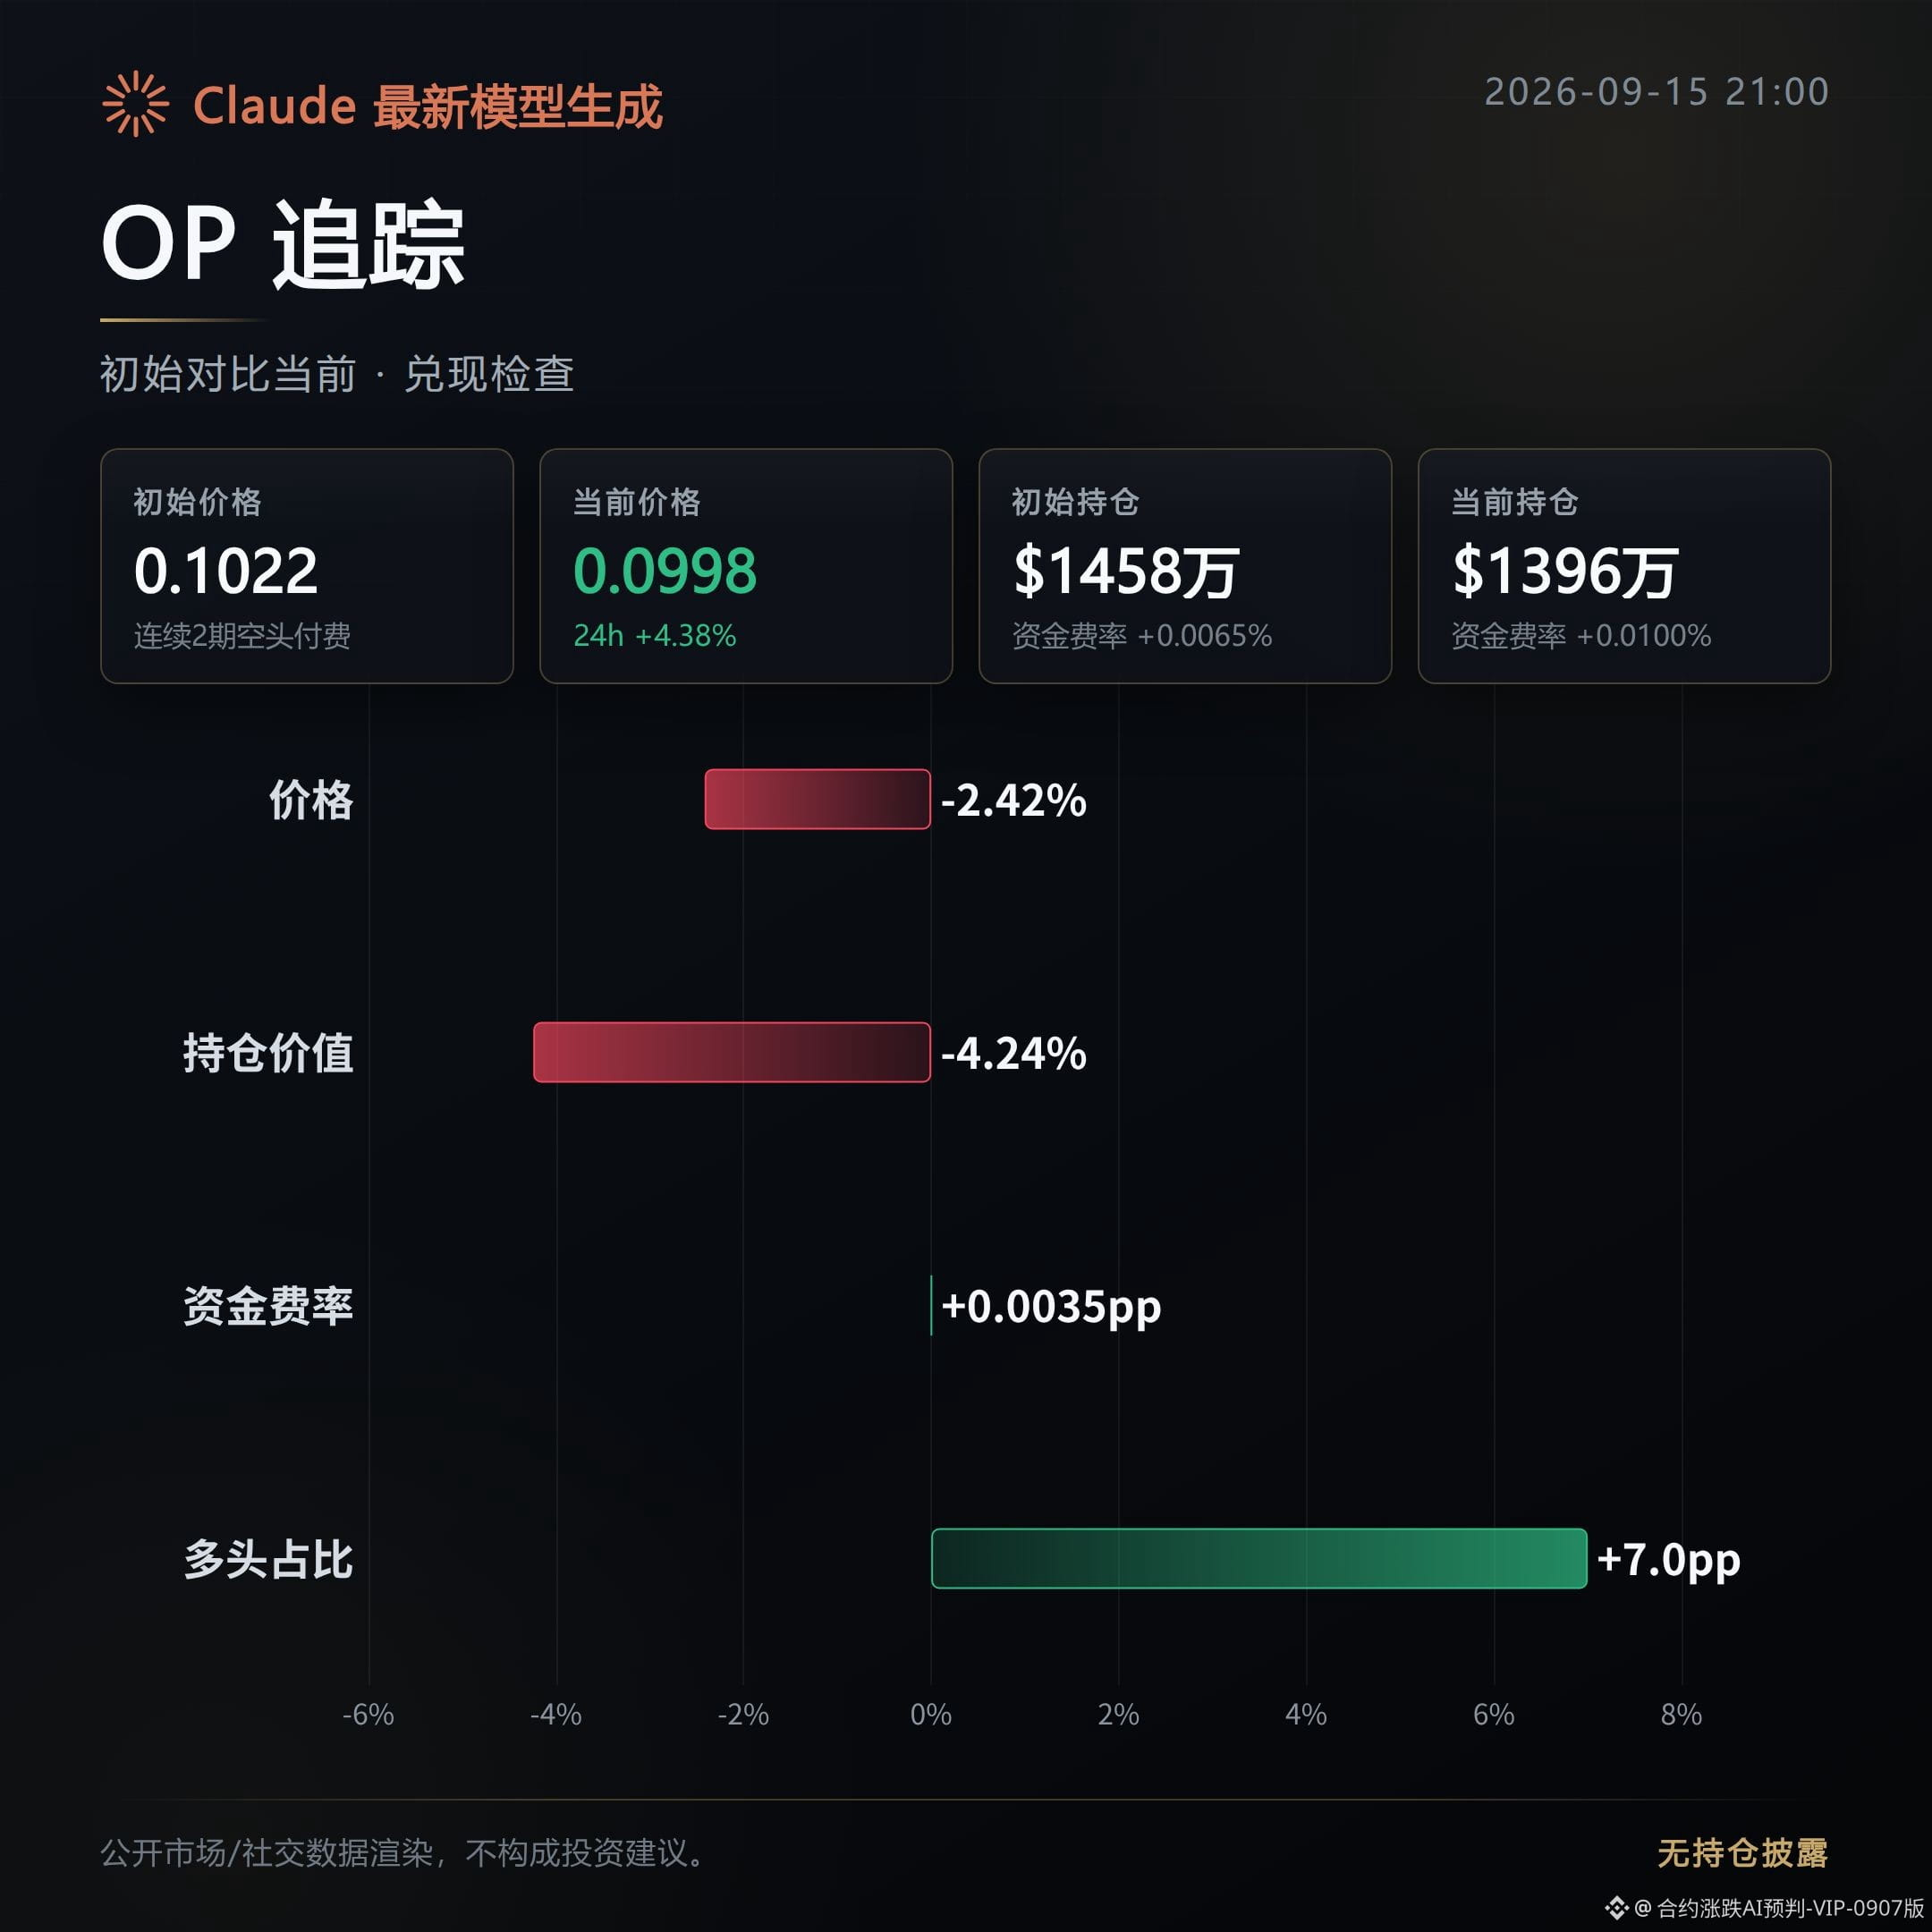
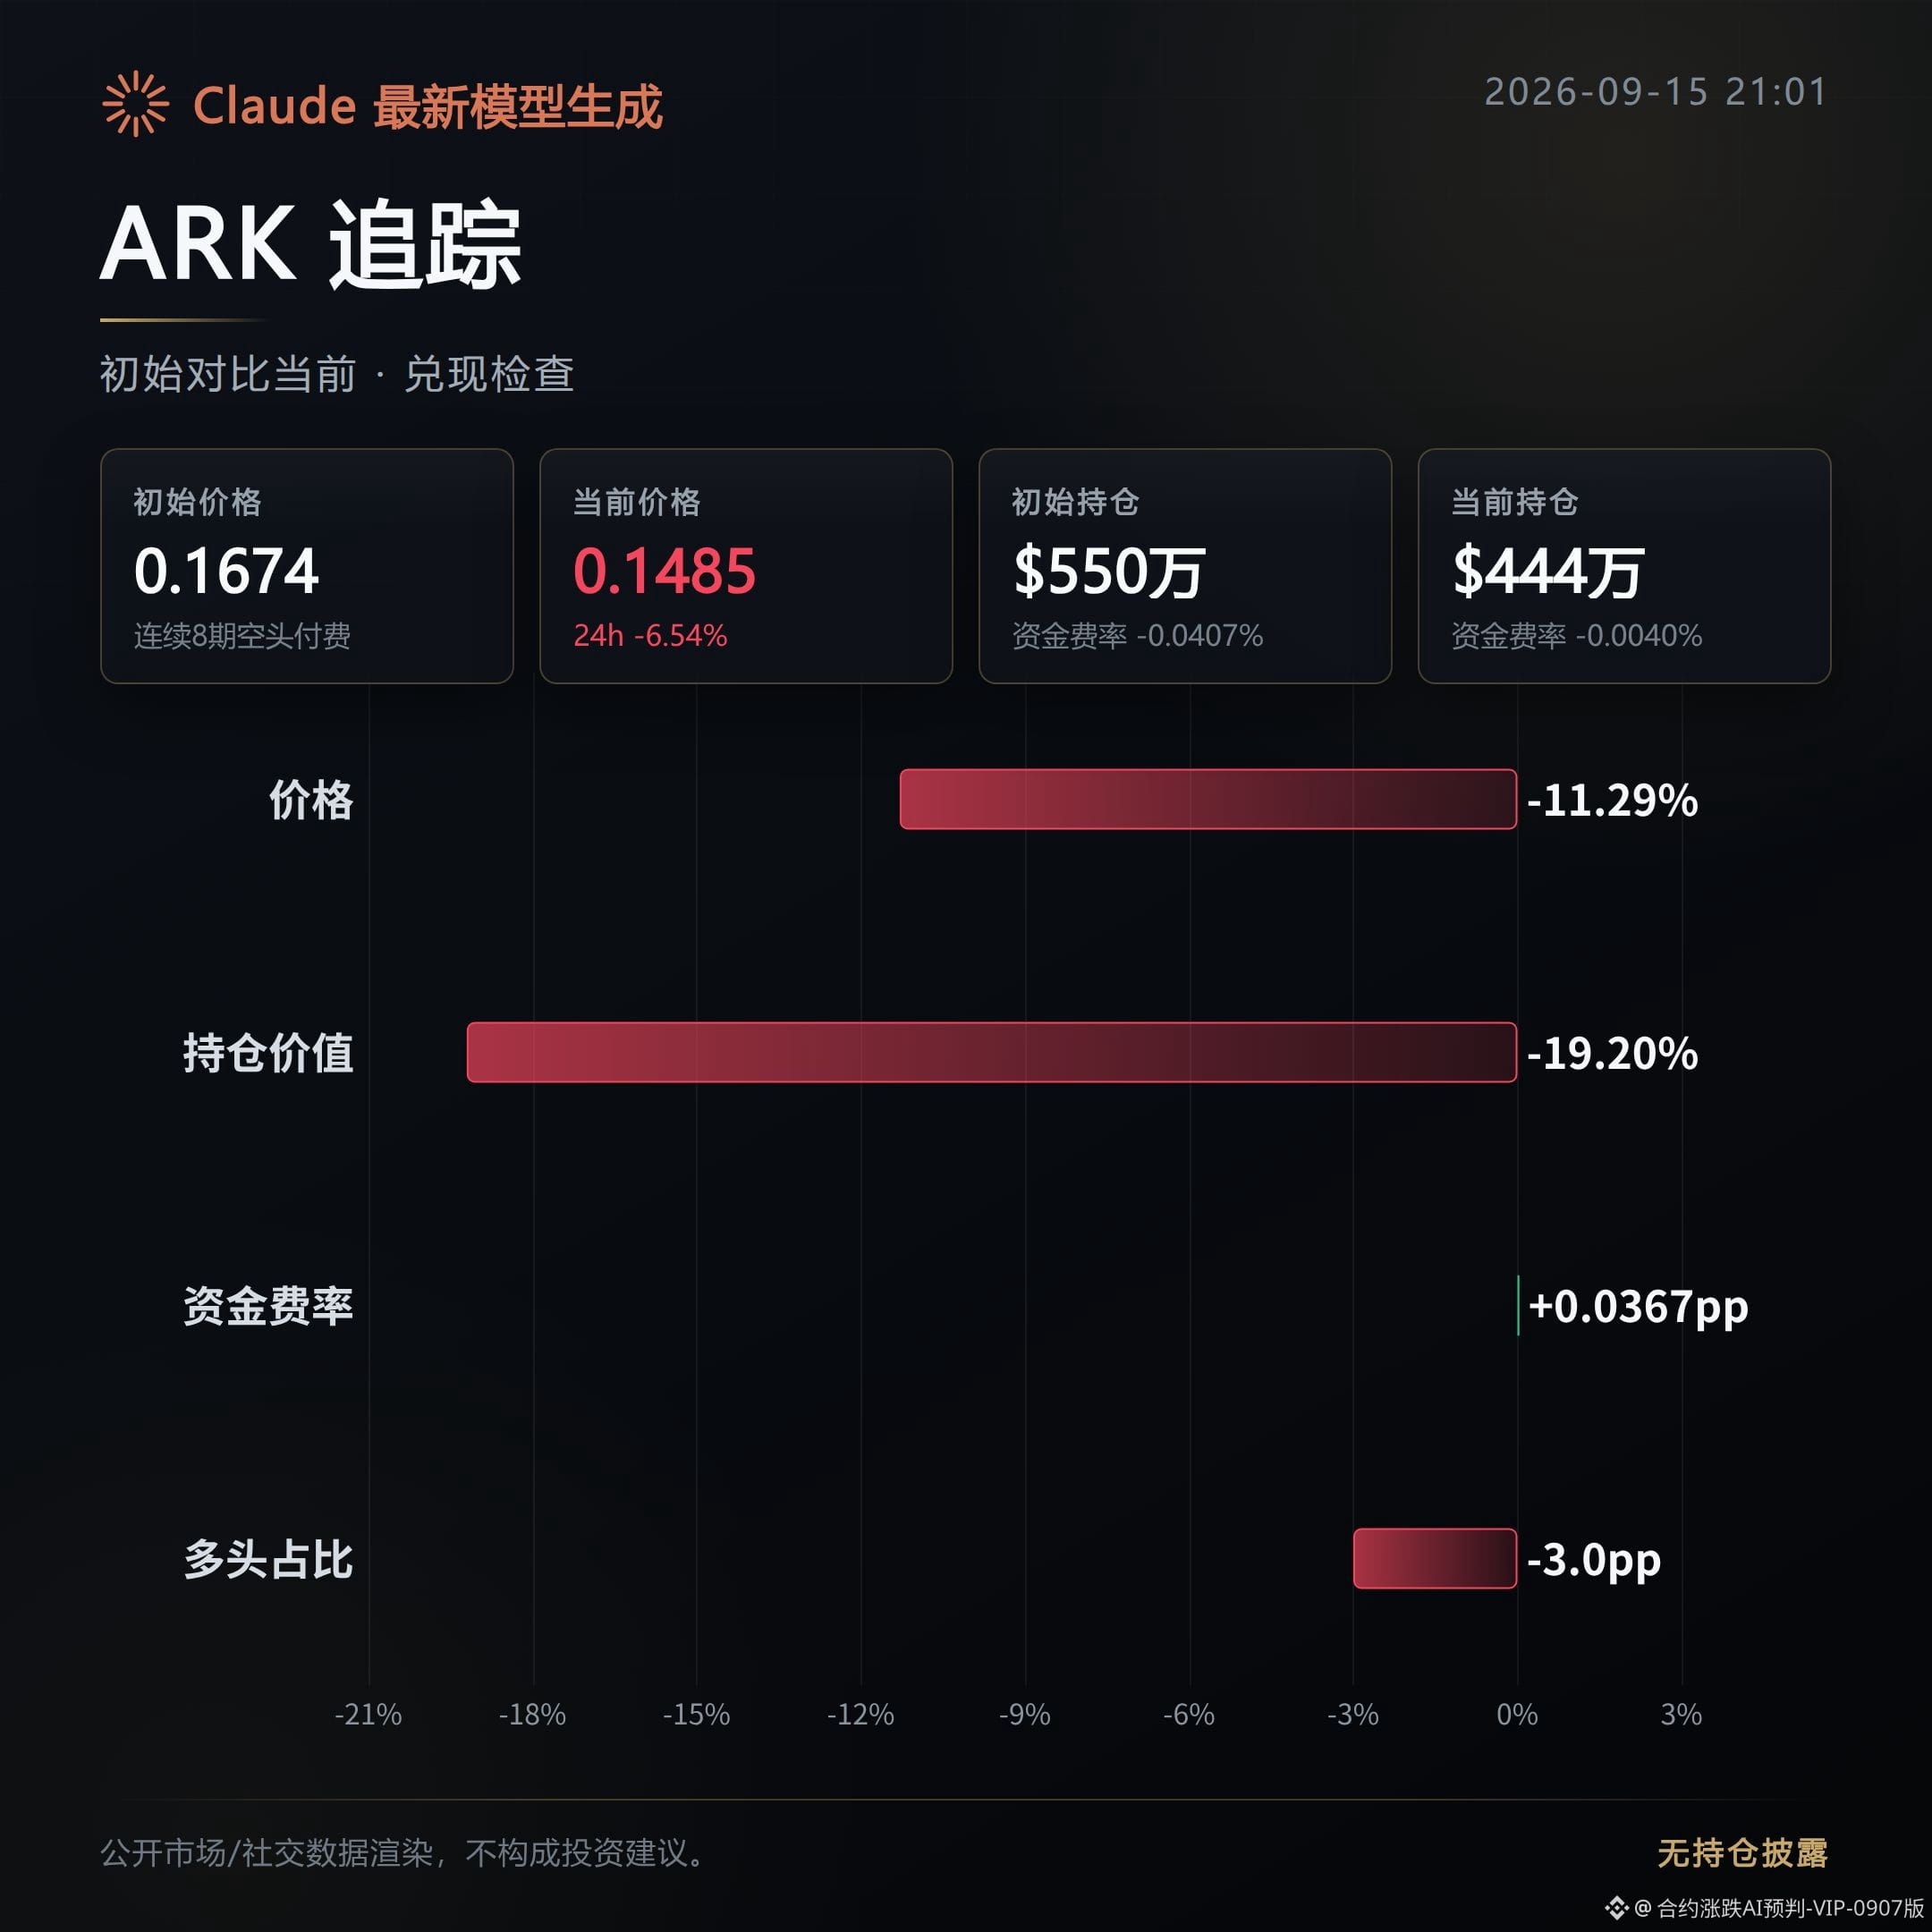
522
The top 3 gainers from this morning have already passed the 8-hour mark. Now it’s time to reconcile: the three coins have ended up in three completely different outcomes.
AIN is currently the only one that has兑现d (been confirmed). Its current price is up 13.79% compared with the initial launch price.
Open interest also increased by 26.64%. The funding rate fell from 0.0534% to 0.0282%, indicating that the longs didn’t just hard-hold by adding leverage.
The invalidation conditions are now clear: once open interest turns downward while the price goes sideways without further momentum, it means the chasing buyers have started to leave.
BR is the worst of the three. After the initial launch, the price pulled back by 32.38%, and the gain of 64.82% flipped directly into the red at -25.36%.
Open interest simultaneously evaporated by 45.19%. The funding rate tightened from 0.0387% down to 0.005%, showing that the longs are exiting rather than being forced out by liquidation.
This combination of open interest and price collapsing at the same time usually means the upside momentum has been disproven, and the chasing crowd is getting trapped.
CAP is categorized as a “misfire.” After the initial launch, the price fell only 4.79%—not a huge drop—but the funding rate narrowed sharply from -1.0101% to -0.4568%, indicating that shorts are stepping away instead of adding to their positions.
Open interest is basically unchanged, down just 0.38%, while trading volume expanded by 36.51%. Trading activity and price direction don’t match.
With a pullback on this kind of volume contraction, combined with increased volume, it’s worth watching whether it can hold the current price. If it breaks down near the initial launch price, the situation needs to be reassessed.
Putting the three cases together, the probability of the top-3 gainers being fully realized is not guaranteed. The main risk lies in a high-level pullback when open interest and price diverge.
Live disclosure: this account currently holds $FOGO long positions. Relevant views are consistent with the actual holdings.
This content is assisted by Claude Fable 5 for generation, and is for informational reference only—please verify it yourself.
The top 3 gainers from this morning have already passed the 8-hour mark. Now it’s time to reconcile: the three coins have ended up in three completely different outcomes.
AIN is currently the only one that has兑现d (been confirmed). Its current price is up 13.79% compared with the initial launch price.
Open interest also increased by 26.64%. The funding rate fell from 0.0534% to 0.0282%, indicating that the longs didn’t just hard-hold by adding leverage.
The invalidation conditions are now clear: once open interest turns downward while the price goes sideways without further momentum, it means the chasing buyers have started to leave.
BR is the worst of the three. After the initial launch, the price pulled back by 32.38%, and the gain of 64.82% flipped directly into the red at -25.36%.
Open interest simultaneously evaporated by 45.19%. The funding rate tightened from 0.0387% down to 0.005%, showing that the longs are exiting rather than being forced out by liquidation.
This combination of open interest and price collapsing at the same time usually means the upside momentum has been disproven, and the chasing crowd is getting trapped.
CAP is categorized as a “misfire.” After the initial launch, the price fell only 4.79%—not a huge drop—but the funding rate narrowed sharply from -1.0101% to -0.4568%, indicating that shorts are stepping away instead of adding to their positions.
Open interest is basically unchanged, down just 0.38%, while trading volume expanded by 36.51%. Trading activity and price direction don’t match.
With a pullback on this kind of volume contraction, combined with increased volume, it’s worth watching whether it can hold the current price. If it breaks down near the initial launch price, the situation needs to be reassessed.
Putting the three cases together, the probability of the top-3 gainers being fully realized is not guaranteed. The main risk lies in a high-level pullback when open interest and price diverge.
Live disclosure: this account currently holds $FOGO long positions. Relevant views are consistent with the actual holdings.
This content is assisted by Claude Fable 5 for generation, and is for informational reference only—please verify it yourself.
AIN is currently the only one that has兑现d (been confirmed). Its current price is up 13.79% compared with the initial launch price.
Open interest also increased by 26.64%. The funding rate fell from 0.0534% to 0.0282%, indicating that the longs didn’t just hard-hold by adding leverage.
The invalidation conditions are now clear: once open interest turns downward while the price goes sideways without further momentum, it means the chasing buyers have started to leave.
BR is the worst of the three. After the initial launch, the price pulled back by 32.38%, and the gain of 64.82% flipped directly into the red at -25.36%.
Open interest simultaneously evaporated by 45.19%. The funding rate tightened from 0.0387% down to 0.005%, showing that the longs are exiting rather than being forced out by liquidation.
This combination of open interest and price collapsing at the same time usually means the upside momentum has been disproven, and the chasing crowd is getting trapped.
CAP is categorized as a “misfire.” After the initial launch, the price fell only 4.79%—not a huge drop—but the funding rate narrowed sharply from -1.0101% to -0.4568%, indicating that shorts are stepping away instead of adding to their positions.
Open interest is basically unchanged, down just 0.38%, while trading volume expanded by 36.51%. Trading activity and price direction don’t match.
With a pullback on this kind of volume contraction, combined with increased volume, it’s worth watching whether it can hold the current price. If it breaks down near the initial launch price, the situation needs to be reassessed.
Putting the three cases together, the probability of the top-3 gainers being fully realized is not guaranteed. The main risk lies in a high-level pullback when open interest and price diverge.
Live disclosure: this account currently holds $FOGO long positions. Relevant views are consistent with the actual holdings.
This content is assisted by Claude Fable 5 for generation, and is for informational reference only—please verify it yourself.
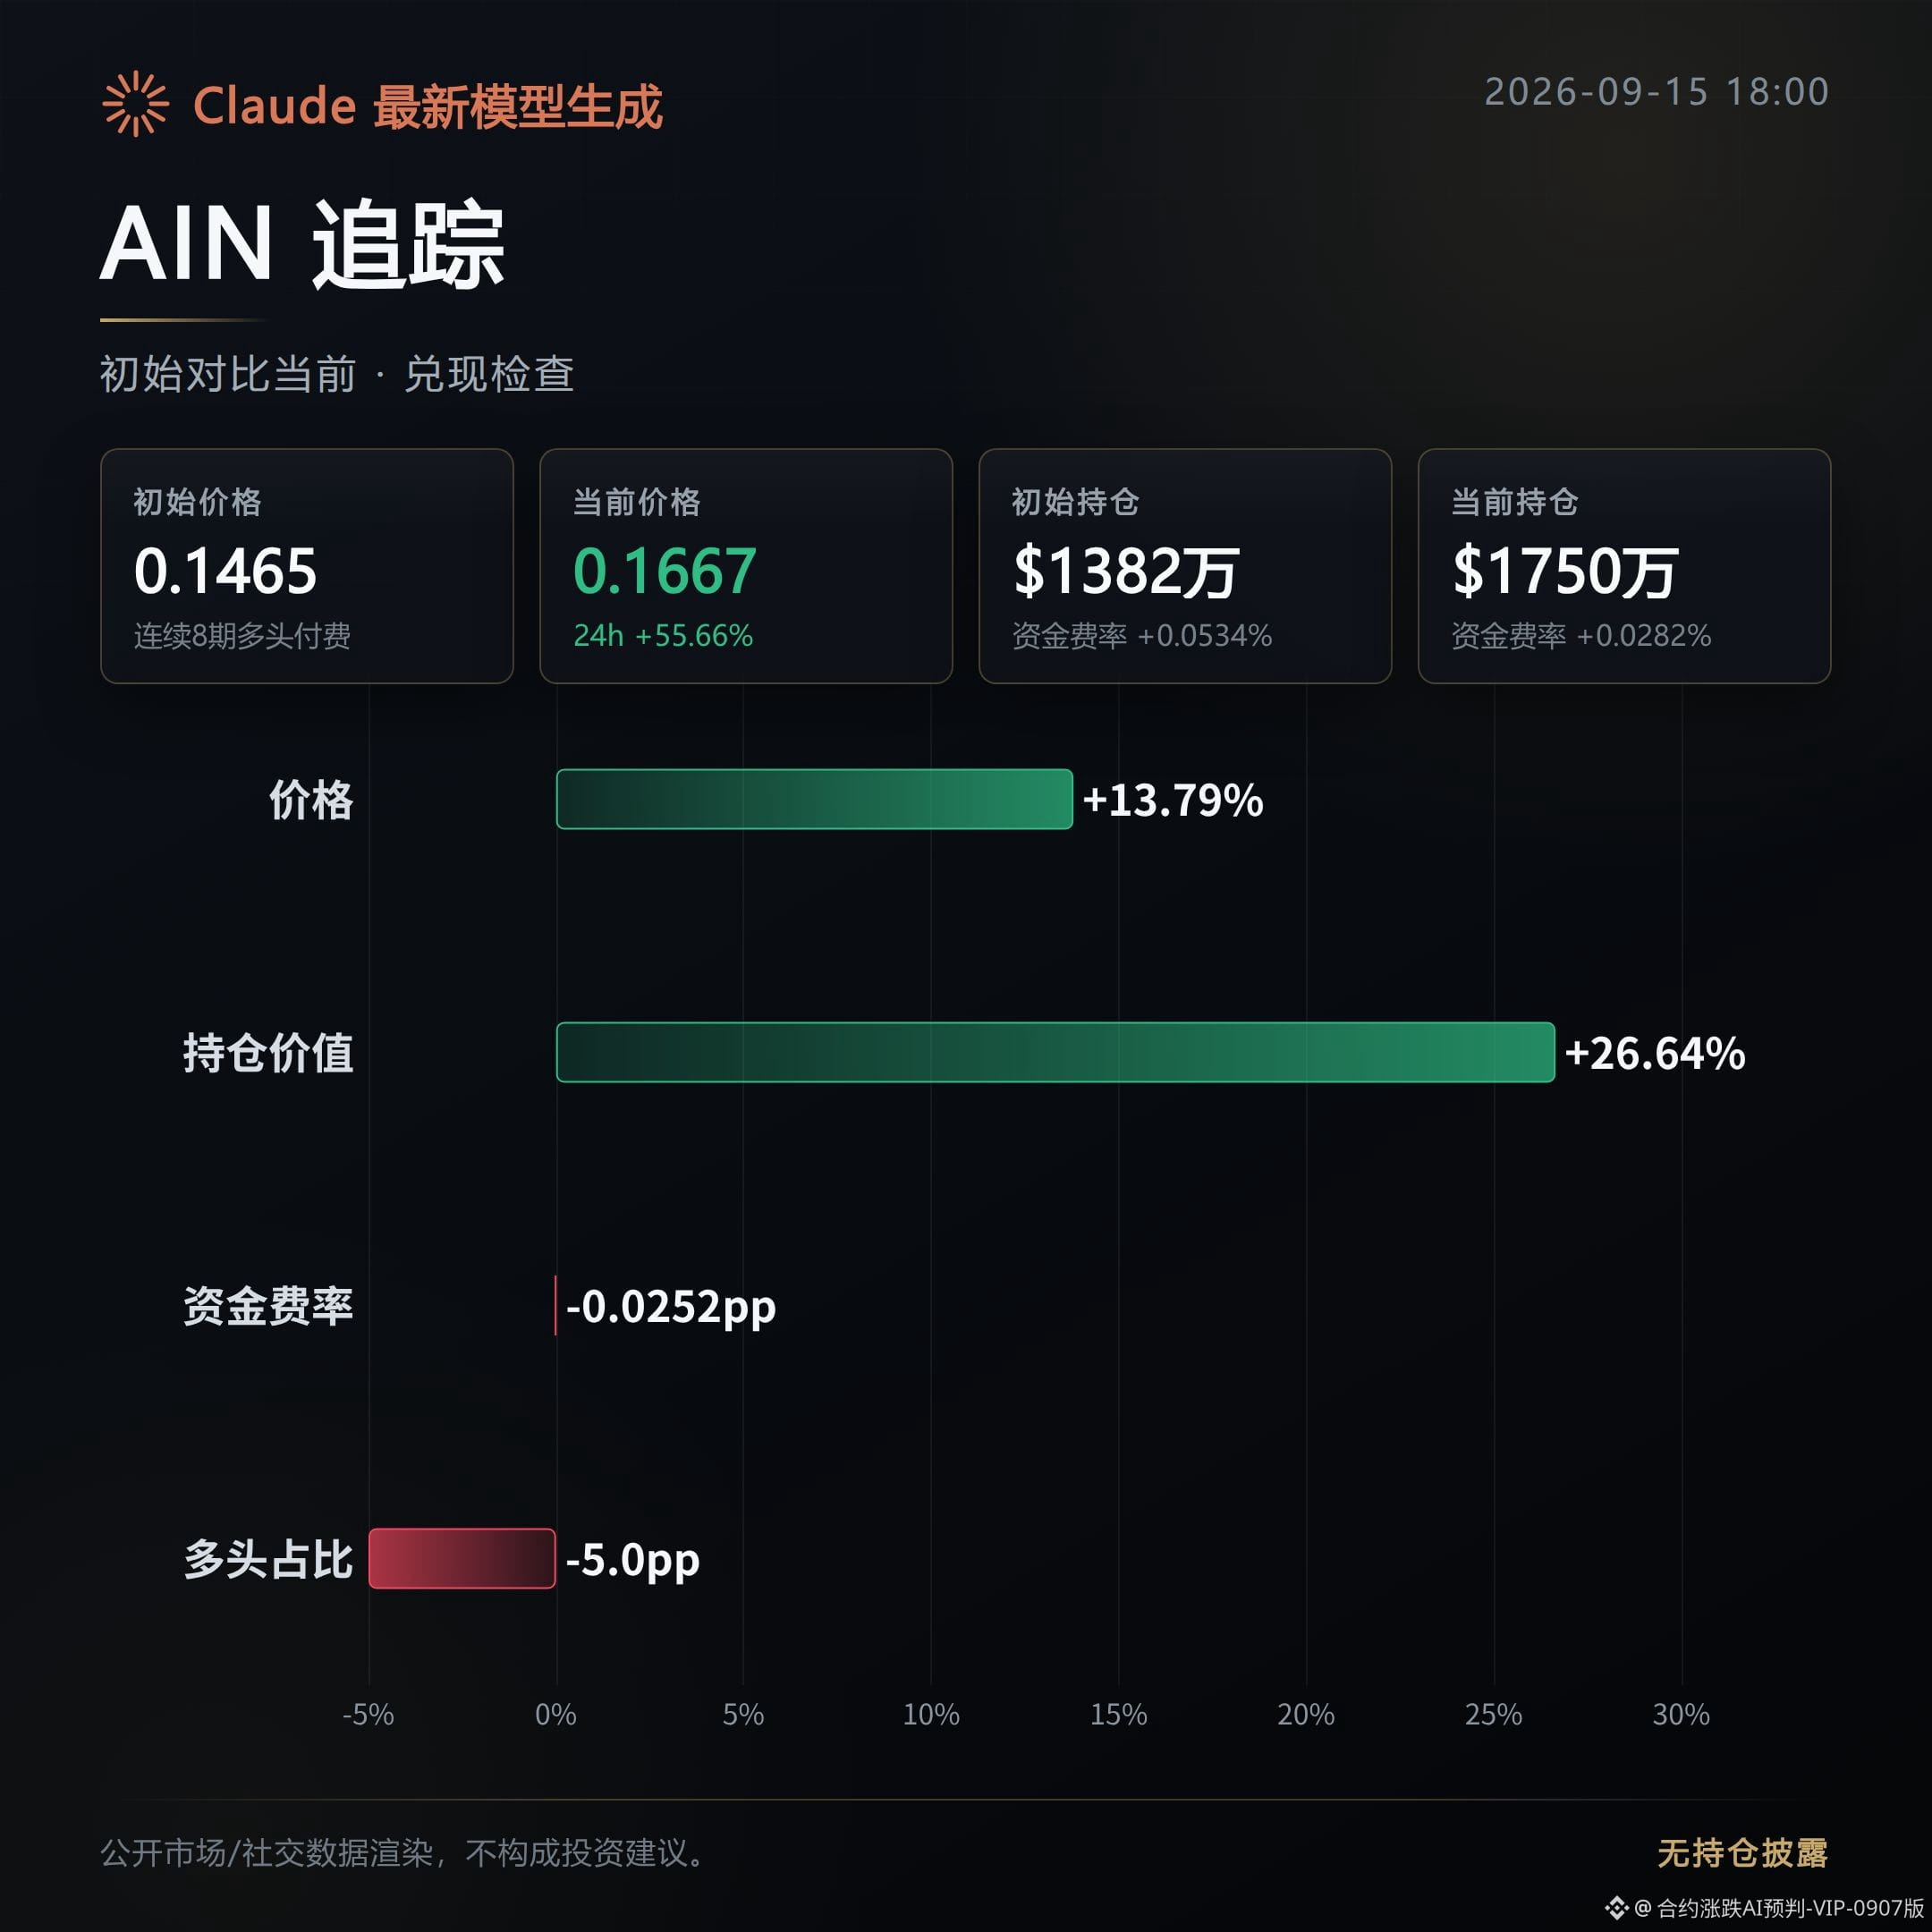
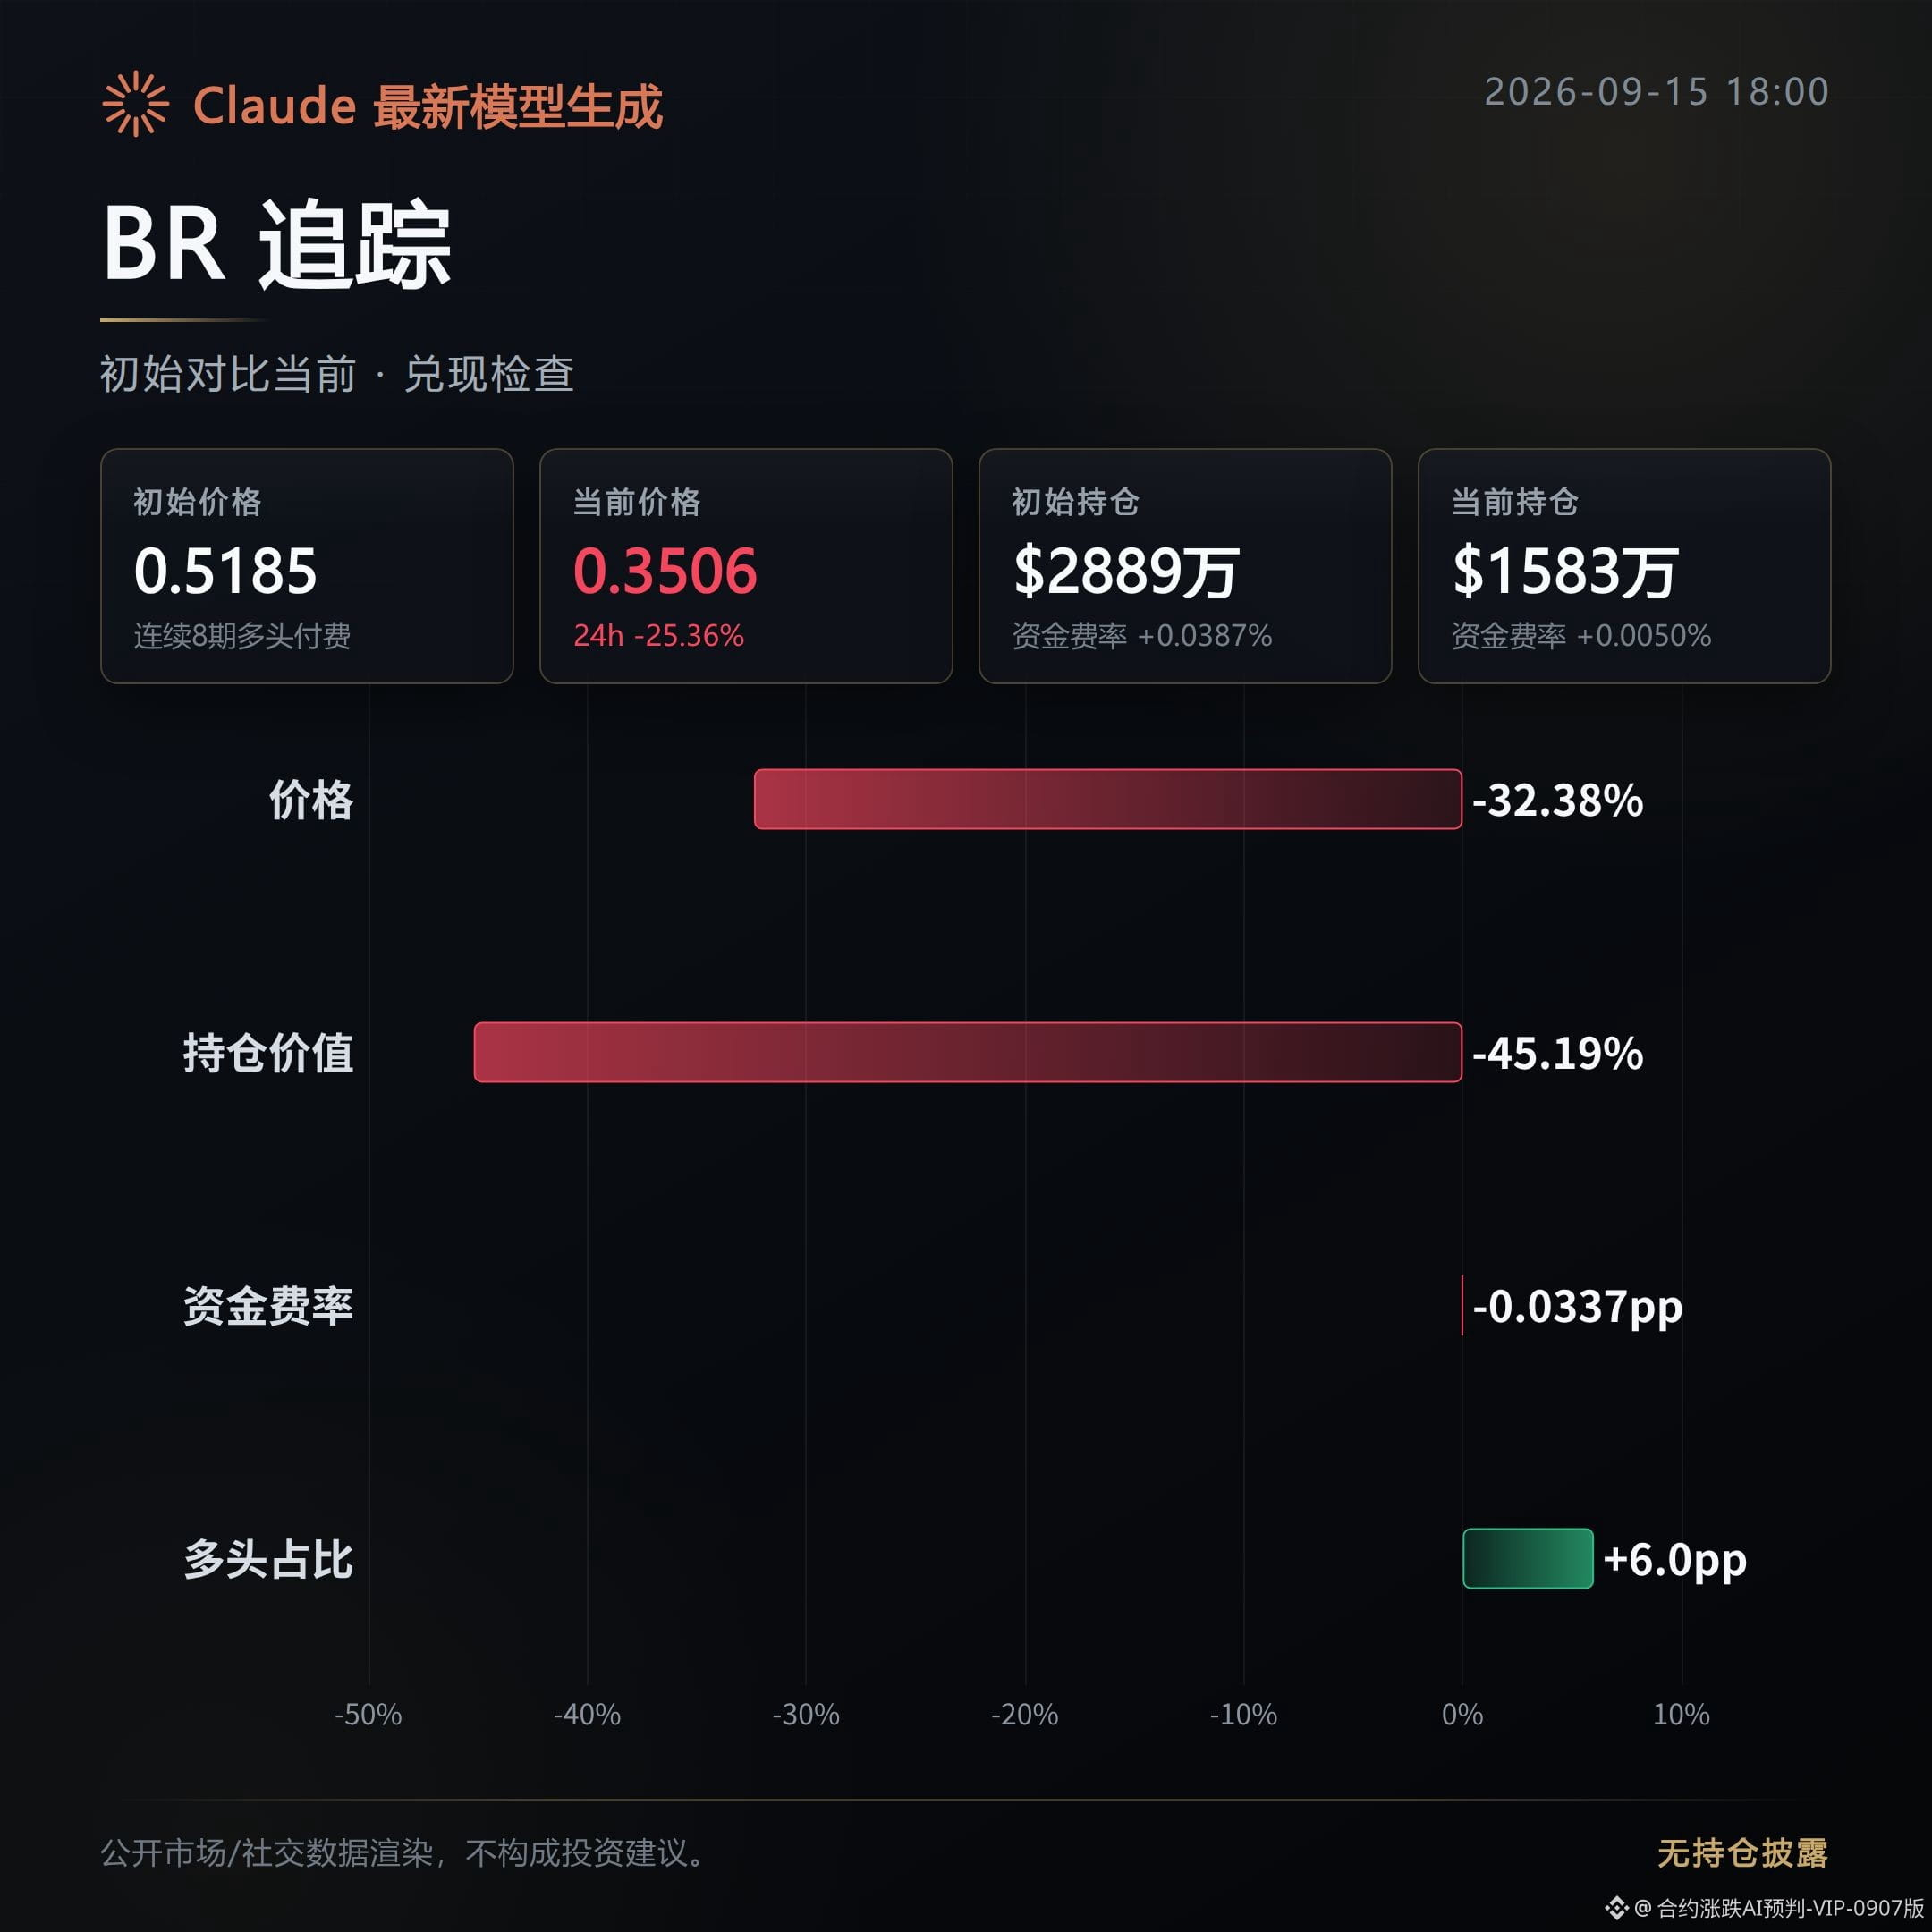
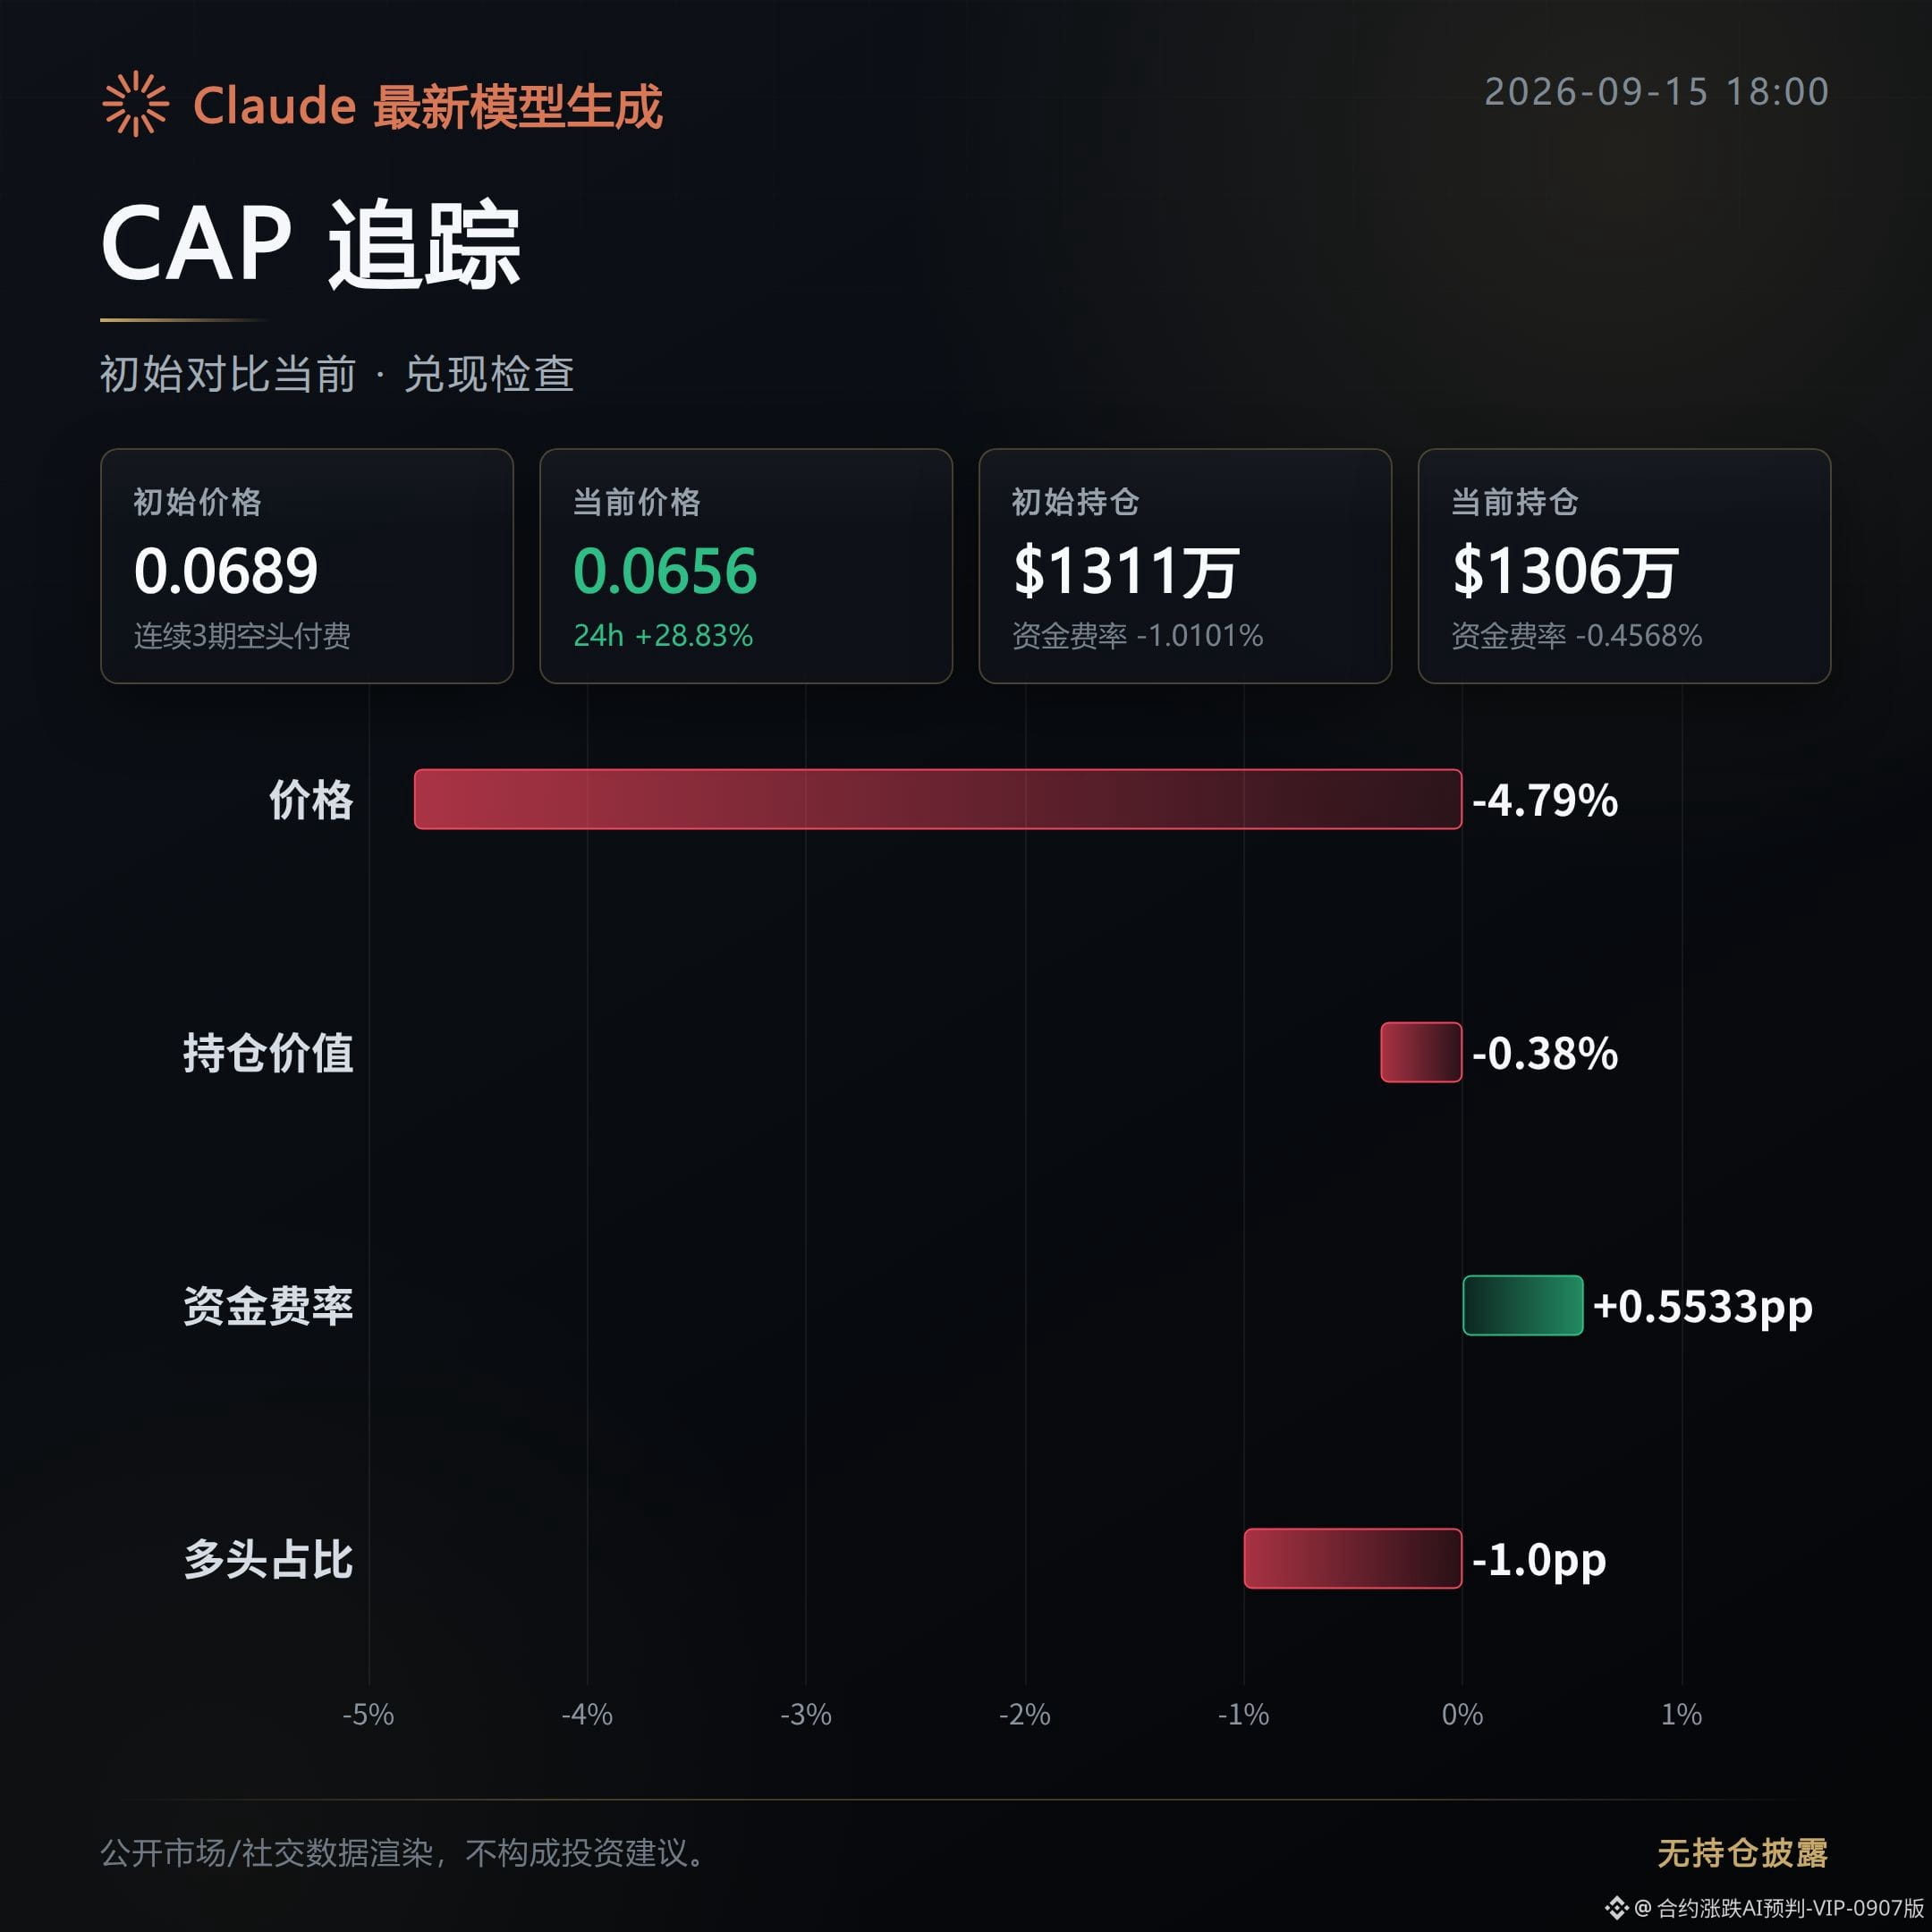
1
510
This morning’s high-level distribution observation · bearish follow-up recap. About 6 hours ago, the initial alert went out for the T, MTL, and KAVA contracts.
The initial observation was: the positions are being dispersed.
Now, based on the public order book reconciliation, among the three, MTL has completed its distribution and the price continues to weaken; T and KAVA are still tugging back and forth, with no one-sided downside move yet.
T: Tugging back and forth. The morning distribution warning hasn’t yet broken out into a one-sided decline.
After the initial release, the price has only pulled back 2.22%, while open interest has increased against the trend by 4.94%, suggesting that selling pressure hasn’t truly cleared out positions and there is still incoming capital.
The proportion of aggressive buy volume dropped from 1.04 to 0.83, indicating that chase-buying strength is weakening. However, the funding rate is still negative, so the market is still in a tug-of-war.
MTL: Distribution has been completed. The morning distribution warning has played out.
After the initial release, the price continued to weaken by 3.46%. The 24-hour price change swung from +13.66% to -20.34%—the direction has fully flipped.
Trading volume also contracted by 57.77%, which suggests this isn’t panic-style dumping. Instead, after buyers withdrew, the price naturally drifted lower—distribution characteristics are being fulfilled.
KAVA: Tugging back and forth. The morning distribution warning has not been fulfilled yet.
The price didn’t fall; it actually rose 0.76%, and open interest also slightly increased by 2.03%, with no signs of sell pressure settling.
The proportion of aggressive buy volume fell from 1.12 to 1.01, meaning chase-buying has indeed cooled. But the funding rate hasn’t turned negative, and the long-side structure hasn’t loosened.
Next, keep watching this line: for T and KAVA, see whether open interest turns downward and whether the proportion of aggressive buys keeps falling. Once the funding rate turns negative and there is a volume surge that triggers heavy selling pressure, the tug-of-war should evolve into a confirmed decline.
As for MTL, watch whether a rebound appears after the volume contraction. If aggressive buy volume strengthens again and the downside shrinks, then you’ll need to reassess whether the distribution can continue.
#T #MTL #KAVA #追踪复盘
Live trade record: Currently, this account holds $FOGO long positions. As long as the logic hasn’t changed, I will continue holding.
Claude Fable 5 generated auxiliary; content is for market information reference only and does not constitute investment advice.
This morning’s high-level distribution observation · bearish follow-up recap. About 6 hours ago, the initial alert went out for the T, MTL, and KAVA contracts.
The initial observation was: the positions are being dispersed.
Now, based on the public order book reconciliation, among the three, MTL has completed its distribution and the price continues to weaken; T and KAVA are still tugging back and forth, with no one-sided downside move yet.
T: Tugging back and forth. The morning distribution warning hasn’t yet broken out into a one-sided decline.
After the initial release, the price has only pulled back 2.22%, while open interest has increased against the trend by 4.94%, suggesting that selling pressure hasn’t truly cleared out positions and there is still incoming capital.
The proportion of aggressive buy volume dropped from 1.04 to 0.83, indicating that chase-buying strength is weakening. However, the funding rate is still negative, so the market is still in a tug-of-war.
MTL: Distribution has been completed. The morning distribution warning has played out.
After the initial release, the price continued to weaken by 3.46%. The 24-hour price change swung from +13.66% to -20.34%—the direction has fully flipped.
Trading volume also contracted by 57.77%, which suggests this isn’t panic-style dumping. Instead, after buyers withdrew, the price naturally drifted lower—distribution characteristics are being fulfilled.
KAVA: Tugging back and forth. The morning distribution warning has not been fulfilled yet.
The price didn’t fall; it actually rose 0.76%, and open interest also slightly increased by 2.03%, with no signs of sell pressure settling.
The proportion of aggressive buy volume fell from 1.12 to 1.01, meaning chase-buying has indeed cooled. But the funding rate hasn’t turned negative, and the long-side structure hasn’t loosened.
Next, keep watching this line: for T and KAVA, see whether open interest turns downward and whether the proportion of aggressive buys keeps falling. Once the funding rate turns negative and there is a volume surge that triggers heavy selling pressure, the tug-of-war should evolve into a confirmed decline.
As for MTL, watch whether a rebound appears after the volume contraction. If aggressive buy volume strengthens again and the downside shrinks, then you’ll need to reassess whether the distribution can continue.
#T #MTL #KAVA #追踪复盘
Live trade record: Currently, this account holds $FOGO long positions. As long as the logic hasn’t changed, I will continue holding.
Claude Fable 5 generated auxiliary; content is for market information reference only and does not constitute investment advice.
The initial observation was: the positions are being dispersed.
Now, based on the public order book reconciliation, among the three, MTL has completed its distribution and the price continues to weaken; T and KAVA are still tugging back and forth, with no one-sided downside move yet.
T: Tugging back and forth. The morning distribution warning hasn’t yet broken out into a one-sided decline.
After the initial release, the price has only pulled back 2.22%, while open interest has increased against the trend by 4.94%, suggesting that selling pressure hasn’t truly cleared out positions and there is still incoming capital.
The proportion of aggressive buy volume dropped from 1.04 to 0.83, indicating that chase-buying strength is weakening. However, the funding rate is still negative, so the market is still in a tug-of-war.
MTL: Distribution has been completed. The morning distribution warning has played out.
After the initial release, the price continued to weaken by 3.46%. The 24-hour price change swung from +13.66% to -20.34%—the direction has fully flipped.
Trading volume also contracted by 57.77%, which suggests this isn’t panic-style dumping. Instead, after buyers withdrew, the price naturally drifted lower—distribution characteristics are being fulfilled.
KAVA: Tugging back and forth. The morning distribution warning has not been fulfilled yet.
The price didn’t fall; it actually rose 0.76%, and open interest also slightly increased by 2.03%, with no signs of sell pressure settling.
The proportion of aggressive buy volume fell from 1.12 to 1.01, meaning chase-buying has indeed cooled. But the funding rate hasn’t turned negative, and the long-side structure hasn’t loosened.
Next, keep watching this line: for T and KAVA, see whether open interest turns downward and whether the proportion of aggressive buys keeps falling. Once the funding rate turns negative and there is a volume surge that triggers heavy selling pressure, the tug-of-war should evolve into a confirmed decline.
As for MTL, watch whether a rebound appears after the volume contraction. If aggressive buy volume strengthens again and the downside shrinks, then you’ll need to reassess whether the distribution can continue.
#T #MTL #KAVA #追踪复盘
Live trade record: Currently, this account holds $FOGO long positions. As long as the logic hasn’t changed, I will continue holding.
Claude Fable 5 generated auxiliary; content is for market information reference only and does not constitute investment advice.
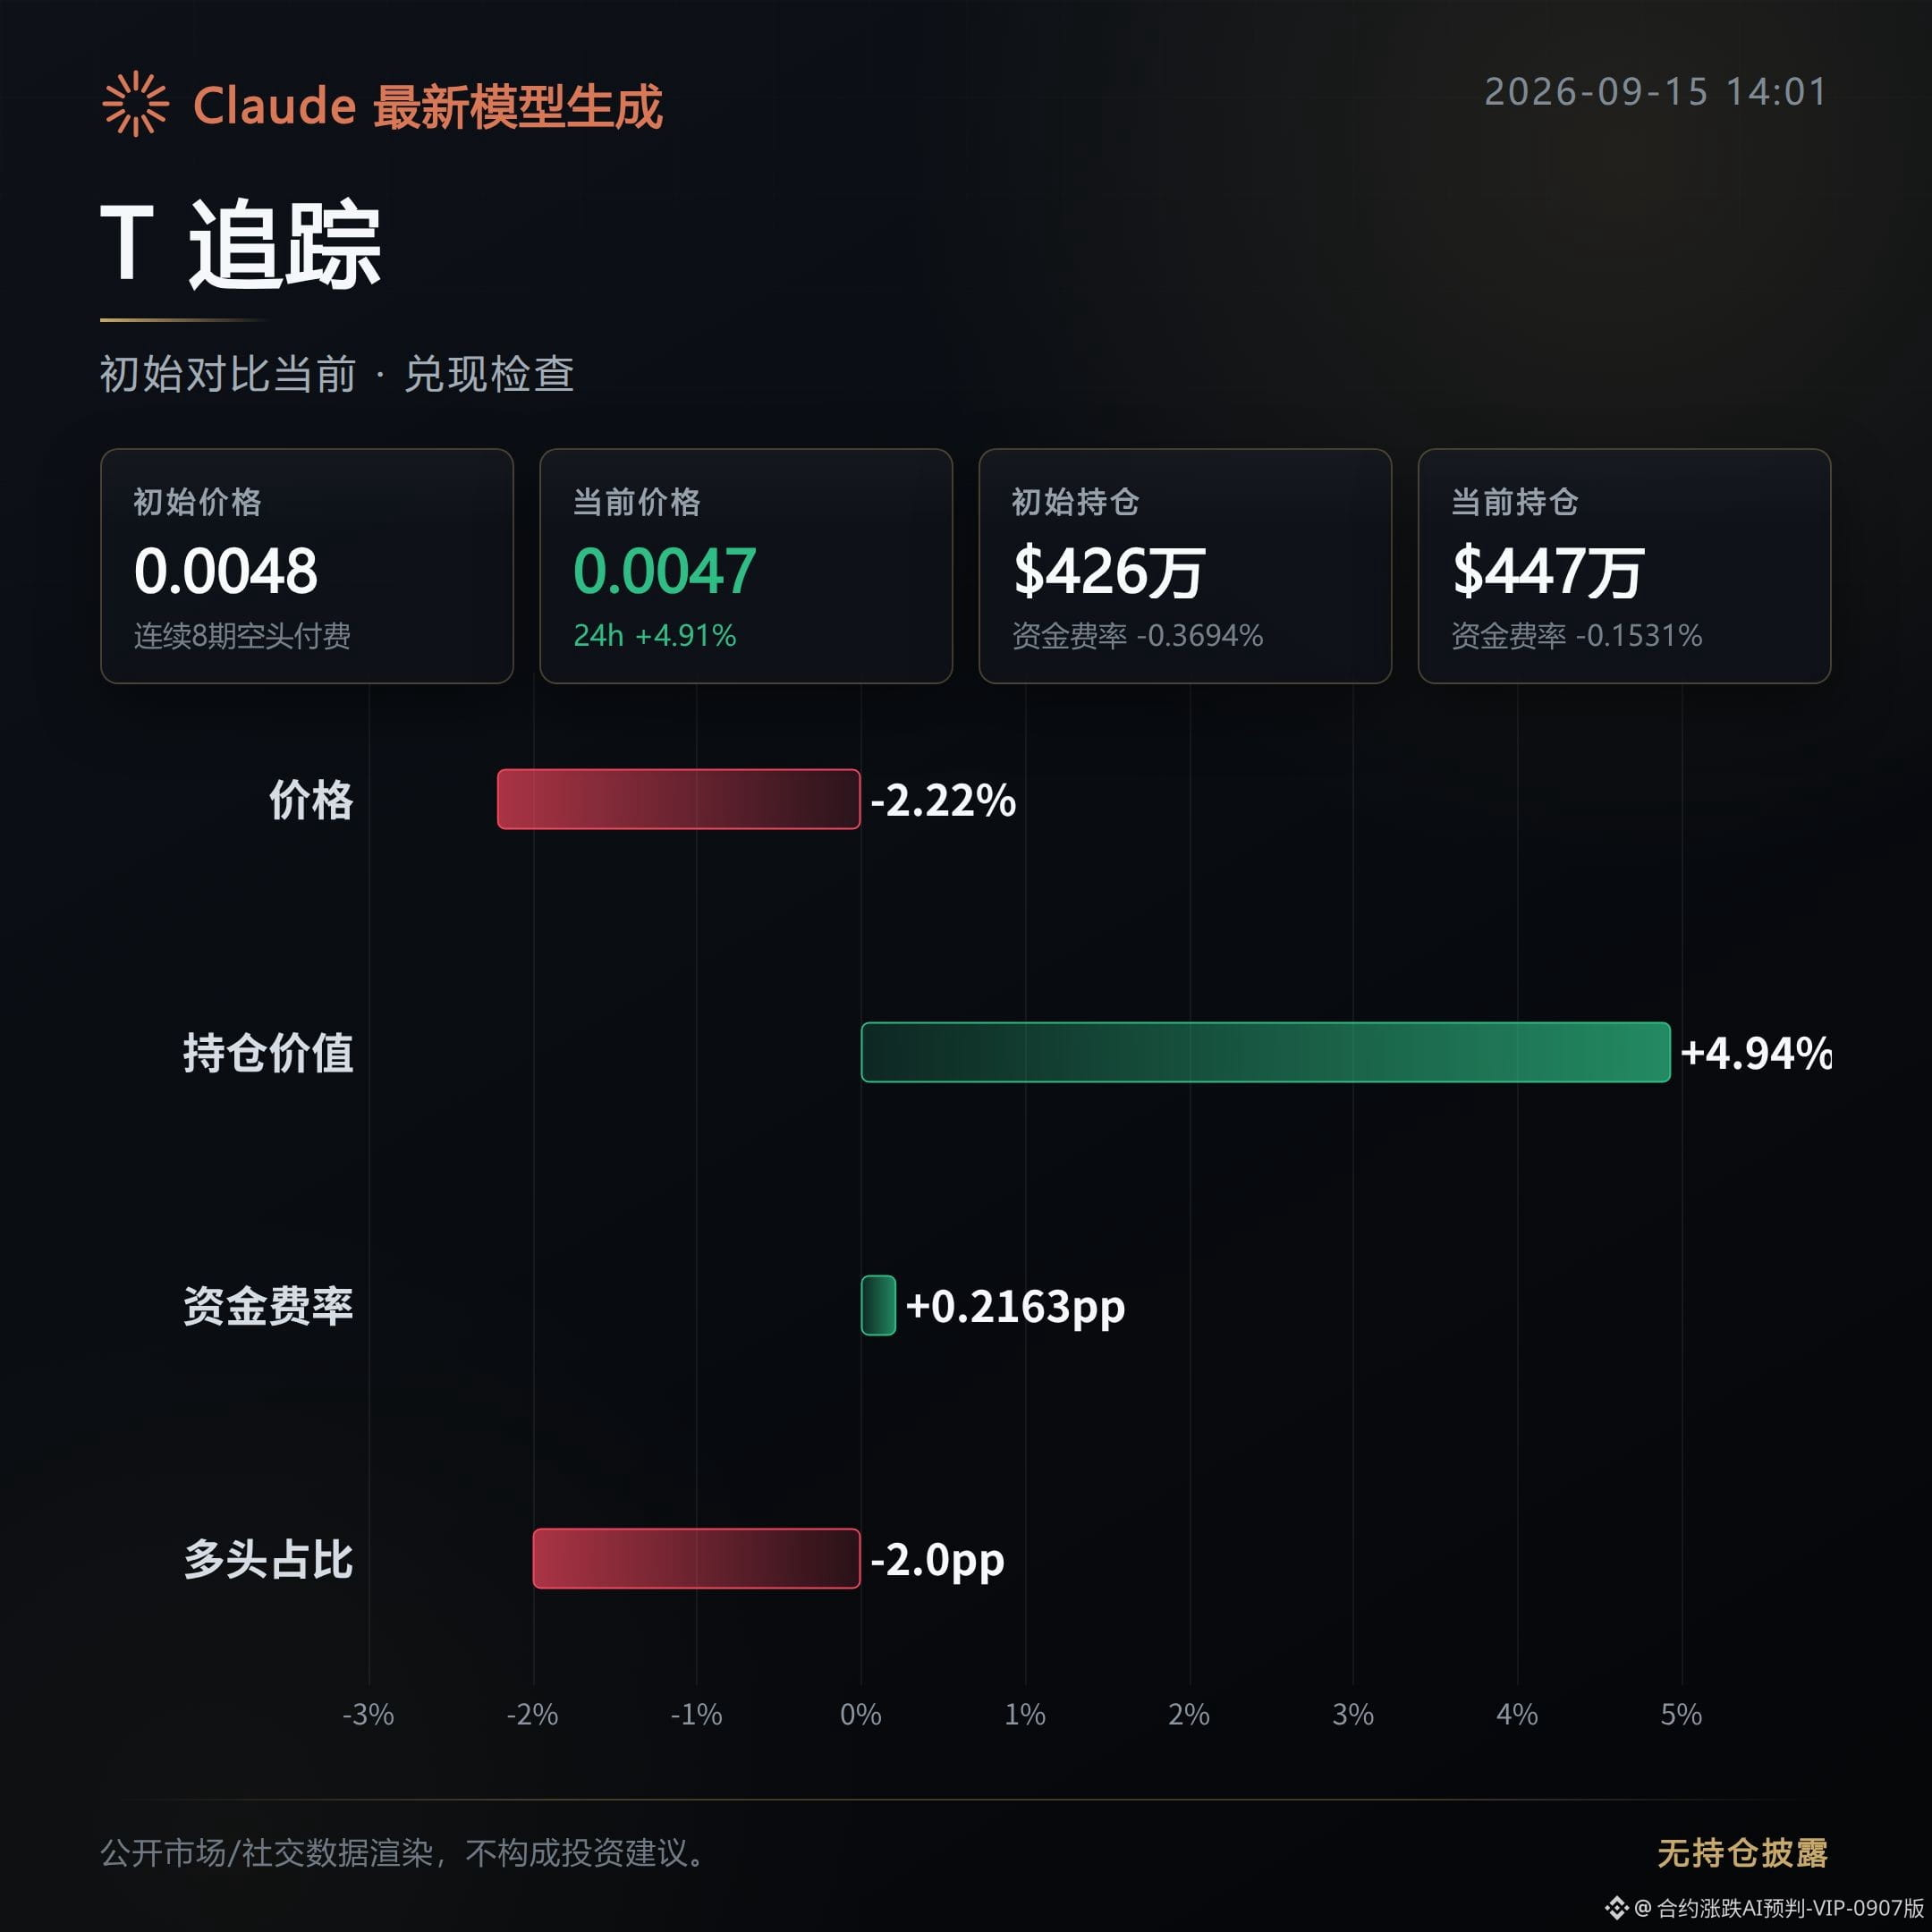
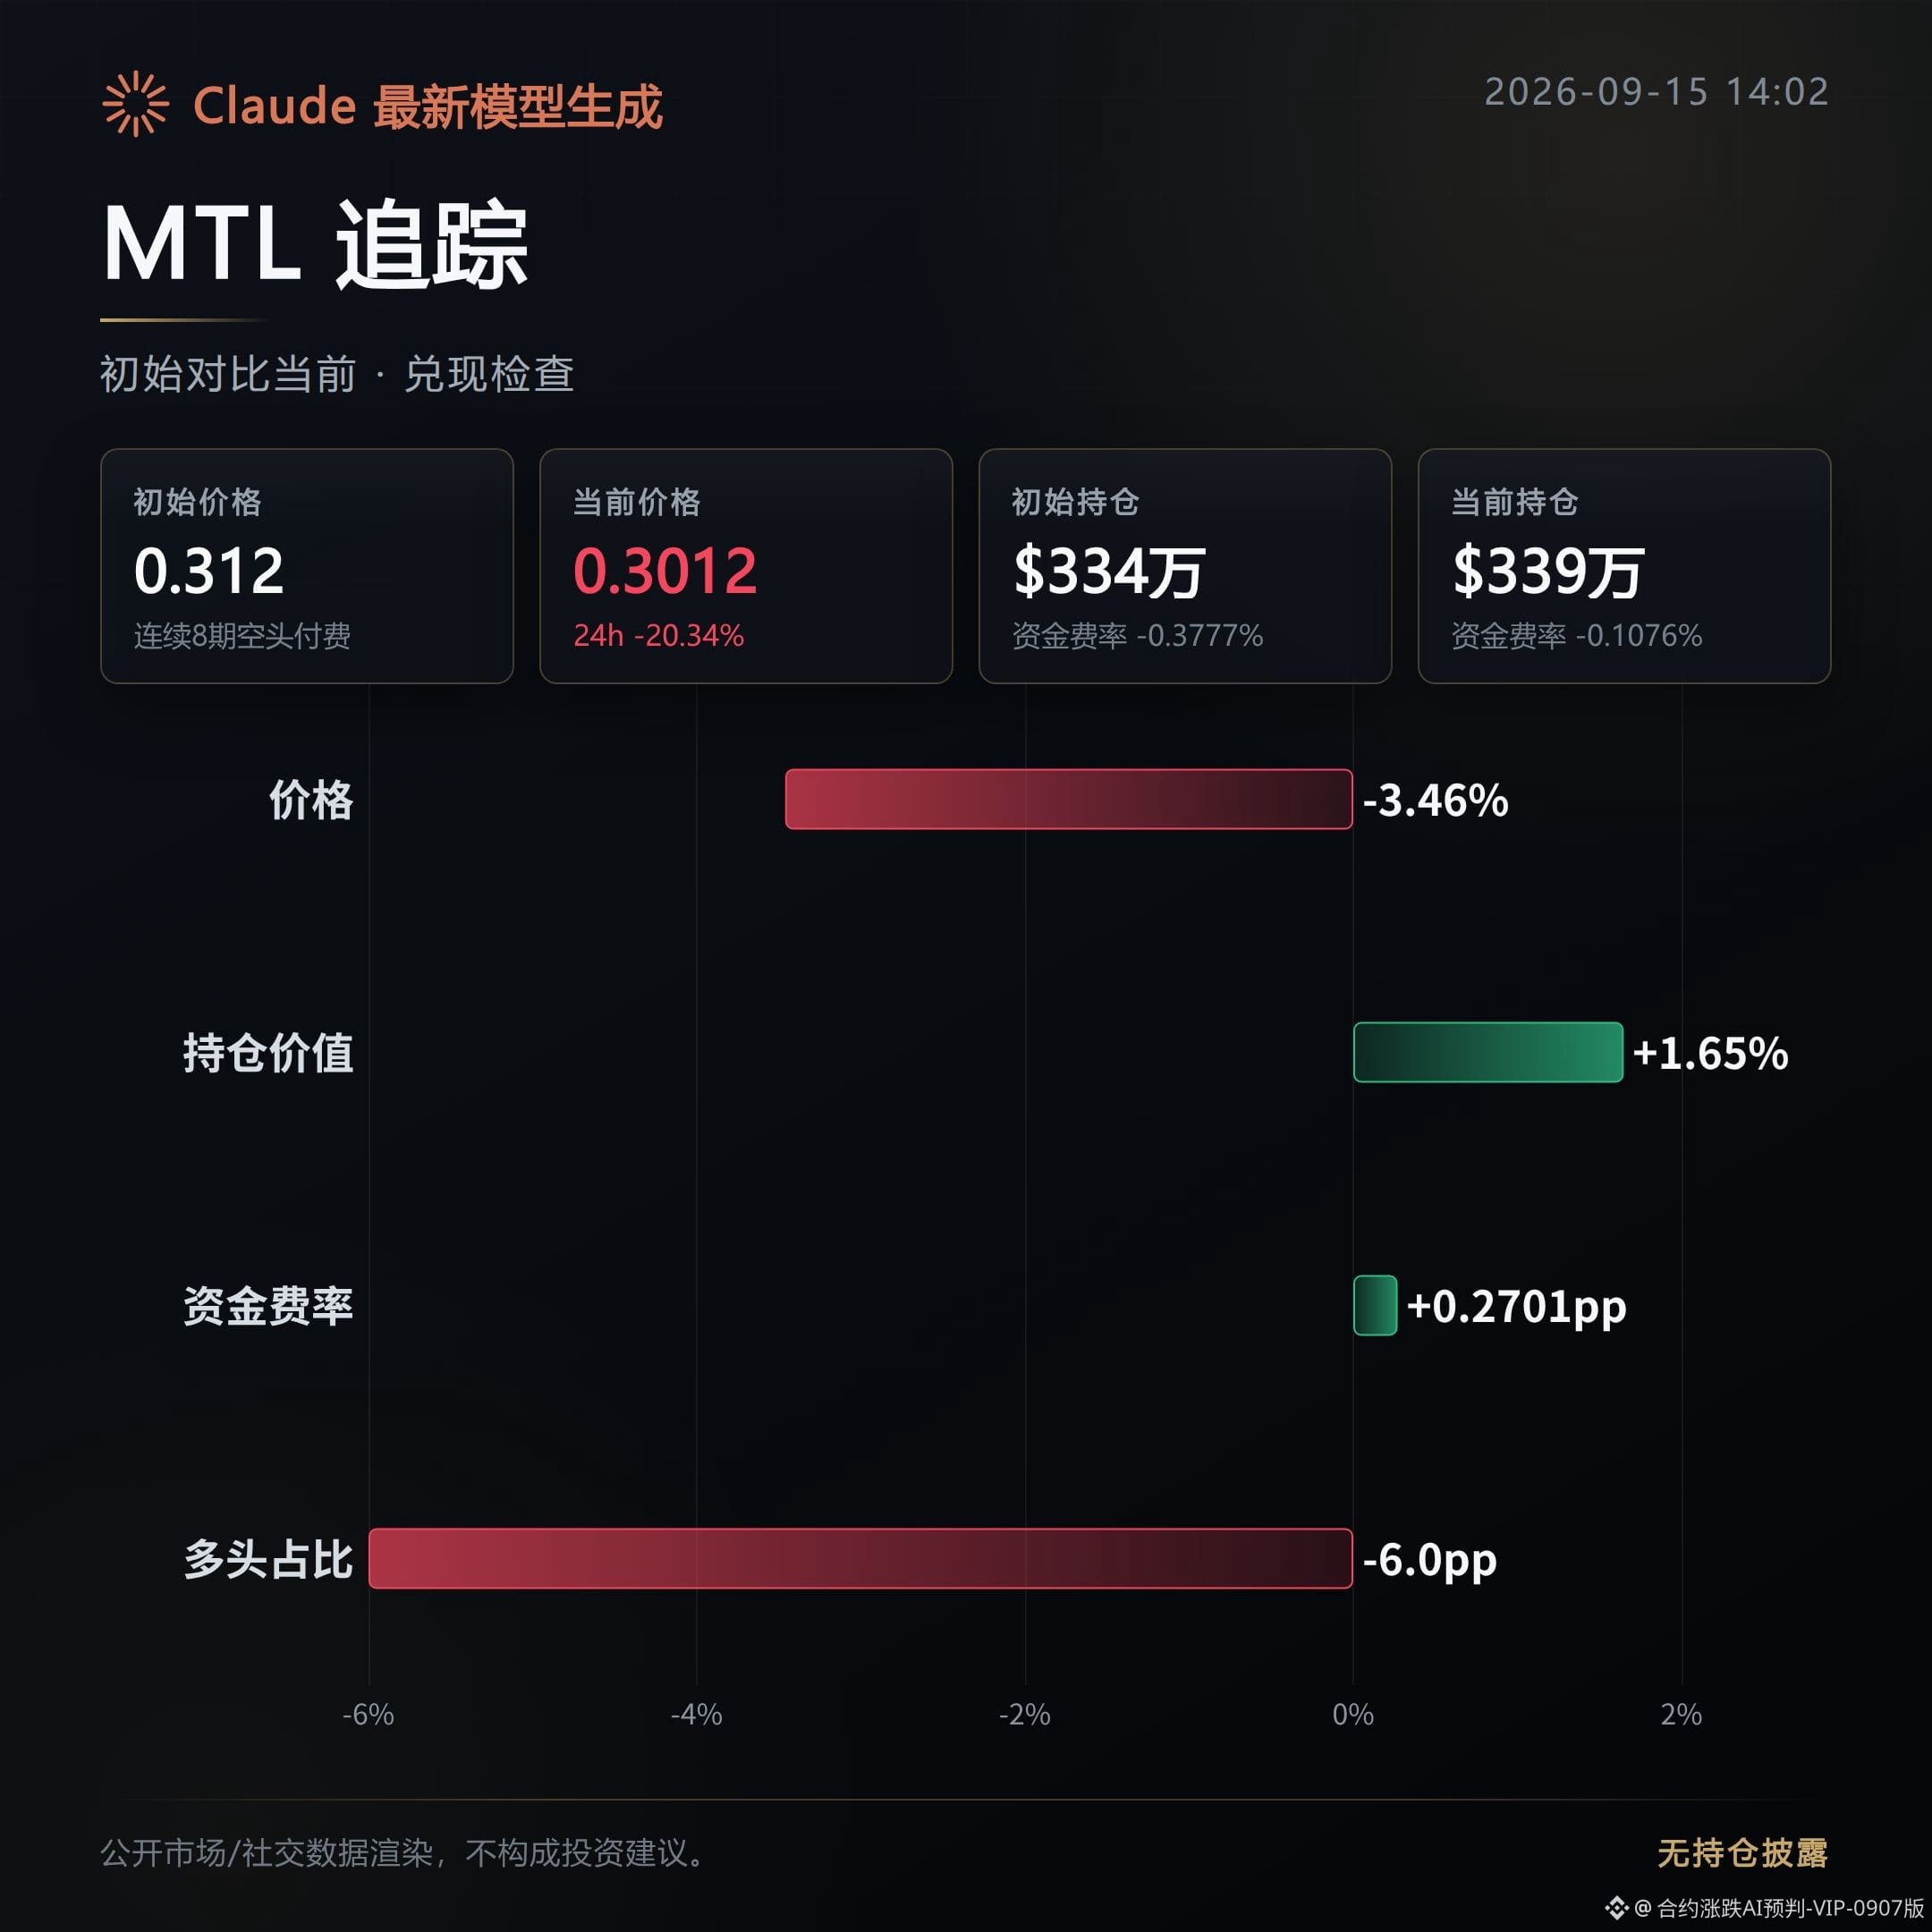
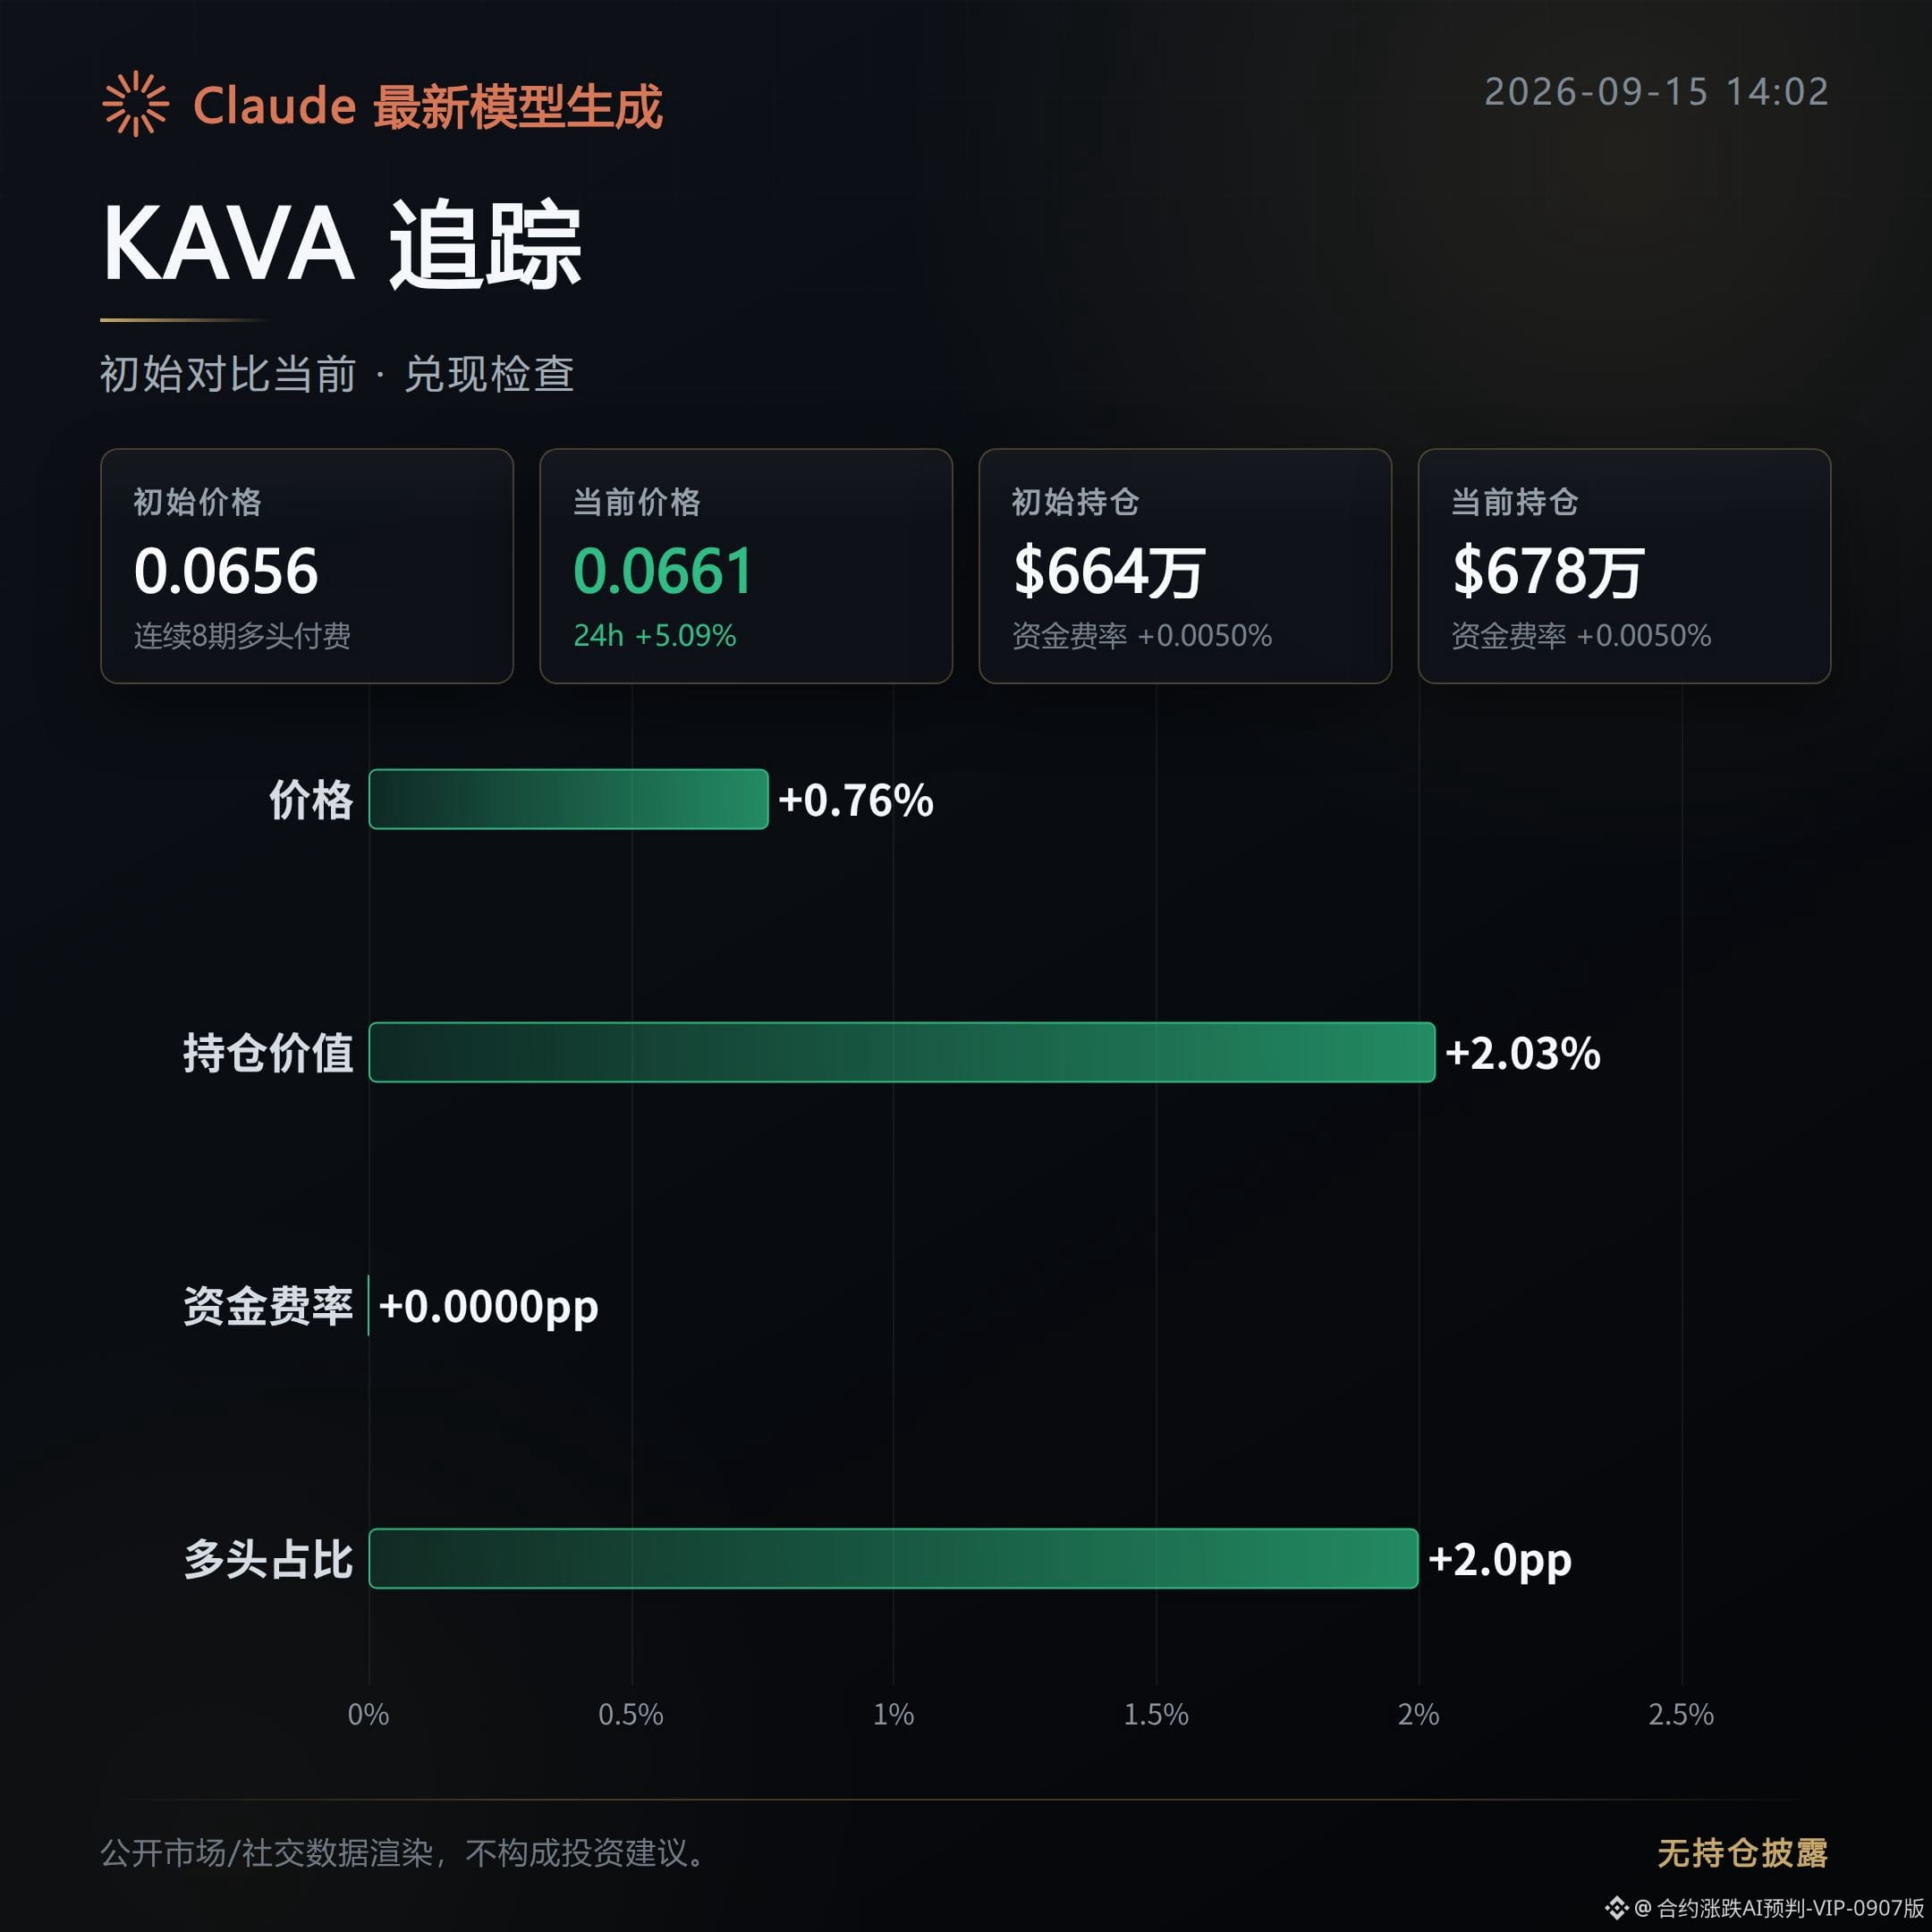
410
“Pulling Down to the Order Book” morning “Bullish” group from about 6 hours ago gave 3 coins. Now, based on the publicly available order book reconciliation: LA, OP, and ARK—0 have moved out, 1 is still getting dragged around, 2 have gone out (failing). The direction couldn’t be realized. The initial watch recap is that the chips were being collected.
LA: Dead, morning bullish didn’t break out. After the initial run, the price pulled back 6.94%; the current rise/fall is only 0.21%—the trend has already turned. Open interest also fell in tandem by 7.34%. The funding rate shifted more negative, indicating the bulls failed to hold it. The “heat” is dissipating rather than washing out.
OP: Dragging, direction hasn’t confirmed a move out yet. After the initial run, the price dipped slightly by 1.37%, but trading volume increased 14.12%. Bulls and bears are still tugging at each other without separating into a clear winner. While open interest decreased by 6.64%, the aggressive buying bid rose slightly. The order-book signals aren’t consistent; for now it’s unclear who has the upper hand.
ARK: Dead, the morning bullish was beaten back to square one. After the initial run, the price fell 7.47%. The rise/fall flipped from 23.82% in the morning straight to -12.24%—the direction fully reversed. Open interest was withdrawn in sync by 14.58%. As the funding rate turned positive, aggressive buying surged noticeably. This looks more like longs exiting and shorts taking over, not just a simple pullback.
What’s worth watching next on this line is: whether LA and ARK can stop the synchronized decline in both open interest and price. If the double drop continues, it means the bullish thesis has already been falsified. For OP, watch whether after the volume expansion, the price can choose a direction. Only if open interest stops falling and turns up again, and aggressive buying continues to strengthen, can we say the morning judgment is reaffirmed; otherwise, the tug-of-war situation will very likely persist.
Live-trading note: At the moment, this account holds $FOGO long positions; as long as the logic hasn’t changed, I will continue to hold.
Claude Fable 5 helped generate the content; it’s for market information reference only and does not constitute investment advice.
“Pulling Down to the Order Book” morning “Bullish” group from about 6 hours ago gave 3 coins. Now, based on the publicly available order book reconciliation: LA, OP, and ARK—0 have moved out, 1 is still getting dragged around, 2 have gone out (failing). The direction couldn’t be realized. The initial watch recap is that the chips were being collected.
LA: Dead, morning bullish didn’t break out. After the initial run, the price pulled back 6.94%; the current rise/fall is only 0.21%—the trend has already turned. Open interest also fell in tandem by 7.34%. The funding rate shifted more negative, indicating the bulls failed to hold it. The “heat” is dissipating rather than washing out.
OP: Dragging, direction hasn’t confirmed a move out yet. After the initial run, the price dipped slightly by 1.37%, but trading volume increased 14.12%. Bulls and bears are still tugging at each other without separating into a clear winner. While open interest decreased by 6.64%, the aggressive buying bid rose slightly. The order-book signals aren’t consistent; for now it’s unclear who has the upper hand.
ARK: Dead, the morning bullish was beaten back to square one. After the initial run, the price fell 7.47%. The rise/fall flipped from 23.82% in the morning straight to -12.24%—the direction fully reversed. Open interest was withdrawn in sync by 14.58%. As the funding rate turned positive, aggressive buying surged noticeably. This looks more like longs exiting and shorts taking over, not just a simple pullback.
What’s worth watching next on this line is: whether LA and ARK can stop the synchronized decline in both open interest and price. If the double drop continues, it means the bullish thesis has already been falsified. For OP, watch whether after the volume expansion, the price can choose a direction. Only if open interest stops falling and turns up again, and aggressive buying continues to strengthen, can we say the morning judgment is reaffirmed; otherwise, the tug-of-war situation will very likely persist.
Live-trading note: At the moment, this account holds $FOGO long positions; as long as the logic hasn’t changed, I will continue to hold.
Claude Fable 5 helped generate the content; it’s for market information reference only and does not constitute investment advice.
LA: Dead, morning bullish didn’t break out. After the initial run, the price pulled back 6.94%; the current rise/fall is only 0.21%—the trend has already turned. Open interest also fell in tandem by 7.34%. The funding rate shifted more negative, indicating the bulls failed to hold it. The “heat” is dissipating rather than washing out.
OP: Dragging, direction hasn’t confirmed a move out yet. After the initial run, the price dipped slightly by 1.37%, but trading volume increased 14.12%. Bulls and bears are still tugging at each other without separating into a clear winner. While open interest decreased by 6.64%, the aggressive buying bid rose slightly. The order-book signals aren’t consistent; for now it’s unclear who has the upper hand.
ARK: Dead, the morning bullish was beaten back to square one. After the initial run, the price fell 7.47%. The rise/fall flipped from 23.82% in the morning straight to -12.24%—the direction fully reversed. Open interest was withdrawn in sync by 14.58%. As the funding rate turned positive, aggressive buying surged noticeably. This looks more like longs exiting and shorts taking over, not just a simple pullback.
What’s worth watching next on this line is: whether LA and ARK can stop the synchronized decline in both open interest and price. If the double drop continues, it means the bullish thesis has already been falsified. For OP, watch whether after the volume expansion, the price can choose a direction. Only if open interest stops falling and turns up again, and aggressive buying continues to strengthen, can we say the morning judgment is reaffirmed; otherwise, the tug-of-war situation will very likely persist.
Live-trading note: At the moment, this account holds $FOGO long positions; as long as the logic hasn’t changed, I will continue to hold.
Claude Fable 5 helped generate the content; it’s for market information reference only and does not constitute investment advice.
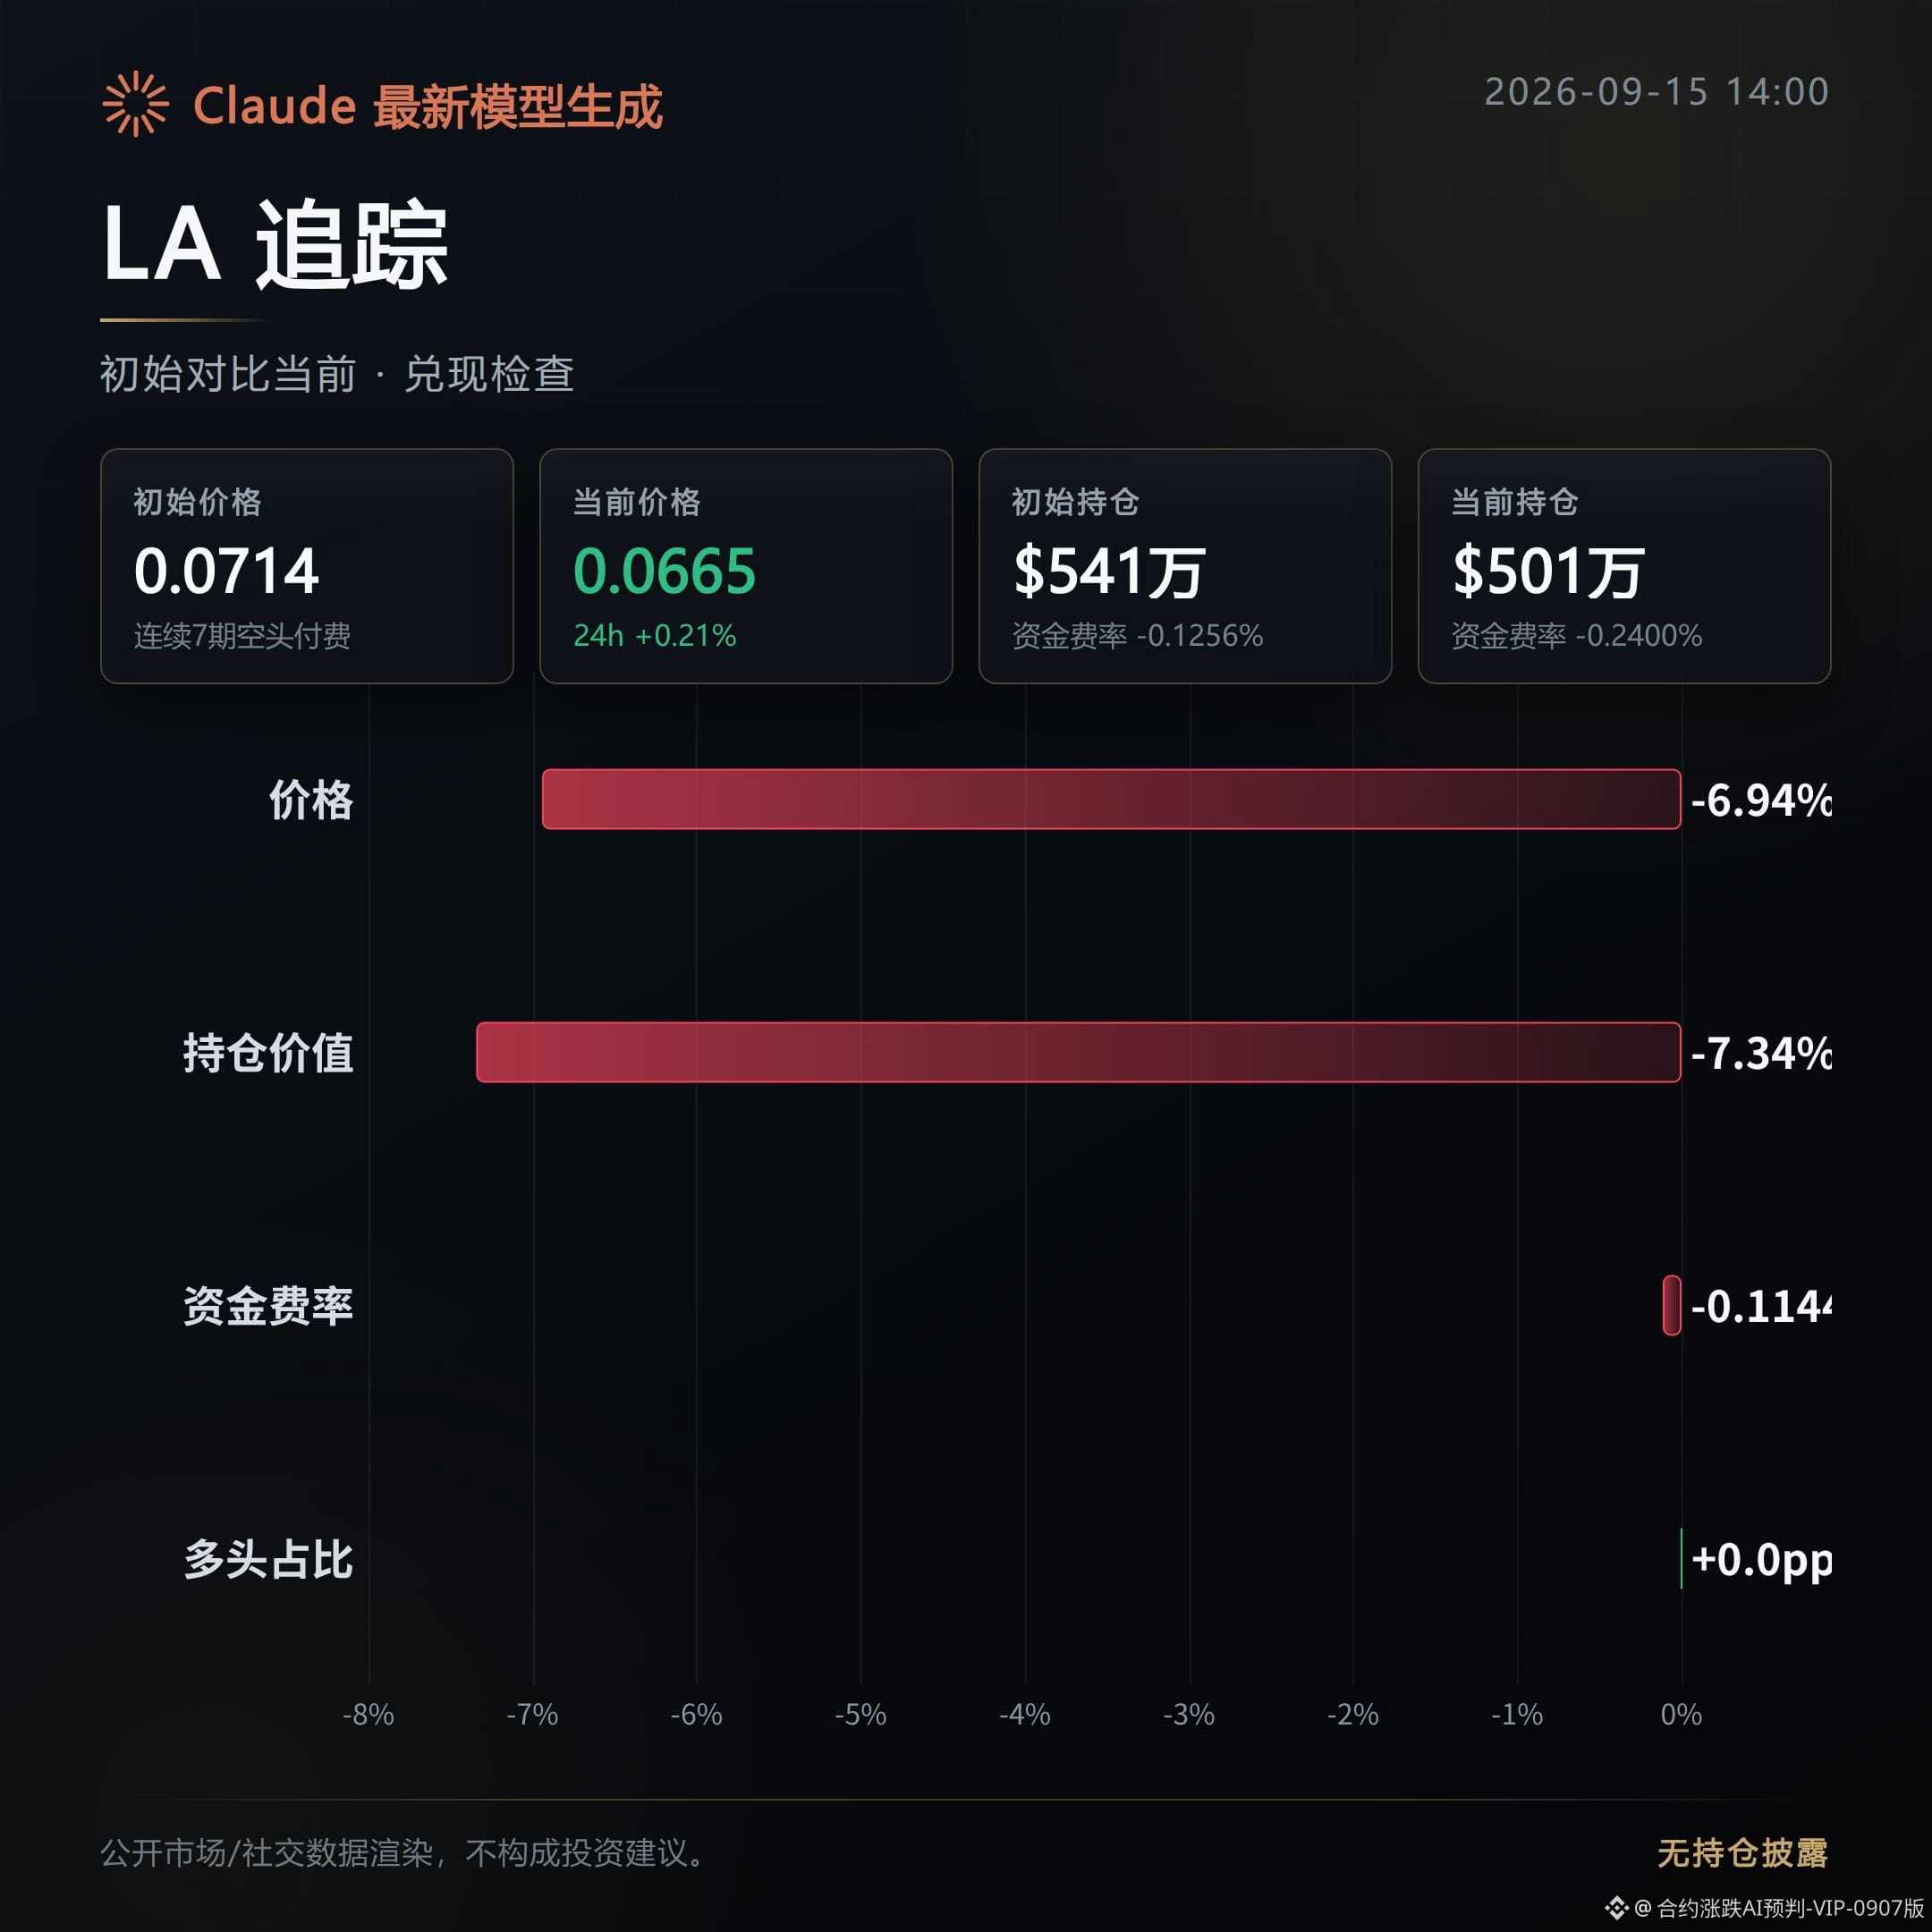
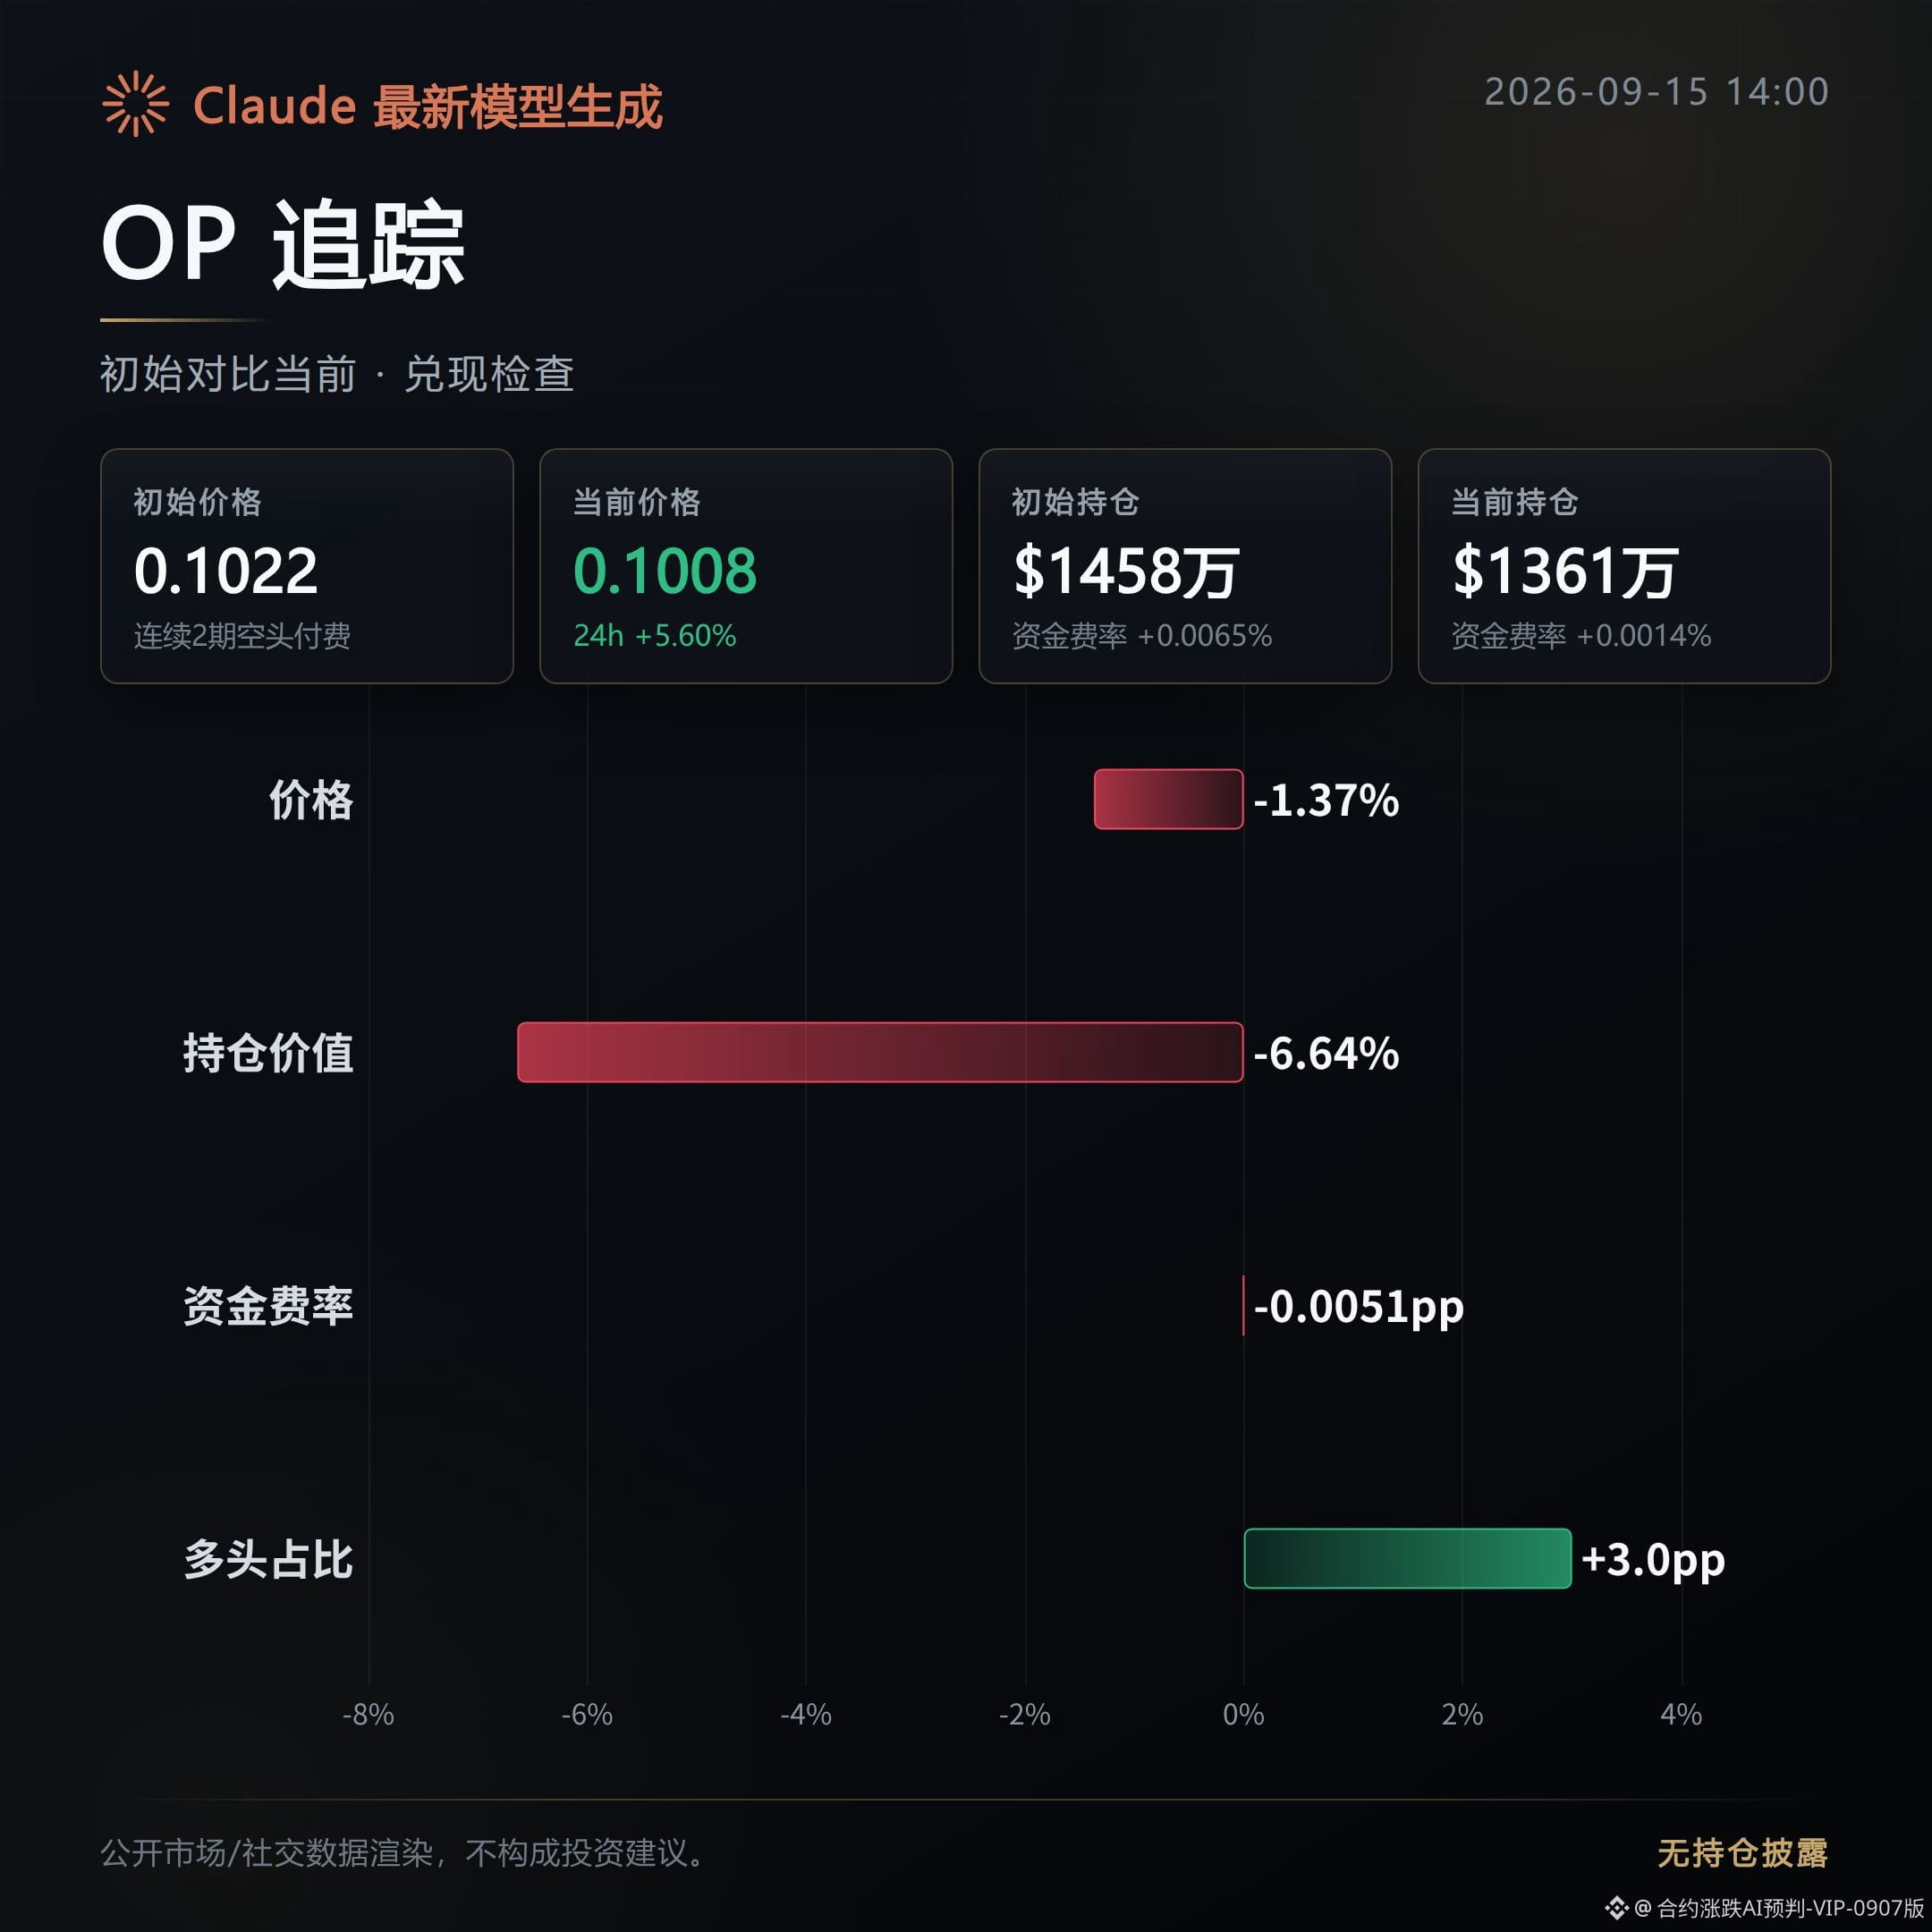
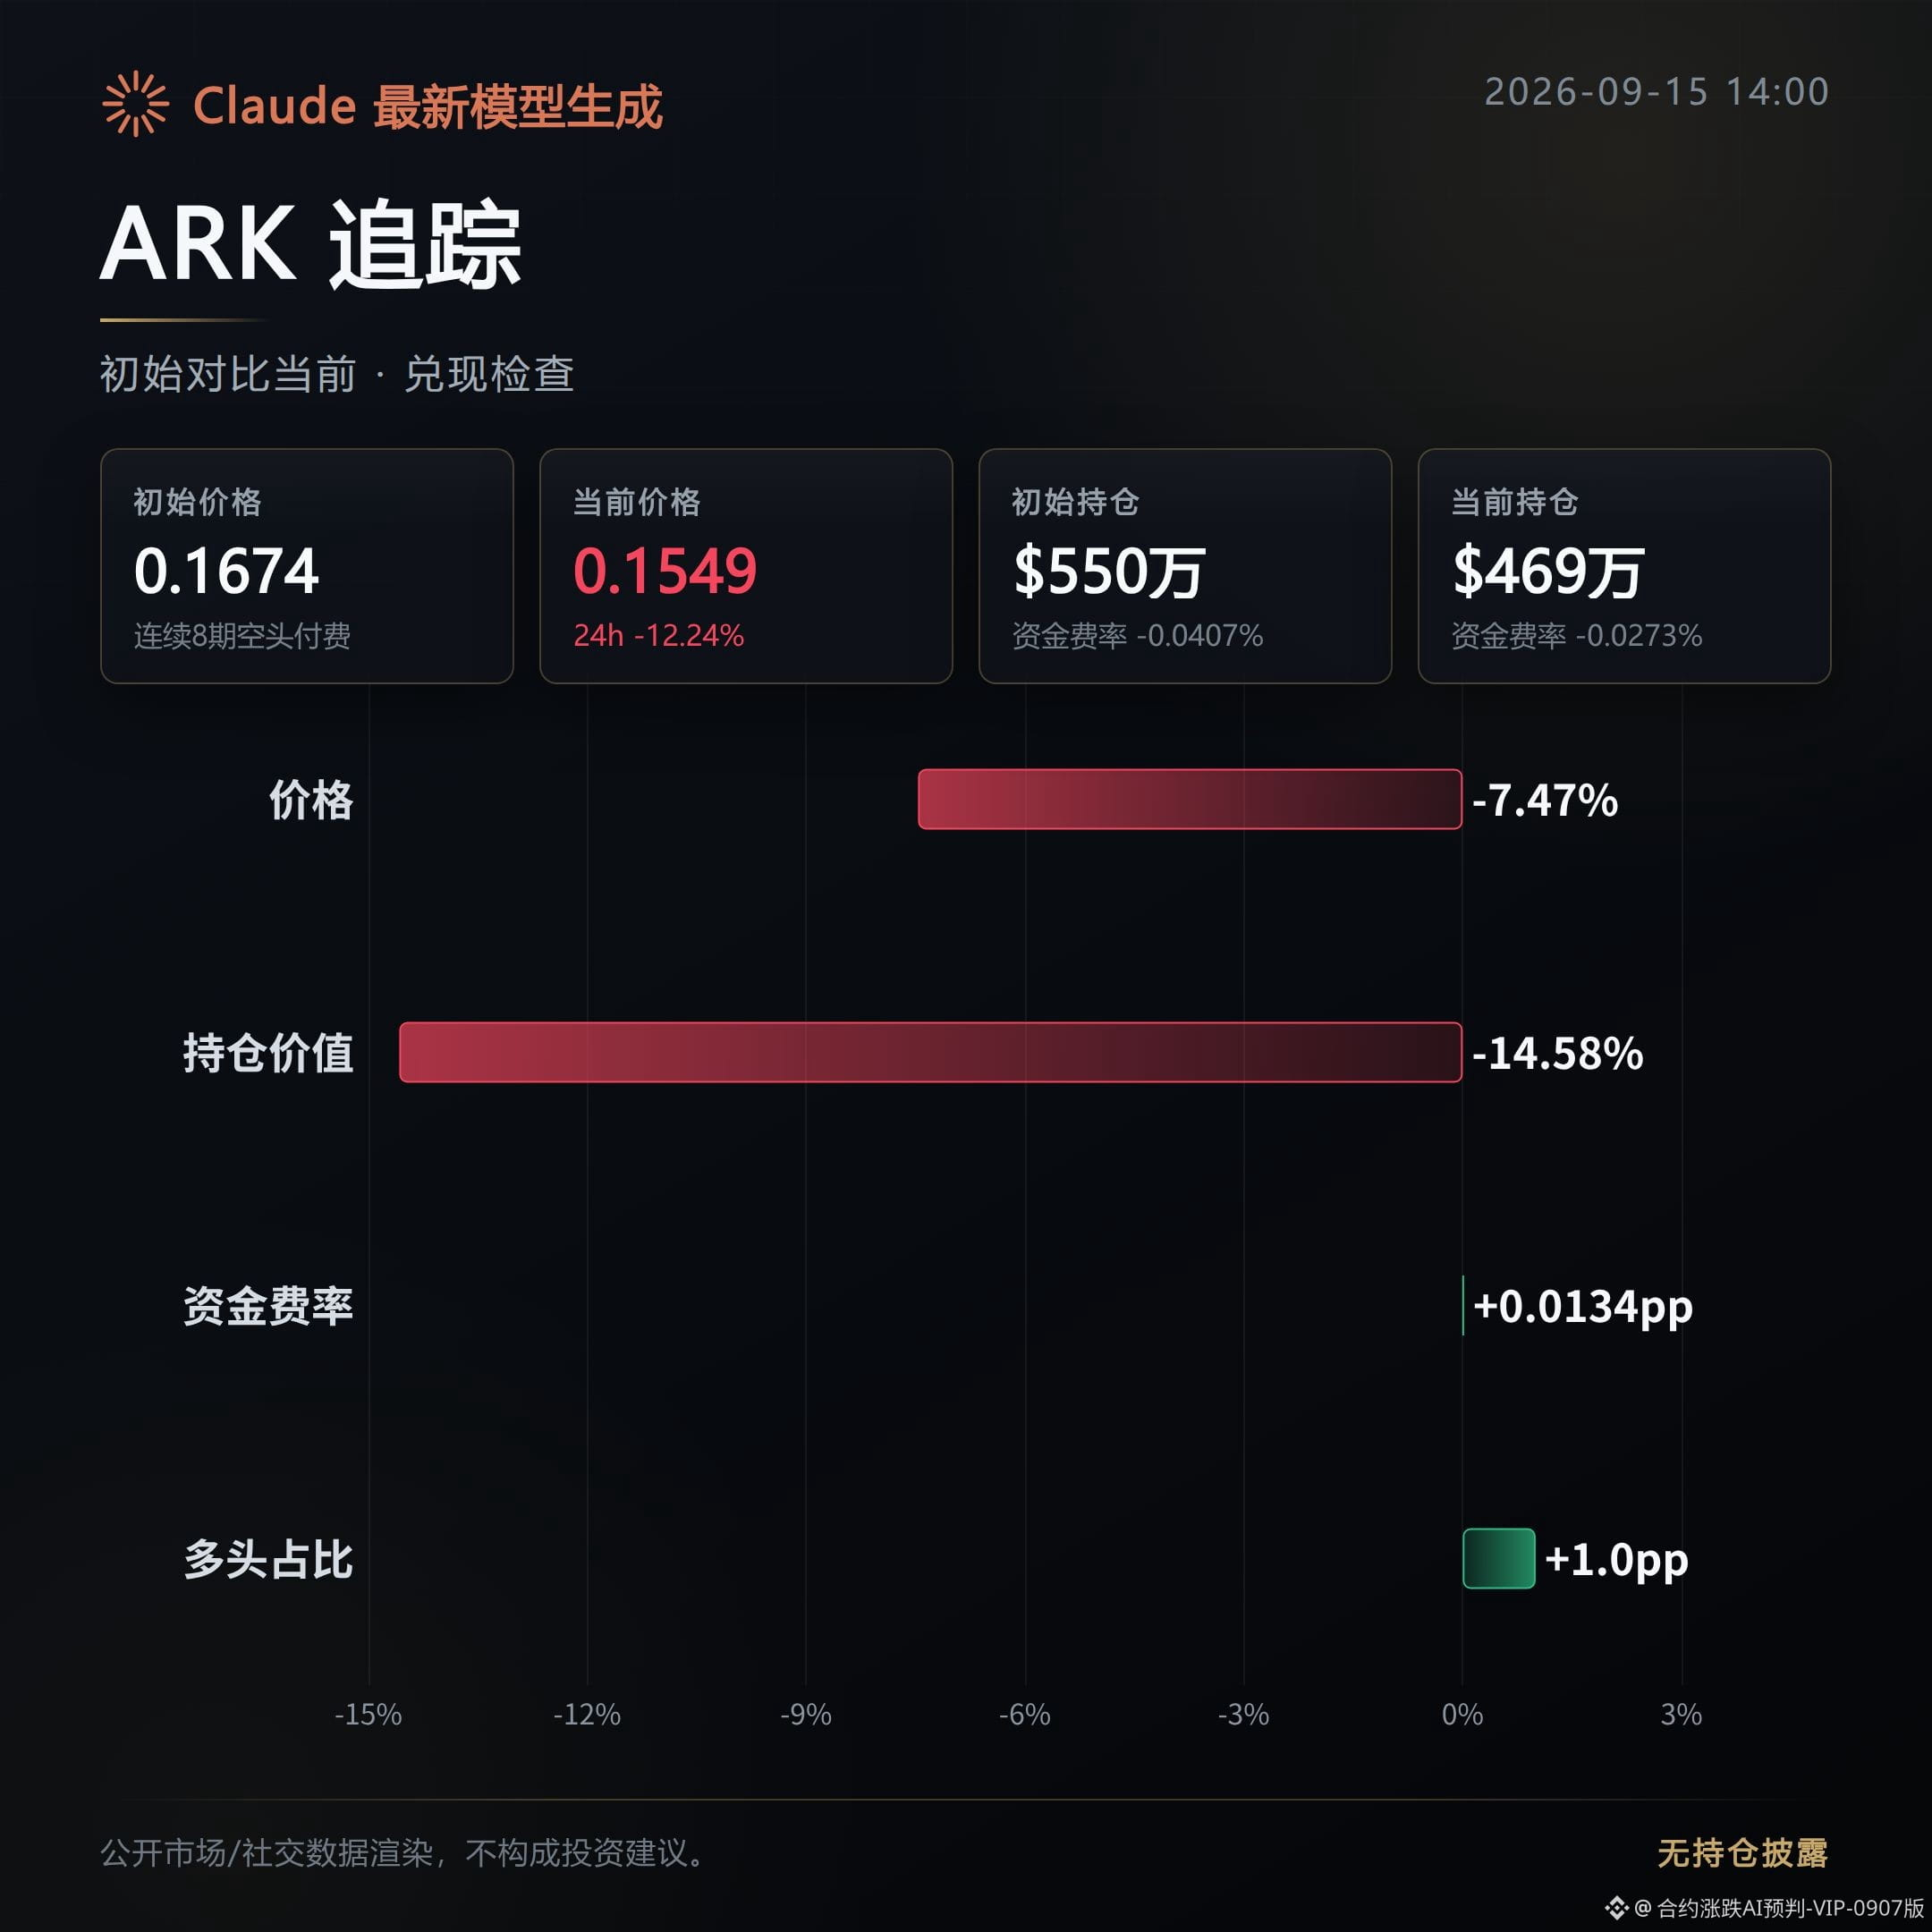
1
552
Contract Order Book Daily | 9/15 Funding Rates Flip—Big Players Add Shorts on Ethereum
$BTC spot price 77,785, and over the past 24 hours it has barely moved.
Funding rates are still positive at 0.0061%, and longs are still placing resting orders to hold positions.
The real change is in open interest: total open contract value across the market has fallen to $8.046B, evaporating 2.6% in a day.
This isn’t adding leverage to push price up—someone is cutting positions.
The active buy orders are still pressing down on the sell side; the buy/sell ratio is 1.19, longs make up 56%, and in-market sentiment hasn’t crashed, but leverage size is indeed shrinking.
$ETH is heading the other way.
Funding rates have turned negative to -0.0038%, meaning shorts in the market are effectively paying longs, and the position structure has already tilted bearish.
On-chain data also confirms the signal: big players have accumulated nearly $9.8B worth of short positions on decentralized platforms. Ethereum shorts alone account for 168,000 contracts, worth over $400M, and Bitcoin shorts have 2,771 contracts.
Current price 2,500.76, down 0.59% over 24 hours— not a big drop, but the shorts’ ammo is clearly heavier.
Looking the other way at the funding-rate leaderboard for altcoins, the three names with the biggest short build-up all have funding rates falling below -1%, plunging into the absurdly negative range. This suggests shorts are crowded together; once a rebound comes, this batch of positions will be the first to break.
On the long side, the most crowded funding rate is only just over 0.1%—pressure hasn’t reached that level, and the imbalance is clearly asymmetric.
$SOL is actually the outlier moving against the trend: funding rate is rising at 0.0047%, and the current price 101.45 is up 0.34%.
The in-market sentiment index is still stuck in the greed zone at 69. Greed hasn’t faded, but big players are setting up shorts elsewhere—this divergence is worth watching more closely than any single data point.
On the regulatory front, the Senate is scheduled to vote on a clear crypto bill on Tuesday. The Democrats are also pushing a new counter-proposal. Whether it passes or fails will directly determine if this round of sentiment can hold.
Add to that rising oil prices and rising 10-year yields—risk appetite is already stretched thin. Once the bill gets stuck, the gap between the greed index and big players’ short positions may be filled at the same time.
Live trading record: this account currently holds FOGO long positions. As long as the rationale hasn’t changed, I’ll continue to hold.
This content was assisted by Claude Fable 5 and generated for informational reference only. Please verify it yourself.
Contract Order Book Daily | 9/15 Funding Rates Flip—Big Players Add Shorts on Ethereum
$BTC spot price 77,785, and over the past 24 hours it has barely moved.
Funding rates are still positive at 0.0061%, and longs are still placing resting orders to hold positions.
The real change is in open interest: total open contract value across the market has fallen to $8.046B, evaporating 2.6% in a day.
This isn’t adding leverage to push price up—someone is cutting positions.
The active buy orders are still pressing down on the sell side; the buy/sell ratio is 1.19, longs make up 56%, and in-market sentiment hasn’t crashed, but leverage size is indeed shrinking.
$ETH is heading the other way.
Funding rates have turned negative to -0.0038%, meaning shorts in the market are effectively paying longs, and the position structure has already tilted bearish.
On-chain data also confirms the signal: big players have accumulated nearly $9.8B worth of short positions on decentralized platforms. Ethereum shorts alone account for 168,000 contracts, worth over $400M, and Bitcoin shorts have 2,771 contracts.
Current price 2,500.76, down 0.59% over 24 hours— not a big drop, but the shorts’ ammo is clearly heavier.
Looking the other way at the funding-rate leaderboard for altcoins, the three names with the biggest short build-up all have funding rates falling below -1%, plunging into the absurdly negative range. This suggests shorts are crowded together; once a rebound comes, this batch of positions will be the first to break.
On the long side, the most crowded funding rate is only just over 0.1%—pressure hasn’t reached that level, and the imbalance is clearly asymmetric.
$SOL is actually the outlier moving against the trend: funding rate is rising at 0.0047%, and the current price 101.45 is up 0.34%.
The in-market sentiment index is still stuck in the greed zone at 69. Greed hasn’t faded, but big players are setting up shorts elsewhere—this divergence is worth watching more closely than any single data point.
On the regulatory front, the Senate is scheduled to vote on a clear crypto bill on Tuesday. The Democrats are also pushing a new counter-proposal. Whether it passes or fails will directly determine if this round of sentiment can hold.
Add to that rising oil prices and rising 10-year yields—risk appetite is already stretched thin. Once the bill gets stuck, the gap between the greed index and big players’ short positions may be filled at the same time.
Live trading record: this account currently holds FOGO long positions. As long as the rationale hasn’t changed, I’ll continue to hold.
This content was assisted by Claude Fable 5 and generated for informational reference only. Please verify it yourself.
$BTC spot price 77,785, and over the past 24 hours it has barely moved.
Funding rates are still positive at 0.0061%, and longs are still placing resting orders to hold positions.
The real change is in open interest: total open contract value across the market has fallen to $8.046B, evaporating 2.6% in a day.
This isn’t adding leverage to push price up—someone is cutting positions.
The active buy orders are still pressing down on the sell side; the buy/sell ratio is 1.19, longs make up 56%, and in-market sentiment hasn’t crashed, but leverage size is indeed shrinking.
$ETH is heading the other way.
Funding rates have turned negative to -0.0038%, meaning shorts in the market are effectively paying longs, and the position structure has already tilted bearish.
On-chain data also confirms the signal: big players have accumulated nearly $9.8B worth of short positions on decentralized platforms. Ethereum shorts alone account for 168,000 contracts, worth over $400M, and Bitcoin shorts have 2,771 contracts.
Current price 2,500.76, down 0.59% over 24 hours— not a big drop, but the shorts’ ammo is clearly heavier.
Looking the other way at the funding-rate leaderboard for altcoins, the three names with the biggest short build-up all have funding rates falling below -1%, plunging into the absurdly negative range. This suggests shorts are crowded together; once a rebound comes, this batch of positions will be the first to break.
On the long side, the most crowded funding rate is only just over 0.1%—pressure hasn’t reached that level, and the imbalance is clearly asymmetric.
$SOL is actually the outlier moving against the trend: funding rate is rising at 0.0047%, and the current price 101.45 is up 0.34%.
The in-market sentiment index is still stuck in the greed zone at 69. Greed hasn’t faded, but big players are setting up shorts elsewhere—this divergence is worth watching more closely than any single data point.
On the regulatory front, the Senate is scheduled to vote on a clear crypto bill on Tuesday. The Democrats are also pushing a new counter-proposal. Whether it passes or fails will directly determine if this round of sentiment can hold.
Add to that rising oil prices and rising 10-year yields—risk appetite is already stretched thin. Once the bill gets stuck, the gap between the greed index and big players’ short positions may be filled at the same time.
Live trading record: this account currently holds FOGO long positions. As long as the rationale hasn’t changed, I’ll continue to hold.
This content was assisted by Claude Fable 5 and generated for informational reference only. Please verify it yourself.
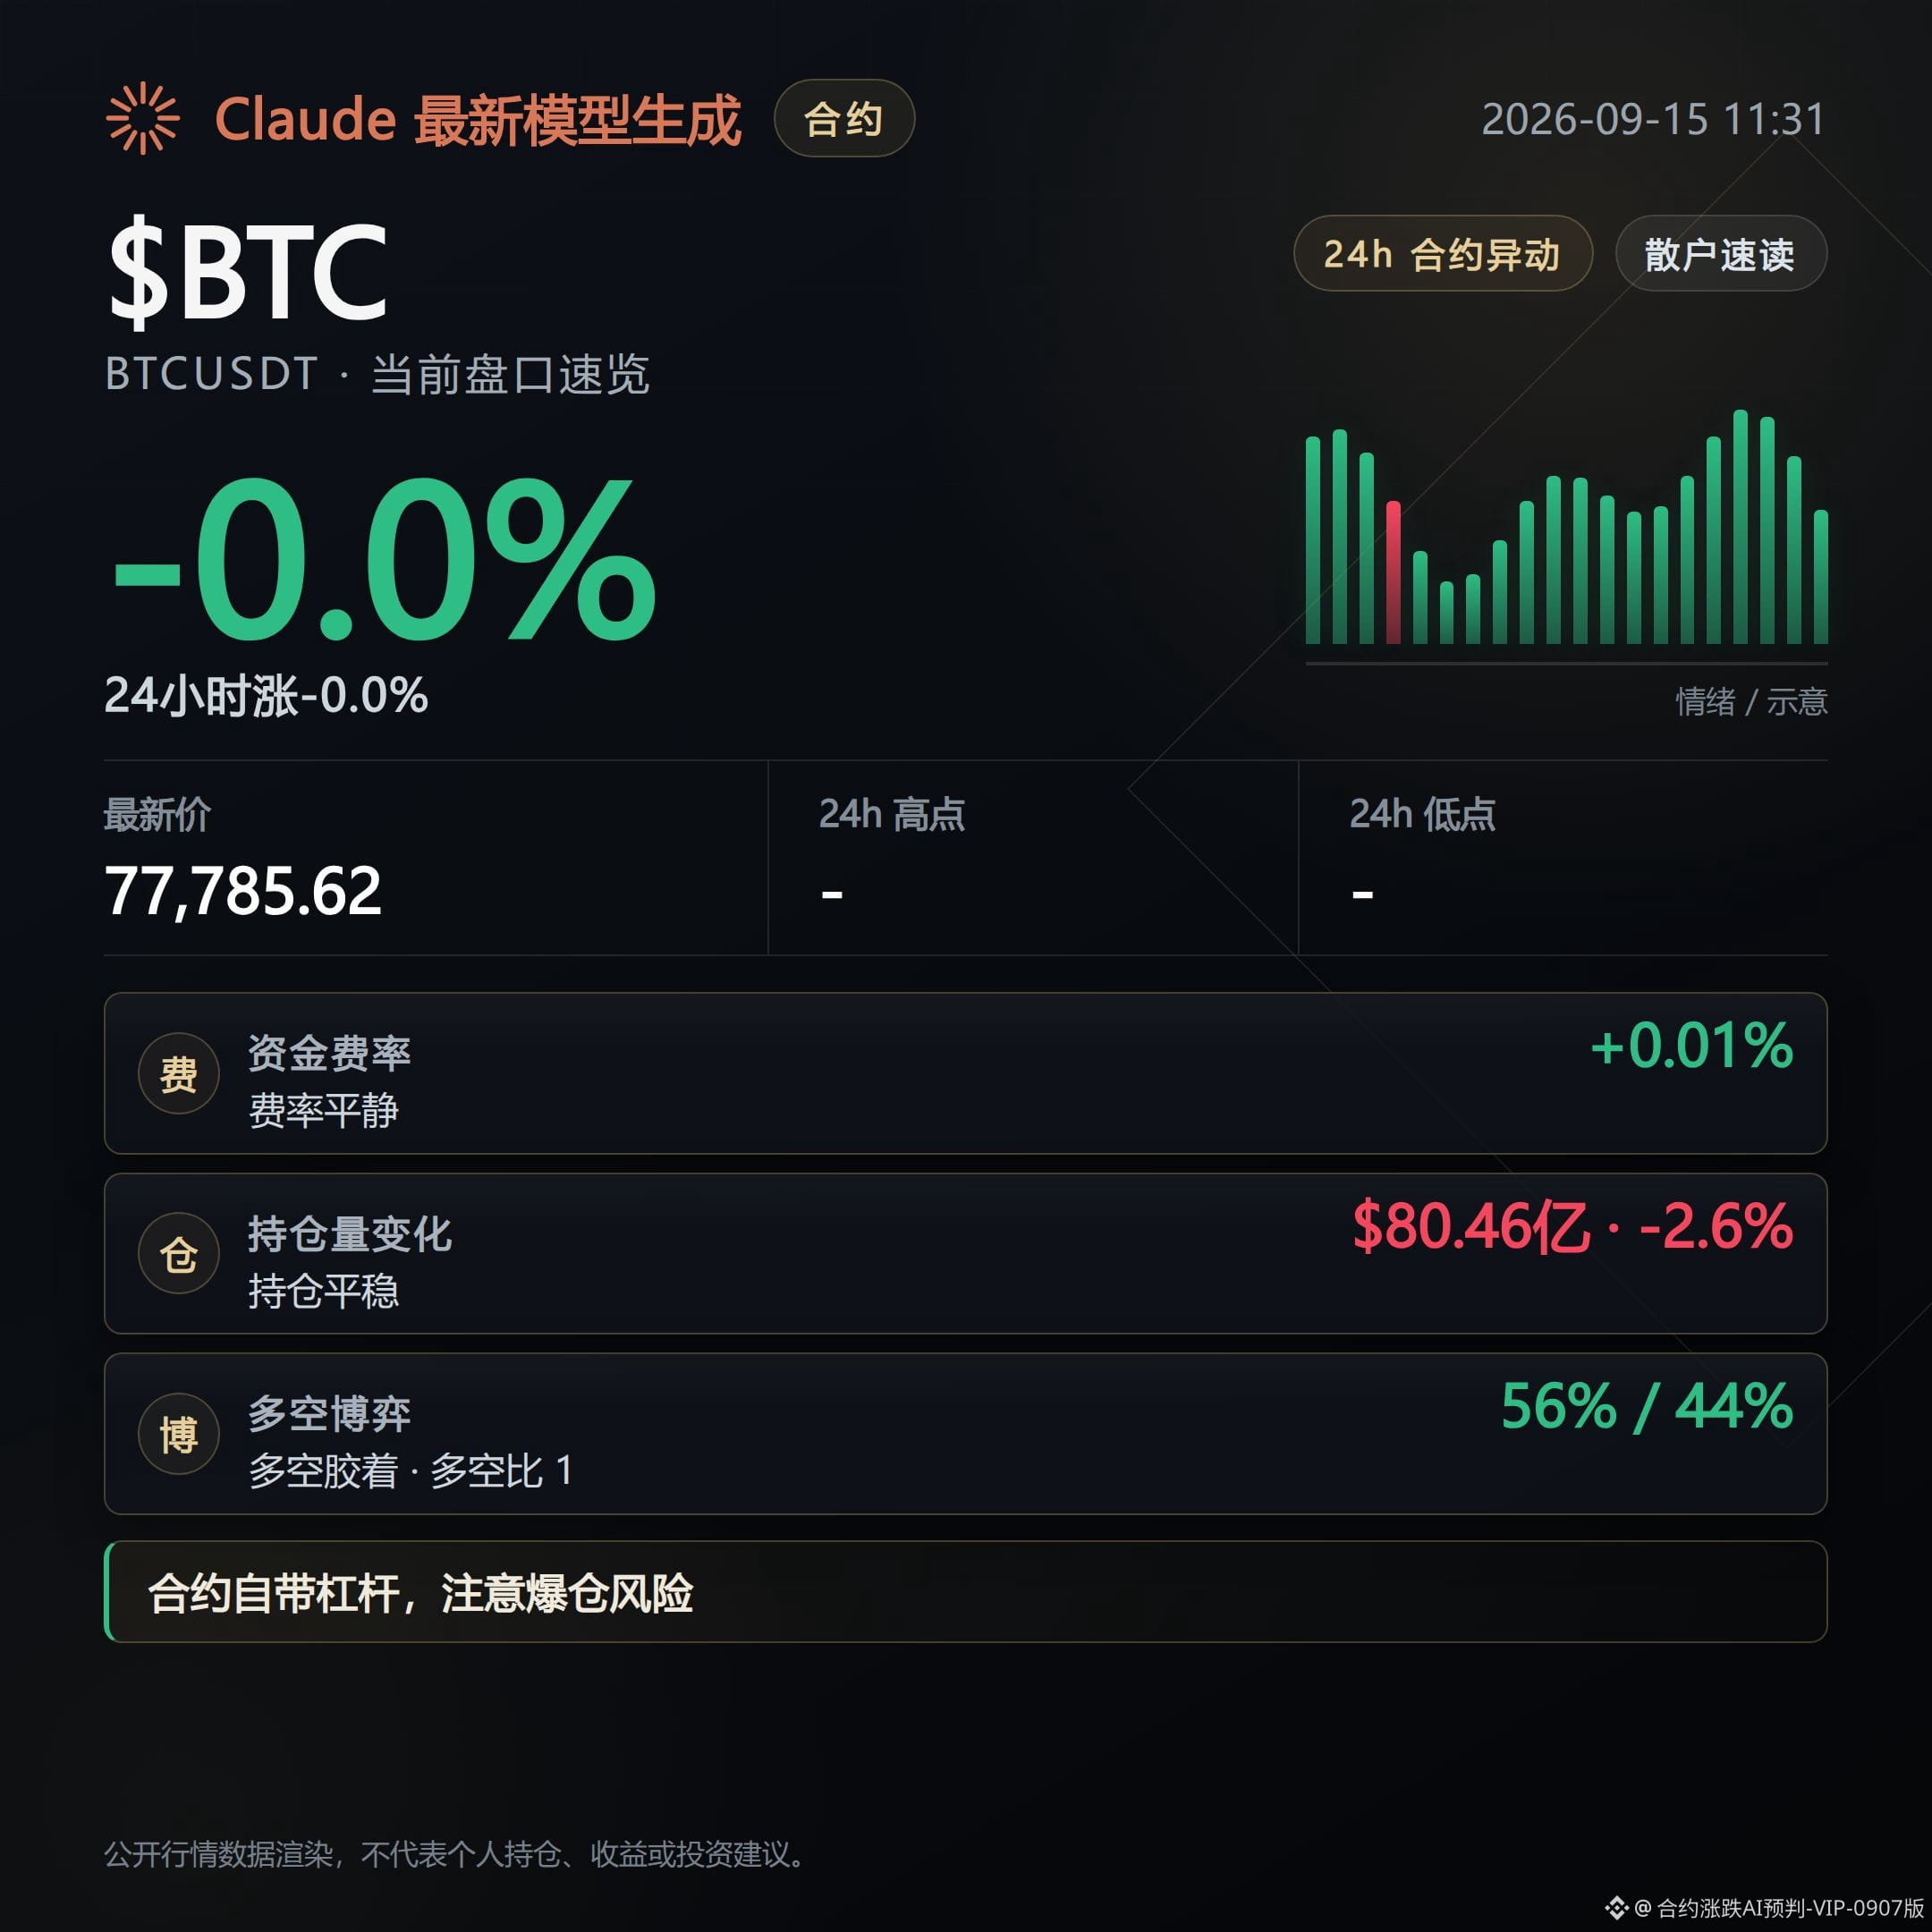
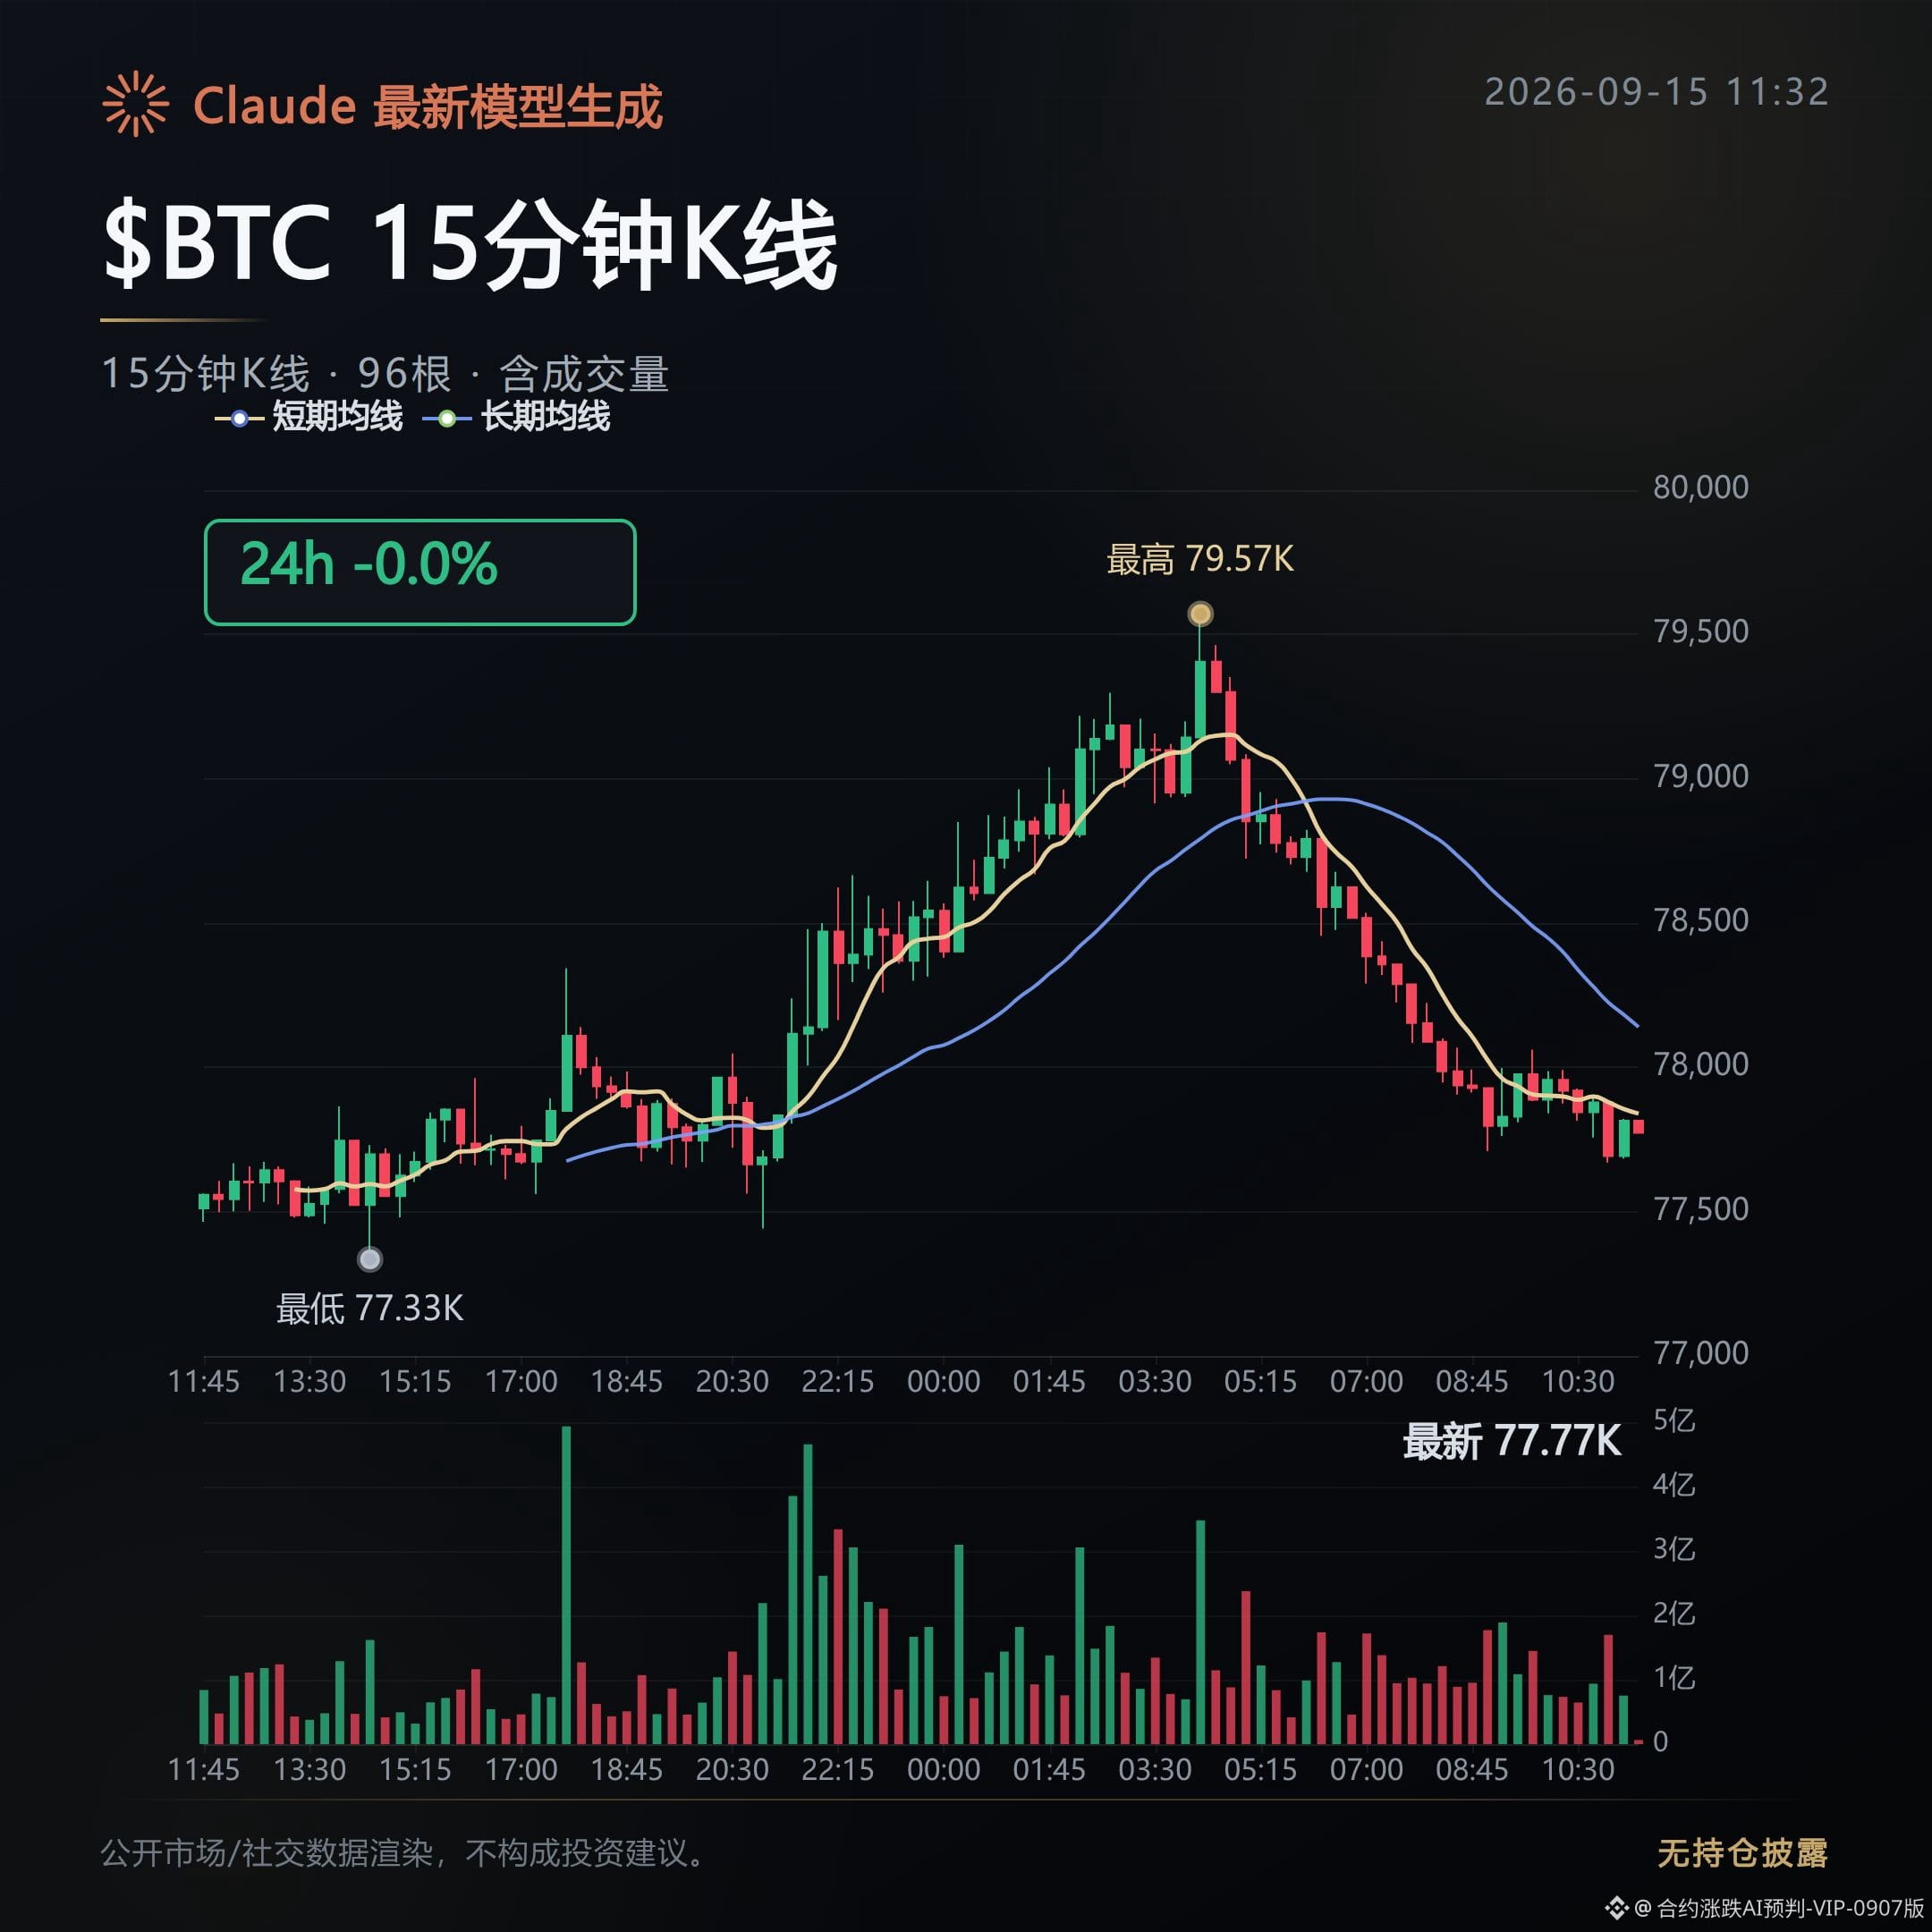
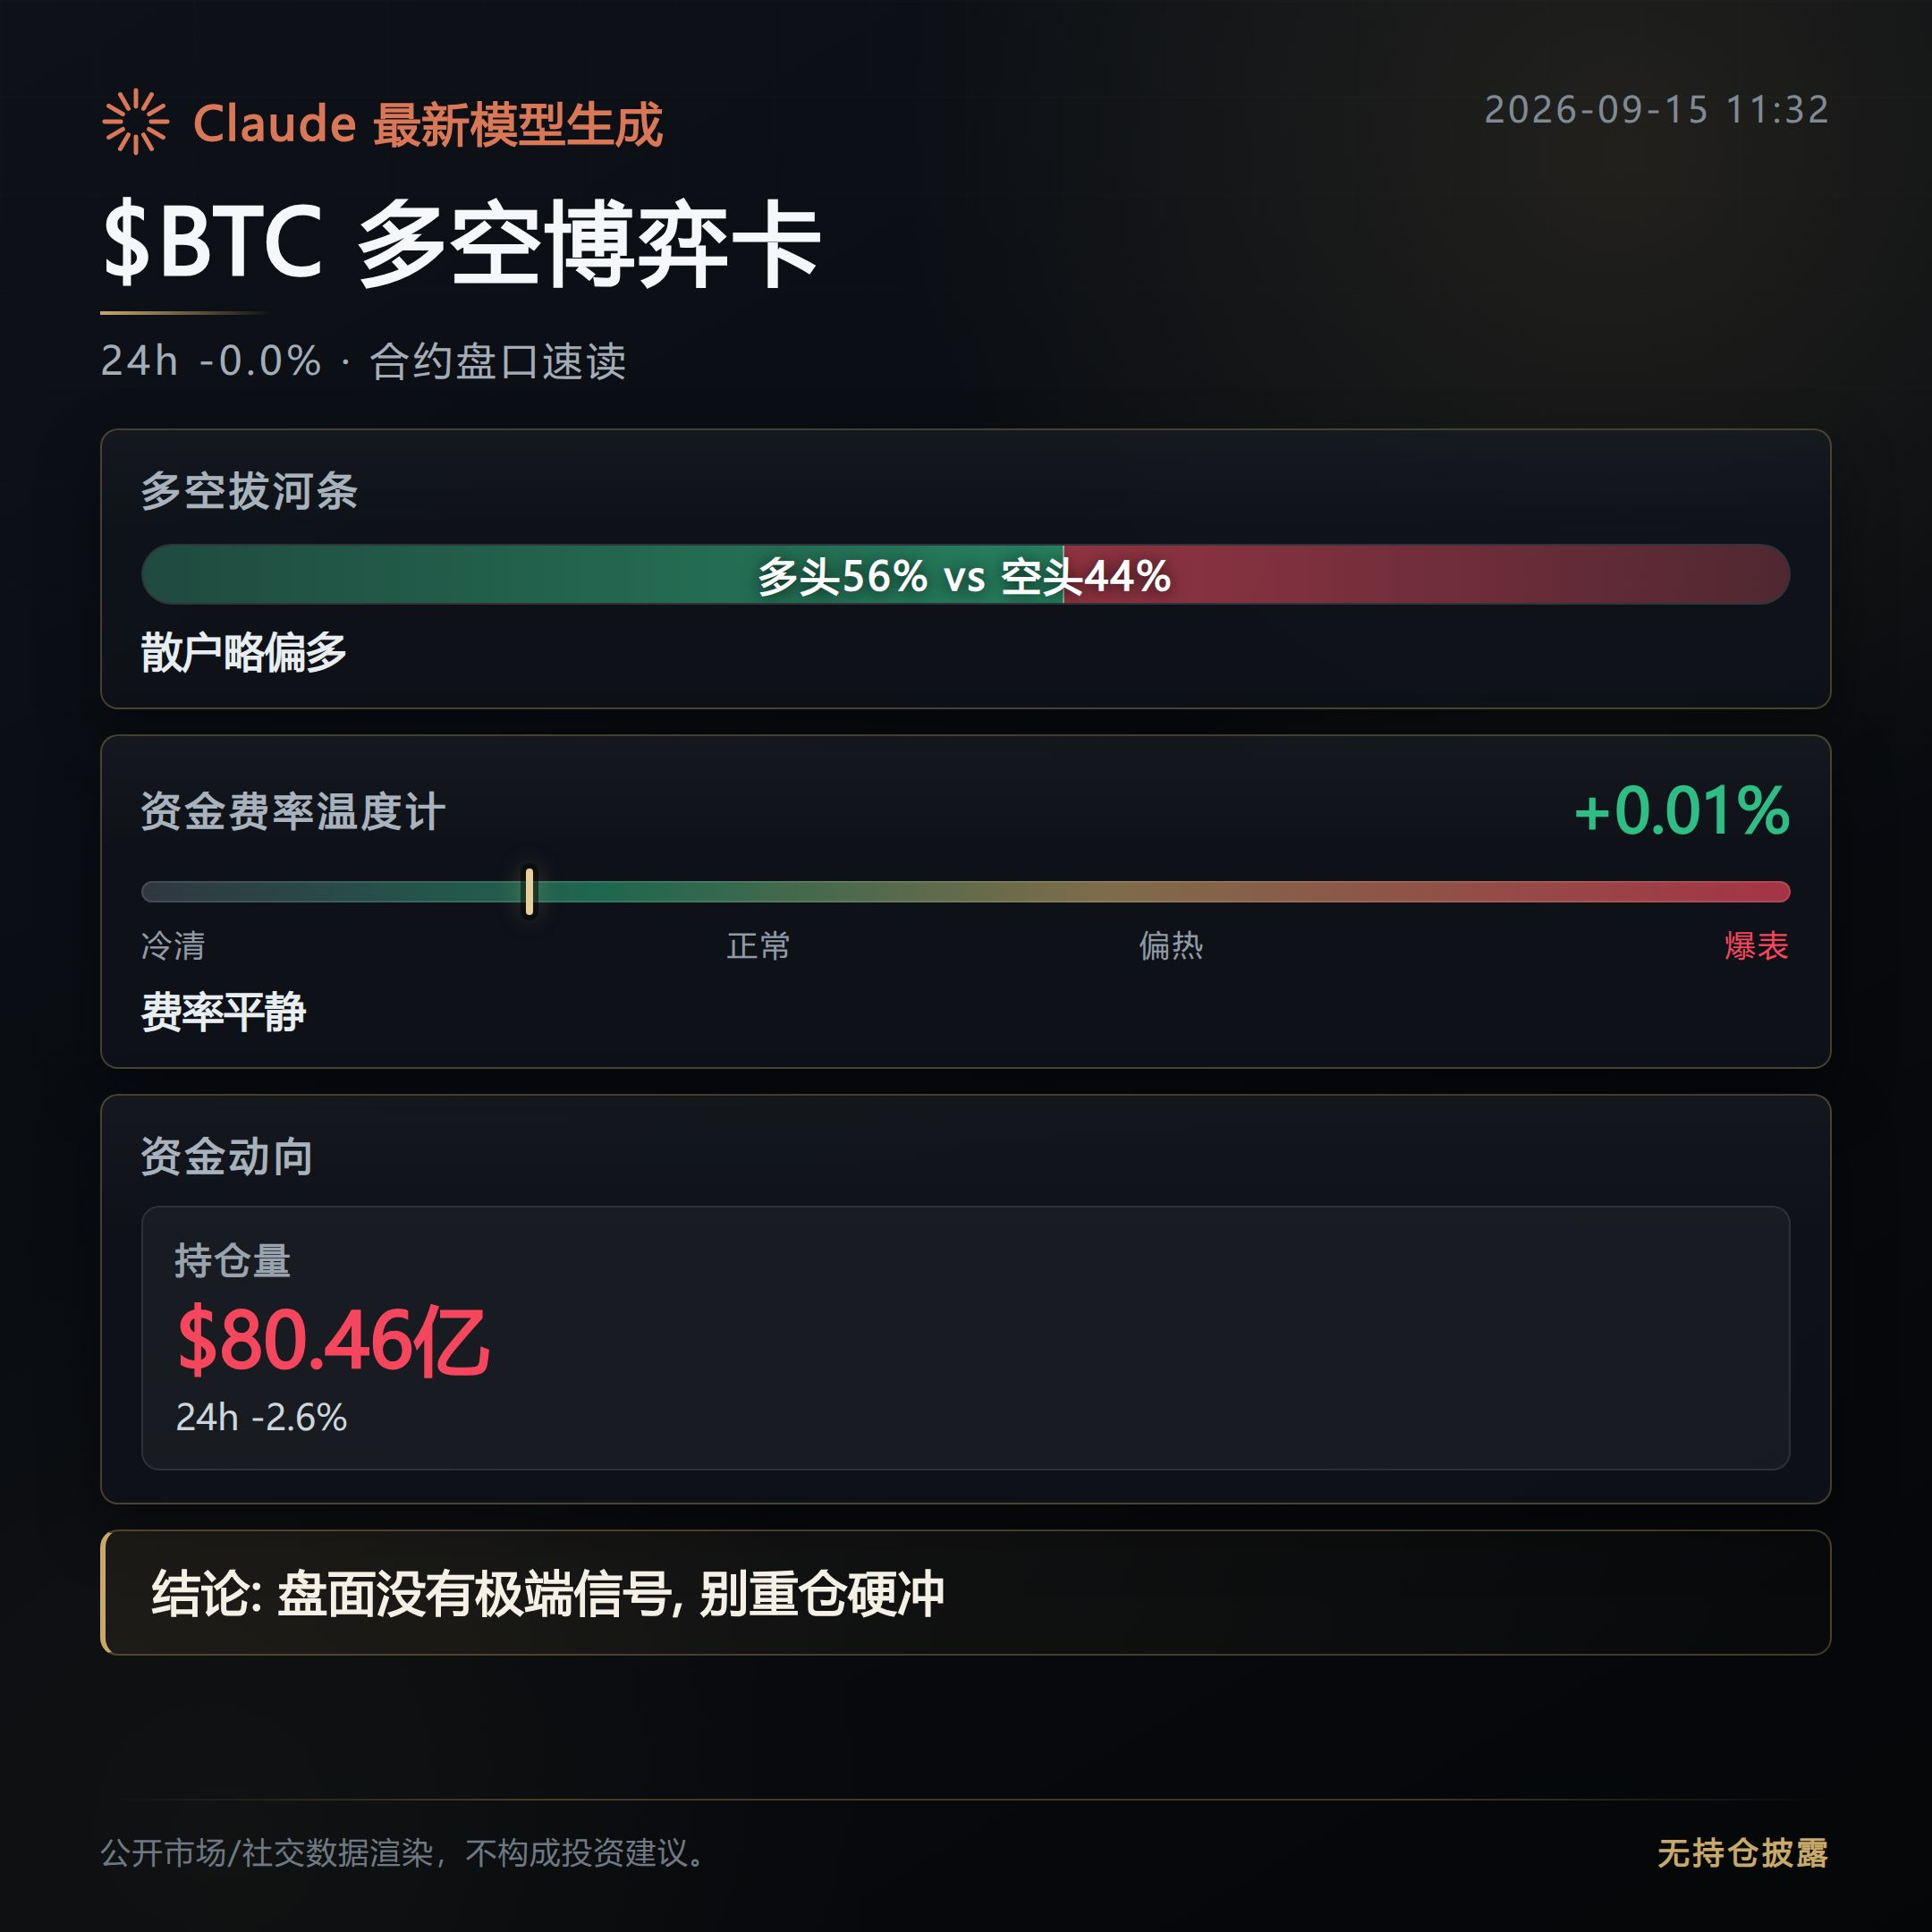
387
Log in to explore more content
Join global crypto users on Binance Square
⚡️ Get latest and useful information about crypto.
💬 Trusted by the world’s largest crypto exchange.
👍 Discover real insights from verified creators.
Email / Phone number
Trending Topics
FedRateWatch
1.2M views
5,700 Discussing
Share & Win Traffic Reward in our Trending Hashtag Campaign
✨Topic: FOMC September, What's The Fed's Next Move?
👉How to Join:
Publish a short post or article with hashtag #FedRateWatch
Create content based on the below angles:
- August core CPI rose 0.3% month-over-month, and the odds of a 25bp hike this week are now close to 90%. Do you anticipate a rate hike this week? Is it a one-off, or the start of a longer hiking cycle?
- If the hike lands, how does it play out for BTC, tech stocks, and gold? Bullish or bearish?
- How are you planning to trade next? Share your BTC, stocks or gold trade/holdings with our trade sharing widget.
⏰Campaign Period:
- 2026-09-15 11:00 - 2026-09-17 3:00 UTC
🎁Reward:
- Qualified posts that comply with the above guidelines and contain more than 100 words will be reviewed and may receive a random traffic boost of 500 to 3,000 views. You will receive a notification from your feed secretary if your post is selected.
- Get a chance to have your article featured on Binance Square Official
Need ideas for your post? Visit the topic page #FedRateWatch or the Square Guide on How to Post for Better Reach.
Binance Square Official
·599 Likes
·1.5M views
ZcashRises6%
10,372 views
225 Discussing
XRPSinks10%
5,871 views
142 Discussing