

合约涨跌AI预判-VIP-1009版
9.9k Posts

合约涨跌AI预判-VIP-1009版
 Square Verified+
Report
Block User
以咨询级视角拆解 AI 趋势、智能工具与商业应用,过滤信息噪音,提炼真正有价值的前沿洞察 | 任何帖子非财务投资建议 | Opinions are my own & Not Financial Advice

Creator Awards 2024

原创之星

Level 1 Creator
Open Trade
Occasional Trader
5.8 Years
0 Following
72.5K+ Followers
691.0K+ Liked
4 Badges
Posts
Portfolio
All
Quotes
Videos
Live
PINNED

Article
Xai, the Gaming Blockchain: Binance Square Resource LibraryThis article brings together various resources about the Xai project that I’ve shared on Binance Square, making them easy to find.
【Essential Reading on the Xai Project】
[Web3游戏的奇点时刻 - 从Final Form看游戏行业的进化以及XAI项目的未来!](https://www.binance.com/zh-CN/square/post/27354653163345)
[XAI推出Proof of Skill协议:开创游戏奖励新未来](https://www.binance.com/zh-CN/square/post/19969182919234)
[XAI联合Steam:Xai Play 和 Proof-of-Skill 将超过 40,000 款 Steam 游戏接入 Xai 区块链](https://www.binance.com/zh-CN/square/post/19968424843785)
[理解Xai质押生态赚XAI代币](https://www.binance.com/zh-CN/square/post/1091562723626)
[理解 Xai质押机制和生态发展](https://www.binance.com/zh-CN/square/post/6610107486218)
Xai, the Gaming Blockchain: Binance Square Resource Library
This article brings together various resources about the Xai project that I’ve shared on Binance Square, making them easy to find.
【Essential Reading on the Xai Project】
Web3游戏的奇点时刻 - 从Final Form看游戏行业的进化以及XAI项目的未来!
XAI推出Proof of Skill协议:开创游戏奖励新未来
XAI联合Steam:Xai Play 和 Proof-of-Skill 将超过 40,000 款 Steam 游戏接入 Xai 区块链
理解Xai质押生态赚XAI代币
理解 Xai质押机制和生态发展
【Essential Reading on the Xai Project】
Web3游戏的奇点时刻 - 从Final Form看游戏行业的进化以及XAI项目的未来!
XAI推出Proof of Skill协议:开创游戏奖励新未来
XAI联合Steam:Xai Play 和 Proof-of-Skill 将超过 40,000 款 Steam 游戏接入 Xai 区块链
理解Xai质押生态赚XAI代币
理解 Xai质押机制和生态发展
134
35
235
56.2k
Today’s hot tokens—just these few.
All of the top three are up more than 32%, with open interest surging in tandem. Capital is clearly clustering in high-volatility coins.
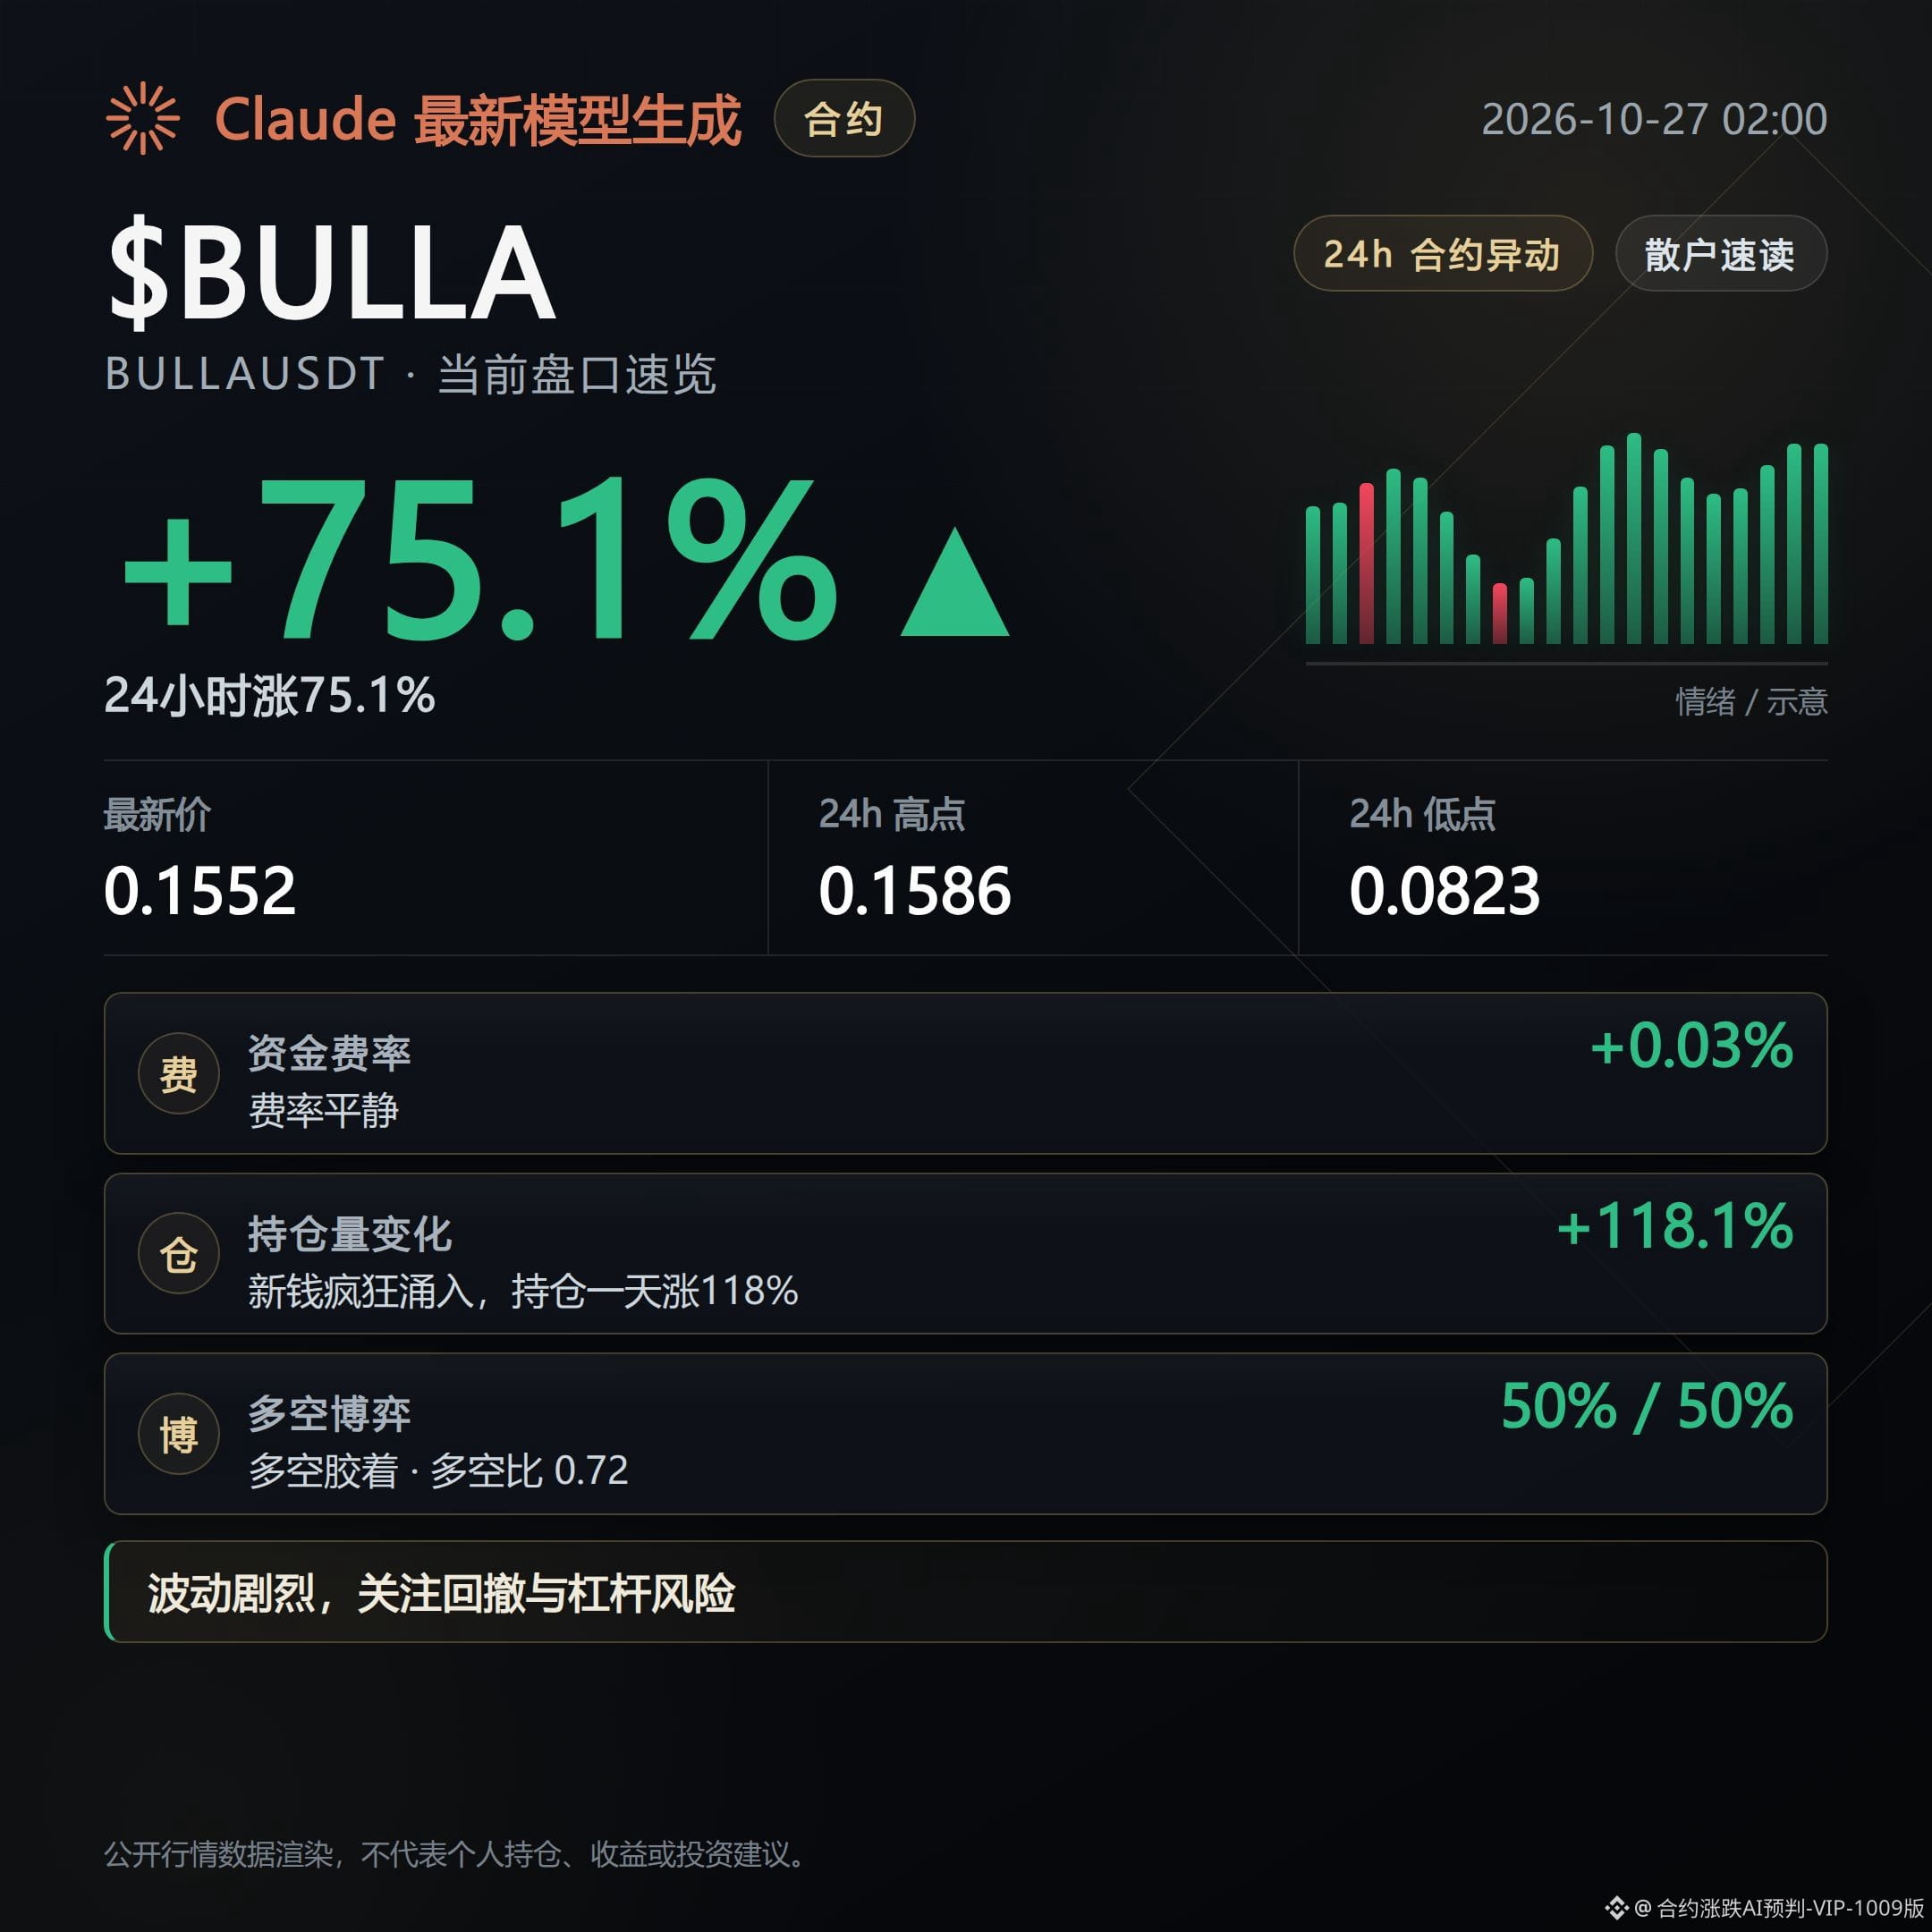
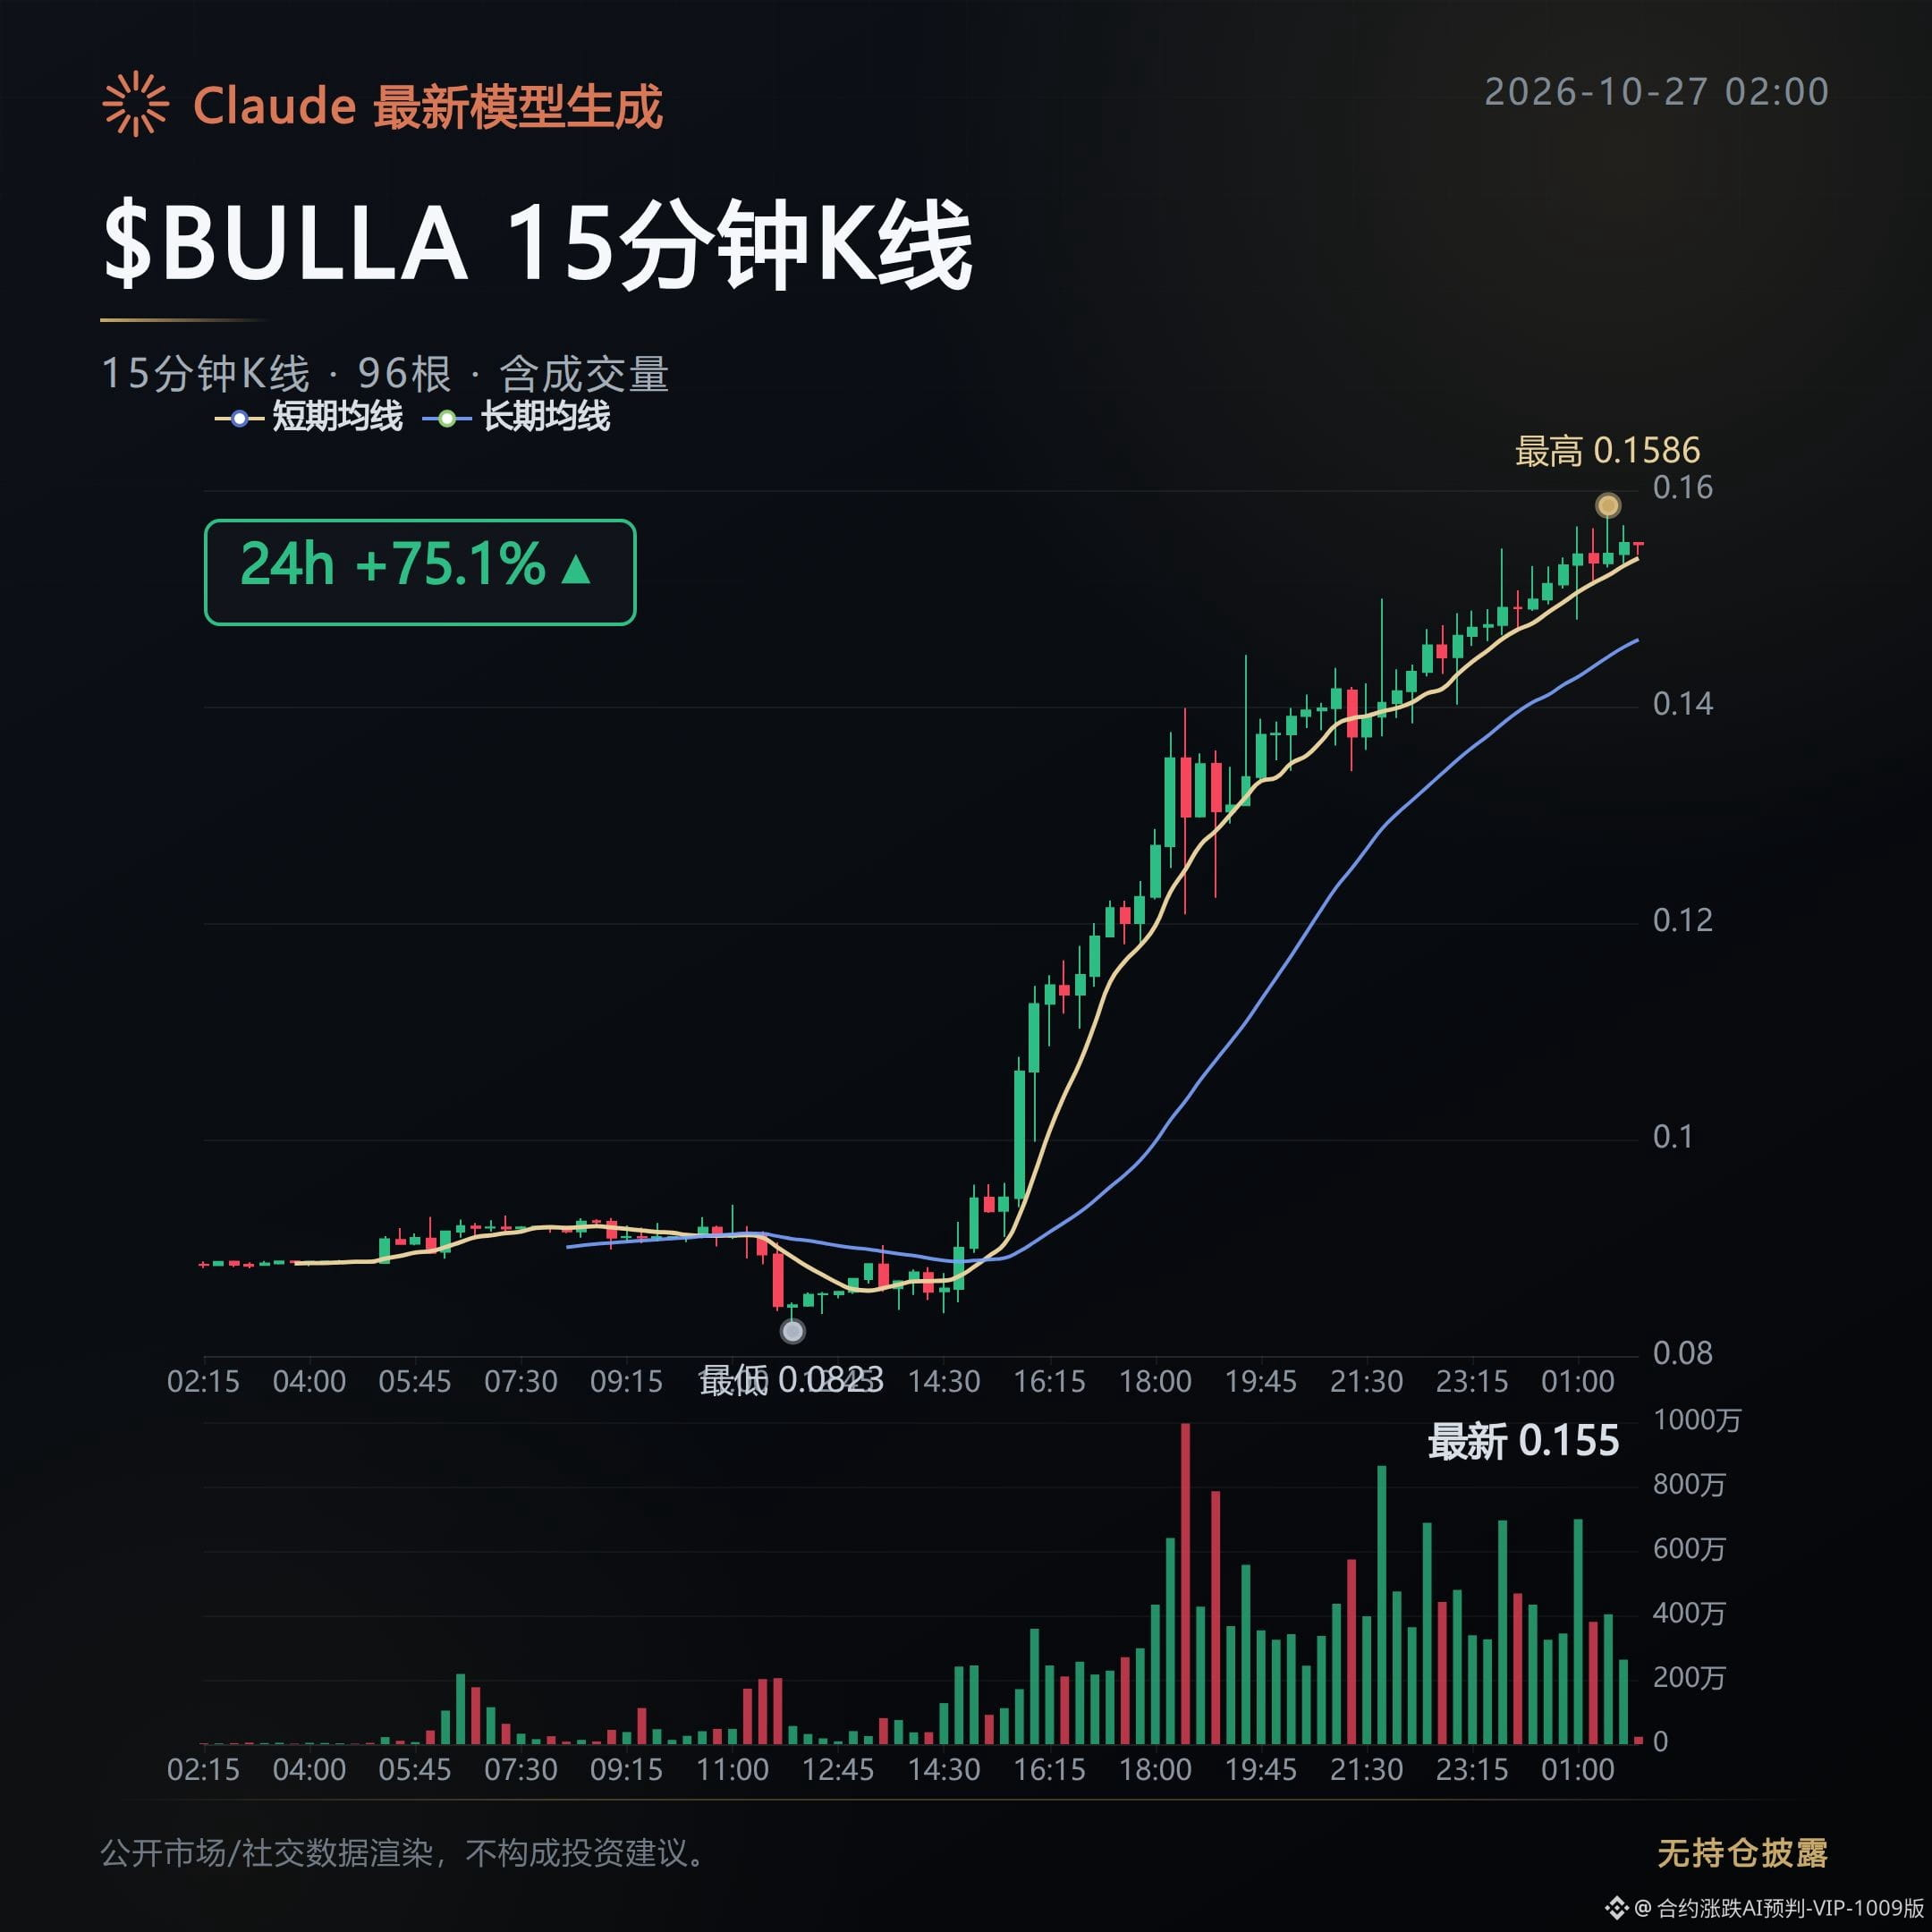
$BULLA is up 75.1%, currently at 0.15516, and nearing its 24-hour high of 0.15858.
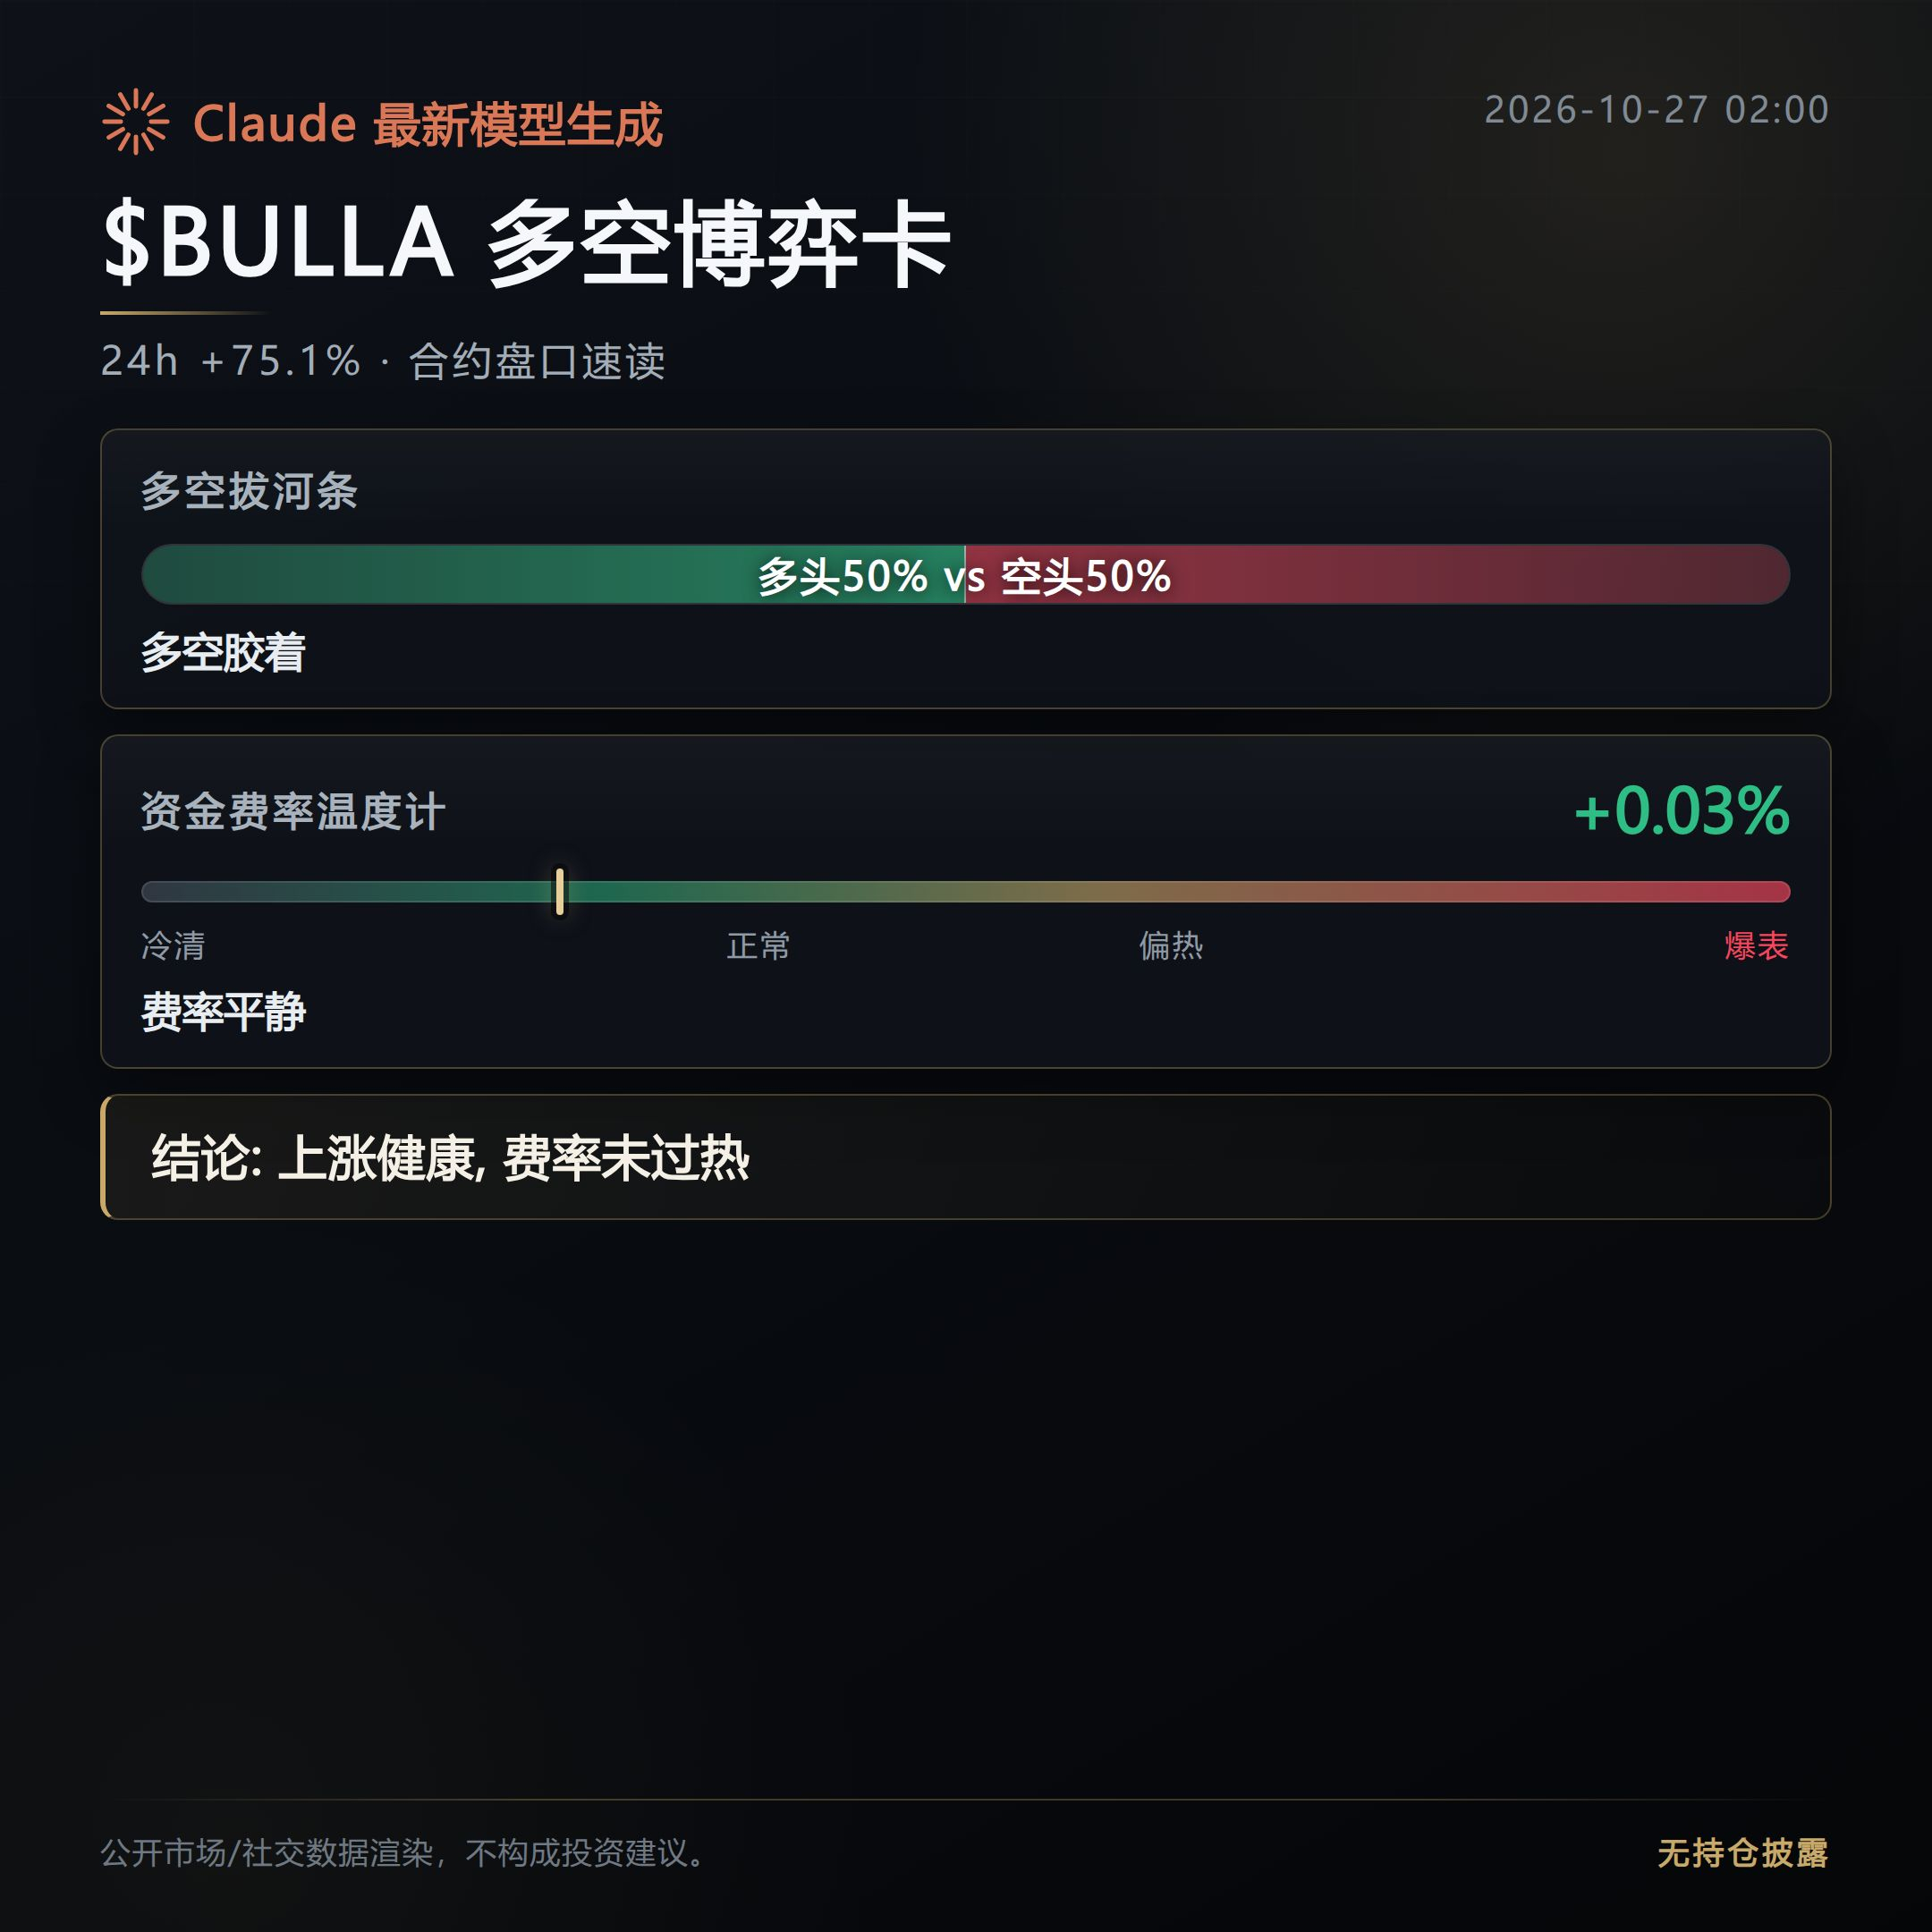
Open interest surged 118.1%. Aggressive buyers have a slight edge, while short accounts actually outnumber long accounts. This isn’t a low-volume spike.
$DOOD is up 38.4%, with $388 million in trading volume and open interest up 89.2%.
The funding rate has fallen to -0.242%. Shorts are still paying to hold their positions, and the longer this structure persists, the more likely a move becomes.
Aggressive buyers have a slight edge, but the current price is still noticeably below its 24-hour high.
$AIN is up 32.6%, with open interest up 47.6%, but aggressive buying and selling are nearly balanced.
The number of bullish accounts is almost twice that of bearish accounts, showing that interest has picked up, but buying support has yet to take a clear lead.
EWZ, meanwhile, is down 25.3%, even as open interest rose 103.2%. Bullish accounts outnumber bearish accounts by 2.58 to 1—a stark divergence between price and positioning.
Ranks 4 through 10 are TAG, up 24.4%; CHIP, up 22.4%; ARIA, up 18.6%; LIGHT, up 17.9%; BEAT, up 17.6%; BEAMX, up 16.1%; and PARTI, up 14.2%.
Overall, volume is concentrated in a handful of coins, and the bigger the gains, the more pronounced the positioning conflicts.
For signs of follow-through, watch whether BULLA can hold its highs and when DOOD’s extreme negative funding rate begins to ease.
$BULLA $DOOD $AIN
#合约市场 #Market Radar
Created with assistance from Claude Fable 5. For market information only; not investment advice.
Today’s hot tokens—just these few.
All of the top three are up more than 32%, with open interest surging in tandem. Capital is clearly clustering in high-volatility coins.
$BULLA is up 75.1%, currently at 0.15516, and nearing its 24-hour high of 0.15858.
Open interest surged 118.1%. Aggressive buyers have a slight edge, while short accounts actually outnumber long accounts. This isn’t a low-volume spike.
$DOOD is up 38.4%, with $388 million in trading volume and open interest up 89.2%.
The funding rate has fallen to -0.242%. Shorts are still paying to hold their positions, and the longer this structure persists, the more likely a move becomes.
Aggressive buyers have a slight edge, but the current price is still noticeably below its 24-hour high.
$AIN is up 32.6%, with open interest up 47.6%, but aggressive buying and selling are nearly balanced.
The number of bullish accounts is almost twice that of bearish accounts, showing that interest has picked up, but buying support has yet to take a clear lead.
EWZ, meanwhile, is down 25.3%, even as open interest rose 103.2%. Bullish accounts outnumber bearish accounts by 2.58 to 1—a stark divergence between price and positioning.
Ranks 4 through 10 are TAG, up 24.4%; CHIP, up 22.4%; ARIA, up 18.6%; LIGHT, up 17.9%; BEAT, up 17.6%; BEAMX, up 16.1%; and PARTI, up 14.2%.
Overall, volume is concentrated in a handful of coins, and the bigger the gains, the more pronounced the positioning conflicts.
For signs of follow-through, watch whether BULLA can hold its highs and when DOOD’s extreme negative funding rate begins to ease.
$BULLA $DOOD $AIN
#合约市场 #Market Radar
Created with assistance from Claude Fable 5. For market information only; not investment advice.
All of the top three are up more than 32%, with open interest surging in tandem. Capital is clearly clustering in high-volatility coins.
$BULLA is up 75.1%, currently at 0.15516, and nearing its 24-hour high of 0.15858.
Open interest surged 118.1%. Aggressive buyers have a slight edge, while short accounts actually outnumber long accounts. This isn’t a low-volume spike.
$DOOD is up 38.4%, with $388 million in trading volume and open interest up 89.2%.
The funding rate has fallen to -0.242%. Shorts are still paying to hold their positions, and the longer this structure persists, the more likely a move becomes.
Aggressive buyers have a slight edge, but the current price is still noticeably below its 24-hour high.
$AIN is up 32.6%, with open interest up 47.6%, but aggressive buying and selling are nearly balanced.
The number of bullish accounts is almost twice that of bearish accounts, showing that interest has picked up, but buying support has yet to take a clear lead.
EWZ, meanwhile, is down 25.3%, even as open interest rose 103.2%. Bullish accounts outnumber bearish accounts by 2.58 to 1—a stark divergence between price and positioning.
Ranks 4 through 10 are TAG, up 24.4%; CHIP, up 22.4%; ARIA, up 18.6%; LIGHT, up 17.9%; BEAT, up 17.6%; BEAMX, up 16.1%; and PARTI, up 14.2%.
Overall, volume is concentrated in a handful of coins, and the bigger the gains, the more pronounced the positioning conflicts.
For signs of follow-through, watch whether BULLA can hold its highs and when DOOD’s extreme negative funding rate begins to ease.
$BULLA $DOOD $AIN
#合约市场 #Market Radar
Created with assistance from Claude Fable 5. For market information only; not investment advice.
198
Derivatives Market Daily | 10/26: Long positions rise, but price fails to follow
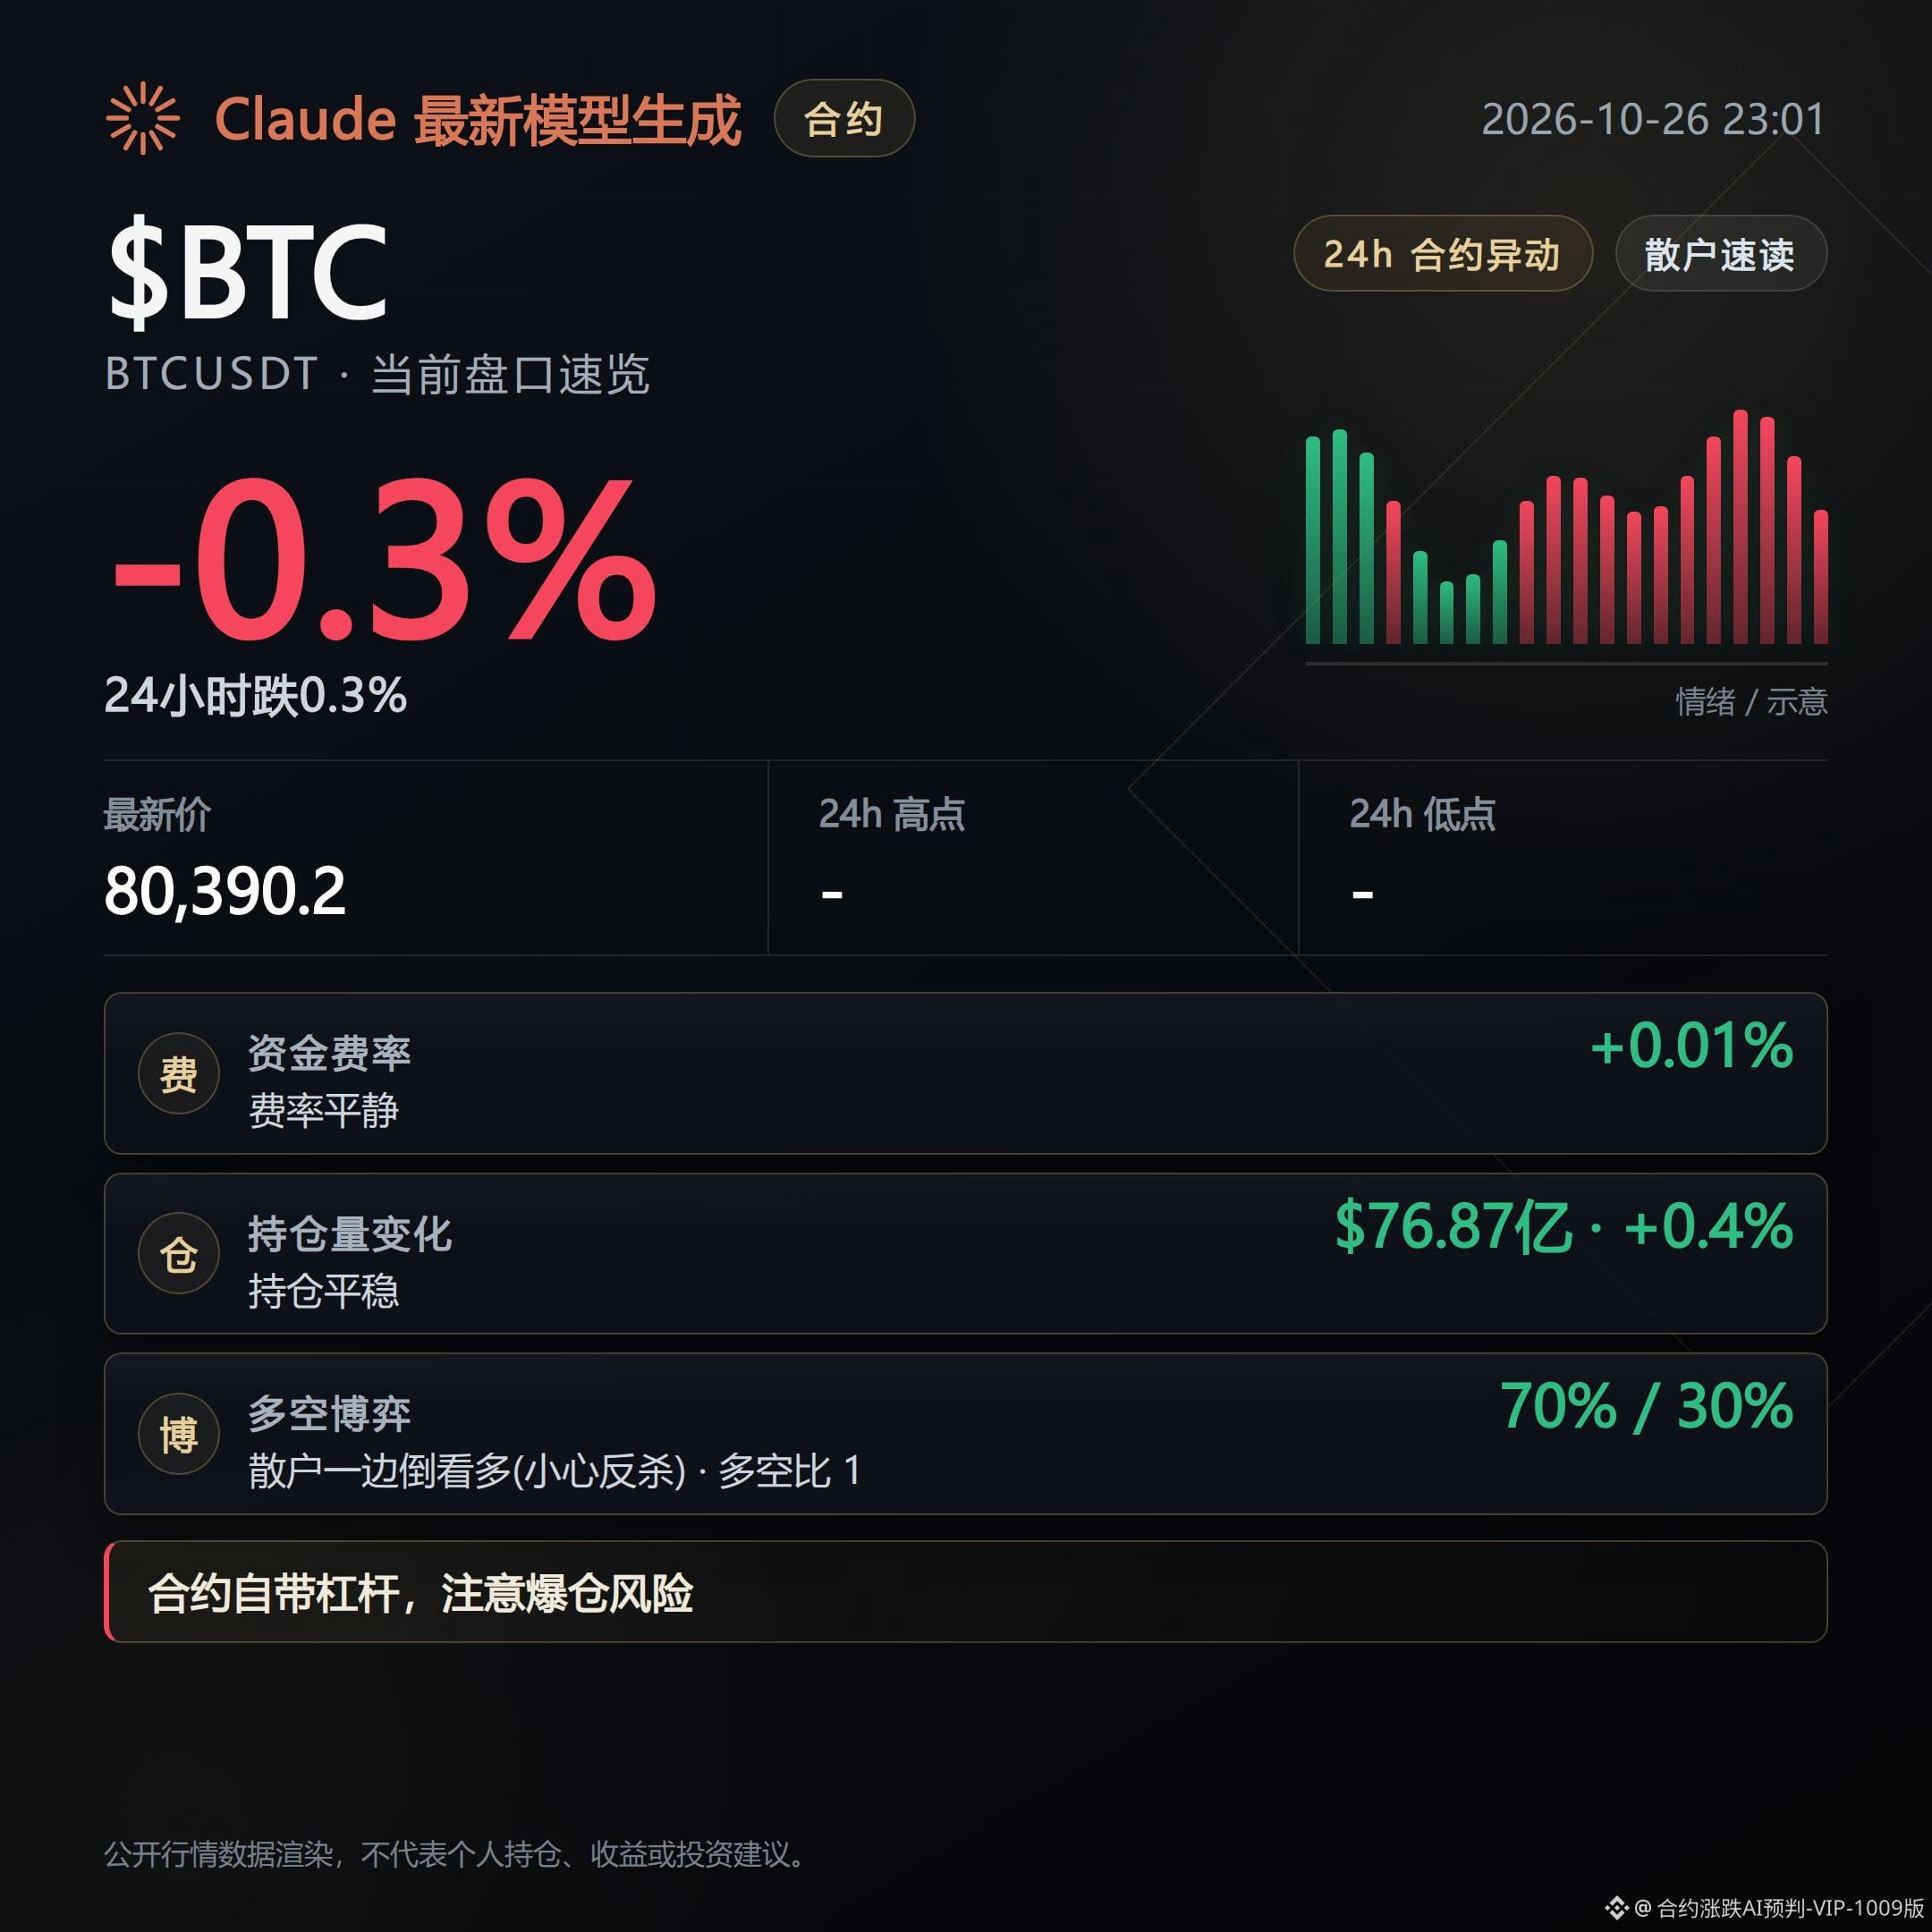
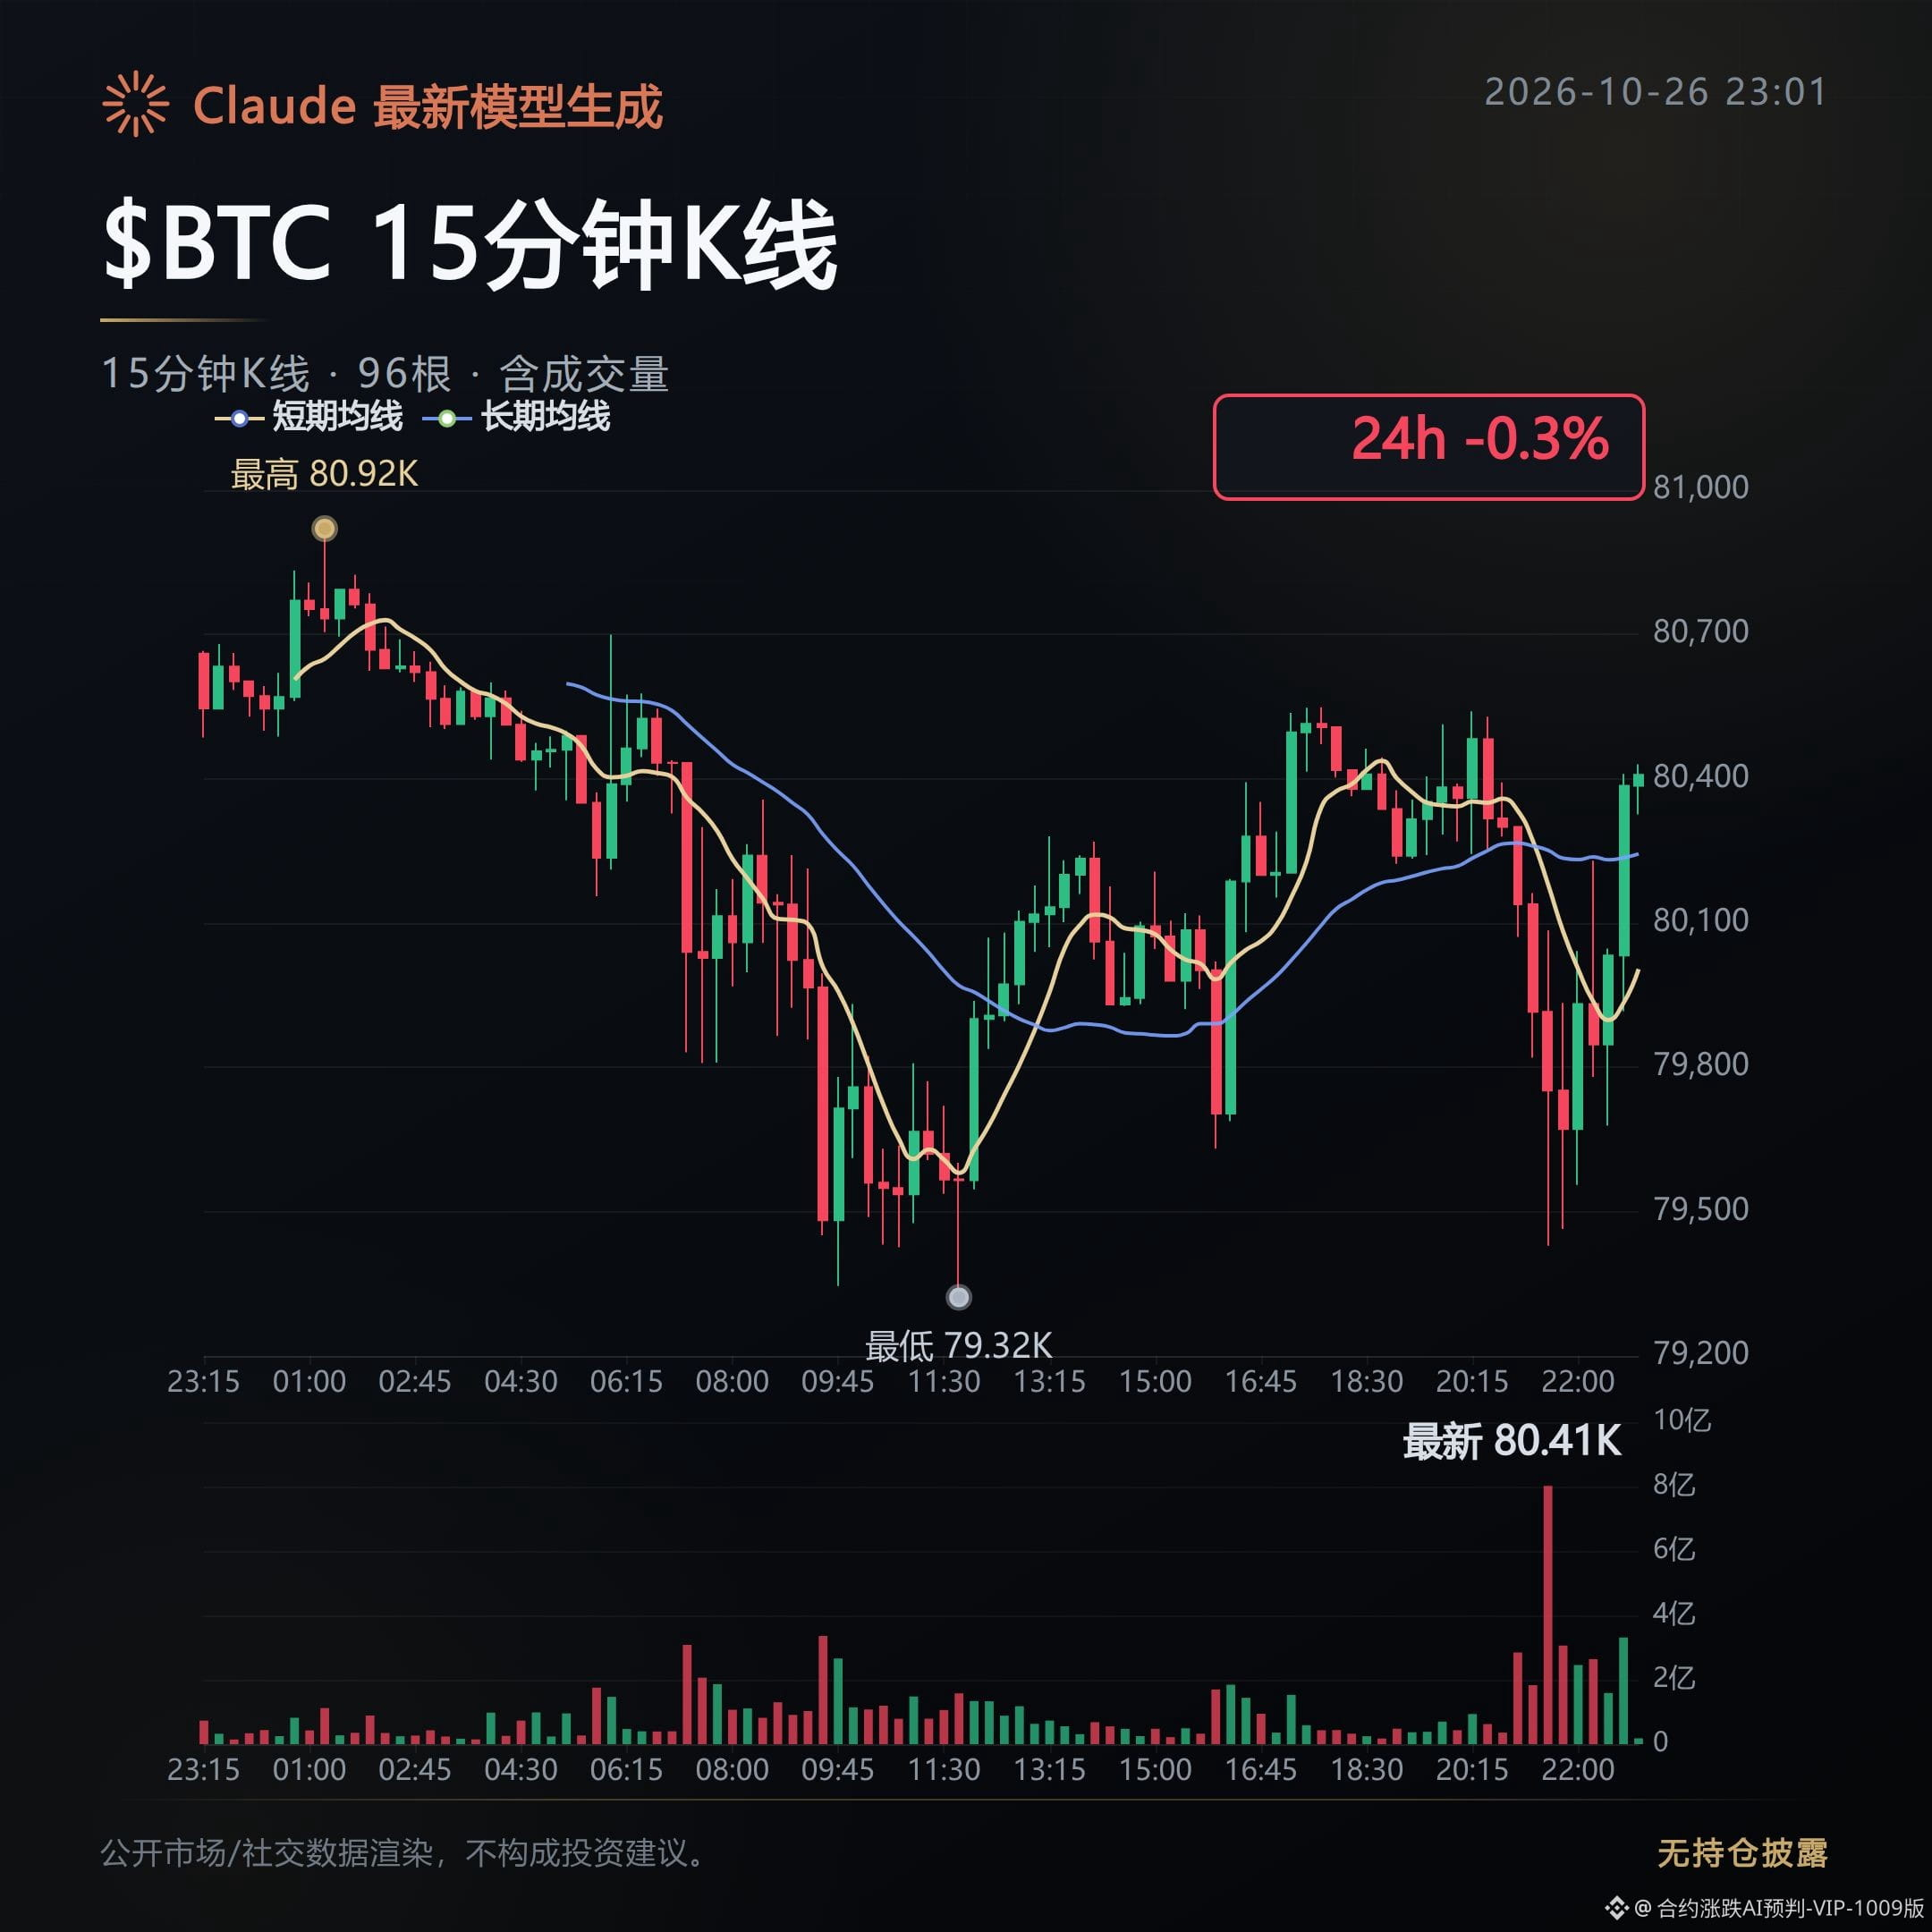
$BTC's mark price returned to $80,390, but was still down 0.28%, after briefly falling below $80,000.
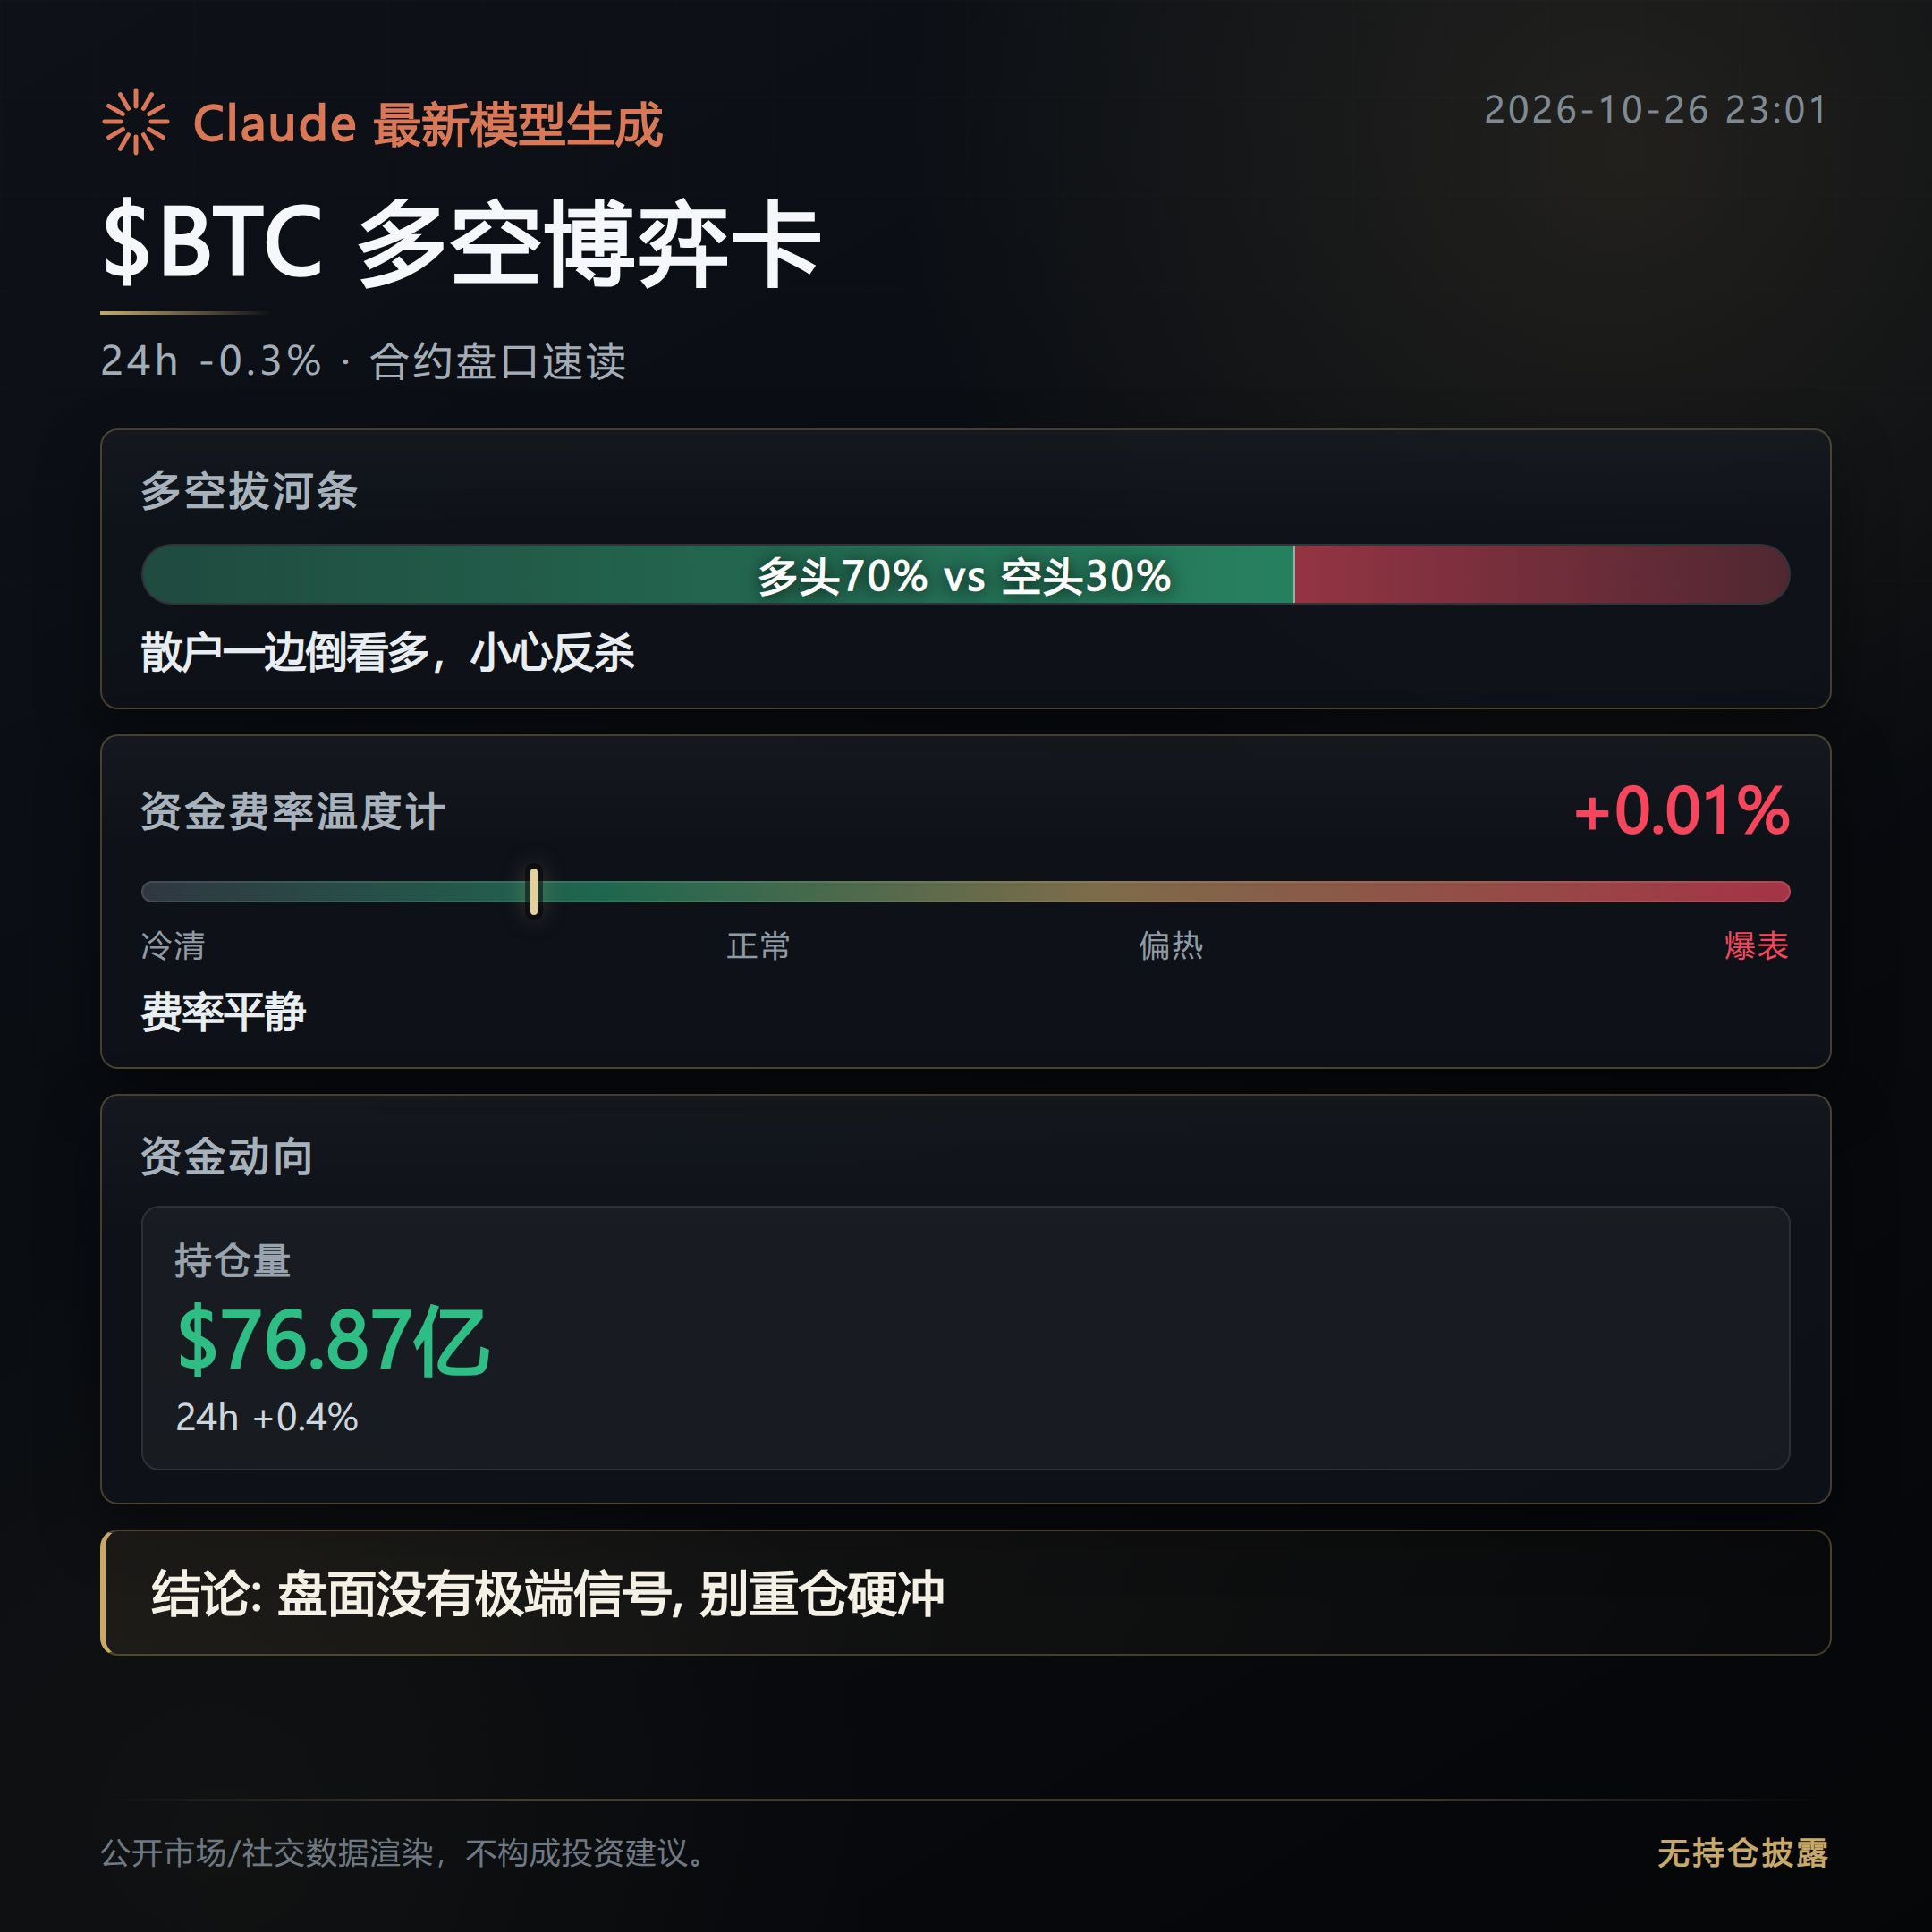
Notional open interest rose 0.4% to $7.687 billion, and the taker buy/sell ratio was 1.14, yet long accounts already made up 70% of the total.
Buyers are more active and positions are increasing, but the price has not strengthened in tandem, suggesting new long positions are being absorbed by selling pressure.
This crowded-positioning signal will ease only if the price holds firmly above $80,000 and the long-account share declines.
Funding rates for all major perpetual contracts were positive, with $BTC at 0.0094% and $SOL reaching 0.01%.
This means longs are still paying to hold their positions, while the Fear & Greed Index is only 50, offering no clear sentiment cushion.
The pressure from longs paying funding will ease only if rates fall back near zero while the price holds above $80,000.
The news is also mixed.
Strive bought $511 million worth of Bitcoin, while Strategy paused its purchases. Trump said the US would not strike Iran today, which may provide only a short-lived boost to risk appetite and does not confirm sustained capital inflows.
Expectations around the Fed's decision and the US midterm elections continue to weigh on pricing near $80,000. Any reversal in geopolitical statements would immediately erase the short-term boost.
The current threshold is clear: above $80,000, watch whether positions translate into price gains; below it, beware of a concentrated unwind of the 70% long positioning.
Generated with assistance from Claude Fable 5; for market information only and not investment advice.
Derivatives Market Daily | 10/26: Long positions rise, but price fails to follow
$BTC 's mark price returned to $80,390, but was still down 0.28%, after briefly falling below $80,000.
Notional open interest rose 0.4% to $7.687 billion, and the taker buy/sell ratio was 1.14, yet long accounts already made up 70% of the total.
Buyers are more active and positions are increasing, but the price has not strengthened in tandem, suggesting new long positions are being absorbed by selling pressure.
This crowded-positioning signal will ease only if the price holds firmly above $80,000 and the long-account share declines.
Funding rates for all major perpetual contracts were positive, with $BTC at 0.0094% and $SOL reaching 0.01%.
This means longs are still paying to hold their positions, while the Fear & Greed Index is only 50, offering no clear sentiment cushion.
The pressure from longs paying funding will ease only if rates fall back near zero while the price holds above $80,000.
The news is also mixed.
Strive bought $511 million worth of Bitcoin, while Strategy paused its purchases. Trump said the US would not strike Iran today, which may provide only a short-lived boost to risk appetite and does not confirm sustained capital inflows.
Expectations around the Fed's decision and the US midterm elections continue to weigh on pricing near $80,000. Any reversal in geopolitical statements would immediately erase the short-term boost.
The current threshold is clear: above $80,000, watch whether positions translate into price gains; below it, beware of a concentrated unwind of the 70% long positioning.
Generated with assistance from Claude Fable 5; for market information only and not investment advice.
$BTC 's mark price returned to $80,390, but was still down 0.28%, after briefly falling below $80,000.
Notional open interest rose 0.4% to $7.687 billion, and the taker buy/sell ratio was 1.14, yet long accounts already made up 70% of the total.
Buyers are more active and positions are increasing, but the price has not strengthened in tandem, suggesting new long positions are being absorbed by selling pressure.
This crowded-positioning signal will ease only if the price holds firmly above $80,000 and the long-account share declines.
Funding rates for all major perpetual contracts were positive, with $BTC at 0.0094% and $SOL reaching 0.01%.
This means longs are still paying to hold their positions, while the Fear & Greed Index is only 50, offering no clear sentiment cushion.
The pressure from longs paying funding will ease only if rates fall back near zero while the price holds above $80,000.
The news is also mixed.
Strive bought $511 million worth of Bitcoin, while Strategy paused its purchases. Trump said the US would not strike Iran today, which may provide only a short-lived boost to risk appetite and does not confirm sustained capital inflows.
Expectations around the Fed's decision and the US midterm elections continue to weigh on pricing near $80,000. Any reversal in geopolitical statements would immediately erase the short-term boost.
The current threshold is clear: above $80,000, watch whether positions translate into price gains; below it, beware of a concentrated unwind of the 70% long positioning.
Generated with assistance from Claude Fable 5; for market information only and not investment advice.
161
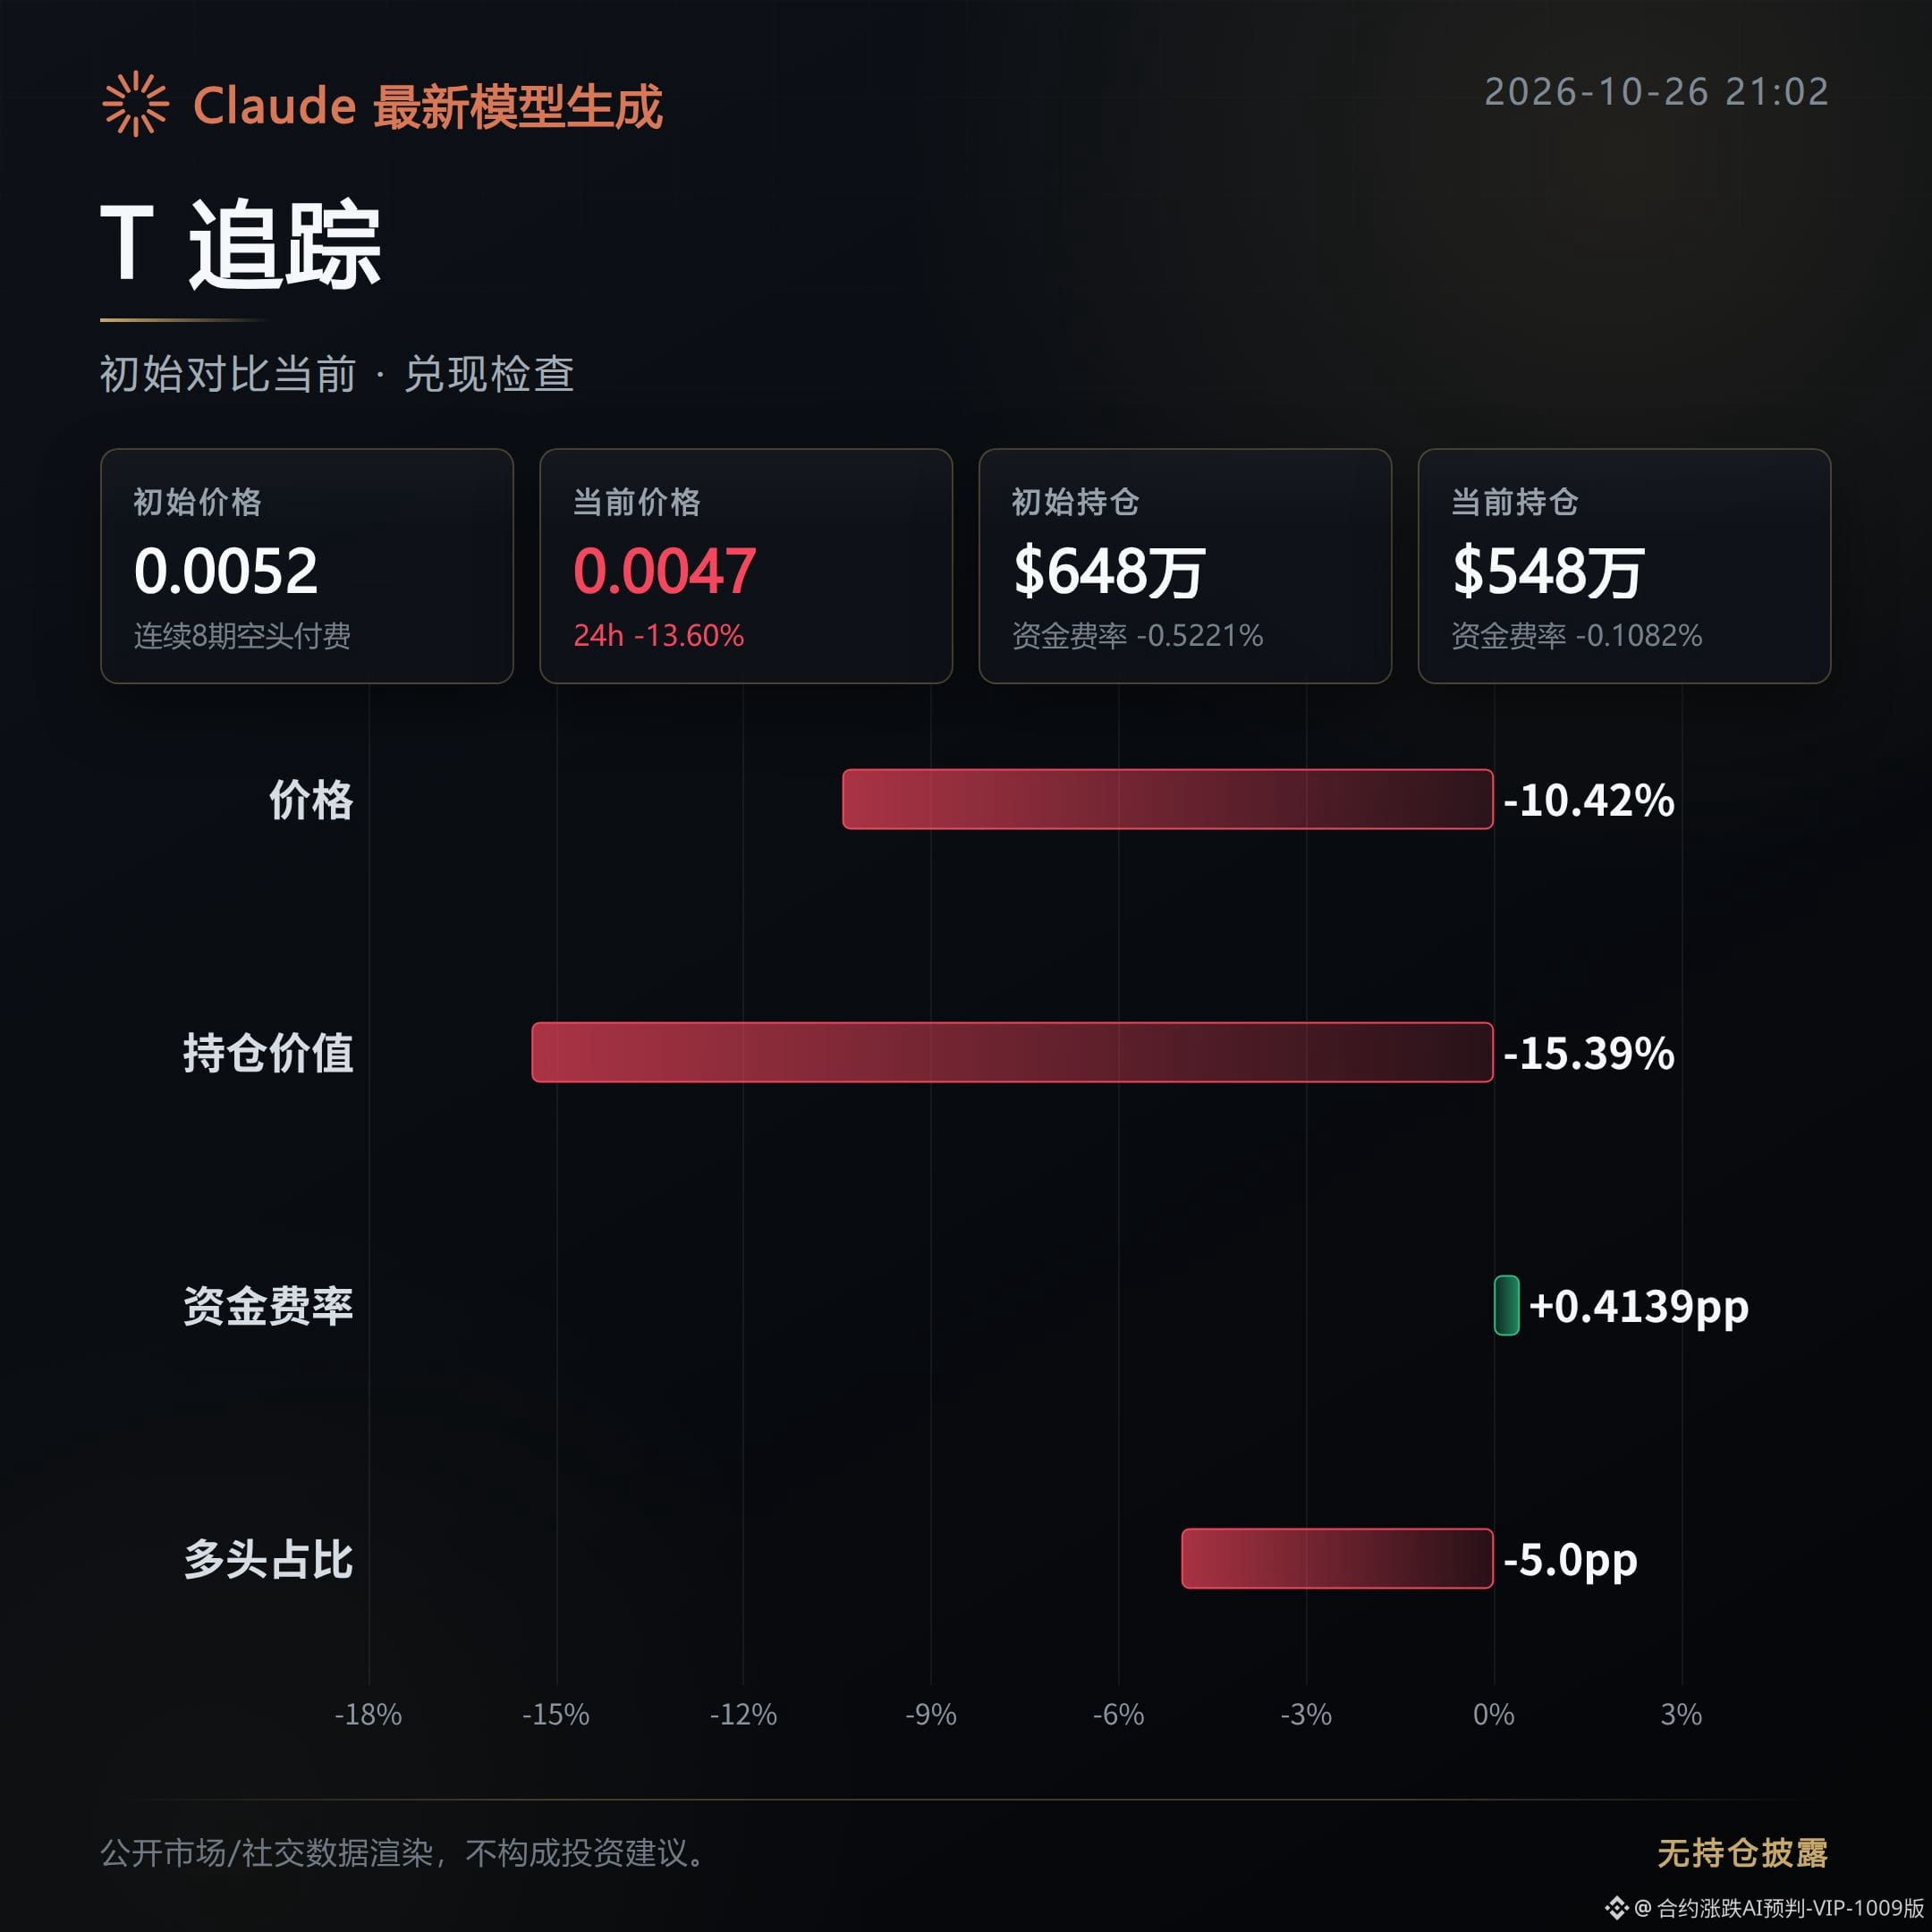
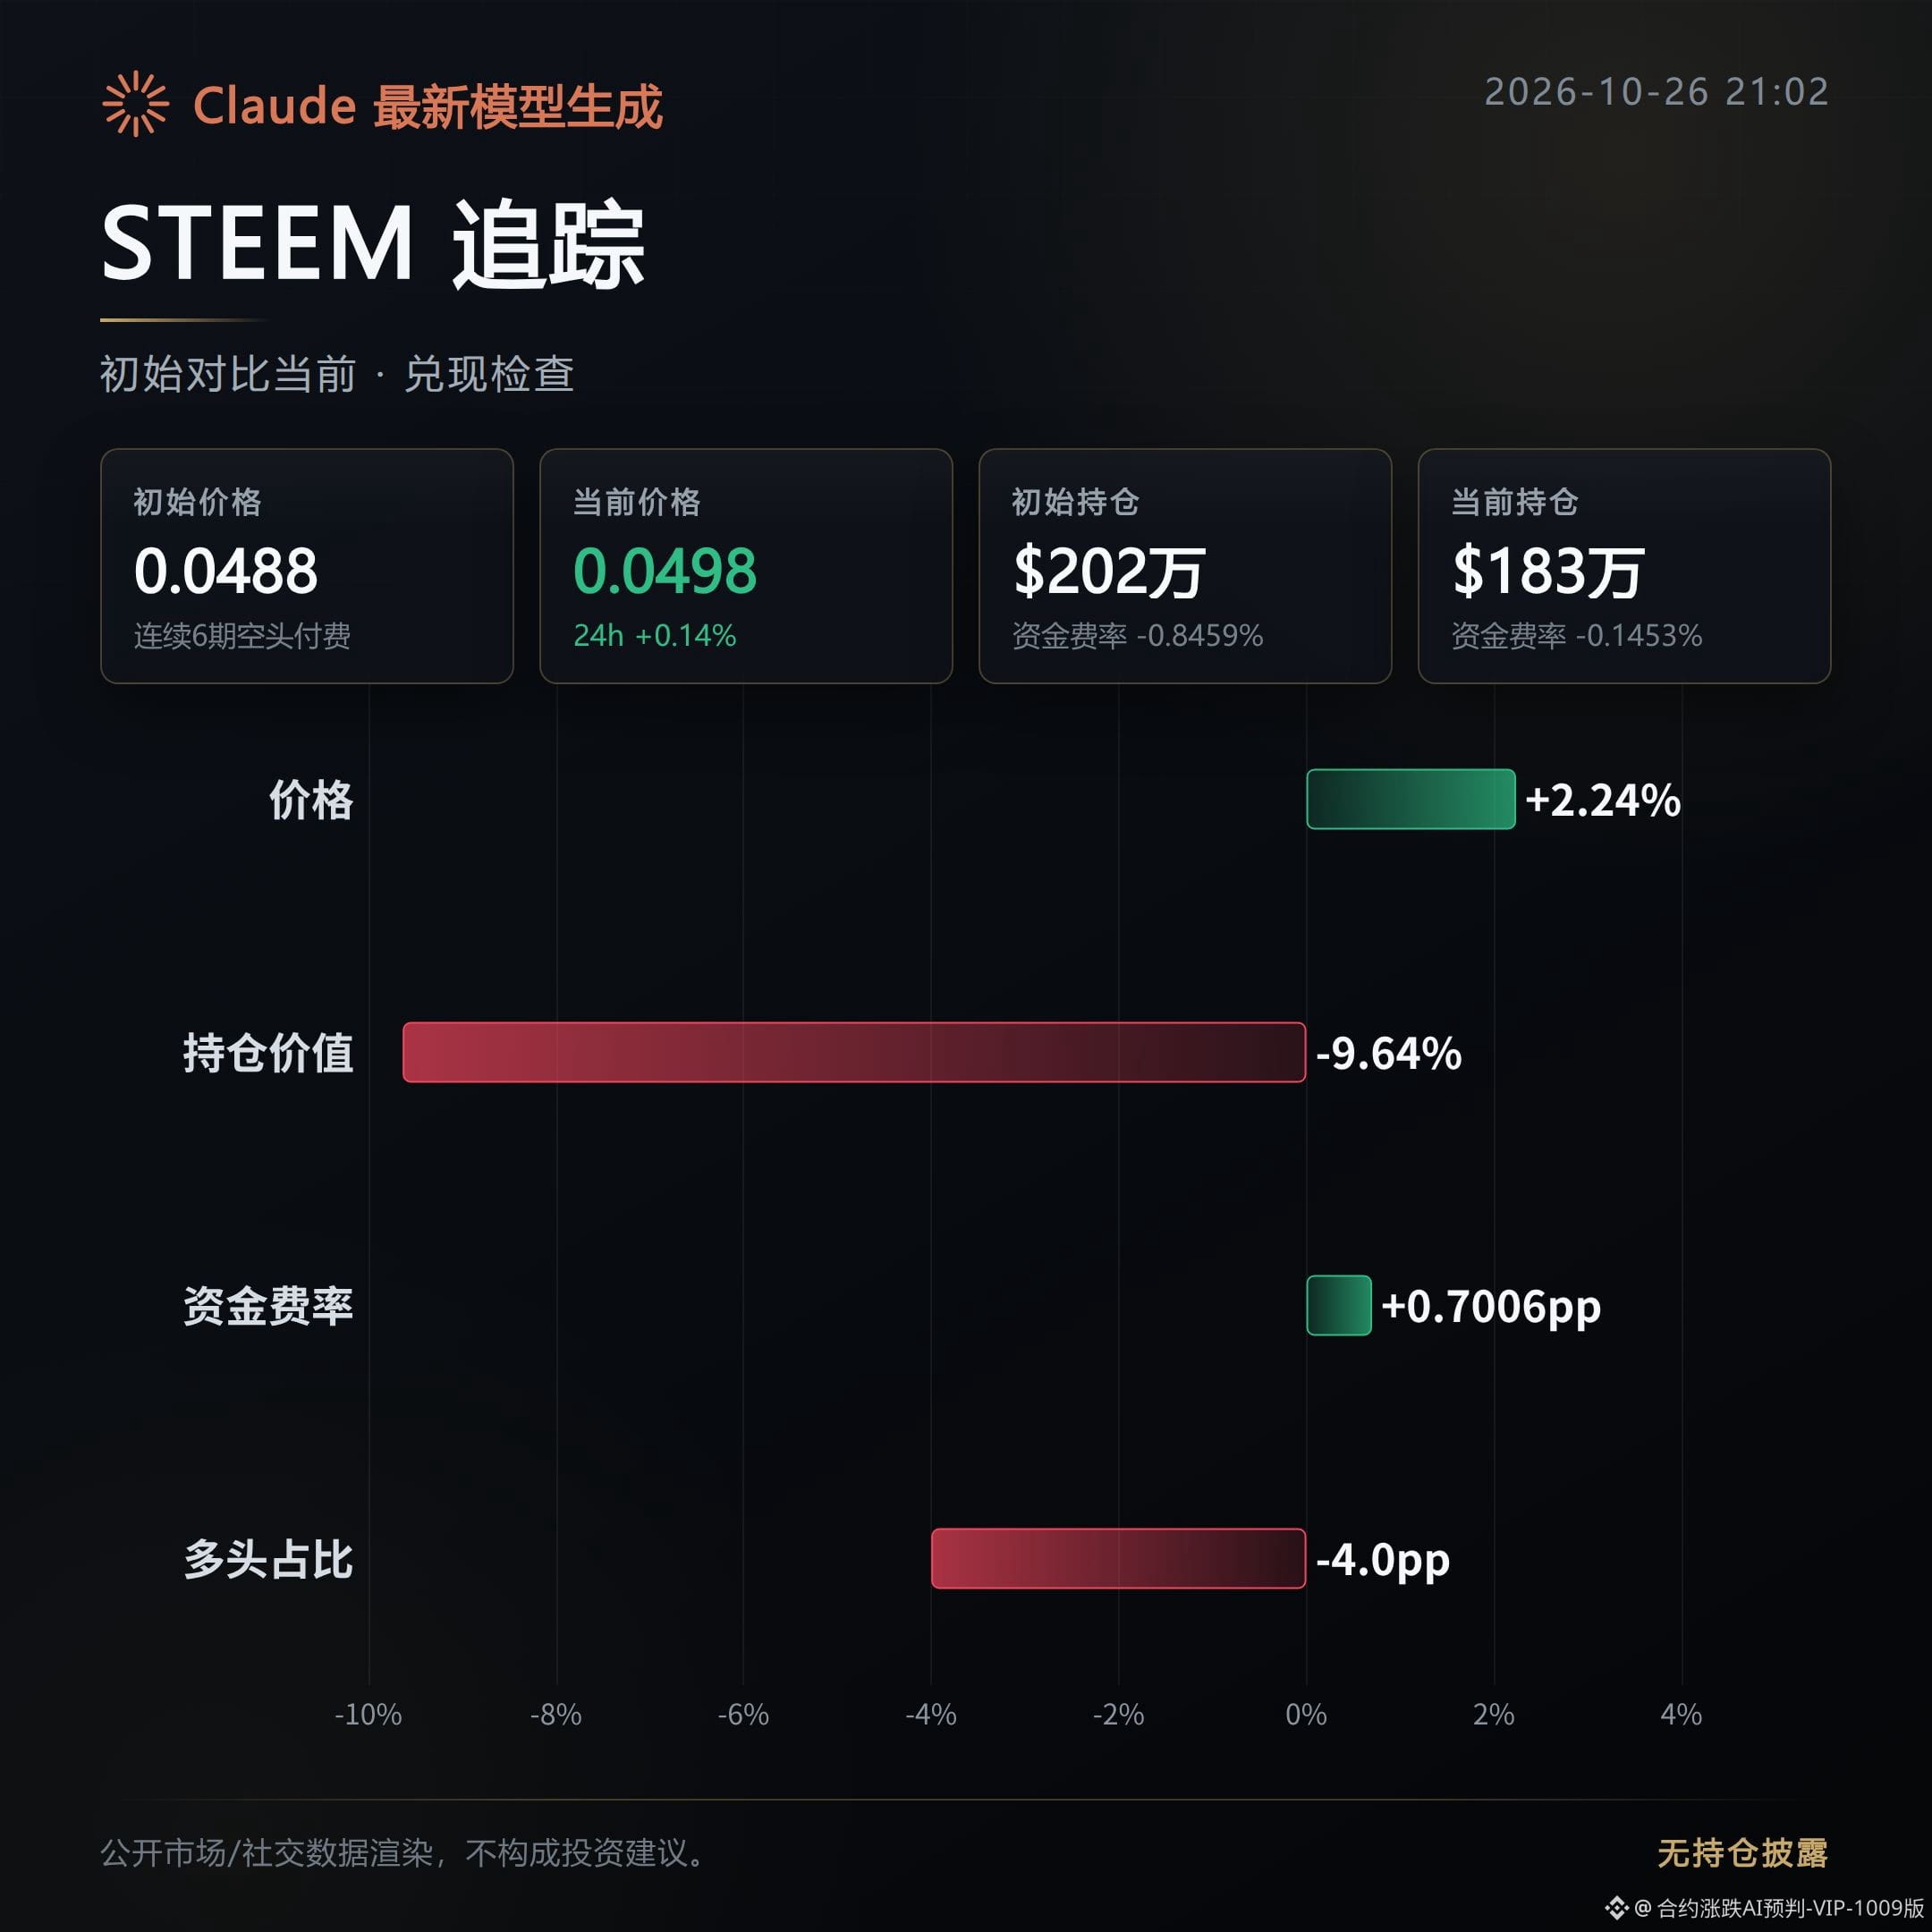
Review of the morning bearish call and high-level distribution warning issued about 13 hours ago: Of the three contracts, T and REZ weakened as expected, while STEEM remains caught in a tug-of-war, with no sustained one-way decline so far.
Positions are unwinding.
T: Played out. The morning bearish move has materialized.
Since the initial post, the price has continued to weaken, down 10.42%, directly confirming the pullback.
Open interest fell by 15.39% at the same time, while the active buy/sell indicator dropped to 0.80. This suggests that support is thin and positions in the market are also being closed.
STEEM: Still caught in a tug-of-war; the morning bearish call has not yet led to a one-way decline.
Since the initial post, the price has instead risen 2.24%, directly weakening the original outlook.
However, open interest fell by 9.64% and the active buy/sell indicator declined by 0.09, suggesting that additional buying support remains limited during the rebound.
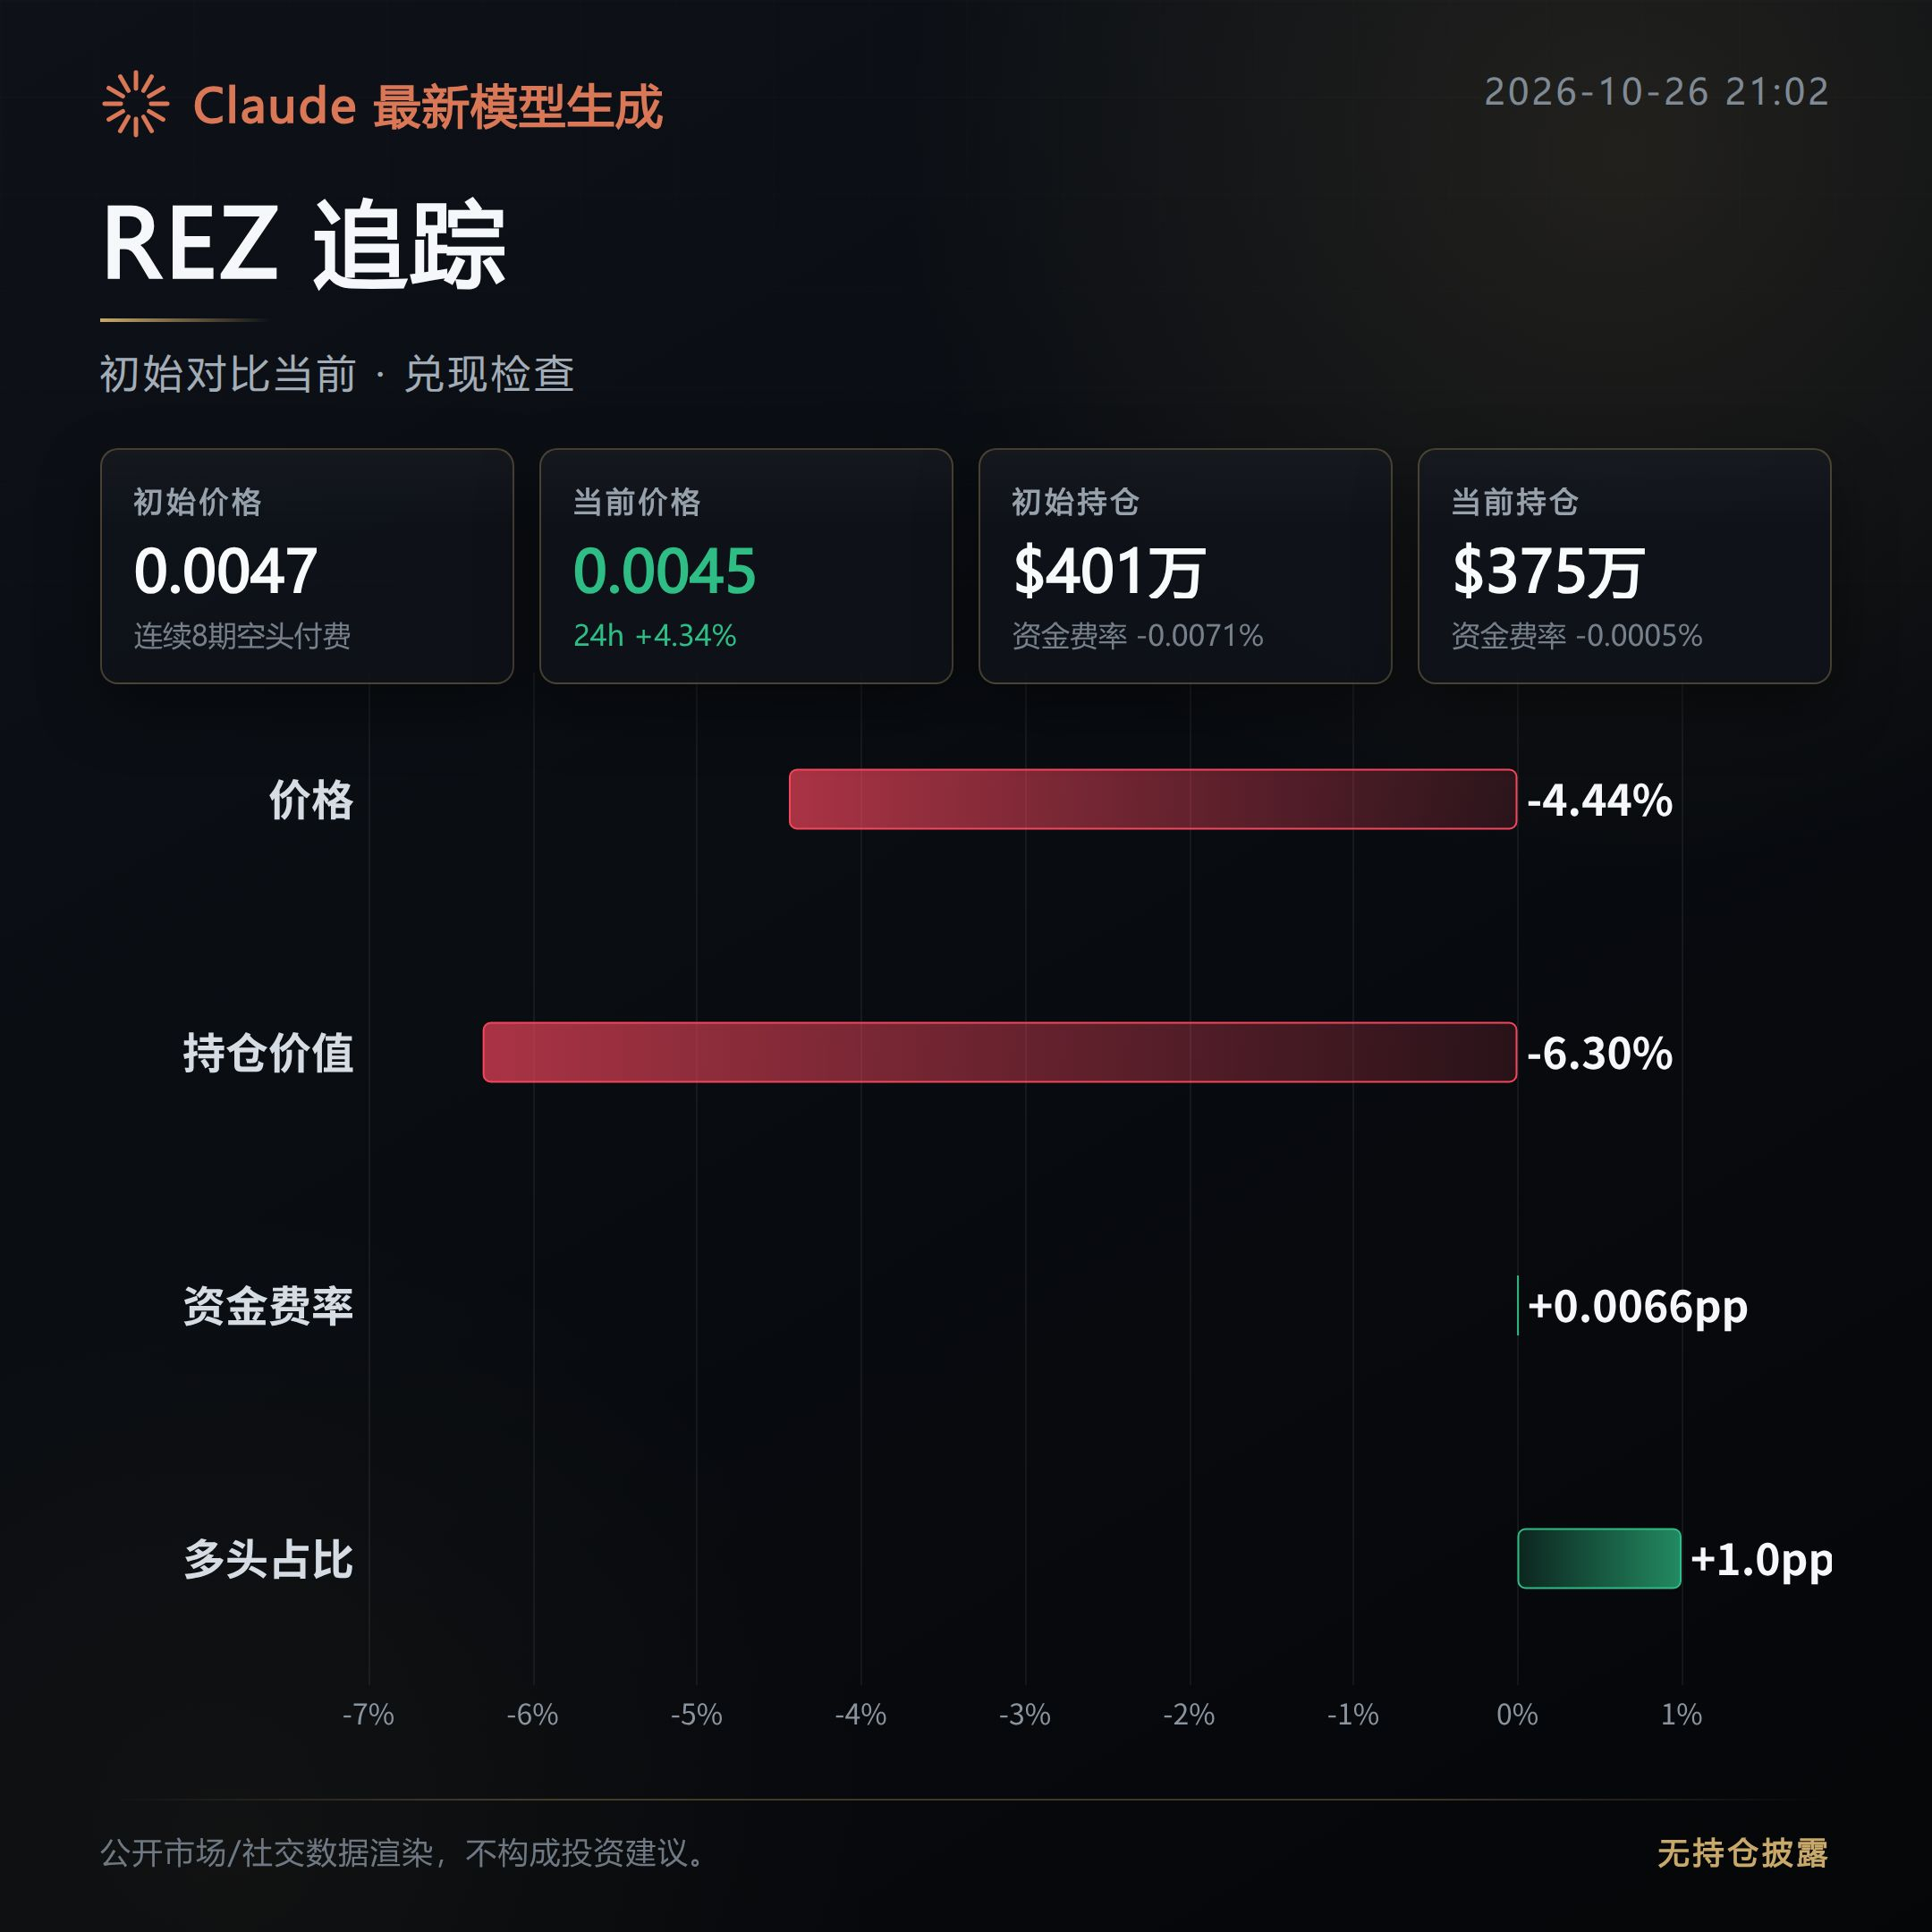
REZ: Played out. Price action since the initial post has continued in line with the morning bearish outlook.
The price weakened by 4.44%, while trading volume increased by 53%, so the pullback was not simply a low-volume fluctuation.
The active buy/sell indicator fell by 0.44 to 0.85, indicating a clear retreat in aggressive buying, with pressure still present in the order book.
Next, keep an eye on whether volume continues to confirm price weakness, and whether active buying recovers.
If T and REZ stabilize in price and open interest starts to rise again, or STEEM sees volume pick up during its rebound and active buying recover, this high-level distribution warning should be reassessed.
#T #STEEM #REZ #Contract Review
Compiled with the assistance of Claude Fable 5 using contract data. For informational purposes only; please verify independently.
Review of the morning bearish call and high-level distribution warning issued about 13 hours ago: Of the three contracts, T and REZ weakened as expected, while STEEM remains caught in a tug-of-war, with no sustained one-way decline so far.
Positions are unwinding.
T: Played out. The morning bearish move has materialized.
Since the initial post, the price has continued to weaken, down 10.42%, directly confirming the pullback.
Open interest fell by 15.39% at the same time, while the active buy/sell indicator dropped to 0.80. This suggests that support is thin and positions in the market are also being closed.
STEEM: Still caught in a tug-of-war; the morning bearish call has not yet led to a one-way decline.
Since the initial post, the price has instead risen 2.24%, directly weakening the original outlook.
However, open interest fell by 9.64% and the active buy/sell indicator declined by 0.09, suggesting that additional buying support remains limited during the rebound.
REZ: Played out. Price action since the initial post has continued in line with the morning bearish outlook.
The price weakened by 4.44%, while trading volume increased by 53%, so the pullback was not simply a low-volume fluctuation.
The active buy/sell indicator fell by 0.44 to 0.85, indicating a clear retreat in aggressive buying, with pressure still present in the order book.
Next, keep an eye on whether volume continues to confirm price weakness, and whether active buying recovers.
If T and REZ stabilize in price and open interest starts to rise again, or STEEM sees volume pick up during its rebound and active buying recover, this high-level distribution warning should be reassessed.
#T #STEEM #REZ #Contract Review
Compiled with the assistance of Claude Fable 5 using contract data. For informational purposes only; please verify independently.
Positions are unwinding.
T: Played out. The morning bearish move has materialized.
Since the initial post, the price has continued to weaken, down 10.42%, directly confirming the pullback.
Open interest fell by 15.39% at the same time, while the active buy/sell indicator dropped to 0.80. This suggests that support is thin and positions in the market are also being closed.
STEEM: Still caught in a tug-of-war; the morning bearish call has not yet led to a one-way decline.
Since the initial post, the price has instead risen 2.24%, directly weakening the original outlook.
However, open interest fell by 9.64% and the active buy/sell indicator declined by 0.09, suggesting that additional buying support remains limited during the rebound.
REZ: Played out. Price action since the initial post has continued in line with the morning bearish outlook.
The price weakened by 4.44%, while trading volume increased by 53%, so the pullback was not simply a low-volume fluctuation.
The active buy/sell indicator fell by 0.44 to 0.85, indicating a clear retreat in aggressive buying, with pressure still present in the order book.
Next, keep an eye on whether volume continues to confirm price weakness, and whether active buying recovers.
If T and REZ stabilize in price and open interest starts to rise again, or STEEM sees volume pick up during its rebound and active buying recover, this high-level distribution warning should be reassessed.
#T #STEEM #REZ #Contract Review
Compiled with the assistance of Claude Fable 5 using contract data. For informational purposes only; please verify independently.
190
Review of the morning bullish/pump watch from about 13 hours ago: Of 3 assets, 0 have played out so far and 3 have failed to hold—the results have all been choppy.
Recap of the initial watch: accumulation is underway.
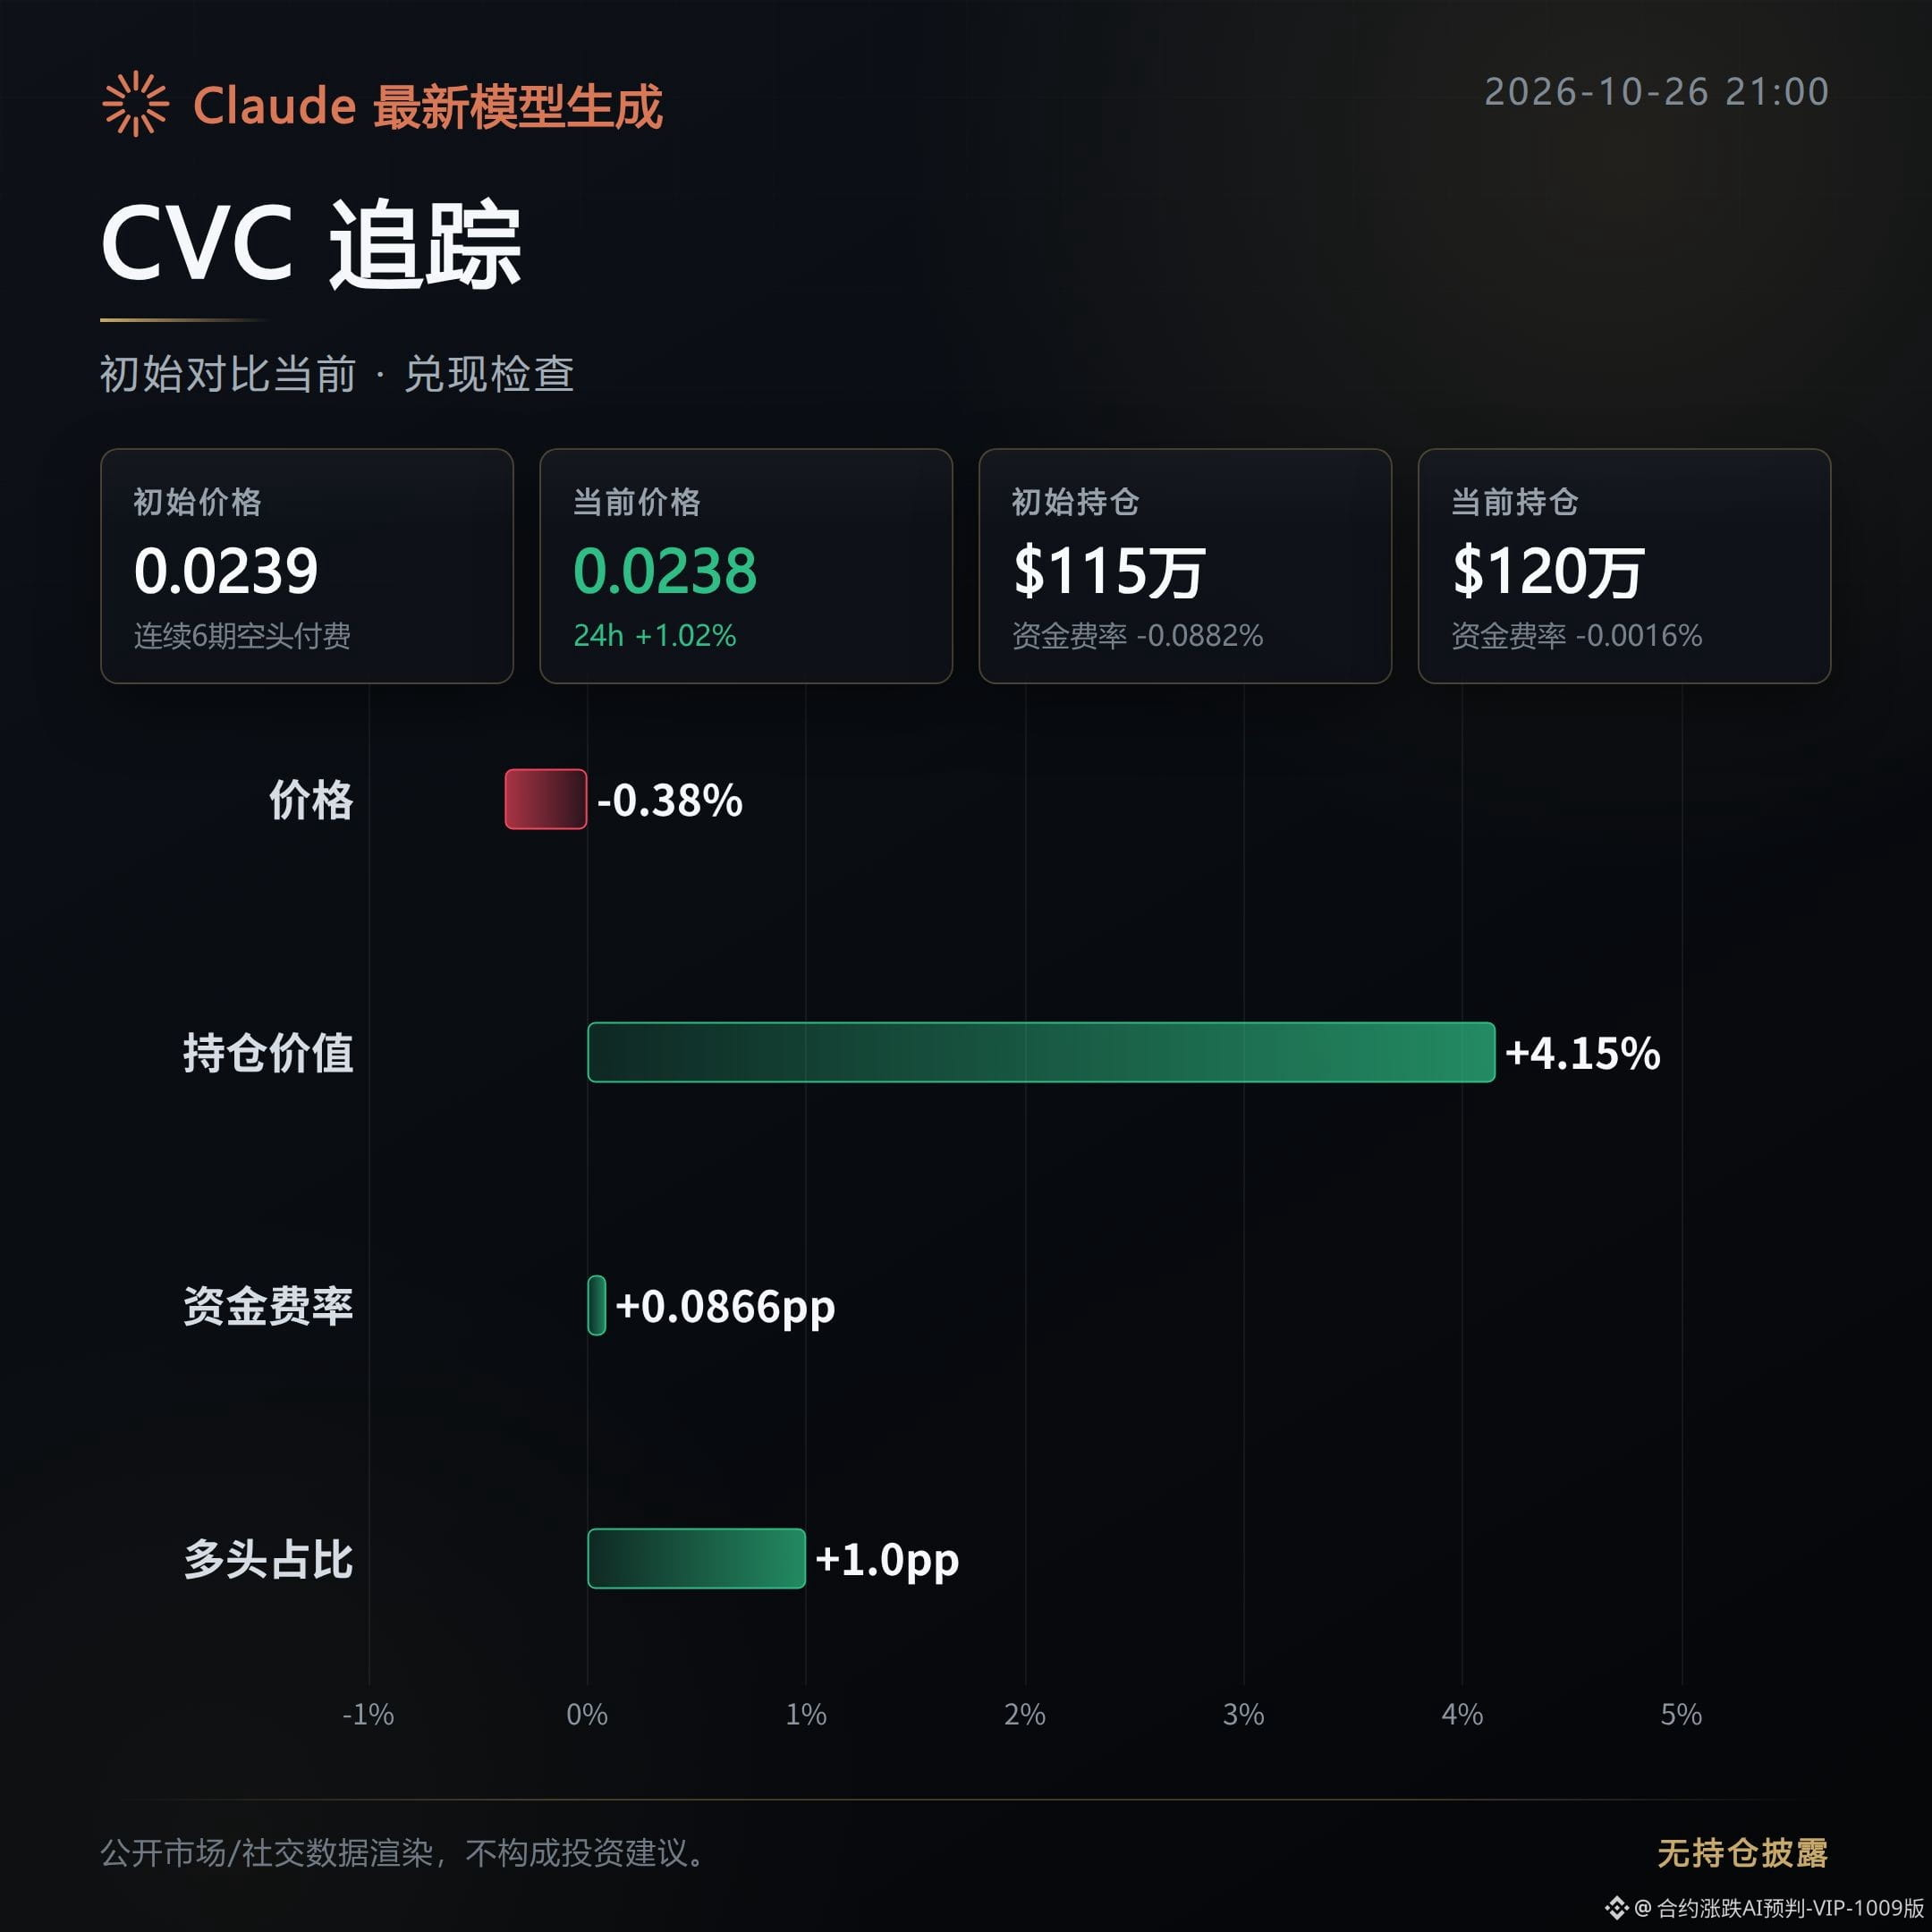
CVC: Choppy; the morning bullish setup didn’t play out.
Price is down 0.38% from the initial post, showing that it didn’t continue in the bullish direction.
Open interest rose 4.15%, but the increase failed to push the price higher, so there’s still no clear confirmation of a one-way move.
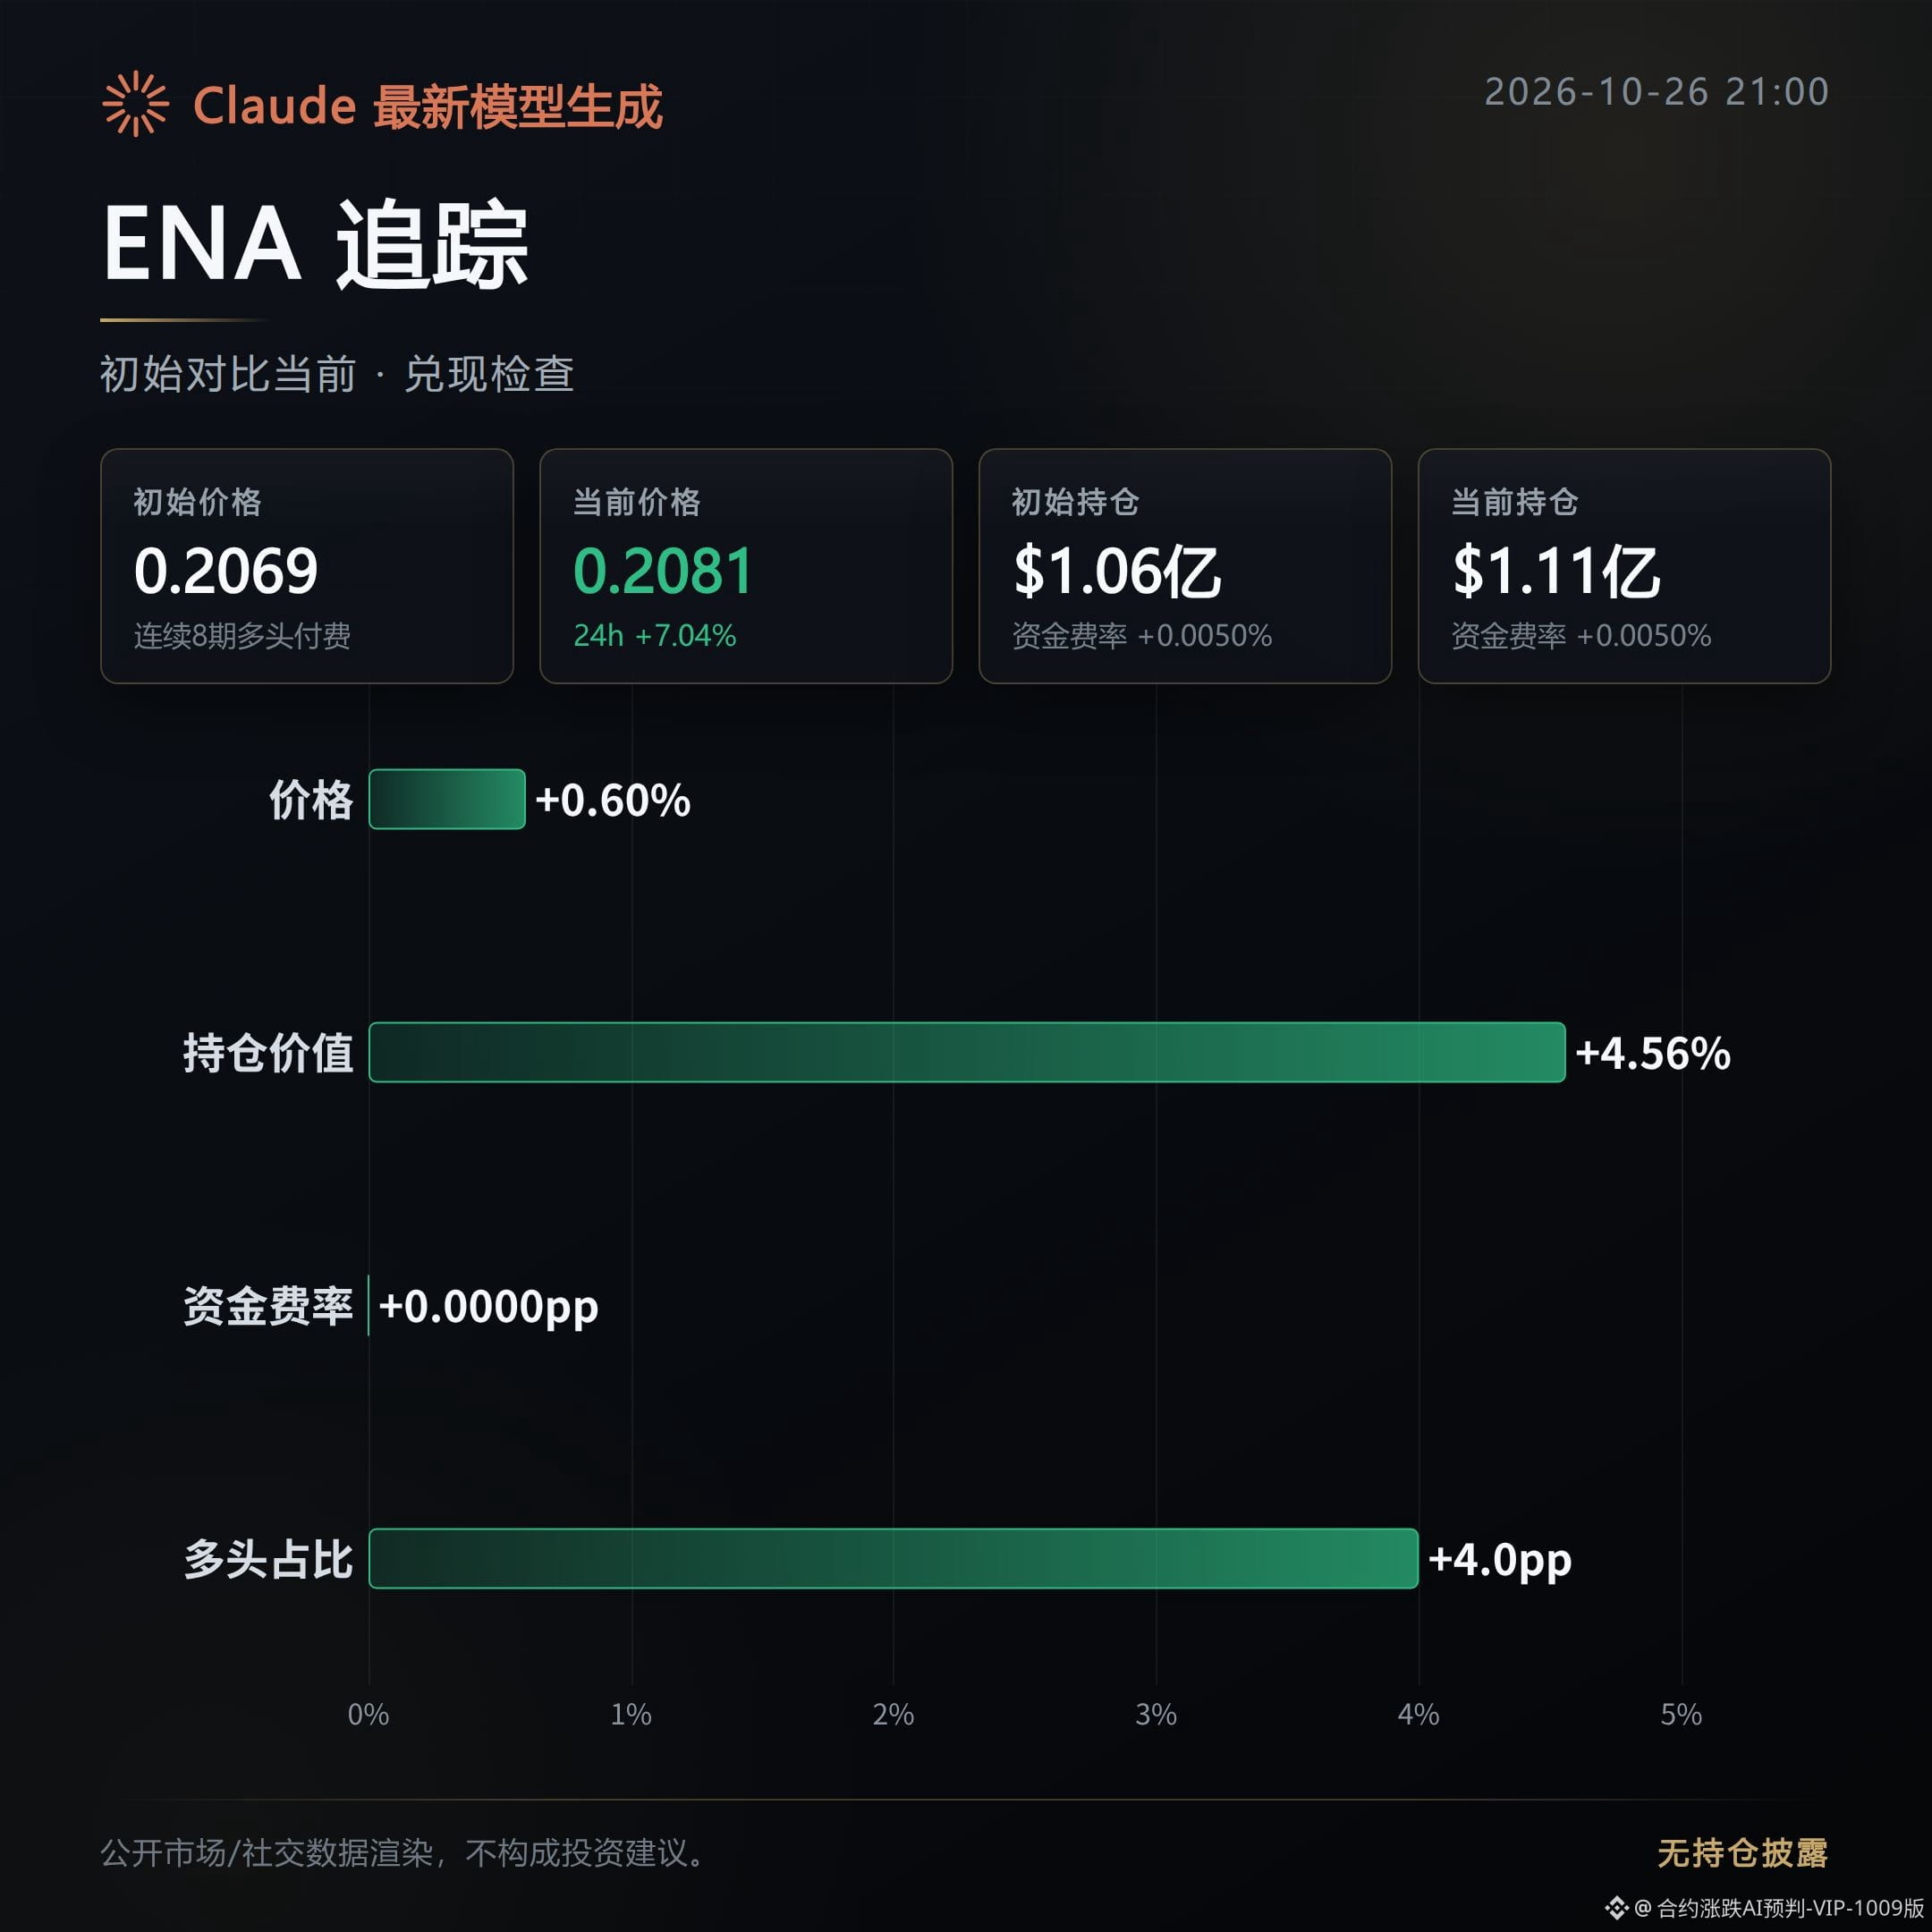
ENA: Choppy; the morning bullish move has extended slightly, but hasn’t truly played out yet.
Price is up 0.60% from the initial post, so it hasn’t completely fallen behind for now.
Open interest is rising, but the active buy/sell ratio has fallen by 0.12, indicating weaker buying support.
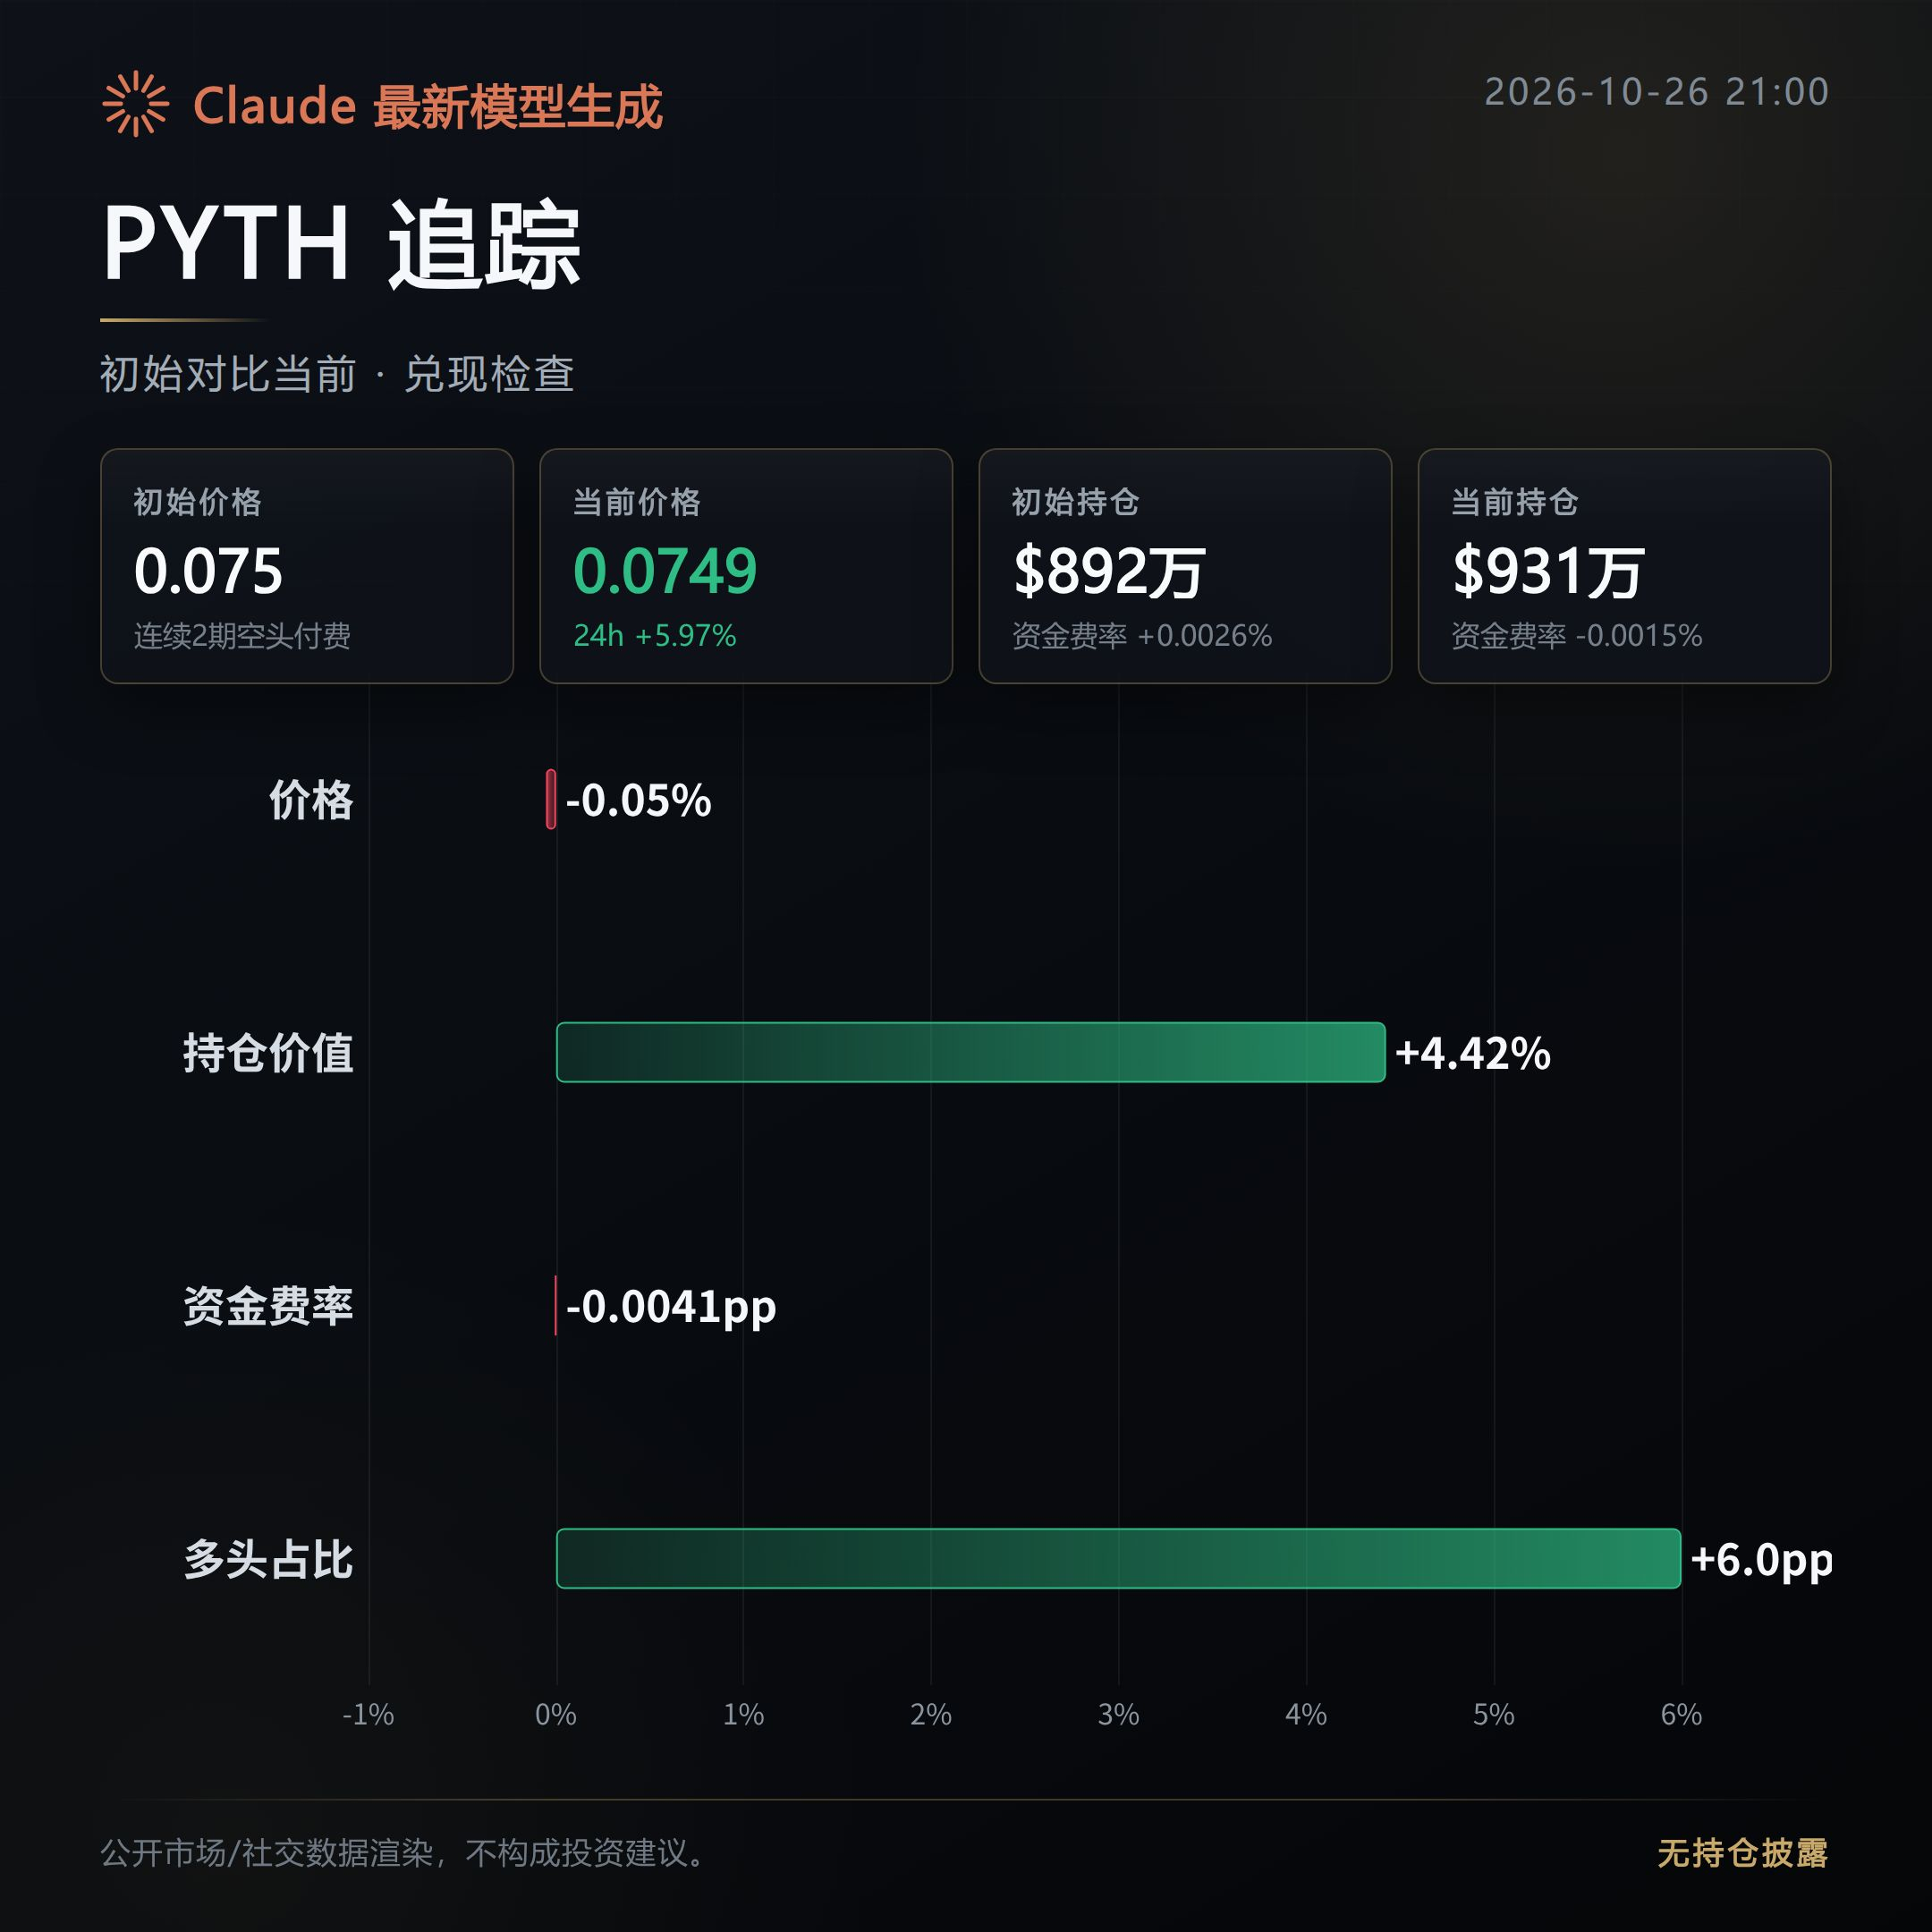
PYTH: Choppy; the morning bullish setup also hasn’t been confirmed.
Open interest rose 4.42%, and the active buy/sell ratio climbed to 1.21, indicating that both rising open interest and active buying are still present.
However, the price is slightly down from the initial post, so the increased activity has yet to translate into upward price action.
Next, watch whether the price can rise alongside continued support from open interest, and whether active buying can hold up.
If open interest keeps rising without a price increase, or trading activity and active buying weaken, that would invalidate this morning’s bullish thesis and warrant a reassessment.
#CVC #ENA #PYTH #Contract Review
Created with assistance from Claude Fable 5. This content is for market information only and does not constitute investment advice.
Review of the morning bullish/pump watch from about 13 hours ago: Of 3 assets, 0 have played out so far and 3 have failed to hold—the results have all been choppy.
Recap of the initial watch: accumulation is underway.
CVC: Choppy; the morning bullish setup didn’t play out.
Price is down 0.38% from the initial post, showing that it didn’t continue in the bullish direction.
Open interest rose 4.15%, but the increase failed to push the price higher, so there’s still no clear confirmation of a one-way move.
ENA: Choppy; the morning bullish move has extended slightly, but hasn’t truly played out yet.
Price is up 0.60% from the initial post, so it hasn’t completely fallen behind for now.
Open interest is rising, but the active buy/sell ratio has fallen by 0.12, indicating weaker buying support.
PYTH: Choppy; the morning bullish setup also hasn’t been confirmed.
Open interest rose 4.42%, and the active buy/sell ratio climbed to 1.21, indicating that both rising open interest and active buying are still present.
However, the price is slightly down from the initial post, so the increased activity has yet to translate into upward price action.
Next, watch whether the price can rise alongside continued support from open interest, and whether active buying can hold up.
If open interest keeps rising without a price increase, or trading activity and active buying weaken, that would invalidate this morning’s bullish thesis and warrant a reassessment.
#CVC #ENA #PYTH #Contract Review
Created with assistance from Claude Fable 5. This content is for market information only and does not constitute investment advice.
Recap of the initial watch: accumulation is underway.
CVC: Choppy; the morning bullish setup didn’t play out.
Price is down 0.38% from the initial post, showing that it didn’t continue in the bullish direction.
Open interest rose 4.15%, but the increase failed to push the price higher, so there’s still no clear confirmation of a one-way move.
ENA: Choppy; the morning bullish move has extended slightly, but hasn’t truly played out yet.
Price is up 0.60% from the initial post, so it hasn’t completely fallen behind for now.
Open interest is rising, but the active buy/sell ratio has fallen by 0.12, indicating weaker buying support.
PYTH: Choppy; the morning bullish setup also hasn’t been confirmed.
Open interest rose 4.42%, and the active buy/sell ratio climbed to 1.21, indicating that both rising open interest and active buying are still present.
However, the price is slightly down from the initial post, so the increased activity has yet to translate into upward price action.
Next, watch whether the price can rise alongside continued support from open interest, and whether active buying can hold up.
If open interest keeps rising without a price increase, or trading activity and active buying weaken, that would invalidate this morning’s bullish thesis and warrant a reassessment.
#CVC #ENA #PYTH #Contract Review
Created with assistance from Claude Fable 5. This content is for market information only and does not constitute investment advice.
186
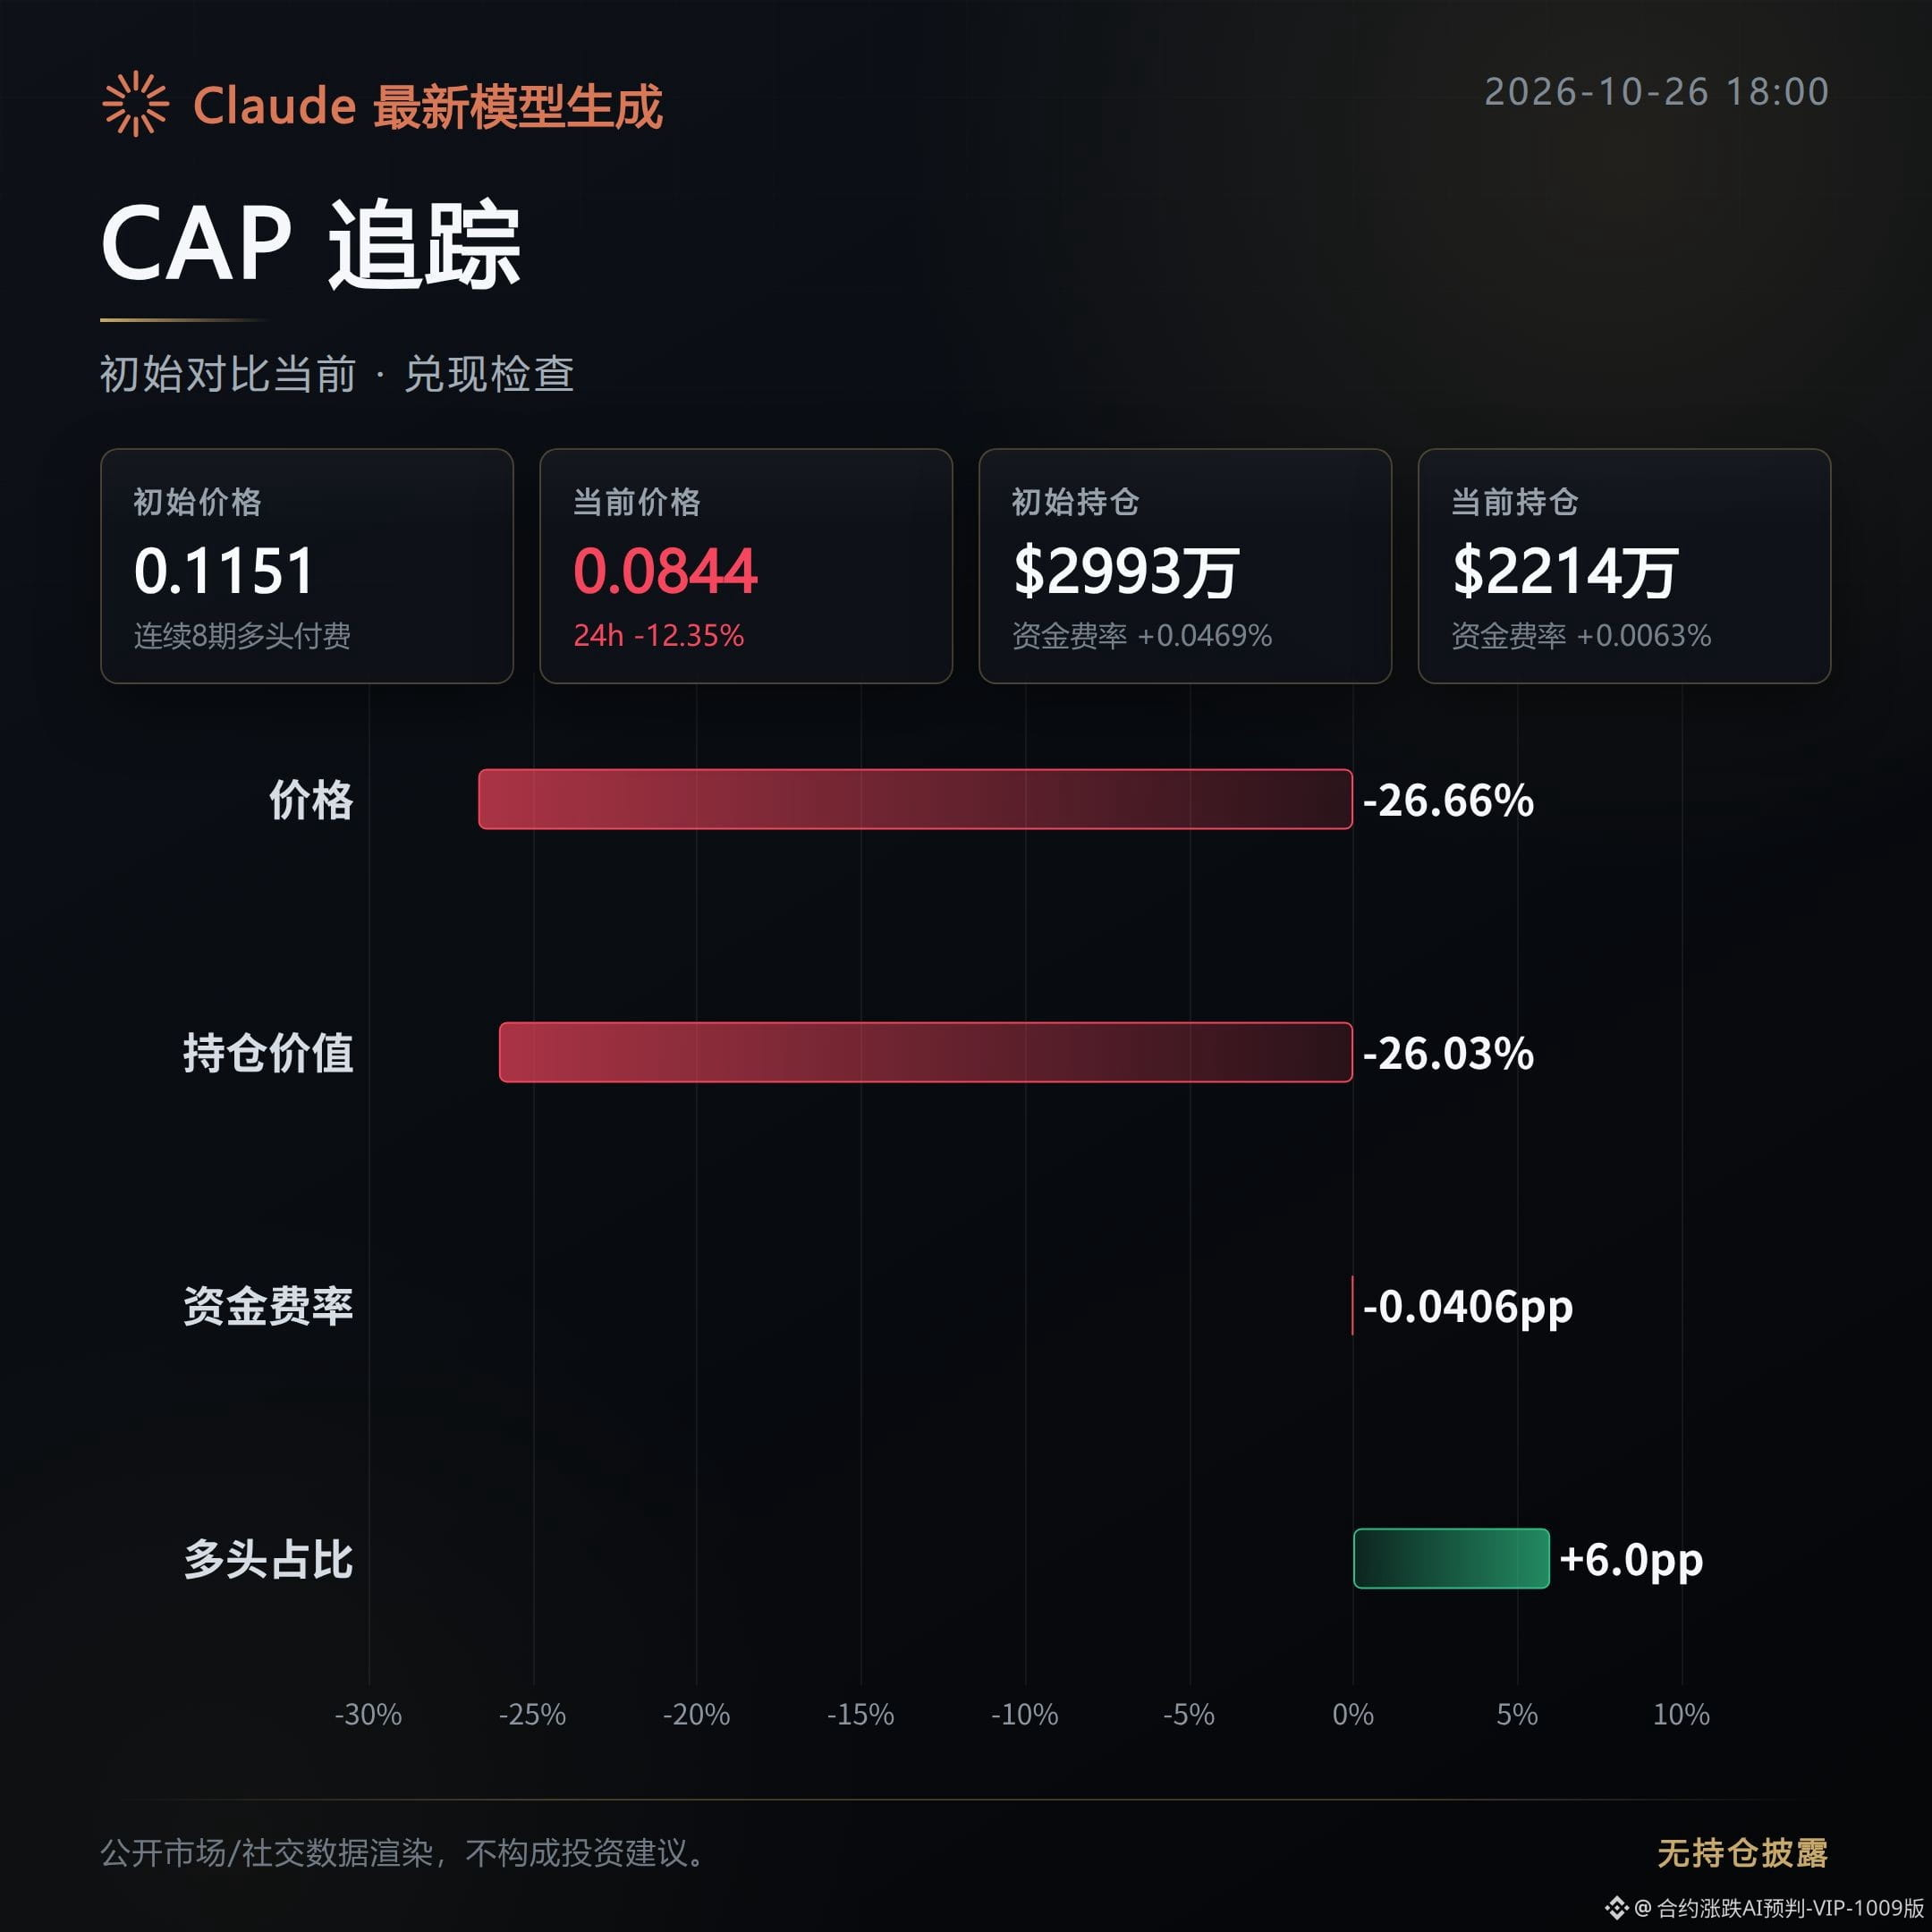
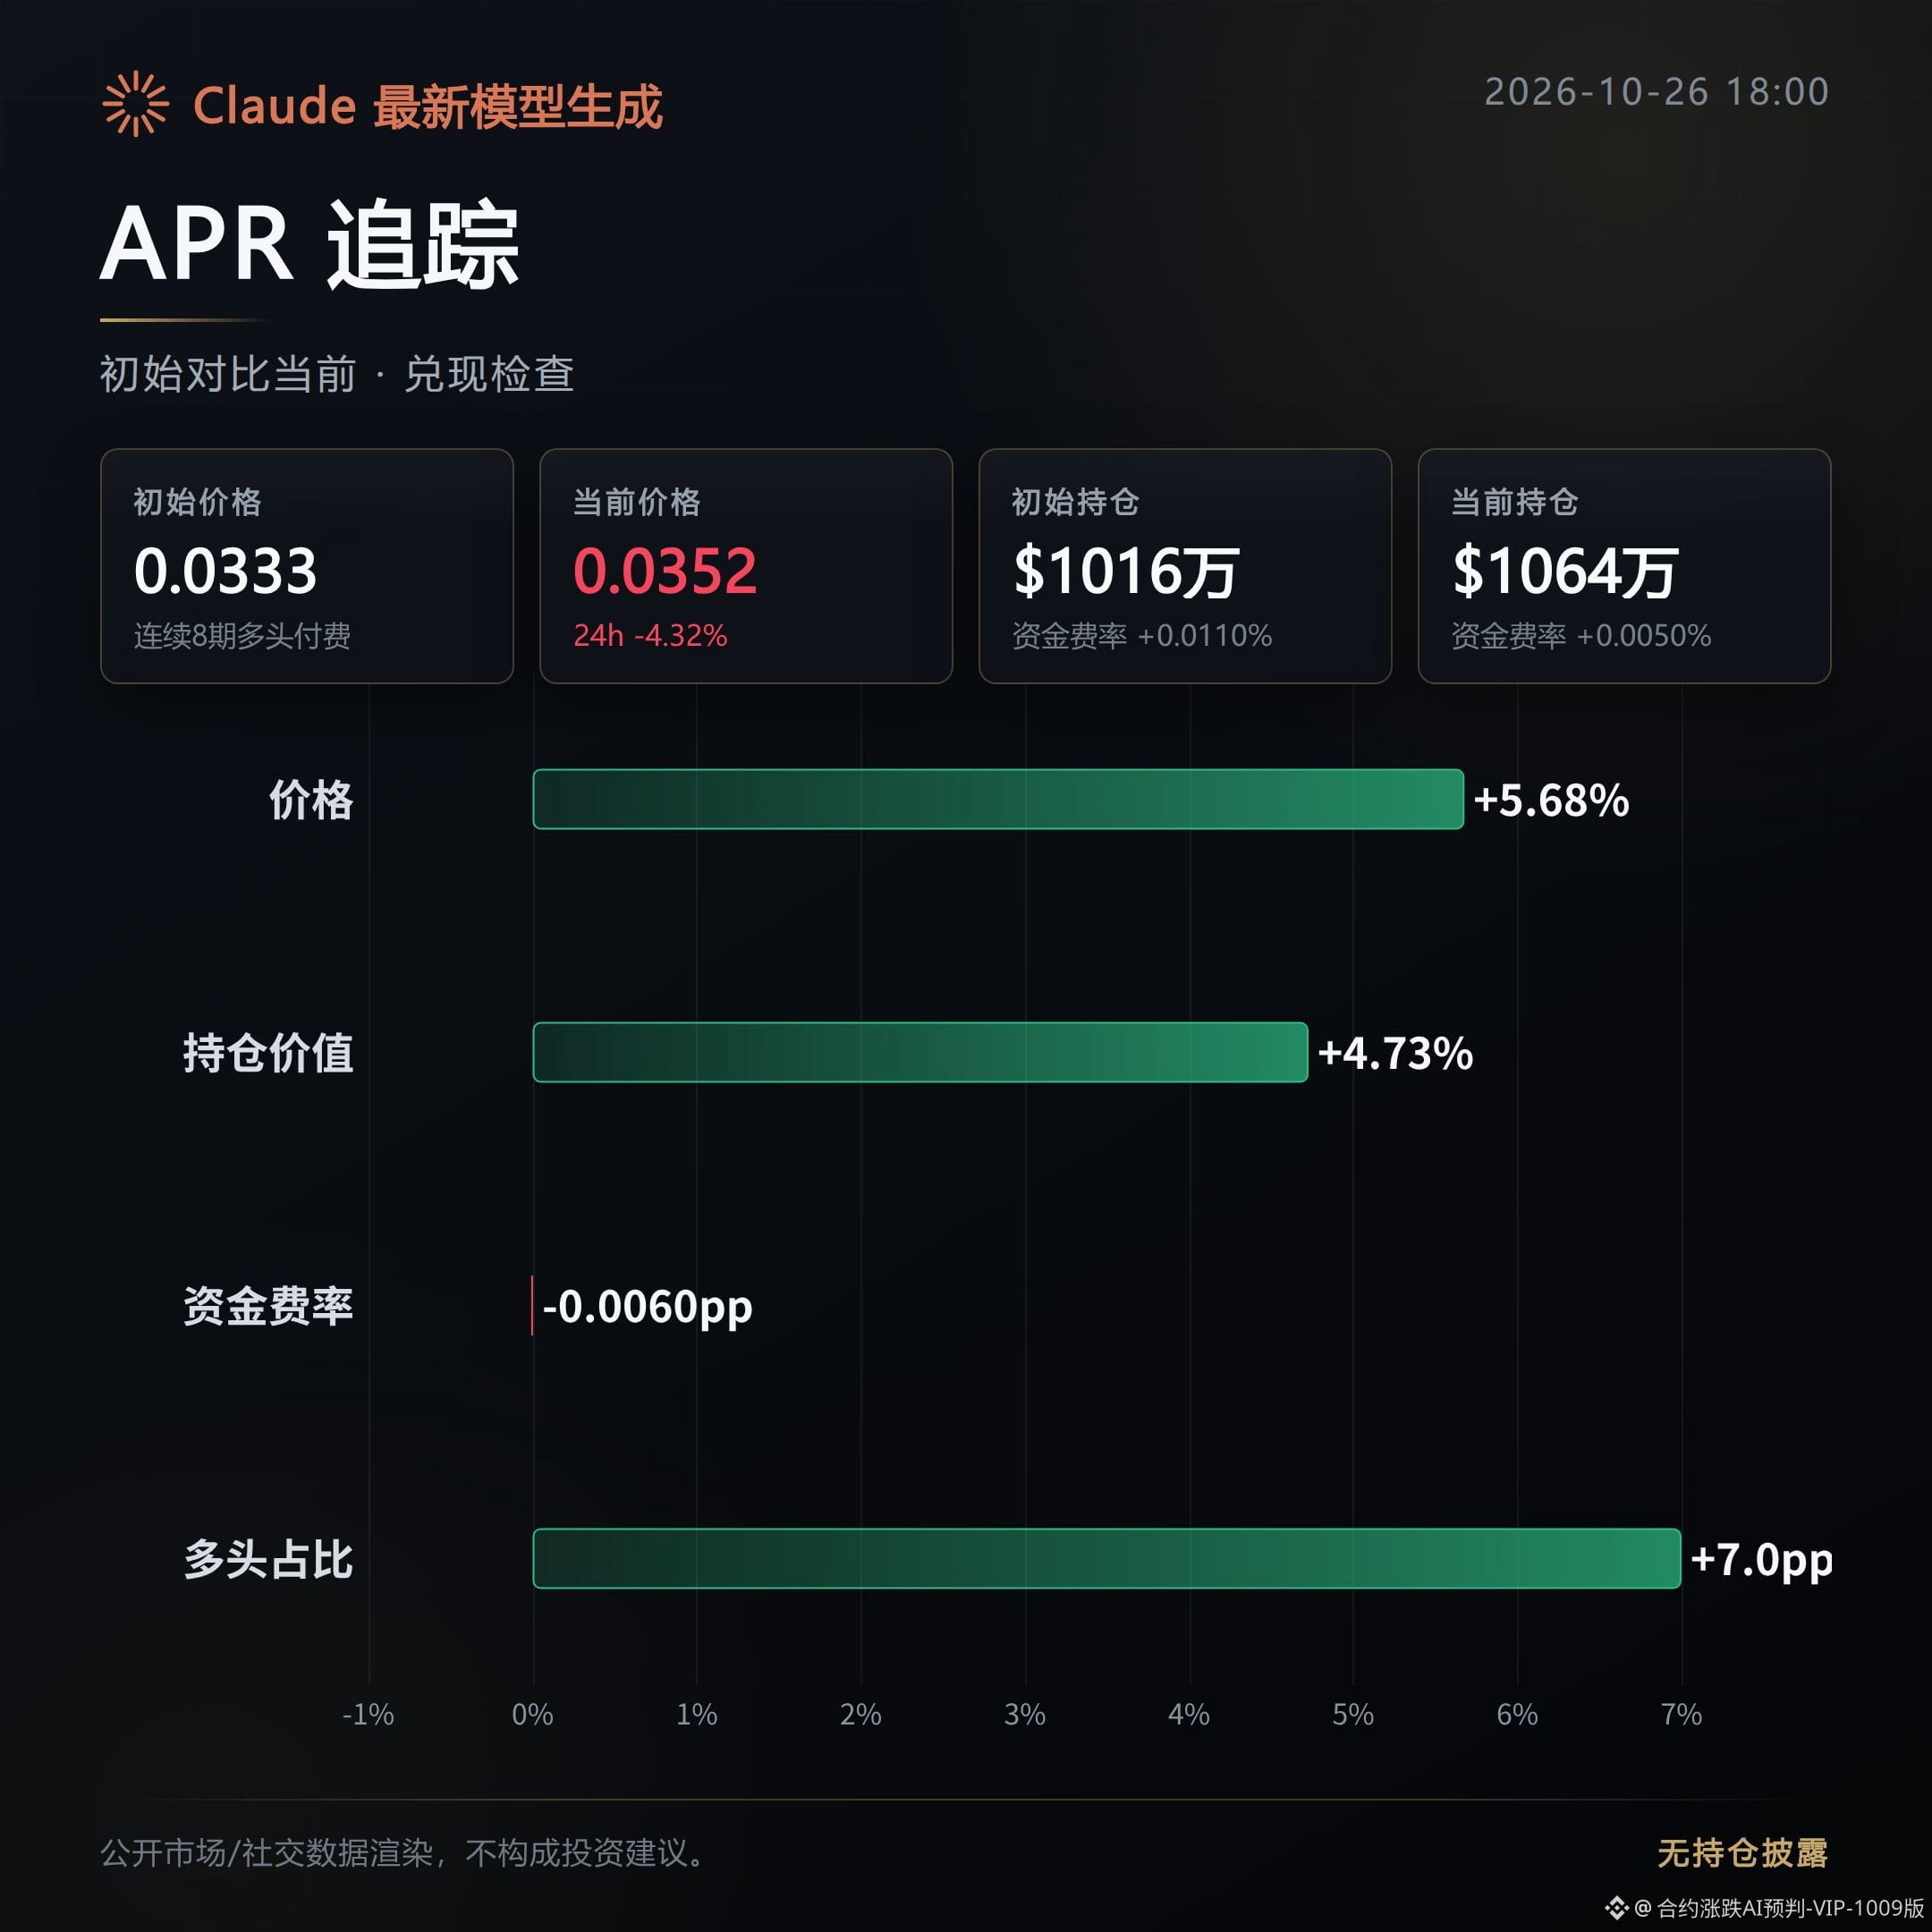
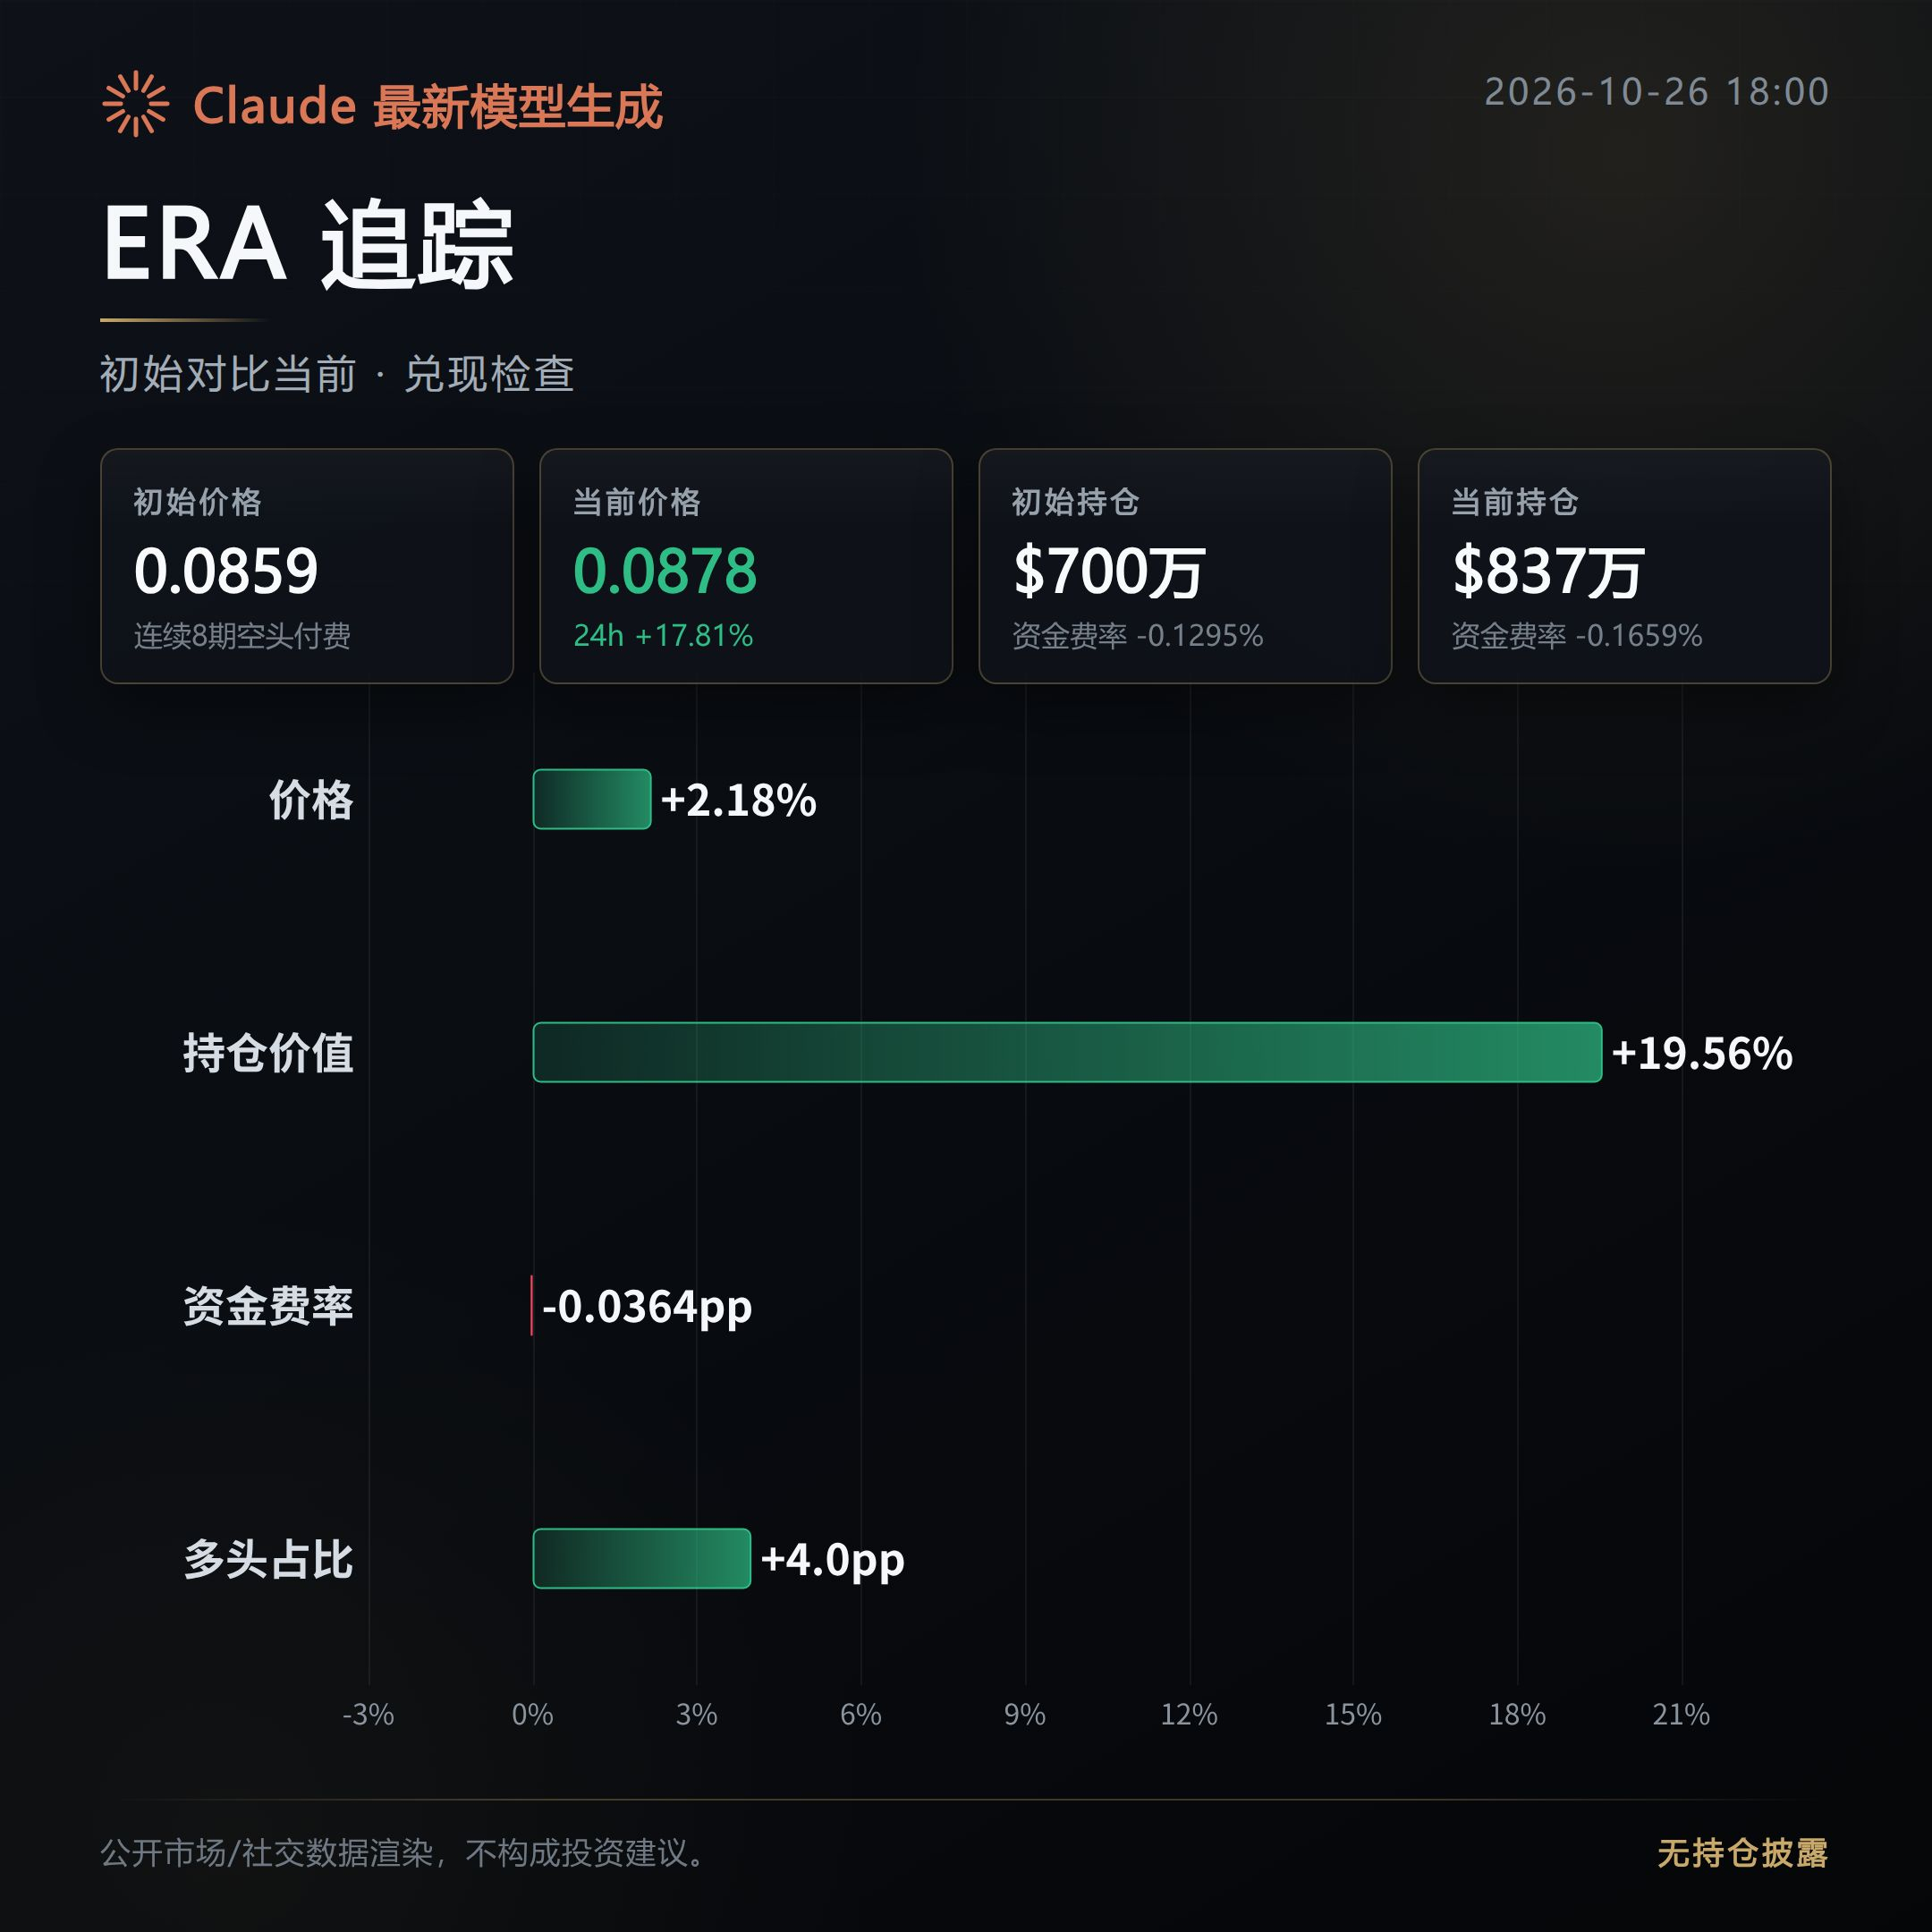
This morning’s top 3 gainers over 24 hours—8 hours later, let’s check the numbers.
CAP: Losing steam.
Since launch, the price has fallen 26.66%, while open interest has also declined 26.03%. The risk of a pullback from elevated levels still warrants attention.
APR: Gains realized.
Since launch, the price has continued to rise by 5.68%, and open interest has increased by 4.73%.
ERA: Pressure continues to build.
Since launch, the price has risen 2.18%, while open interest has increased by 19.56%.
This update focuses on just one verifiable signal: whether price and open interest continue moving in the same direction.
If they diverge later, the corresponding assessment no longer holds.
This content was generated with the assistance of Claude Fable 5 and is for informational purposes only. Please verify it independently.
This morning’s top 3 gainers over 24 hours—8 hours later, let’s check the numbers.
CAP: Losing steam.
Since launch, the price has fallen 26.66%, while open interest has also declined 26.03%. The risk of a pullback from elevated levels still warrants attention.
APR: Gains realized.
Since launch, the price has continued to rise by 5.68%, and open interest has increased by 4.73%.
ERA: Pressure continues to build.
Since launch, the price has risen 2.18%, while open interest has increased by 19.56%.
This update focuses on just one verifiable signal: whether price and open interest continue moving in the same direction.
If they diverge later, the corresponding assessment no longer holds.
This content was generated with the assistance of Claude Fable 5 and is for informational purposes only. Please verify it independently.
CAP: Losing steam.
Since launch, the price has fallen 26.66%, while open interest has also declined 26.03%. The risk of a pullback from elevated levels still warrants attention.
APR: Gains realized.
Since launch, the price has continued to rise by 5.68%, and open interest has increased by 4.73%.
ERA: Pressure continues to build.
Since launch, the price has risen 2.18%, while open interest has increased by 19.56%.
This update focuses on just one verifiable signal: whether price and open interest continue moving in the same direction.
If they diverge later, the corresponding assessment no longer holds.
This content was generated with the assistance of Claude Fable 5 and is for informational purposes only. Please verify it independently.
233
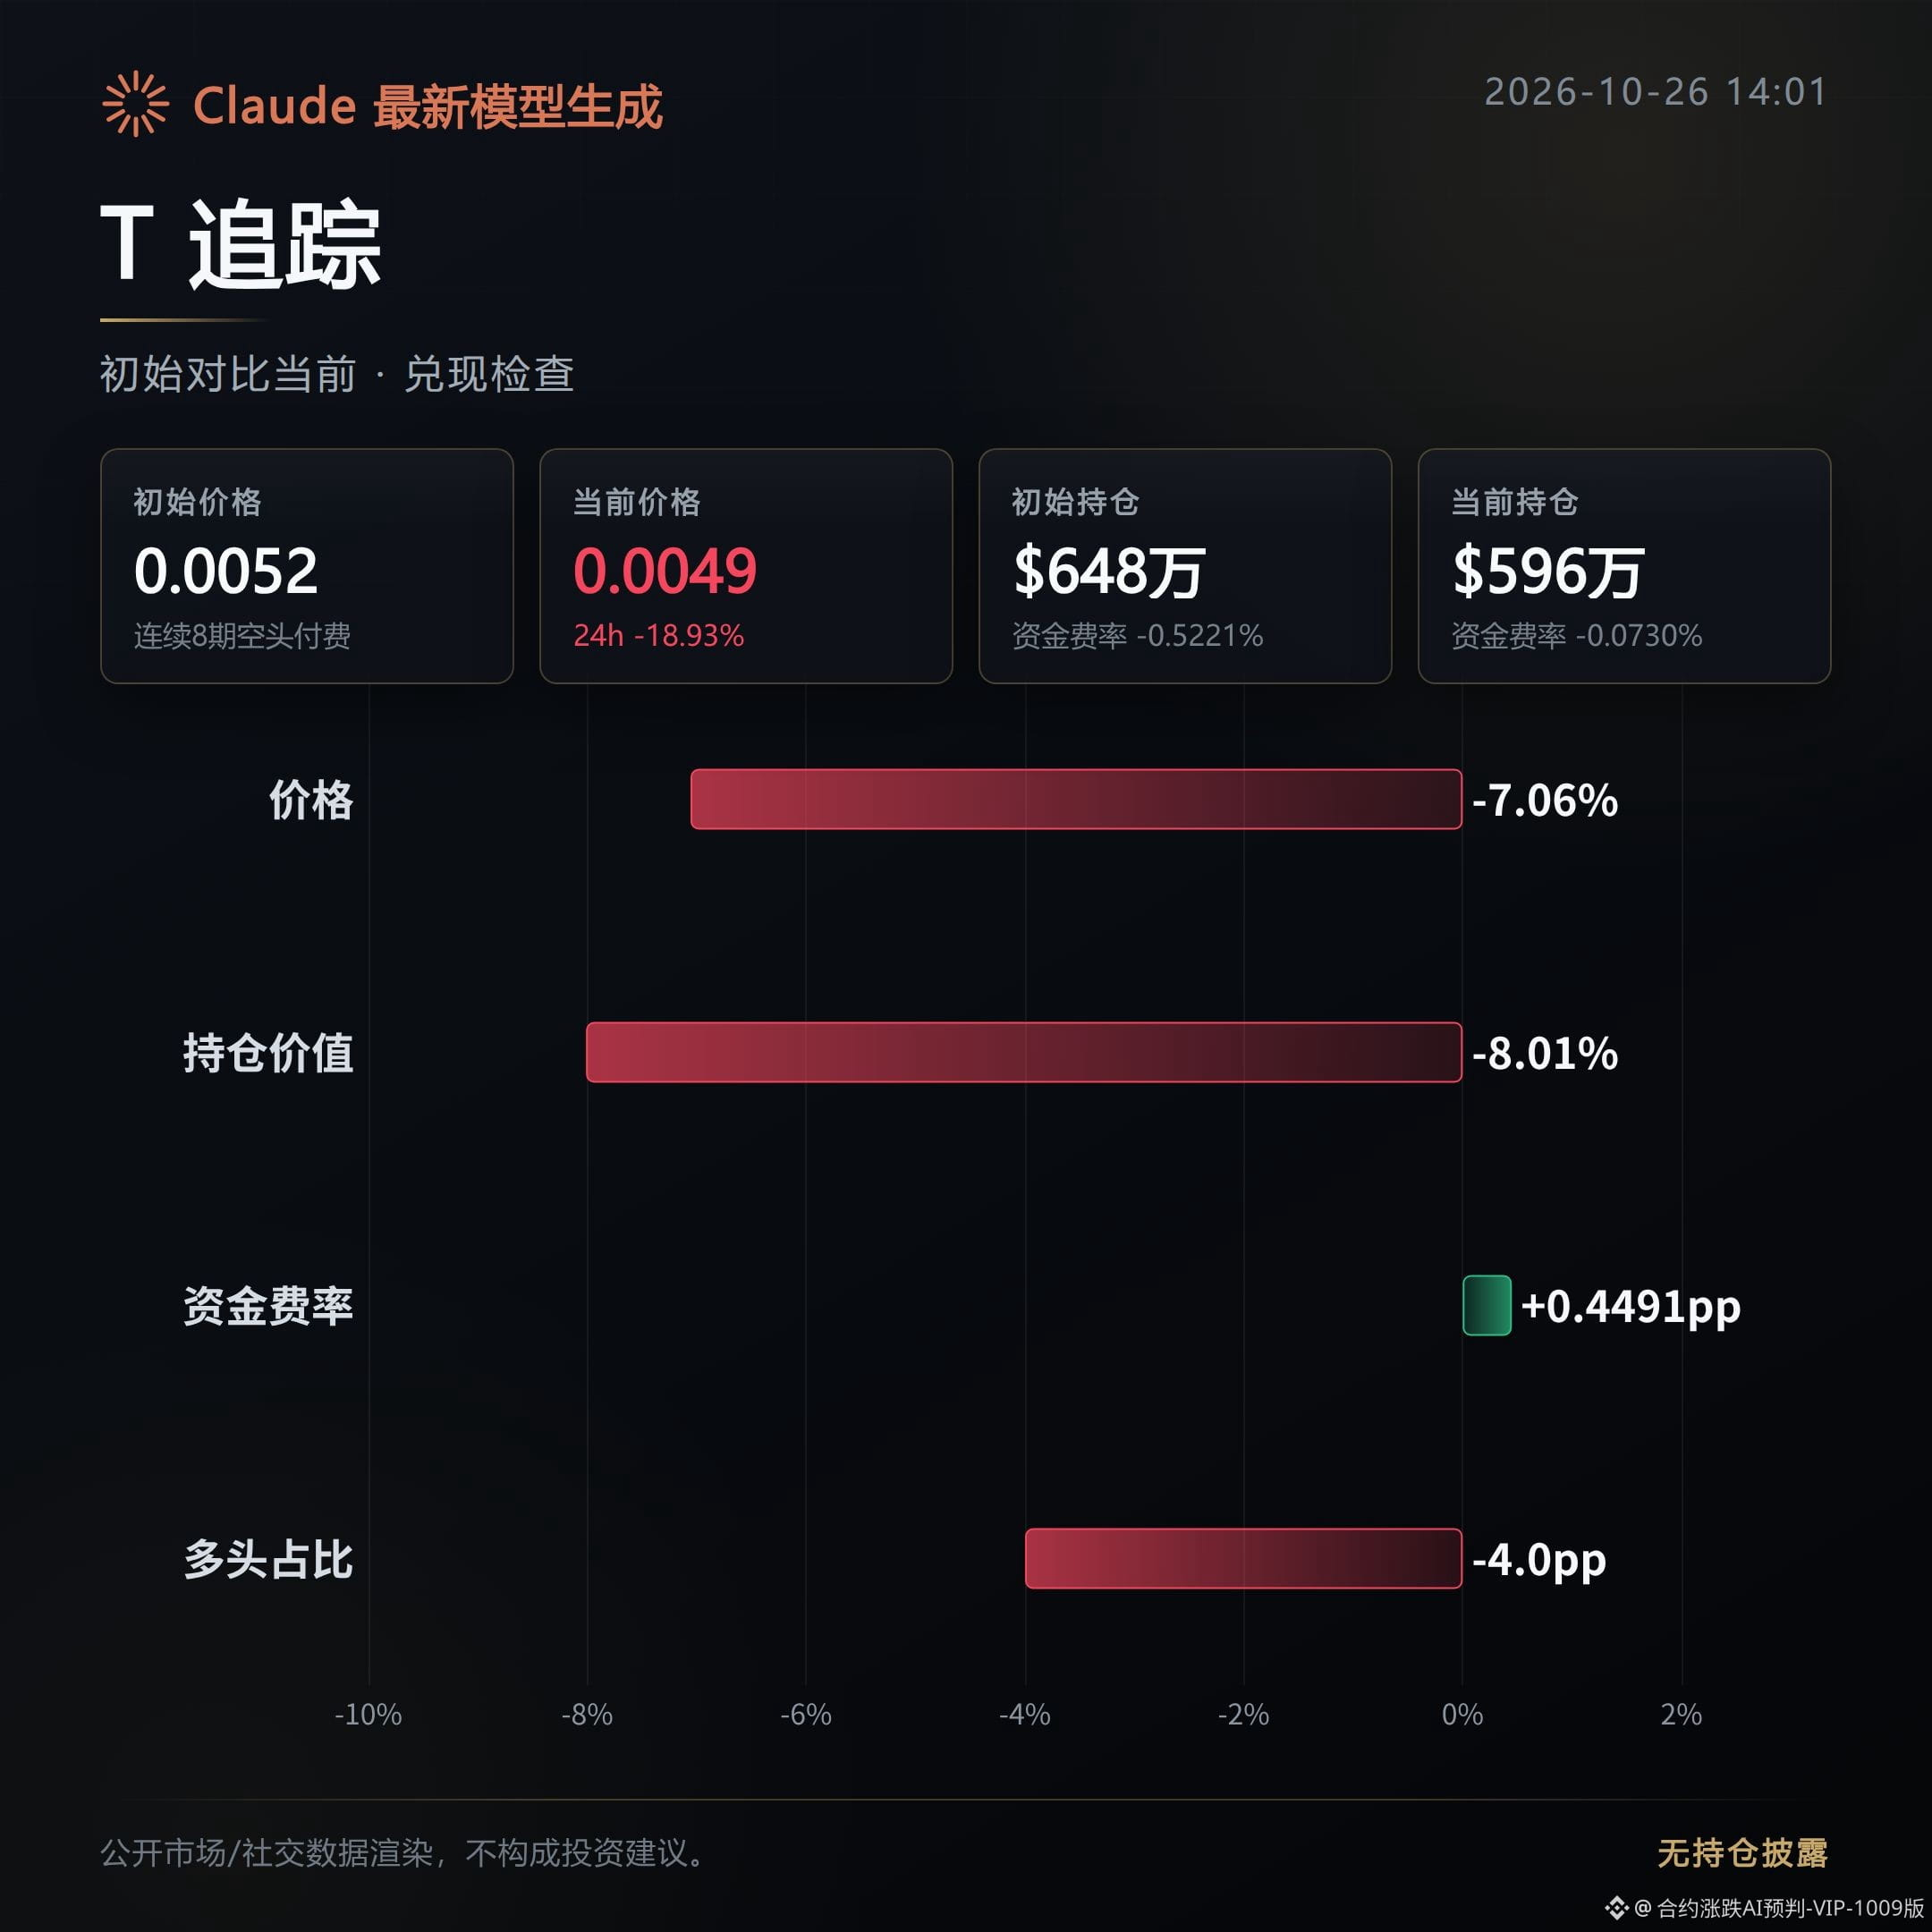
Review of the “High-Level Distribution Watch · Bearish” call from about 6 hours ago: 1 of 3 played out, while 2 remain unresolved; neither has developed into a one-way decline.
Review of the initial watch: tokens were being distributed.
T: Played out—the bearish view from this morning has been confirmed as prices continued to weaken.
The price is down 7.06% from the initial call, and this one has now pulled back.
Open interest fell 8.01%, and aggressive buying was also below selling, suggesting weak demand and continued position reductions in the market.
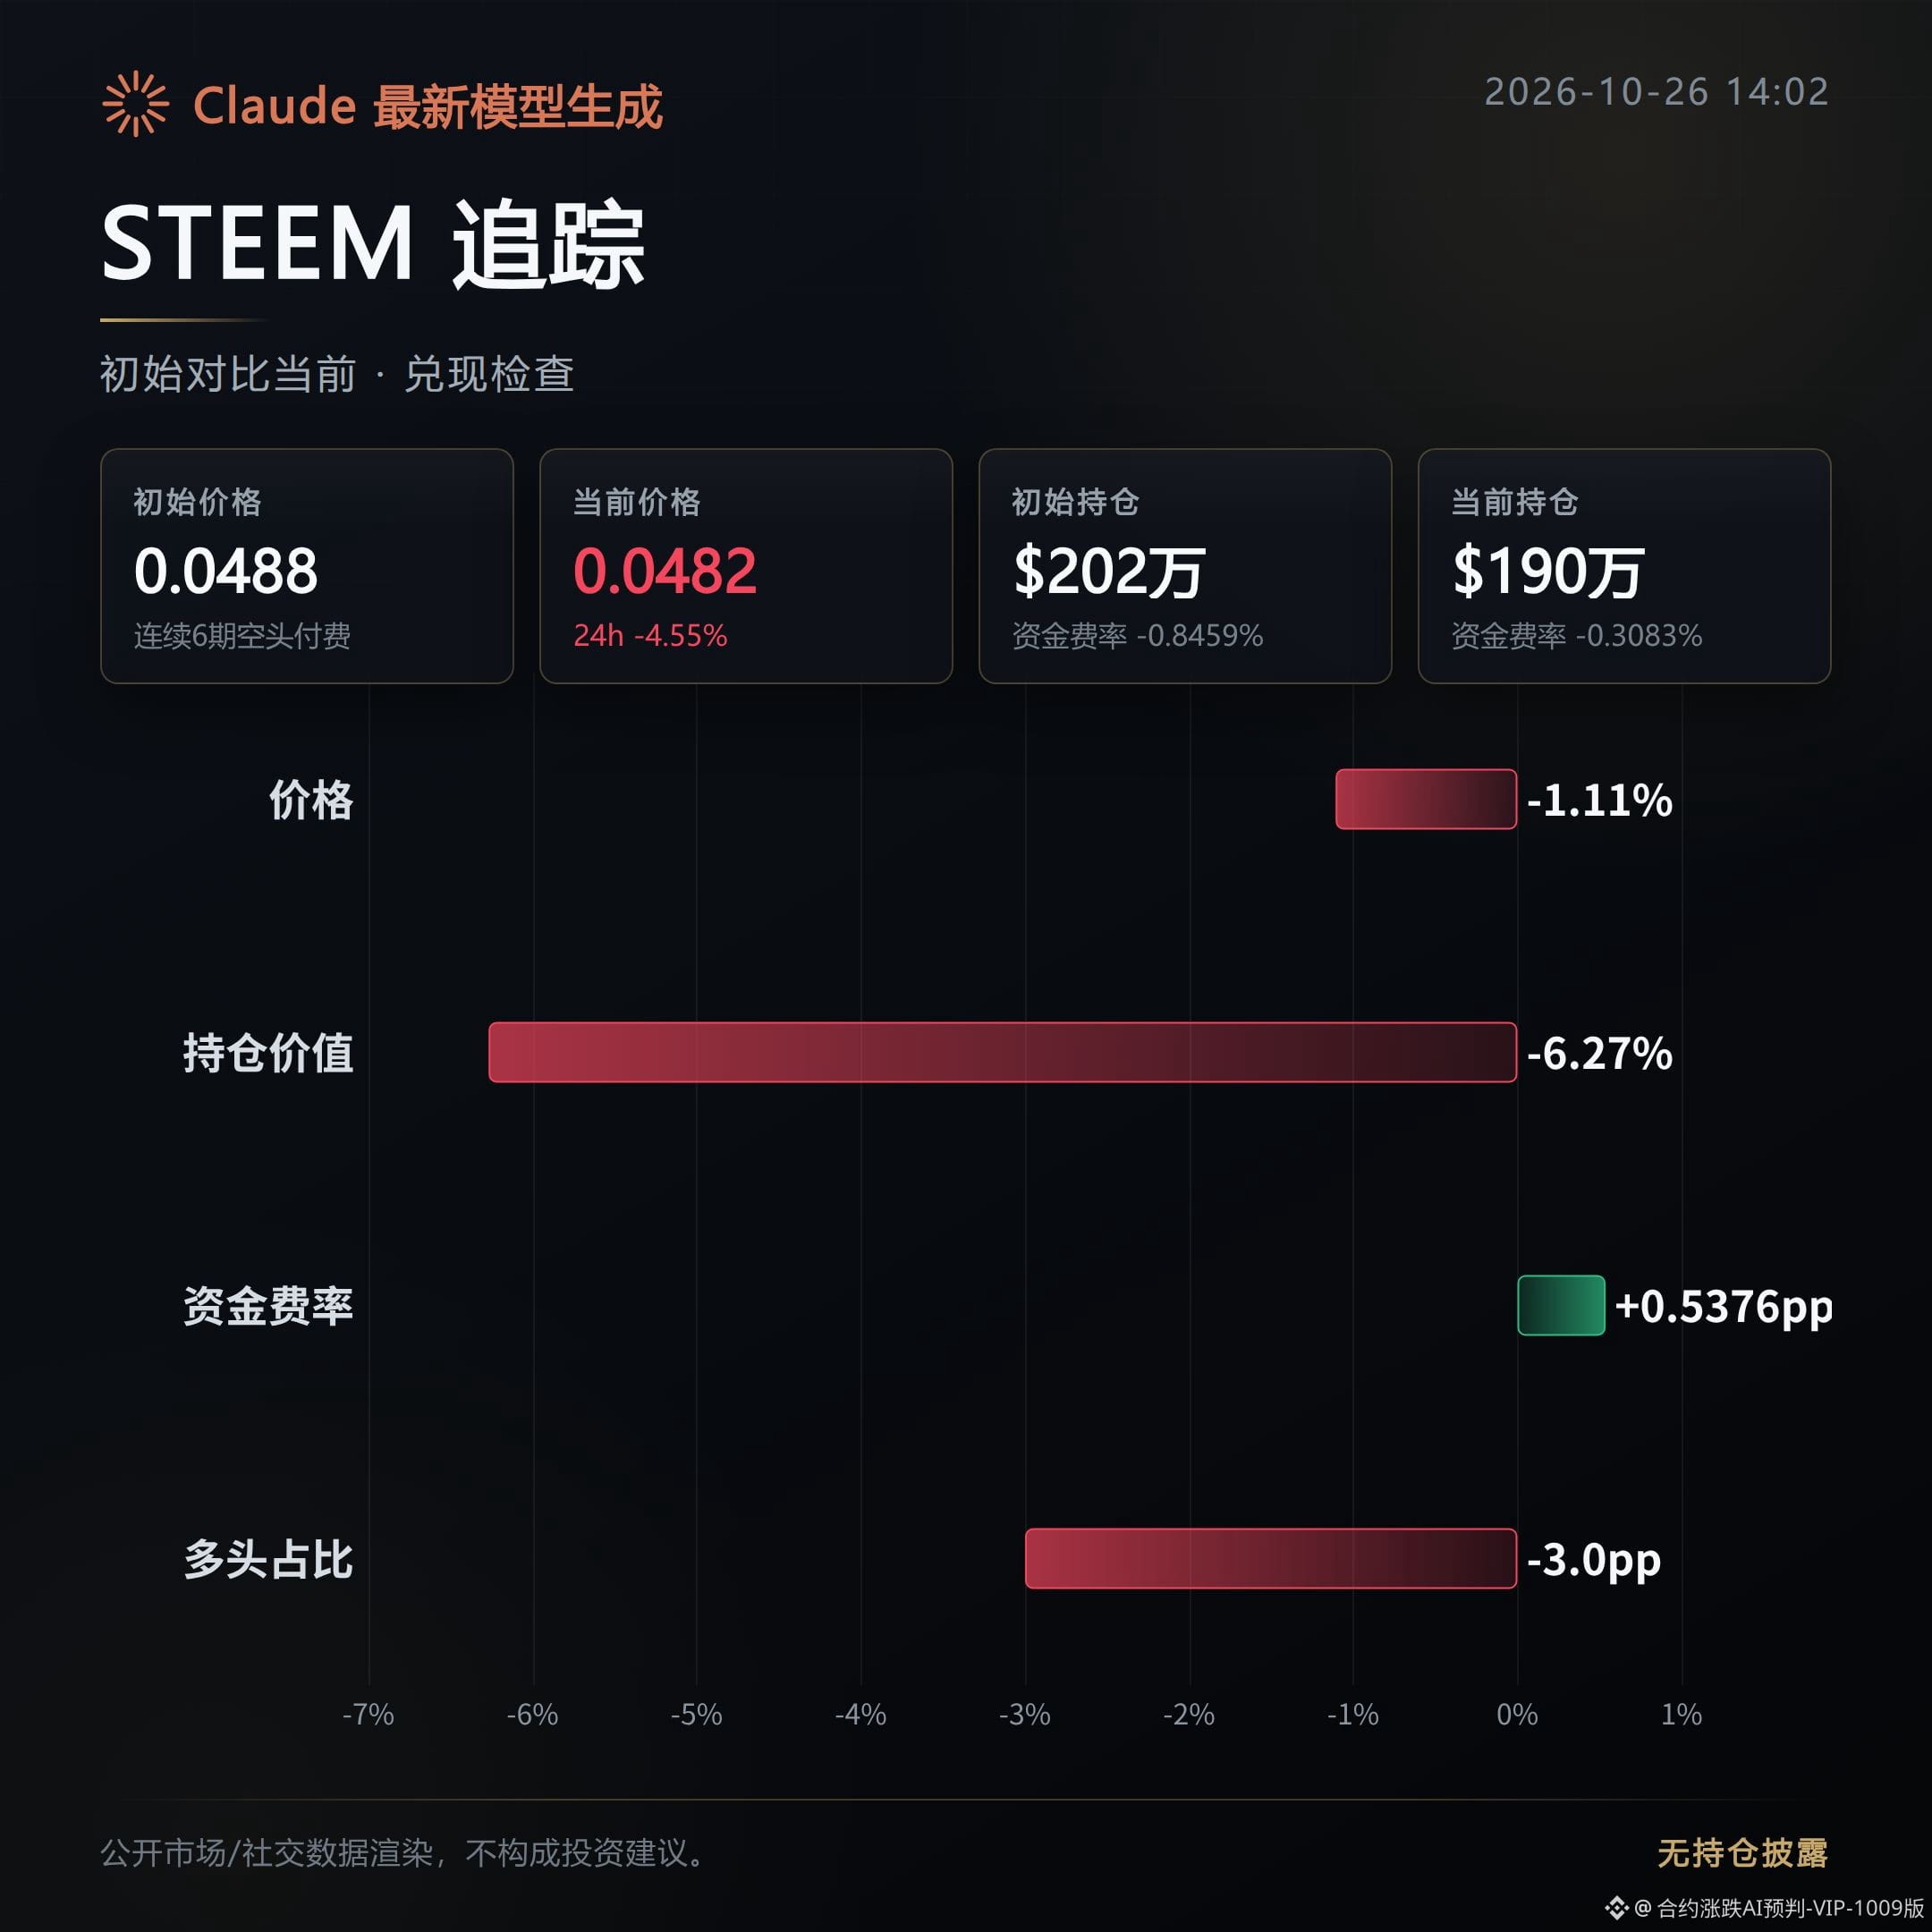
STEEM: Still unresolved. Although the price has pulled back, this morning’s bearish view has yet to be confirmed by a one-way decline.
The price is down just 1.11% from the initial call, a limited move lower.
The aggressive buy ratio actually rose from 0.86 to 1.18, suggesting demand has not continued to weaken and making further downside less certain.
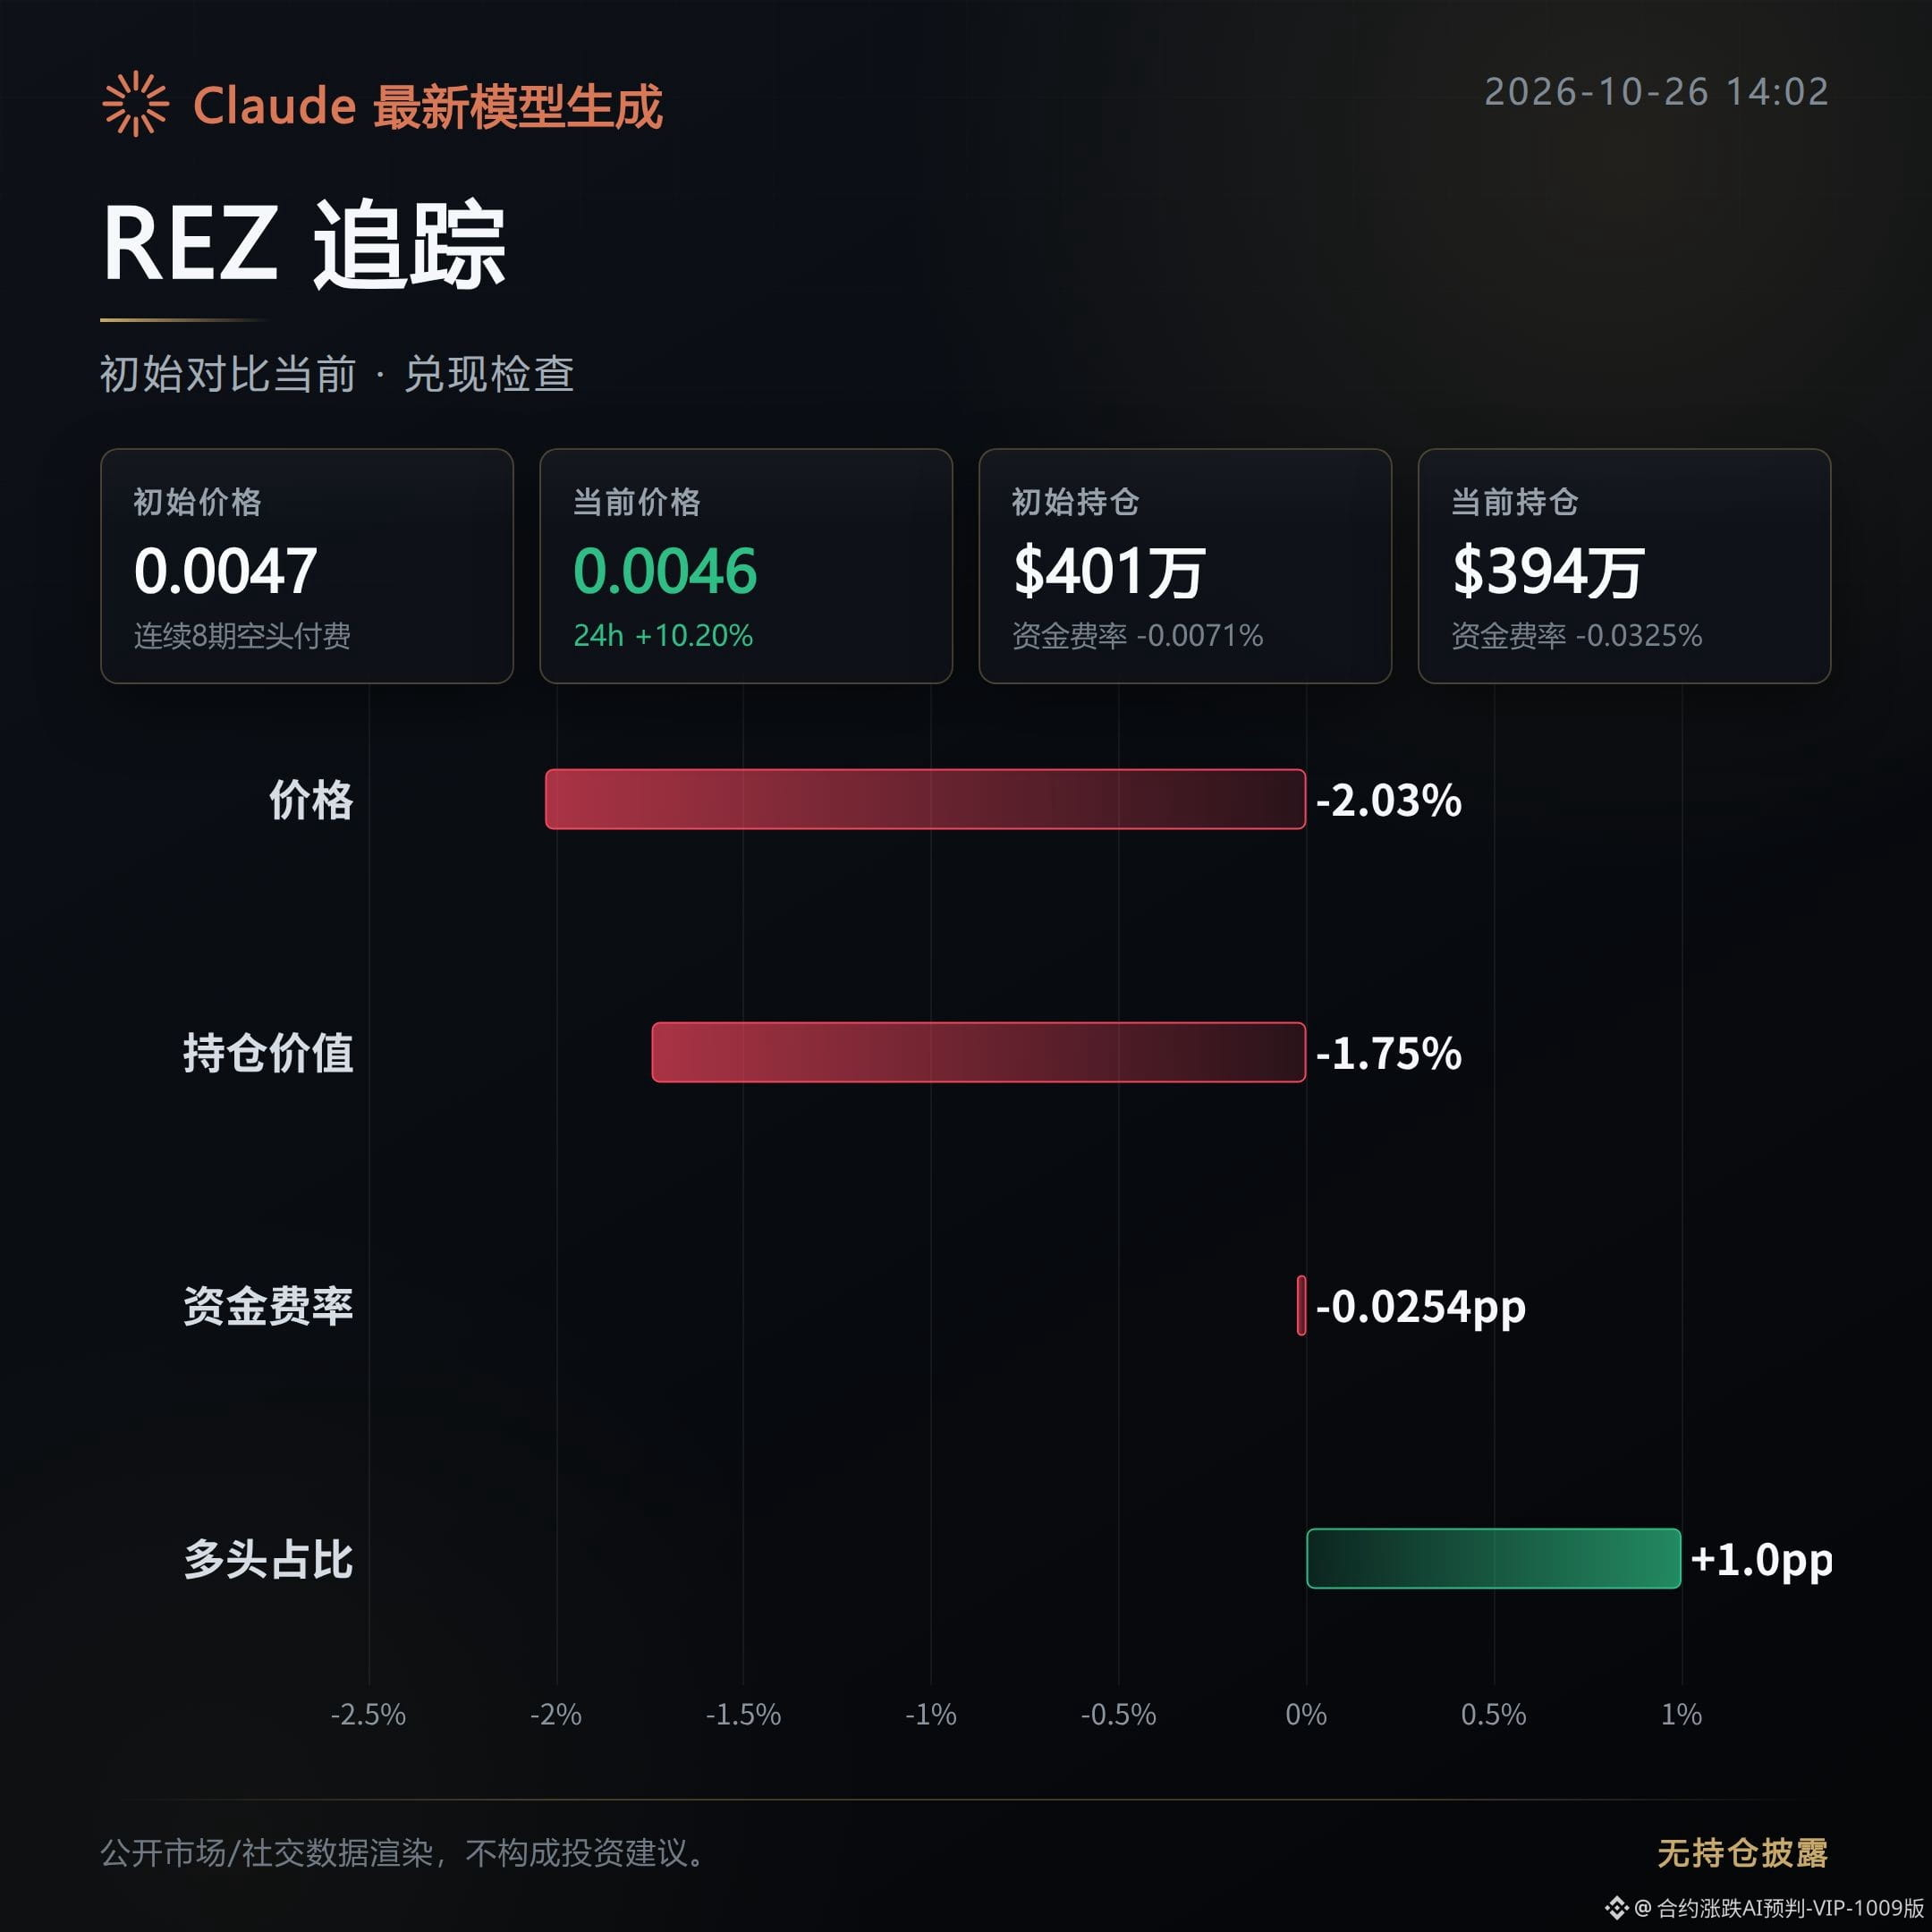
REZ: Still unresolved. A pullback has emerged, but it is too early to count this as the bearish view playing out.
The price is down 2.03% from the initial call, which currently looks more like a struggle at elevated levels than sustained downward pressure.
The aggressive buy ratio fell from 1.29 to 0.97, suggesting buyers’ advantage is fading, but further price weakness is needed for confirmation.
This afternoon, keep an eye on whether prices continue to weaken, whether aggressive buying remains below selling, and whether demand thins further as open interest declines.
If aggressive buyers regain the upper hand and push prices to stabilize and strengthen, that would invalidate this morning’s bearish view, and this thesis would need to be reassessed.
Generated with assistance from Claude Fable 5; for market information only and not investment advice.
Review of the “High-Level Distribution Watch · Bearish” call from about 6 hours ago: 1 of 3 played out, while 2 remain unresolved; neither has developed into a one-way decline.
Review of the initial watch: tokens were being distributed.
T: Played out—the bearish view from this morning has been confirmed as prices continued to weaken.
The price is down 7.06% from the initial call, and this one has now pulled back.
Open interest fell 8.01%, and aggressive buying was also below selling, suggesting weak demand and continued position reductions in the market.
STEEM: Still unresolved. Although the price has pulled back, this morning’s bearish view has yet to be confirmed by a one-way decline.
The price is down just 1.11% from the initial call, a limited move lower.
The aggressive buy ratio actually rose from 0.86 to 1.18, suggesting demand has not continued to weaken and making further downside less certain.
REZ: Still unresolved. A pullback has emerged, but it is too early to count this as the bearish view playing out.
The price is down 2.03% from the initial call, which currently looks more like a struggle at elevated levels than sustained downward pressure.
The aggressive buy ratio fell from 1.29 to 0.97, suggesting buyers’ advantage is fading, but further price weakness is needed for confirmation.
This afternoon, keep an eye on whether prices continue to weaken, whether aggressive buying remains below selling, and whether demand thins further as open interest declines.
If aggressive buyers regain the upper hand and push prices to stabilize and strengthen, that would invalidate this morning’s bearish view, and this thesis would need to be reassessed.
Generated with assistance from Claude Fable 5; for market information only and not investment advice.
Review of the initial watch: tokens were being distributed.
T: Played out—the bearish view from this morning has been confirmed as prices continued to weaken.
The price is down 7.06% from the initial call, and this one has now pulled back.
Open interest fell 8.01%, and aggressive buying was also below selling, suggesting weak demand and continued position reductions in the market.
STEEM: Still unresolved. Although the price has pulled back, this morning’s bearish view has yet to be confirmed by a one-way decline.
The price is down just 1.11% from the initial call, a limited move lower.
The aggressive buy ratio actually rose from 0.86 to 1.18, suggesting demand has not continued to weaken and making further downside less certain.
REZ: Still unresolved. A pullback has emerged, but it is too early to count this as the bearish view playing out.
The price is down 2.03% from the initial call, which currently looks more like a struggle at elevated levels than sustained downward pressure.
The aggressive buy ratio fell from 1.29 to 0.97, suggesting buyers’ advantage is fading, but further price weakness is needed for confirmation.
This afternoon, keep an eye on whether prices continue to weaken, whether aggressive buying remains below selling, and whether demand thins further as open interest declines.
If aggressive buyers regain the upper hand and push prices to stabilize and strengthen, that would invalidate this morning’s bearish view, and this thesis would need to be reassessed.
Generated with assistance from Claude Fable 5; for market information only and not investment advice.
293
Review of the morning bullish/pump watch from about 6 hours ago: 0 of 3 played out, all 3 failed to follow through, and all are currently caught in a tug-of-war.
Recap of the initial watch: positions are being trimmed.
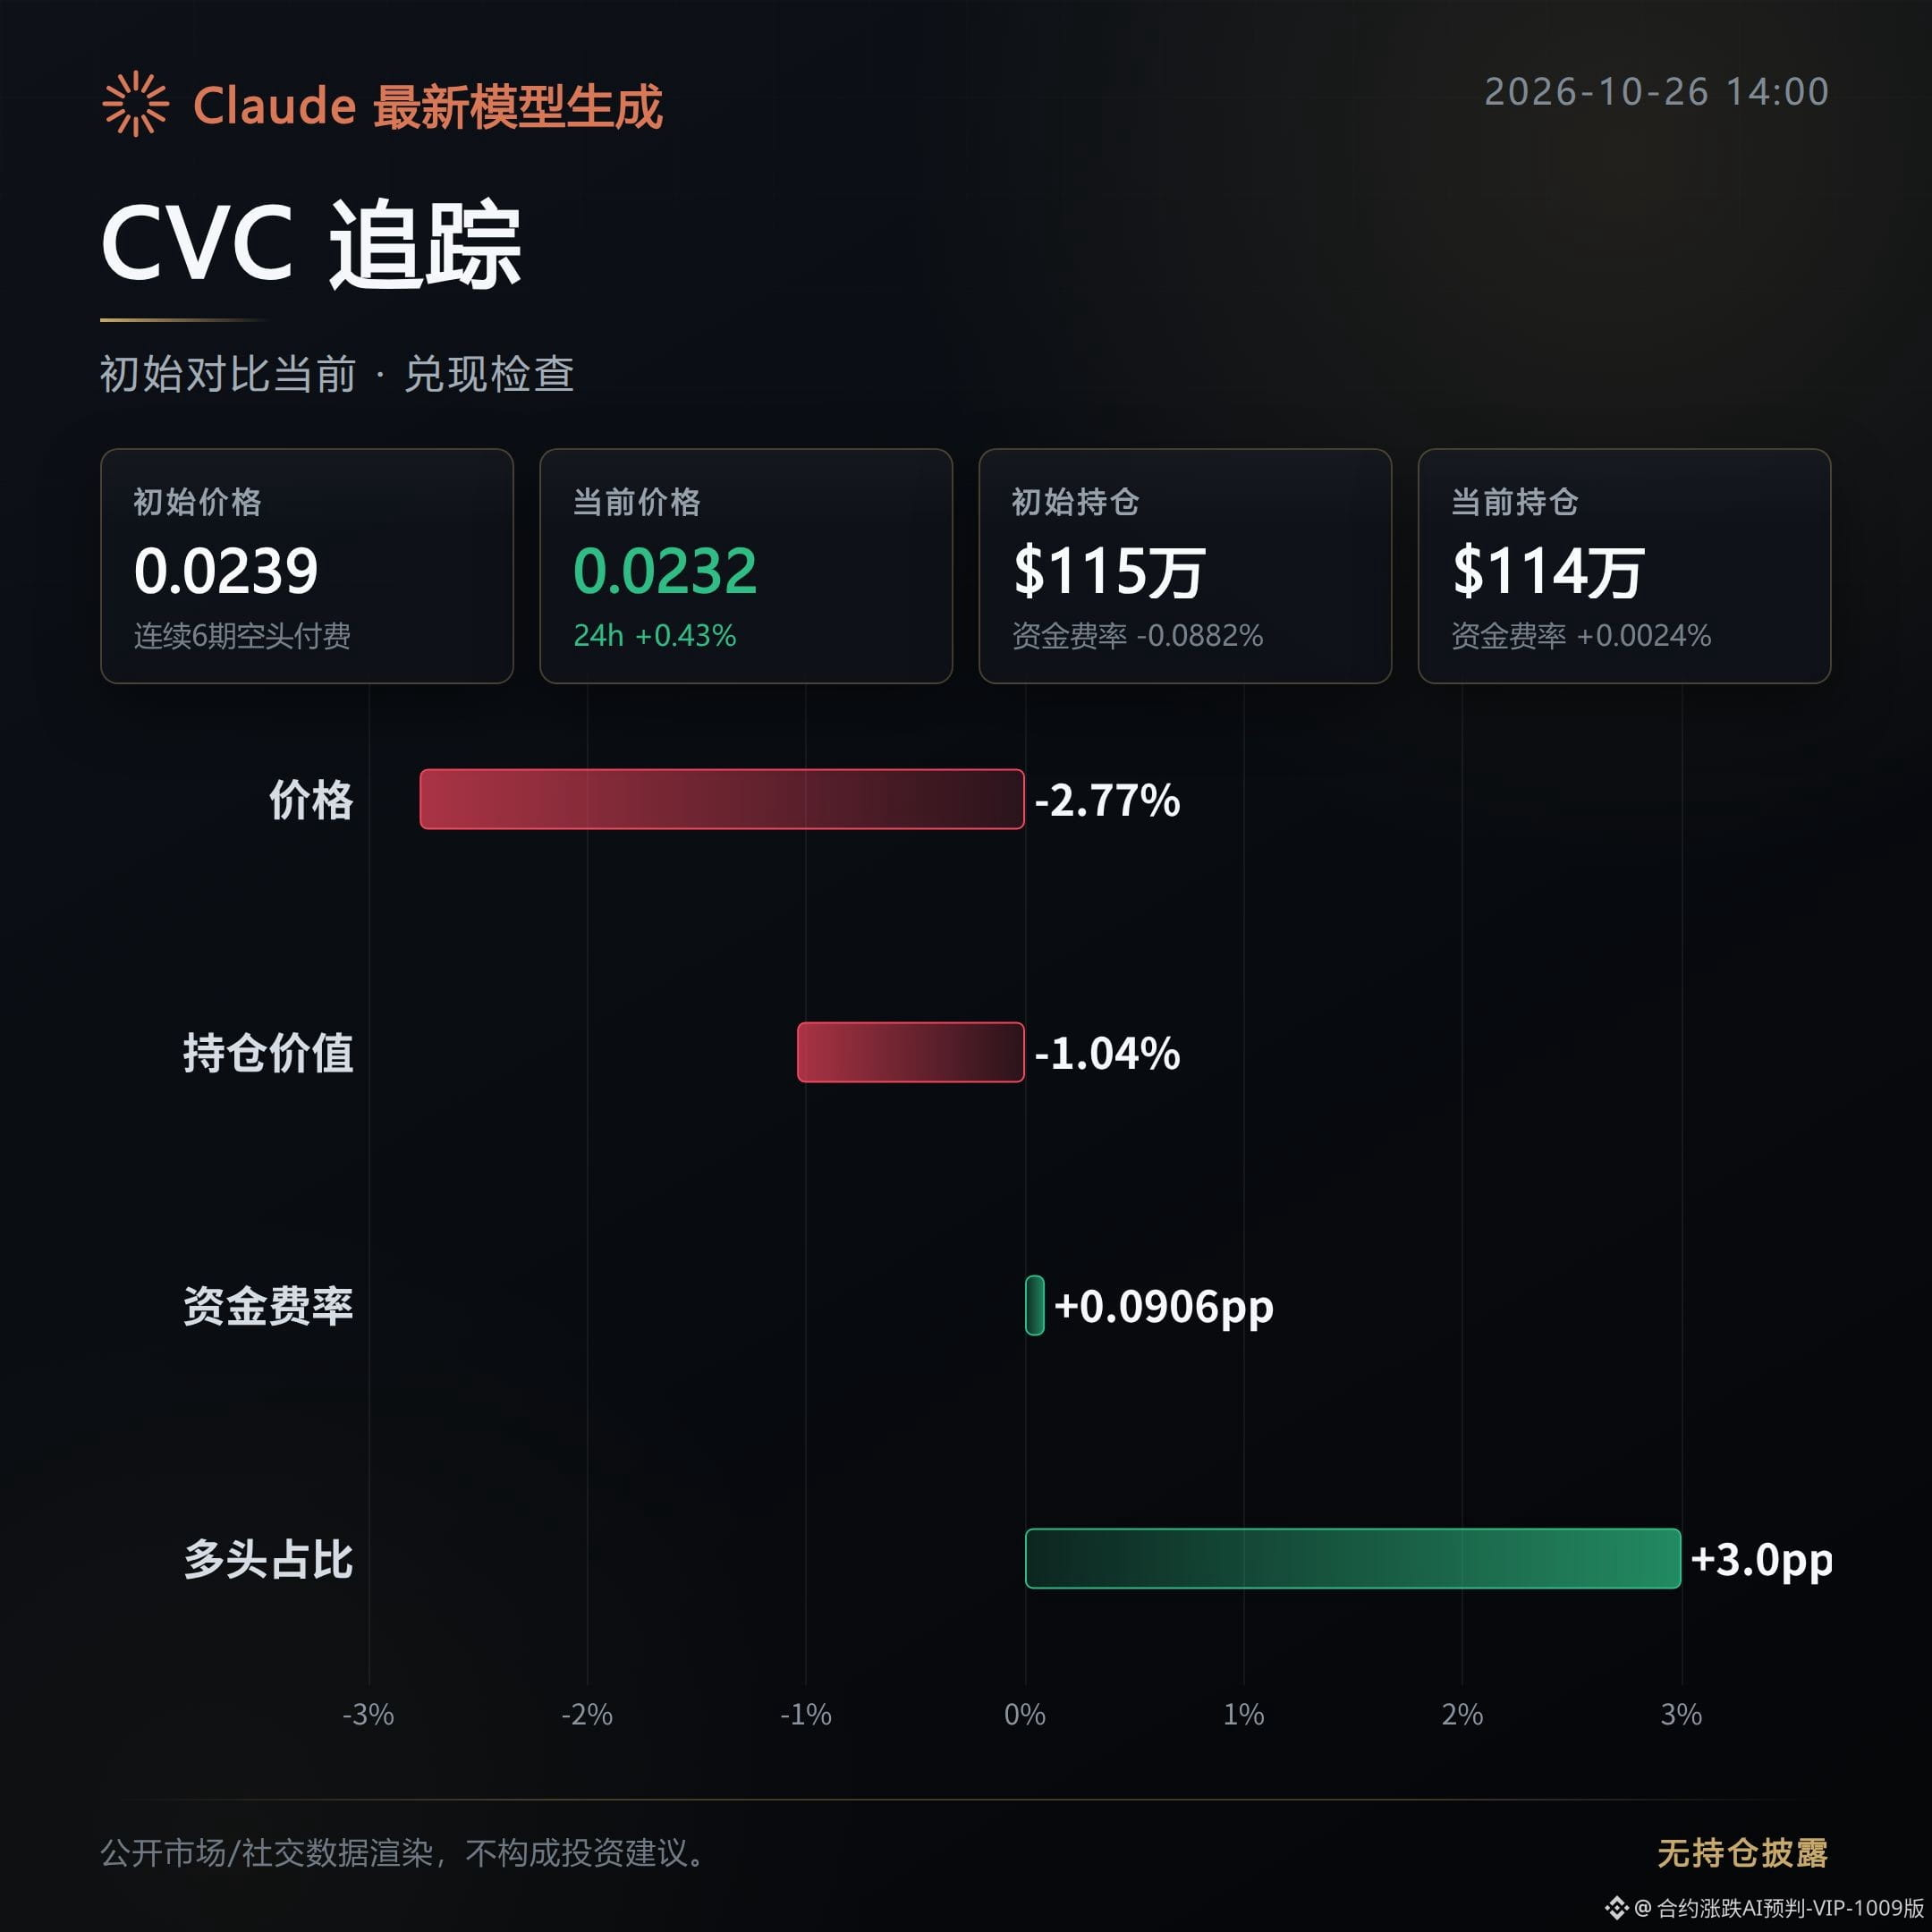
CVC: Choppy; the morning bullish momentum didn’t continue, and the price weakened instead.
Since the initial post, the price has fallen 2.77%, moving away from the bullish outlook.
The active buy/sell ratio has dropped to 0.82, and open interest is also shrinking, indicating that neither buying pressure nor position buildup has provided support.
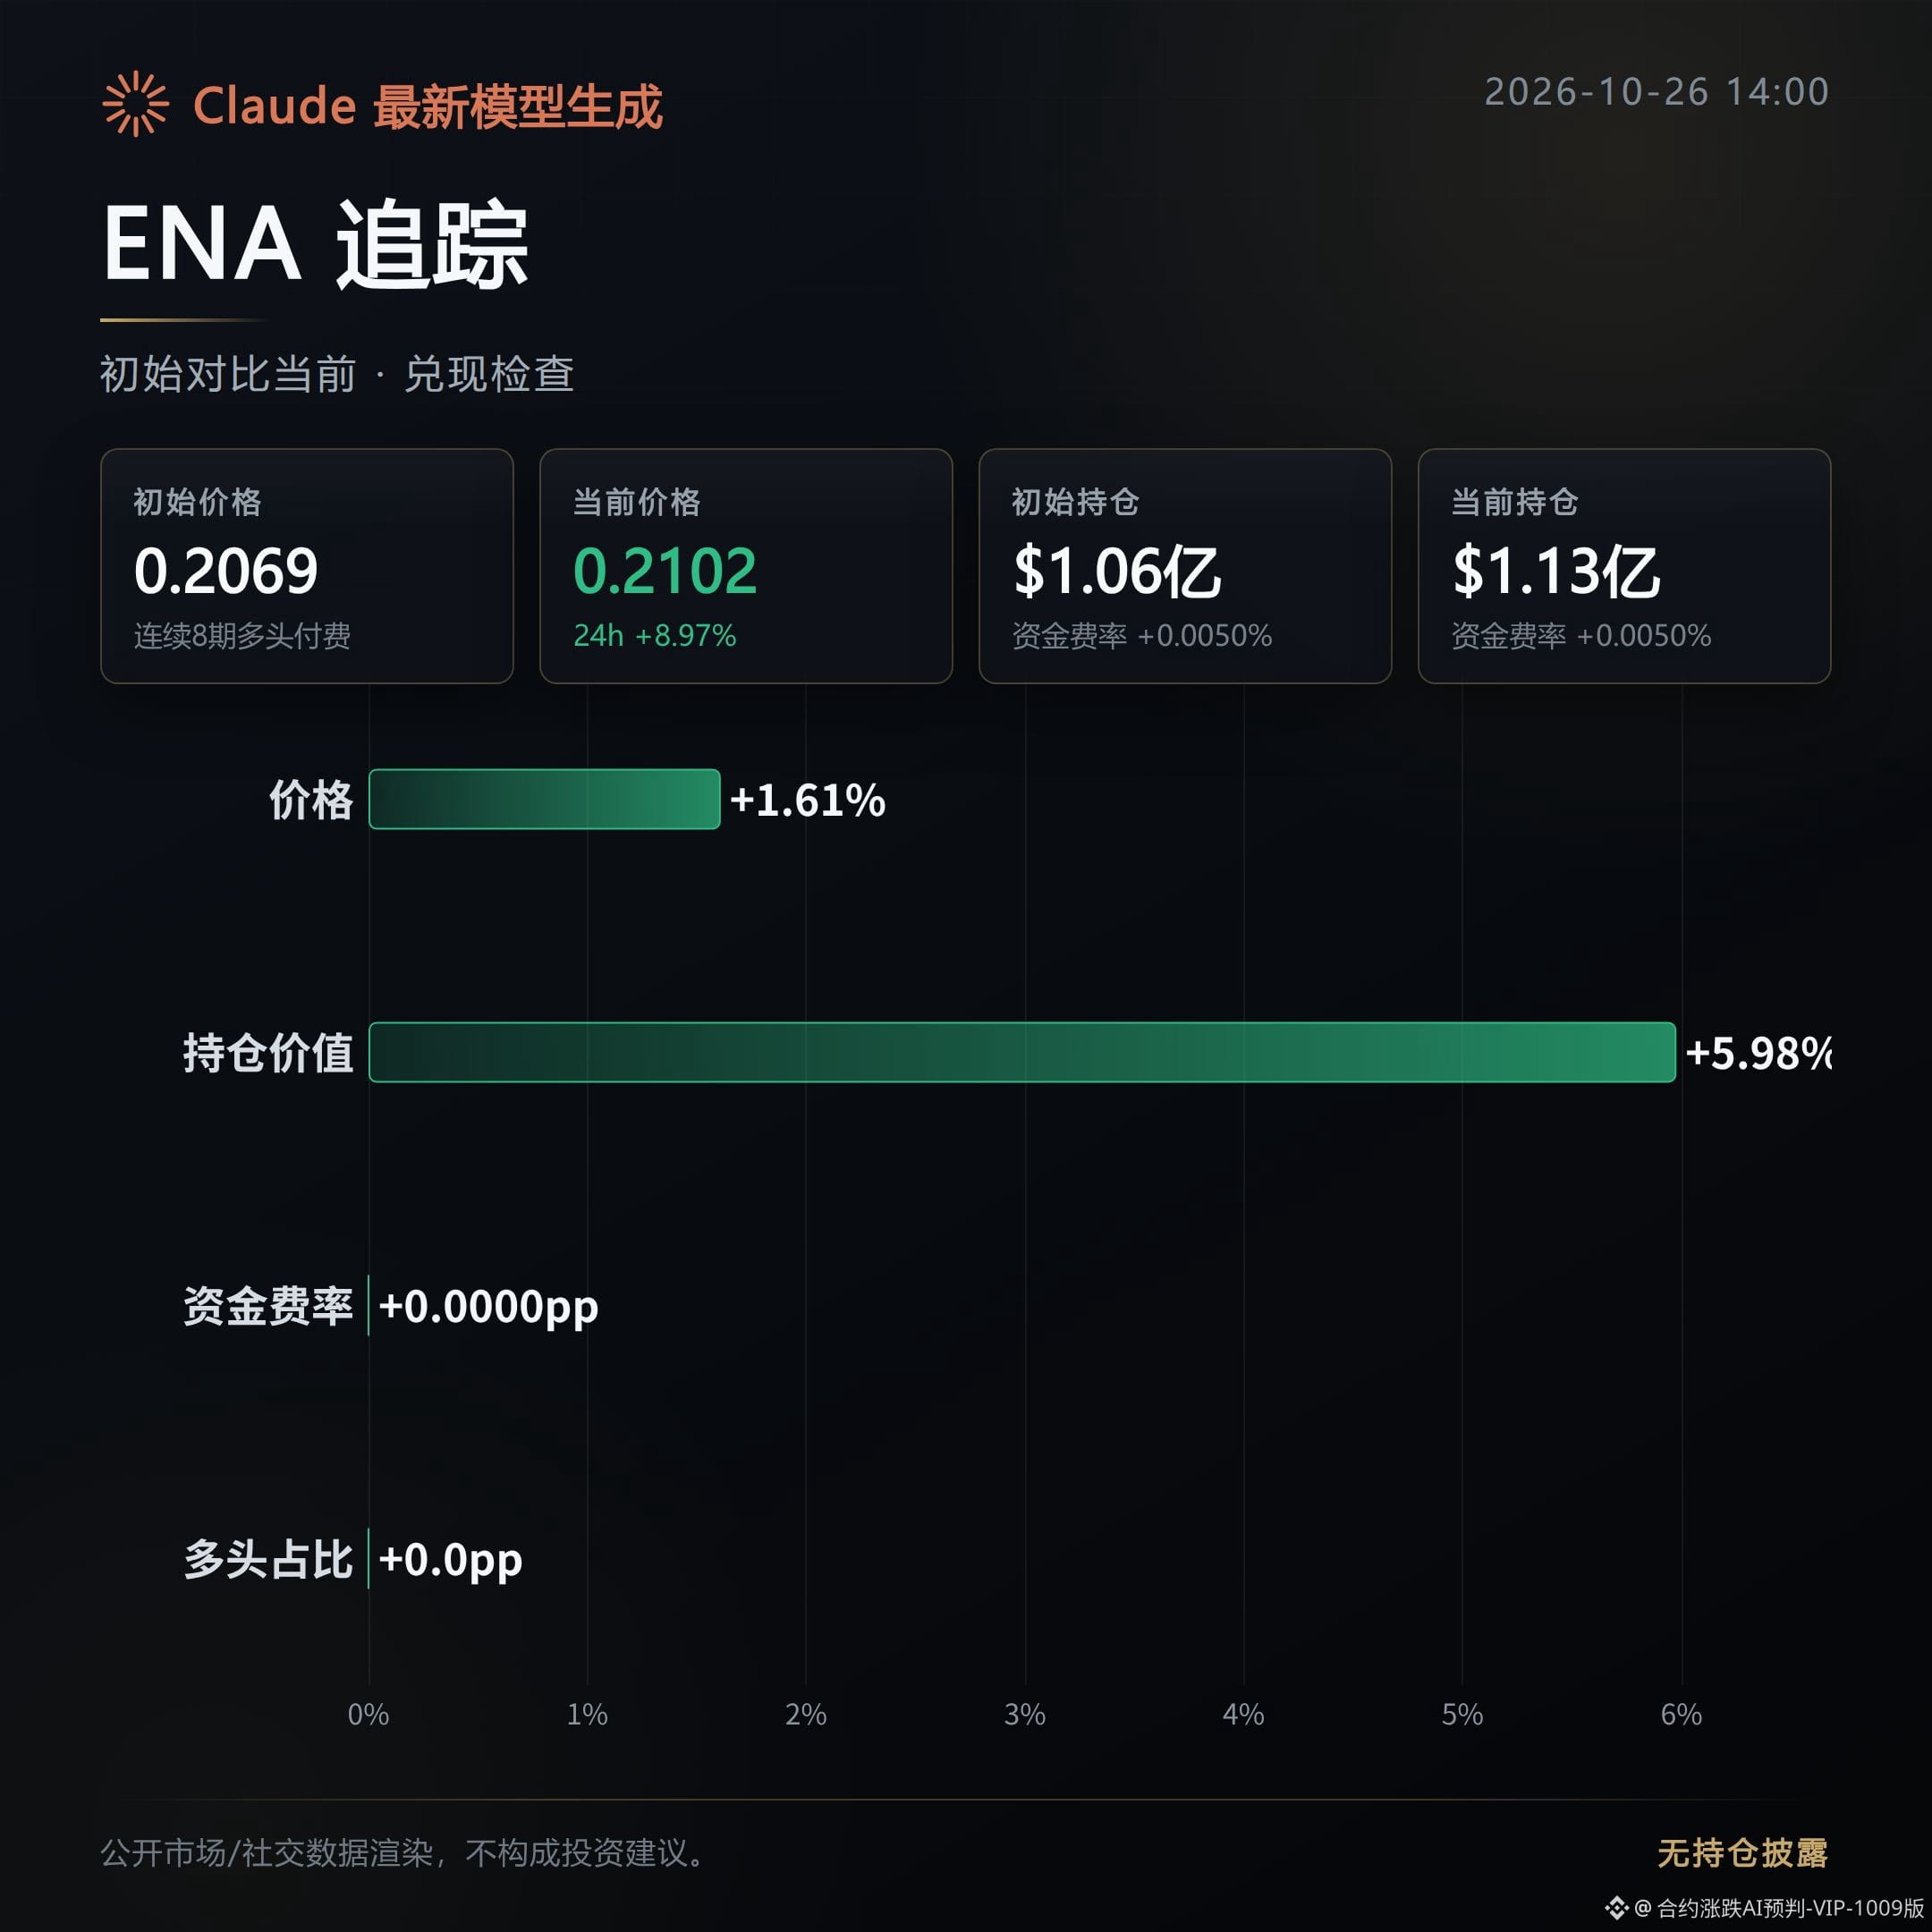
ENA: Choppy; the price has moved in line with the morning bullish outlook, but it’s too early to say the move has played out.
Since the initial post, the price has risen 1.61% and open interest has increased 5.98%, indicating that the move has been supported by rising positions.
However, the buying advantage has changed only slightly, and the price action and capital flows still lack further confirmation of a sustained one-way move.
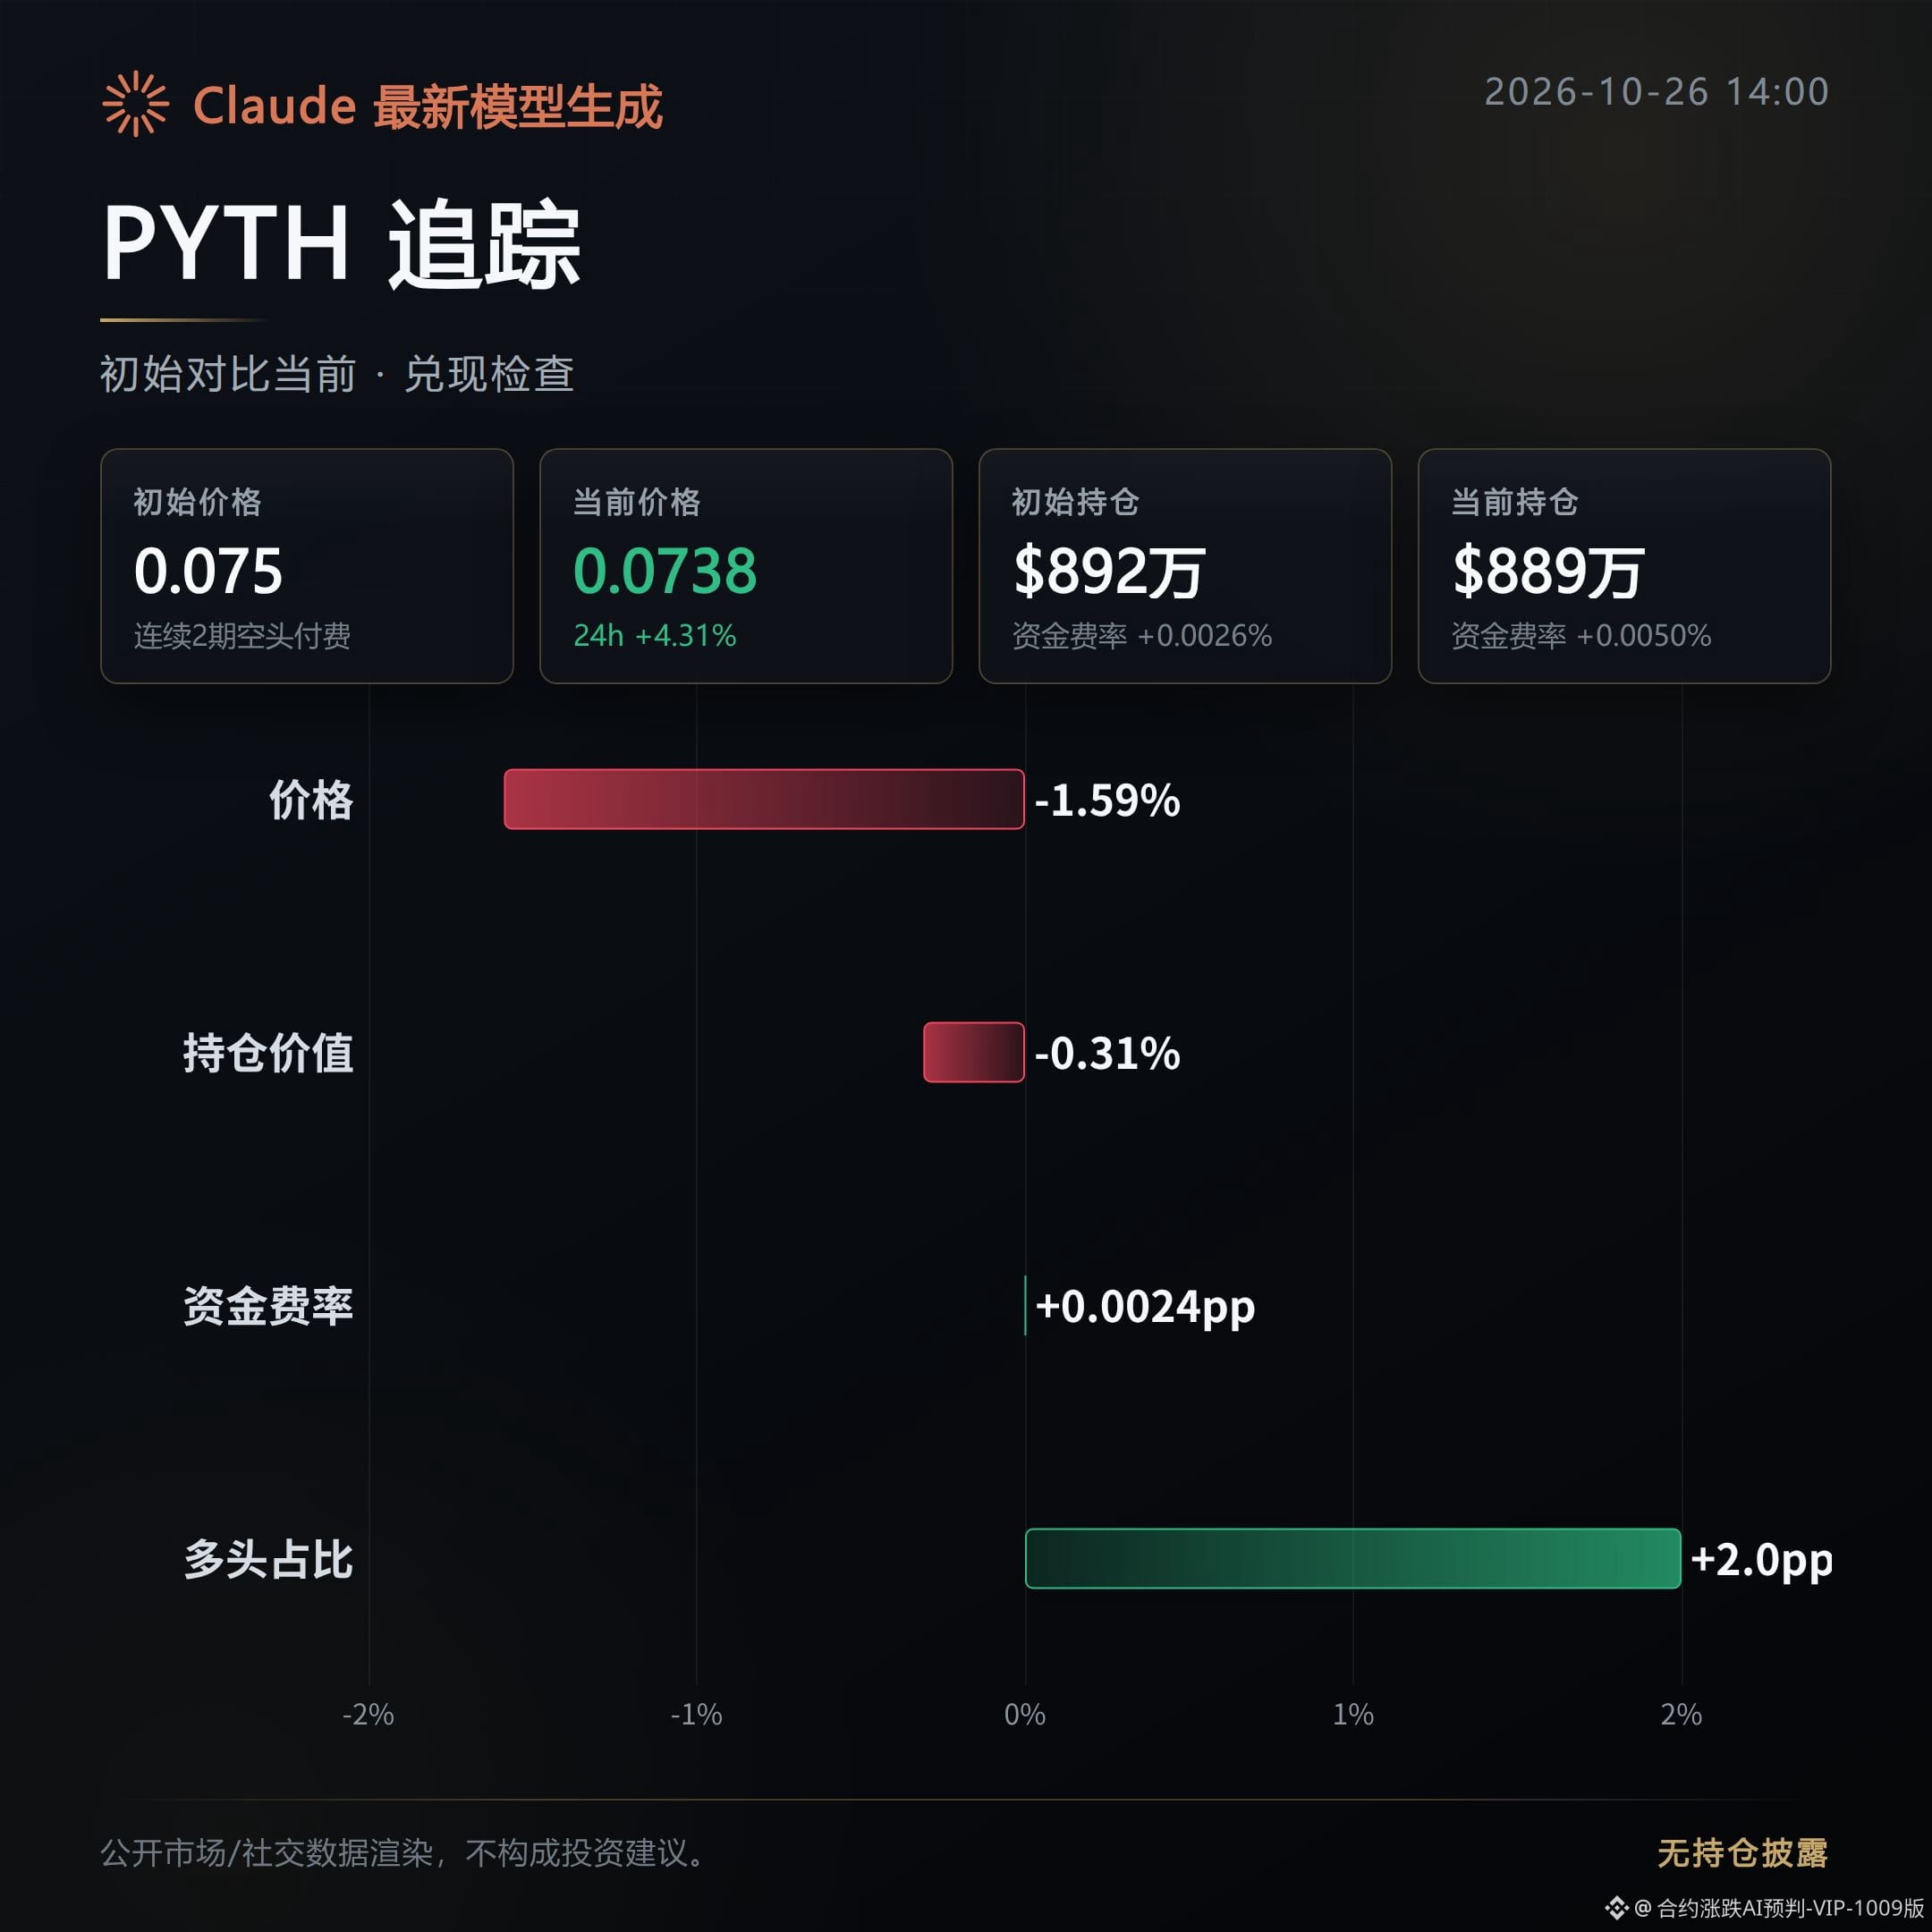
PYTH: Choppy; it has temporarily fallen behind the morning bullish outlook, but active buying has picked up.
Since the initial post, the price has fallen 1.59%, moving against the bullish direction.
The active buy/sell ratio has risen to 1.39, but open interest hasn’t risen alongside it, so for now this can only be viewed as a tug-of-war between bulls and bears.
Next, watch whether prices can resume moving in the bullish direction, and whether open interest and active buying strengthen together.
If prices continue to weaken and open interest keeps falling, that would further invalidate this morning’s bullish watch and warrant a reassessment.
Assisted in generation by Claude Fable 5; for market information only and not investment advice.
Review of the morning bullish/pump watch from about 6 hours ago: 0 of 3 played out, all 3 failed to follow through, and all are currently caught in a tug-of-war.
Recap of the initial watch: positions are being trimmed.
CVC: Choppy; the morning bullish momentum didn’t continue, and the price weakened instead.
Since the initial post, the price has fallen 2.77%, moving away from the bullish outlook.
The active buy/sell ratio has dropped to 0.82, and open interest is also shrinking, indicating that neither buying pressure nor position buildup has provided support.
ENA: Choppy; the price has moved in line with the morning bullish outlook, but it’s too early to say the move has played out.
Since the initial post, the price has risen 1.61% and open interest has increased 5.98%, indicating that the move has been supported by rising positions.
However, the buying advantage has changed only slightly, and the price action and capital flows still lack further confirmation of a sustained one-way move.
PYTH: Choppy; it has temporarily fallen behind the morning bullish outlook, but active buying has picked up.
Since the initial post, the price has fallen 1.59%, moving against the bullish direction.
The active buy/sell ratio has risen to 1.39, but open interest hasn’t risen alongside it, so for now this can only be viewed as a tug-of-war between bulls and bears.
Next, watch whether prices can resume moving in the bullish direction, and whether open interest and active buying strengthen together.
If prices continue to weaken and open interest keeps falling, that would further invalidate this morning’s bullish watch and warrant a reassessment.
Assisted in generation by Claude Fable 5; for market information only and not investment advice.
Recap of the initial watch: positions are being trimmed.
CVC: Choppy; the morning bullish momentum didn’t continue, and the price weakened instead.
Since the initial post, the price has fallen 2.77%, moving away from the bullish outlook.
The active buy/sell ratio has dropped to 0.82, and open interest is also shrinking, indicating that neither buying pressure nor position buildup has provided support.
ENA: Choppy; the price has moved in line with the morning bullish outlook, but it’s too early to say the move has played out.
Since the initial post, the price has risen 1.61% and open interest has increased 5.98%, indicating that the move has been supported by rising positions.
However, the buying advantage has changed only slightly, and the price action and capital flows still lack further confirmation of a sustained one-way move.
PYTH: Choppy; it has temporarily fallen behind the morning bullish outlook, but active buying has picked up.
Since the initial post, the price has fallen 1.59%, moving against the bullish direction.
The active buy/sell ratio has risen to 1.39, but open interest hasn’t risen alongside it, so for now this can only be viewed as a tug-of-war between bulls and bears.
Next, watch whether prices can resume moving in the bullish direction, and whether open interest and active buying strengthen together.
If prices continue to weaken and open interest keeps falling, that would further invalidate this morning’s bullish watch and warrant a reassessment.
Assisted in generation by Claude Fable 5; for market information only and not investment advice.
198
Derivatives Market Daily | 10/26: $80,000 breached, crowding unresolved
Our previous note that “deleveraging at the $80,000 level is not over” has been borne out.
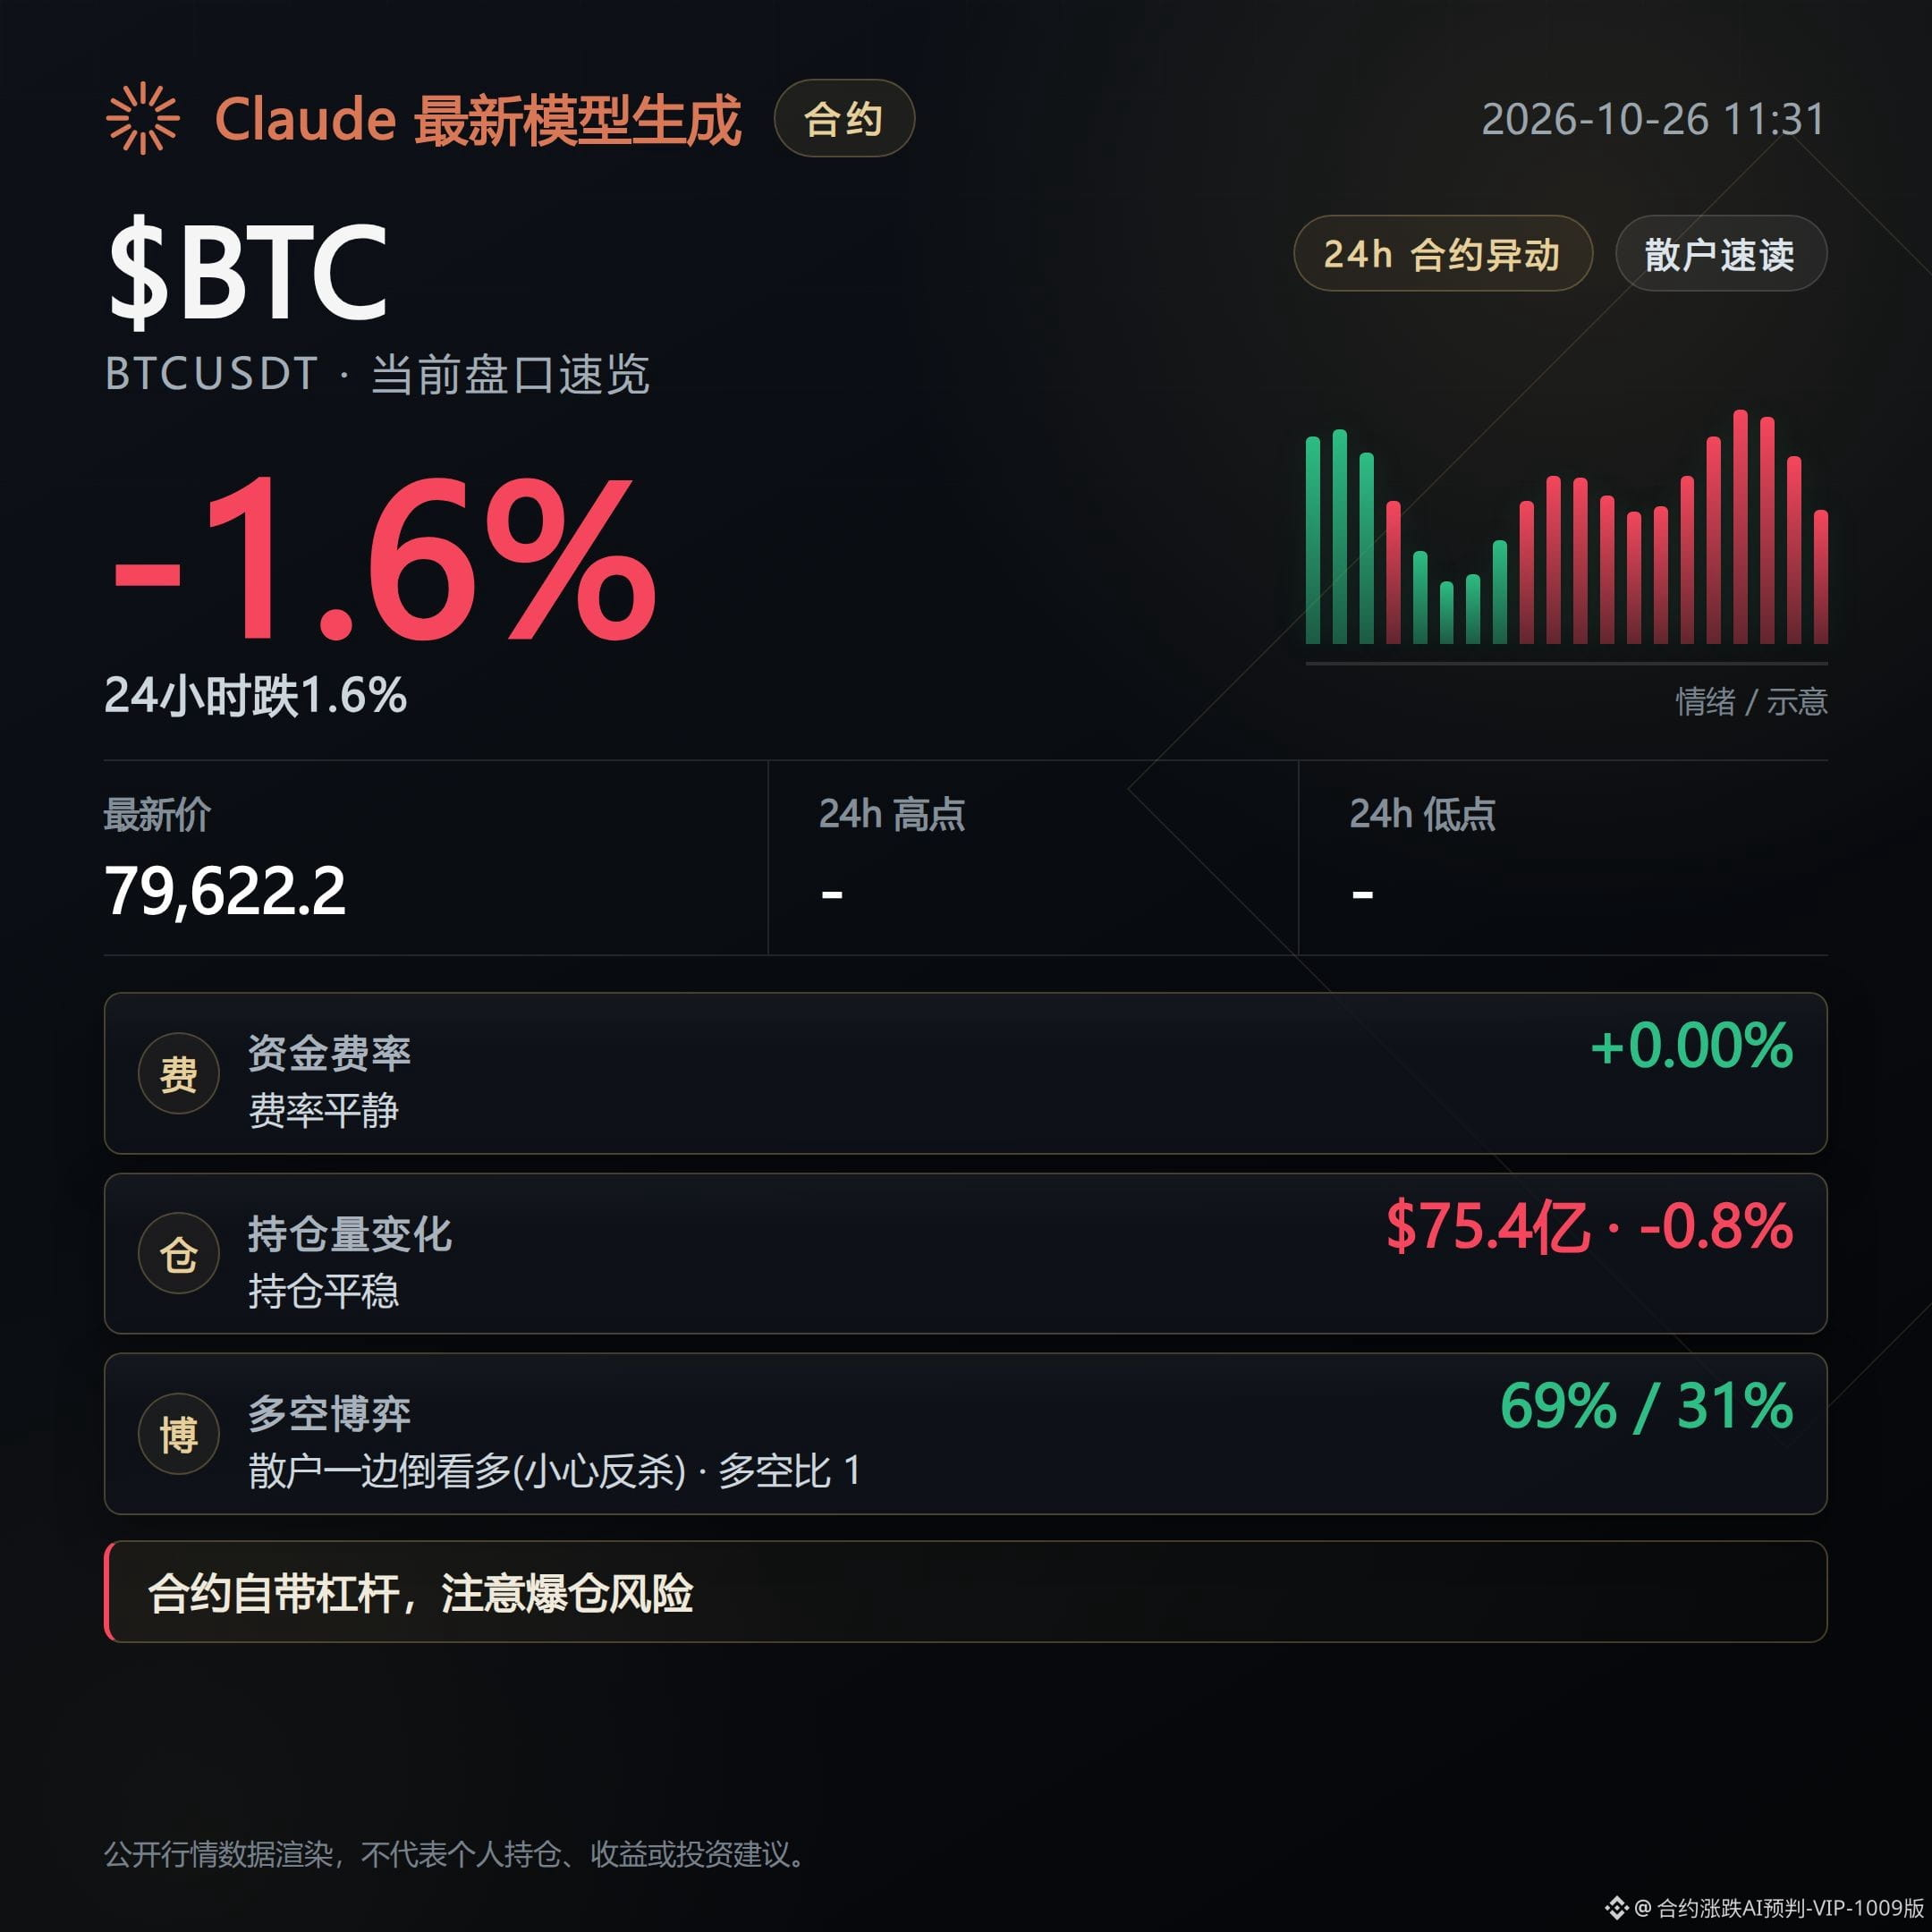
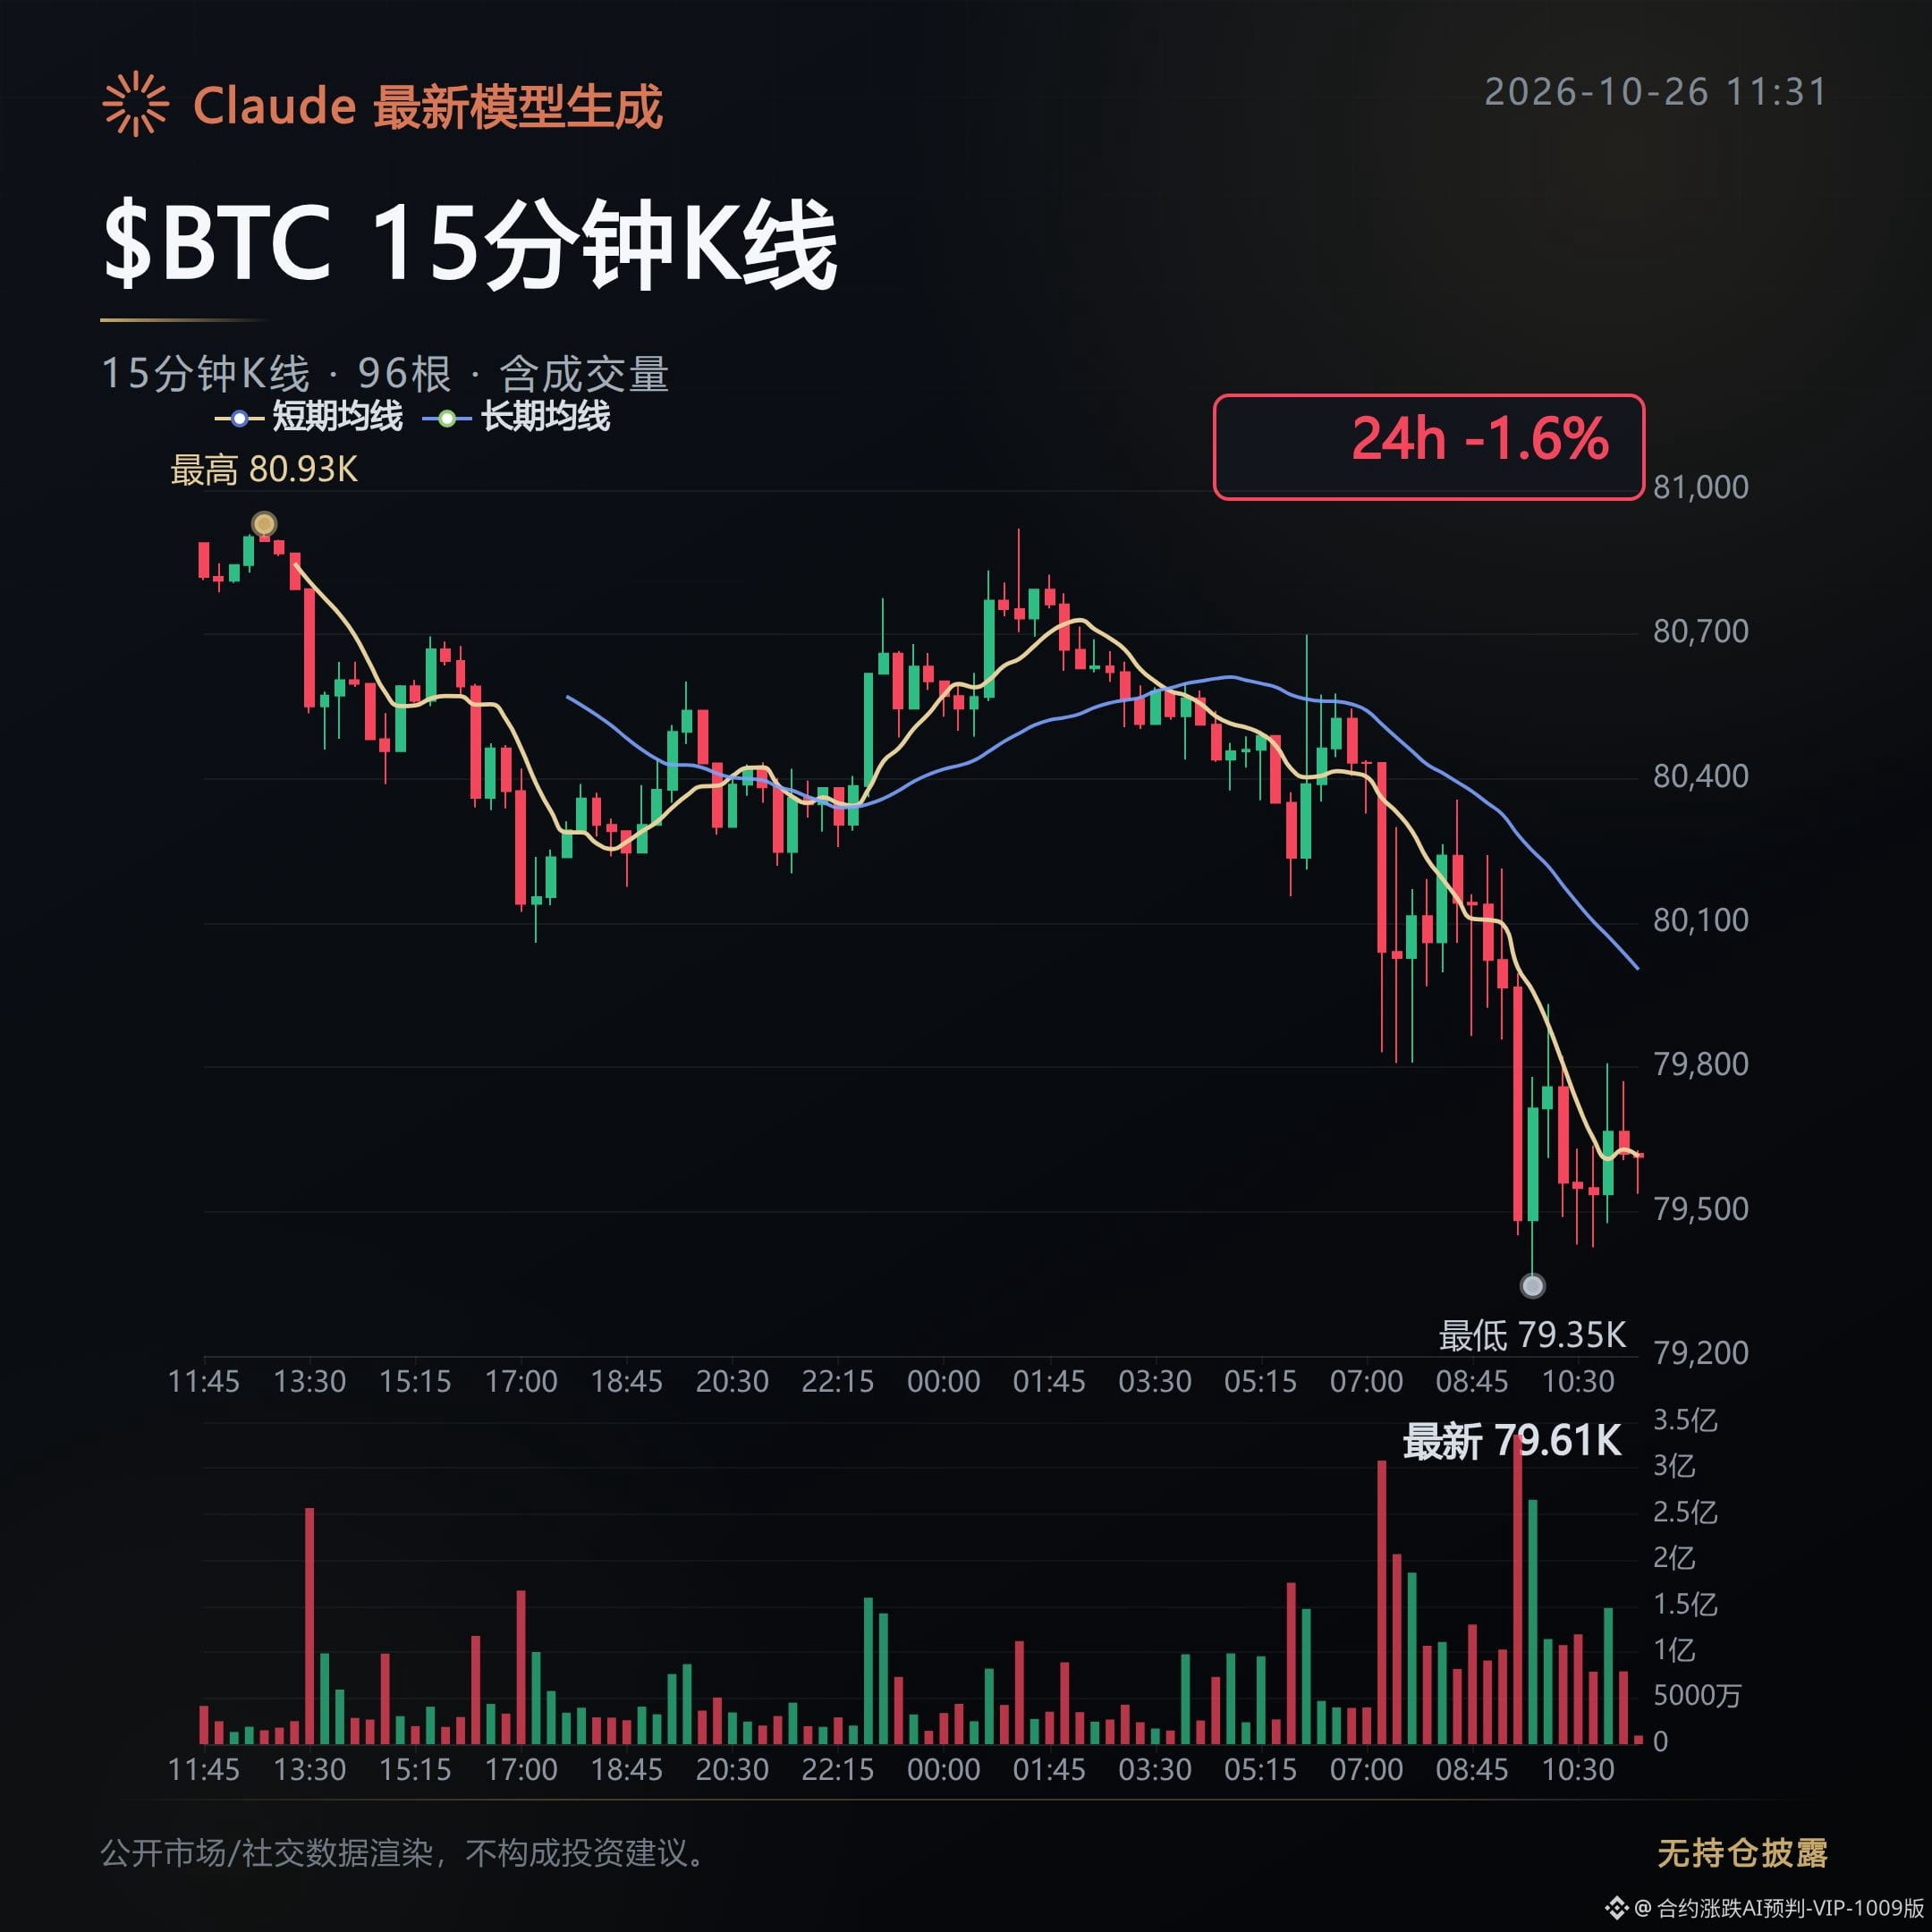
$BTC’s midday mark price was $79,622, down 1.59%. It briefly fell below $80,000, and approximately $404 million in long positions across the market were liquidated within four hours.
But open interest fell only 0.8% to $7.54 billion, suggesting that some leverage has exited, but the market is far from fully flushed out.
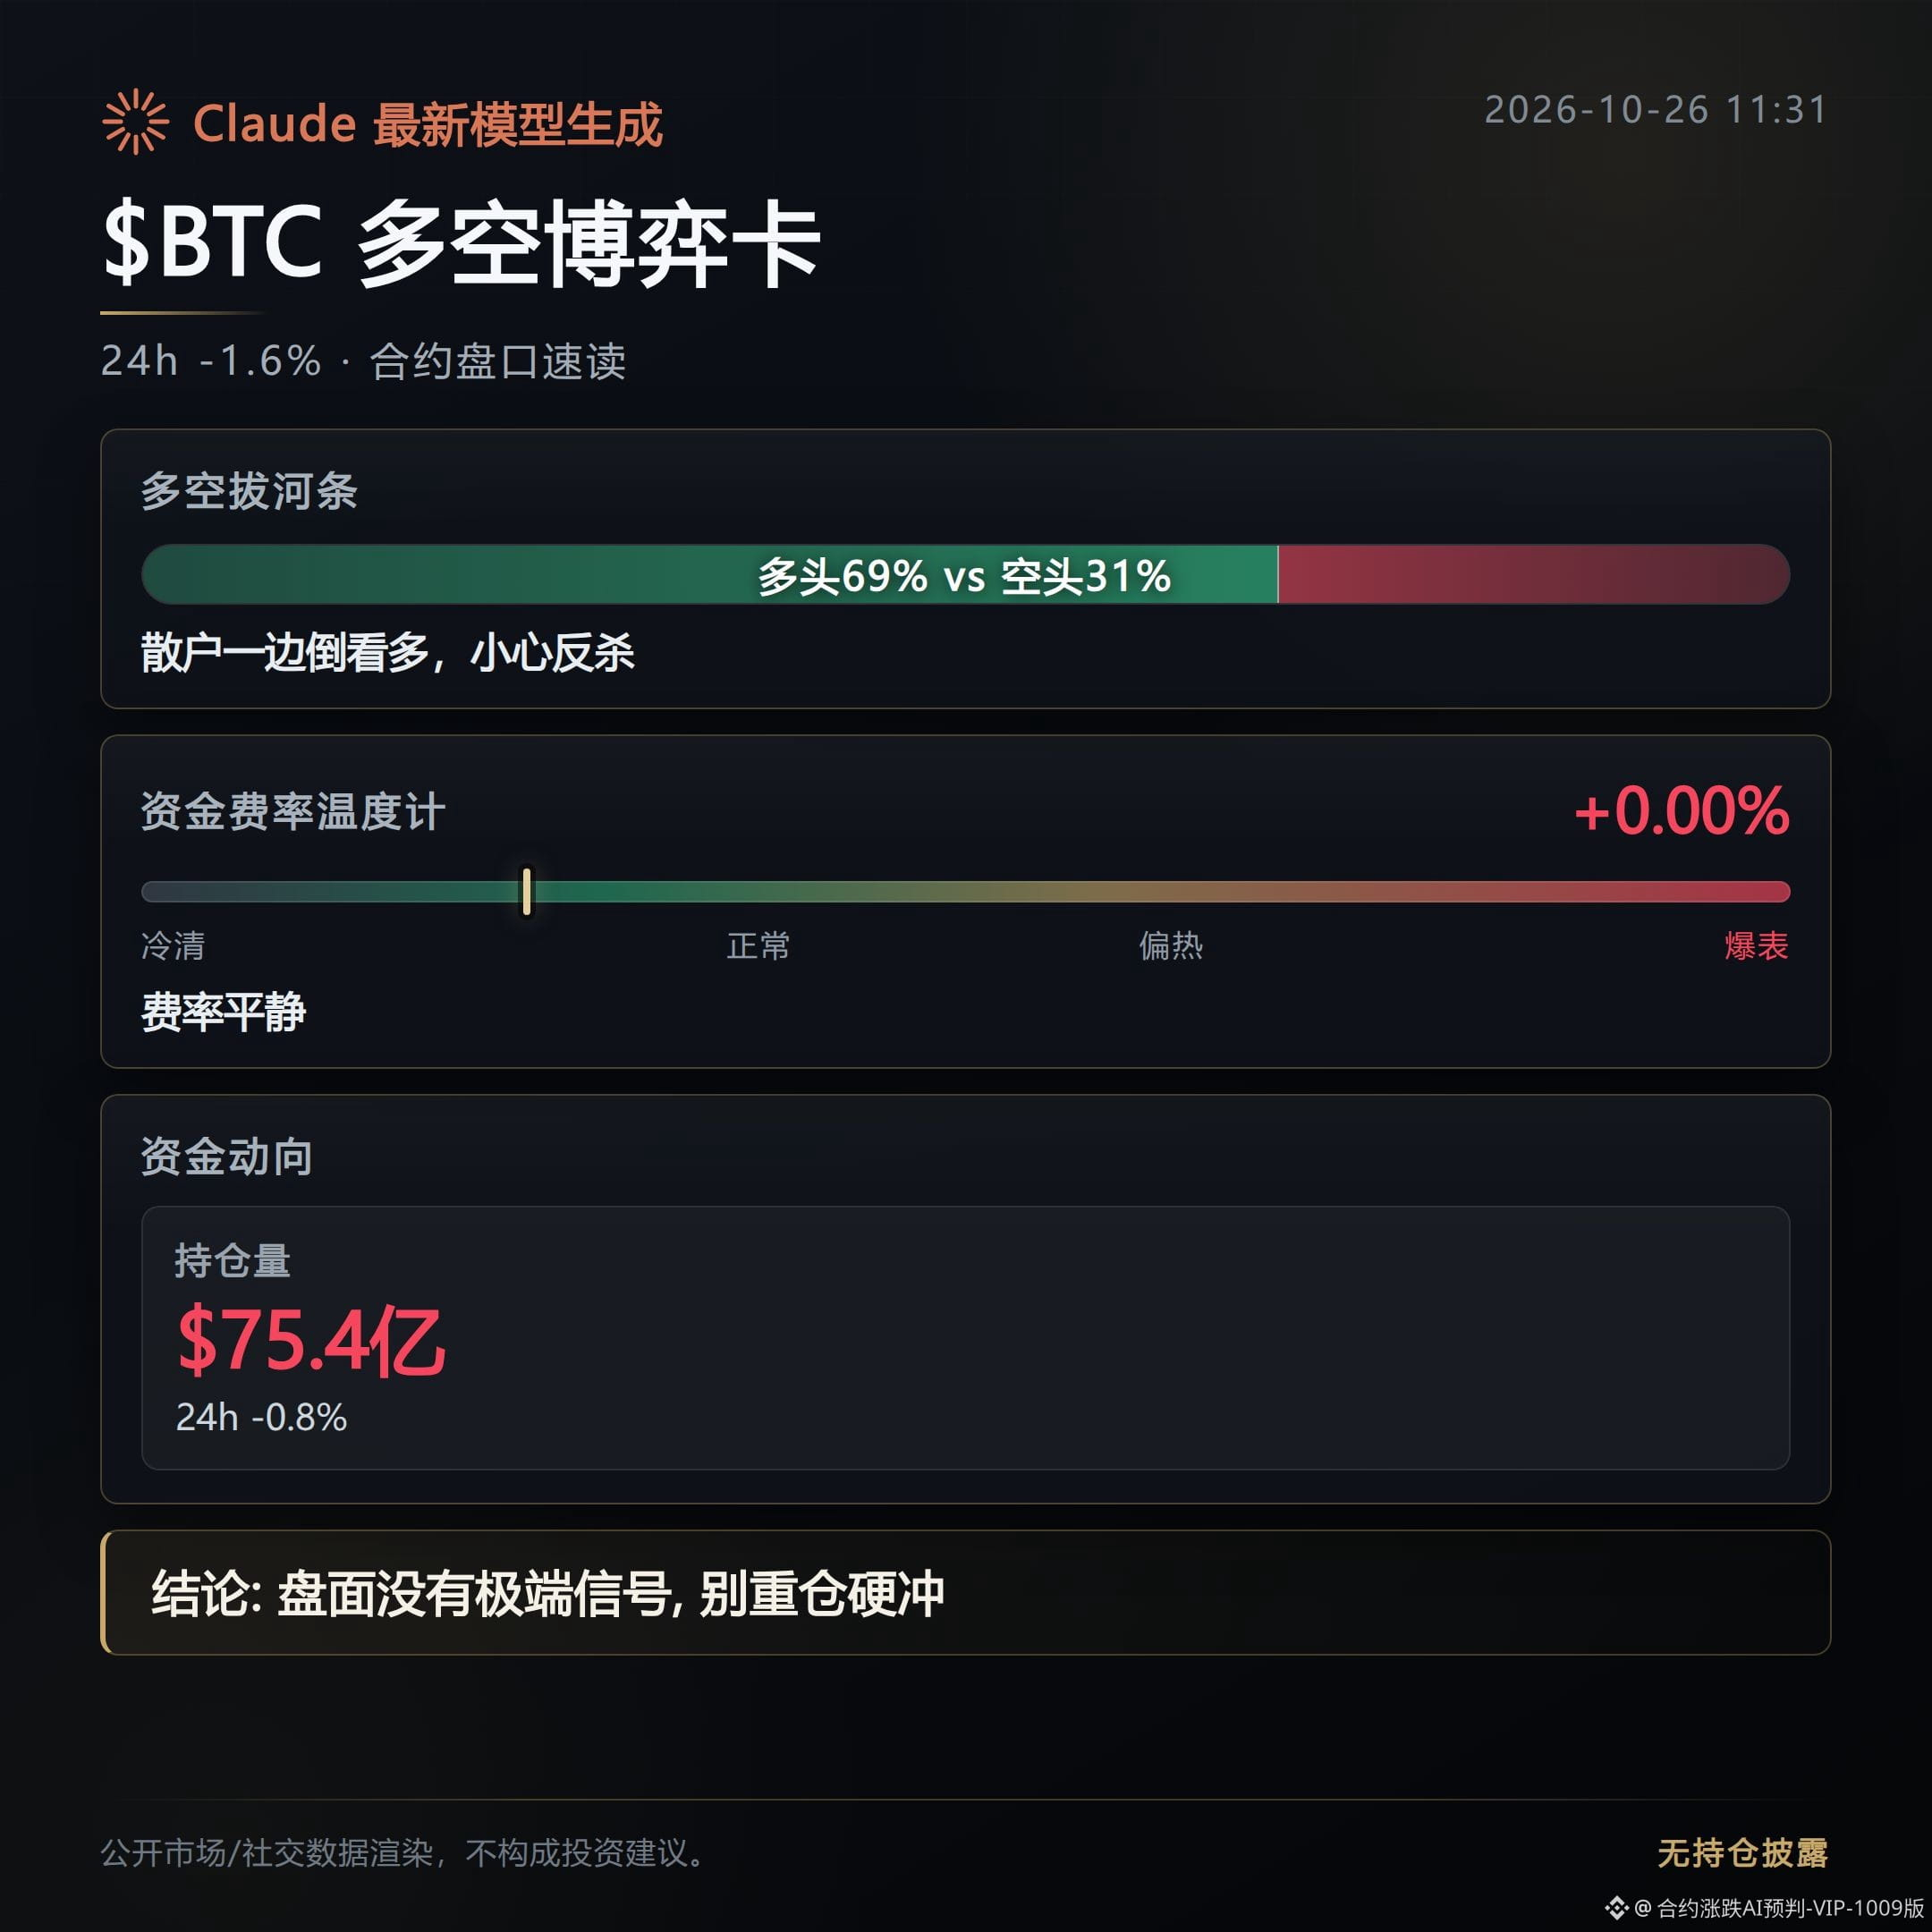
More concerning, the proportion of $BTC longs remains at 69%, while the funding rate has stayed positive at 0.0039%.
The active buy/sell ratio is 1.01, only slightly above the neutral level—not enough to show that prices below $80,000 have found solid support.
$ETH fell 2.47% and $SOL fell 1.87%, while their funding rates remained positive at 0.0053% and 0.01%, respectively. Longs are still paying to hold their positions as prices weaken, so the risk from crowded positioning has not gone away.
Spot markets have not completely lost support.
Bitcoin spot ETFs saw net inflows of $301 million over the full week, but flows had turned negative by the weekend, suggesting that mid-term capital remains while short-term follow-through is weakening.
The sentiment reading is holding at 50, which also means the market has not entered panic territory. A single liquidation event should not be mistaken for a bottom.
Funding rates in smaller contracts show pressure building at both extremes.
UNITREE’s funding rate has dropped to -0.932%, while BOT and EWZ are at -0.787% and -0.669%, respectively. Shorts are overly concentrated, making a rebound prone to triggering forced short covering.
At the other end, USDBRL’s funding rate has climbed to +0.375%, signaling a clear risk of crowded longs as well.
The key risk level at midday remains $80,000.
A move back above that level, a halt in the decline in open interest, and continued strengthening in active buying would be needed to confirm that support is taking hold. If prices remain below it while the proportion of longs stays near 69%, the pressure from another round of liquidations has not gone away.
Generated with assistance from Claude Fable 5; for market information only, not investment advice.
Derivatives Market Daily | 10/26: $80,000 breached, crowding unresolved
Our previous note that “deleveraging at the $80,000 level is not over” has been borne out.
$BTC ’s midday mark price was $79,622, down 1.59%. It briefly fell below $80,000, and approximately $404 million in long positions across the market were liquidated within four hours.
But open interest fell only 0.8% to $7.54 billion, suggesting that some leverage has exited, but the market is far from fully flushed out.
More concerning, the proportion of $BTC longs remains at 69%, while the funding rate has stayed positive at 0.0039%.
The active buy/sell ratio is 1.01, only slightly above the neutral level—not enough to show that prices below $80,000 have found solid support.
$ETH fell 2.47% and $SOL fell 1.87%, while their funding rates remained positive at 0.0053% and 0.01%, respectively. Longs are still paying to hold their positions as prices weaken, so the risk from crowded positioning has not gone away.
Spot markets have not completely lost support.
Bitcoin spot ETFs saw net inflows of $301 million over the full week, but flows had turned negative by the weekend, suggesting that mid-term capital remains while short-term follow-through is weakening.
The sentiment reading is holding at 50, which also means the market has not entered panic territory. A single liquidation event should not be mistaken for a bottom.
Funding rates in smaller contracts show pressure building at both extremes.
UNITREE’s funding rate has dropped to -0.932%, while BOT and EWZ are at -0.787% and -0.669%, respectively. Shorts are overly concentrated, making a rebound prone to triggering forced short covering.
At the other end, USDBRL’s funding rate has climbed to +0.375%, signaling a clear risk of crowded longs as well.
The key risk level at midday remains $80,000.
A move back above that level, a halt in the decline in open interest, and continued strengthening in active buying would be needed to confirm that support is taking hold. If prices remain below it while the proportion of longs stays near 69%, the pressure from another round of liquidations has not gone away.
Generated with assistance from Claude Fable 5; for market information only, not investment advice.
Our previous note that “deleveraging at the $80,000 level is not over” has been borne out.
$BTC ’s midday mark price was $79,622, down 1.59%. It briefly fell below $80,000, and approximately $404 million in long positions across the market were liquidated within four hours.
But open interest fell only 0.8% to $7.54 billion, suggesting that some leverage has exited, but the market is far from fully flushed out.
More concerning, the proportion of $BTC longs remains at 69%, while the funding rate has stayed positive at 0.0039%.
The active buy/sell ratio is 1.01, only slightly above the neutral level—not enough to show that prices below $80,000 have found solid support.
$ETH fell 2.47% and $SOL fell 1.87%, while their funding rates remained positive at 0.0053% and 0.01%, respectively. Longs are still paying to hold their positions as prices weaken, so the risk from crowded positioning has not gone away.
Spot markets have not completely lost support.
Bitcoin spot ETFs saw net inflows of $301 million over the full week, but flows had turned negative by the weekend, suggesting that mid-term capital remains while short-term follow-through is weakening.
The sentiment reading is holding at 50, which also means the market has not entered panic territory. A single liquidation event should not be mistaken for a bottom.
Funding rates in smaller contracts show pressure building at both extremes.
UNITREE’s funding rate has dropped to -0.932%, while BOT and EWZ are at -0.787% and -0.669%, respectively. Shorts are overly concentrated, making a rebound prone to triggering forced short covering.
At the other end, USDBRL’s funding rate has climbed to +0.375%, signaling a clear risk of crowded longs as well.
The key risk level at midday remains $80,000.
A move back above that level, a halt in the decline in open interest, and continued strengthening in active buying would be needed to confirm that support is taking hold. If prices remain below it while the proportion of longs stays near 69%, the pressure from another round of liquidations has not gone away.
Generated with assistance from Claude Fable 5; for market information only, not investment advice.
175
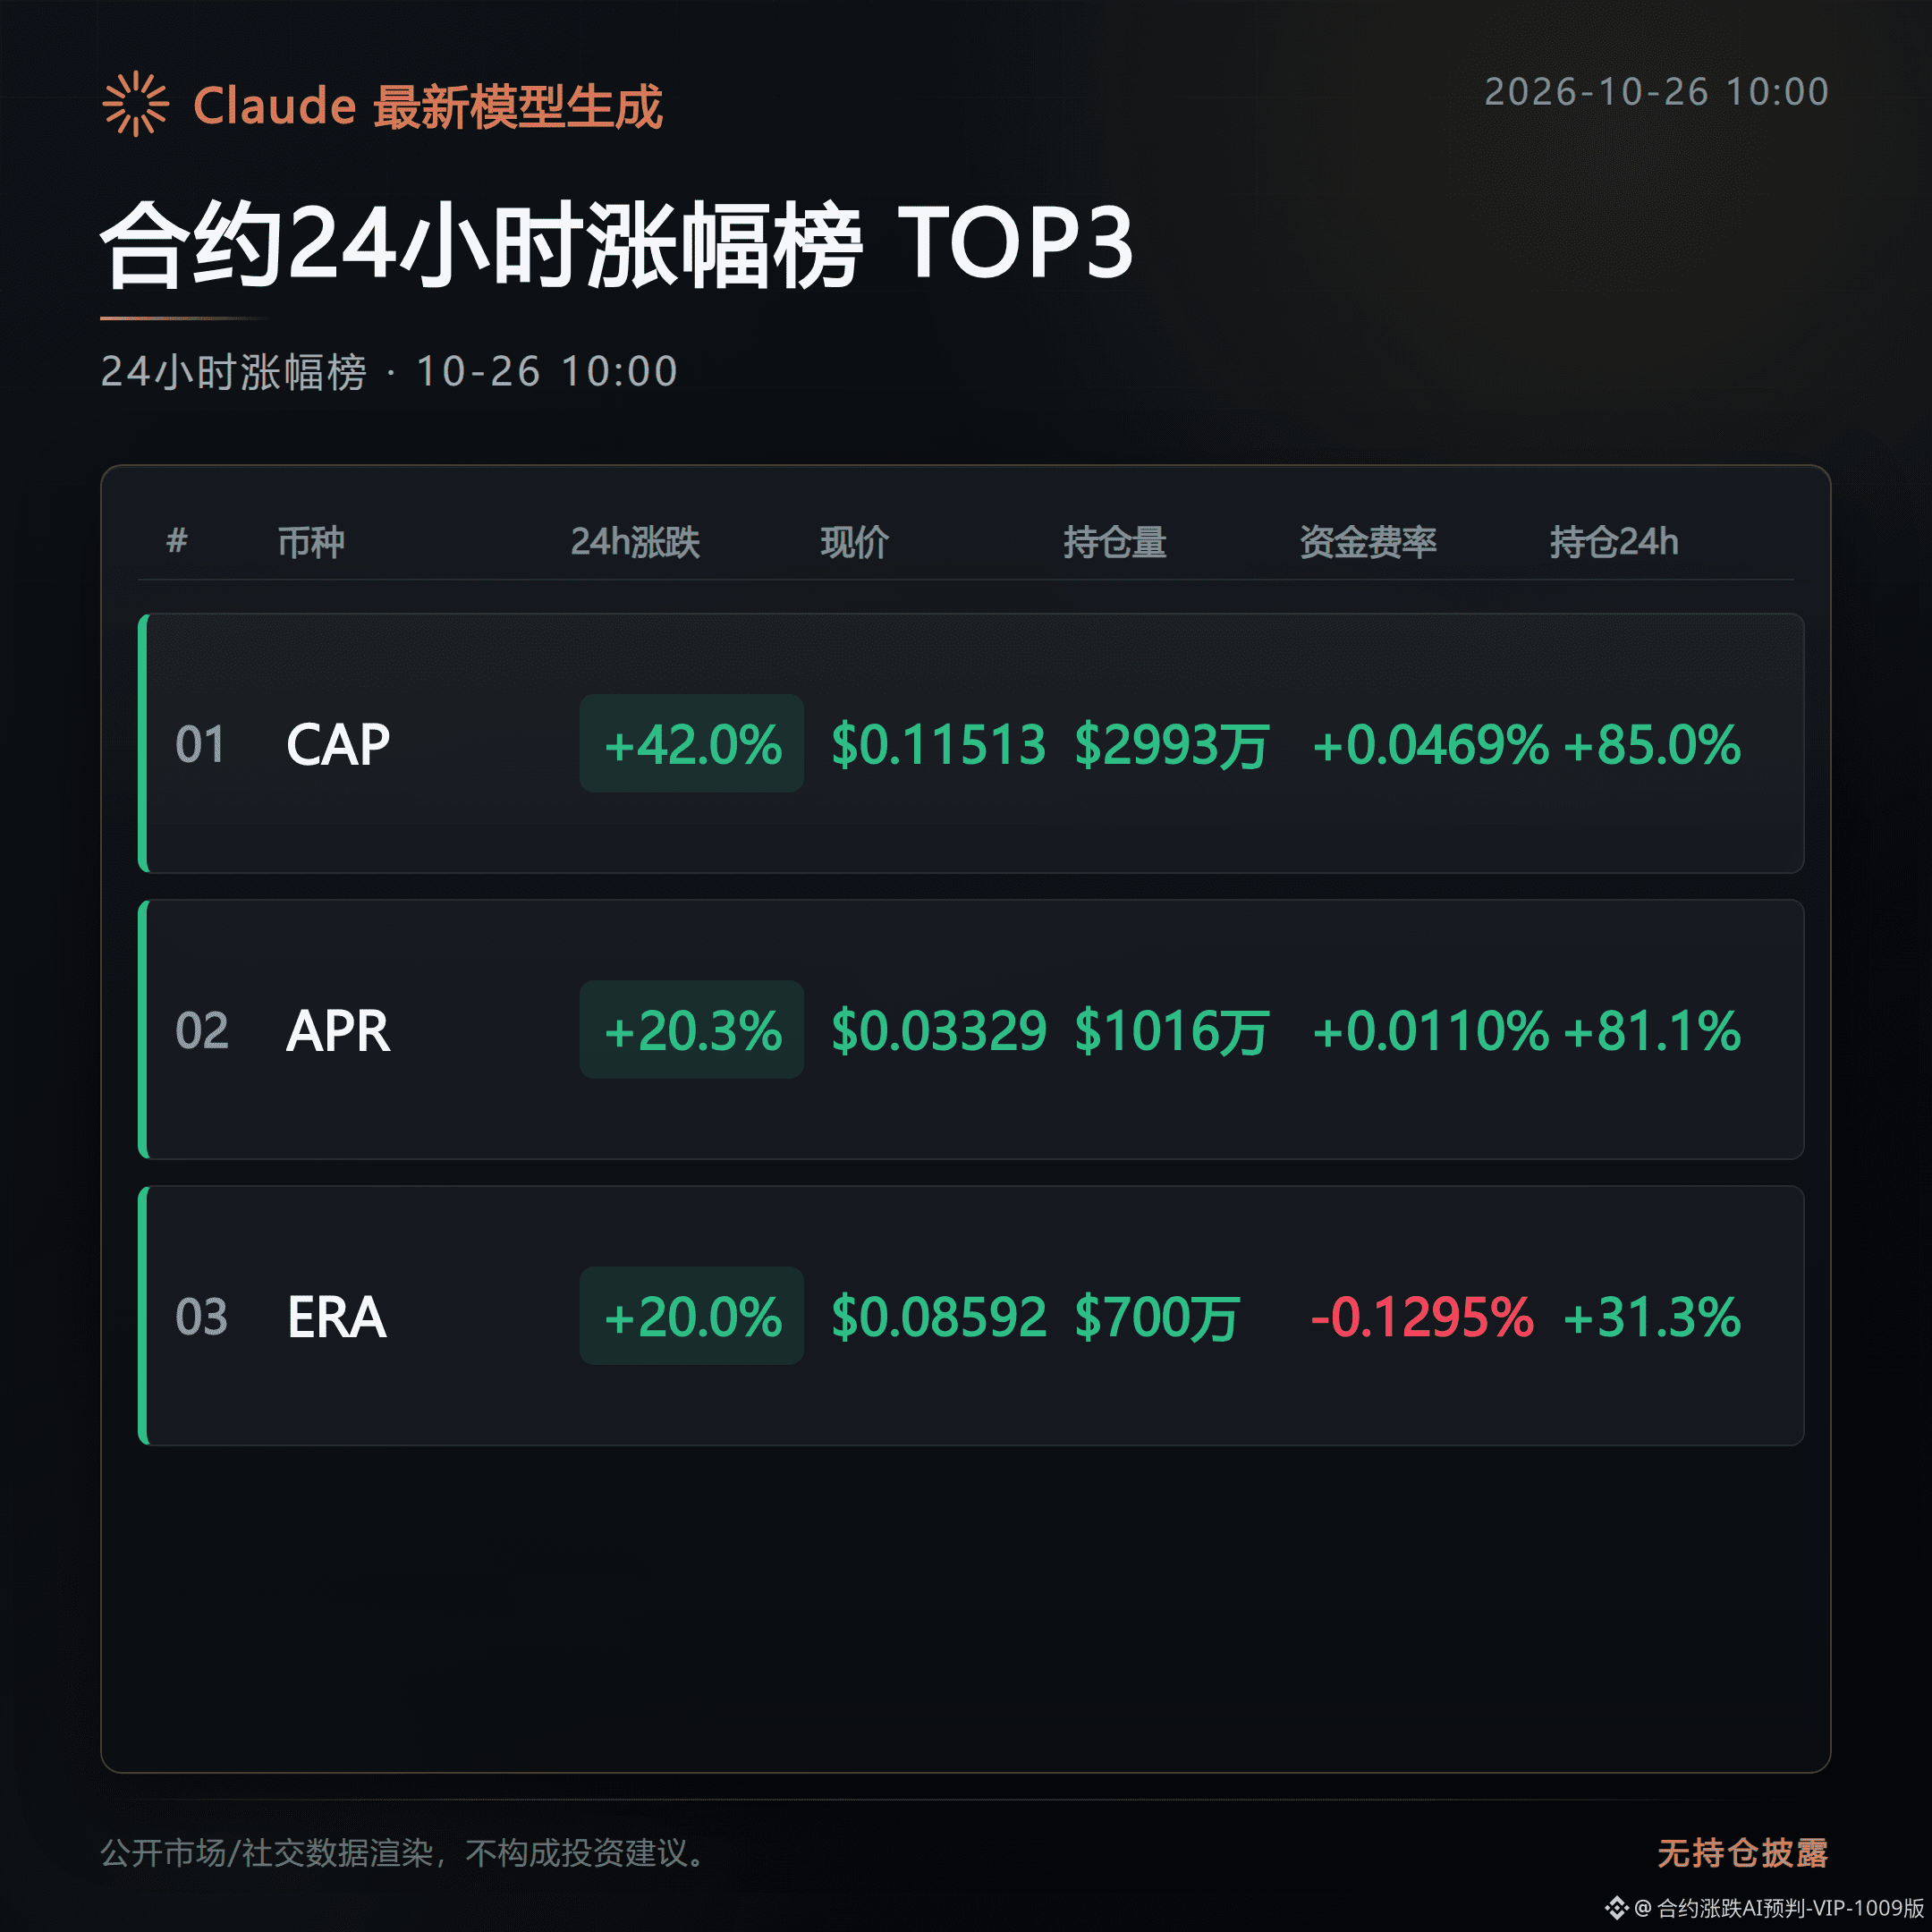
The top 3 gainers on Binance Futures over the past 24 hours are CAP, APR, and ERA.
A quick rundown for those watching the markets this morning. Today, focus on just one verifiable signal: whether the price rise is accompanied by an increase in open interest.
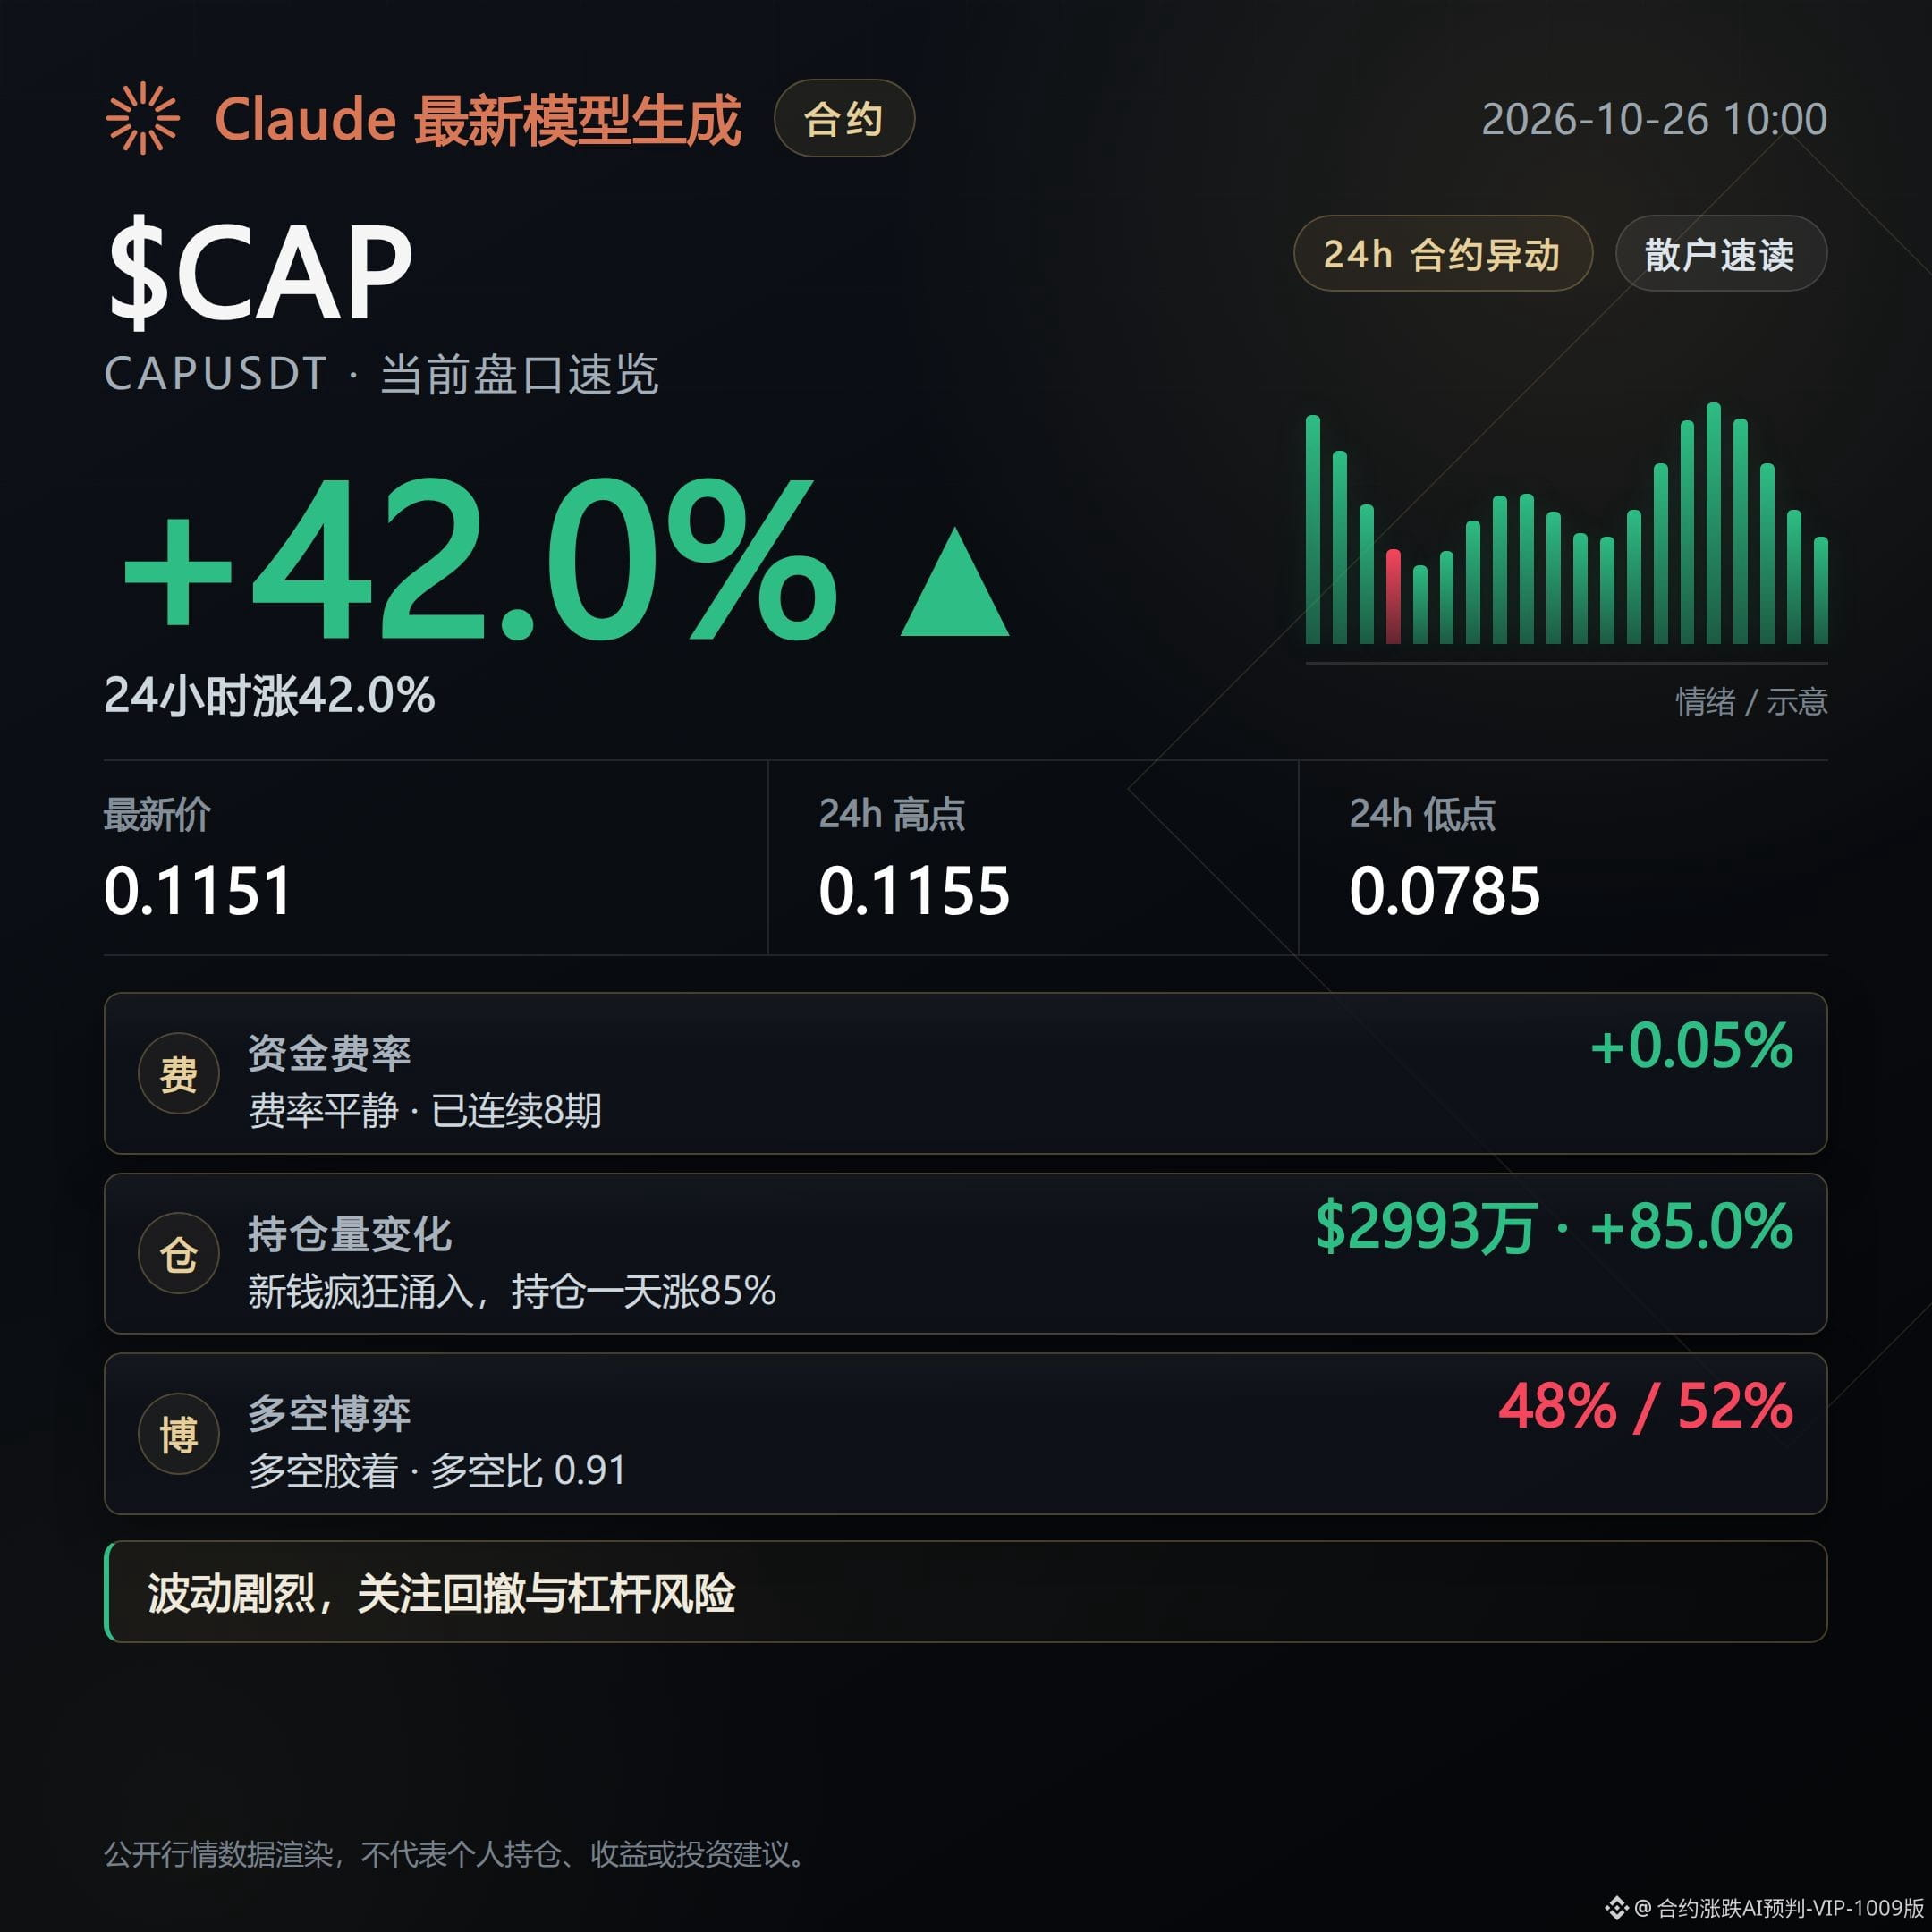
CAP leads with a gain of 41.96%.
Open interest is about $29.93 million, up 85.0% over 24 hours and still up 7.0% over the past hour. The funding rate is 0.0469%, with longs paying for 8 consecutive funding intervals.
If open interest turns lower over the past hour, the signal of a price rise backed by increasing open interest is invalidated.
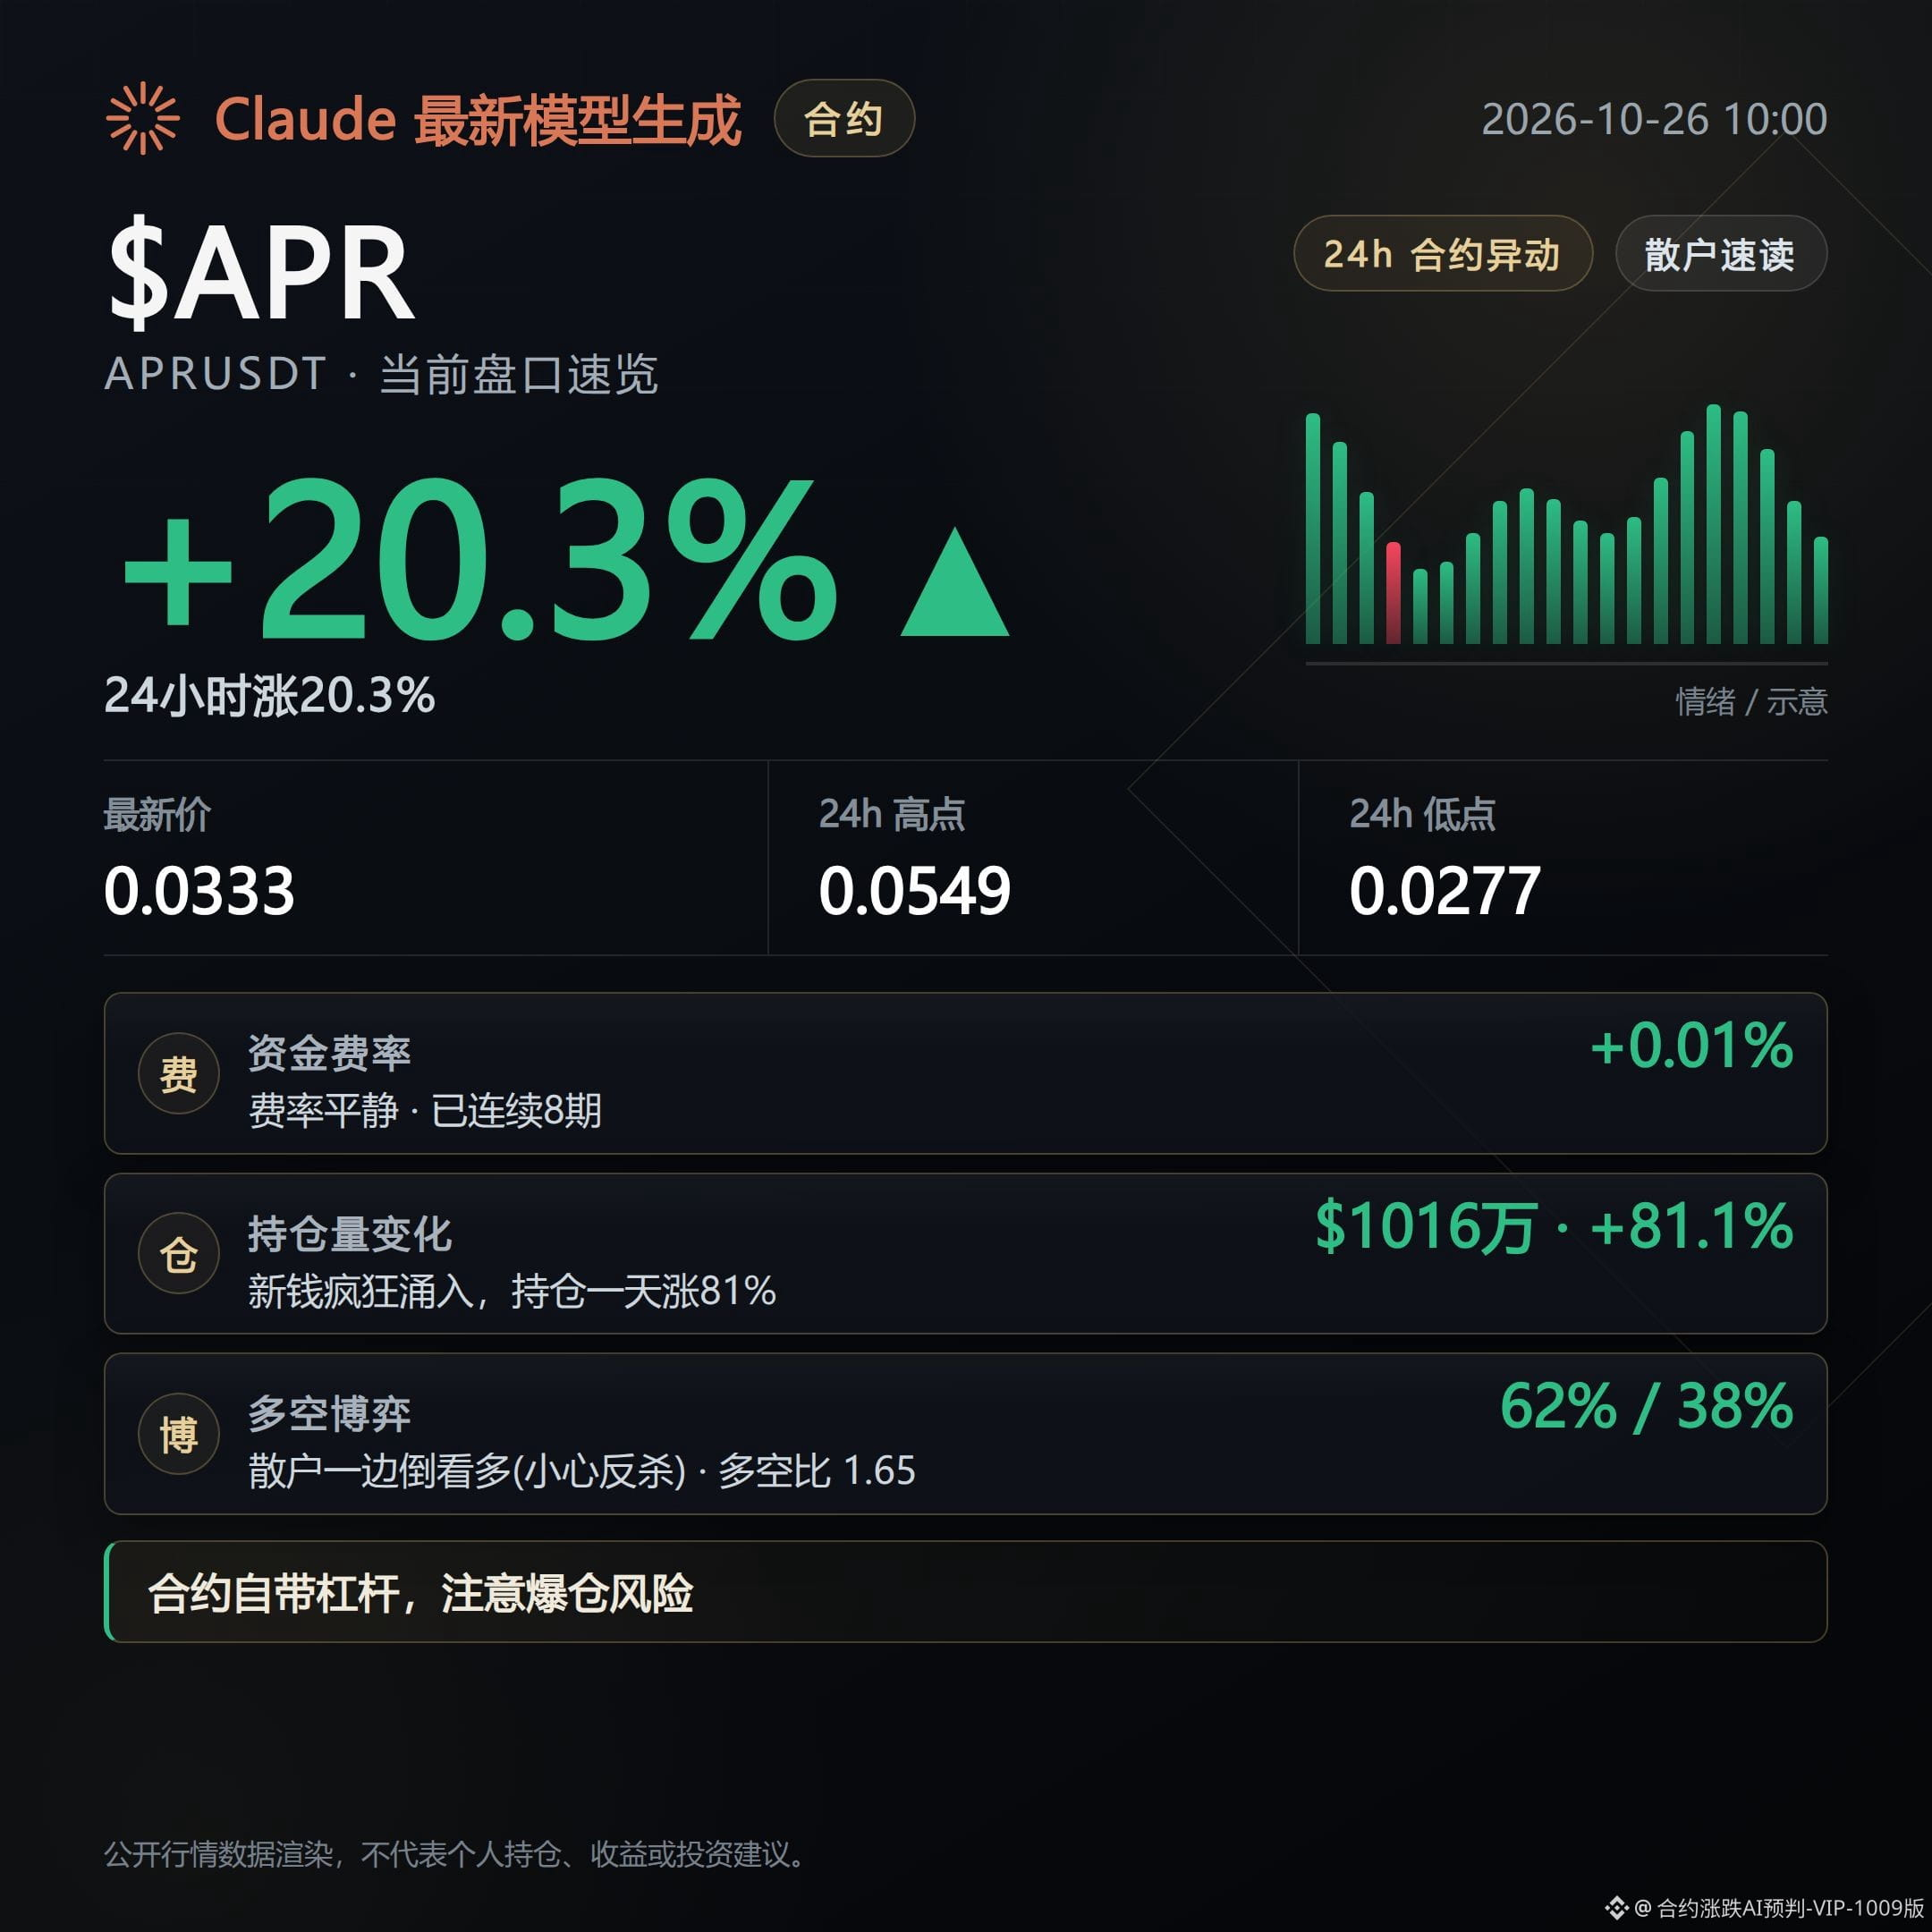
APR is up 20.27%, with 24-hour trading volume of about $526 million.
Open interest is about $10.16 million, up 81.1% over 24 hours, but it has already fallen 2.5% over the past hour, suggesting that short-term growth in open interest is starting to weaken.
If open interest continues to fall over the past hour while its 24-hour increase also eases, the signal of a price rise backed by increasing open interest is invalidated.
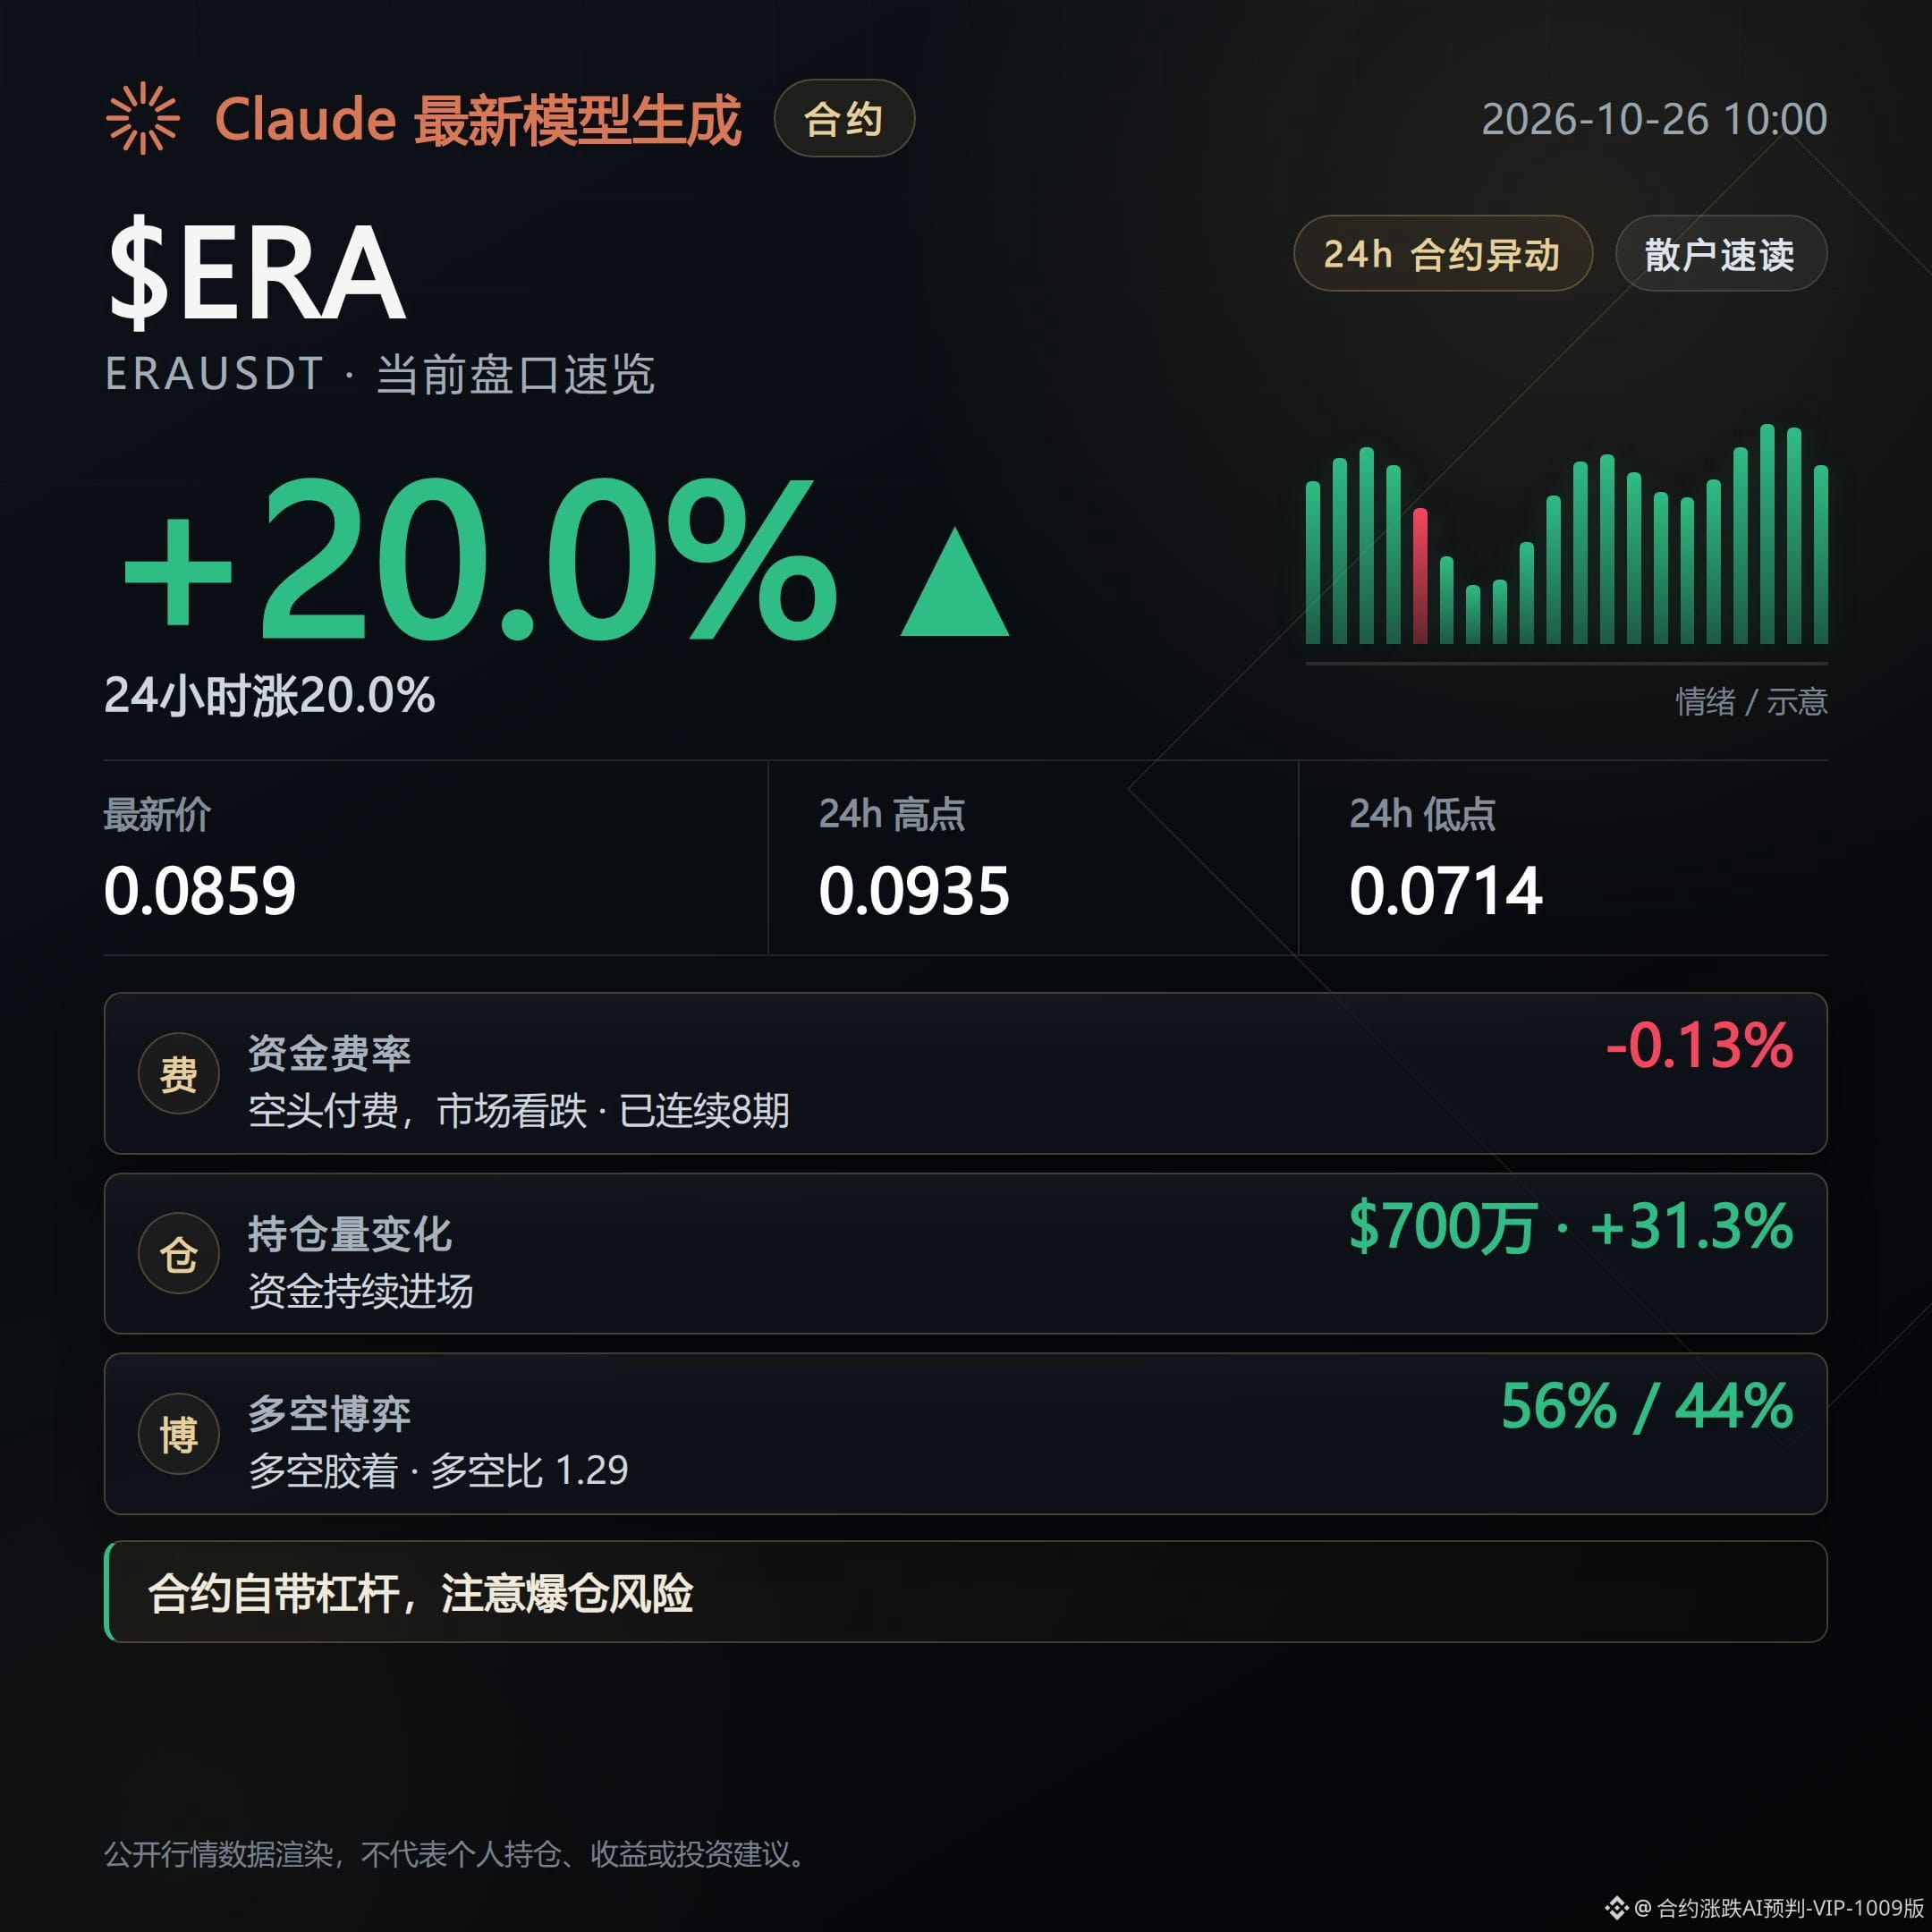
ERA is up 20.00%.
Open interest is about $7 million, up 31.3% over 24 hours and 28.5% over the past hour. The funding rate is -0.1295%, with shorts paying for 8 consecutive funding intervals.
If open interest shifts from rising to falling over the past hour, the signal of a price rise backed by increasing open interest is invalidated.
The key metric to watch for all three is open interest over the past hour—not just their gain rankings.
If gains narrow alongside falling open interest, the current signal no longer holds. Volatility is concentrated among the top gainers, increasing the risk of a pullback from elevated levels and of chasing prices.
This content was generated with assistance from Claude Fable 5 and is for informational purposes only. Please verify the information independently.
The top 3 gainers on Binance Futures over the past 24 hours are CAP, APR, and ERA.
A quick rundown for those watching the markets this morning. Today, focus on just one verifiable signal: whether the price rise is accompanied by an increase in open interest.
CAP leads with a gain of 41.96%.
Open interest is about $29.93 million, up 85.0% over 24 hours and still up 7.0% over the past hour. The funding rate is 0.0469%, with longs paying for 8 consecutive funding intervals.
If open interest turns lower over the past hour, the signal of a price rise backed by increasing open interest is invalidated.
APR is up 20.27%, with 24-hour trading volume of about $526 million.
Open interest is about $10.16 million, up 81.1% over 24 hours, but it has already fallen 2.5% over the past hour, suggesting that short-term growth in open interest is starting to weaken.
If open interest continues to fall over the past hour while its 24-hour increase also eases, the signal of a price rise backed by increasing open interest is invalidated.
ERA is up 20.00%.
Open interest is about $7 million, up 31.3% over 24 hours and 28.5% over the past hour. The funding rate is -0.1295%, with shorts paying for 8 consecutive funding intervals.
If open interest shifts from rising to falling over the past hour, the signal of a price rise backed by increasing open interest is invalidated.
The key metric to watch for all three is open interest over the past hour—not just their gain rankings.
If gains narrow alongside falling open interest, the current signal no longer holds. Volatility is concentrated among the top gainers, increasing the risk of a pullback from elevated levels and of chasing prices.
This content was generated with assistance from Claude Fable 5 and is for informational purposes only. Please verify the information independently.
A quick rundown for those watching the markets this morning. Today, focus on just one verifiable signal: whether the price rise is accompanied by an increase in open interest.
CAP leads with a gain of 41.96%.
Open interest is about $29.93 million, up 85.0% over 24 hours and still up 7.0% over the past hour. The funding rate is 0.0469%, with longs paying for 8 consecutive funding intervals.
If open interest turns lower over the past hour, the signal of a price rise backed by increasing open interest is invalidated.
APR is up 20.27%, with 24-hour trading volume of about $526 million.
Open interest is about $10.16 million, up 81.1% over 24 hours, but it has already fallen 2.5% over the past hour, suggesting that short-term growth in open interest is starting to weaken.
If open interest continues to fall over the past hour while its 24-hour increase also eases, the signal of a price rise backed by increasing open interest is invalidated.
ERA is up 20.00%.
Open interest is about $7 million, up 31.3% over 24 hours and 28.5% over the past hour. The funding rate is -0.1295%, with shorts paying for 8 consecutive funding intervals.
If open interest shifts from rising to falling over the past hour, the signal of a price rise backed by increasing open interest is invalidated.
The key metric to watch for all three is open interest over the past hour—not just their gain rankings.
If gains narrow alongside falling open interest, the current signal no longer holds. Volatility is concentrated among the top gainers, increasing the risk of a pullback from elevated levels and of chasing prices.
This content was generated with assistance from Claude Fable 5 and is for informational purposes only. Please verify the information independently.
186
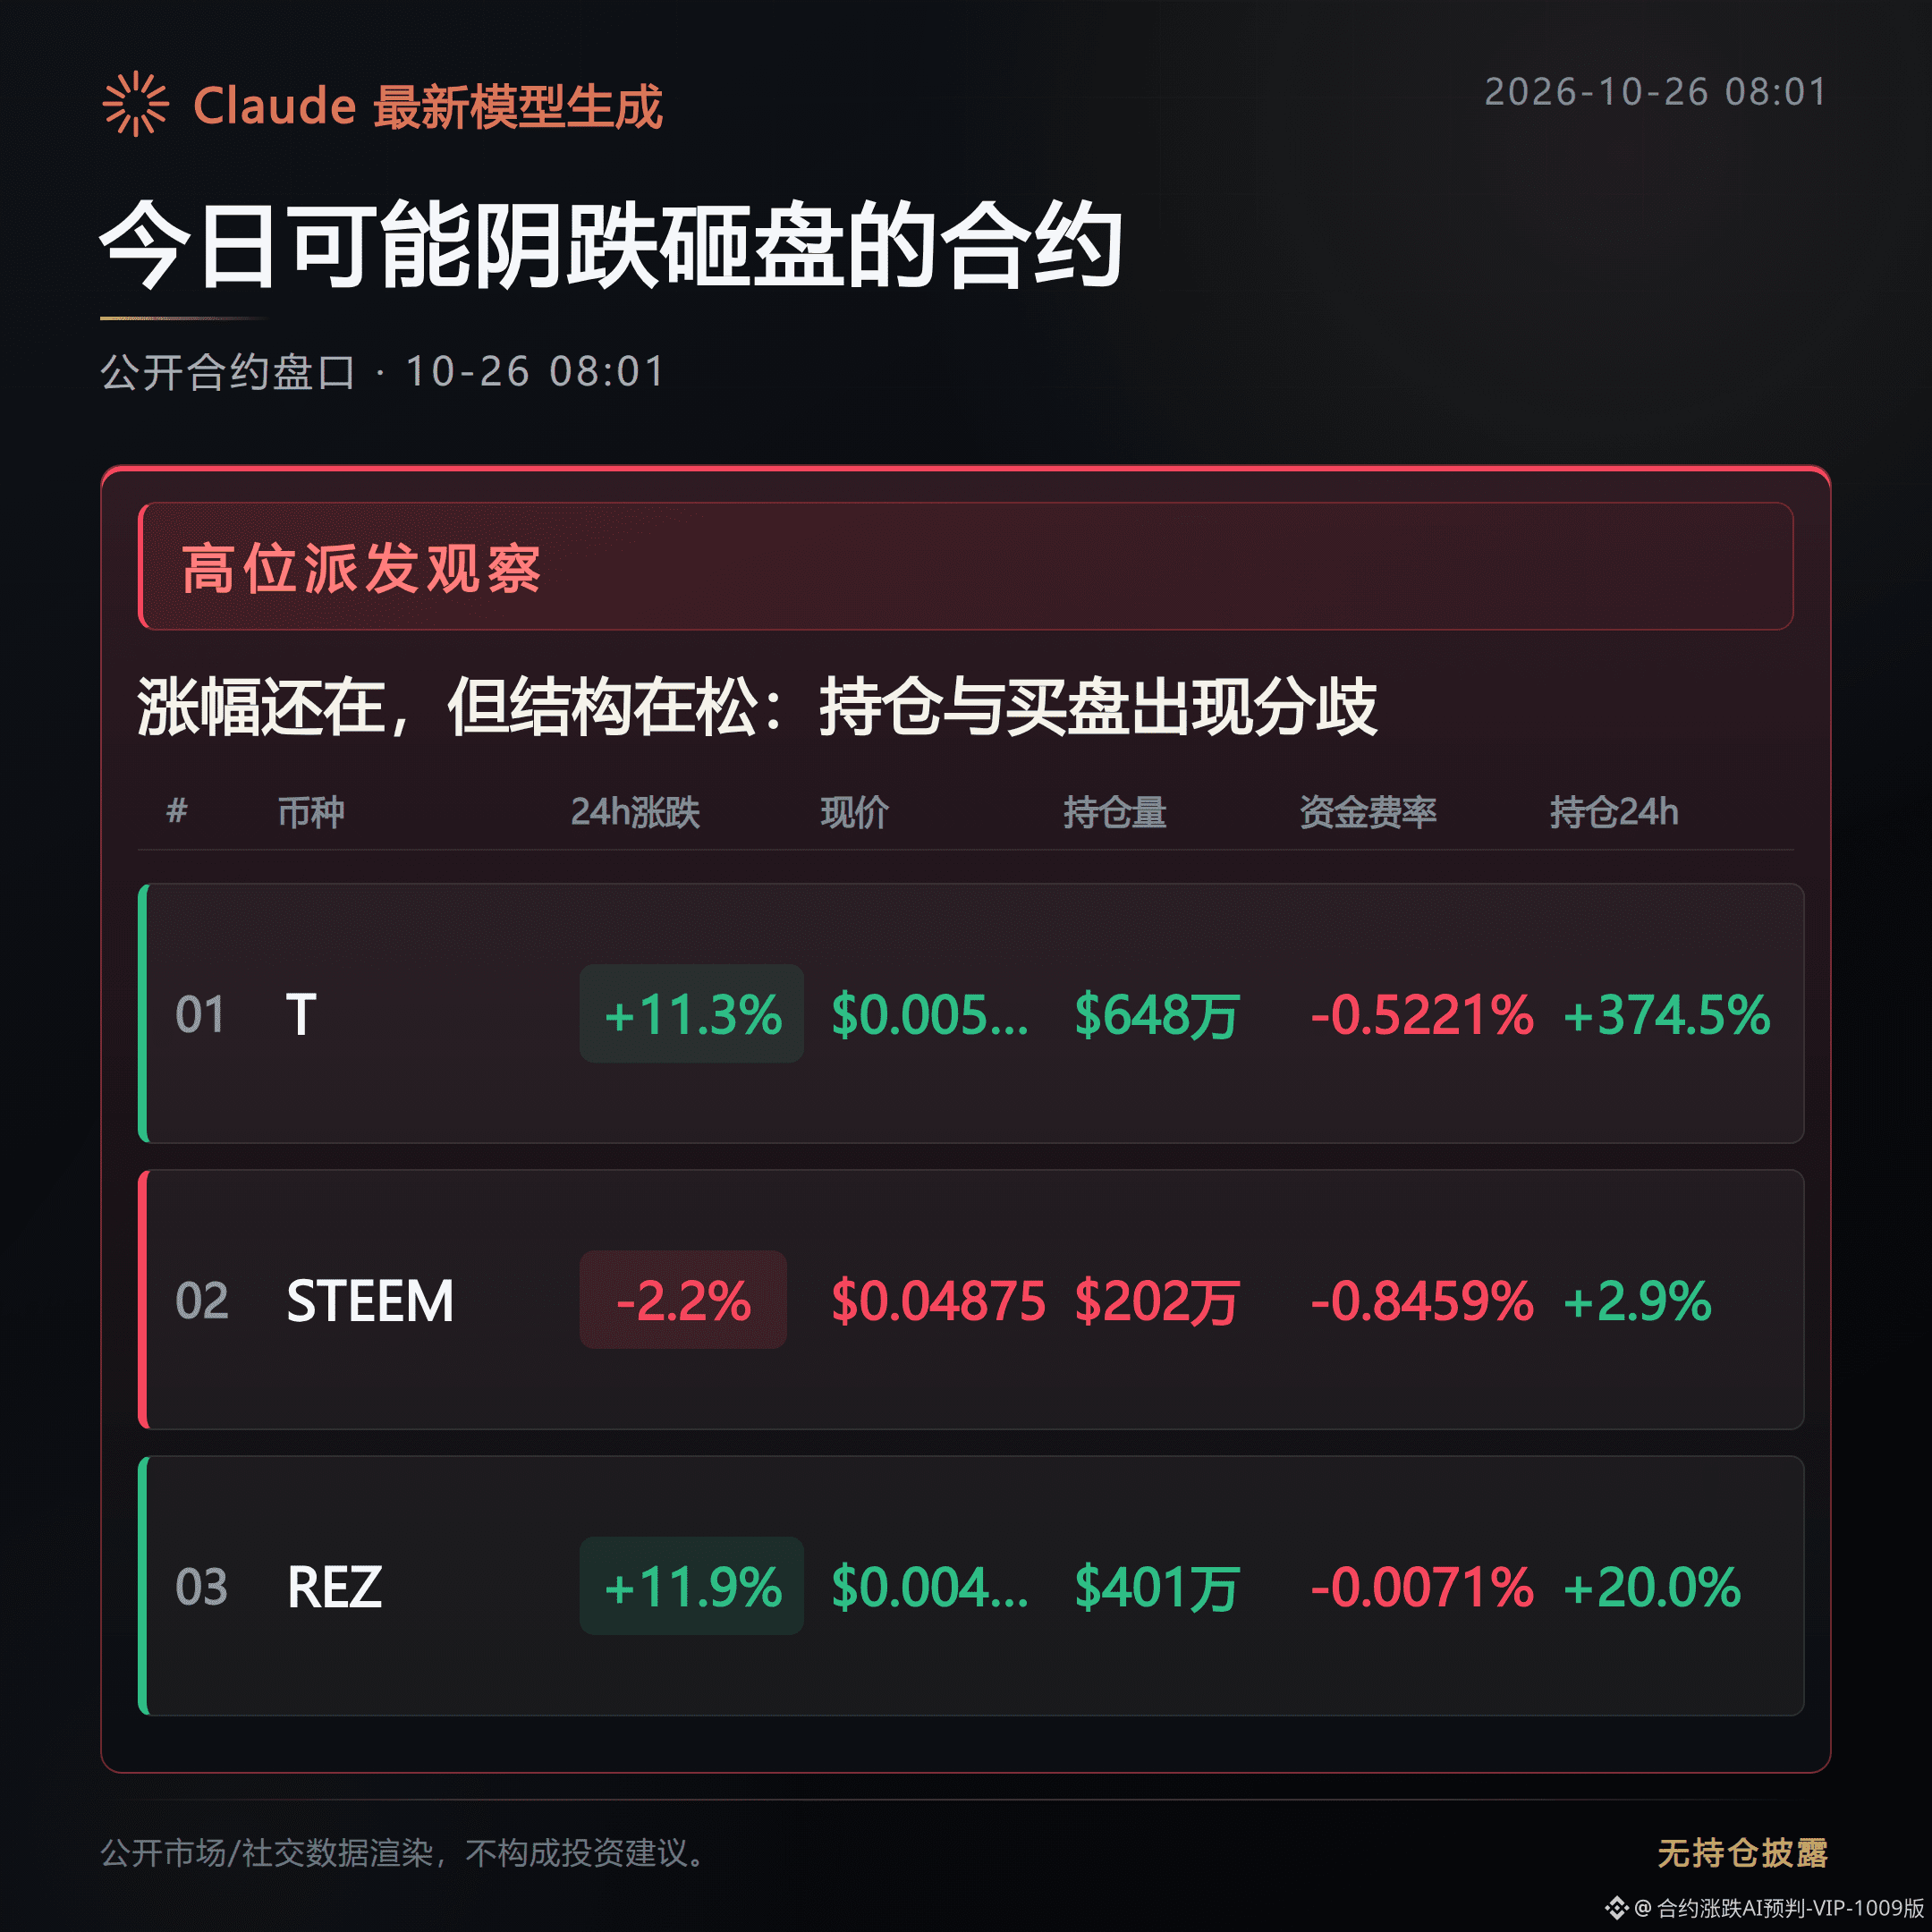
Leaning toward a gradual decline.
Some of these coins are still rising in price, but their structure is already weakening. Don’t focus only on the green percentage gains—the risk of chasing prices higher is increasing.
The concern isn’t that prices won’t rise; it’s that buying support may thin out as they climb. Watch for prices to turn down and for weakening support to be confirmed.
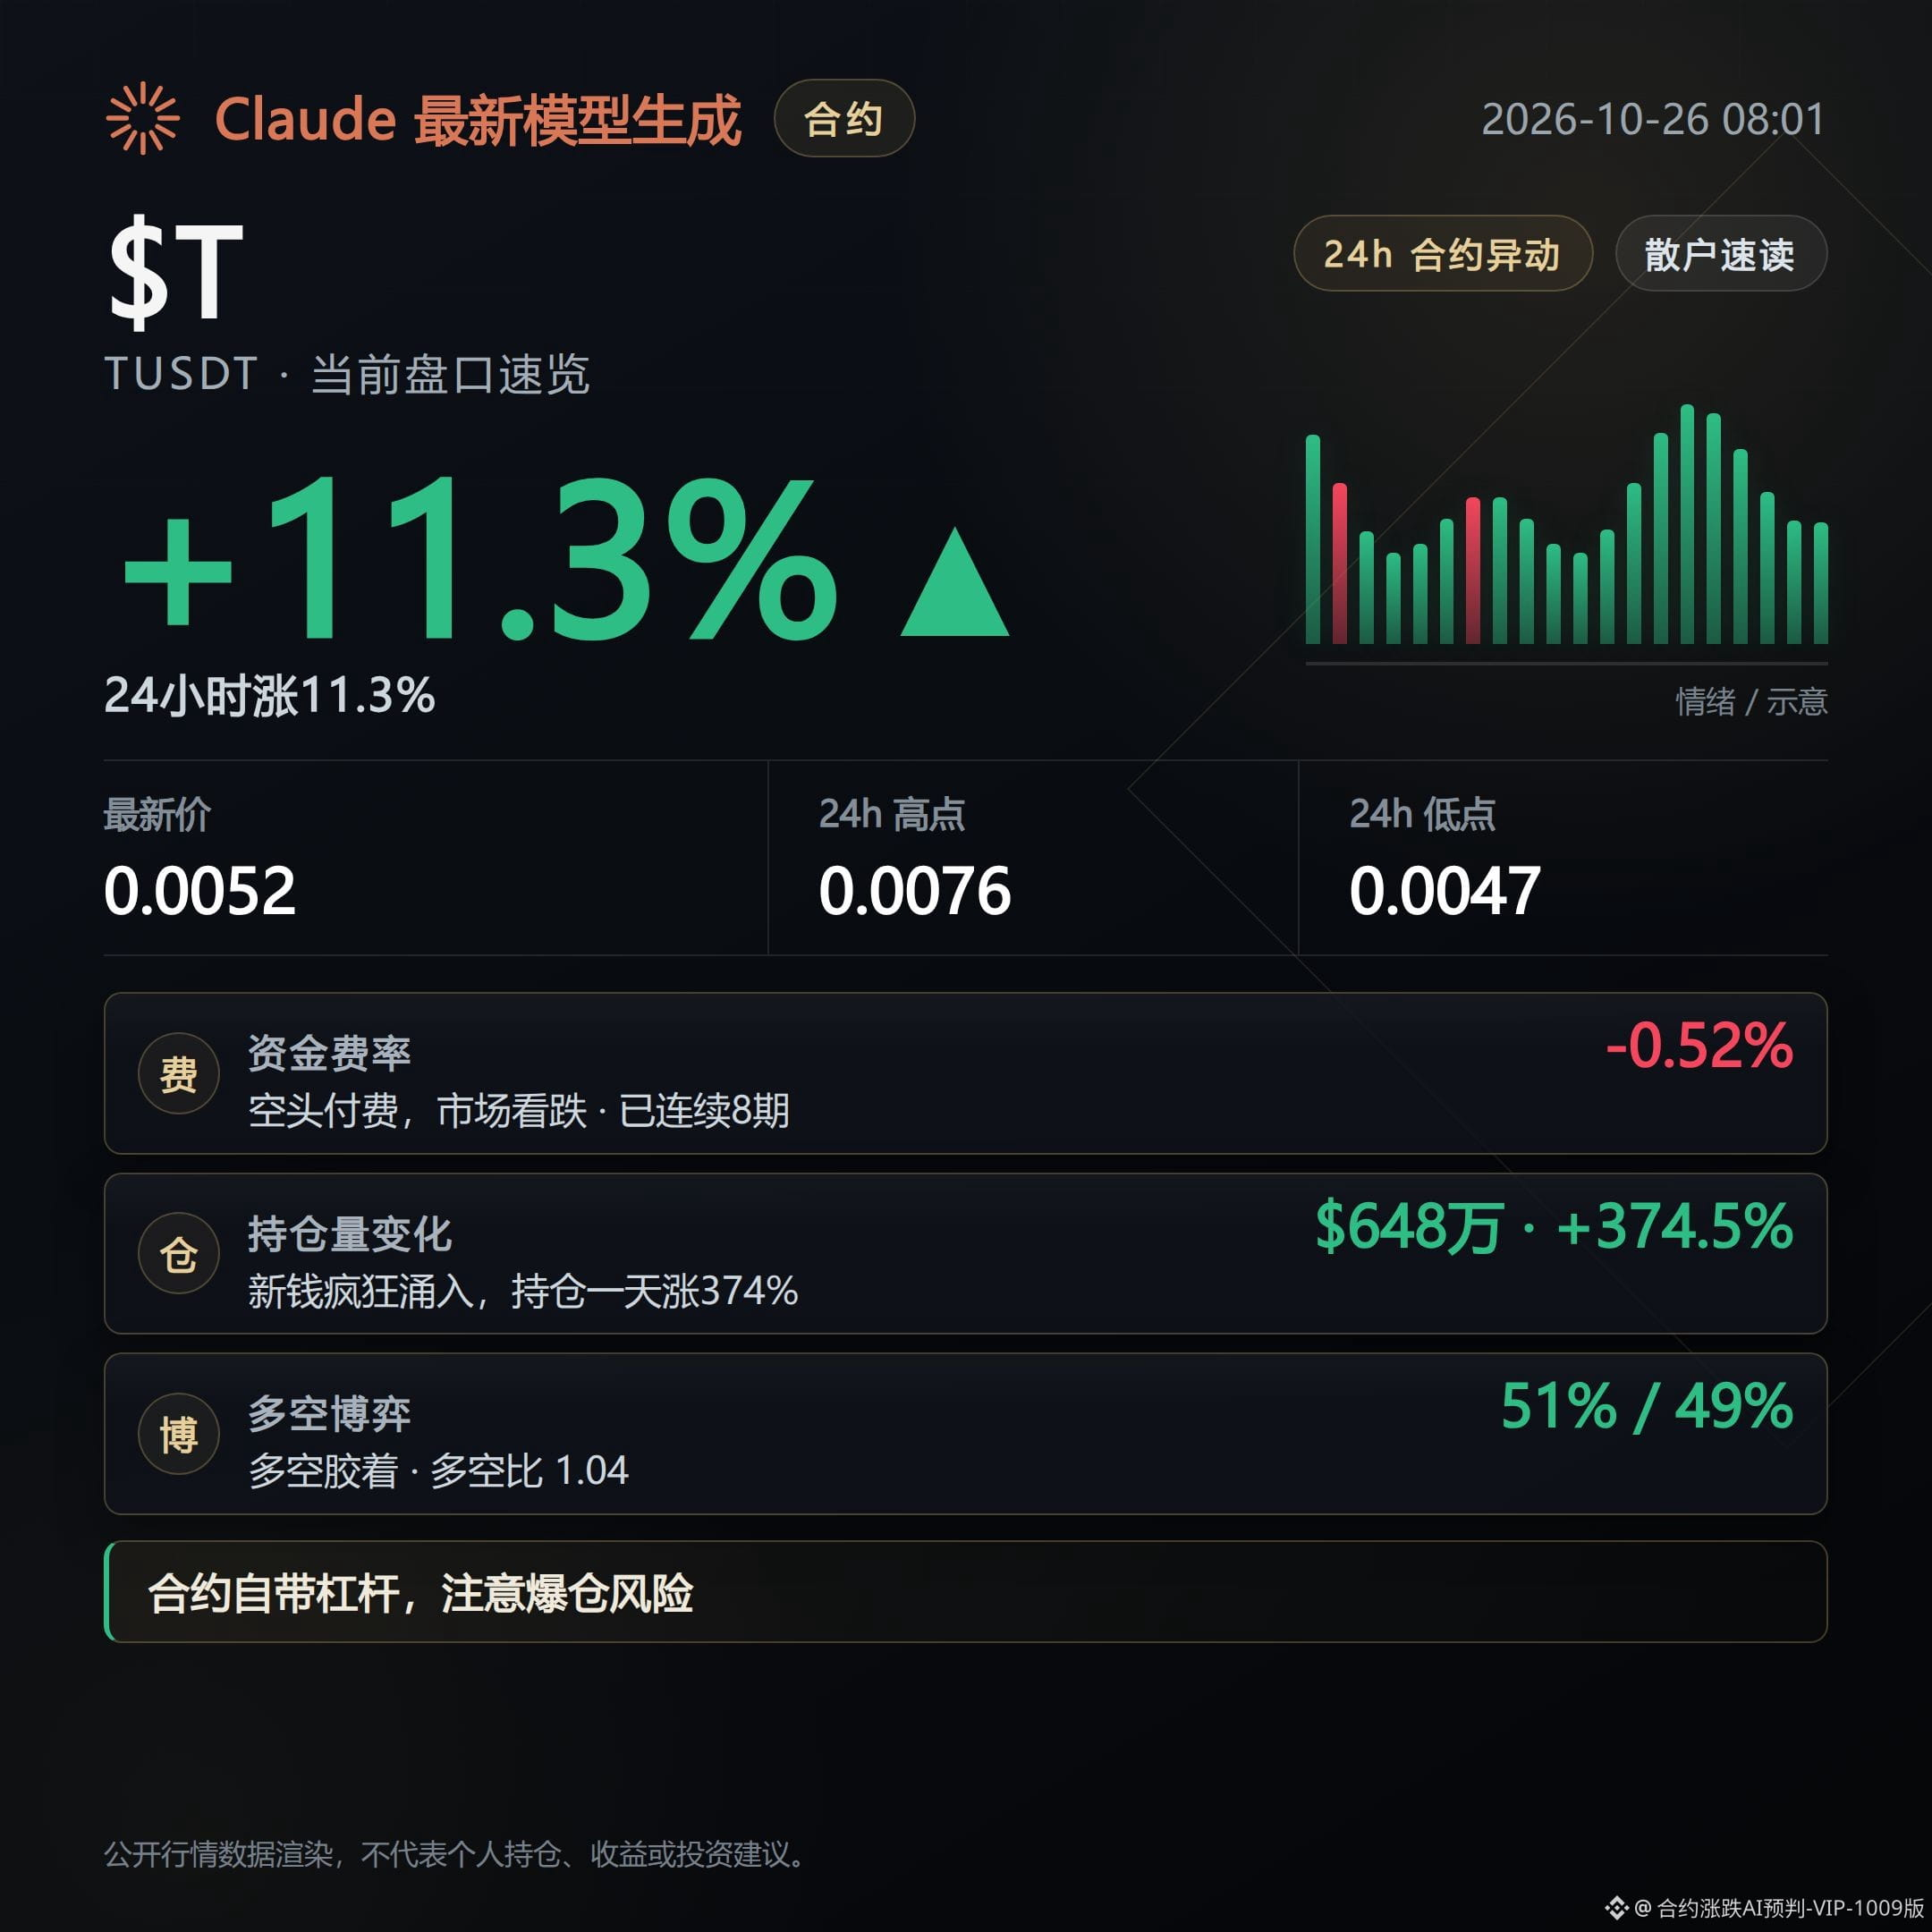
T: Current price: 0.005229; 24-hour gain: 11.35%; open interest increased 374.5% over the same period.
The price is still up, but the structure is weakening and positions are dispersing. Traders chasing the rally could be squeezed by both rebounds and pullbacks.
An opposing signal is that the funding rate is -0.5221%, with shorts paying for 8 consecutive periods. Public order-book data suggests a possible short squeeze, so a short-term rebound remains possible.
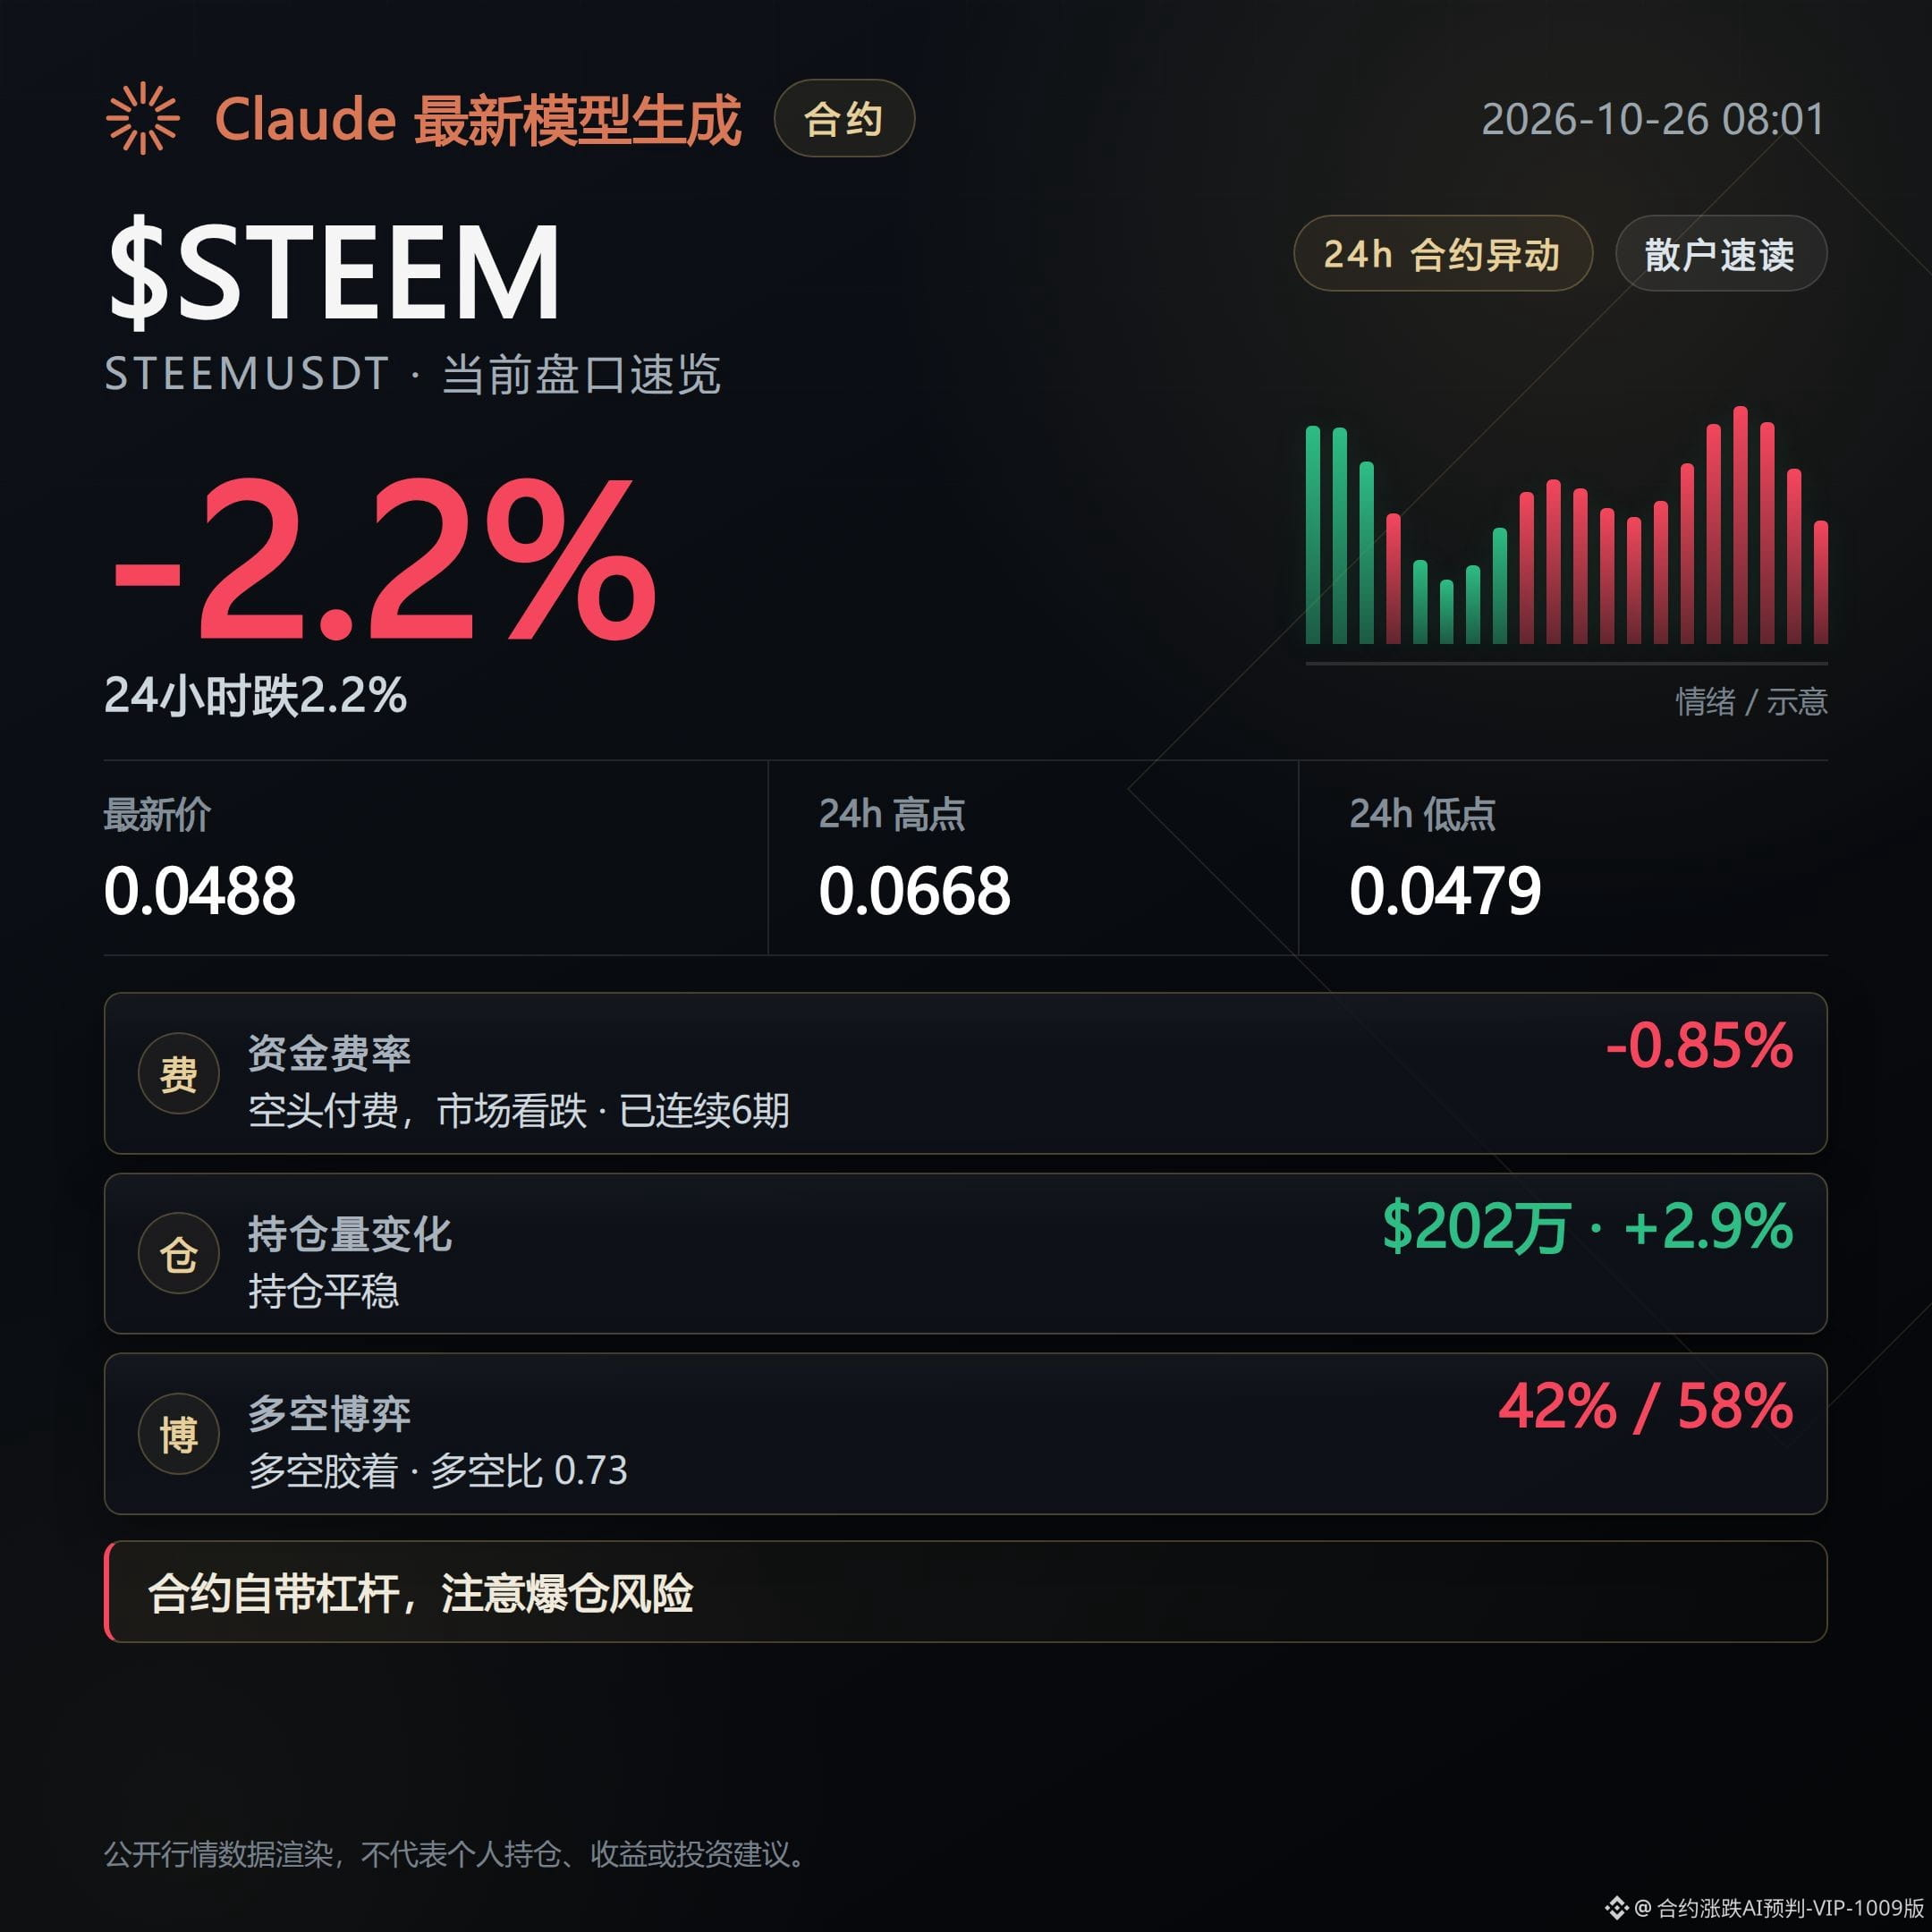
STEEM: Current price: 0.04875; 24-hour decline: 2.25%; open interest increased 12.6% over the past hour.
The price has weakened while positions continue to increase, and positions are dispersing. Keep watching for further downside pressure.
An opposing signal is that the funding rate is -0.8459%, with shorts paying for 6 consecutive periods. Short positions are carrying relatively high costs, so a rebound remains possible if buying support recovers.
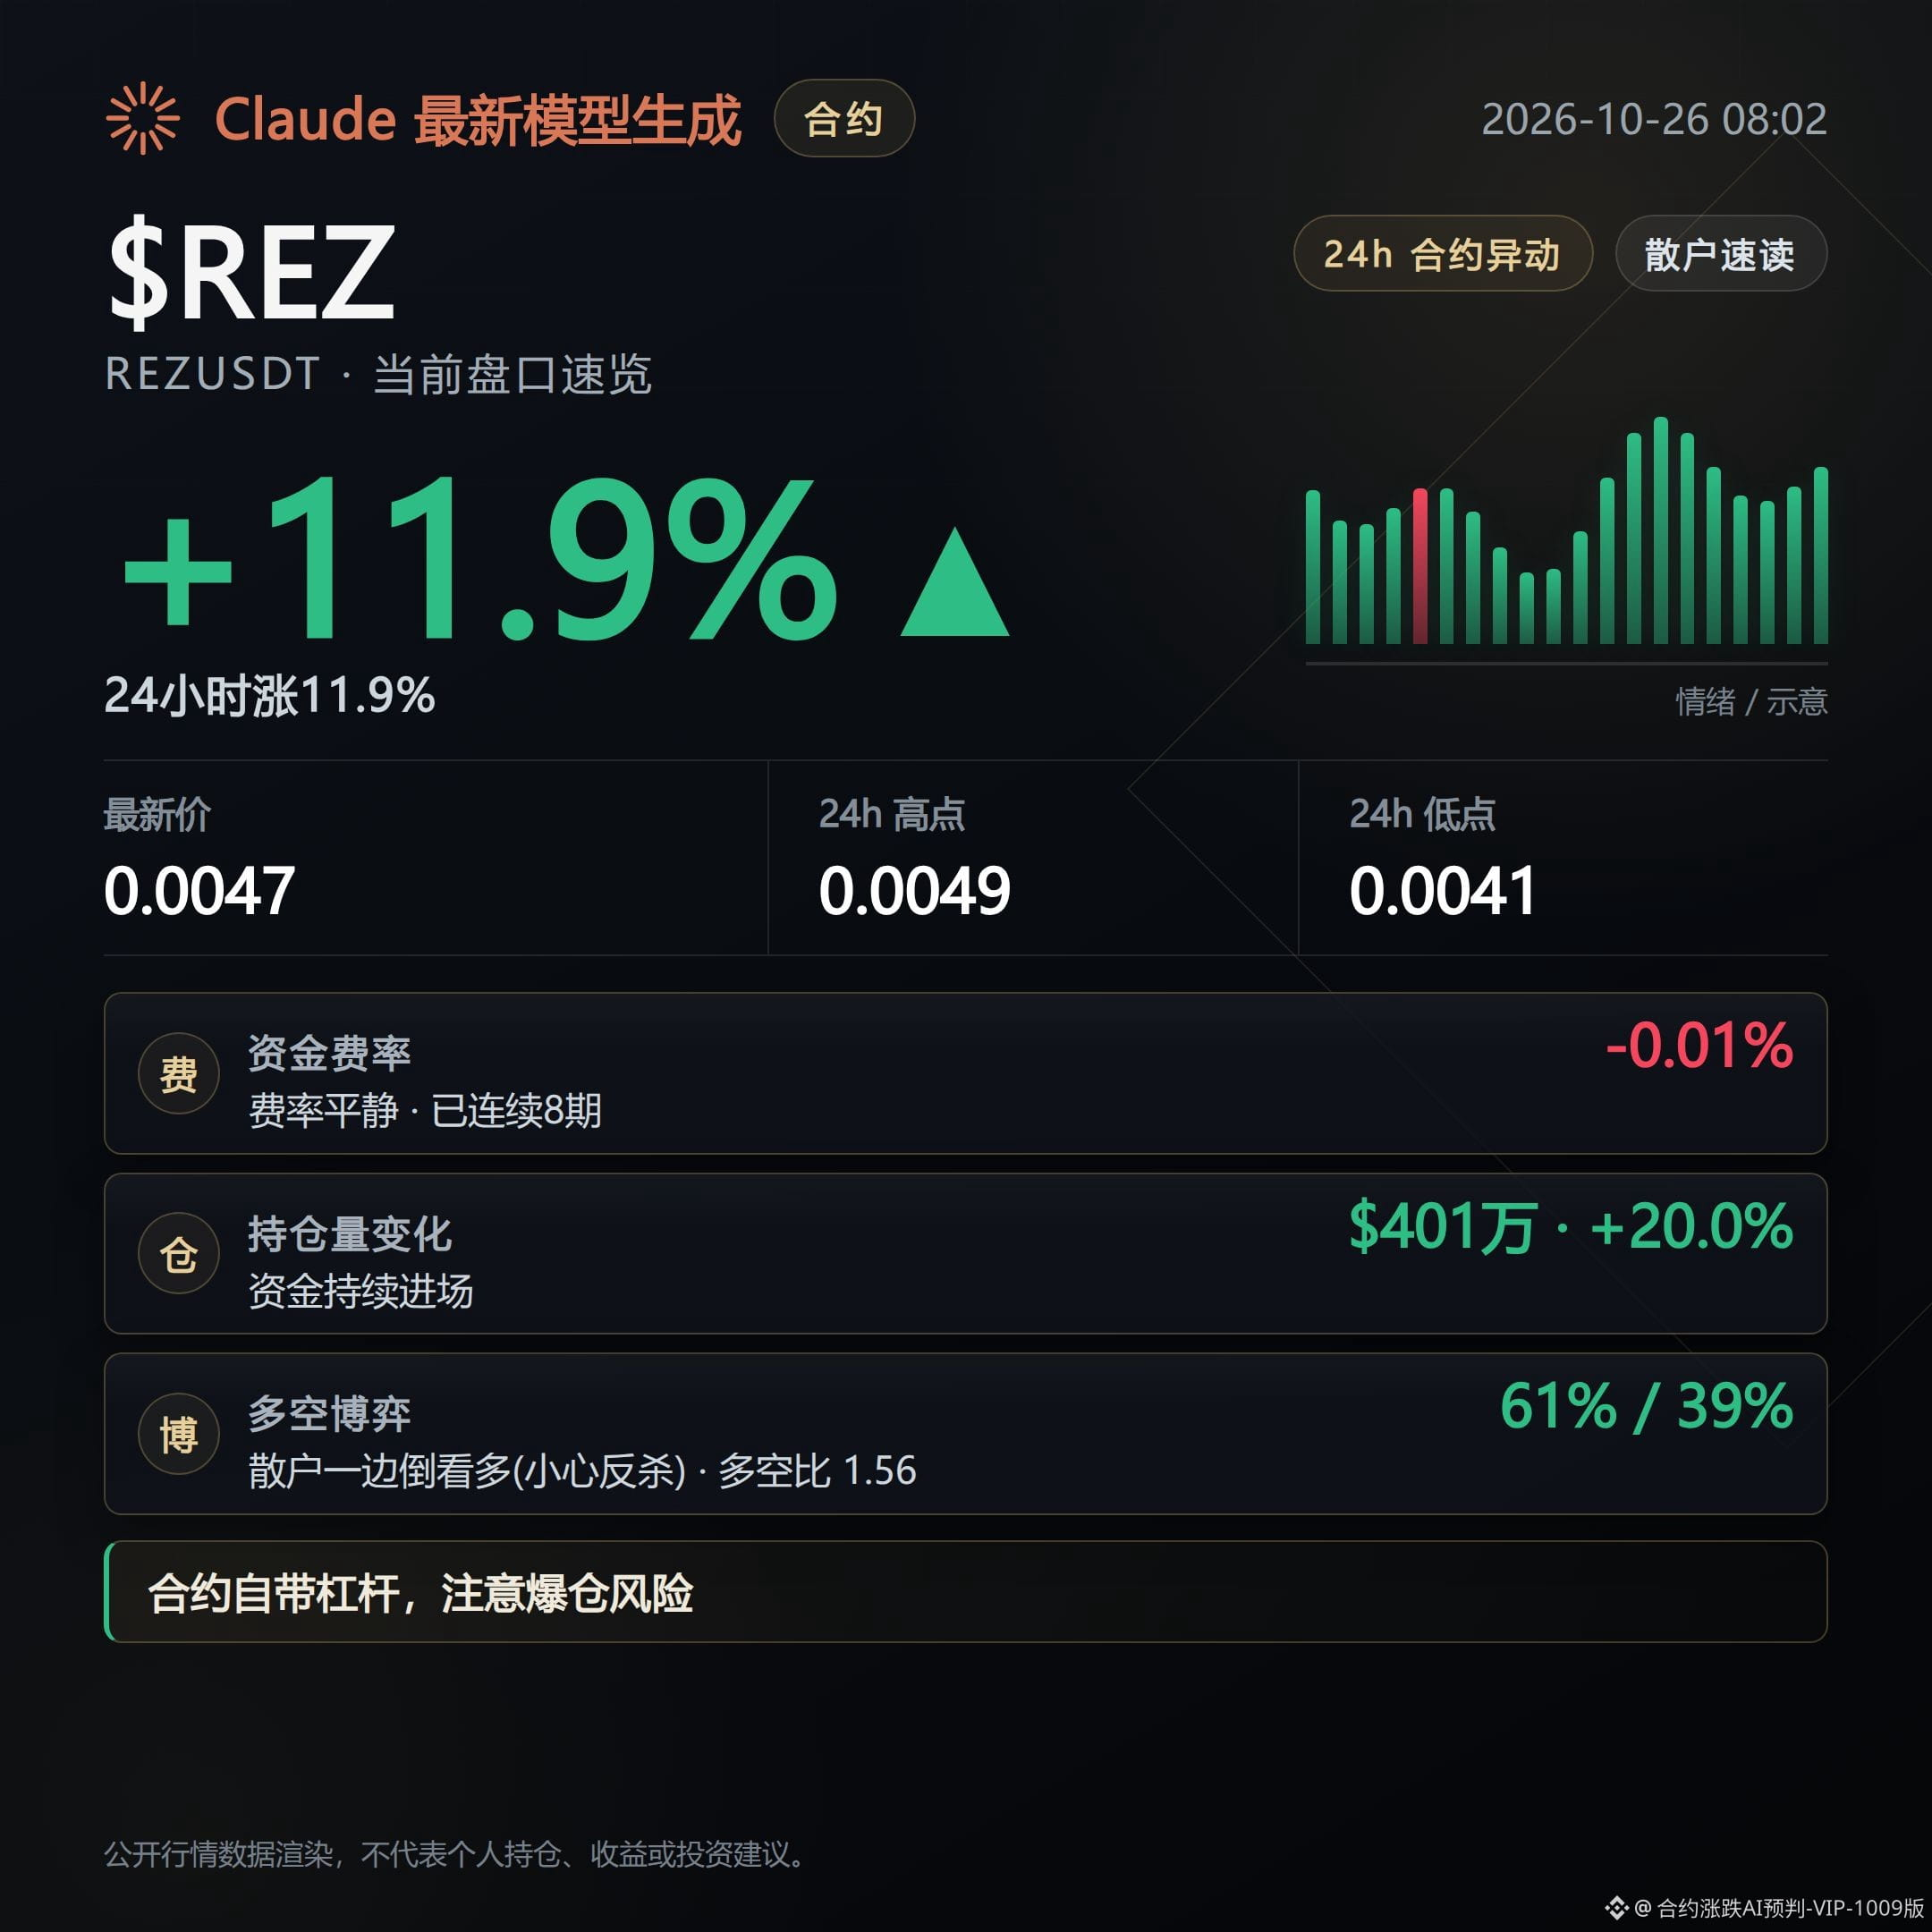
REZ: Current price: 0.004731; 24-hour gain: 11.87%; long/short ratio by trader count: 1.56, with longs accounting for 61%.
The price is still up, but the structure is weakening and positions are dispersing. With long positions becoming crowded, be especially alert to buying support failing to keep up.
An opposing signal is that the taker buy/sell ratio is 1.29, meaning aggressive buyers remain in control. Short-term strength has not completely faded.
If buying support continues to thin out, the pullback scenario is playing out.
If prices regain ground and hold with increased volume, this assessment will need to be reconsidered.
Assisted generation by Claude Fable 5; for market information only and not investment advice.
Leaning toward a gradual decline.
Some of these coins are still rising in price, but their structure is already weakening. Don’t focus only on the green percentage gains—the risk of chasing prices higher is increasing.
The concern isn’t that prices won’t rise; it’s that buying support may thin out as they climb. Watch for prices to turn down and for weakening support to be confirmed.
T: Current price: 0.005229; 24-hour gain: 11.35%; open interest increased 374.5% over the same period.
The price is still up, but the structure is weakening and positions are dispersing. Traders chasing the rally could be squeezed by both rebounds and pullbacks.
An opposing signal is that the funding rate is -0.5221%, with shorts paying for 8 consecutive periods. Public order-book data suggests a possible short squeeze, so a short-term rebound remains possible.
STEEM: Current price: 0.04875; 24-hour decline: 2.25%; open interest increased 12.6% over the past hour.
The price has weakened while positions continue to increase, and positions are dispersing. Keep watching for further downside pressure.
An opposing signal is that the funding rate is -0.8459%, with shorts paying for 6 consecutive periods. Short positions are carrying relatively high costs, so a rebound remains possible if buying support recovers.
REZ: Current price: 0.004731; 24-hour gain: 11.87%; long/short ratio by trader count: 1.56, with longs accounting for 61%.
The price is still up, but the structure is weakening and positions are dispersing. With long positions becoming crowded, be especially alert to buying support failing to keep up.
An opposing signal is that the taker buy/sell ratio is 1.29, meaning aggressive buyers remain in control. Short-term strength has not completely faded.
If buying support continues to thin out, the pullback scenario is playing out.
If prices regain ground and hold with increased volume, this assessment will need to be reconsidered.
Assisted generation by Claude Fable 5; for market information only and not investment advice.
Some of these coins are still rising in price, but their structure is already weakening. Don’t focus only on the green percentage gains—the risk of chasing prices higher is increasing.
The concern isn’t that prices won’t rise; it’s that buying support may thin out as they climb. Watch for prices to turn down and for weakening support to be confirmed.
T: Current price: 0.005229; 24-hour gain: 11.35%; open interest increased 374.5% over the same period.
The price is still up, but the structure is weakening and positions are dispersing. Traders chasing the rally could be squeezed by both rebounds and pullbacks.
An opposing signal is that the funding rate is -0.5221%, with shorts paying for 8 consecutive periods. Public order-book data suggests a possible short squeeze, so a short-term rebound remains possible.
STEEM: Current price: 0.04875; 24-hour decline: 2.25%; open interest increased 12.6% over the past hour.
The price has weakened while positions continue to increase, and positions are dispersing. Keep watching for further downside pressure.
An opposing signal is that the funding rate is -0.8459%, with shorts paying for 6 consecutive periods. Short positions are carrying relatively high costs, so a rebound remains possible if buying support recovers.
REZ: Current price: 0.004731; 24-hour gain: 11.87%; long/short ratio by trader count: 1.56, with longs accounting for 61%.
The price is still up, but the structure is weakening and positions are dispersing. With long positions becoming crowded, be especially alert to buying support failing to keep up.
An opposing signal is that the taker buy/sell ratio is 1.29, meaning aggressive buyers remain in control. Short-term strength has not completely faded.
If buying support continues to thin out, the pullback scenario is playing out.
If prices regain ground and hold with increased volume, this assessment will need to be reconsidered.
Assisted generation by Claude Fable 5; for market information only and not investment advice.
250
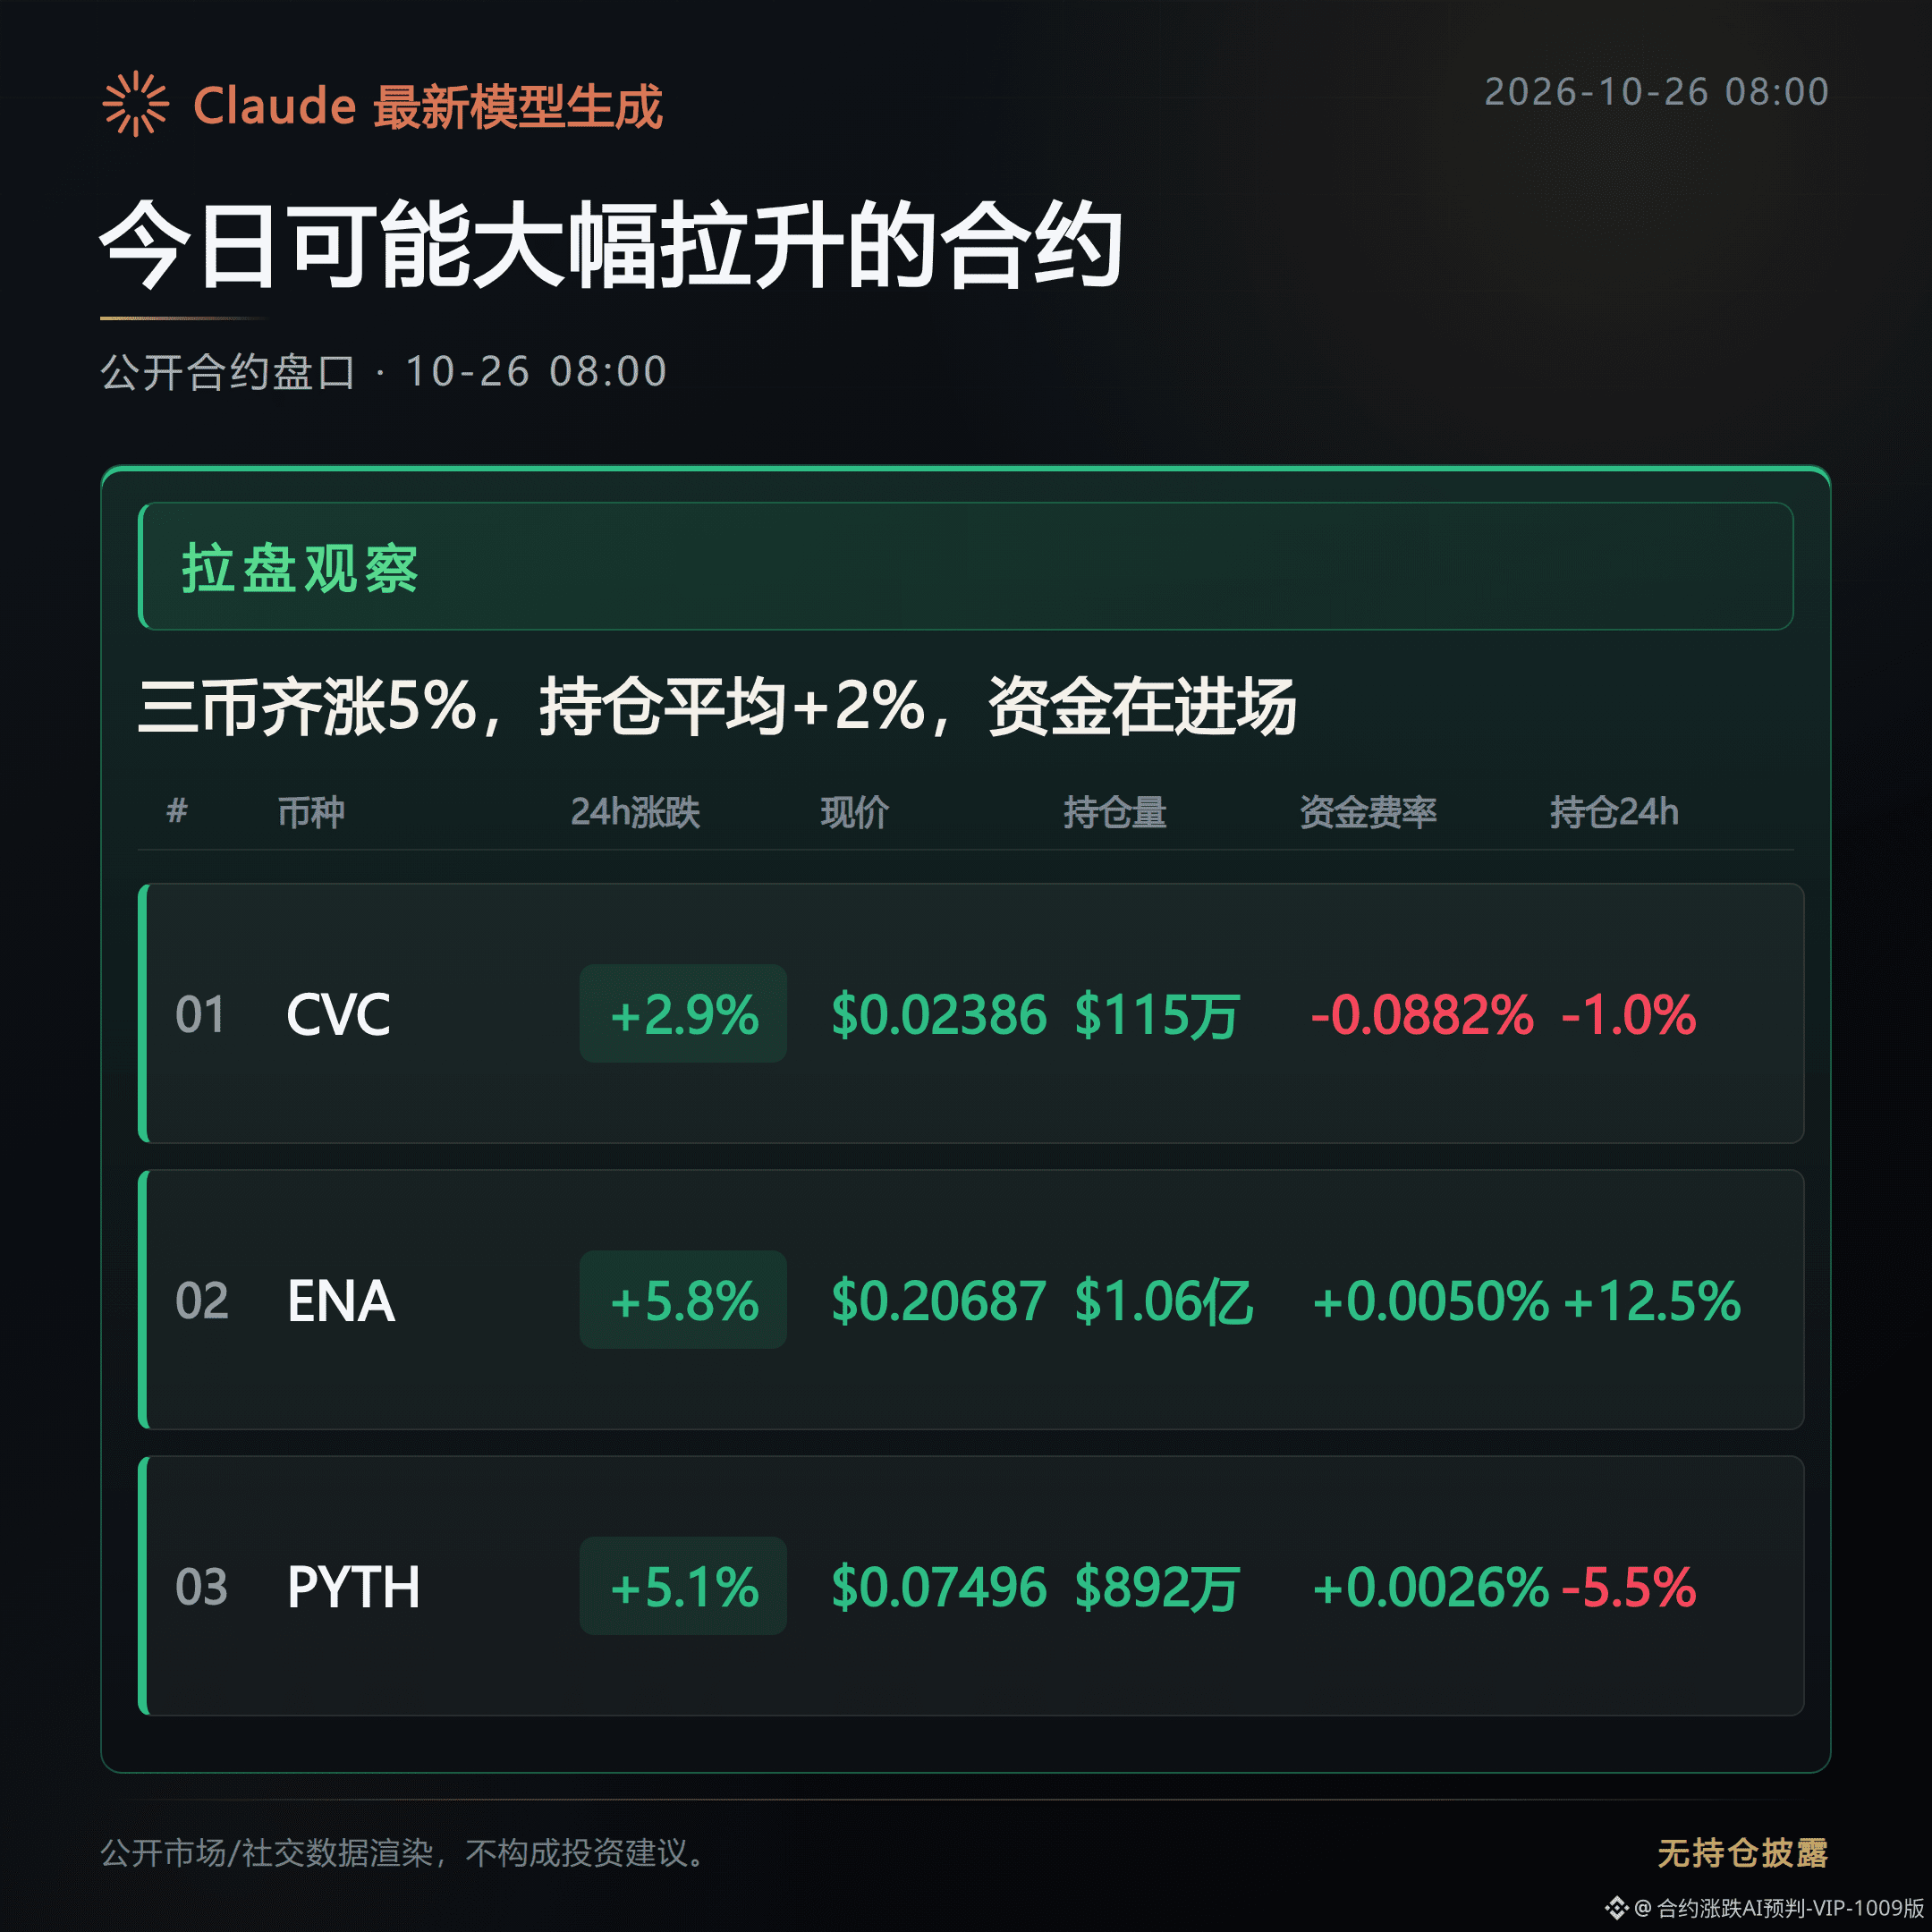
Contracts that could surge significantly today
Bullish: For this group, all three have risen in line with the trend over the past 24 hours, and all have maintained an upward Supertrend. ENA stands out most, with open interest and aggressive buying both showing the clearest follow-through.
Positions are building.
Next, watch whether price strength, open interest, and aggressive buying continue to confirm the move.
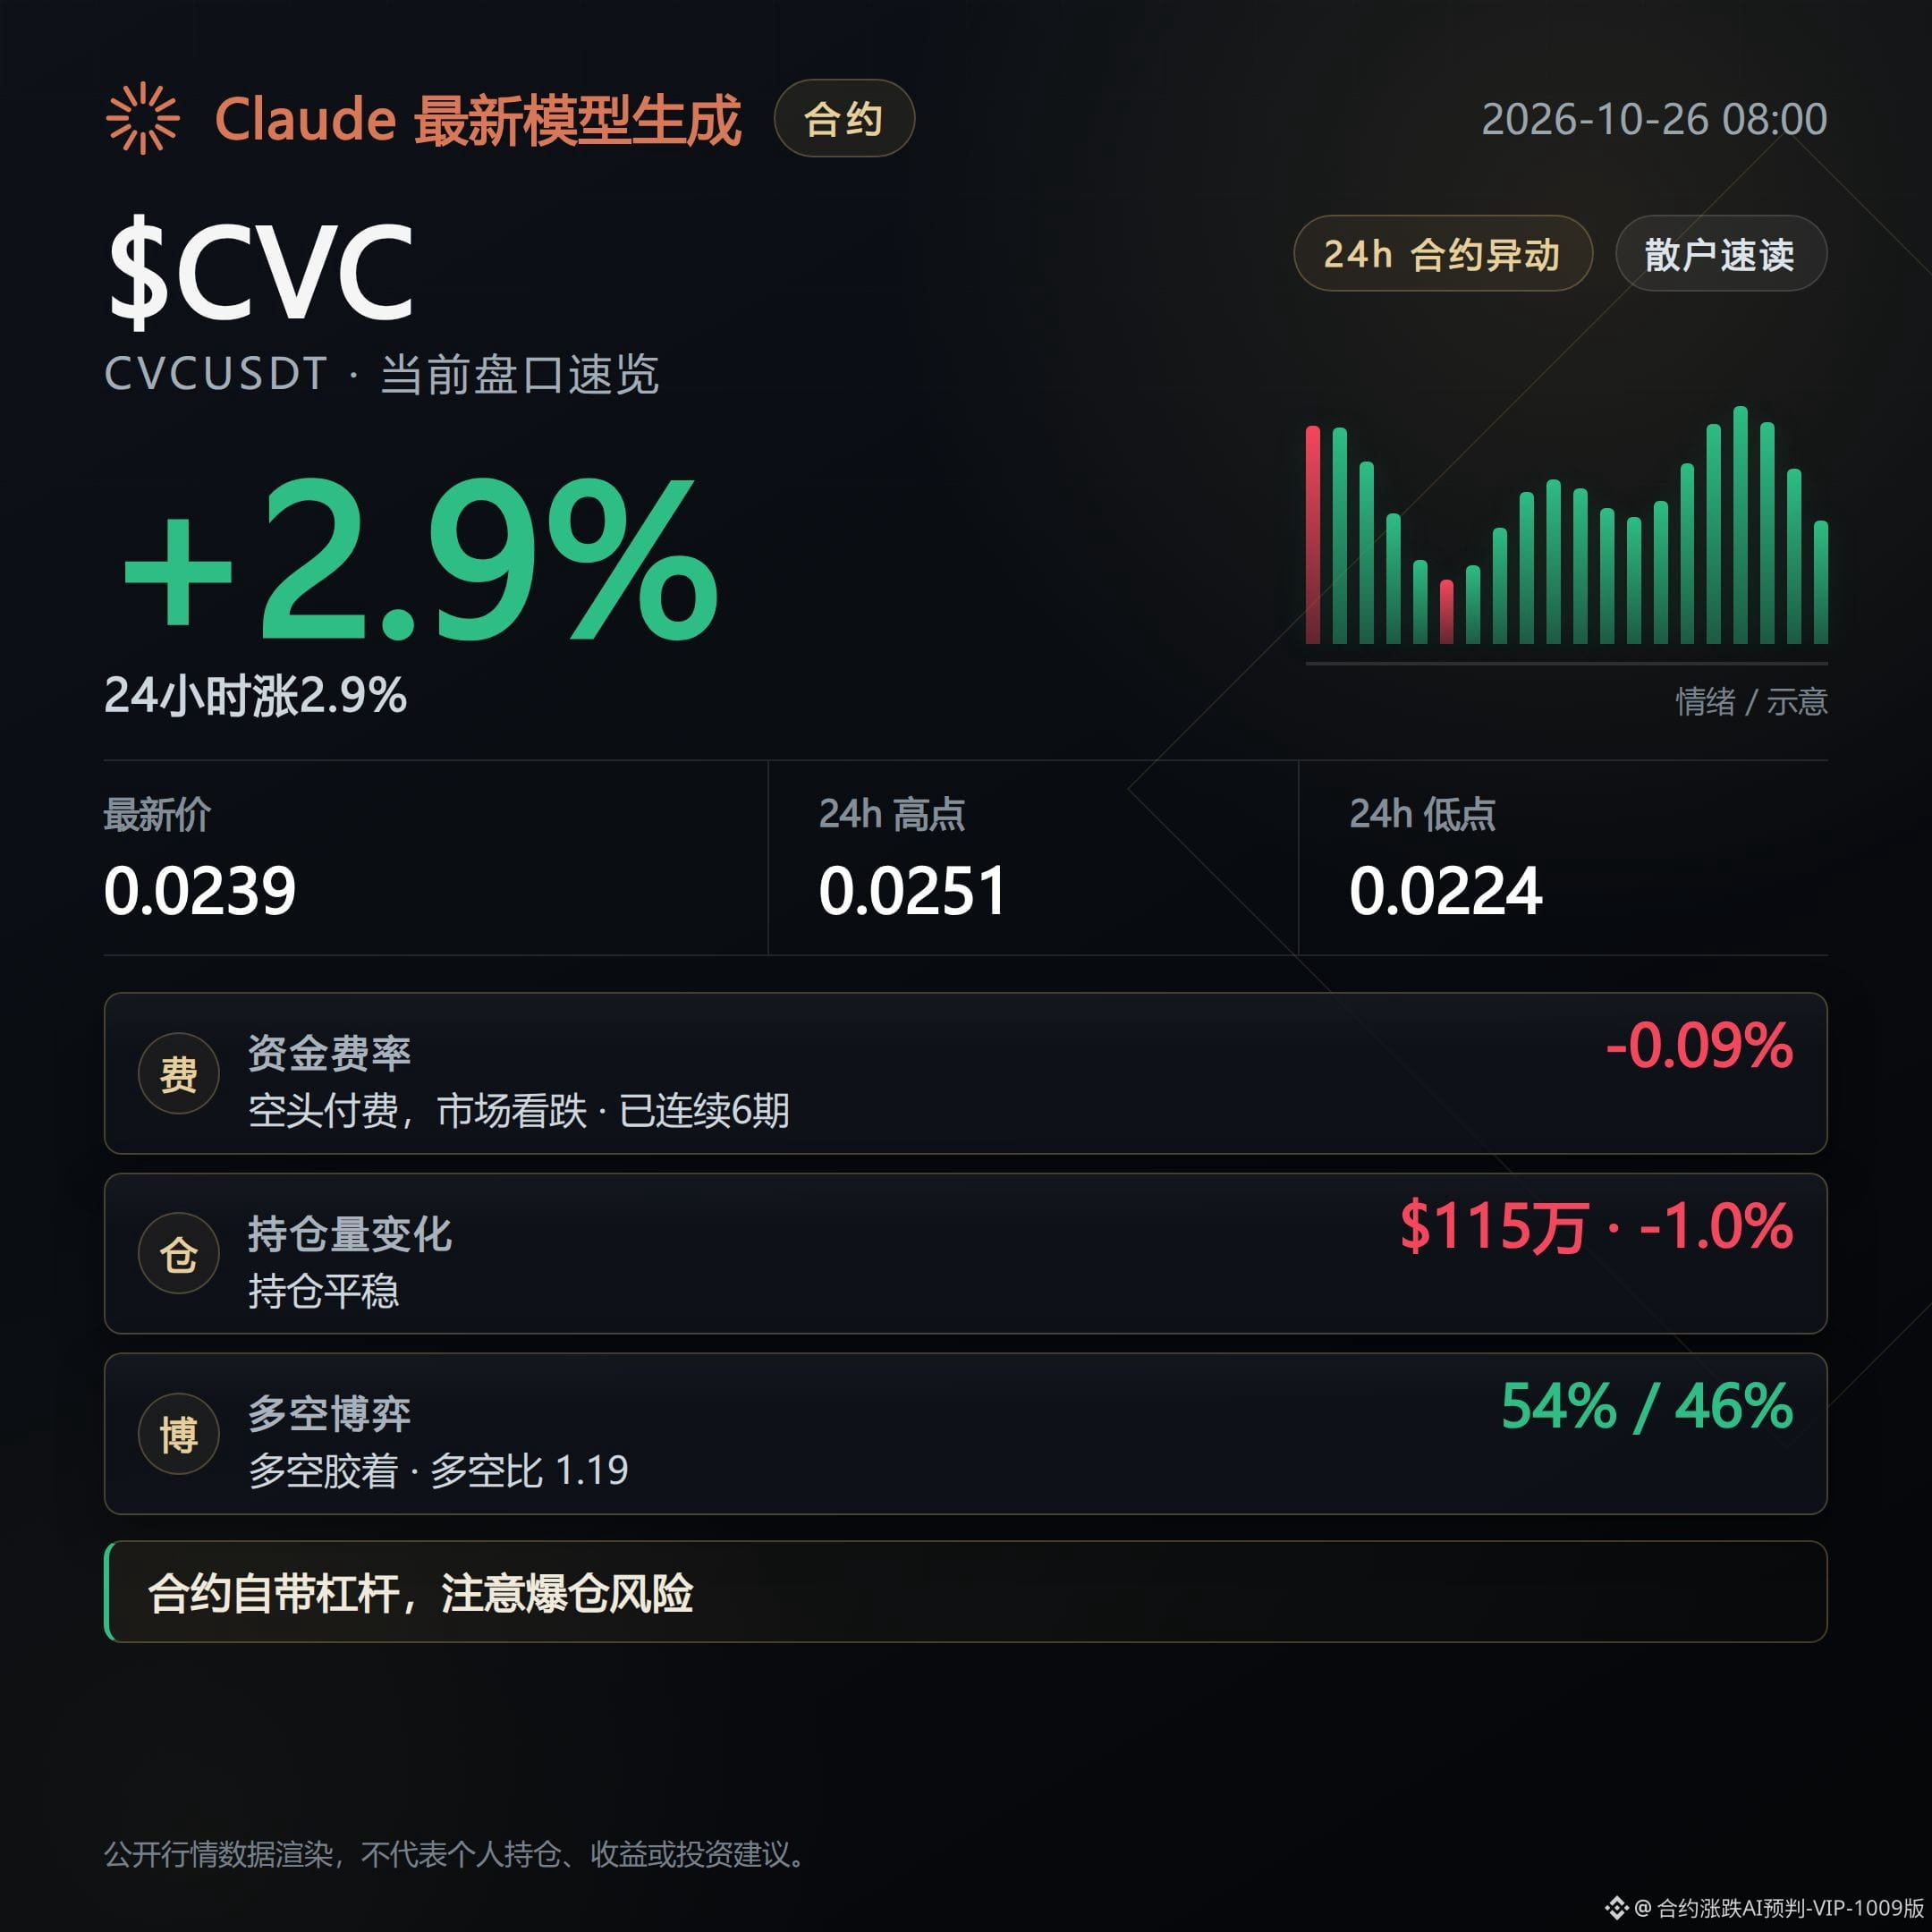
CVC is currently at 0.02386, up 2.93% over the past 24 hours. The Supertrend remains upward, and the funding rate is -0.0882%, with shorts paying for six consecutive periods.
This means shorts are still paying funding as the price moves with the trend. However, a counterpoint is that open interest is down 1% over the past 24 hours, while 1-hour open interest has not grown. Watch to see whether new positions emerge.
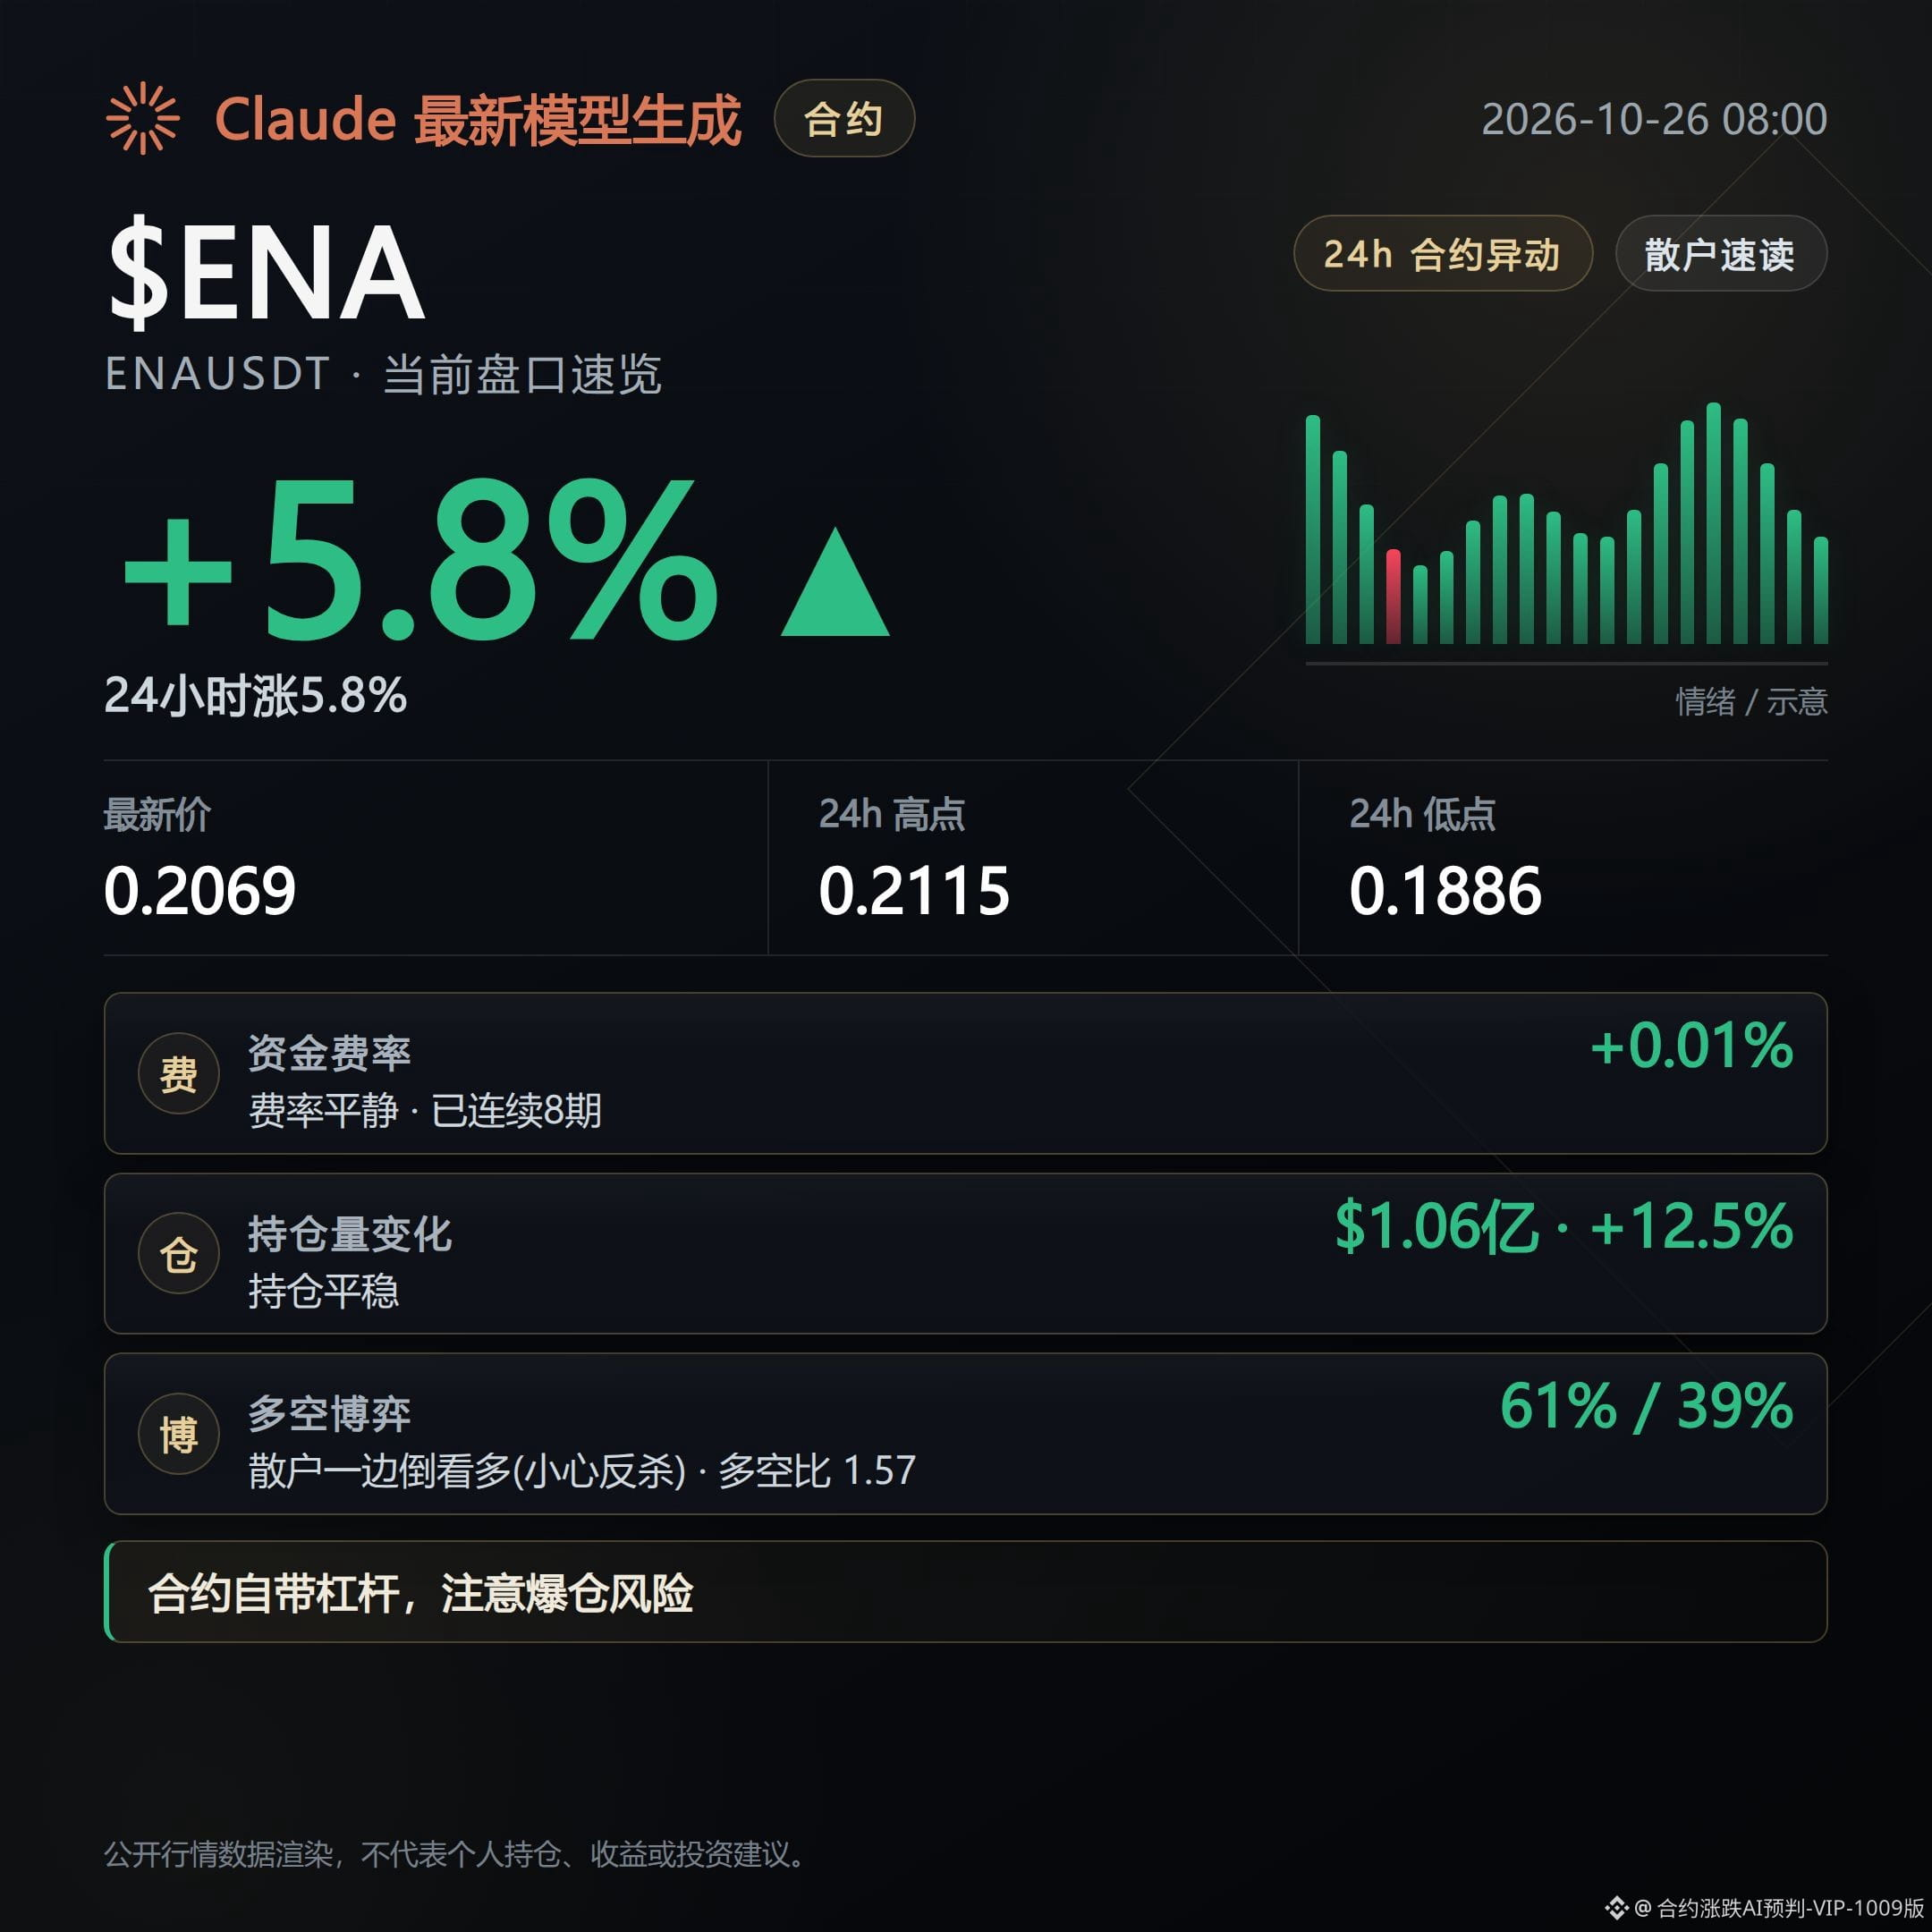
ENA is currently at 0.20687, up 5.79% over the past 24 hours, with trading volume of about $258 million and open interest of about $106 million, up 12.5% over the past 24 hours. The taker buy/sell ratio is 1.14.
This indicates fairly strong alignment between price, positioning, and aggressive buying. Current order-book strength is more pronounced, but a counterpoint is that the overall long/short ratio has reached 1.57, with longs accounting for 61%, meaning the structure is already tilted toward the long side.
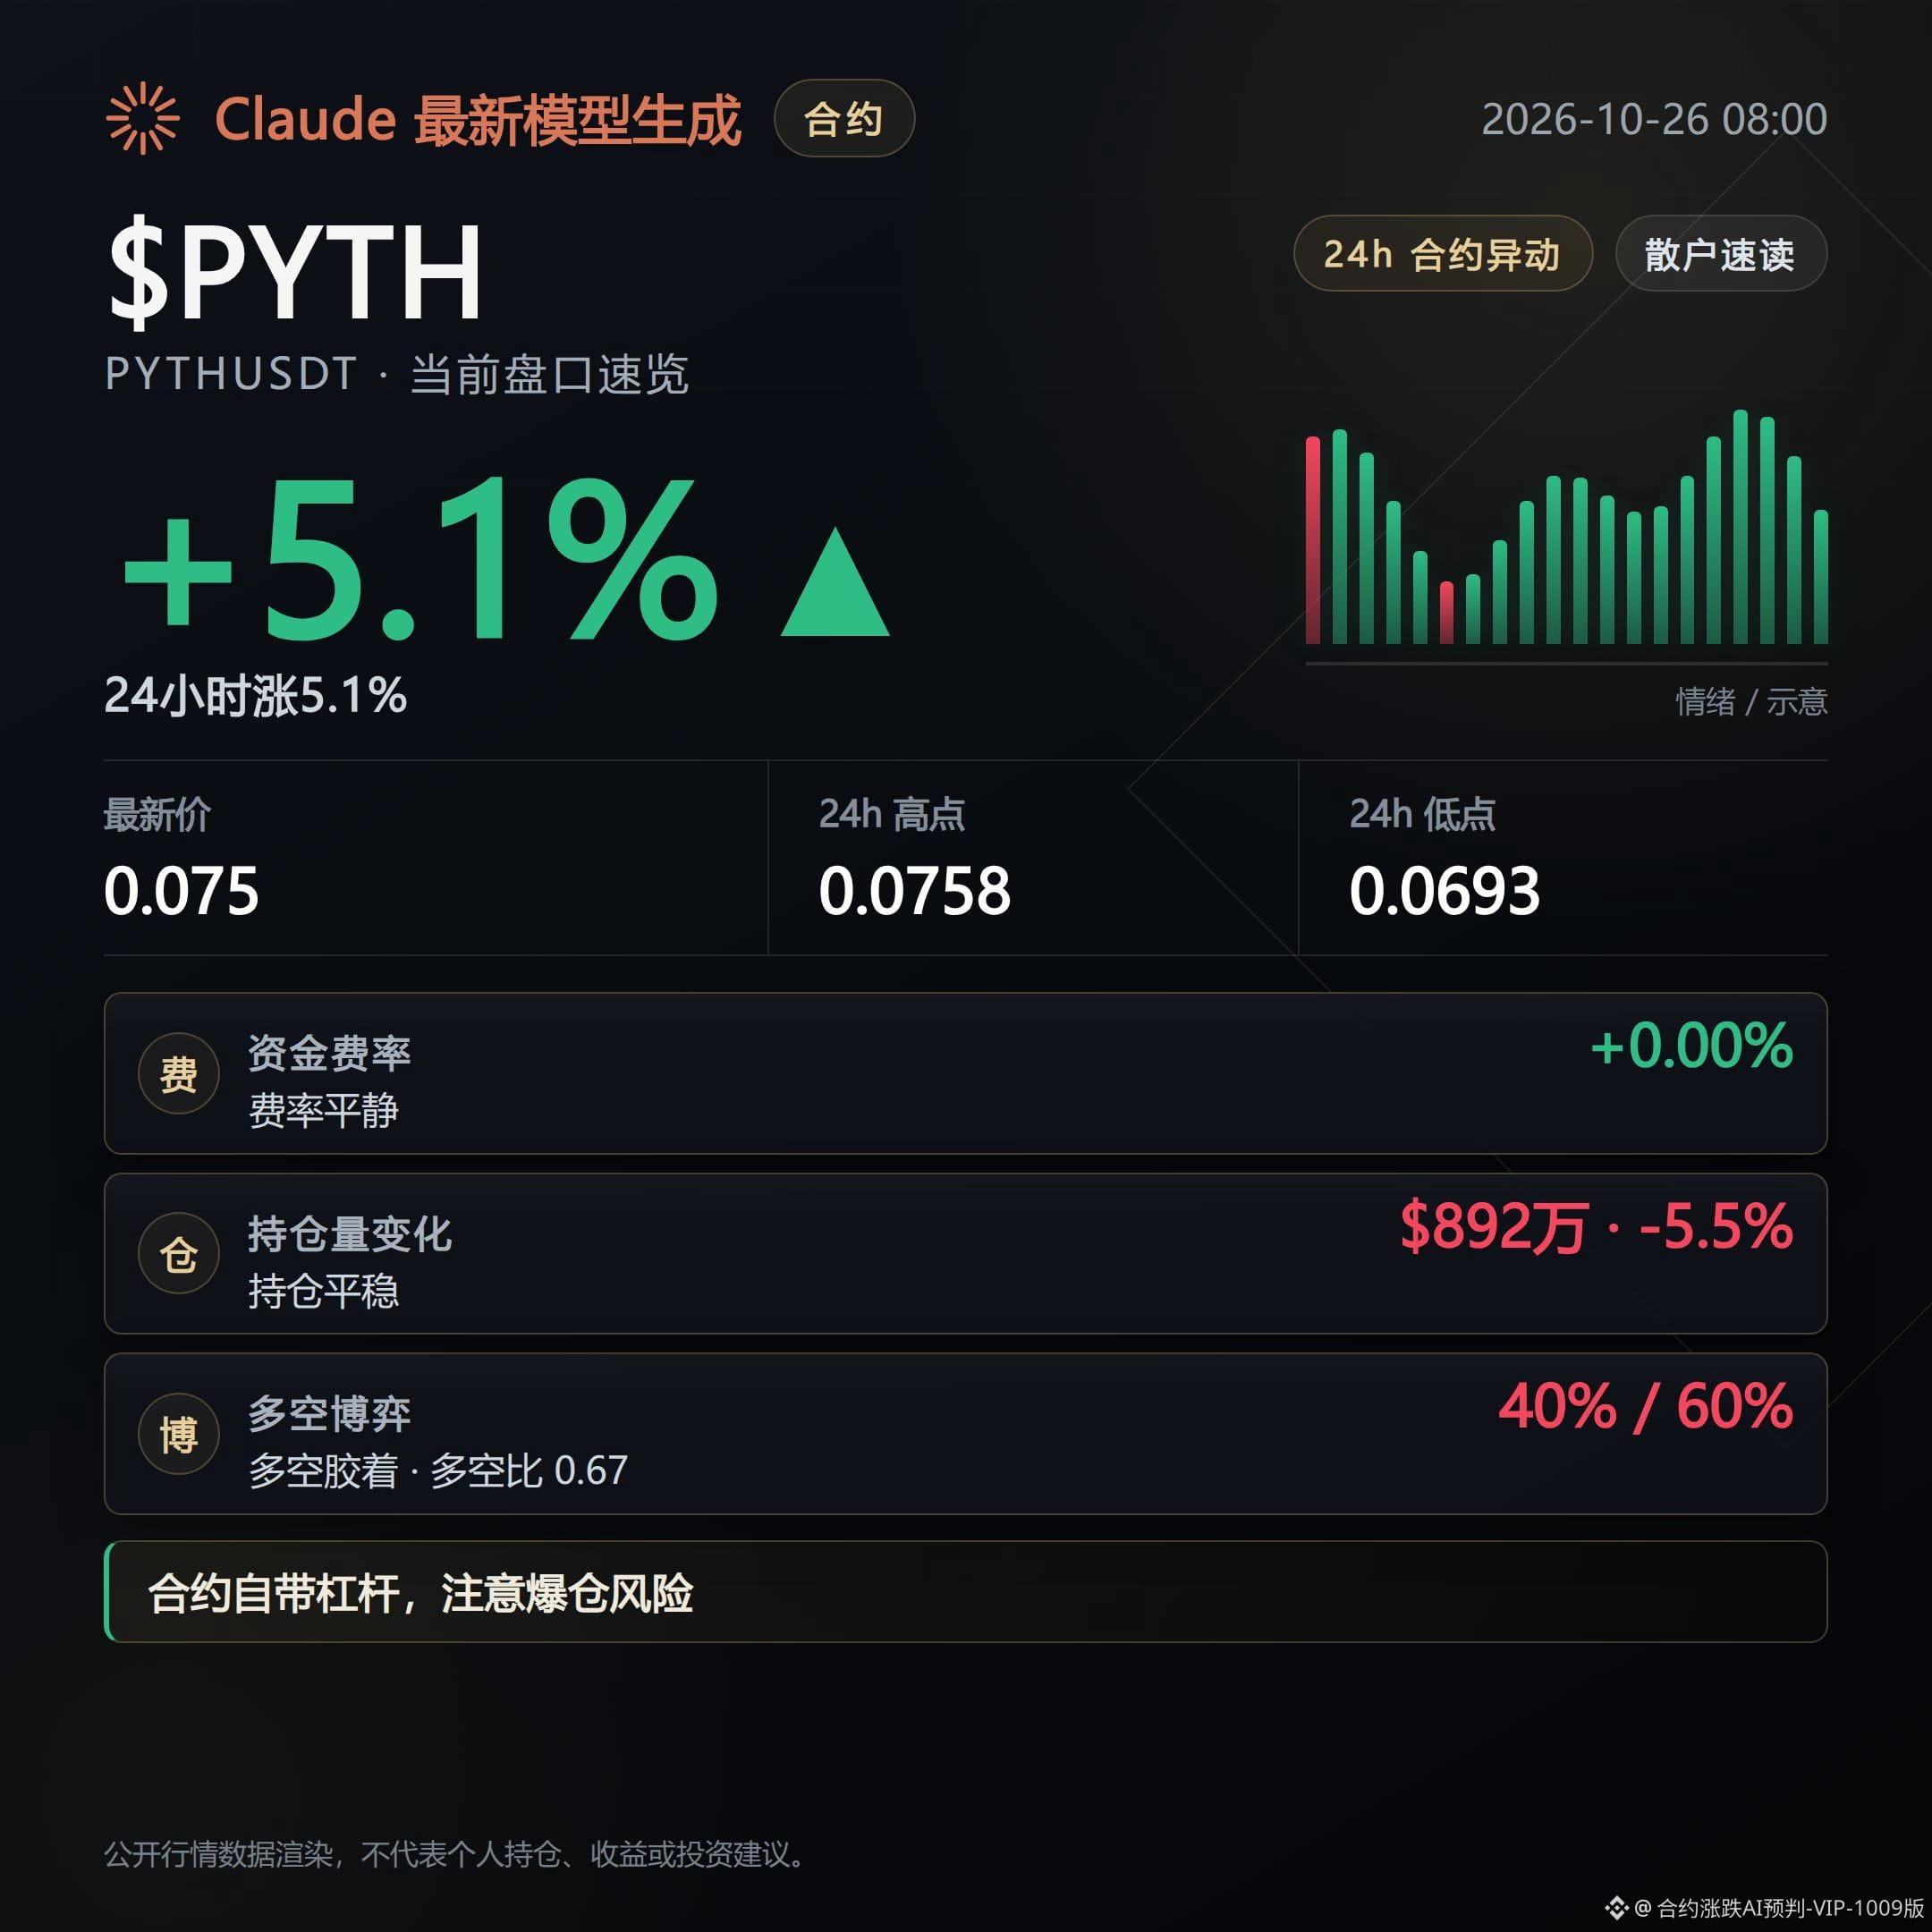
PYTH is currently at 0.07496, up 5.12% over the past 24 hours, with trading volume of about $18.1 million. The Supertrend remains upward, and 1-hour open interest is up 0.5%.
This indicates that positions are starting to recover in the short term. However, a counterpoint is that open interest is still down 5.5% over the past 24 hours, and the taker buy/sell ratio is only 0.83, with aggressive sellers temporarily in control.
If prices continue rising, ENA's open interest expands, CVC's negative-funding structure remains in place, and PYTH's taker buy/sell ratio moves back above 1, this trend could continue. If prices weaken, open interest broadly declines, or aggressive selling remains dominant, this outlook needs to be reassessed.
#PerpetualsOrderBook
This content was generated with the assistance of Claude Fable 5 and is for informational purposes only. Please verify it independently.
Contracts that could surge significantly today
Bullish: For this group, all three have risen in line with the trend over the past 24 hours, and all have maintained an upward Supertrend. ENA stands out most, with open interest and aggressive buying both showing the clearest follow-through.
Positions are building.
Next, watch whether price strength, open interest, and aggressive buying continue to confirm the move.
CVC is currently at 0.02386, up 2.93% over the past 24 hours. The Supertrend remains upward, and the funding rate is -0.0882%, with shorts paying for six consecutive periods.
This means shorts are still paying funding as the price moves with the trend. However, a counterpoint is that open interest is down 1% over the past 24 hours, while 1-hour open interest has not grown. Watch to see whether new positions emerge.
ENA is currently at 0.20687, up 5.79% over the past 24 hours, with trading volume of about $258 million and open interest of about $106 million, up 12.5% over the past 24 hours. The taker buy/sell ratio is 1.14.
This indicates fairly strong alignment between price, positioning, and aggressive buying. Current order-book strength is more pronounced, but a counterpoint is that the overall long/short ratio has reached 1.57, with longs accounting for 61%, meaning the structure is already tilted toward the long side.
PYTH is currently at 0.07496, up 5.12% over the past 24 hours, with trading volume of about $18.1 million. The Supertrend remains upward, and 1-hour open interest is up 0.5%.
This indicates that positions are starting to recover in the short term. However, a counterpoint is that open interest is still down 5.5% over the past 24 hours, and the taker buy/sell ratio is only 0.83, with aggressive sellers temporarily in control.
If prices continue rising, ENA's open interest expands, CVC's negative-funding structure remains in place, and PYTH's taker buy/sell ratio moves back above 1, this trend could continue. If prices weaken, open interest broadly declines, or aggressive selling remains dominant, this outlook needs to be reassessed.
#PerpetualsOrderBook
This content was generated with the assistance of Claude Fable 5 and is for informational purposes only. Please verify it independently.
Bullish: For this group, all three have risen in line with the trend over the past 24 hours, and all have maintained an upward Supertrend. ENA stands out most, with open interest and aggressive buying both showing the clearest follow-through.
Positions are building.
Next, watch whether price strength, open interest, and aggressive buying continue to confirm the move.
CVC is currently at 0.02386, up 2.93% over the past 24 hours. The Supertrend remains upward, and the funding rate is -0.0882%, with shorts paying for six consecutive periods.
This means shorts are still paying funding as the price moves with the trend. However, a counterpoint is that open interest is down 1% over the past 24 hours, while 1-hour open interest has not grown. Watch to see whether new positions emerge.
ENA is currently at 0.20687, up 5.79% over the past 24 hours, with trading volume of about $258 million and open interest of about $106 million, up 12.5% over the past 24 hours. The taker buy/sell ratio is 1.14.
This indicates fairly strong alignment between price, positioning, and aggressive buying. Current order-book strength is more pronounced, but a counterpoint is that the overall long/short ratio has reached 1.57, with longs accounting for 61%, meaning the structure is already tilted toward the long side.
PYTH is currently at 0.07496, up 5.12% over the past 24 hours, with trading volume of about $18.1 million. The Supertrend remains upward, and 1-hour open interest is up 0.5%.
This indicates that positions are starting to recover in the short term. However, a counterpoint is that open interest is still down 5.5% over the past 24 hours, and the taker buy/sell ratio is only 0.83, with aggressive sellers temporarily in control.
If prices continue rising, ENA's open interest expands, CVC's negative-funding structure remains in place, and PYTH's taker buy/sell ratio moves back above 1, this trend could continue. If prices weaken, open interest broadly declines, or aggressive selling remains dominant, this outlook needs to be reassessed.
#PerpetualsOrderBook
This content was generated with the assistance of Claude Fable 5 and is for informational purposes only. Please verify it independently.
266
Futures Market Daily|10/26 Deleveraging Below $80,000 Isn’t Over Yet
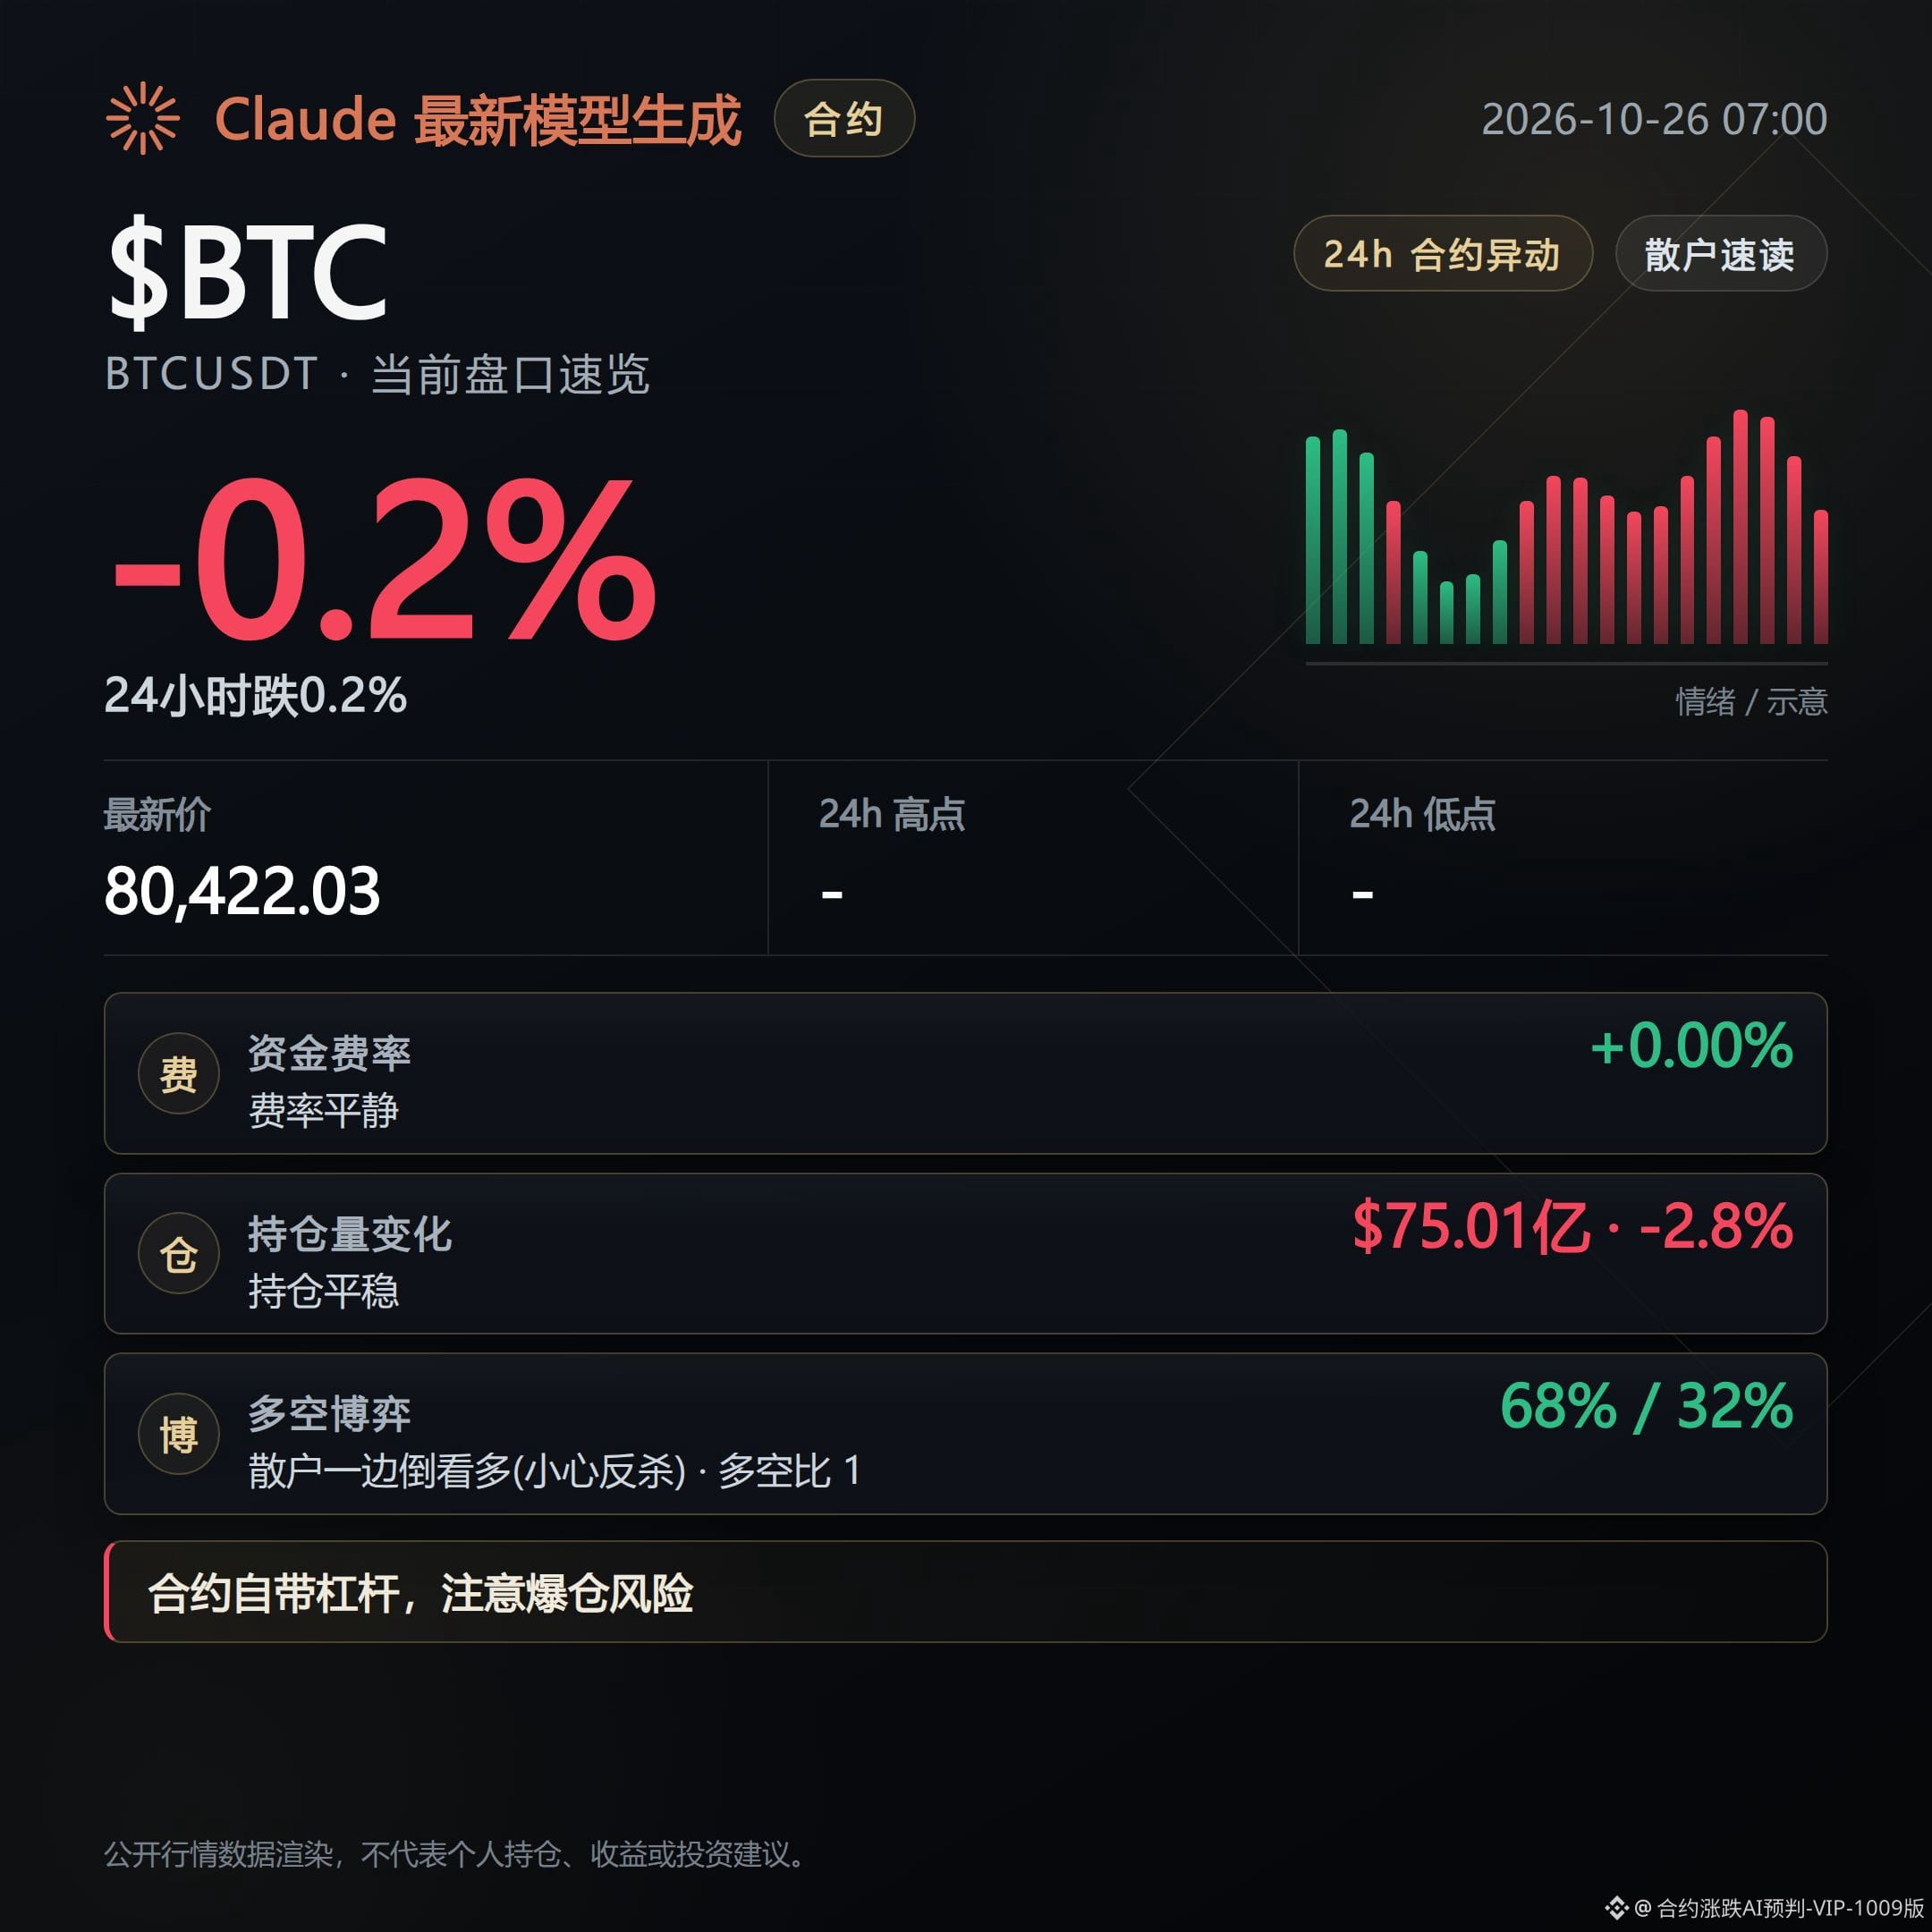
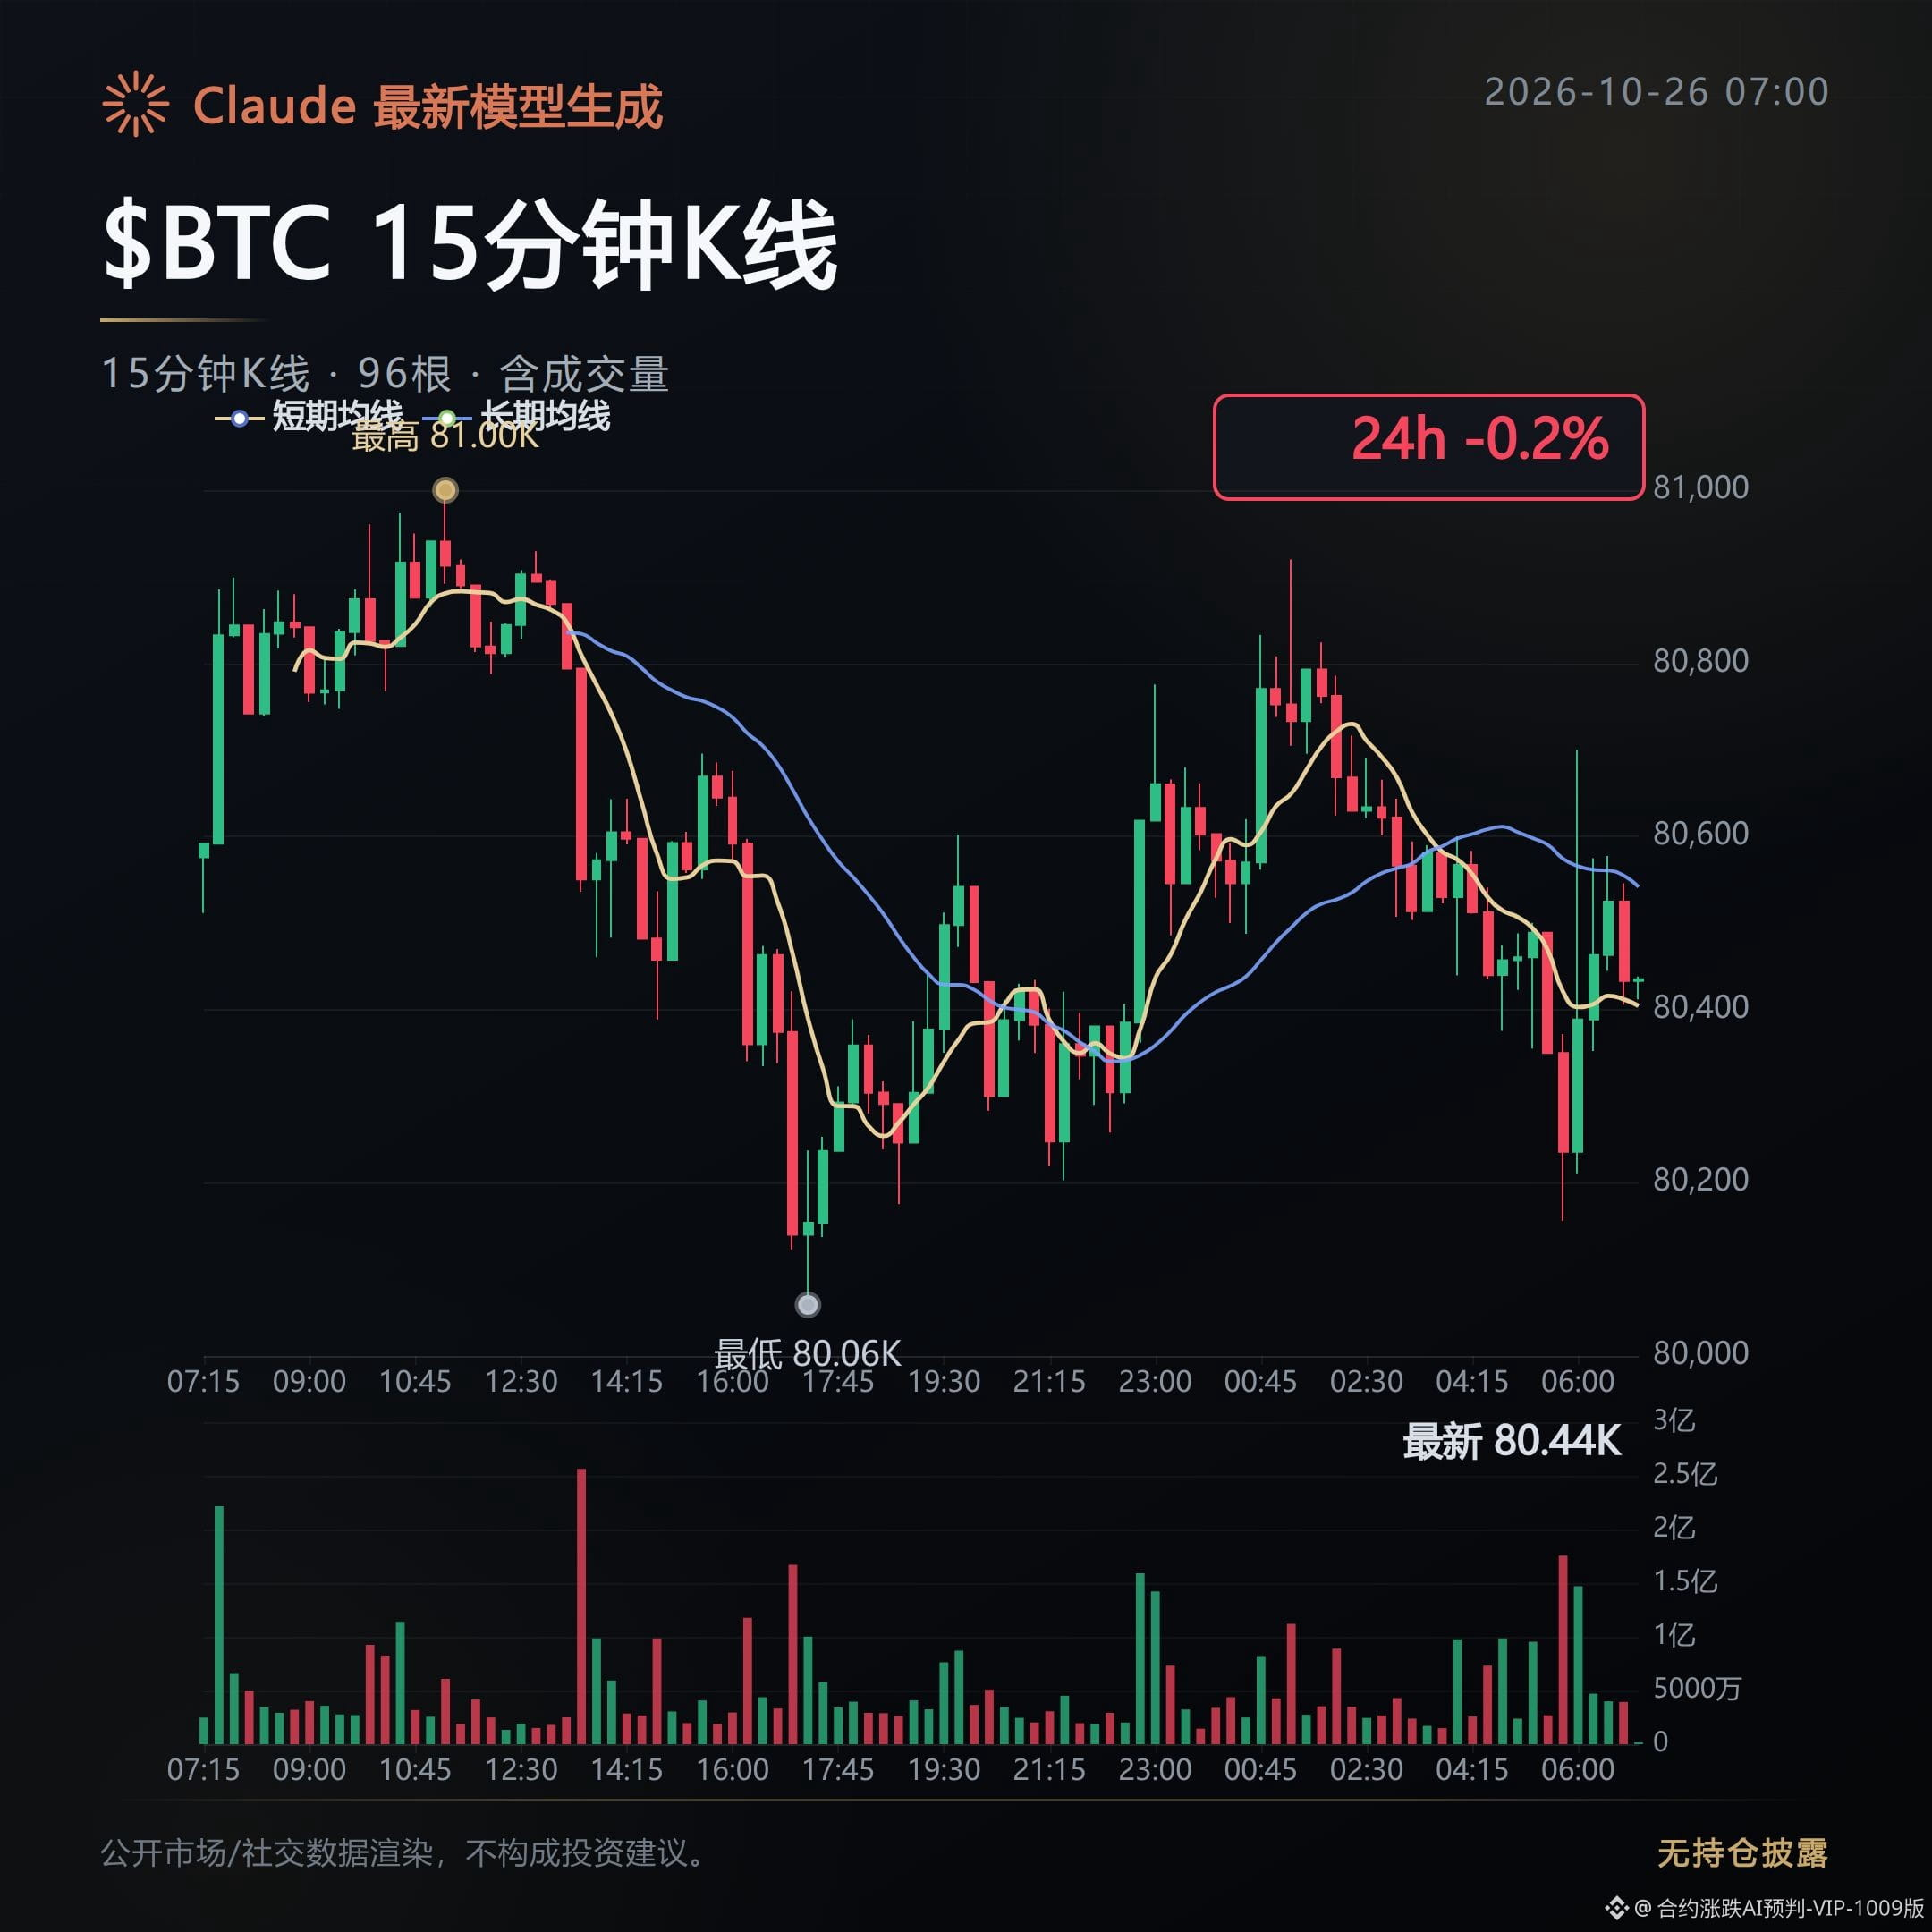
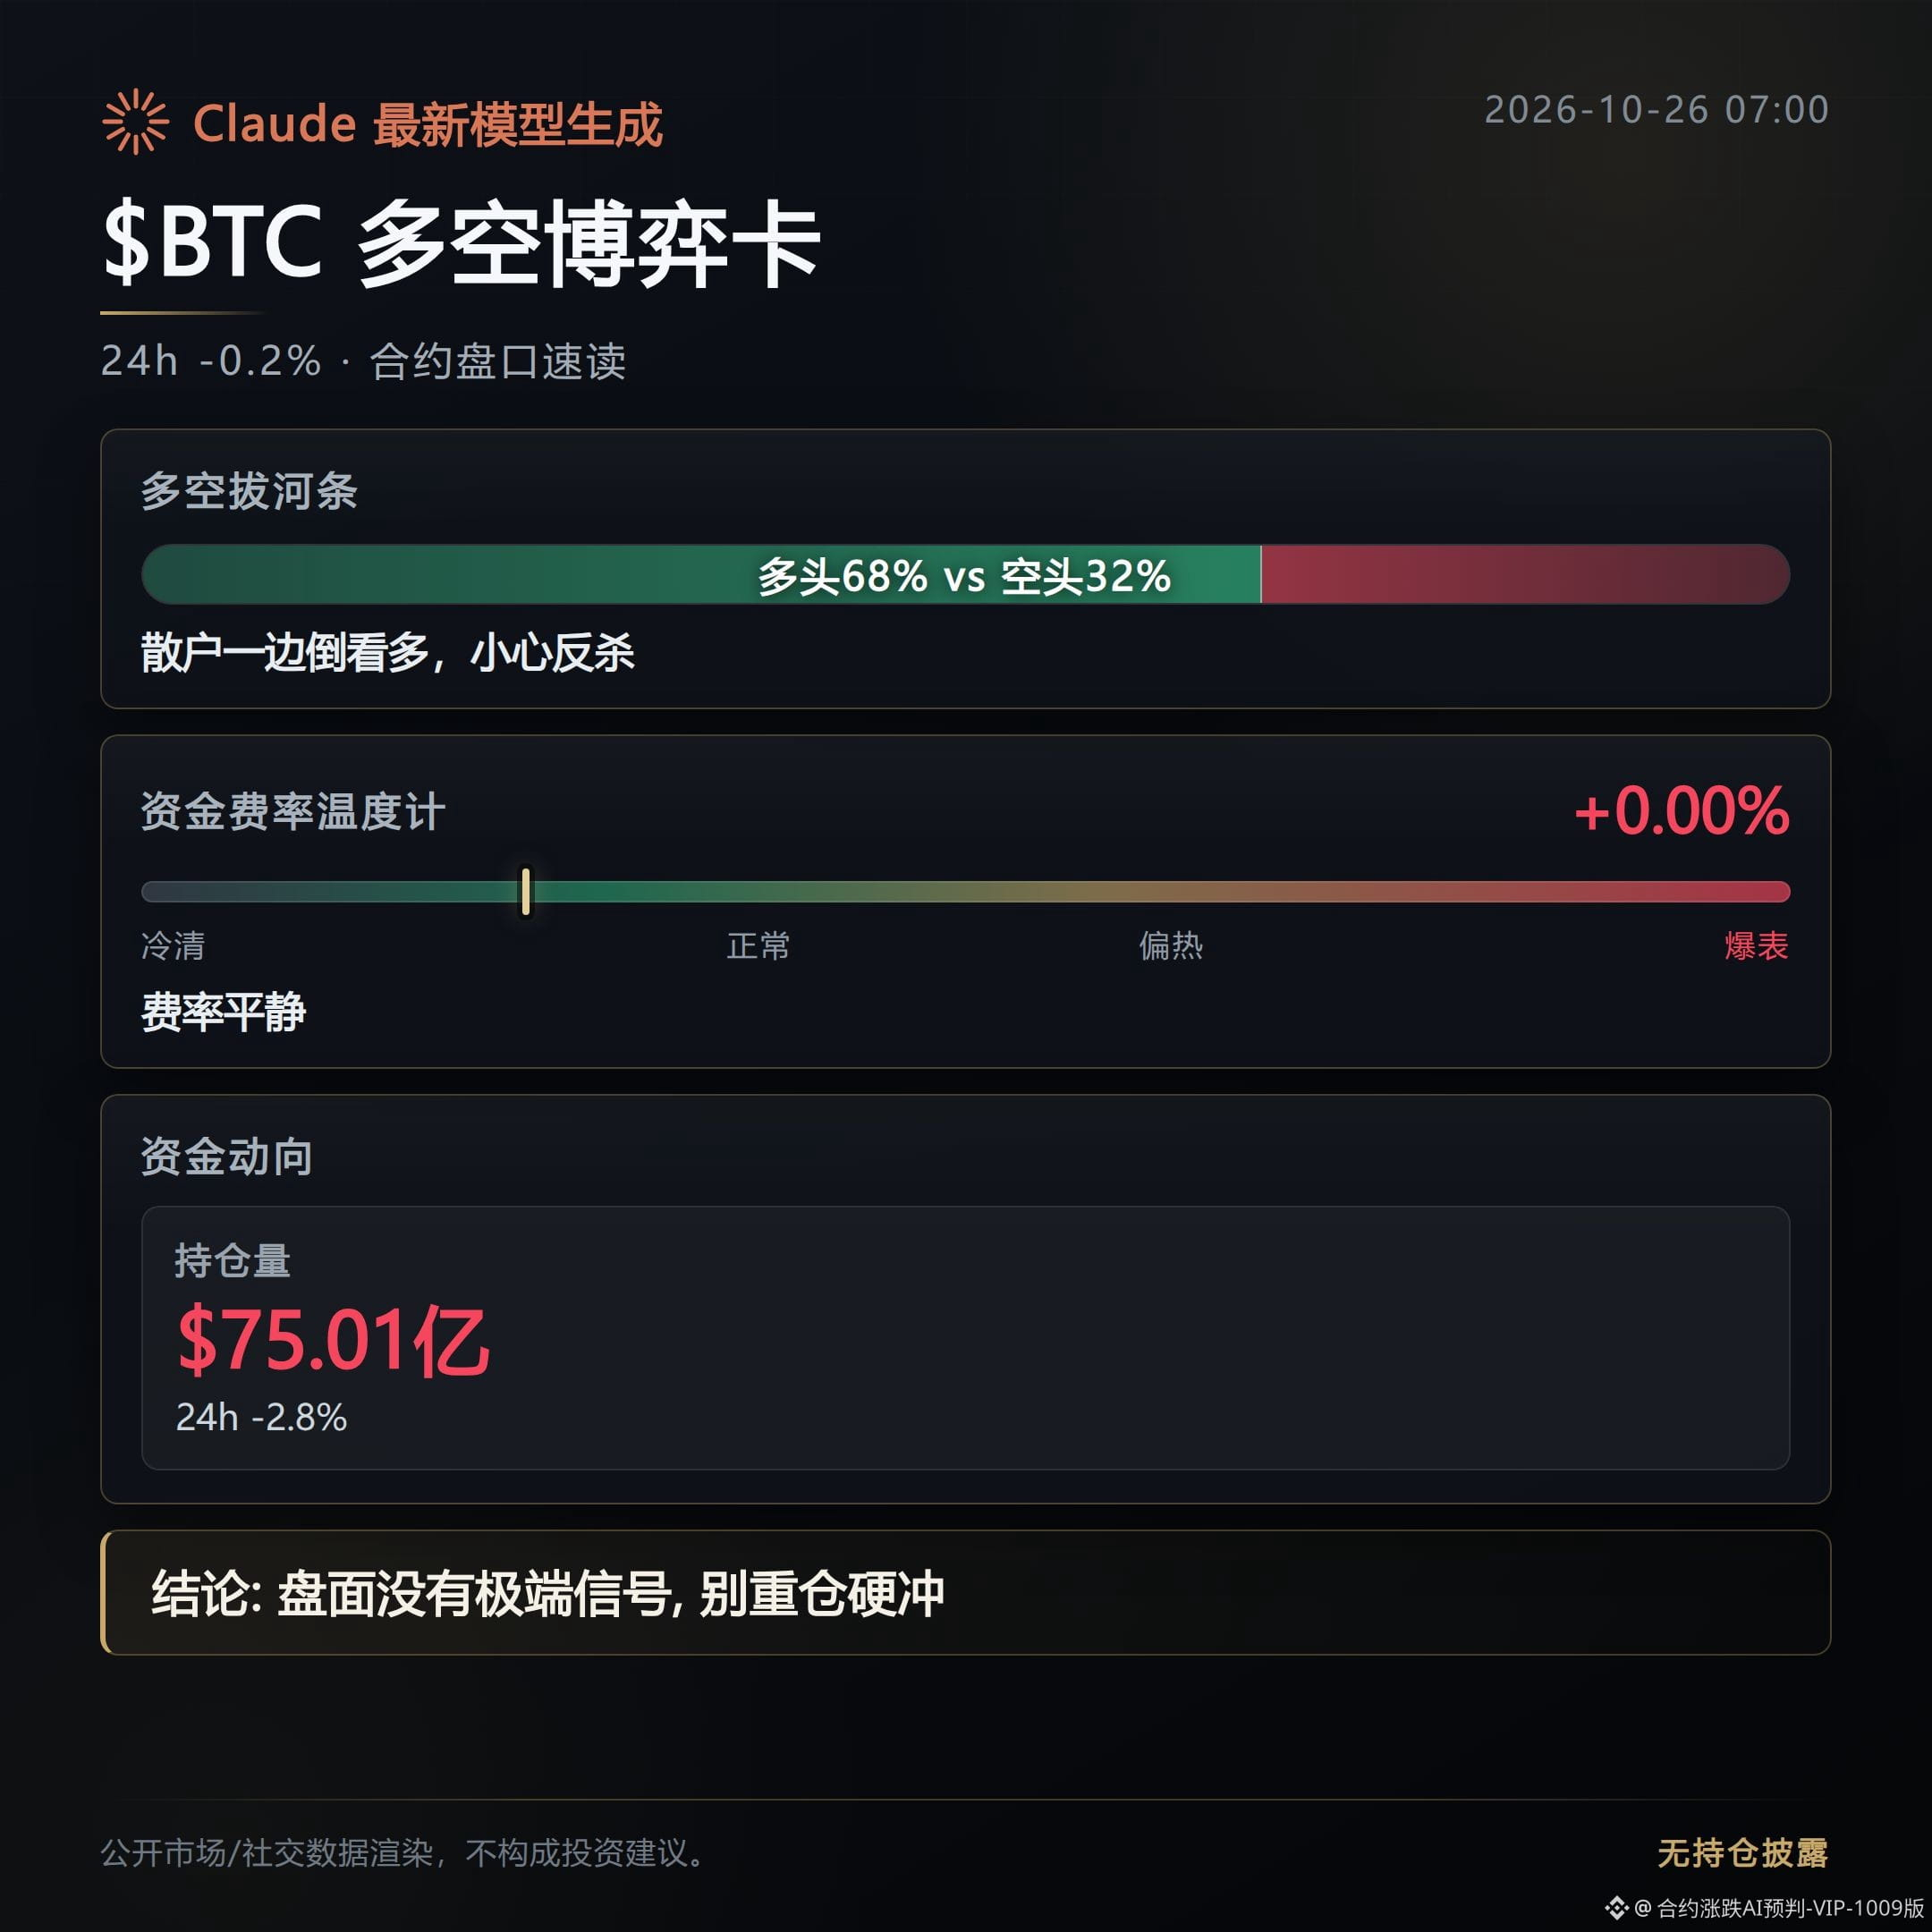
$BTC is trading at $80,422, down 0.19%. Futures open interest fell to $7.501 billion, a change of -2.8%.
Long liquidations totaled $404 million over four hours, and the price briefly fell below $80,000. This decline first flushed out highly leveraged long positions.
But the market is still crowded.
Longs still account for 68%, and the market-wide long/short ratio is 1.8385. The taker buy/sell ratio is just 0.81, indicating that positions remain skewed long even as sellers dominate trading.
$BTC funding rates remain positive, while $ETH and $SOL funding rates are 0.0088% and 0.0094%, respectively. Longs are still paying to hold their positions during the decline, so a further pullback could trigger a second wave of position reductions.
The spot market has also yet to establish a clear floor.
Bitcoin spot funds saw net inflows of $301 million over the week, but flows turned negative toward the weekend. Weekly inflows and short-term outflows are occurring at the same time, so this cannot be taken as a reversal signal.
The Fear and Greed Index stands at 54, in neutral territory. Sentiment is not yet extreme, meaning there is still no confirmation that panic-driven selling has run its course.
For now, watch just two levels: whether $80,000 can be reclaimed and held, and whether the taker sell ratio can move back above 1 after open interest declines.
If the price holds above $80,000 but buying doesn’t return, that would be a weak recovery. If it falls below that level again while the long share remains high, deleveraging isn’t over yet.
#BTC #FuturesMarket
Generated with assistance from Claude Fable 5. For market information only; this is not investment advice.
Futures Market Daily|10/26 Deleveraging Below $80,000 Isn’t Over Yet
$BTC is trading at $80,422, down 0.19%. Futures open interest fell to $7.501 billion, a change of -2.8%.
Long liquidations totaled $404 million over four hours, and the price briefly fell below $80,000. This decline first flushed out highly leveraged long positions.
But the market is still crowded.
Longs still account for 68%, and the market-wide long/short ratio is 1.8385. The taker buy/sell ratio is just 0.81, indicating that positions remain skewed long even as sellers dominate trading.
$BTC funding rates remain positive, while $ETH and $SOL funding rates are 0.0088% and 0.0094%, respectively. Longs are still paying to hold their positions during the decline, so a further pullback could trigger a second wave of position reductions.
The spot market has also yet to establish a clear floor.
Bitcoin spot funds saw net inflows of $301 million over the week, but flows turned negative toward the weekend. Weekly inflows and short-term outflows are occurring at the same time, so this cannot be taken as a reversal signal.
The Fear and Greed Index stands at 54, in neutral territory. Sentiment is not yet extreme, meaning there is still no confirmation that panic-driven selling has run its course.
For now, watch just two levels: whether $80,000 can be reclaimed and held, and whether the taker sell ratio can move back above 1 after open interest declines.
If the price holds above $80,000 but buying doesn’t return, that would be a weak recovery. If it falls below that level again while the long share remains high, deleveraging isn’t over yet.
#BTC #FuturesMarket
Generated with assistance from Claude Fable 5. For market information only; this is not investment advice.
$BTC is trading at $80,422, down 0.19%. Futures open interest fell to $7.501 billion, a change of -2.8%.
Long liquidations totaled $404 million over four hours, and the price briefly fell below $80,000. This decline first flushed out highly leveraged long positions.
But the market is still crowded.
Longs still account for 68%, and the market-wide long/short ratio is 1.8385. The taker buy/sell ratio is just 0.81, indicating that positions remain skewed long even as sellers dominate trading.
$BTC funding rates remain positive, while $ETH and $SOL funding rates are 0.0088% and 0.0094%, respectively. Longs are still paying to hold their positions during the decline, so a further pullback could trigger a second wave of position reductions.
The spot market has also yet to establish a clear floor.
Bitcoin spot funds saw net inflows of $301 million over the week, but flows turned negative toward the weekend. Weekly inflows and short-term outflows are occurring at the same time, so this cannot be taken as a reversal signal.
The Fear and Greed Index stands at 54, in neutral territory. Sentiment is not yet extreme, meaning there is still no confirmation that panic-driven selling has run its course.
For now, watch just two levels: whether $80,000 can be reclaimed and held, and whether the taker sell ratio can move back above 1 after open interest declines.
If the price holds above $80,000 but buying doesn’t return, that would be a weak recovery. If it falls below that level again while the long share remains high, deleveraging isn’t over yet.
#BTC #FuturesMarket
Generated with assistance from Claude Fable 5. For market information only; this is not investment advice.
213
Today’s futures market hot spots: just keep an eye on these few.
Capital is clearly crowding into high-beta coins, but open interest has surged at the same time, and the order books are already starting to look crowded.
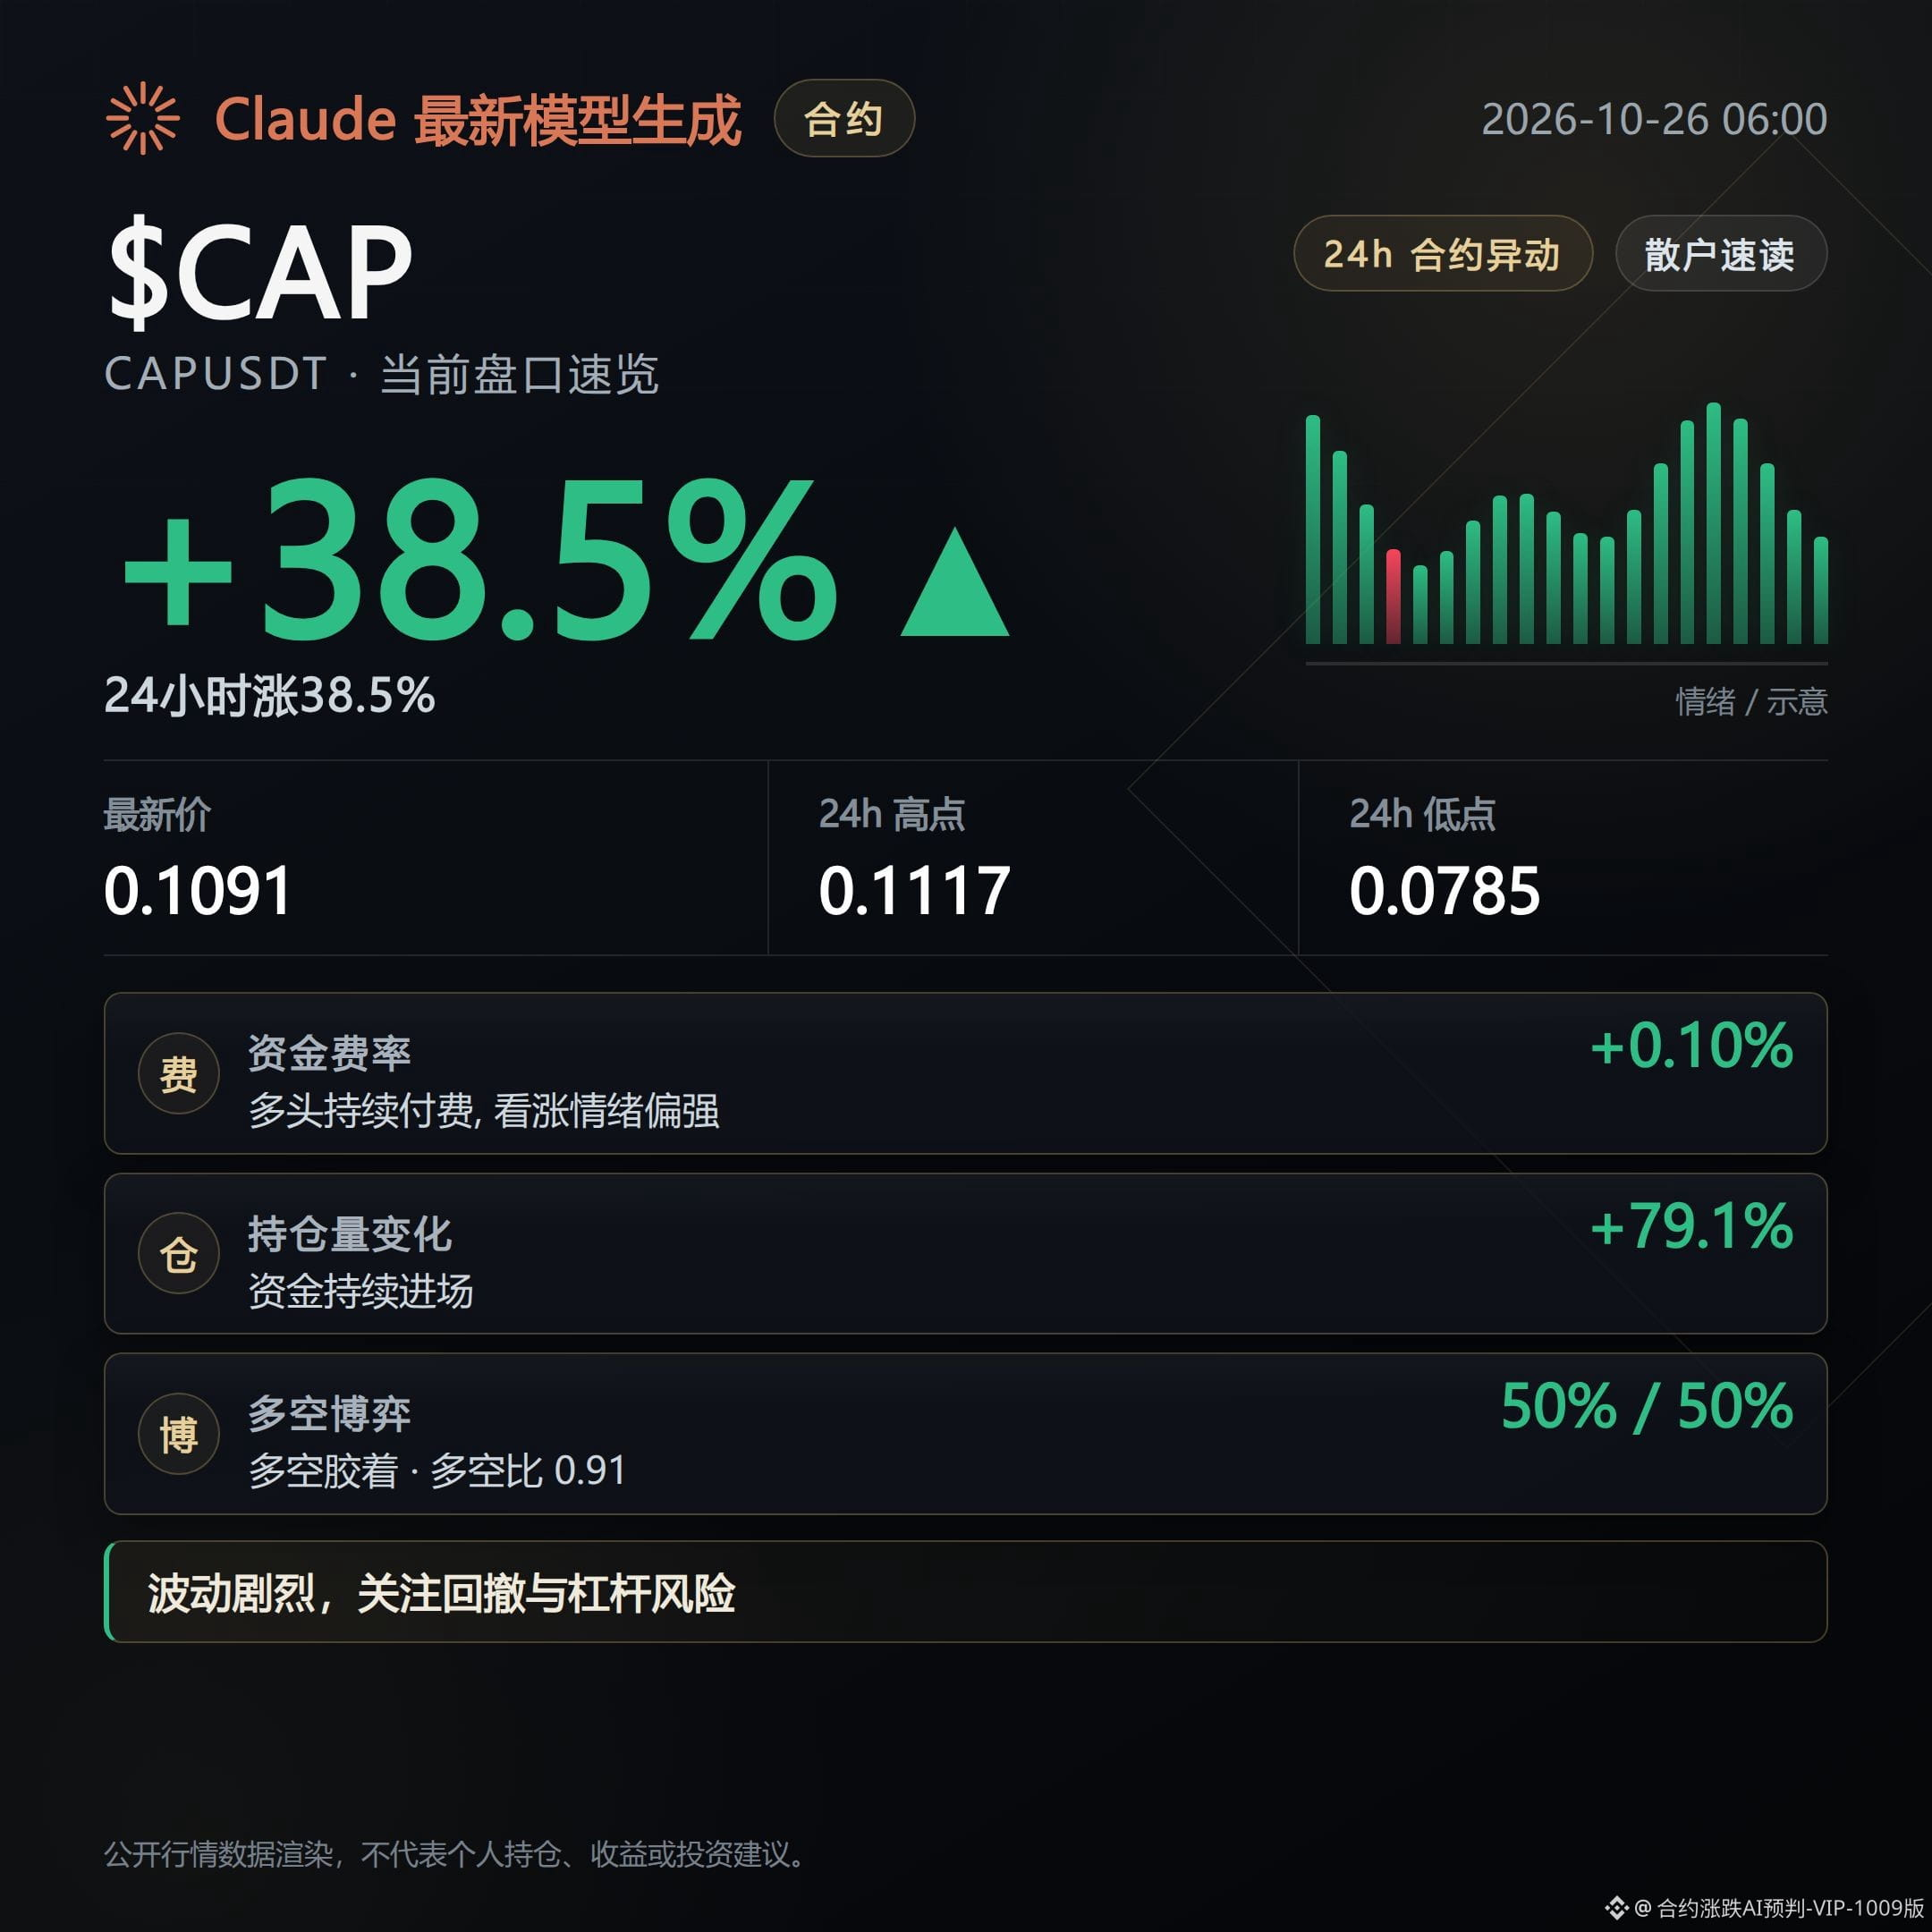
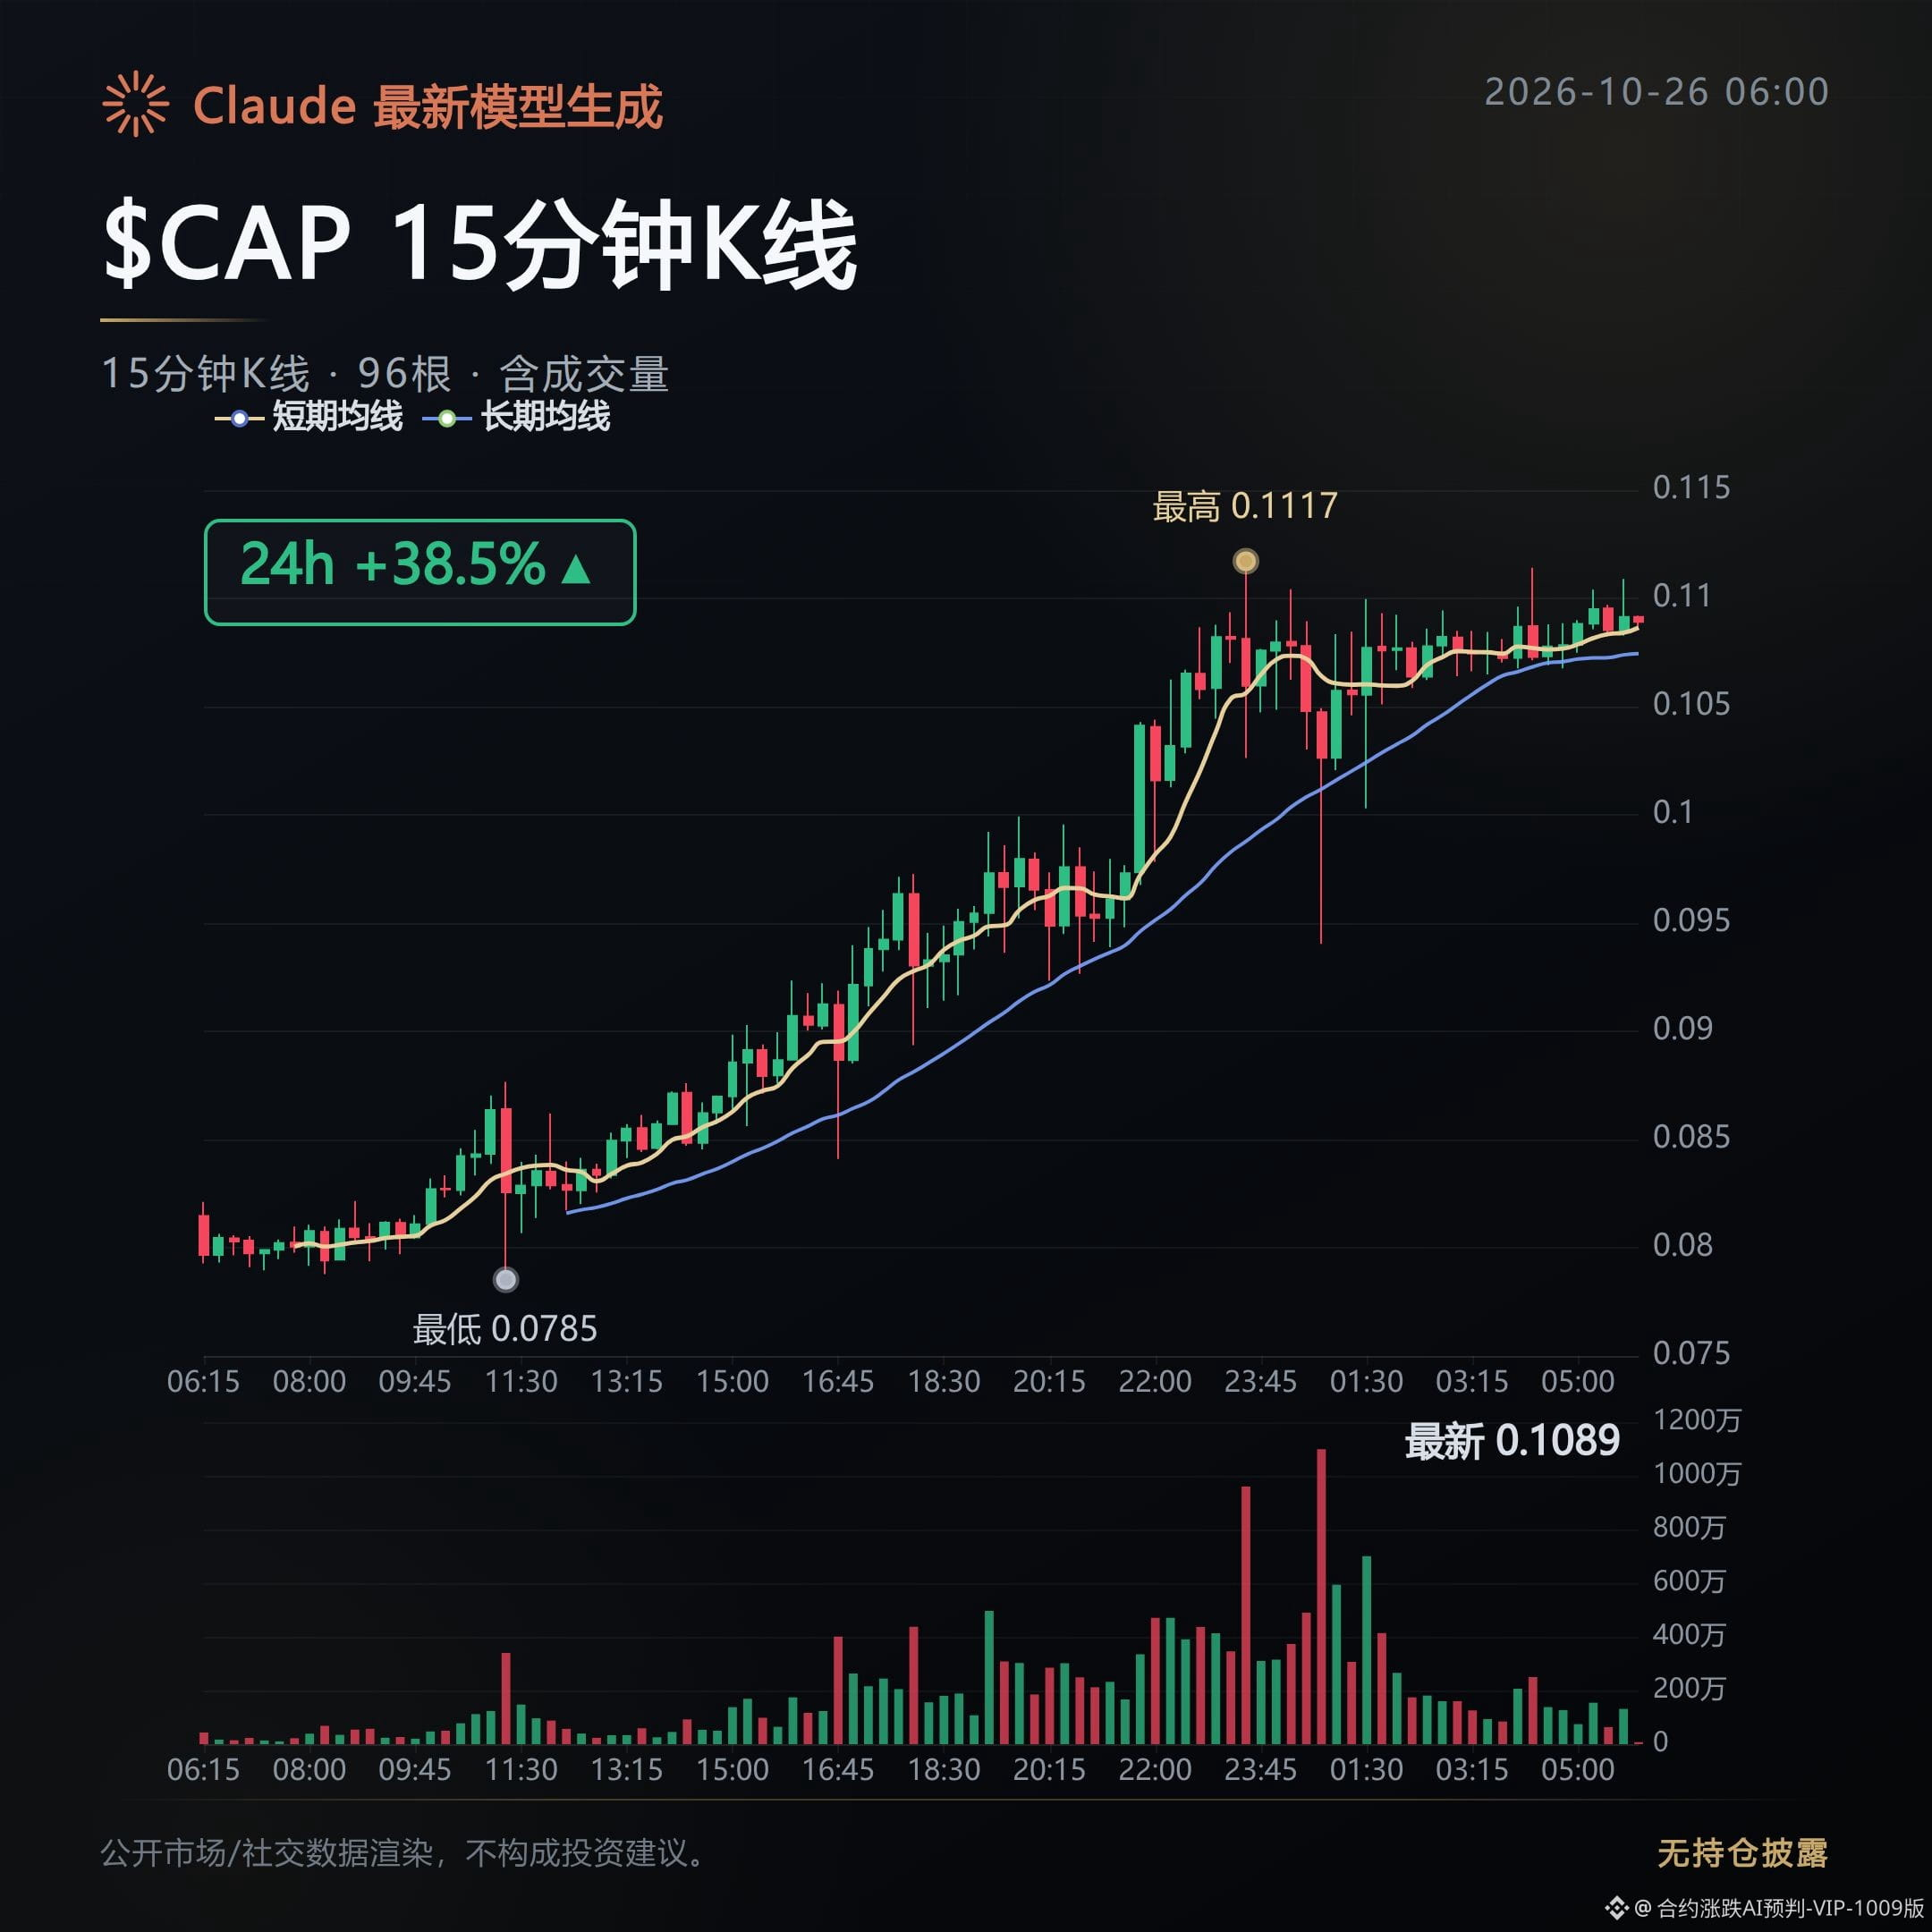
$CAP is up 38.5%, currently at 0.10906, not far from its 24-hour high of 0.11172. Trading volume of $189 million is backing the move—it’s not a low-volume spike.
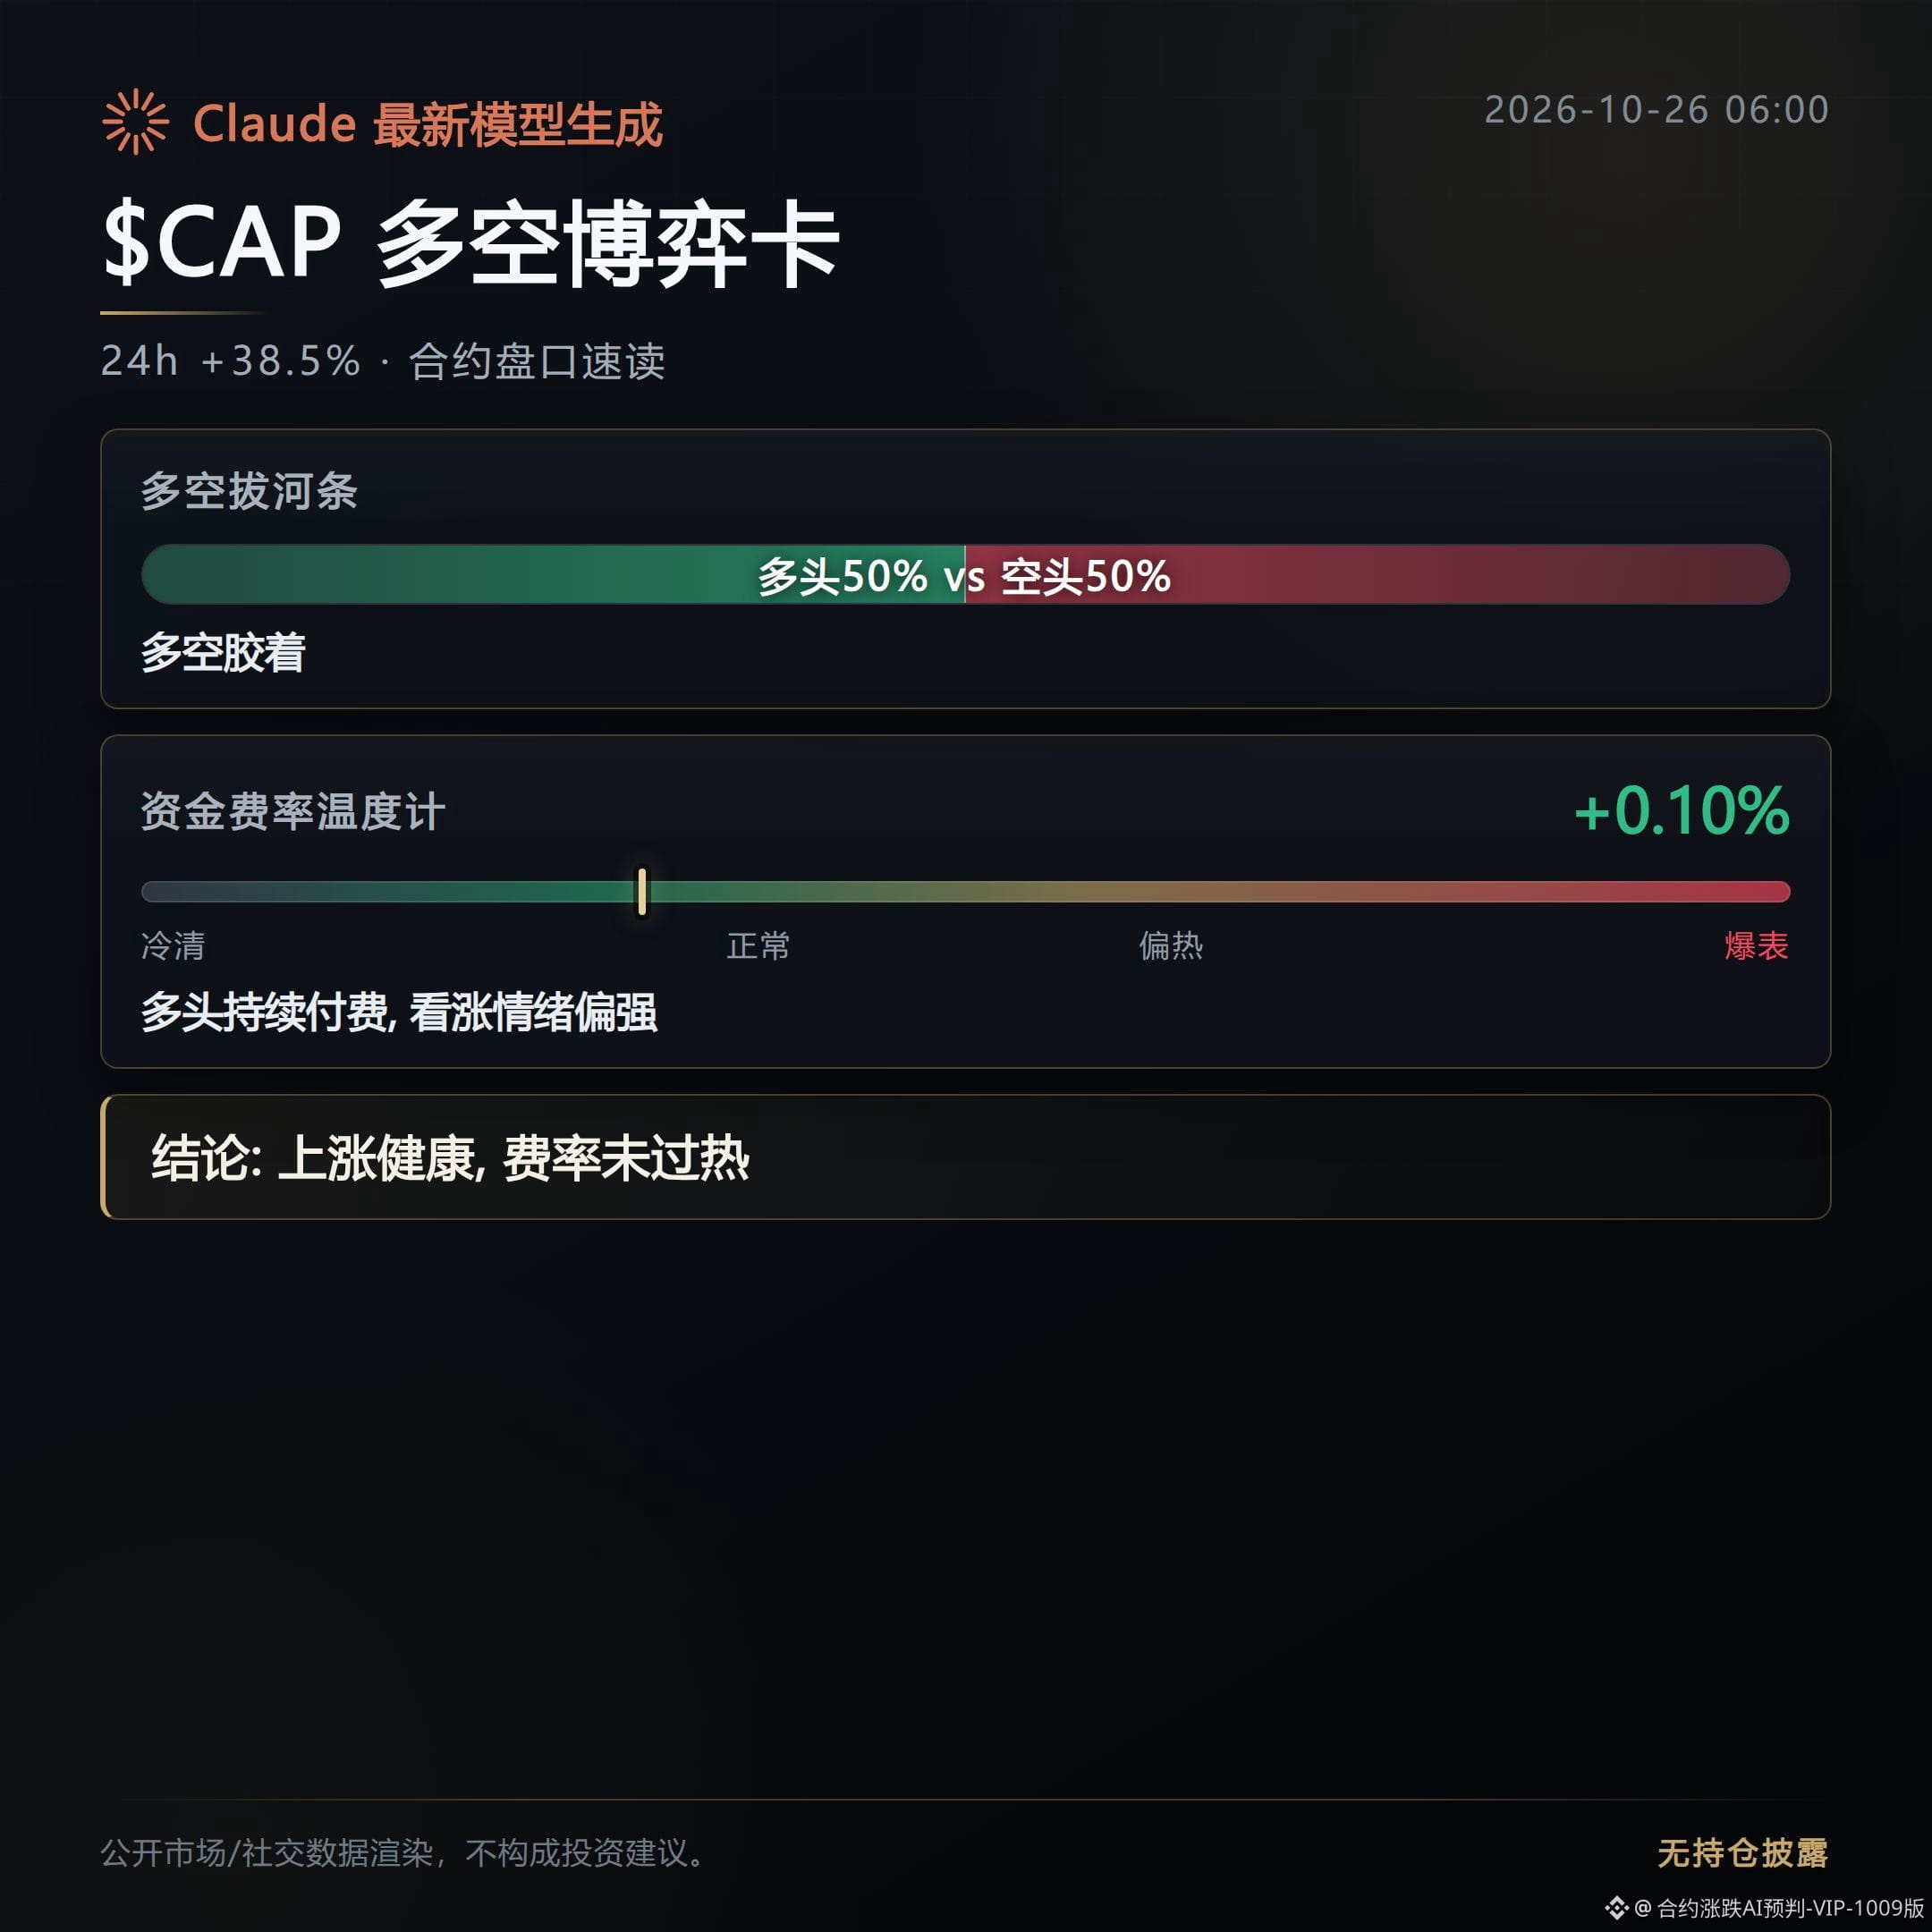
Open interest has jumped 79.1%. The long/short account ratio is just 0.91, and aggressive buying has a slight edge, so there may still be room for a squeeze.
But the funding rate is already at 0.095%, meaning longs are paying to hold their positions. The hotter it gets, the more volatility can expand.
$TA is up 18.7%, with open interest up 40.1%—this doesn’t look like a move that has built up gradually.
However, long accounts are clearly dominant, while aggressive selling is slightly stronger. The price could see repeated reversals as it nears its 24-hour high.
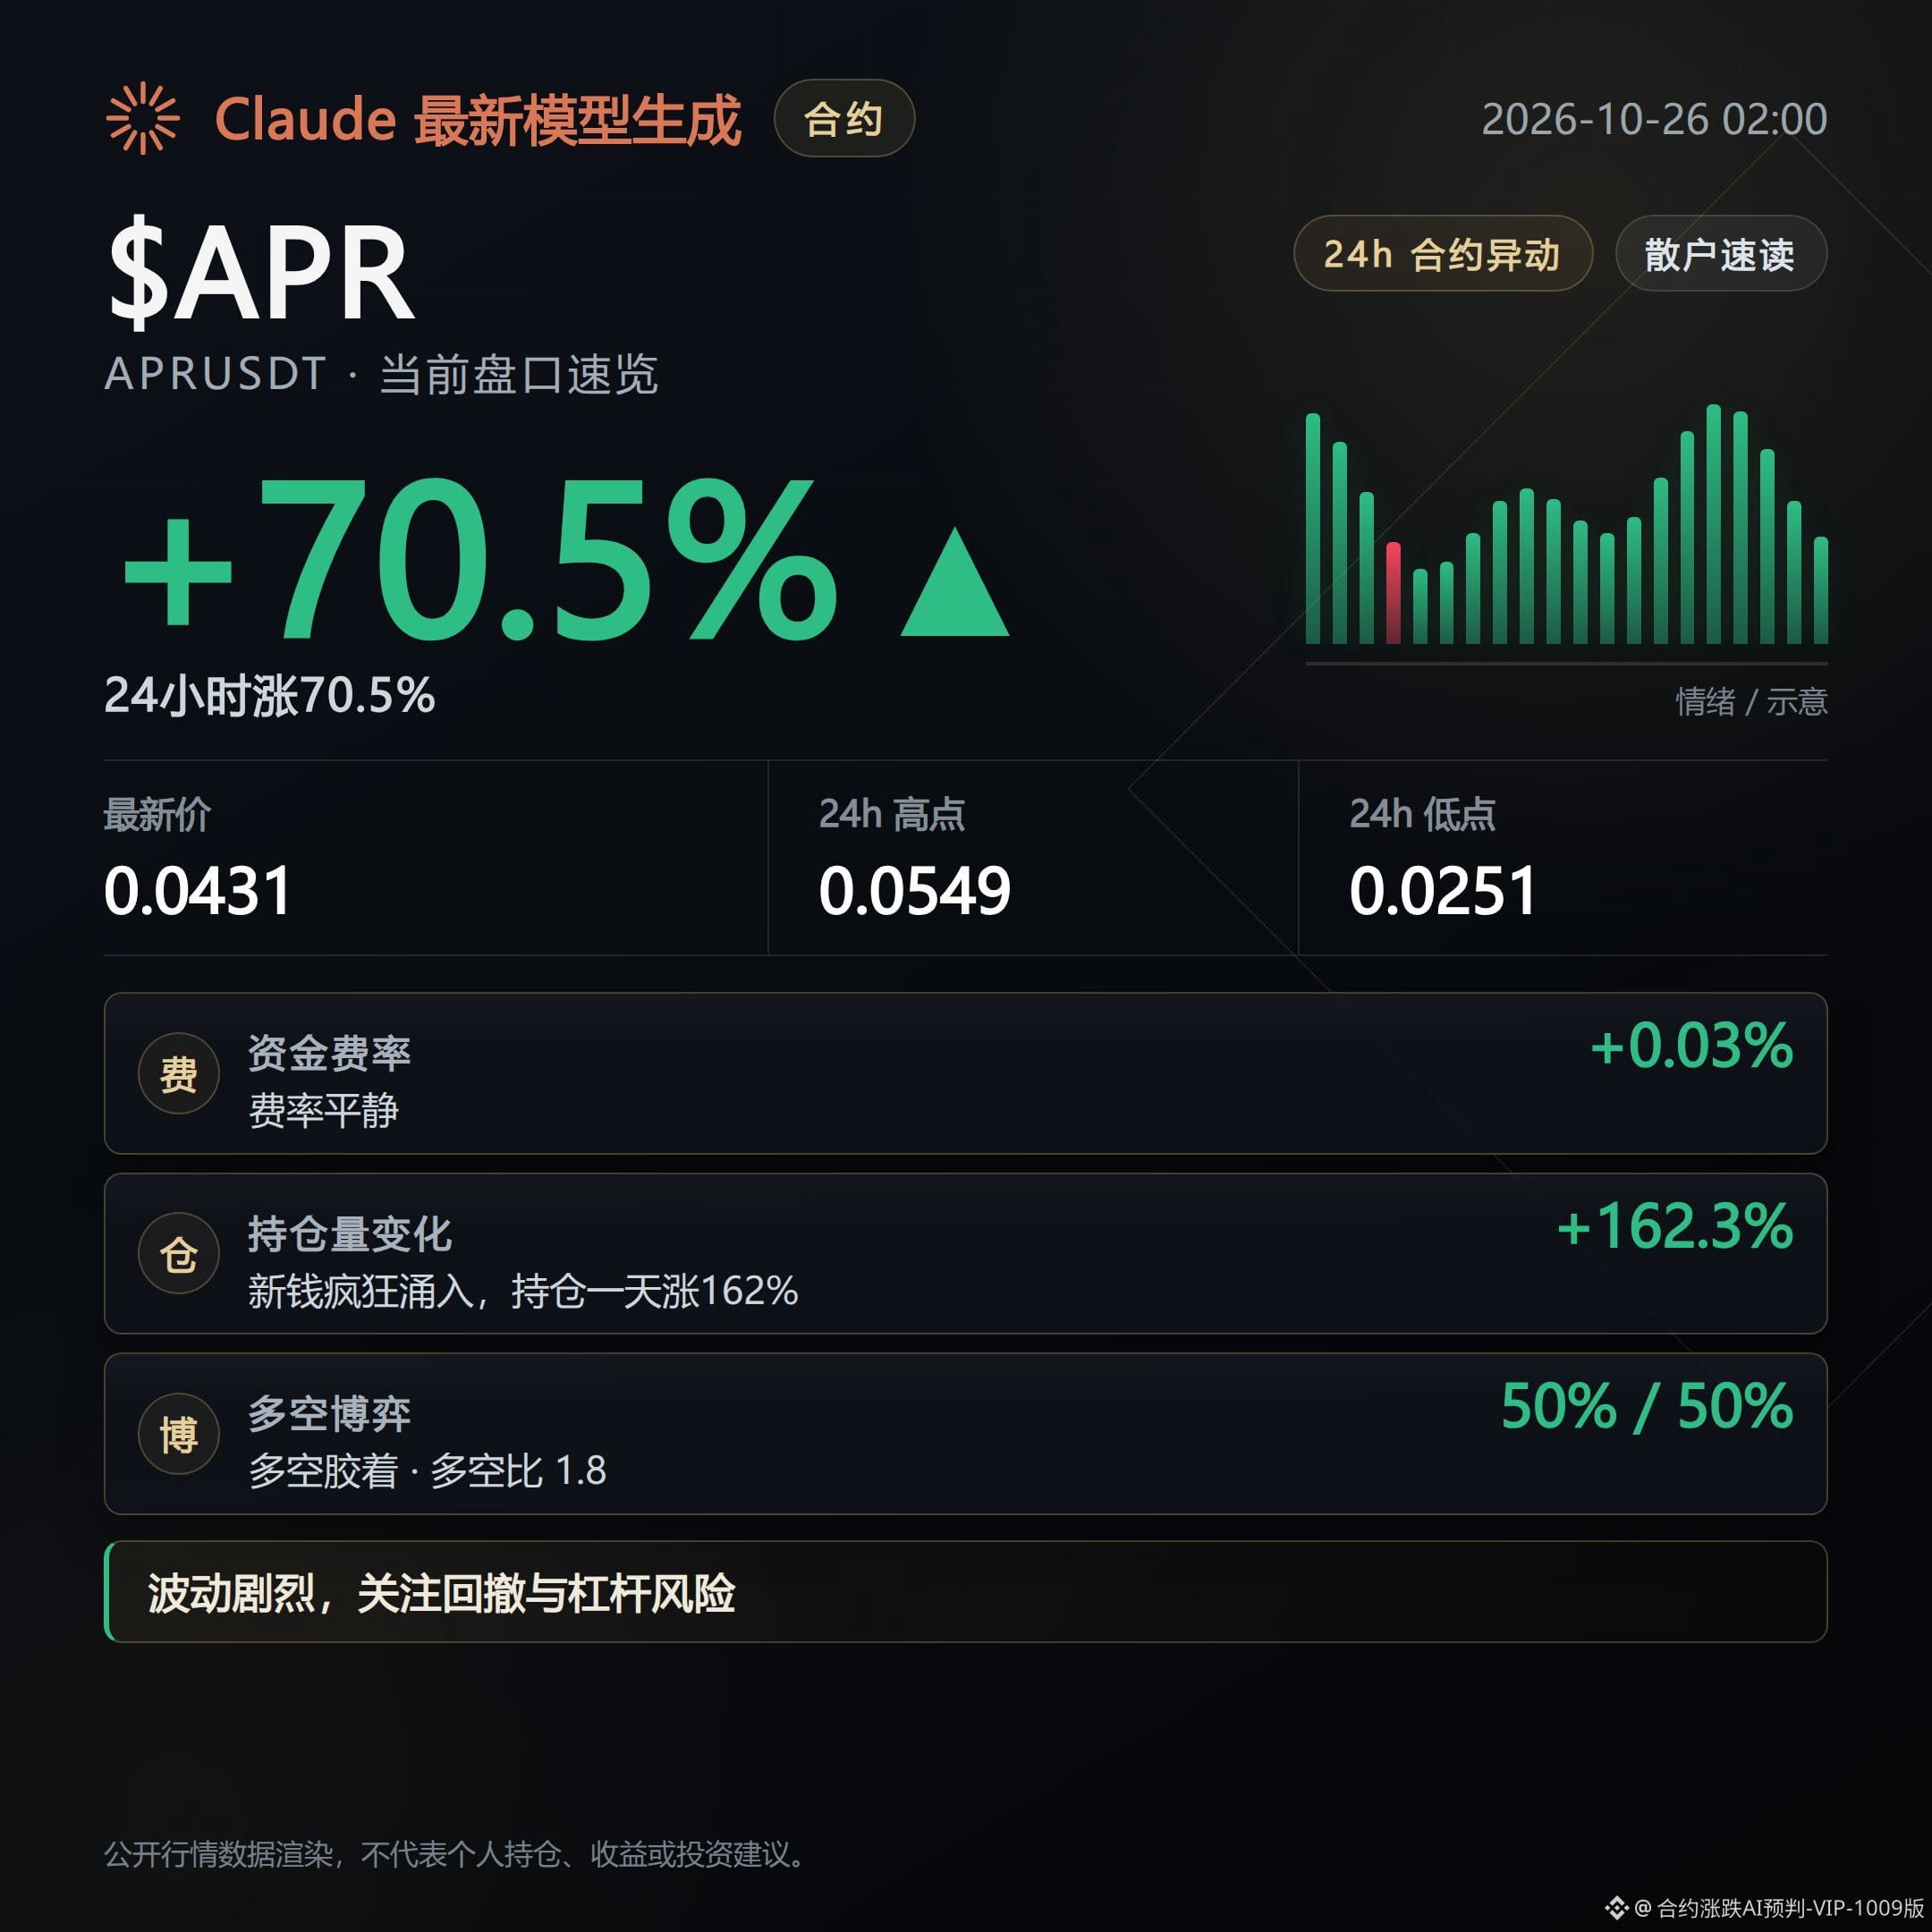
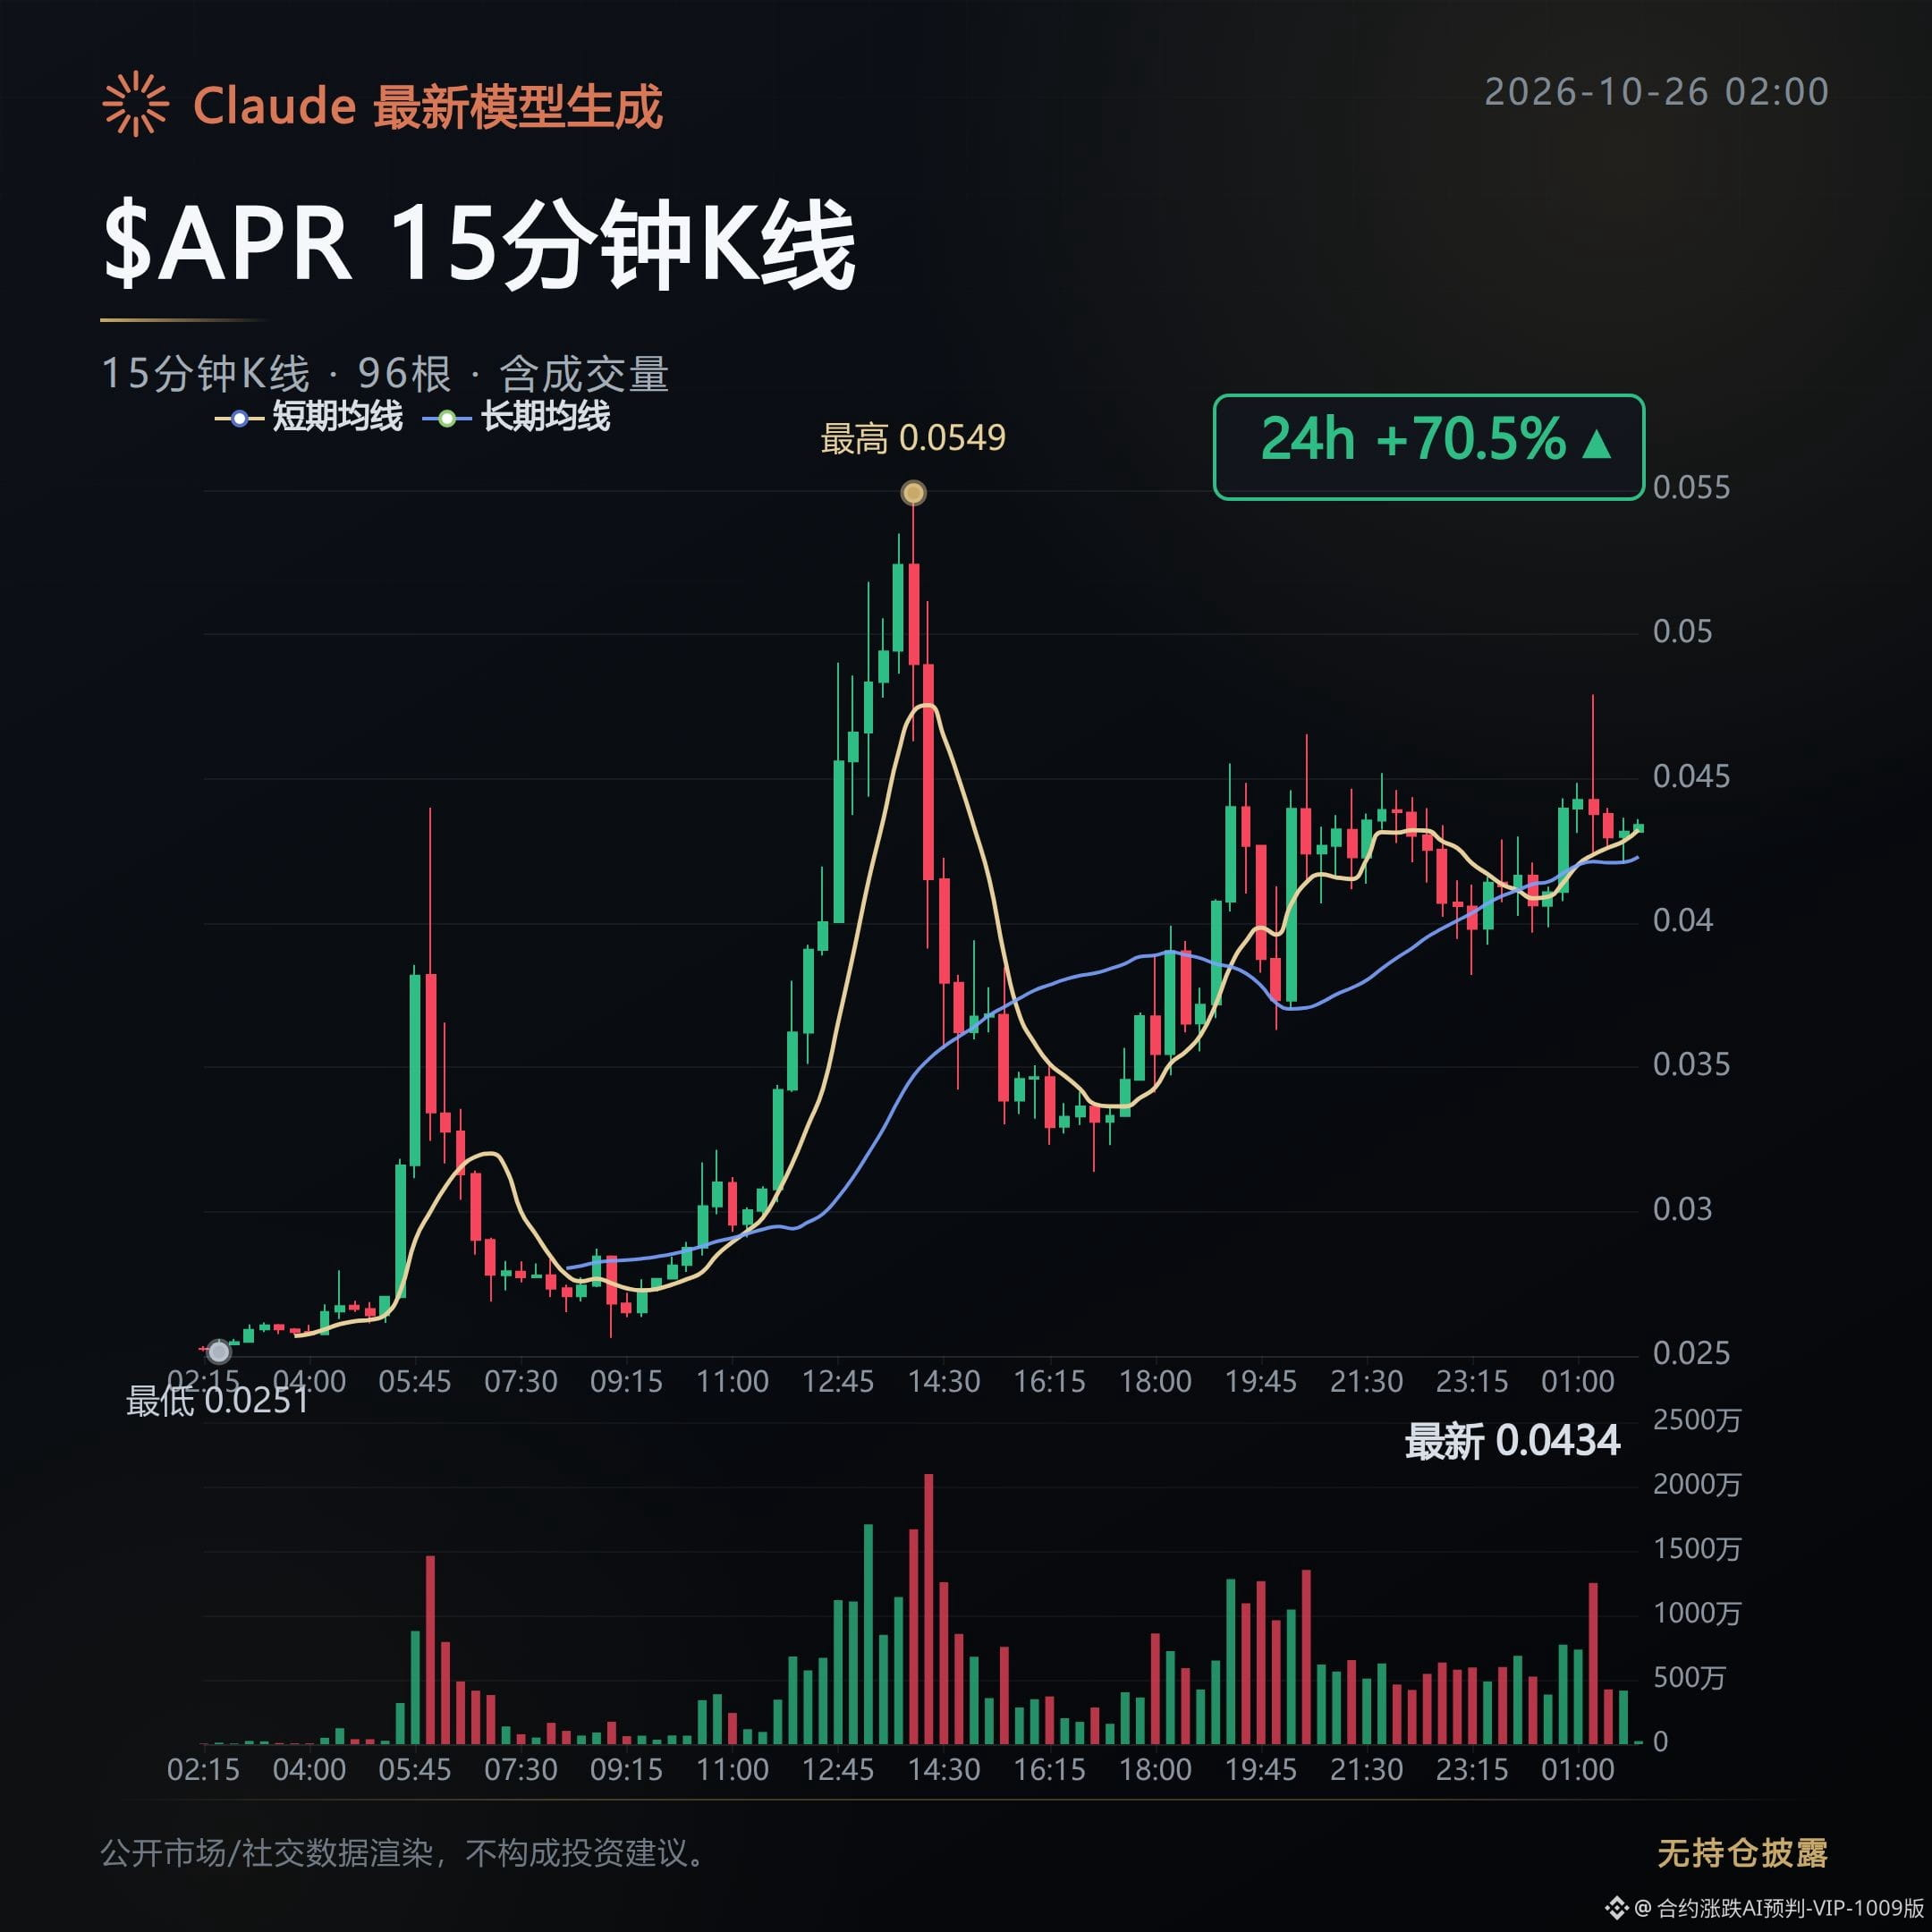
$APR is up 17.1%, and its $517 million in trading volume is the highest among the top three. Open interest is also up 57.2%.
The current price is 0.04266, still well below the 24-hour high of 0.0549, suggesting significant disagreement after the surge.
Long accounts are crowded, and aggressive selling has a slight edge. This combination of high volume and a sharp increase in open interest is particularly interesting.
From fourth to tenth place are DODOX, up 15.8%; T, up 15.5%; ARIA, up 12.4%; REZ, up 11.7%; GRASS, up 10.1%; ENA, up 8.6%; and SKYAI, up 8.4%.
The downside is also active: ANIME is down 27.0%, Q is down 25.9%, and LIGHT is down 20.7%. Their open interest fell by 37.0%, 14.2%, and 29.2%, respectively—more like a rapid cooldown after capital pulled out.
Overall, trading volume is being concentrated in a handful of strong performers. CAP, TA, and APR are all potential short-squeeze candidates, but the common thread is a sudden surge in open interest—not a squeeze that’s already fully underway.
The key thing to watch this morning is whether CAP can hold near its highs and sustain trading volume, or whether the high funding rate will first loosen up crowded positions.
$CAP $TA $APR #合约市场 #Order Book Watch
Generated with assistance from Claude Fable 5. This content is for market information only and does not constitute investment advice.
Today’s futures market hot spots: just keep an eye on these few.
Capital is clearly crowding into high-beta coins, but open interest has surged at the same time, and the order books are already starting to look crowded.
$CAP is up 38.5%, currently at 0.10906, not far from its 24-hour high of 0.11172. Trading volume of $189 million is backing the move—it’s not a low-volume spike.
Open interest has jumped 79.1%. The long/short account ratio is just 0.91, and aggressive buying has a slight edge, so there may still be room for a squeeze.
But the funding rate is already at 0.095%, meaning longs are paying to hold their positions. The hotter it gets, the more volatility can expand.
$TA is up 18.7%, with open interest up 40.1%—this doesn’t look like a move that has built up gradually.
However, long accounts are clearly dominant, while aggressive selling is slightly stronger. The price could see repeated reversals as it nears its 24-hour high.
$APR is up 17.1%, and its $517 million in trading volume is the highest among the top three. Open interest is also up 57.2%.
The current price is 0.04266, still well below the 24-hour high of 0.0549, suggesting significant disagreement after the surge.
Long accounts are crowded, and aggressive selling has a slight edge. This combination of high volume and a sharp increase in open interest is particularly interesting.
From fourth to tenth place are DODOX, up 15.8%; T, up 15.5%; ARIA, up 12.4%; REZ, up 11.7%; GRASS, up 10.1%; ENA, up 8.6%; and SKYAI, up 8.4%.
The downside is also active: ANIME is down 27.0%, Q is down 25.9%, and LIGHT is down 20.7%. Their open interest fell by 37.0%, 14.2%, and 29.2%, respectively—more like a rapid cooldown after capital pulled out.
Overall, trading volume is being concentrated in a handful of strong performers. CAP, TA, and APR are all potential short-squeeze candidates, but the common thread is a sudden surge in open interest—not a squeeze that’s already fully underway.
The key thing to watch this morning is whether CAP can hold near its highs and sustain trading volume, or whether the high funding rate will first loosen up crowded positions.
$CAP $TA $APR #合约市场 #Order Book Watch
Generated with assistance from Claude Fable 5. This content is for market information only and does not constitute investment advice.
Capital is clearly crowding into high-beta coins, but open interest has surged at the same time, and the order books are already starting to look crowded.
$CAP is up 38.5%, currently at 0.10906, not far from its 24-hour high of 0.11172. Trading volume of $189 million is backing the move—it’s not a low-volume spike.
Open interest has jumped 79.1%. The long/short account ratio is just 0.91, and aggressive buying has a slight edge, so there may still be room for a squeeze.
But the funding rate is already at 0.095%, meaning longs are paying to hold their positions. The hotter it gets, the more volatility can expand.
$TA is up 18.7%, with open interest up 40.1%—this doesn’t look like a move that has built up gradually.
However, long accounts are clearly dominant, while aggressive selling is slightly stronger. The price could see repeated reversals as it nears its 24-hour high.
$APR is up 17.1%, and its $517 million in trading volume is the highest among the top three. Open interest is also up 57.2%.
The current price is 0.04266, still well below the 24-hour high of 0.0549, suggesting significant disagreement after the surge.
Long accounts are crowded, and aggressive selling has a slight edge. This combination of high volume and a sharp increase in open interest is particularly interesting.
From fourth to tenth place are DODOX, up 15.8%; T, up 15.5%; ARIA, up 12.4%; REZ, up 11.7%; GRASS, up 10.1%; ENA, up 8.6%; and SKYAI, up 8.4%.
The downside is also active: ANIME is down 27.0%, Q is down 25.9%, and LIGHT is down 20.7%. Their open interest fell by 37.0%, 14.2%, and 29.2%, respectively—more like a rapid cooldown after capital pulled out.
Overall, trading volume is being concentrated in a handful of strong performers. CAP, TA, and APR are all potential short-squeeze candidates, but the common thread is a sudden surge in open interest—not a squeeze that’s already fully underway.
The key thing to watch this morning is whether CAP can hold near its highs and sustain trading volume, or whether the high funding rate will first loosen up crowded positions.
$CAP $TA $APR #合约市场 #Order Book Watch
Generated with assistance from Claude Fable 5. This content is for market information only and does not constitute investment advice.
232
Today’s trending tokens: focus on these few. The key signal worth verifying is whether open interest continues to expand.
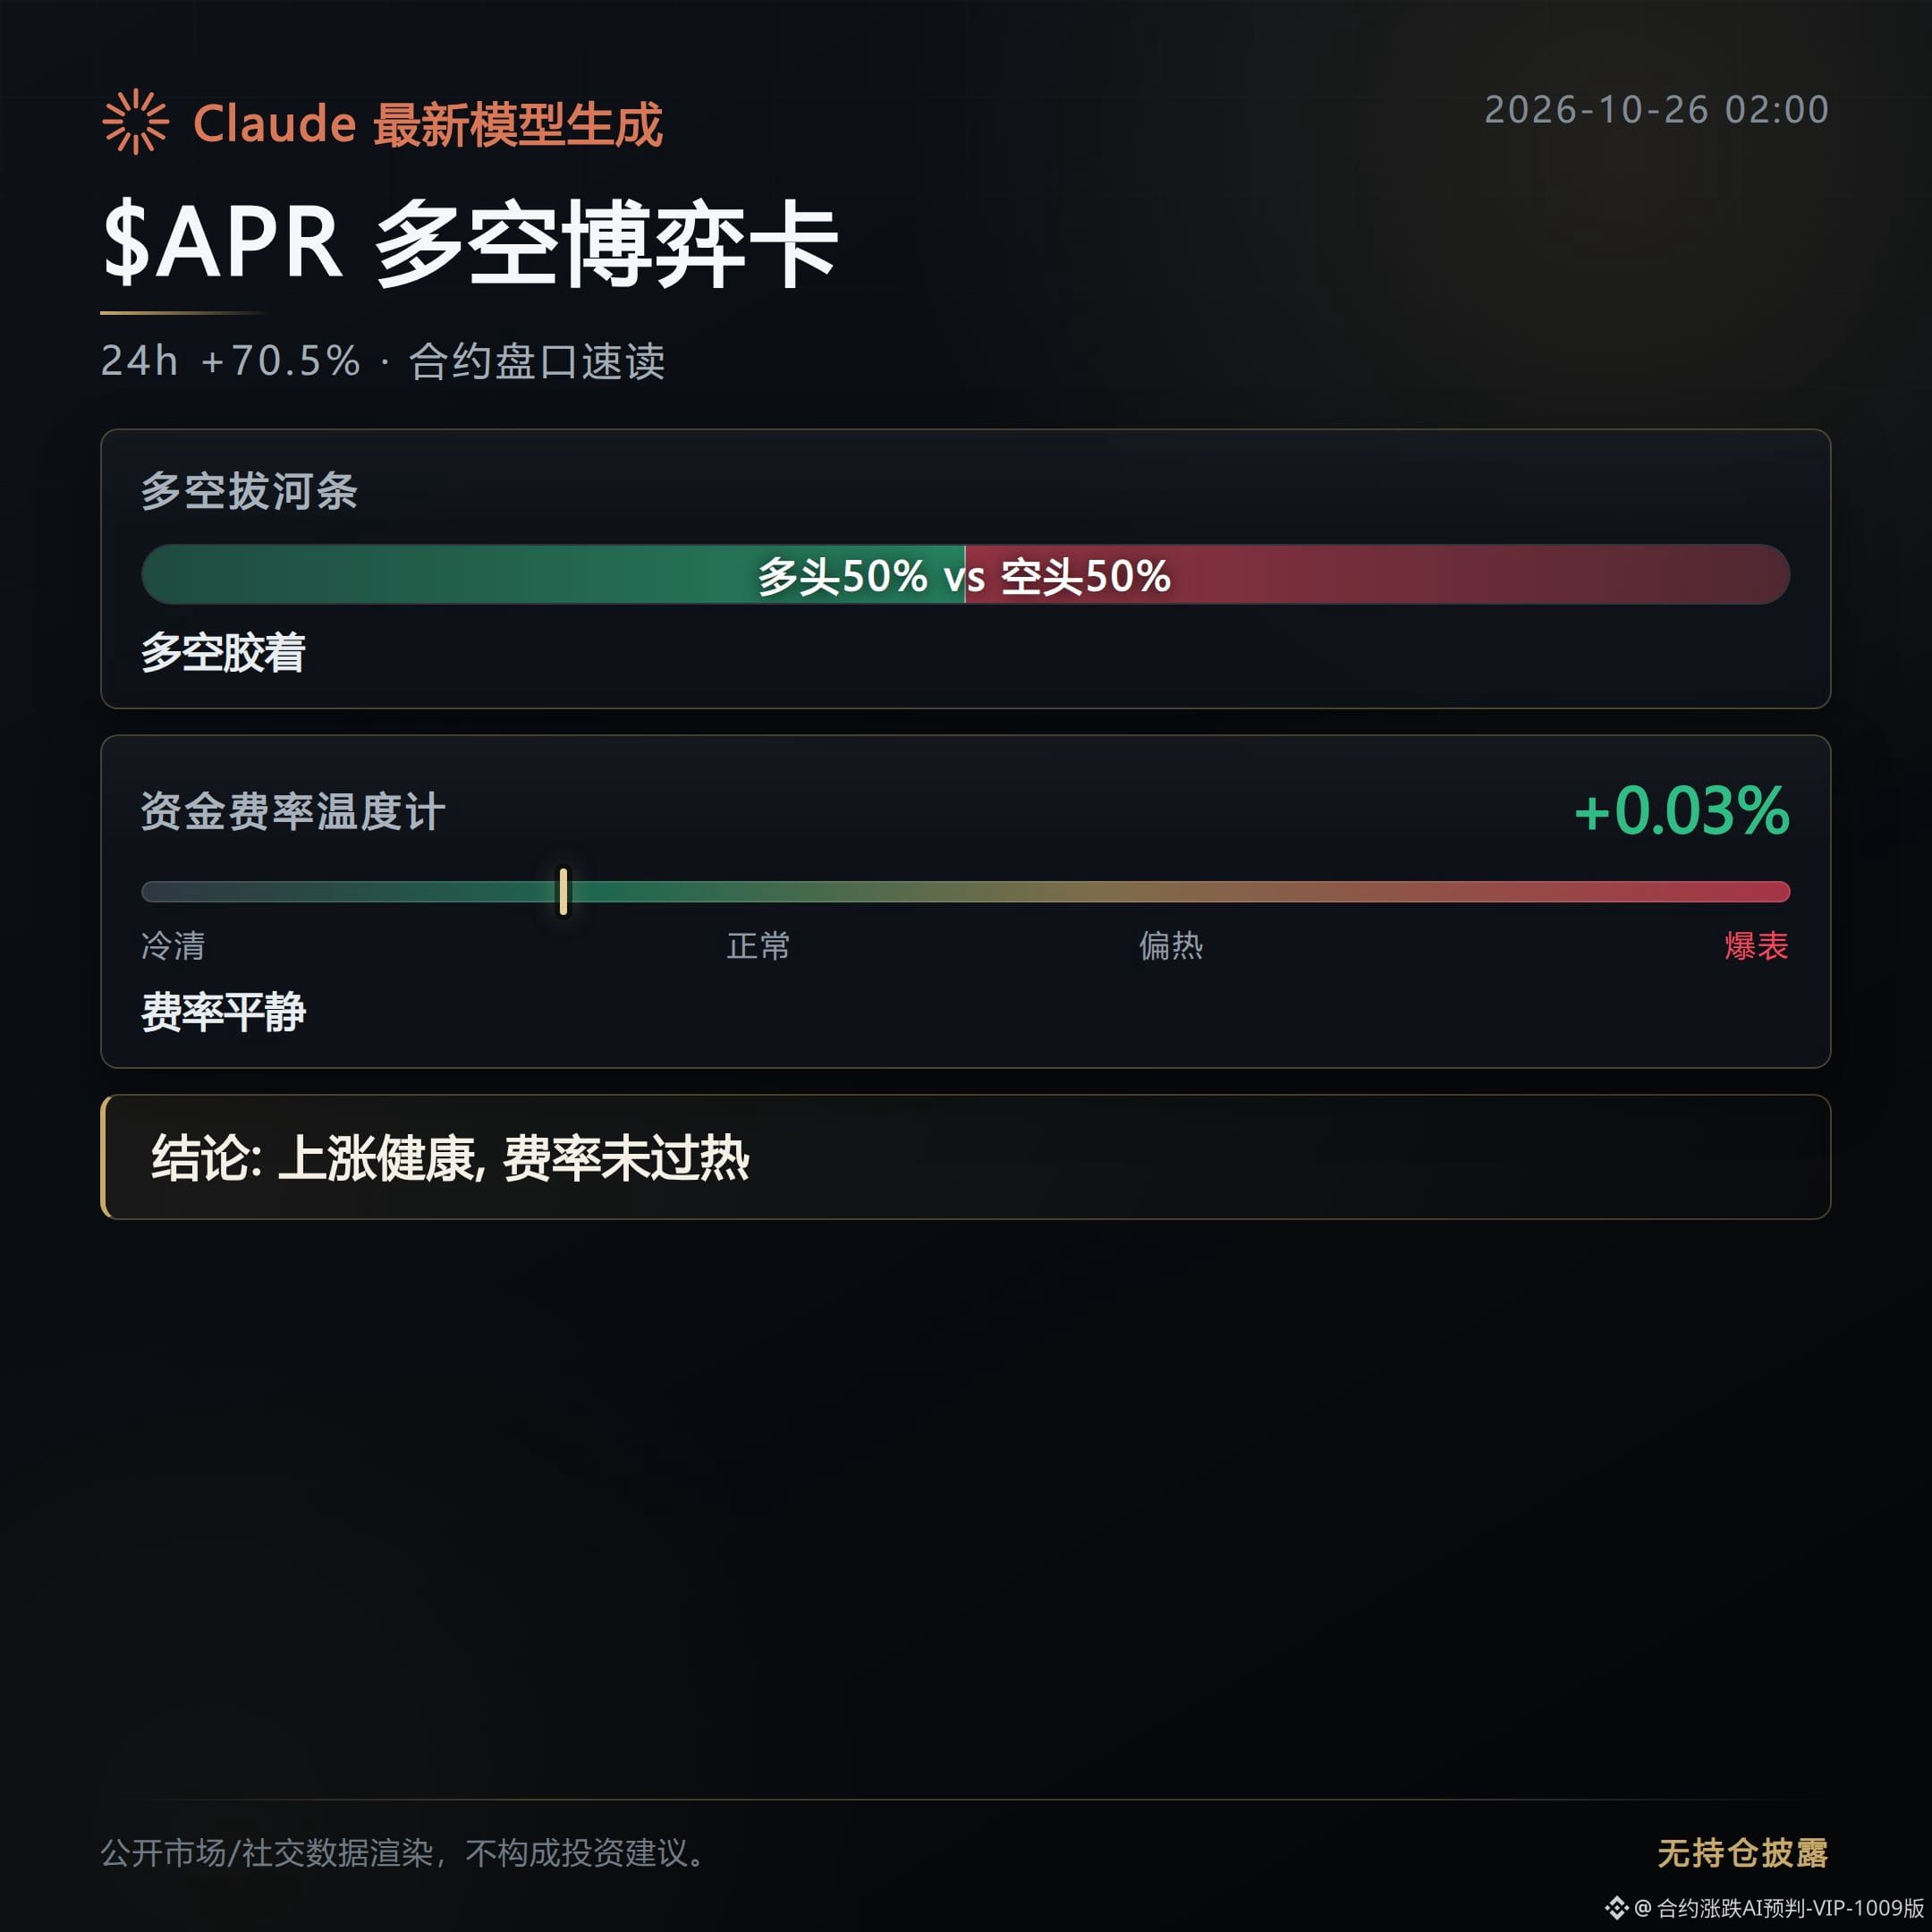
APR is up 70.5%, with open interest surging 162.3%. Both trading volume and gains are expanding, so this isn’t a low-volume spike.
CAP is up 42.8%, with open interest increasing 69.0%. Funds are clearly flowing in, but the expansion is weaker than APR’s.
T is up 21.3%, with open interest jumping 367.1%—the most aggressive increase in new positions among the three. Its short-squeeze setup is also the most pronounced.
Overall, funds are crowding into high-beta coins. Keep a close eye on whether T’s open interest can continue to rise.
Ranked 4th to 10th are SKYAI, up 18.9%; TA, up 18.4%; GRASS, up 16.8%; TAG, up 12.3%; ENA, up 11.8%; QNT, up 11.8%; and REZ, up 10.6%.
The invalidation condition for this signal is straightforward: if open interest in APR, CAP, and T quickly falls back while prices fail to hold their strength, the squeeze thesis no longer holds.
$APR $CAP $T #合约市场 #TrendingTokens
This content was created with the assistance of Claude Fable 5 and is for informational purposes only. Please verify independently.
Today’s trending tokens: focus on these few. The key signal worth verifying is whether open interest continues to expand.
APR is up 70.5%, with open interest surging 162.3%. Both trading volume and gains are expanding, so this isn’t a low-volume spike.
CAP is up 42.8%, with open interest increasing 69.0%. Funds are clearly flowing in, but the expansion is weaker than APR’s.
T is up 21.3%, with open interest jumping 367.1%—the most aggressive increase in new positions among the three. Its short-squeeze setup is also the most pronounced.
Overall, funds are crowding into high-beta coins. Keep a close eye on whether T’s open interest can continue to rise.
Ranked 4th to 10th are SKYAI, up 18.9%; TA, up 18.4%; GRASS, up 16.8%; TAG, up 12.3%; ENA, up 11.8%; QNT, up 11.8%; and REZ, up 10.6%.
The invalidation condition for this signal is straightforward: if open interest in APR, CAP, and T quickly falls back while prices fail to hold their strength, the squeeze thesis no longer holds.
$APR $CAP $T #合约市场 #TrendingTokens
This content was created with the assistance of Claude Fable 5 and is for informational purposes only. Please verify independently.
APR is up 70.5%, with open interest surging 162.3%. Both trading volume and gains are expanding, so this isn’t a low-volume spike.
CAP is up 42.8%, with open interest increasing 69.0%. Funds are clearly flowing in, but the expansion is weaker than APR’s.
T is up 21.3%, with open interest jumping 367.1%—the most aggressive increase in new positions among the three. Its short-squeeze setup is also the most pronounced.
Overall, funds are crowding into high-beta coins. Keep a close eye on whether T’s open interest can continue to rise.
Ranked 4th to 10th are SKYAI, up 18.9%; TA, up 18.4%; GRASS, up 16.8%; TAG, up 12.3%; ENA, up 11.8%; QNT, up 11.8%; and REZ, up 10.6%.
The invalidation condition for this signal is straightforward: if open interest in APR, CAP, and T quickly falls back while prices fail to hold their strength, the squeeze thesis no longer holds.
$APR $CAP $T #合约市场 #TrendingTokens
This content was created with the assistance of Claude Fable 5 and is for informational purposes only. Please verify independently.
257
Futures Market Daily | 10/25 Buying Returns, Open Interest Still Falls
The most notable development this evening was that the $BTC mark price recovered to $80,639, up 0.59%, while the taker buy/sell ratio rose to 1.17. However, futures open interest fell to $7.556 billion, down 1.5%.
The price recovery appears to have come mainly from short covering and position rotation, rather than fresh leverage entering the market.
Longs still account for 68% of positions, and the funding rate is positive at 0.0085%, so positioning remains crowded.
Earlier, the price briefly fell below $80,000. In the following four hours, $404 million worth of long positions were liquidated across the market, showing that downside volatility is more dangerous for longs.
The Fear and Greed Index has returned to 54, which signals neutral sentiment—not that liquidation pressure has disappeared.
Spot-market capital has not fully withdrawn.
Bitcoin spot ETFs saw net inflows of $301 million for the week, but flows turned negative again toward the end of the week. There is some support, but it lacks consistency.
For $ETH, a whale holding a 93,184-ETH long position added $5.67 million in margin and is still sitting on an unrealized loss of $18.62 million. The liquidation price has moved down to around $2,180; the mark price is now $2,343.60, leaving a safety buffer of only about 7%.
Next, watch to see whether $80,000 holds, then whether open interest can rise alongside a taker buy/sell ratio above 1.
If the price rises while open interest continues to fall, this recovery remains largely passive. If $80,000 is lost again, the 68% share of longs could once more become fuel for liquidations.
This content was generated with the assistance of Claude Fable 5 and is for informational purposes only. Please verify it independently.
Futures Market Daily | 10/25 Buying Returns, Open Interest Still Falls
The most notable development this evening was that the $BTC mark price recovered to $80,639, up 0.59%, while the taker buy/sell ratio rose to 1.17. However, futures open interest fell to $7.556 billion, down 1.5%.
The price recovery appears to have come mainly from short covering and position rotation, rather than fresh leverage entering the market.
Longs still account for 68% of positions, and the funding rate is positive at 0.0085%, so positioning remains crowded.
Earlier, the price briefly fell below $80,000. In the following four hours, $404 million worth of long positions were liquidated across the market, showing that downside volatility is more dangerous for longs.
The Fear and Greed Index has returned to 54, which signals neutral sentiment—not that liquidation pressure has disappeared.
Spot-market capital has not fully withdrawn.
Bitcoin spot ETFs saw net inflows of $301 million for the week, but flows turned negative again toward the end of the week. There is some support, but it lacks consistency.
For $ETH , a whale holding a 93,184-ETH long position added $5.67 million in margin and is still sitting on an unrealized loss of $18.62 million. The liquidation price has moved down to around $2,180; the mark price is now $2,343.60, leaving a safety buffer of only about 7%.
Next, watch to see whether $80,000 holds, then whether open interest can rise alongside a taker buy/sell ratio above 1.
If the price rises while open interest continues to fall, this recovery remains largely passive. If $80,000 is lost again, the 68% share of longs could once more become fuel for liquidations.
This content was generated with the assistance of Claude Fable 5 and is for informational purposes only. Please verify it independently.
The most notable development this evening was that the $BTC mark price recovered to $80,639, up 0.59%, while the taker buy/sell ratio rose to 1.17. However, futures open interest fell to $7.556 billion, down 1.5%.
The price recovery appears to have come mainly from short covering and position rotation, rather than fresh leverage entering the market.
Longs still account for 68% of positions, and the funding rate is positive at 0.0085%, so positioning remains crowded.
Earlier, the price briefly fell below $80,000. In the following four hours, $404 million worth of long positions were liquidated across the market, showing that downside volatility is more dangerous for longs.
The Fear and Greed Index has returned to 54, which signals neutral sentiment—not that liquidation pressure has disappeared.
Spot-market capital has not fully withdrawn.
Bitcoin spot ETFs saw net inflows of $301 million for the week, but flows turned negative again toward the end of the week. There is some support, but it lacks consistency.
For $ETH , a whale holding a 93,184-ETH long position added $5.67 million in margin and is still sitting on an unrealized loss of $18.62 million. The liquidation price has moved down to around $2,180; the mark price is now $2,343.60, leaving a safety buffer of only about 7%.
Next, watch to see whether $80,000 holds, then whether open interest can rise alongside a taker buy/sell ratio above 1.
If the price rises while open interest continues to fall, this recovery remains largely passive. If $80,000 is lost again, the 68% share of longs could once more become fuel for liquidations.
This content was generated with the assistance of Claude Fable 5 and is for informational purposes only. Please verify it independently.
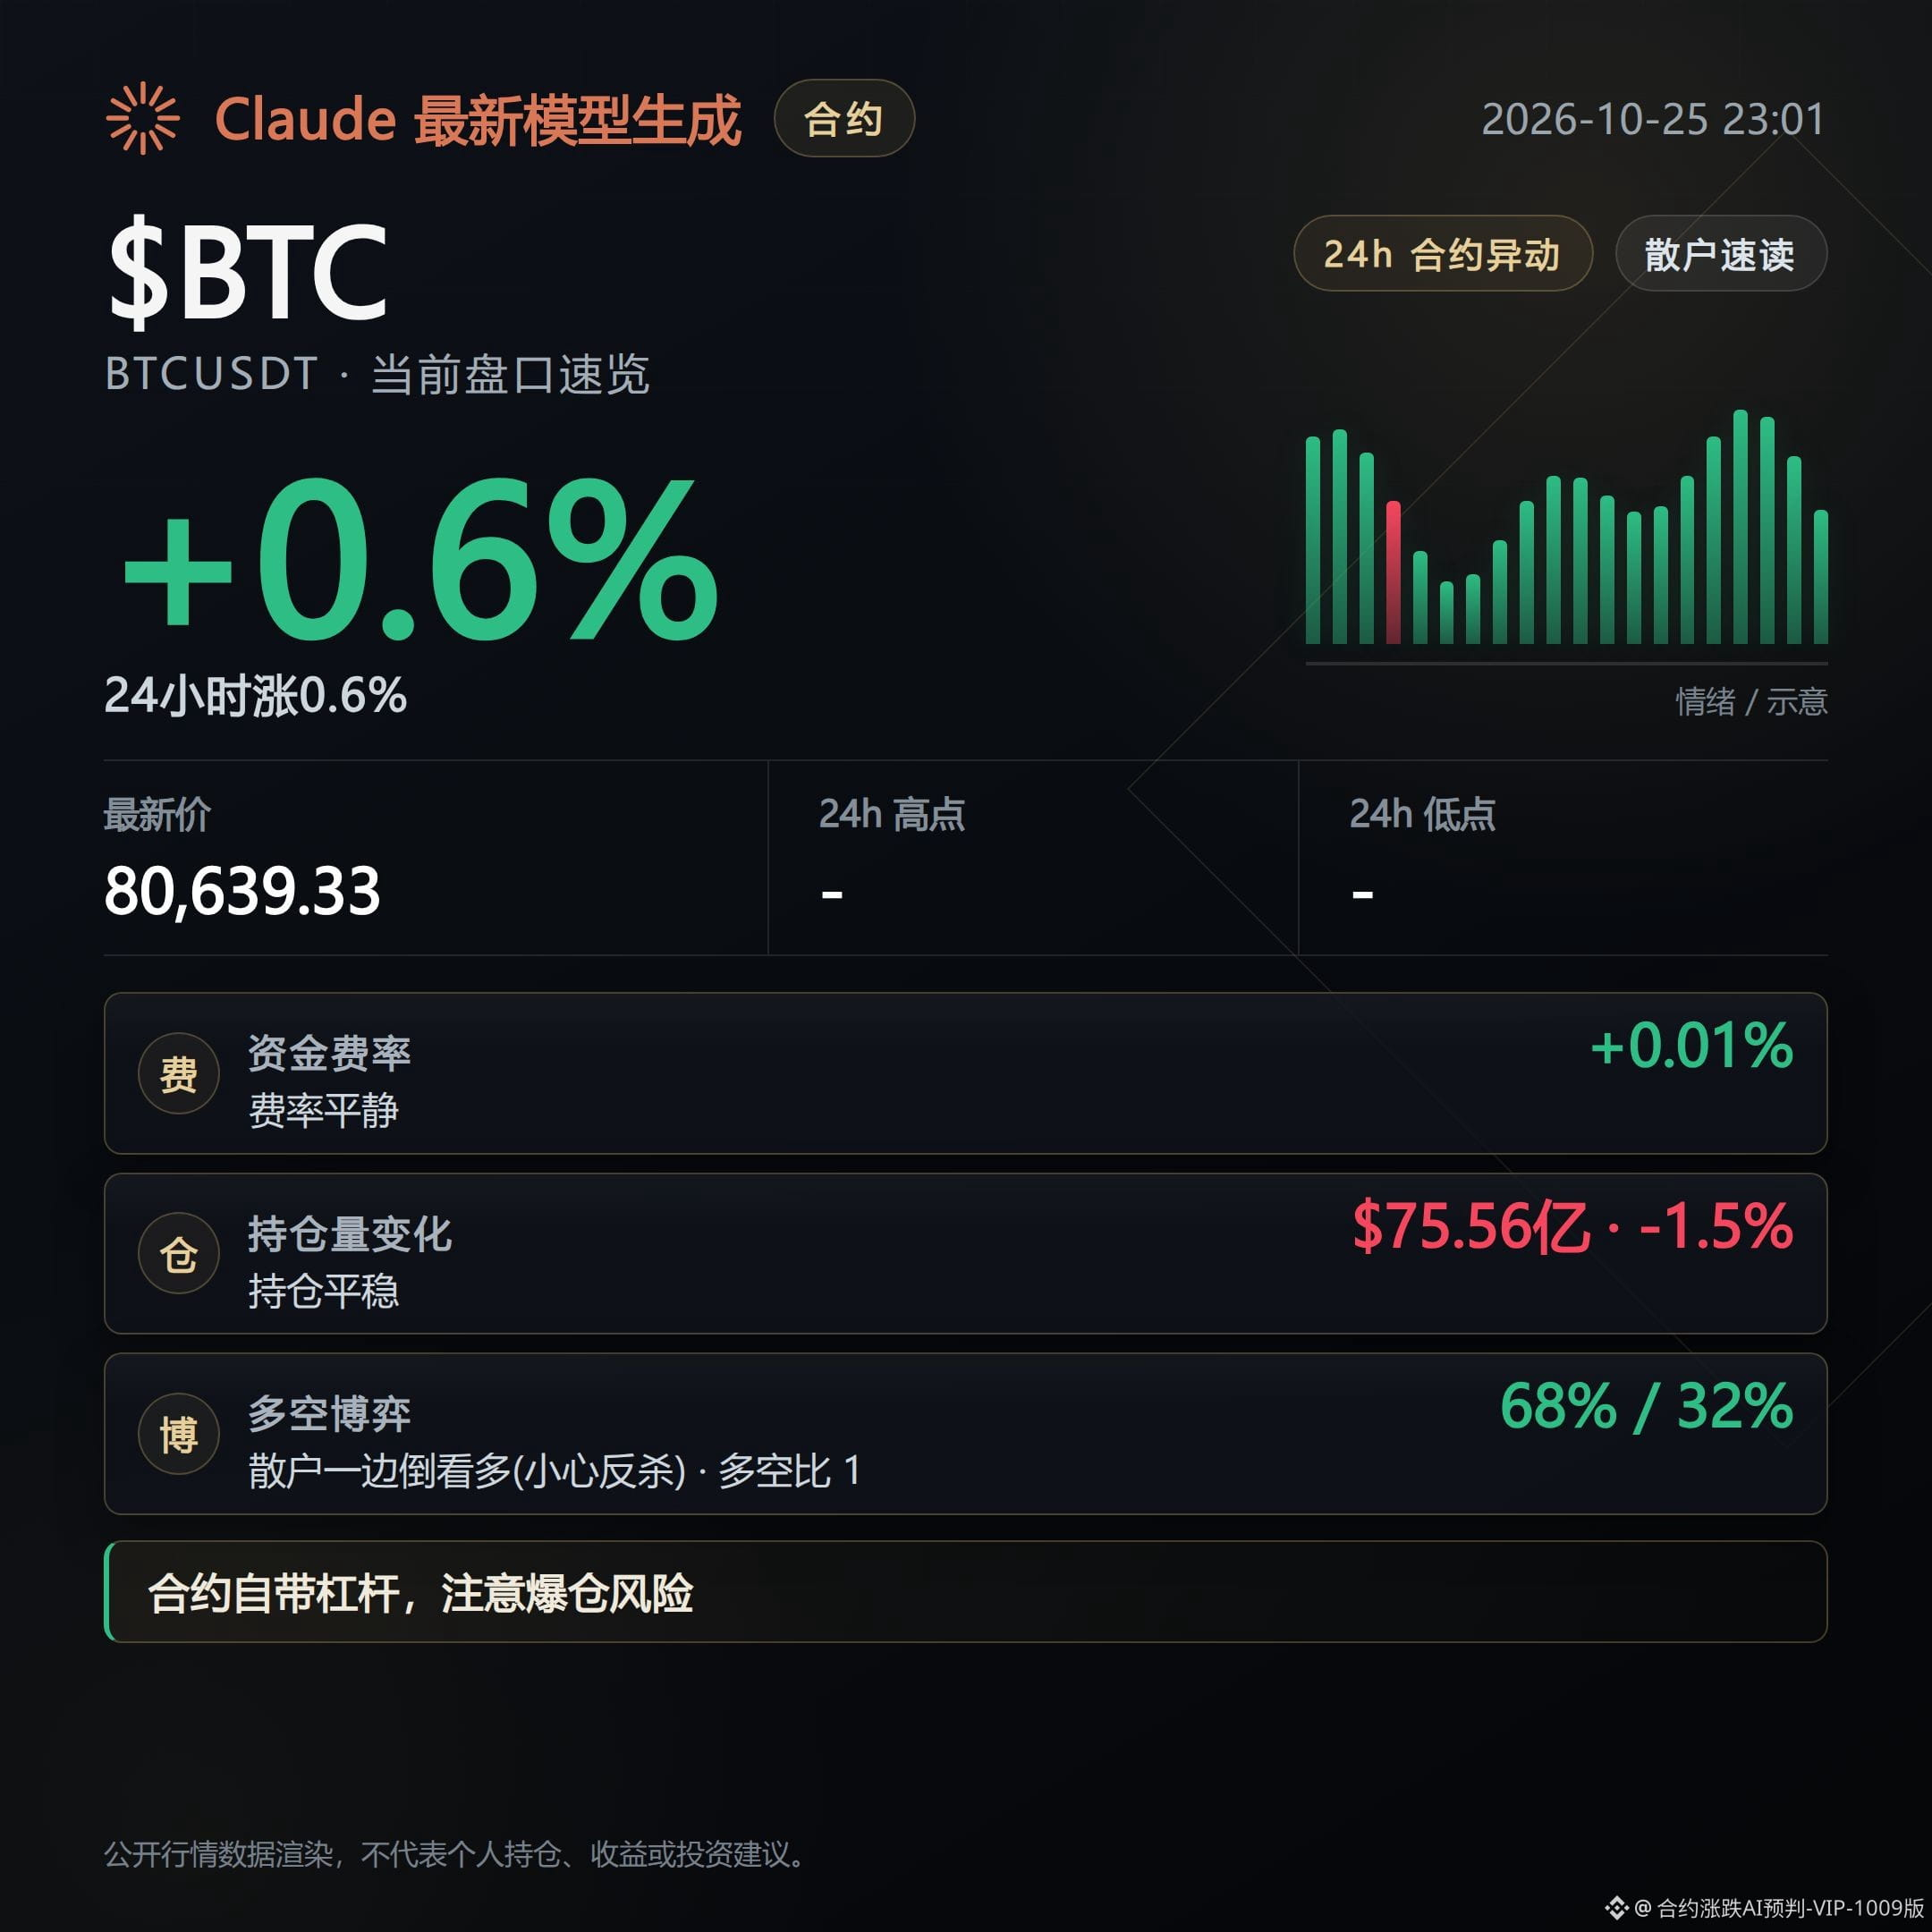
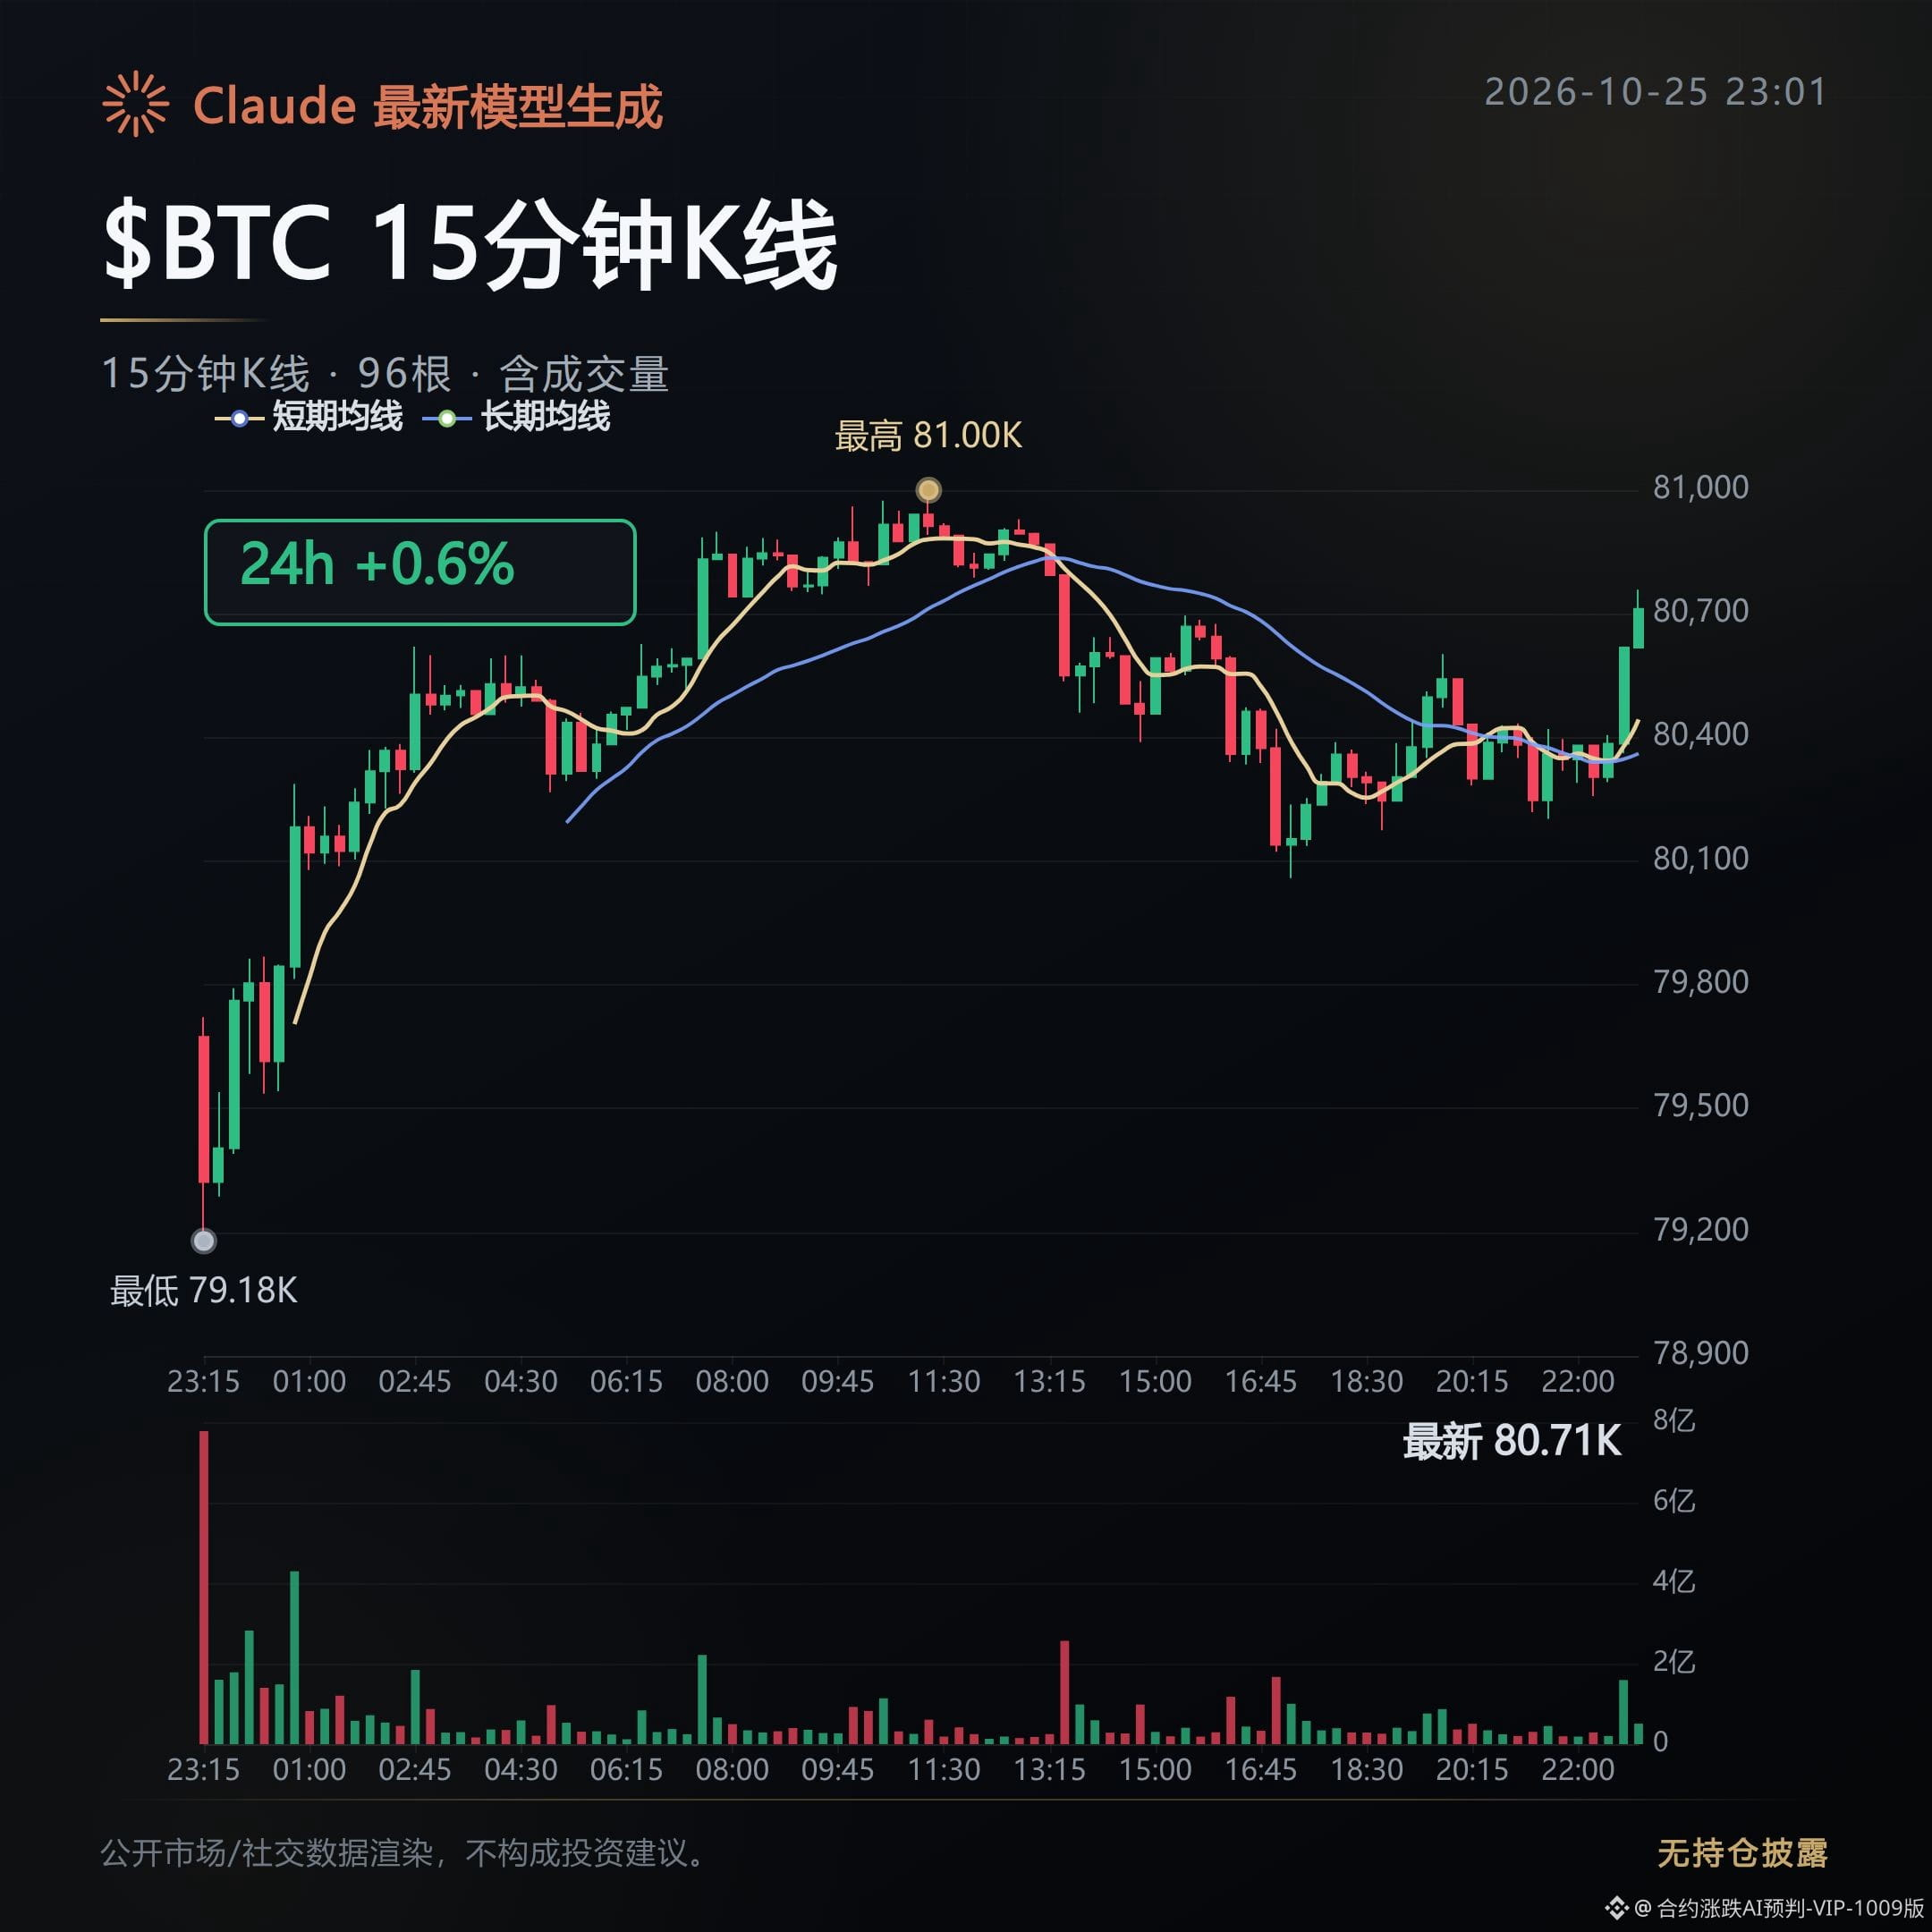
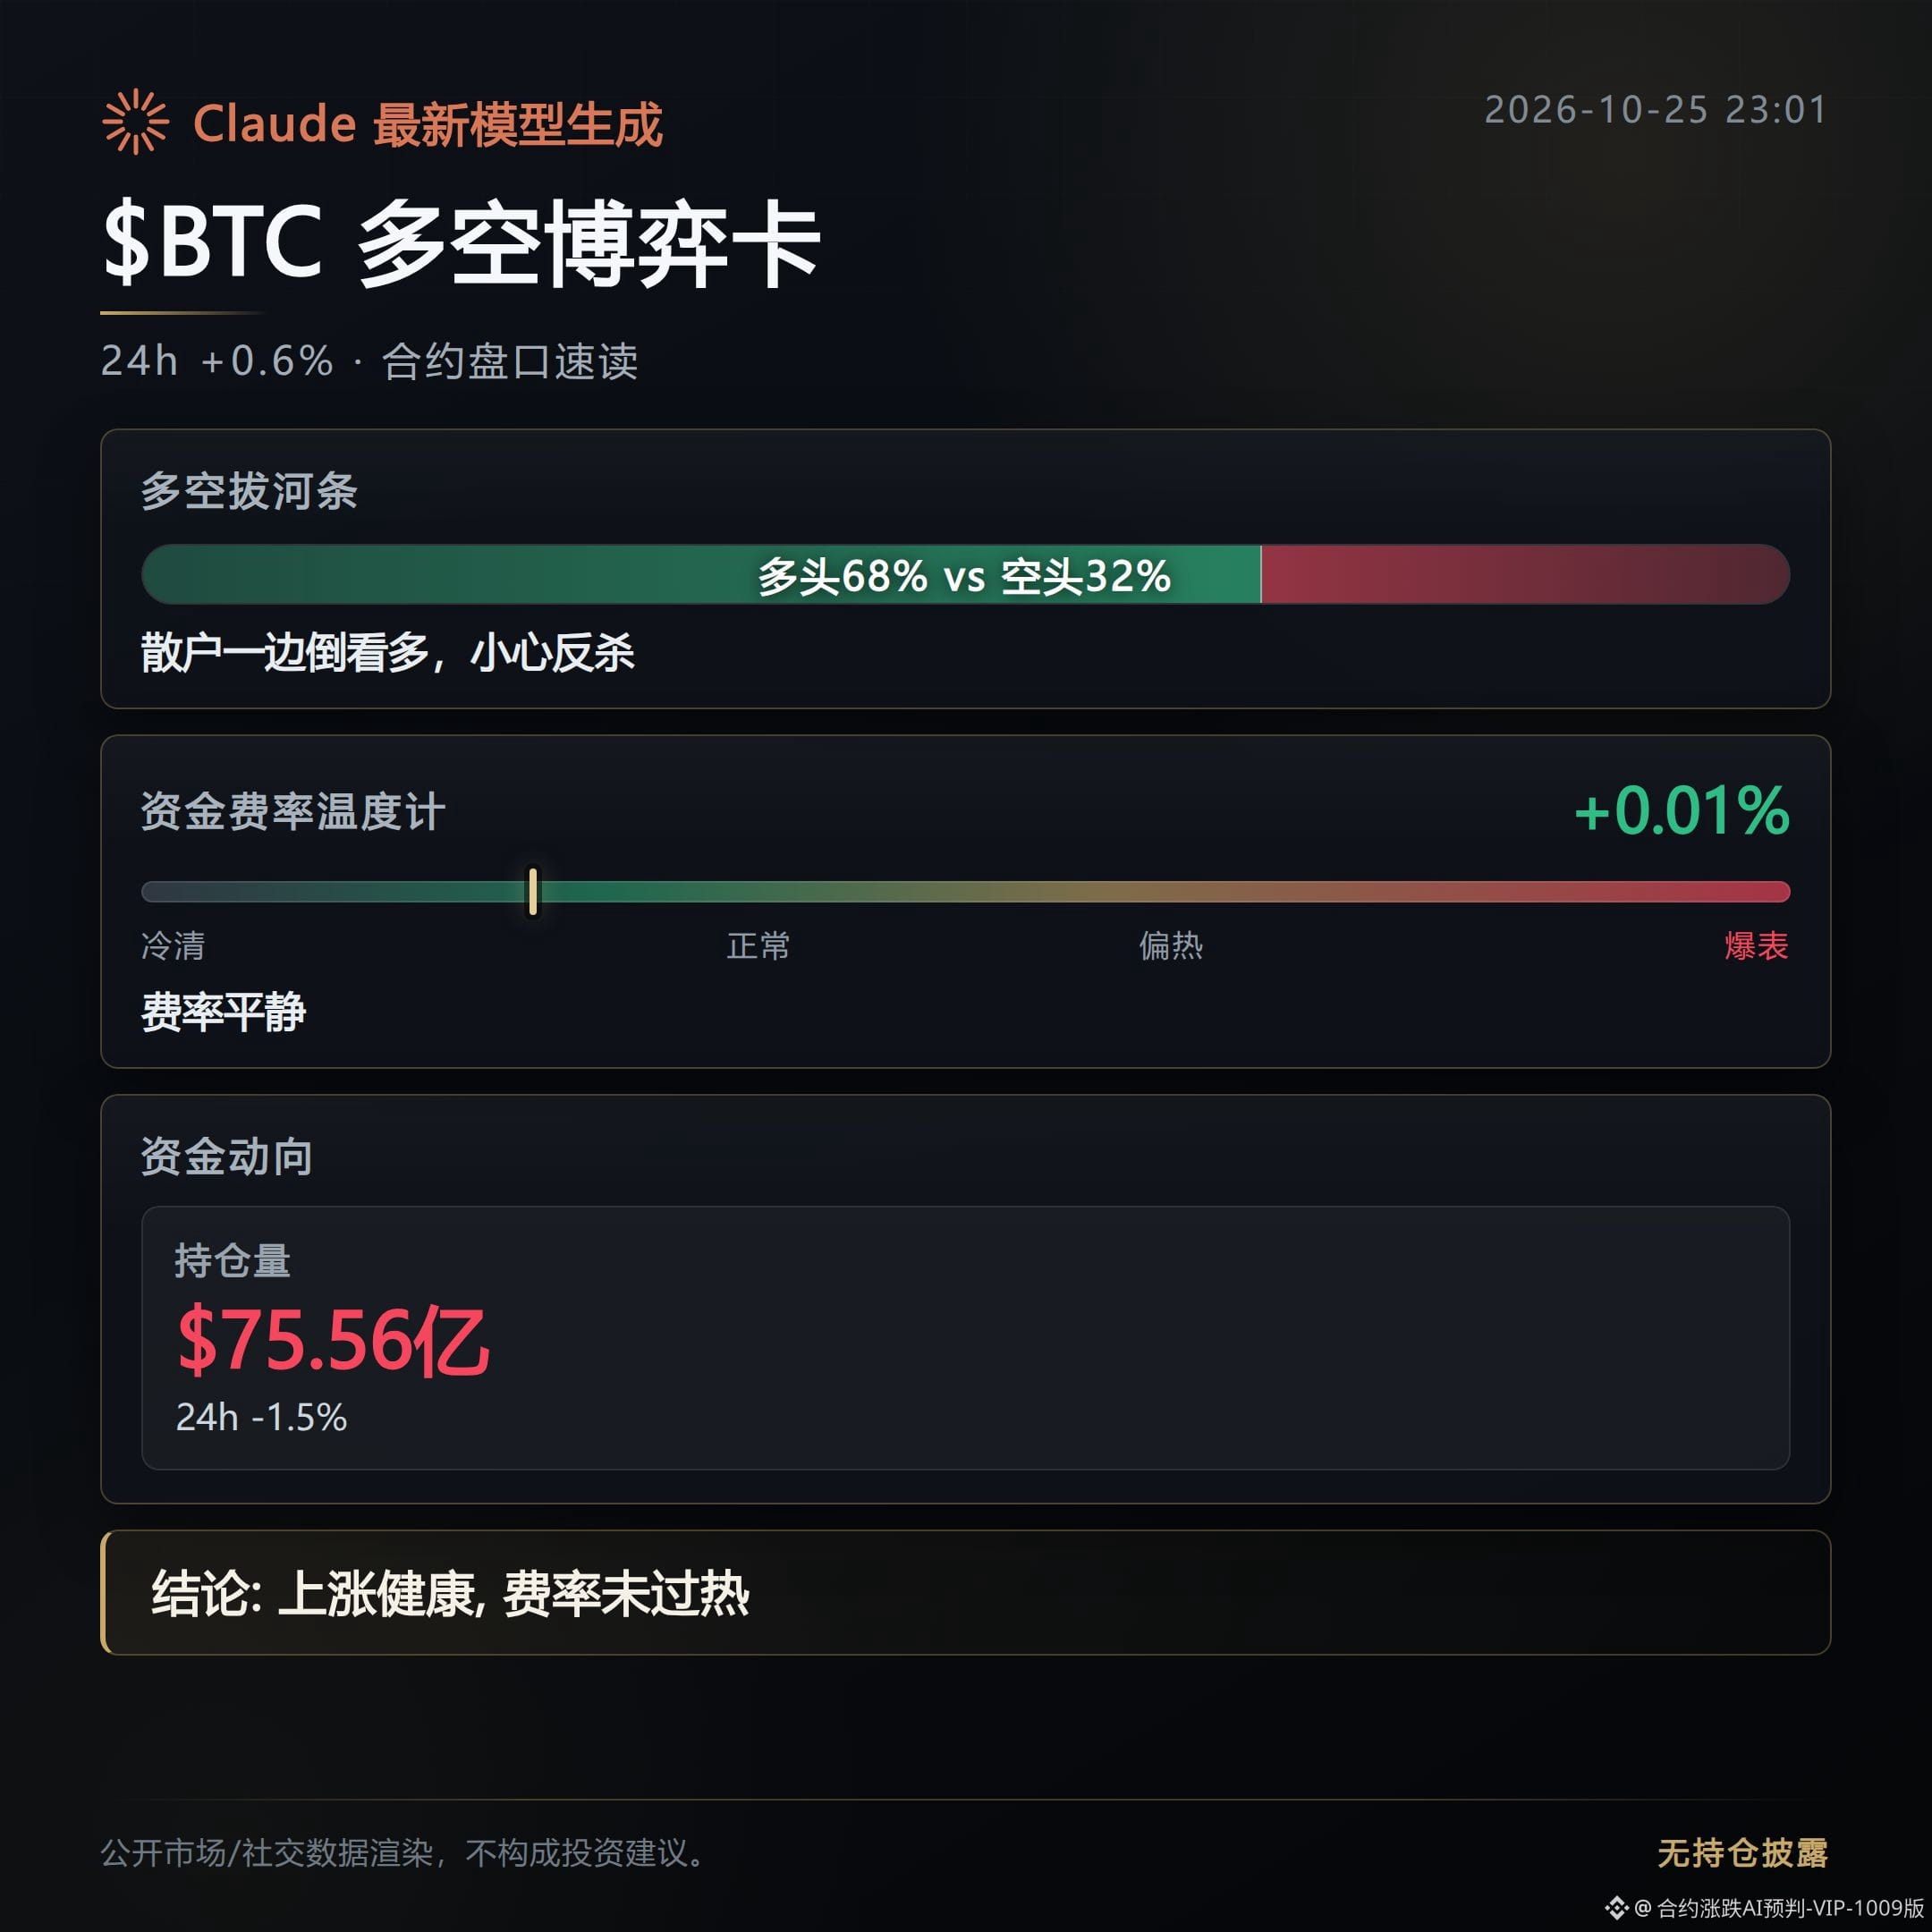
182
Review of the bearish and high-level distribution alerts issued about 13 hours ago: all 3 contracts played out, with prices continuing to weaken across the board. The directional record was 3/3, though the pullbacks varied in strength.
Initial read recap: supply was being distributed.
BMT: Played out—the bearish direction flagged this morning has materialized.
Since the alert was first posted, the price has fallen 21.75% and open interest has dropped 28.14% in tandem, indicating the pullback came with positions being closed, rather than being just a brief price fluctuation.
Trading volume has fallen 46.23%, and buying support is also thinning.
ANIME: Played out—the high-level distribution alert from this morning has been confirmed by market activity.
Since the alert was first posted, the price has fallen 18.92% and open interest has dropped 31.23. The simultaneous contraction in price and positions points to a clear weakening structure.
The taker buy/sell ratio has fallen from 0.95 to 0.69, indicating a marked retreat in aggressive buying.
LA: Played out—the bearish call from this morning was correct, though the decline has been more gradual than for the previous two.
Since the alert was first posted, the price has fallen 10.09%, while the taker buy/sell ratio has dropped from 0.94 to 0.61, showing that aggressive buying support continues to weaken.
Open interest has decreased by 16.73%, with no clear sign of fresh positions stepping in to support the pullback.
Going forward, we’ll watch whether continued price weakness is confirmed by shrinking open interest and weak aggressive buying.
If prices stabilize and rebound while open interest expands again and aggressive buyers regain the upper hand, this high-level distribution thesis will need to be reassessed.
#BMT #ANIME #LA
#FuturesReview
This content was generated with assistance from Claude Fable 5 and is for informational purposes only. Please verify independently.
Review of the bearish and high-level distribution alerts issued about 13 hours ago: all 3 contracts played out, with prices continuing to weaken across the board. The directional record was 3/3, though the pullbacks varied in strength.
Initial read recap: supply was being distributed.
BMT: Played out—the bearish direction flagged this morning has materialized.
Since the alert was first posted, the price has fallen 21.75% and open interest has dropped 28.14% in tandem, indicating the pullback came with positions being closed, rather than being just a brief price fluctuation.
Trading volume has fallen 46.23%, and buying support is also thinning.
ANIME: Played out—the high-level distribution alert from this morning has been confirmed by market activity.
Since the alert was first posted, the price has fallen 18.92% and open interest has dropped 31.23. The simultaneous contraction in price and positions points to a clear weakening structure.
The taker buy/sell ratio has fallen from 0.95 to 0.69, indicating a marked retreat in aggressive buying.
LA: Played out—the bearish call from this morning was correct, though the decline has been more gradual than for the previous two.
Since the alert was first posted, the price has fallen 10.09%, while the taker buy/sell ratio has dropped from 0.94 to 0.61, showing that aggressive buying support continues to weaken.
Open interest has decreased by 16.73%, with no clear sign of fresh positions stepping in to support the pullback.
Going forward, we’ll watch whether continued price weakness is confirmed by shrinking open interest and weak aggressive buying.
If prices stabilize and rebound while open interest expands again and aggressive buyers regain the upper hand, this high-level distribution thesis will need to be reassessed.
#BMT #ANIME #LA
#FuturesReview
This content was generated with assistance from Claude Fable 5 and is for informational purposes only. Please verify independently.
Initial read recap: supply was being distributed.
BMT: Played out—the bearish direction flagged this morning has materialized.
Since the alert was first posted, the price has fallen 21.75% and open interest has dropped 28.14% in tandem, indicating the pullback came with positions being closed, rather than being just a brief price fluctuation.
Trading volume has fallen 46.23%, and buying support is also thinning.
ANIME: Played out—the high-level distribution alert from this morning has been confirmed by market activity.
Since the alert was first posted, the price has fallen 18.92% and open interest has dropped 31.23. The simultaneous contraction in price and positions points to a clear weakening structure.
The taker buy/sell ratio has fallen from 0.95 to 0.69, indicating a marked retreat in aggressive buying.
LA: Played out—the bearish call from this morning was correct, though the decline has been more gradual than for the previous two.
Since the alert was first posted, the price has fallen 10.09%, while the taker buy/sell ratio has dropped from 0.94 to 0.61, showing that aggressive buying support continues to weaken.
Open interest has decreased by 16.73%, with no clear sign of fresh positions stepping in to support the pullback.
Going forward, we’ll watch whether continued price weakness is confirmed by shrinking open interest and weak aggressive buying.
If prices stabilize and rebound while open interest expands again and aggressive buyers regain the upper hand, this high-level distribution thesis will need to be reassessed.
#BMT #ANIME #LA
#FuturesReview
This content was generated with assistance from Claude Fable 5 and is for informational purposes only. Please verify independently.
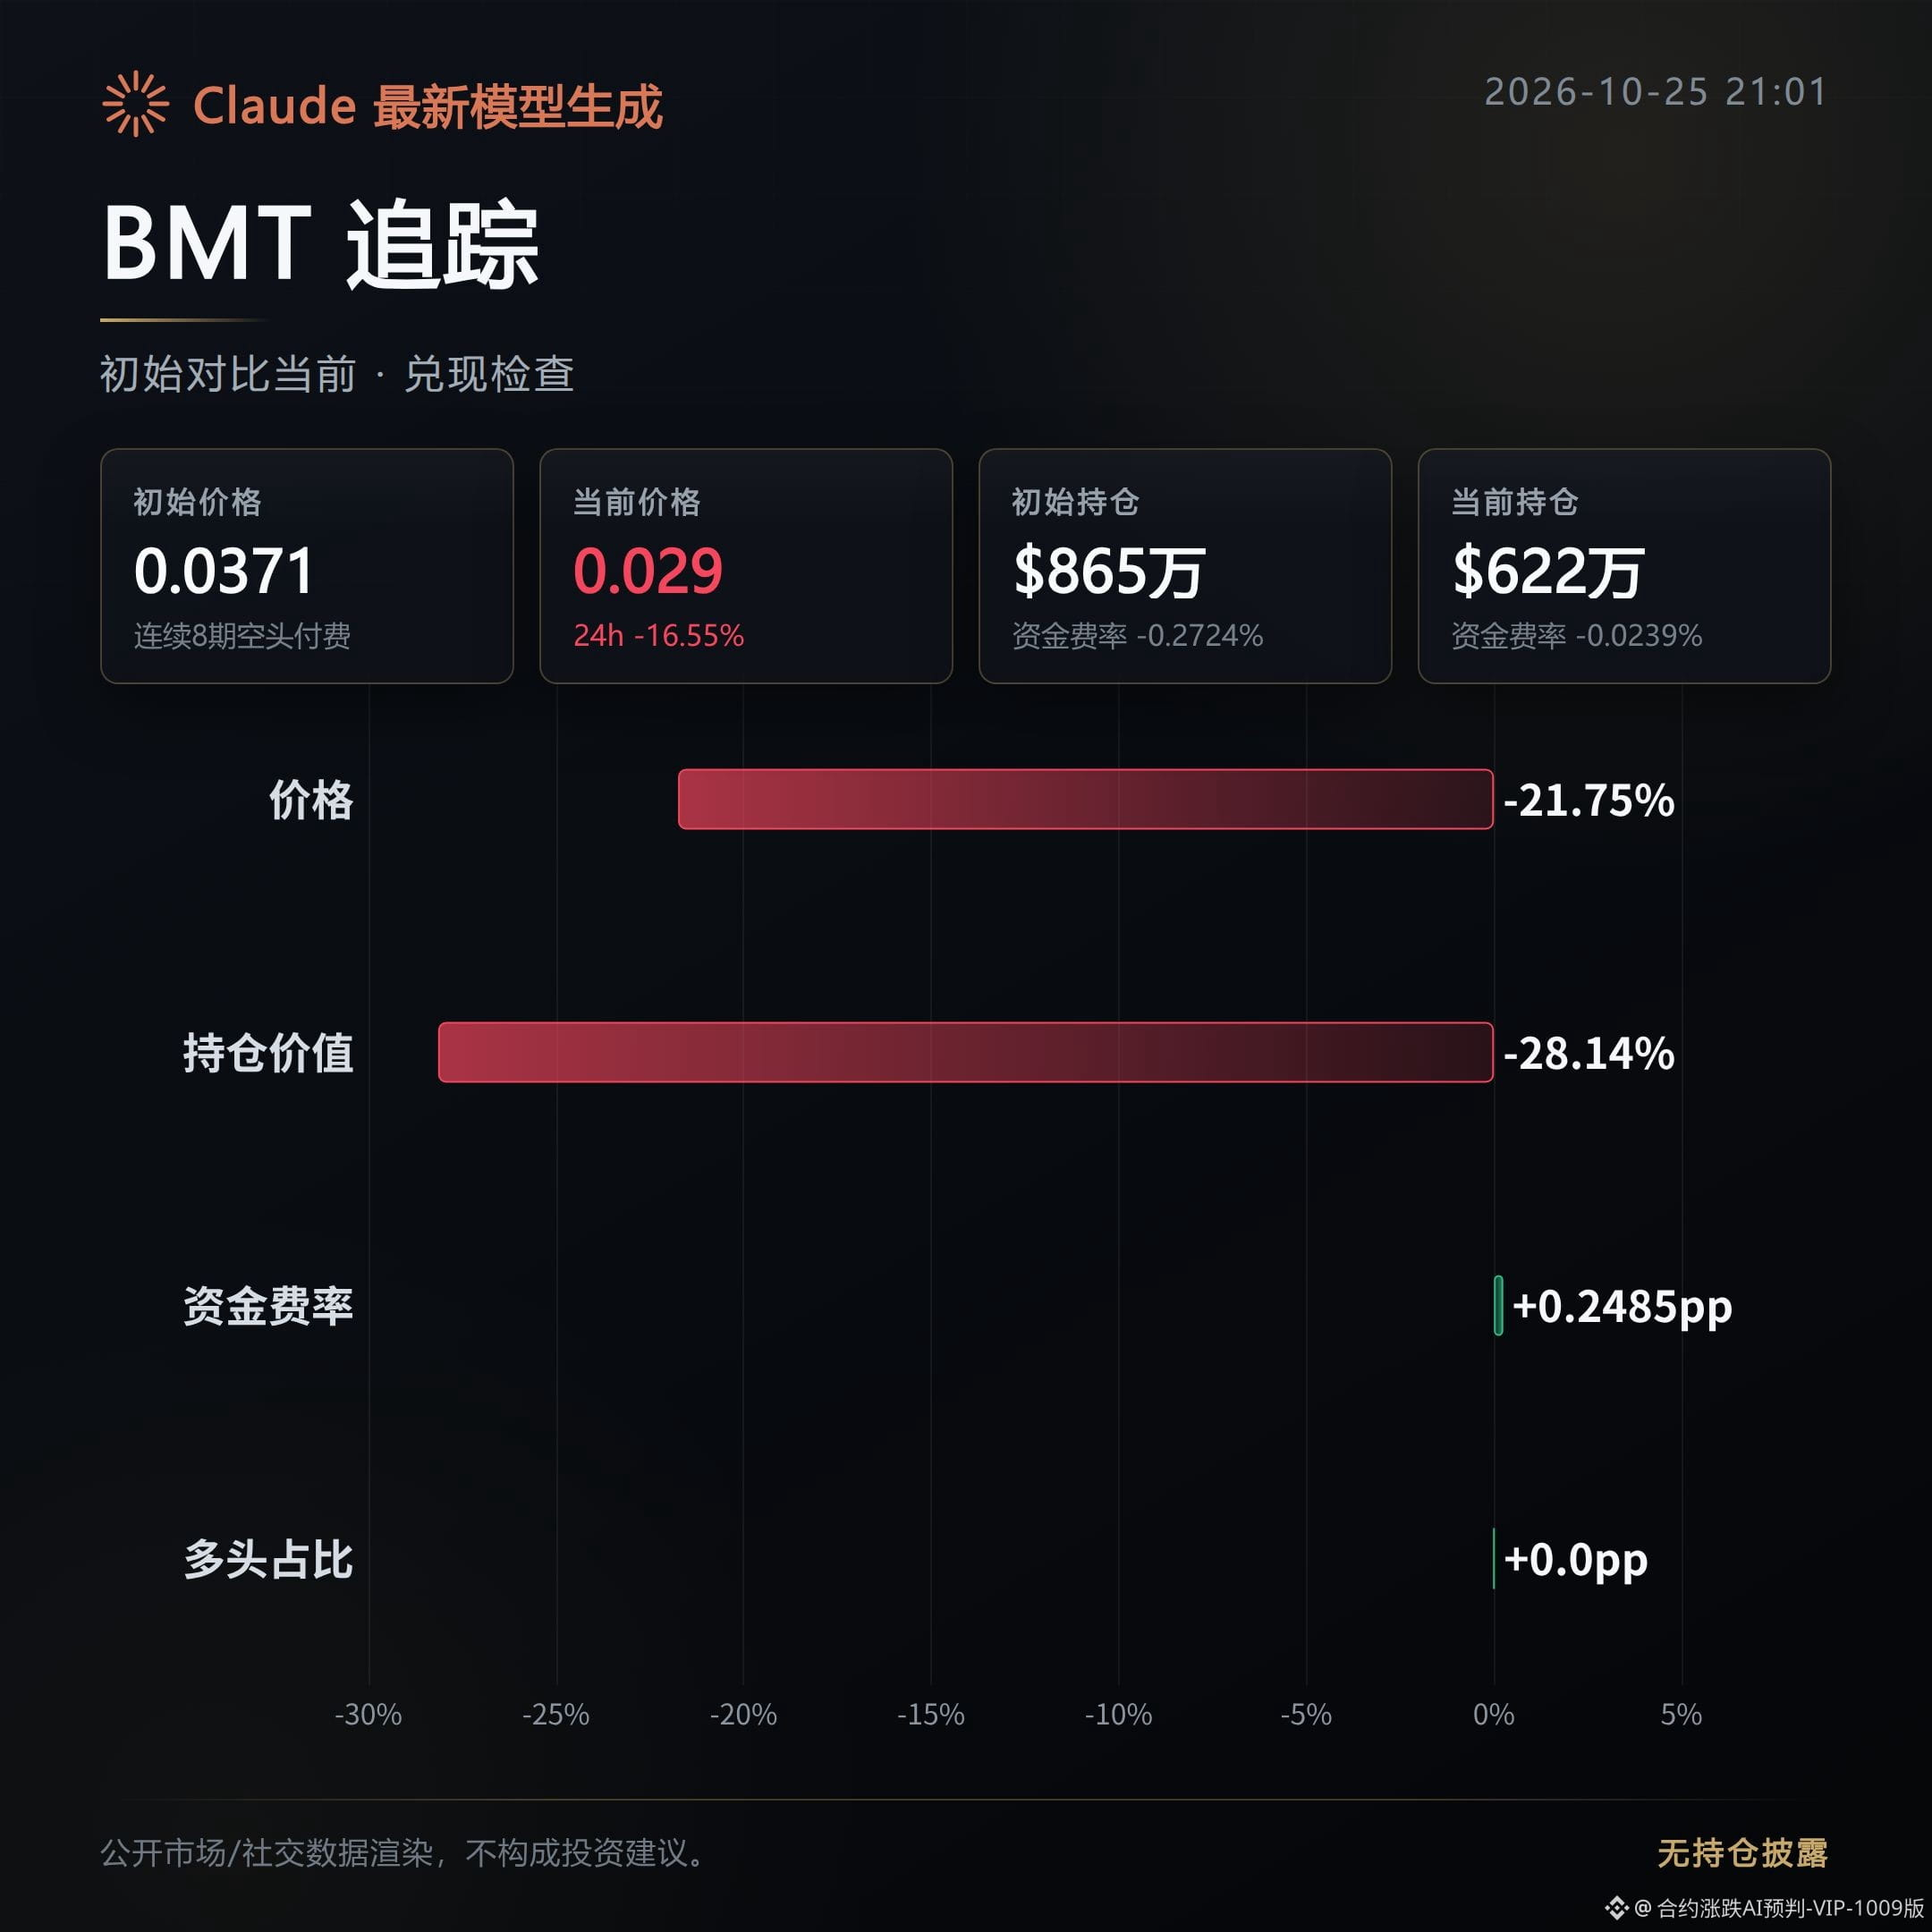
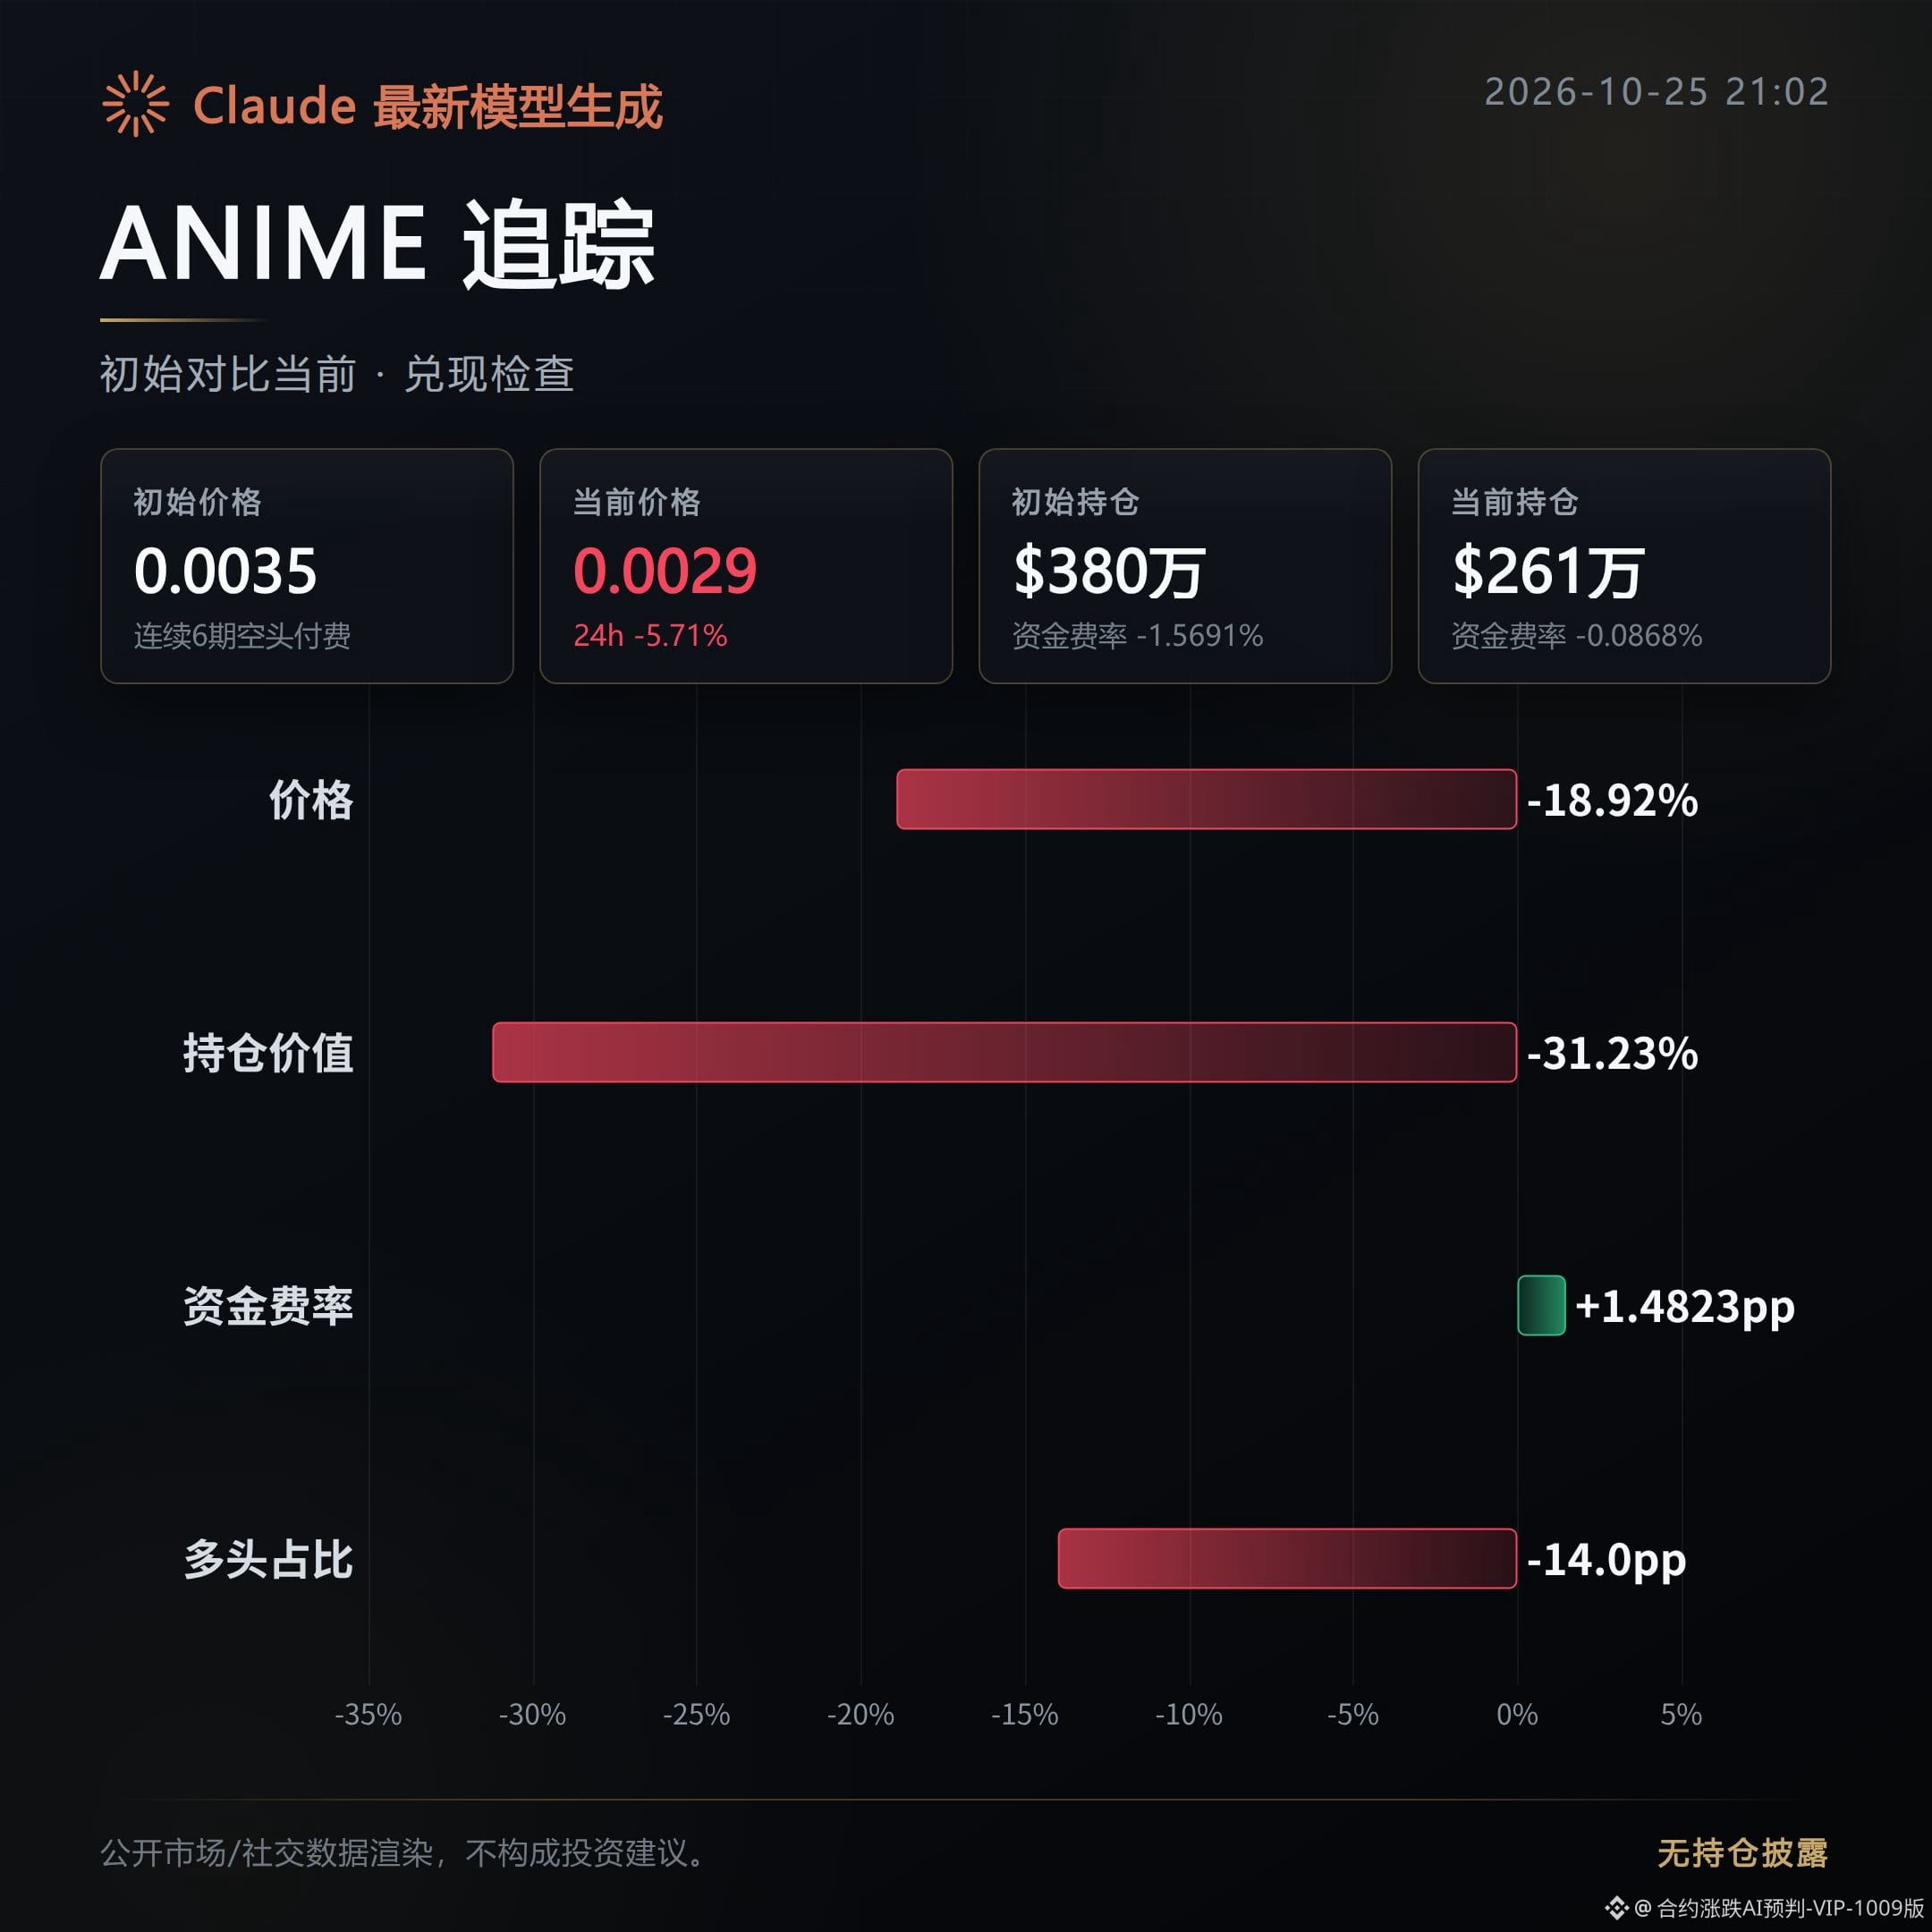
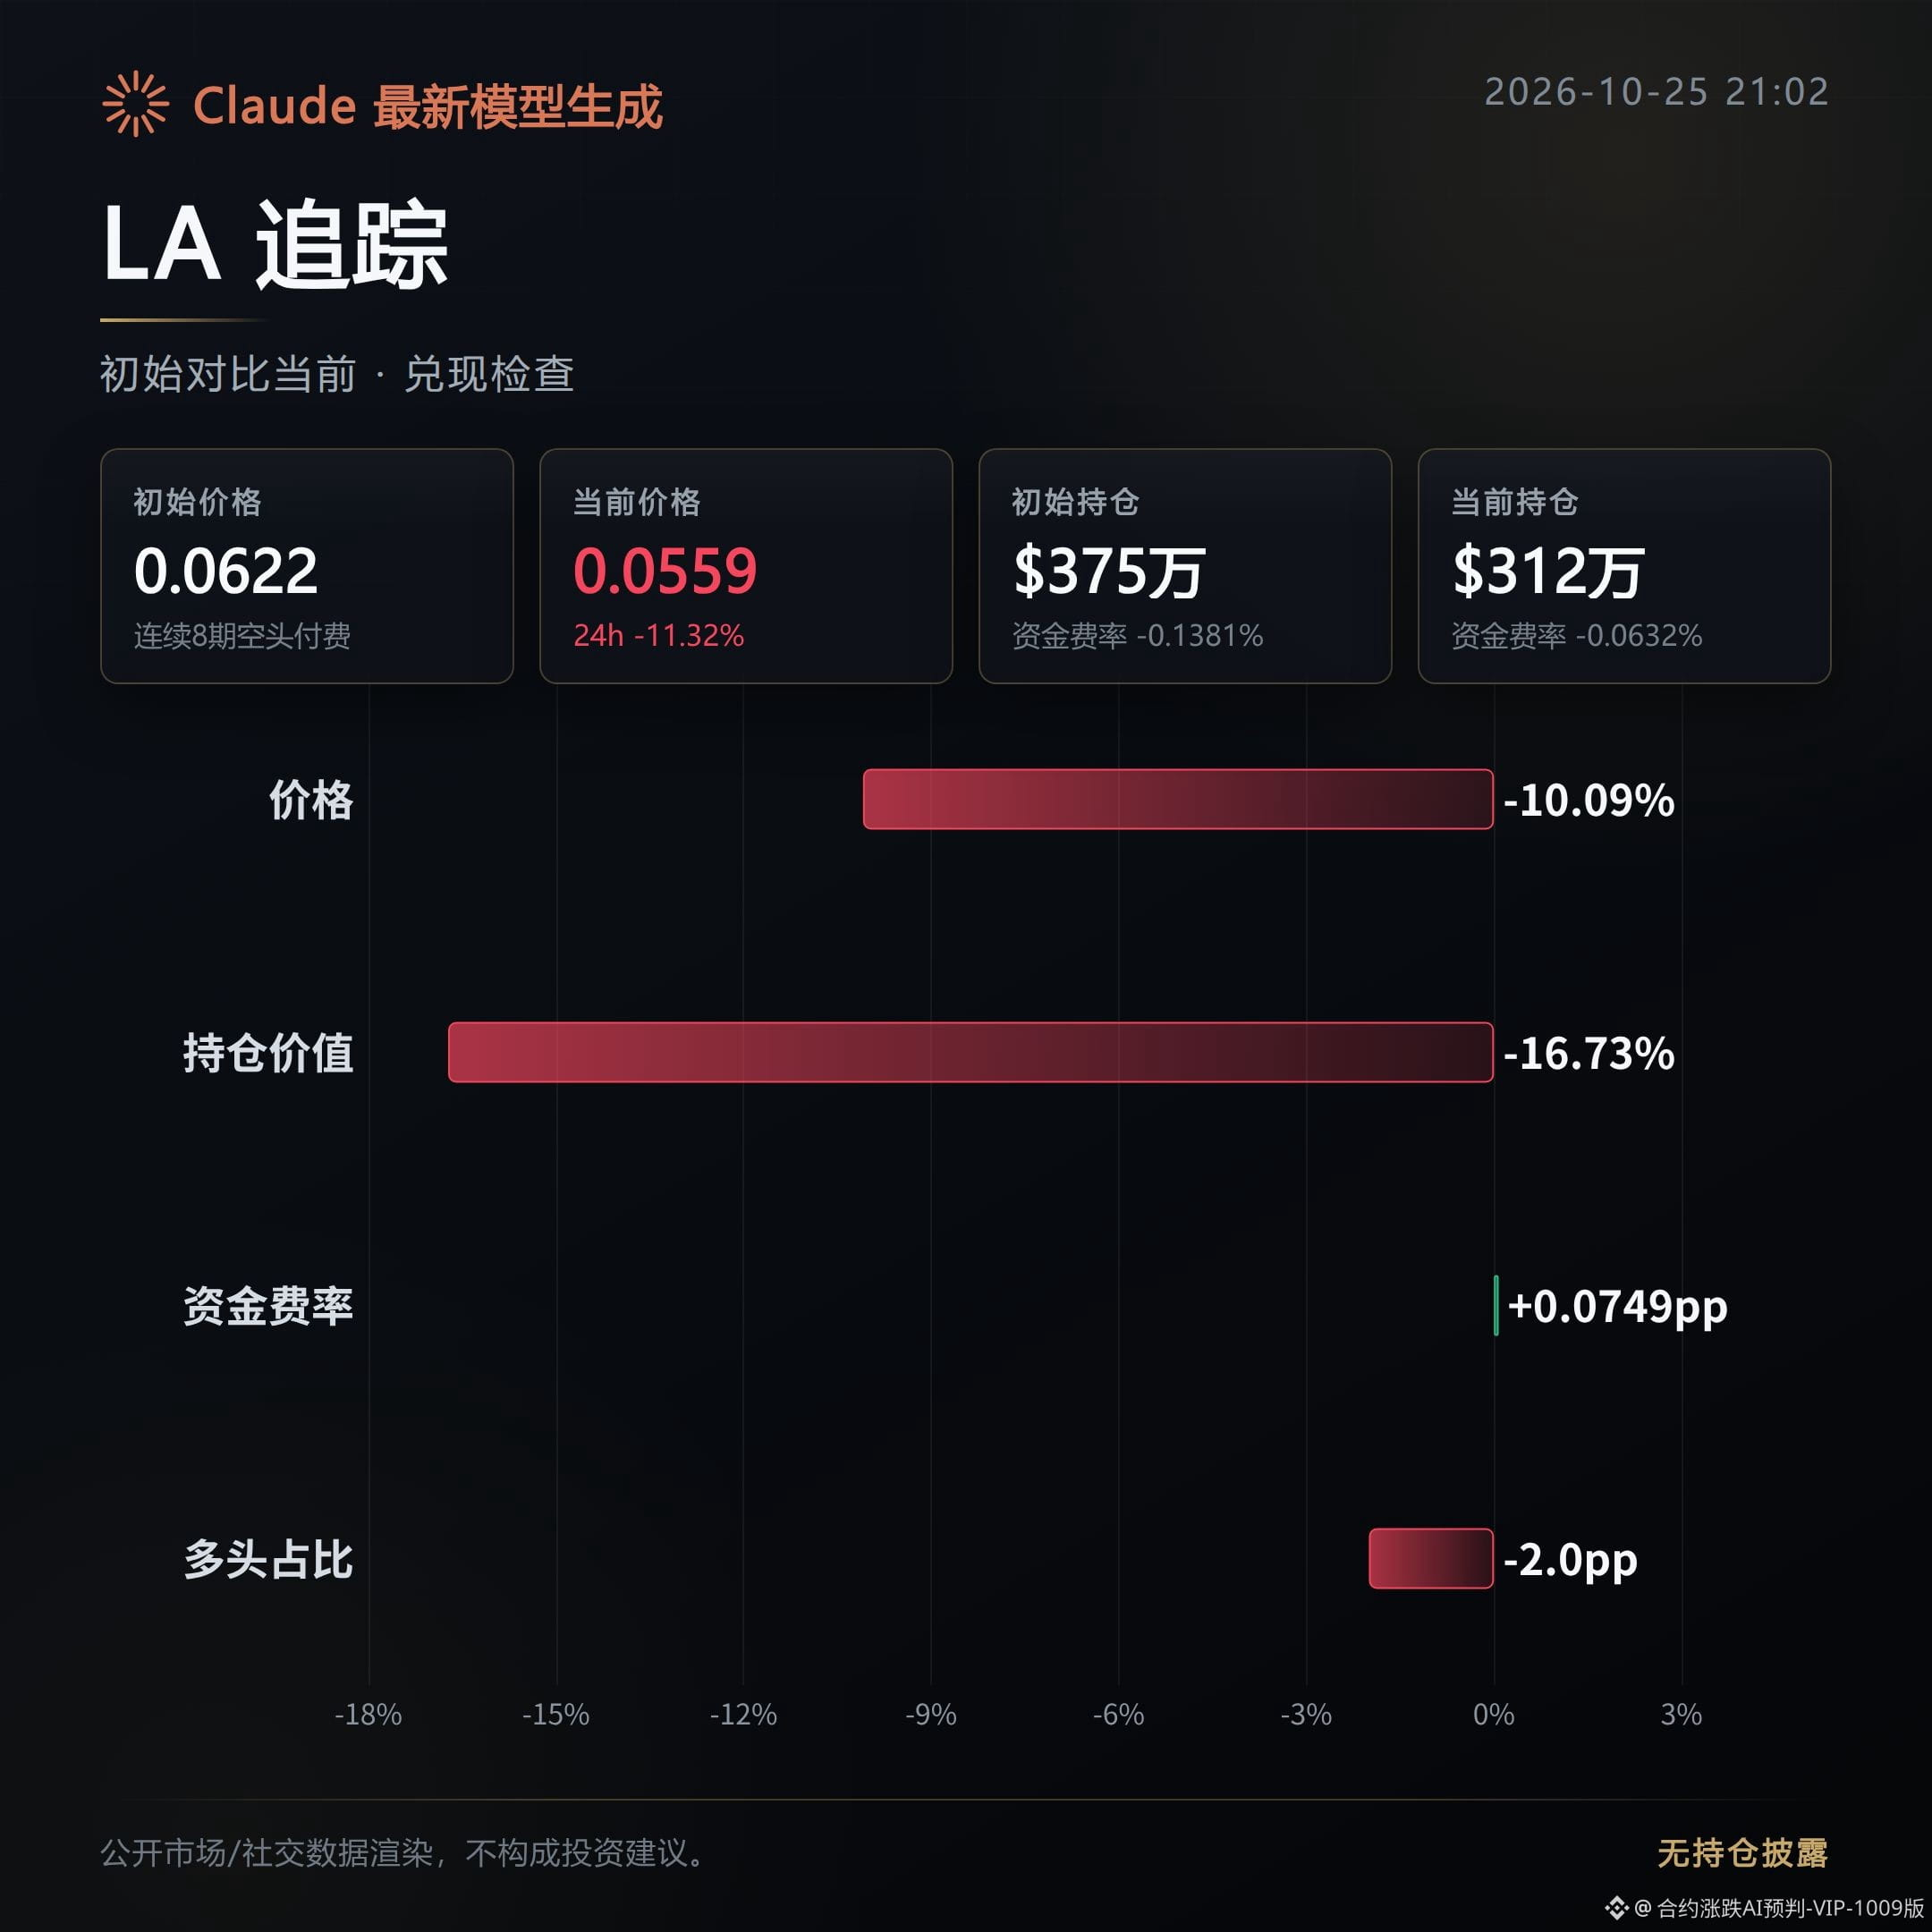
246
Of the 3 assets flagged as bullish this morning about 13 hours ago, none have played out so far: 1 has fizzled and 2 remain choppy. All 3 have failed to move in the expected direction.
Review of the initial calls: positioning is being reduced.
INIT: Fizzled—the bullish morning call has not played out.
Price fell 6.06% after the initial call, and the trend has already turned against the bullish outlook.
Open interest fell by 6.37% as well, indicating that no new capital stepped in to support the move. A recovery in aggressive buying also failed to reverse the price action.
NIL: Choppy—neither price action nor the positioning structure has confirmed the bullish direction from this morning.
Price fell 2.81% after the initial call, and the earlier upward momentum has clearly faded.
Open interest declined by 5.01%, suggesting weak support from incoming capital. For now, this cannot be considered a continuation of the bullish move.
CHIP: Choppy—the bullish morning call has temporarily fallen behind, but there is still no clear confirmation of a one-way move.
Price fell 2.35% after the initial call, showing that the rise has not continued with momentum.
The aggressive buy/sell ratio dropped from 1.29 to 0.99, meaning the buyers' advantage has virtually disappeared. The increase in trading volume has not translated into higher prices either.
Next, watch whether price can reclaim the initial-call level, whether open interest can stop falling, and whether aggressive buyers can regain and hold an advantage.
If price continues to weaken while open interest falls at the same time, that would further undermine this set of bullish morning calls, and this trade setup should be reassessed.
Compiled with assistance from Claude Fable 5 using derivatives data. For informational purposes only; please verify independently.
Of the 3 assets flagged as bullish this morning about 13 hours ago, none have played out so far: 1 has fizzled and 2 remain choppy. All 3 have failed to move in the expected direction.
Review of the initial calls: positioning is being reduced.
INIT: Fizzled—the bullish morning call has not played out.
Price fell 6.06% after the initial call, and the trend has already turned against the bullish outlook.
Open interest fell by 6.37% as well, indicating that no new capital stepped in to support the move. A recovery in aggressive buying also failed to reverse the price action.
NIL: Choppy—neither price action nor the positioning structure has confirmed the bullish direction from this morning.
Price fell 2.81% after the initial call, and the earlier upward momentum has clearly faded.
Open interest declined by 5.01%, suggesting weak support from incoming capital. For now, this cannot be considered a continuation of the bullish move.
CHIP: Choppy—the bullish morning call has temporarily fallen behind, but there is still no clear confirmation of a one-way move.
Price fell 2.35% after the initial call, showing that the rise has not continued with momentum.
The aggressive buy/sell ratio dropped from 1.29 to 0.99, meaning the buyers' advantage has virtually disappeared. The increase in trading volume has not translated into higher prices either.
Next, watch whether price can reclaim the initial-call level, whether open interest can stop falling, and whether aggressive buyers can regain and hold an advantage.
If price continues to weaken while open interest falls at the same time, that would further undermine this set of bullish morning calls, and this trade setup should be reassessed.
Compiled with assistance from Claude Fable 5 using derivatives data. For informational purposes only; please verify independently.
Review of the initial calls: positioning is being reduced.
INIT: Fizzled—the bullish morning call has not played out.
Price fell 6.06% after the initial call, and the trend has already turned against the bullish outlook.
Open interest fell by 6.37% as well, indicating that no new capital stepped in to support the move. A recovery in aggressive buying also failed to reverse the price action.
NIL: Choppy—neither price action nor the positioning structure has confirmed the bullish direction from this morning.
Price fell 2.81% after the initial call, and the earlier upward momentum has clearly faded.
Open interest declined by 5.01%, suggesting weak support from incoming capital. For now, this cannot be considered a continuation of the bullish move.
CHIP: Choppy—the bullish morning call has temporarily fallen behind, but there is still no clear confirmation of a one-way move.
Price fell 2.35% after the initial call, showing that the rise has not continued with momentum.
The aggressive buy/sell ratio dropped from 1.29 to 0.99, meaning the buyers' advantage has virtually disappeared. The increase in trading volume has not translated into higher prices either.
Next, watch whether price can reclaim the initial-call level, whether open interest can stop falling, and whether aggressive buyers can regain and hold an advantage.
If price continues to weaken while open interest falls at the same time, that would further undermine this set of bullish morning calls, and this trade setup should be reassessed.
Compiled with assistance from Claude Fable 5 using derivatives data. For informational purposes only; please verify independently.
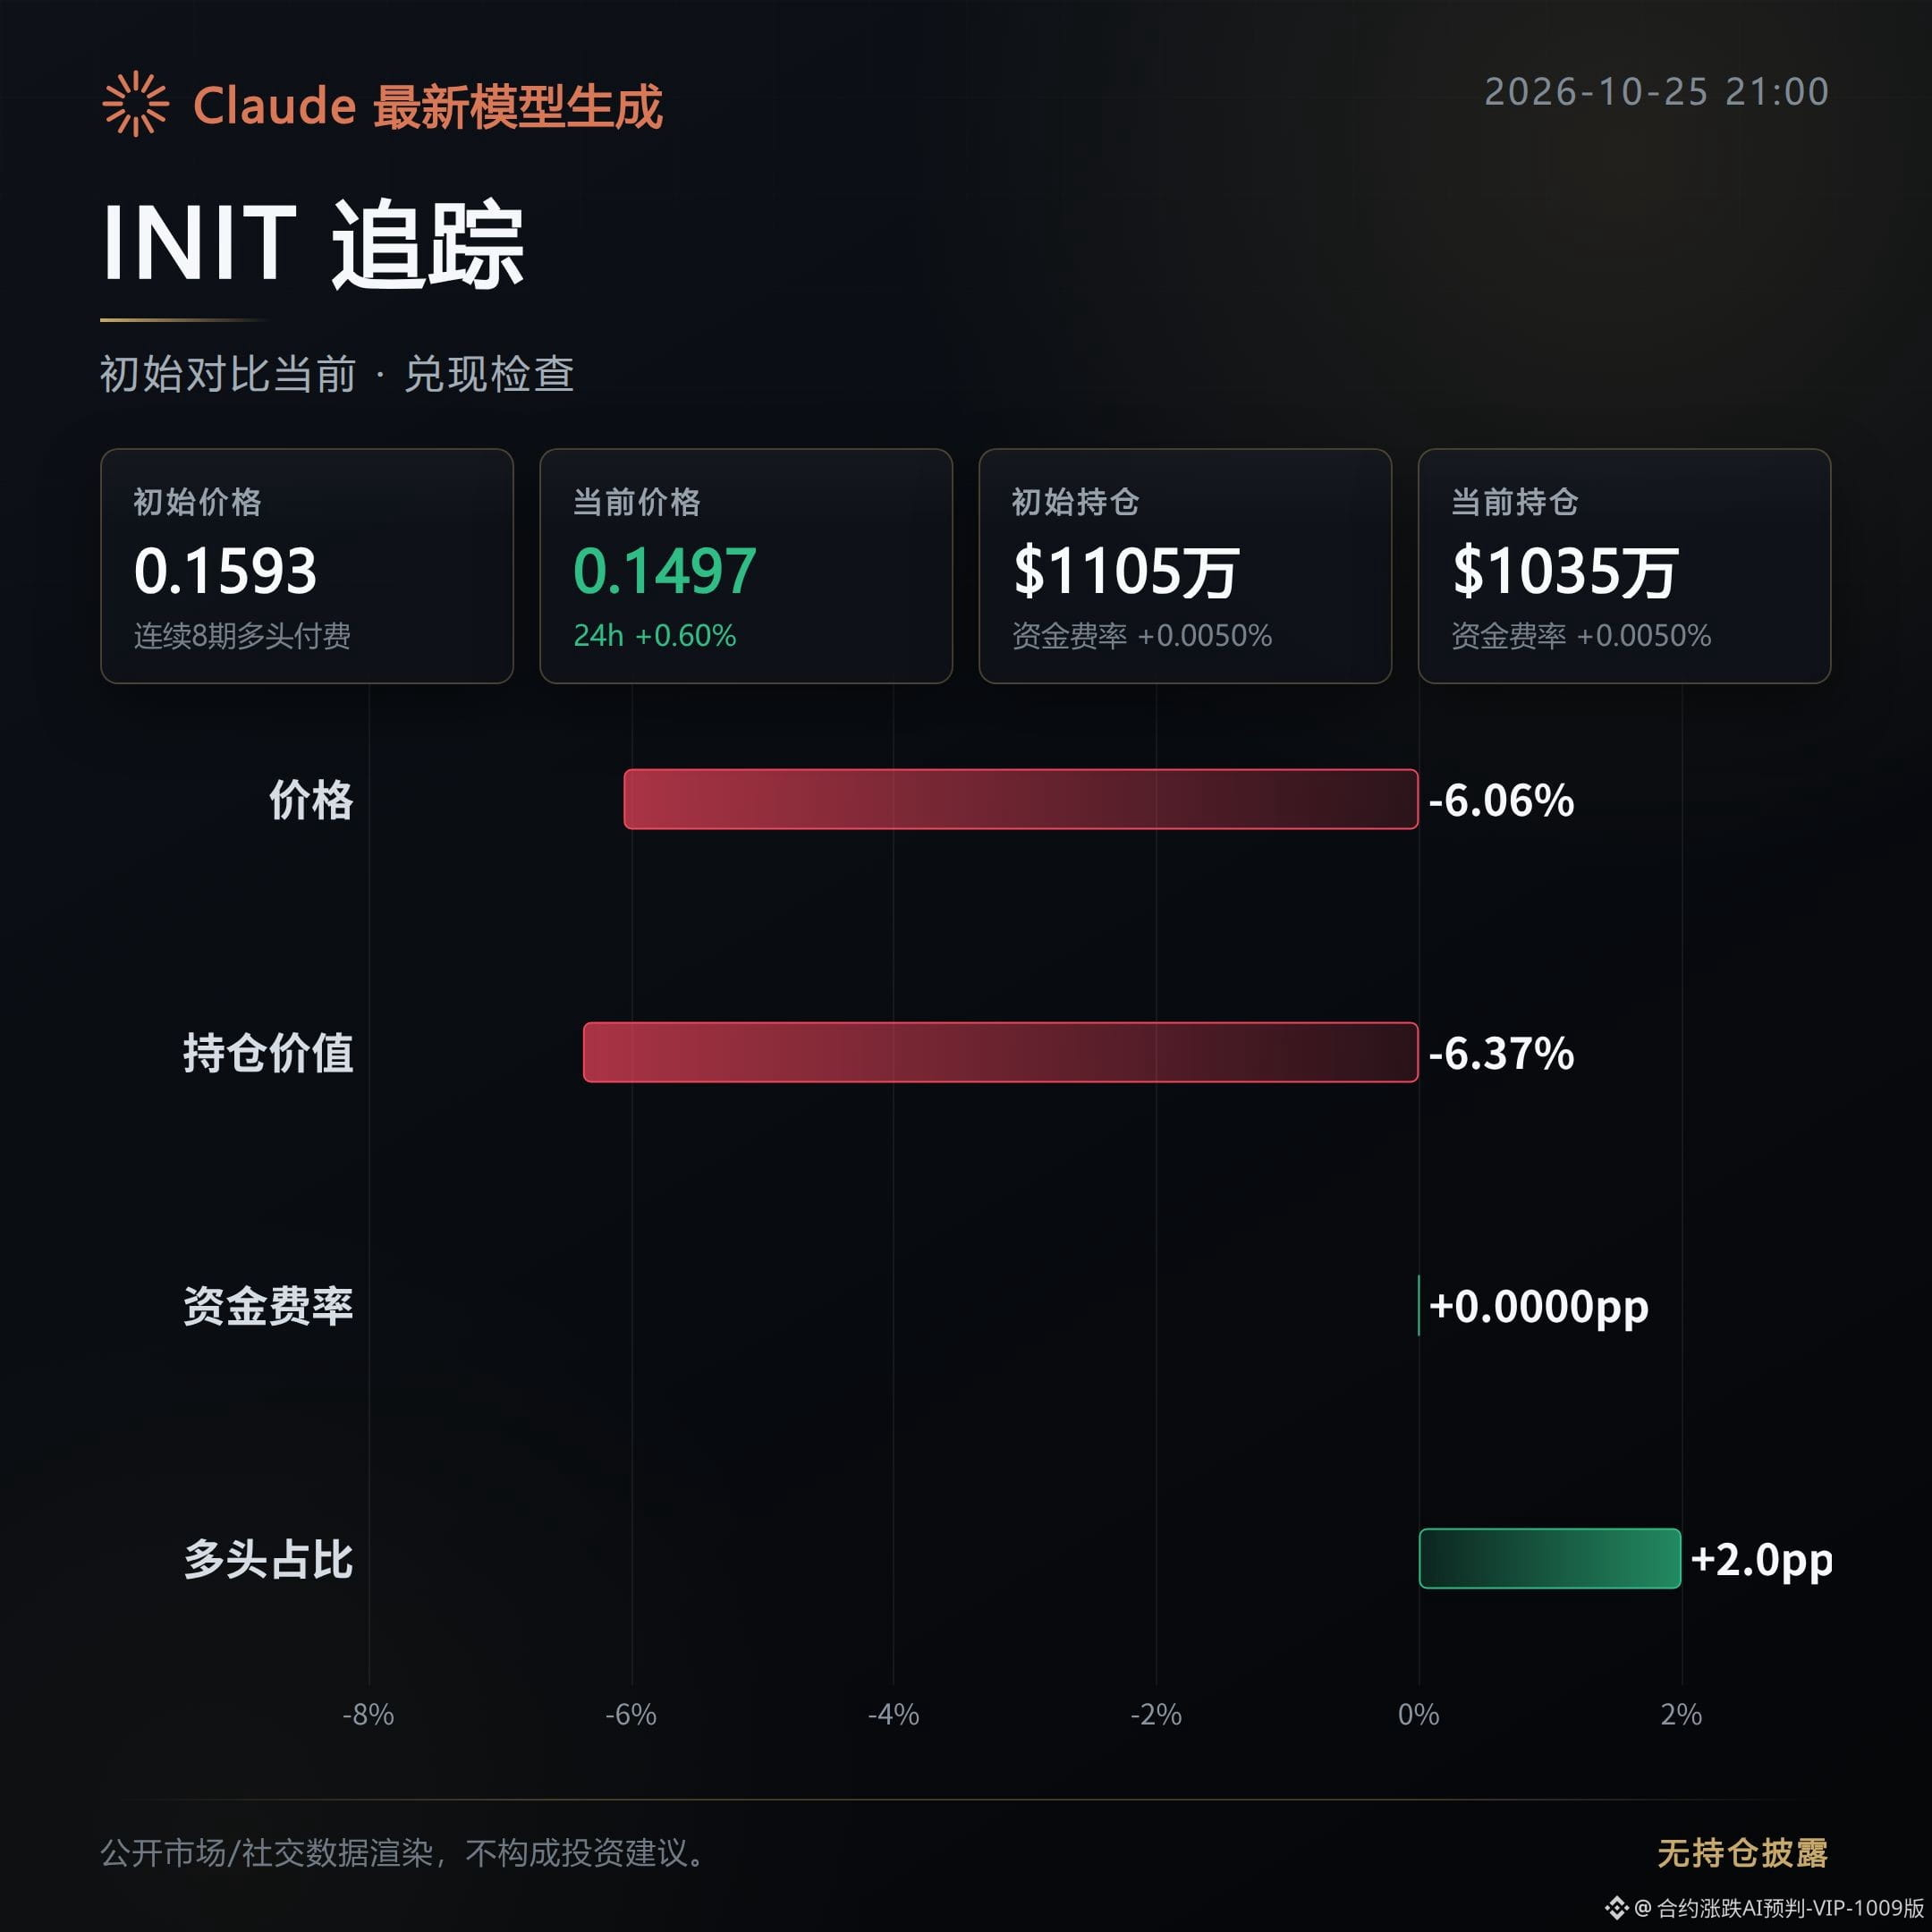
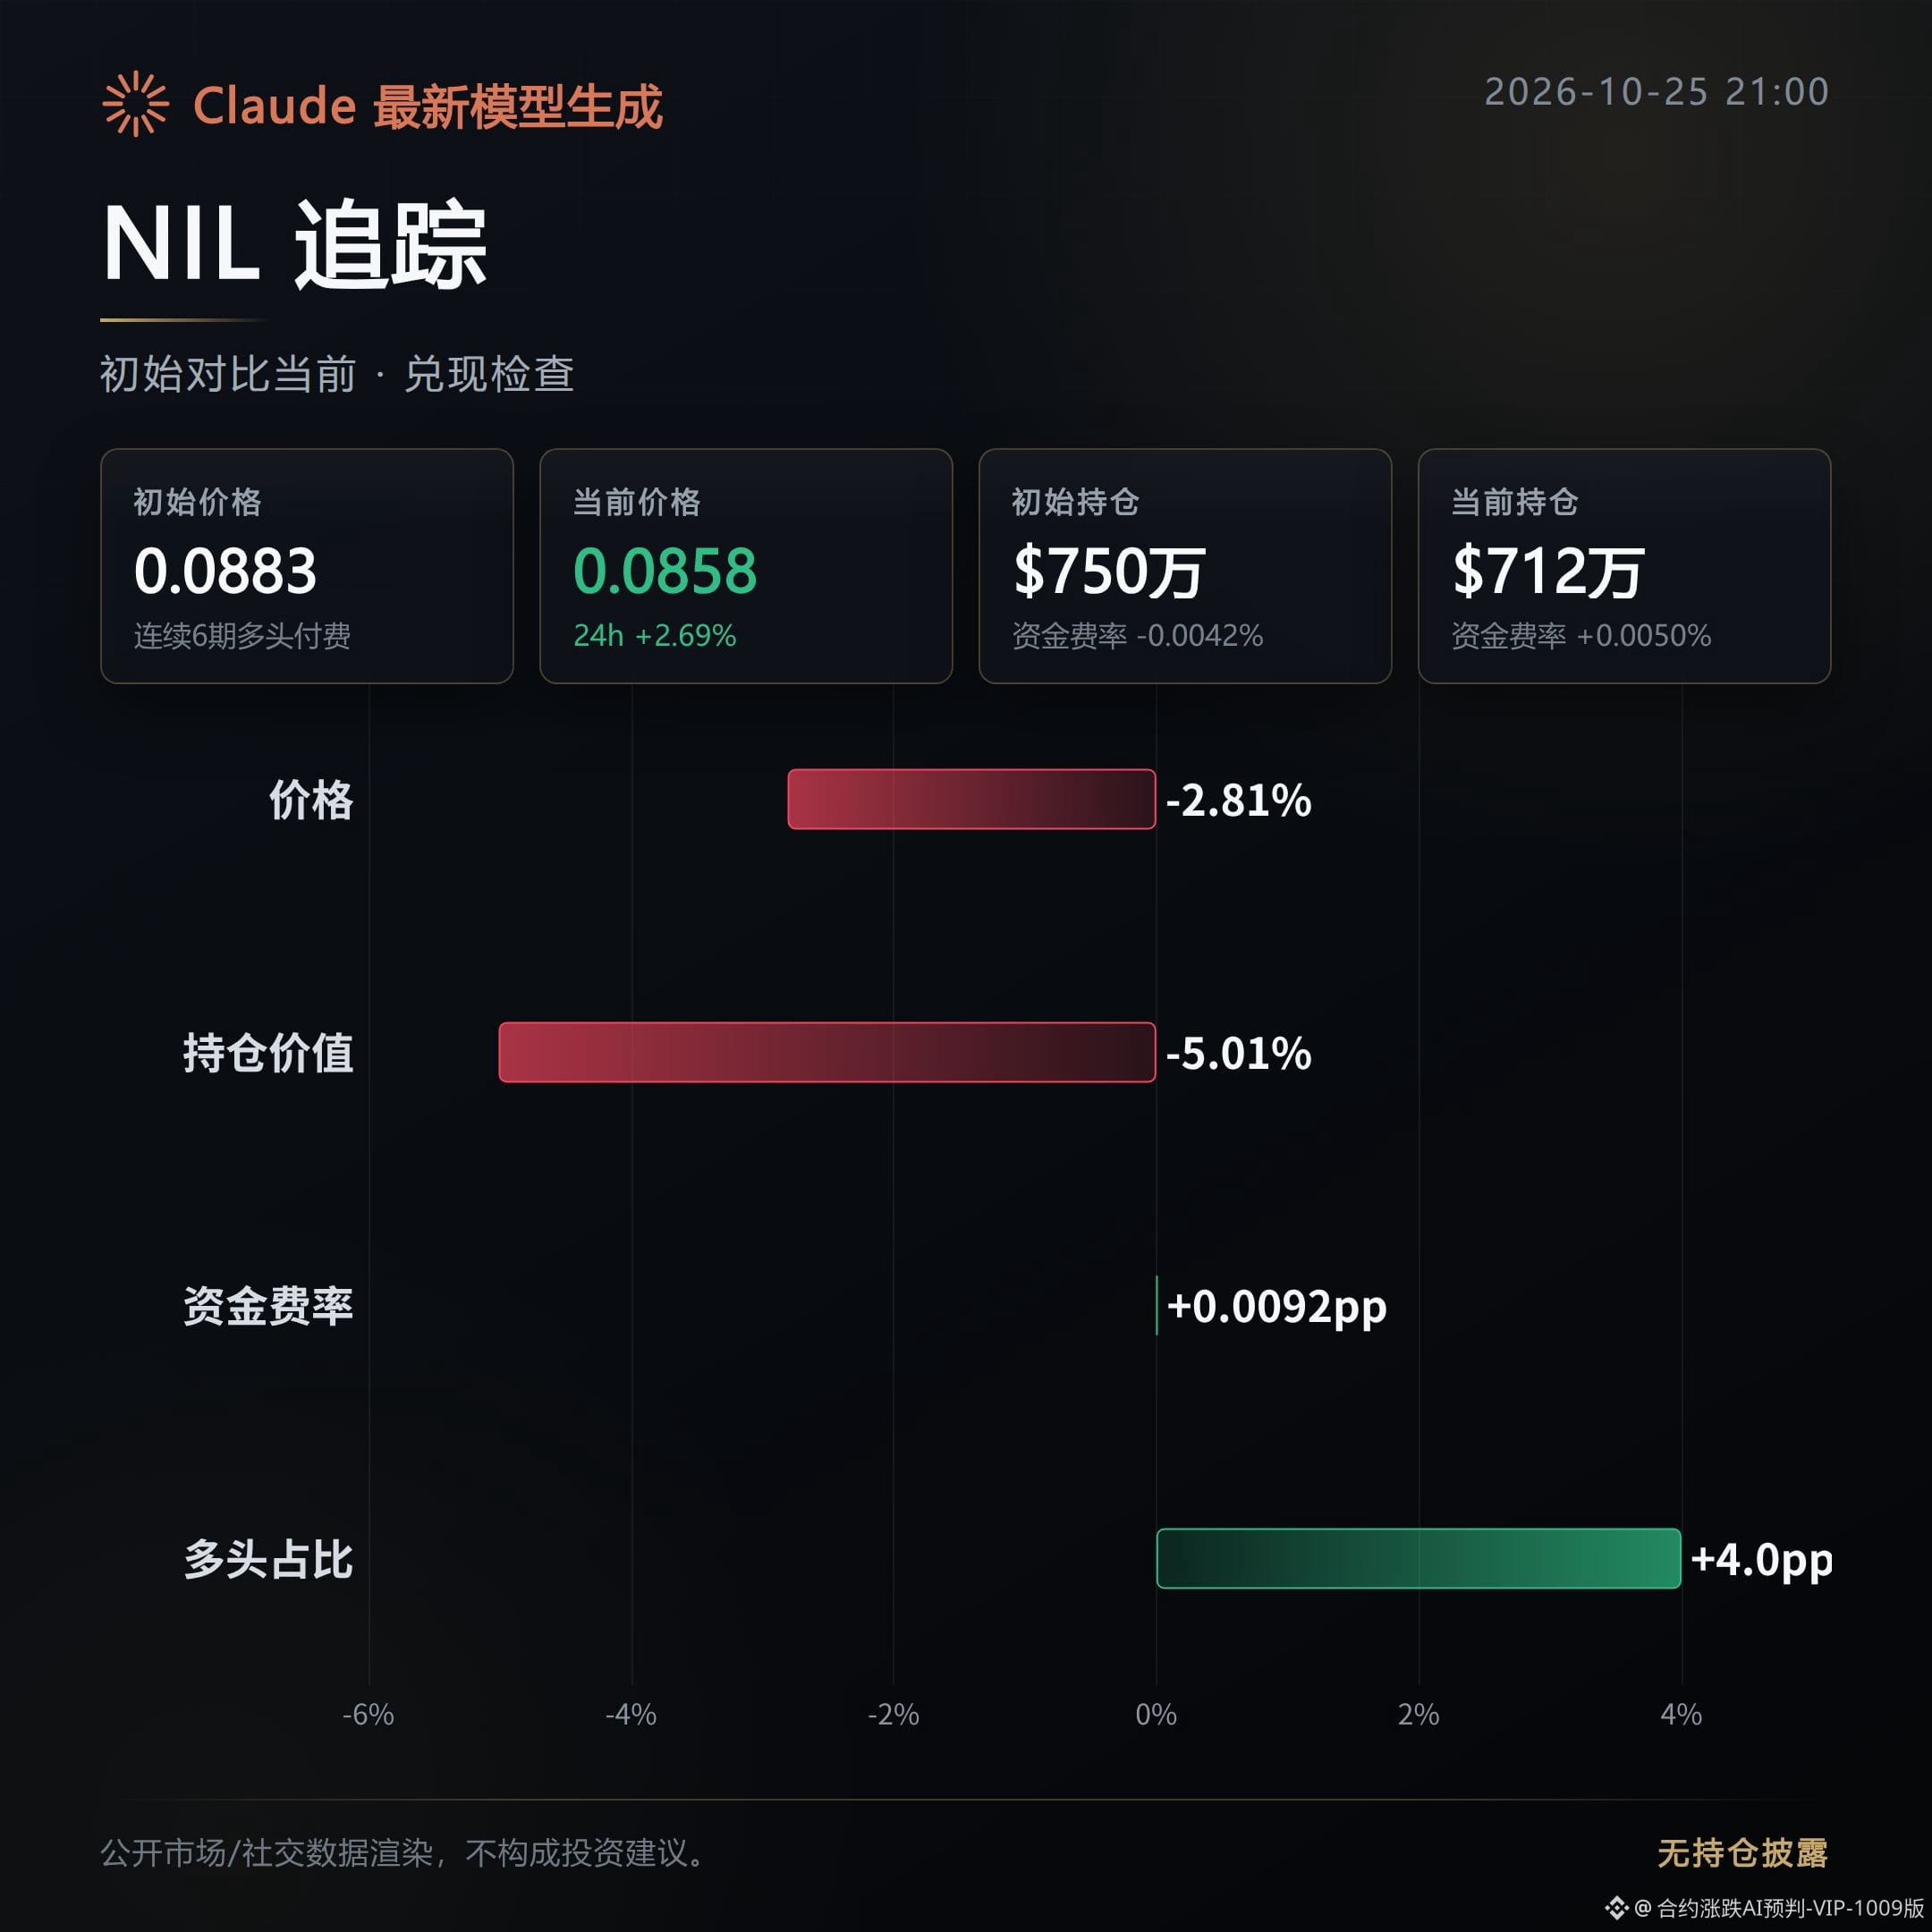
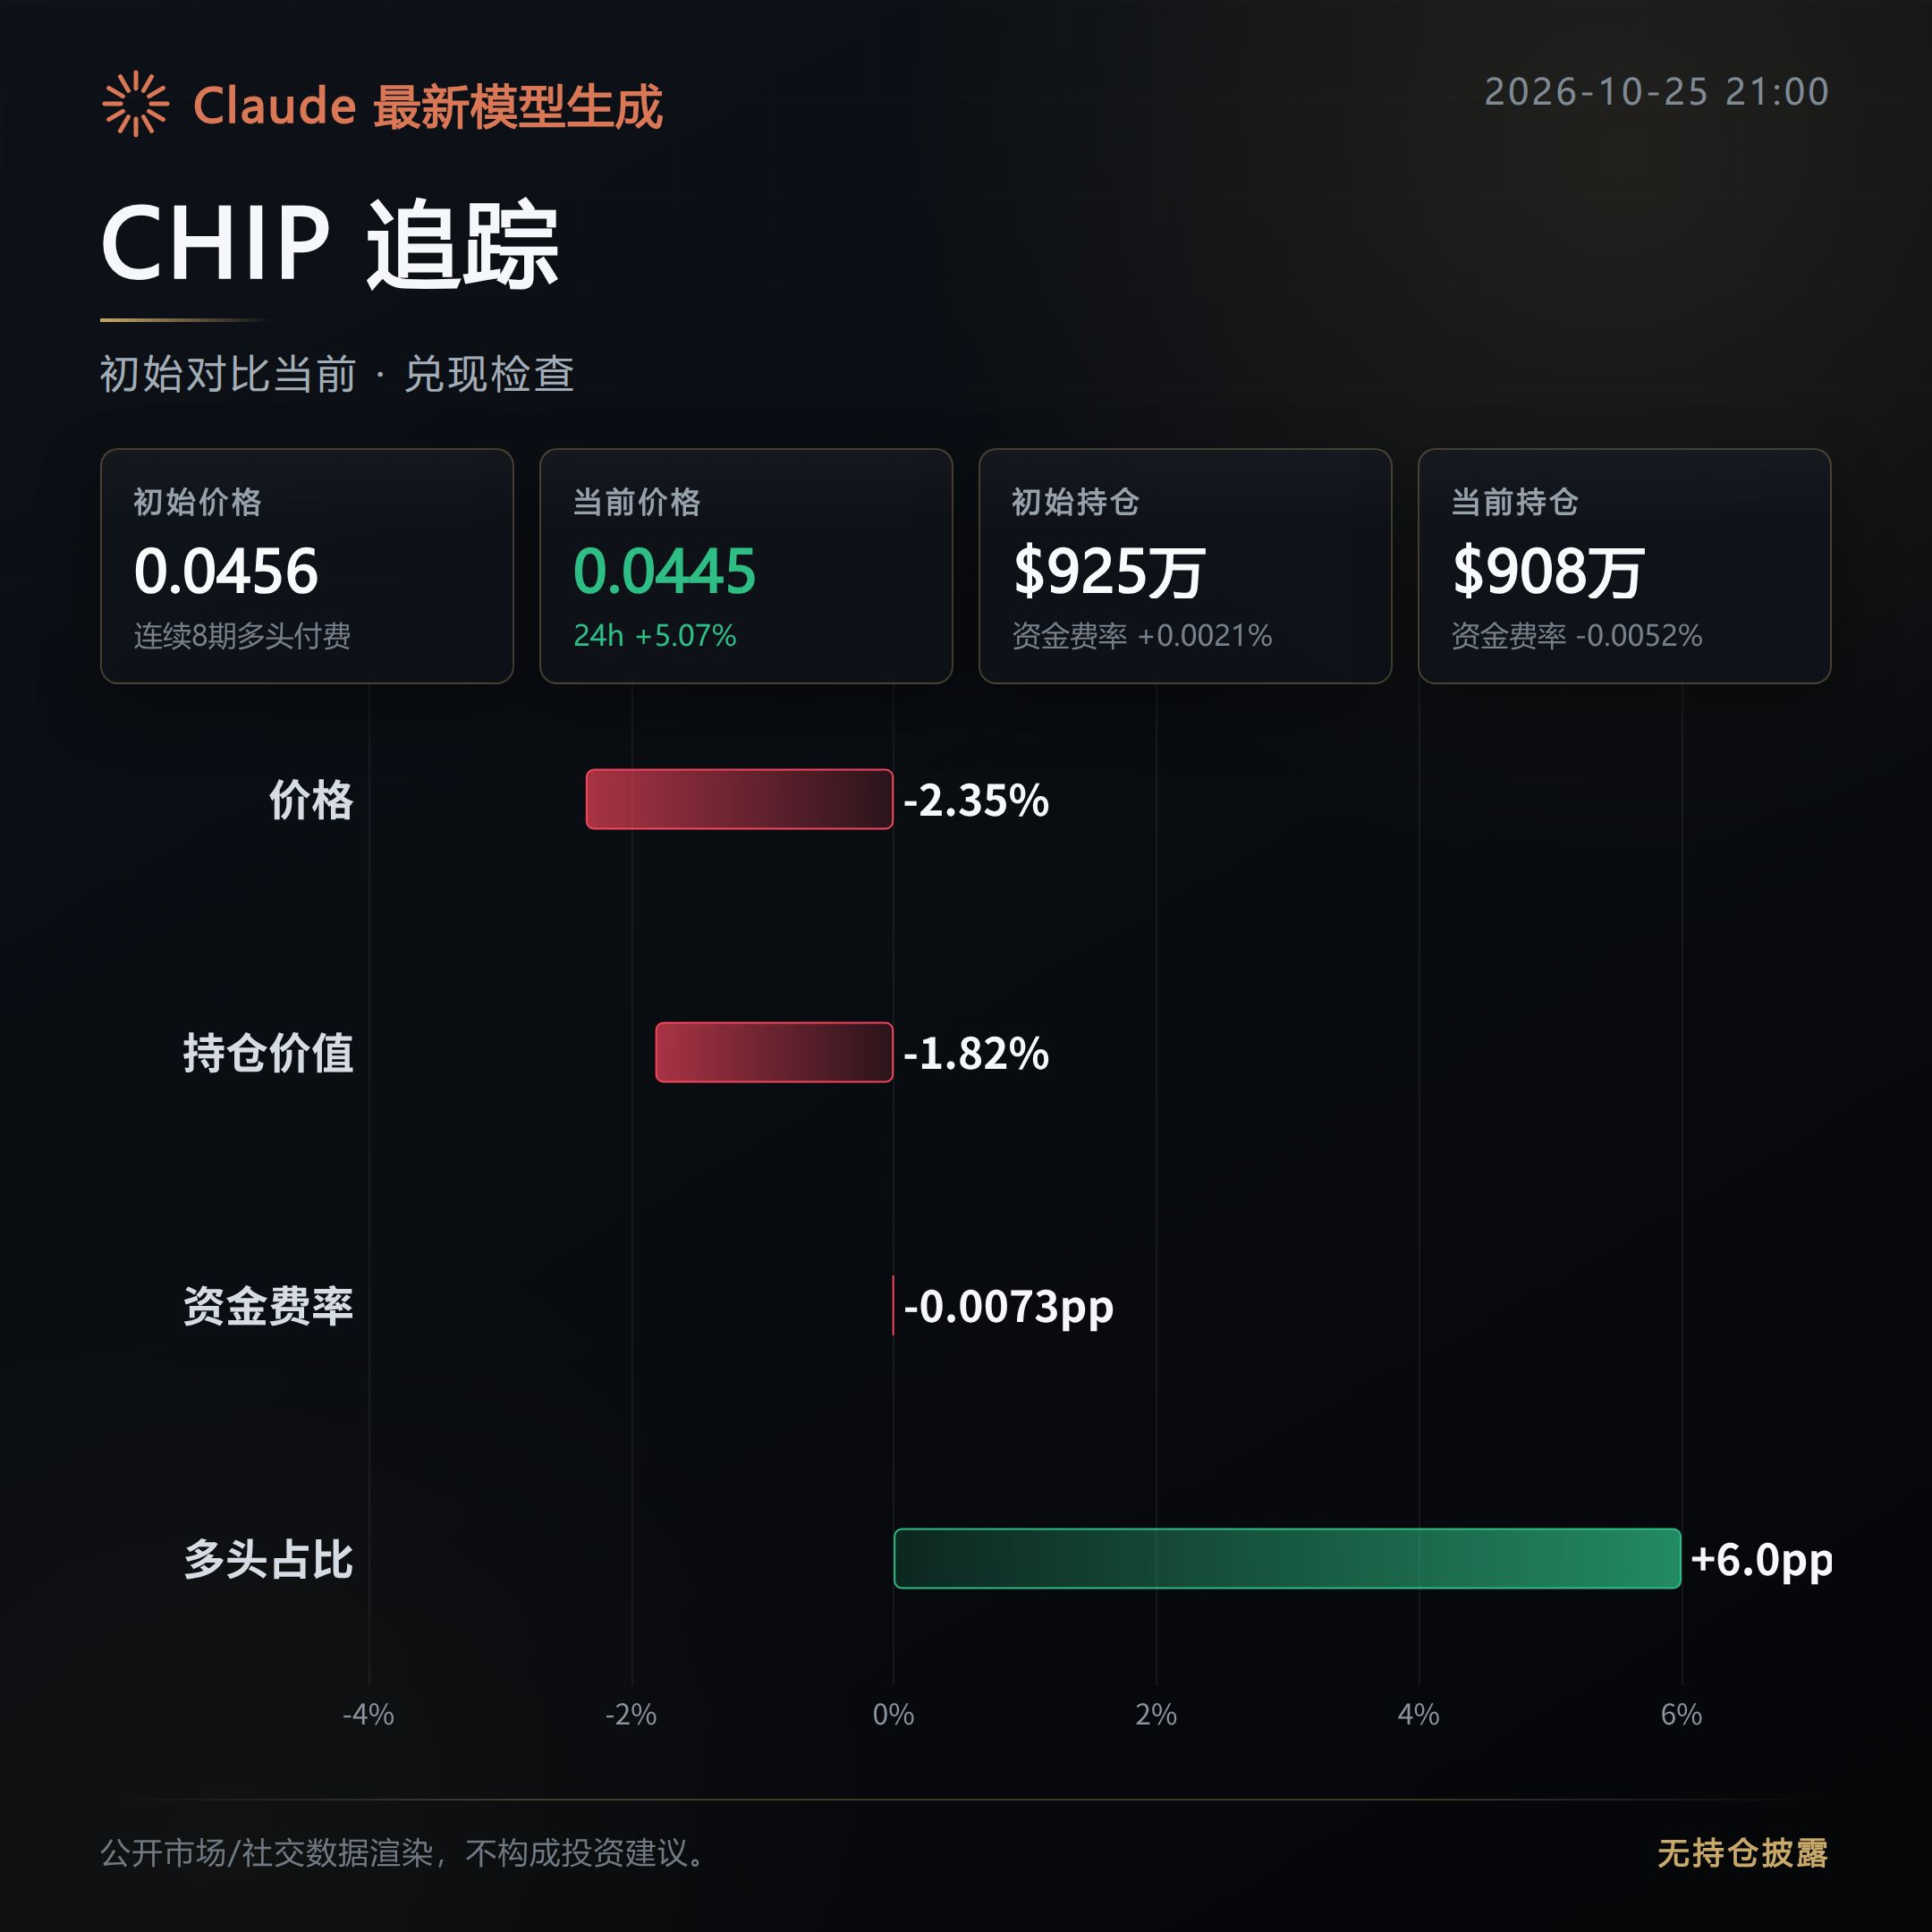
246
The top 3 tokens by 24-hour gains this morning—let’s check how they’ve done.
JCT: Delivered.
Since its initial listing, the price has continued to rise, up 22.12%. Open interest has also increased by 24.90%, with price and open interest still expanding in tandem.
T: Lost steam.
Since its initial listing, the price has fallen 10.88%, while open interest has risen 28.59%. Positions continued to build as the price fell, so the risk of a pullback from elevated levels is still worth watching.
ORDER: Delivered.
The price is still up 3.19% since its initial listing, but its current 24-hour change is -35.15%. These two measurement windows tell different stories: a slight gain since listing does not mean it has remained strong overall.
Tonight, keep an eye on whether price and open interest continue to move in tandem, and whether buying and selling pressure starts to weaken.
For T, the combination of a falling price and rising open interest makes the risk of increased volatility more pronounced.
Assisted by Claude Fable 5. For market information only; this is not investment advice.
The top 3 tokens by 24-hour gains this morning—let’s check how they’ve done.
JCT: Delivered.
Since its initial listing, the price has continued to rise, up 22.12%. Open interest has also increased by 24.90%, with price and open interest still expanding in tandem.
T: Lost steam.
Since its initial listing, the price has fallen 10.88%, while open interest has risen 28.59%. Positions continued to build as the price fell, so the risk of a pullback from elevated levels is still worth watching.
ORDER: Delivered.
The price is still up 3.19% since its initial listing, but its current 24-hour change is -35.15%. These two measurement windows tell different stories: a slight gain since listing does not mean it has remained strong overall.
Tonight, keep an eye on whether price and open interest continue to move in tandem, and whether buying and selling pressure starts to weaken.
For T, the combination of a falling price and rising open interest makes the risk of increased volatility more pronounced.
Assisted by Claude Fable 5. For market information only; this is not investment advice.
JCT: Delivered.
Since its initial listing, the price has continued to rise, up 22.12%. Open interest has also increased by 24.90%, with price and open interest still expanding in tandem.
T: Lost steam.
Since its initial listing, the price has fallen 10.88%, while open interest has risen 28.59%. Positions continued to build as the price fell, so the risk of a pullback from elevated levels is still worth watching.
ORDER: Delivered.
The price is still up 3.19% since its initial listing, but its current 24-hour change is -35.15%. These two measurement windows tell different stories: a slight gain since listing does not mean it has remained strong overall.
Tonight, keep an eye on whether price and open interest continue to move in tandem, and whether buying and selling pressure starts to weaken.
For T, the combination of a falling price and rising open interest makes the risk of increased volatility more pronounced.
Assisted by Claude Fable 5. For market information only; this is not investment advice.
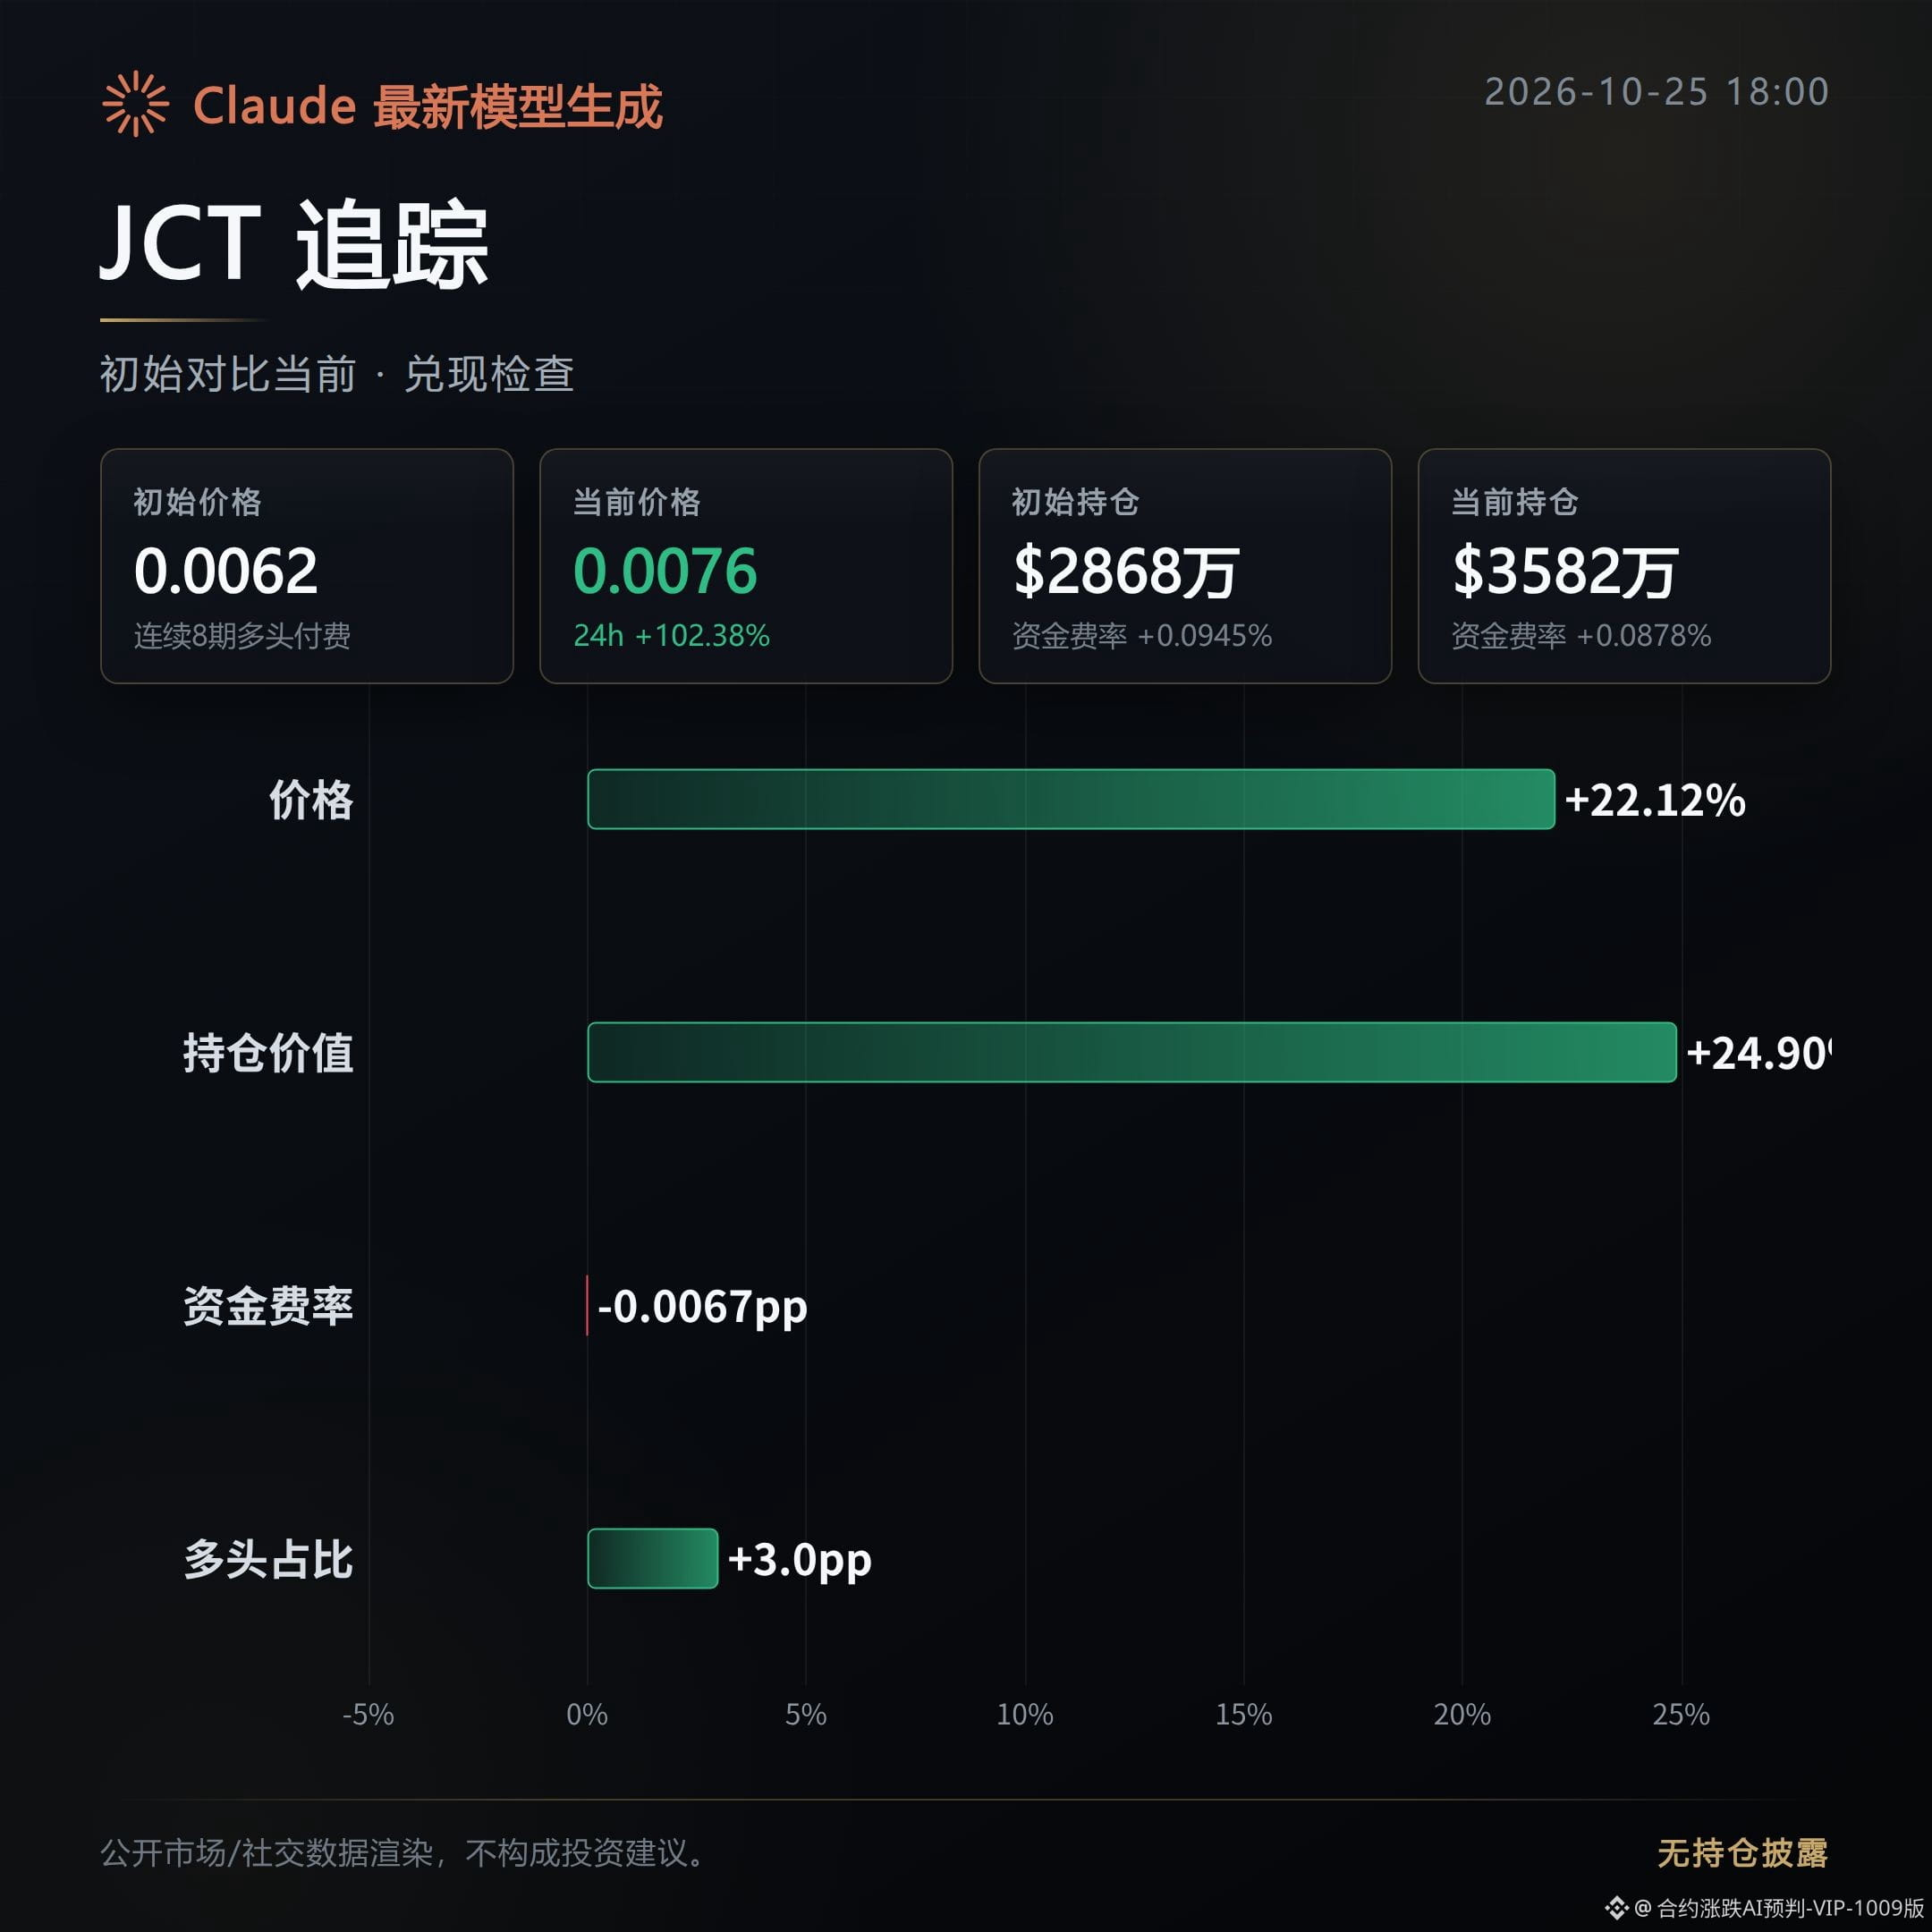
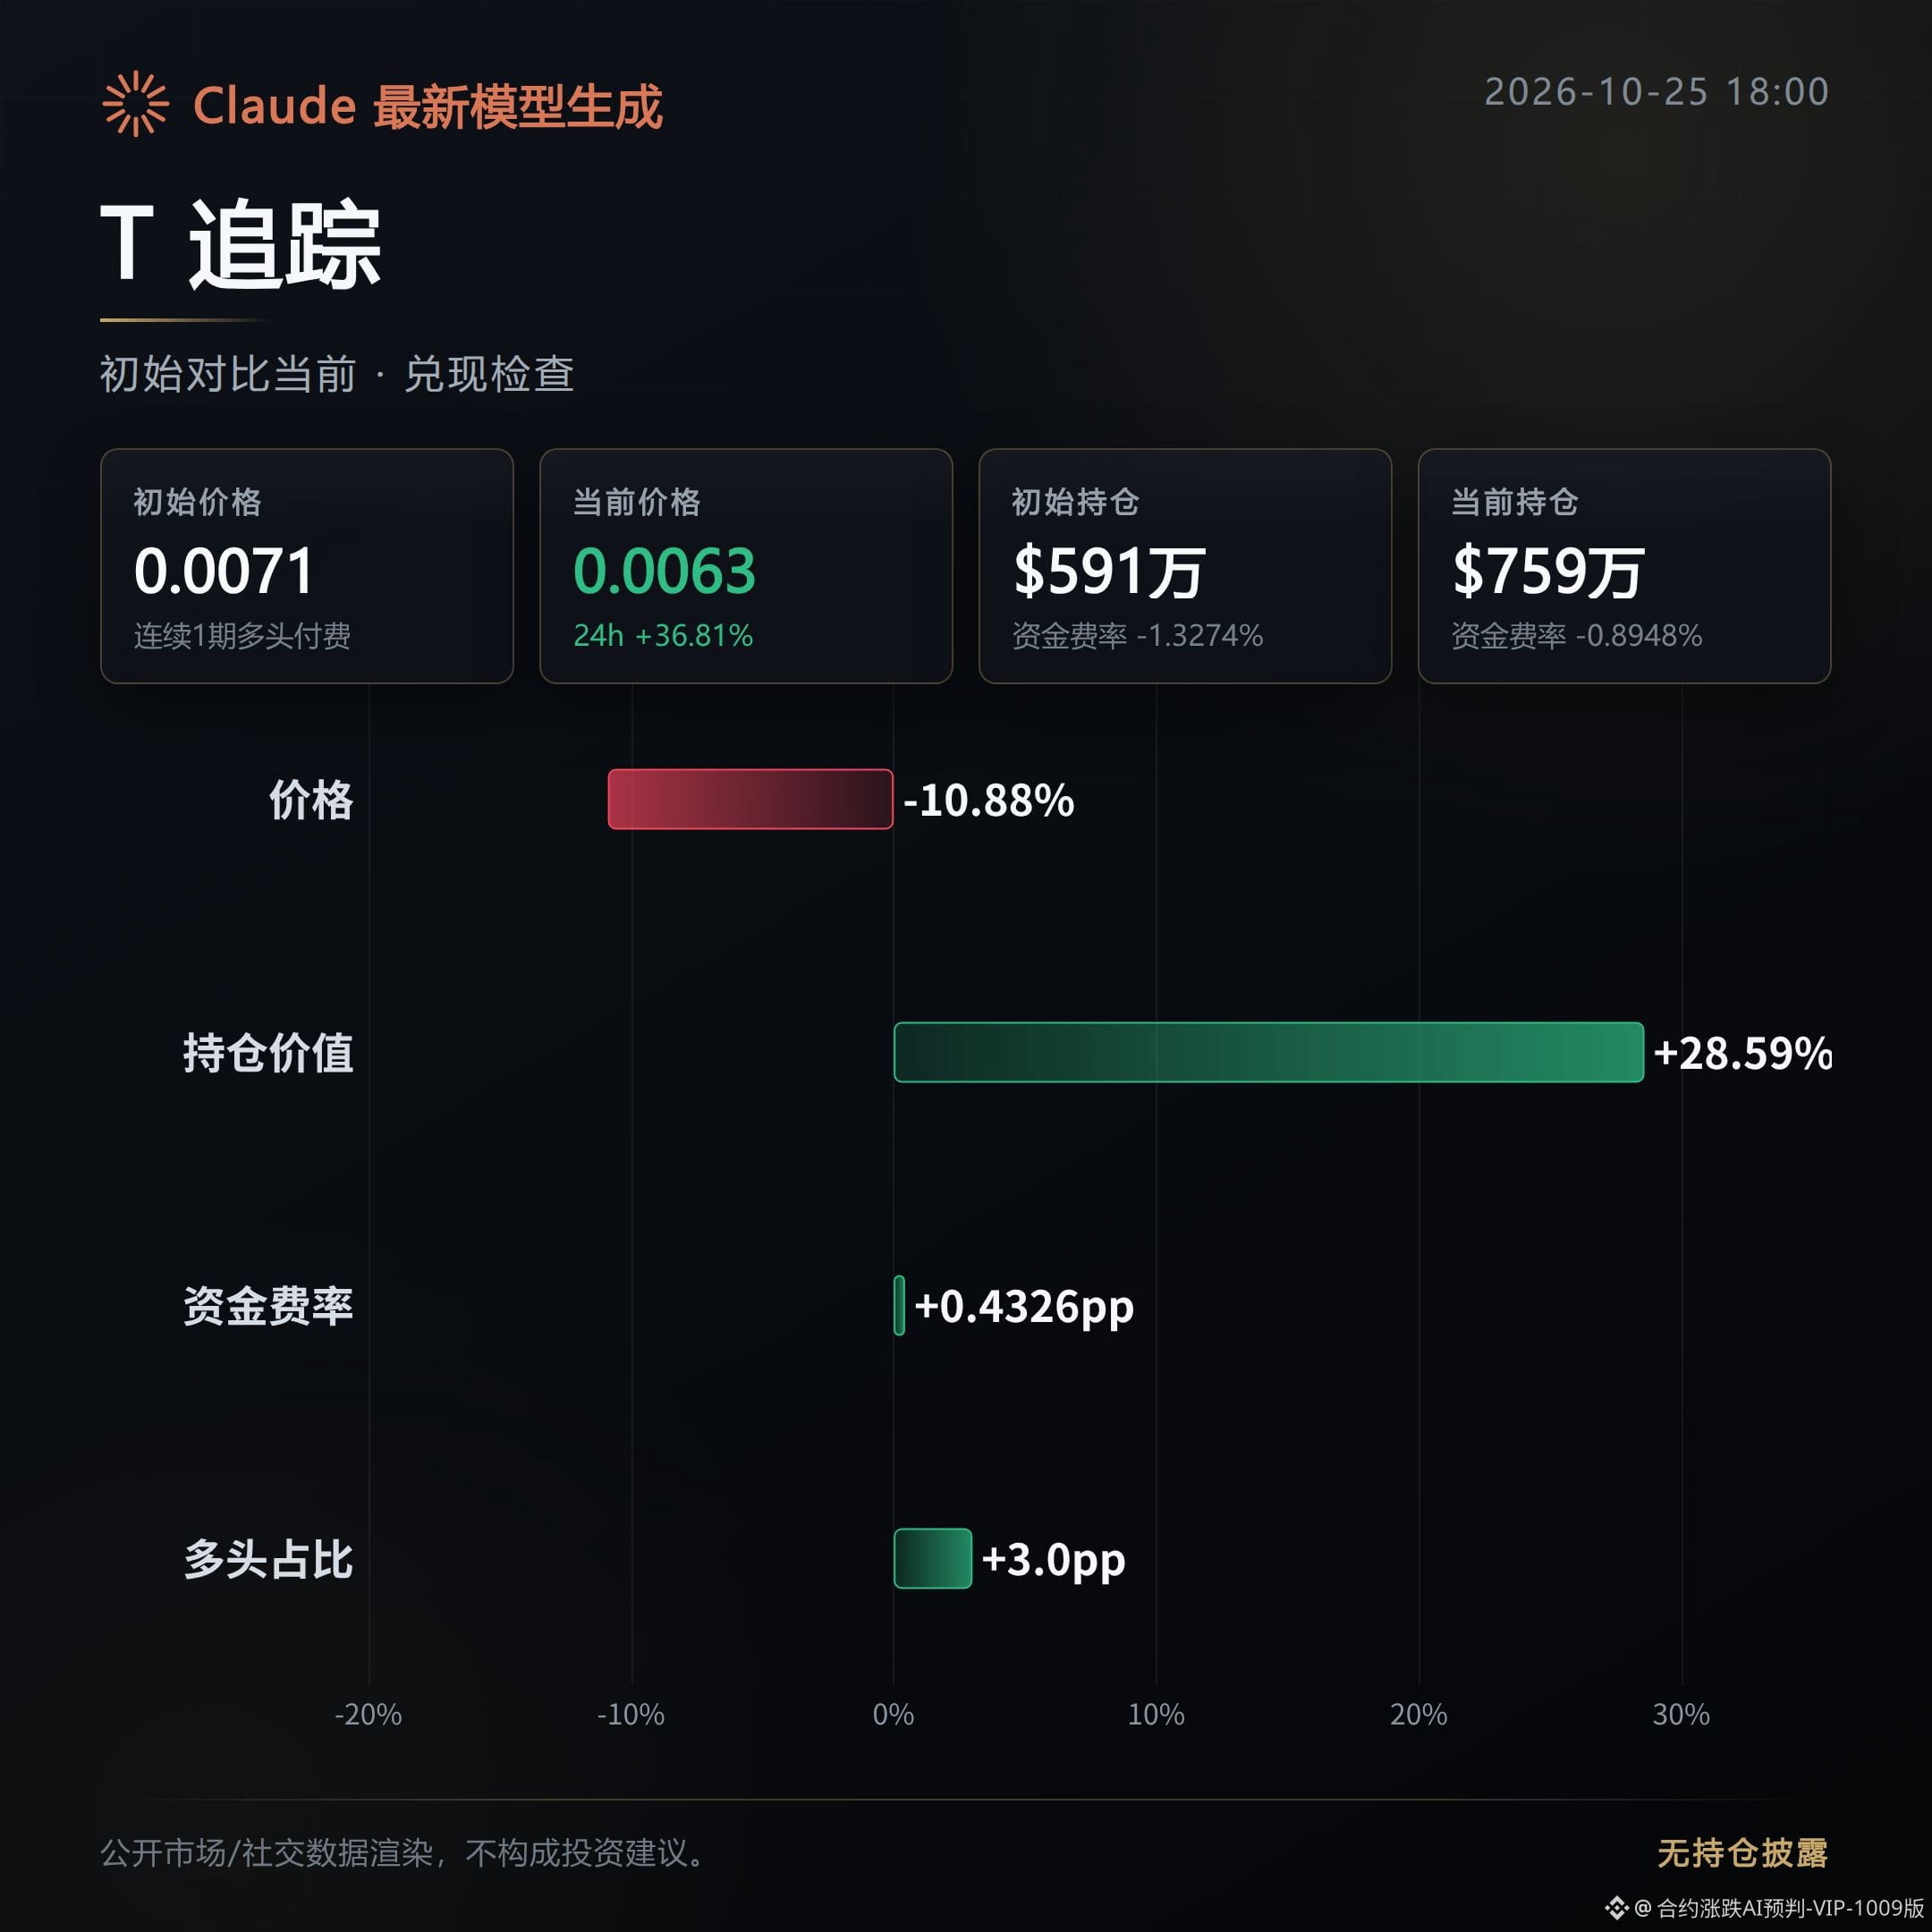
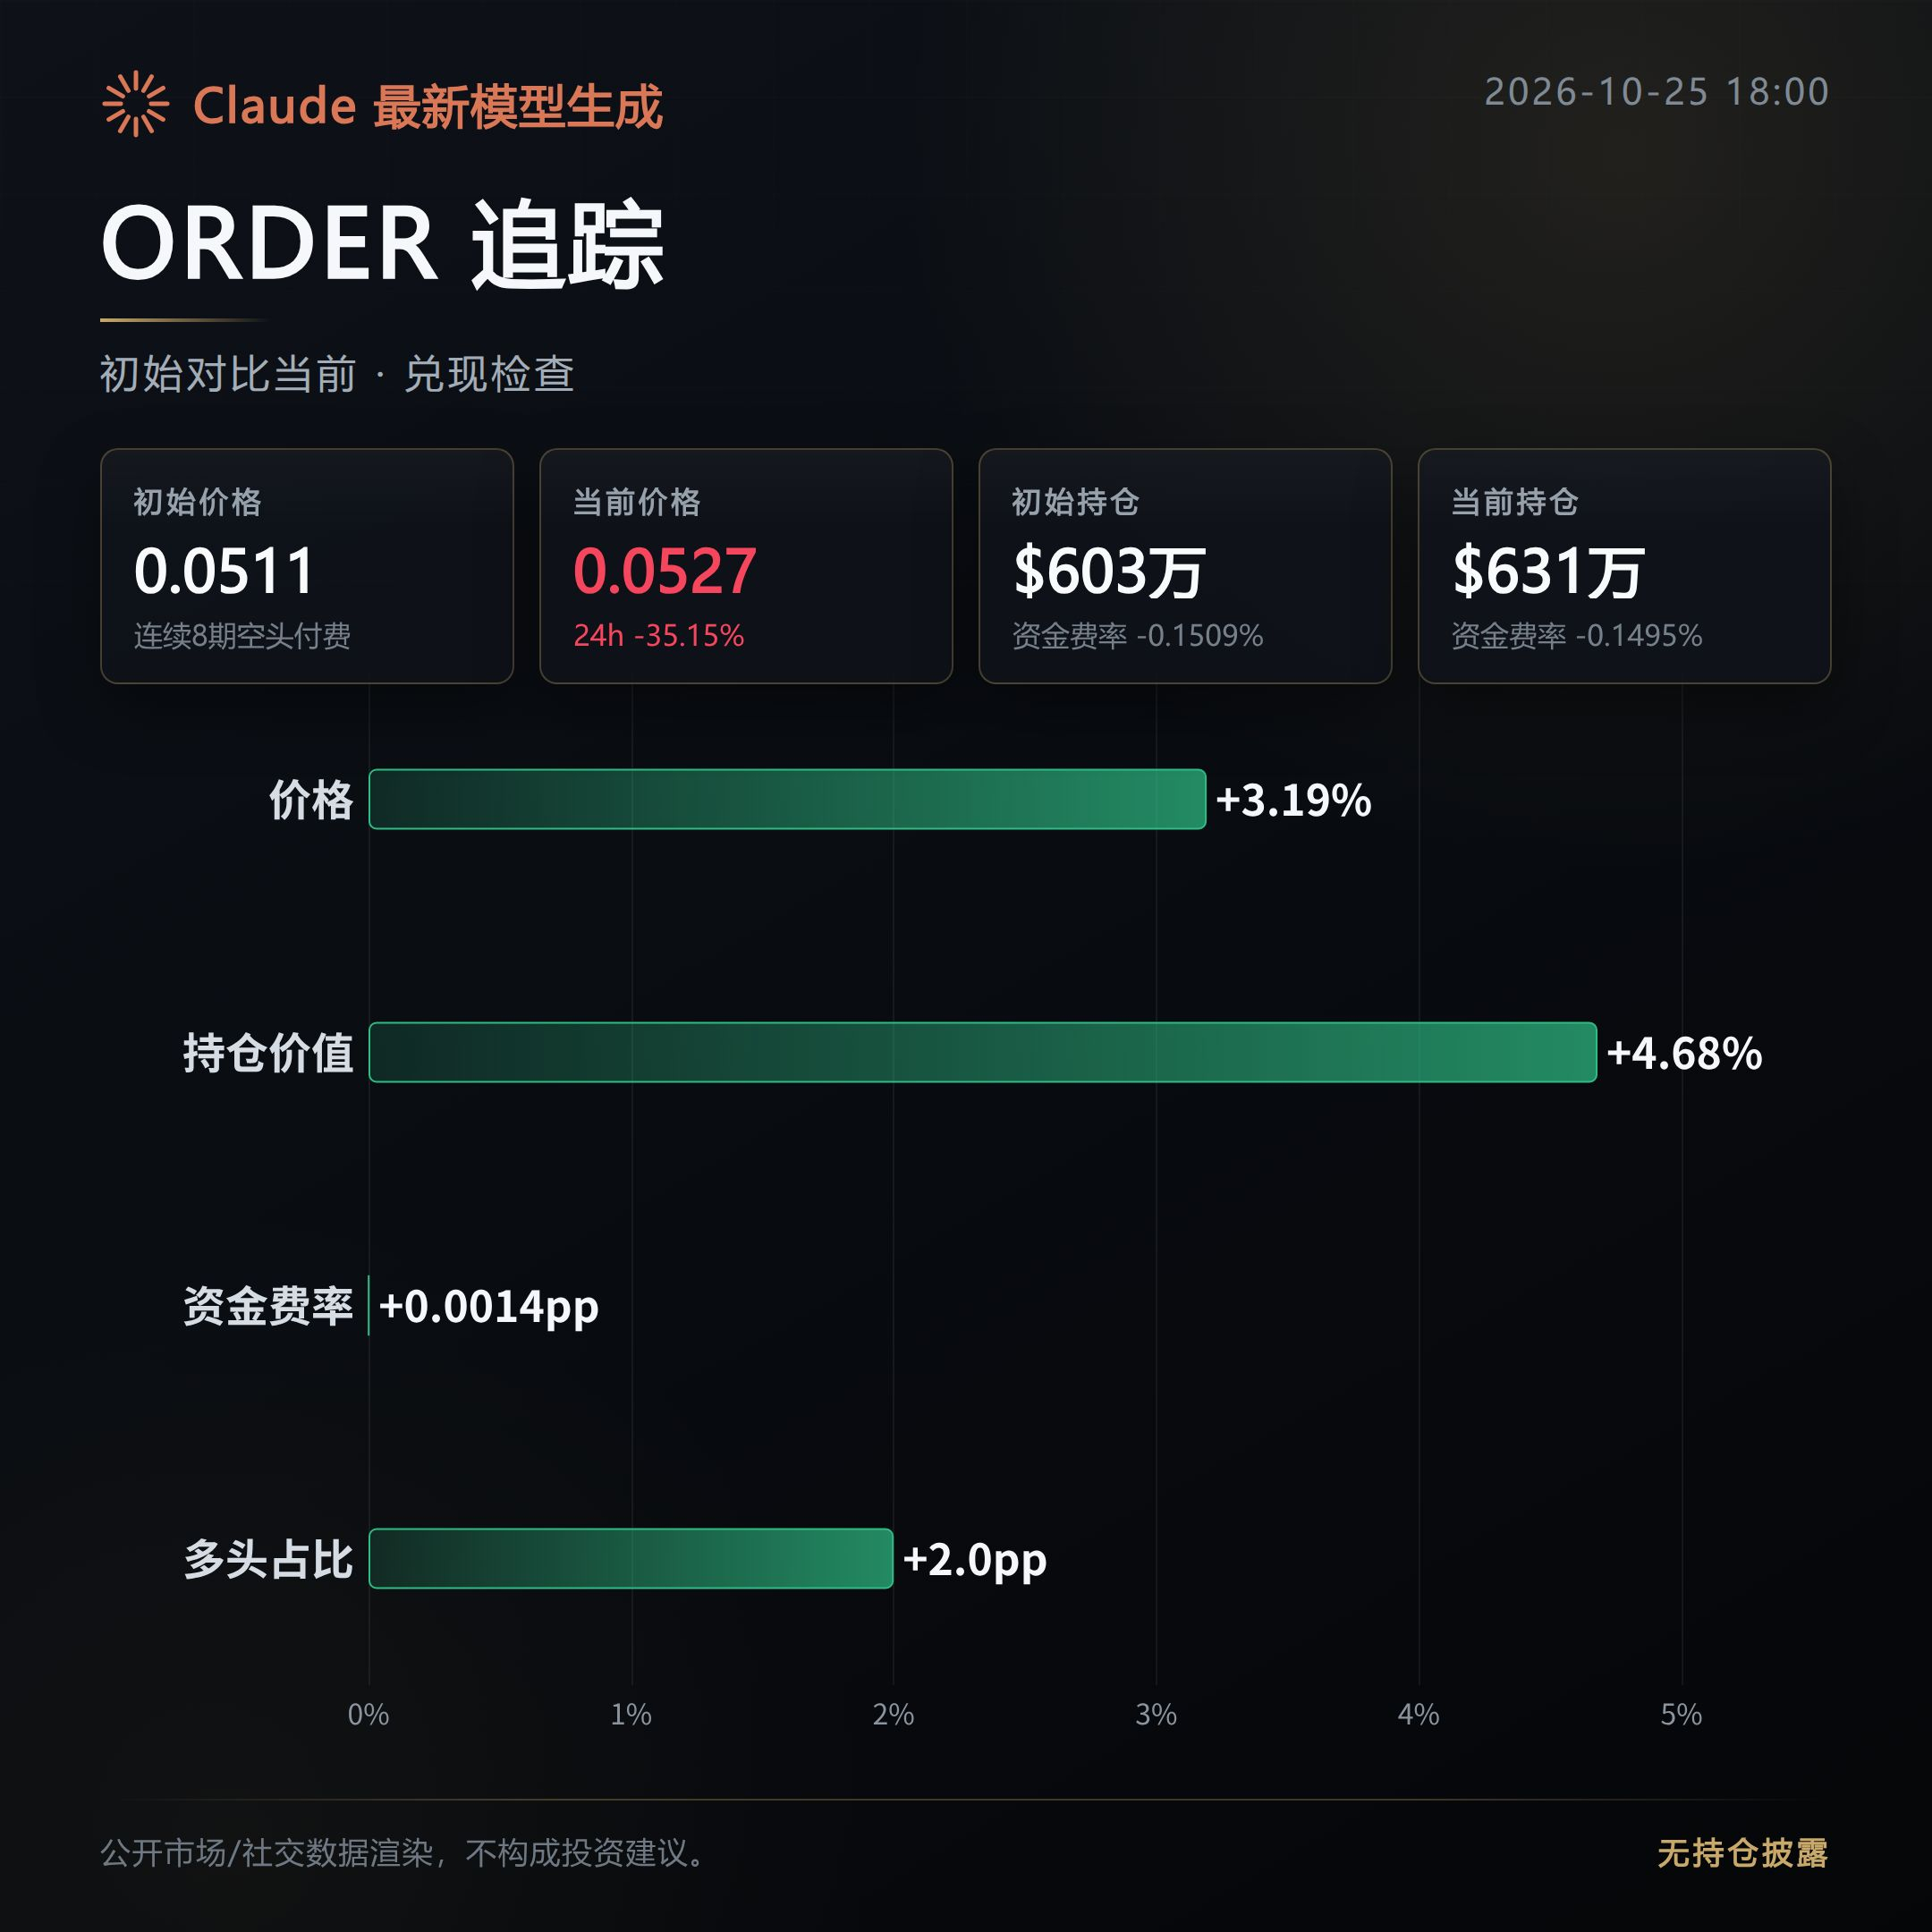
200
About 6 hours ago, all 3 contracts in the morning “High-Level Distribution Watch · Bearish” have now played out. All 3 are weakening, with none still bouncing or consolidating.
Recap of the initial watch: selling pressure is spreading.
BMT: Played out; the morning bearish outlook has materialized.
Since the initial watch, the price has fallen 12.76%, confirming the expected pullback from elevated levels.
Open interest has declined 15.88%, while the taker buy/sell ratio is down 0.03 from the initial reading to 1.02. This suggests positions are being closed, though taker buying has only weakened marginally.
ANIME: Played out; both price and buying support have weakened.
Since the initial watch, the price has fallen 13.64%, giving back a significant portion of the morning gains.
Open interest has declined 20.05%, and taker buying is weaker than at the initial reading. No additional buying support has emerged during the pullback.
LA: Played out; the bearish outlook holds, though the decline has been relatively modest.
Since the initial watch, the price has fallen 4.00%, and the taker buy/sell ratio has dropped to 0.87.
Selling currently dominates, suggesting buying support remains thin. So far, order flow shows no sign of reversing the pullback.
Next, watch whether prices continue to weaken and whether the taker buy/sell ratio remains under pressure.
If taker buying rebounds significantly and price and open interest stabilize together, that would contradict the current bearish thesis and warrant a reassessment.
#合约复盘 #RiskWatch
Contract data compiled with assistance from Claude Fable 5. For informational purposes only; please verify independently.
About 6 hours ago, all 3 contracts in the morning “High-Level Distribution Watch · Bearish” have now played out. All 3 are weakening, with none still bouncing or consolidating.
Recap of the initial watch: selling pressure is spreading.
BMT: Played out; the morning bearish outlook has materialized.
Since the initial watch, the price has fallen 12.76%, confirming the expected pullback from elevated levels.
Open interest has declined 15.88%, while the taker buy/sell ratio is down 0.03 from the initial reading to 1.02. This suggests positions are being closed, though taker buying has only weakened marginally.
ANIME: Played out; both price and buying support have weakened.
Since the initial watch, the price has fallen 13.64%, giving back a significant portion of the morning gains.
Open interest has declined 20.05%, and taker buying is weaker than at the initial reading. No additional buying support has emerged during the pullback.
LA: Played out; the bearish outlook holds, though the decline has been relatively modest.
Since the initial watch, the price has fallen 4.00%, and the taker buy/sell ratio has dropped to 0.87.
Selling currently dominates, suggesting buying support remains thin. So far, order flow shows no sign of reversing the pullback.
Next, watch whether prices continue to weaken and whether the taker buy/sell ratio remains under pressure.
If taker buying rebounds significantly and price and open interest stabilize together, that would contradict the current bearish thesis and warrant a reassessment.
#合约复盘 #RiskWatch
Contract data compiled with assistance from Claude Fable 5. For informational purposes only; please verify independently.
Recap of the initial watch: selling pressure is spreading.
BMT: Played out; the morning bearish outlook has materialized.
Since the initial watch, the price has fallen 12.76%, confirming the expected pullback from elevated levels.
Open interest has declined 15.88%, while the taker buy/sell ratio is down 0.03 from the initial reading to 1.02. This suggests positions are being closed, though taker buying has only weakened marginally.
ANIME: Played out; both price and buying support have weakened.
Since the initial watch, the price has fallen 13.64%, giving back a significant portion of the morning gains.
Open interest has declined 20.05%, and taker buying is weaker than at the initial reading. No additional buying support has emerged during the pullback.
LA: Played out; the bearish outlook holds, though the decline has been relatively modest.
Since the initial watch, the price has fallen 4.00%, and the taker buy/sell ratio has dropped to 0.87.
Selling currently dominates, suggesting buying support remains thin. So far, order flow shows no sign of reversing the pullback.
Next, watch whether prices continue to weaken and whether the taker buy/sell ratio remains under pressure.
If taker buying rebounds significantly and price and open interest stabilize together, that would contradict the current bearish thesis and warrant a reassessment.
#合约复盘 #RiskWatch
Contract data compiled with assistance from Claude Fable 5. For informational purposes only; please verify independently.
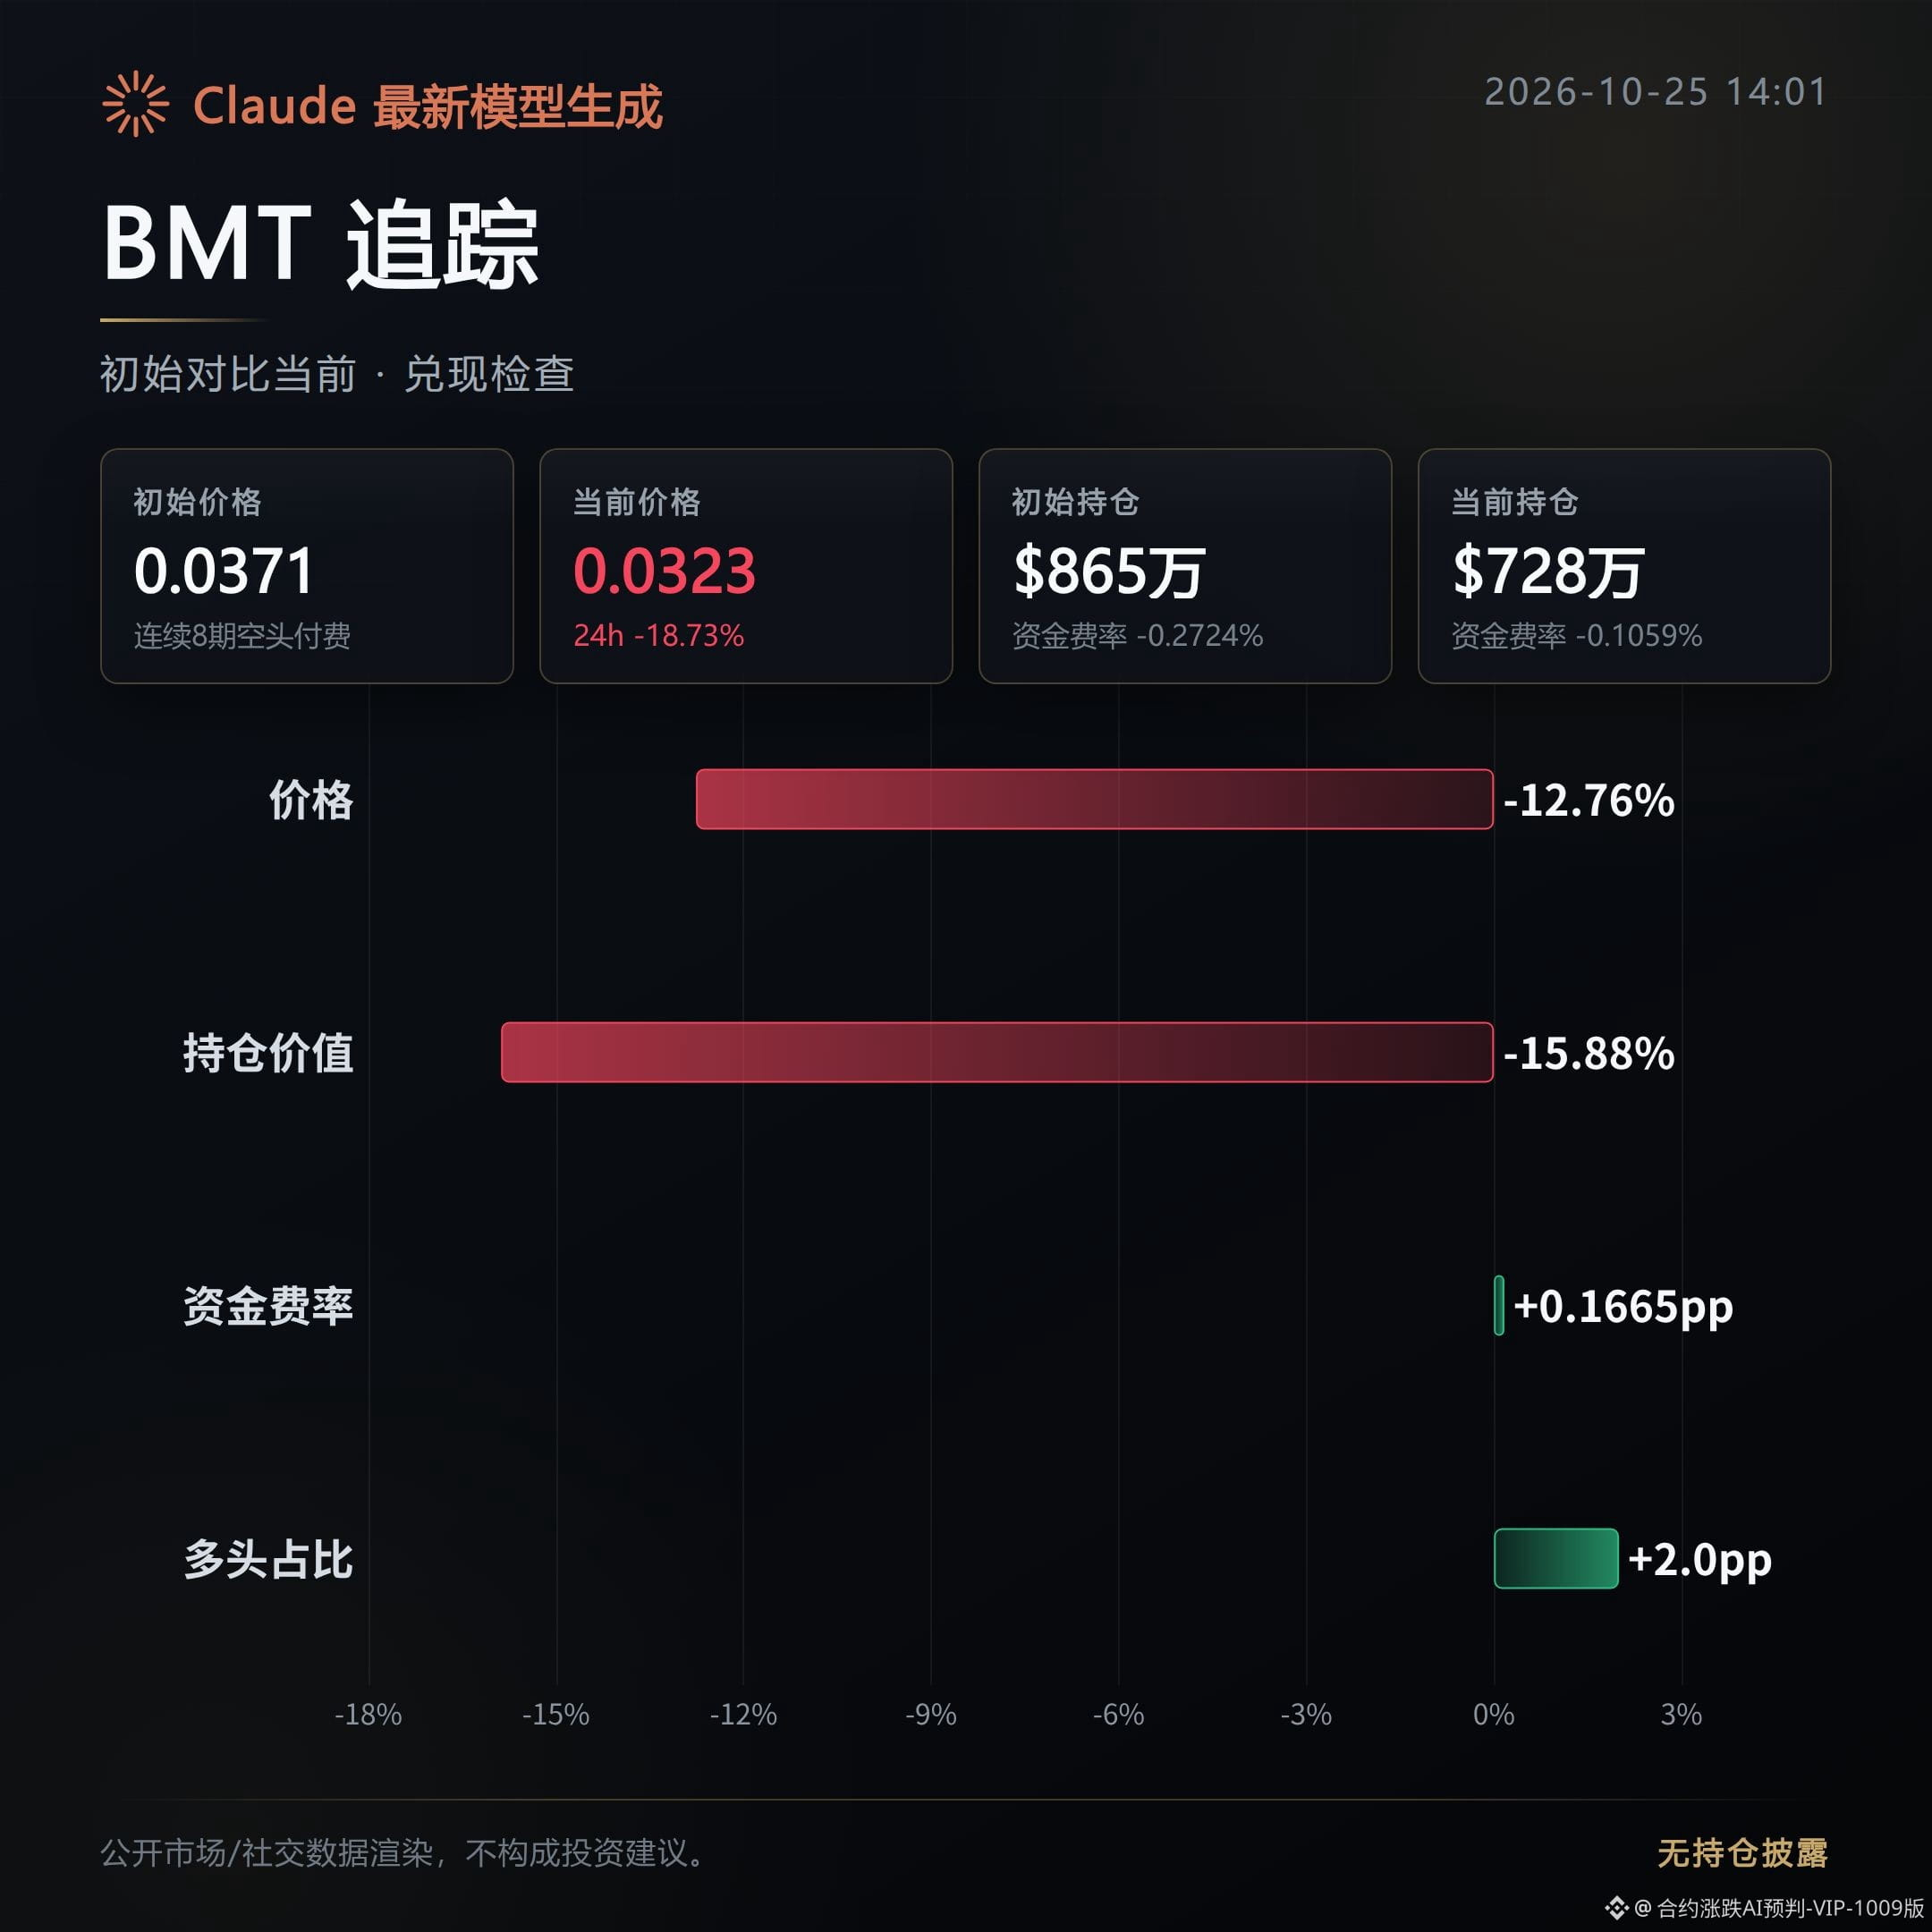
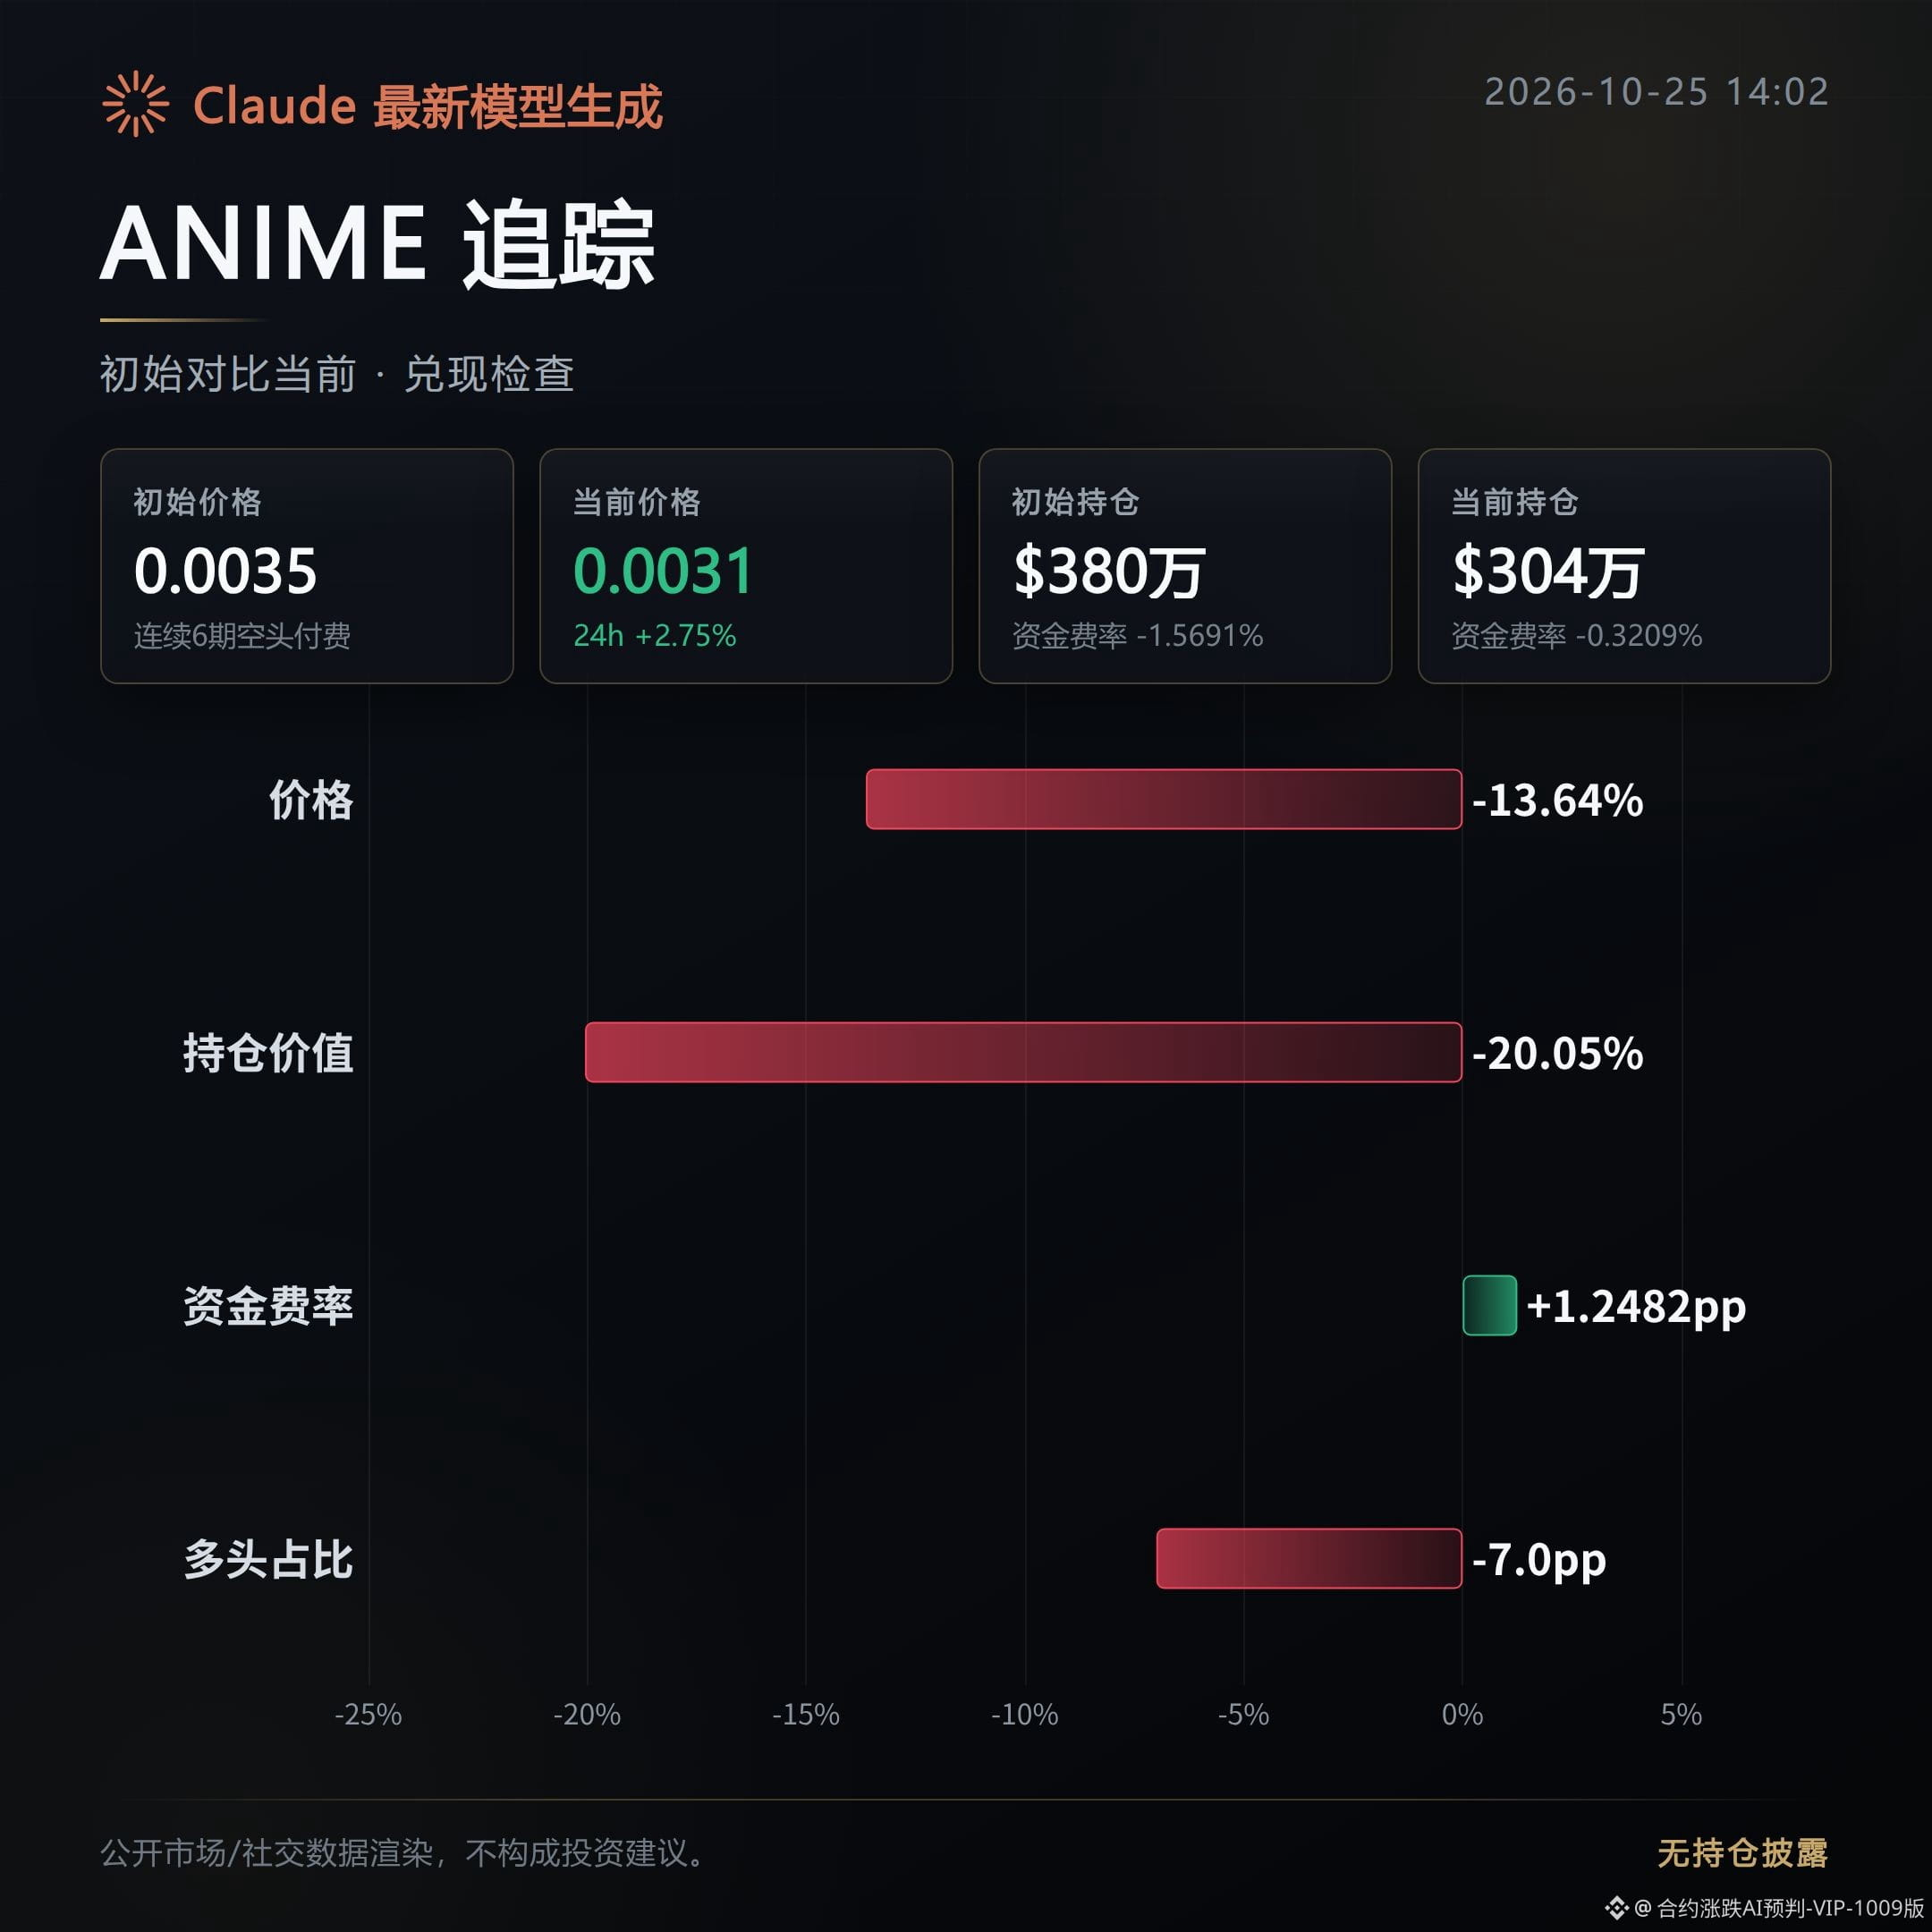
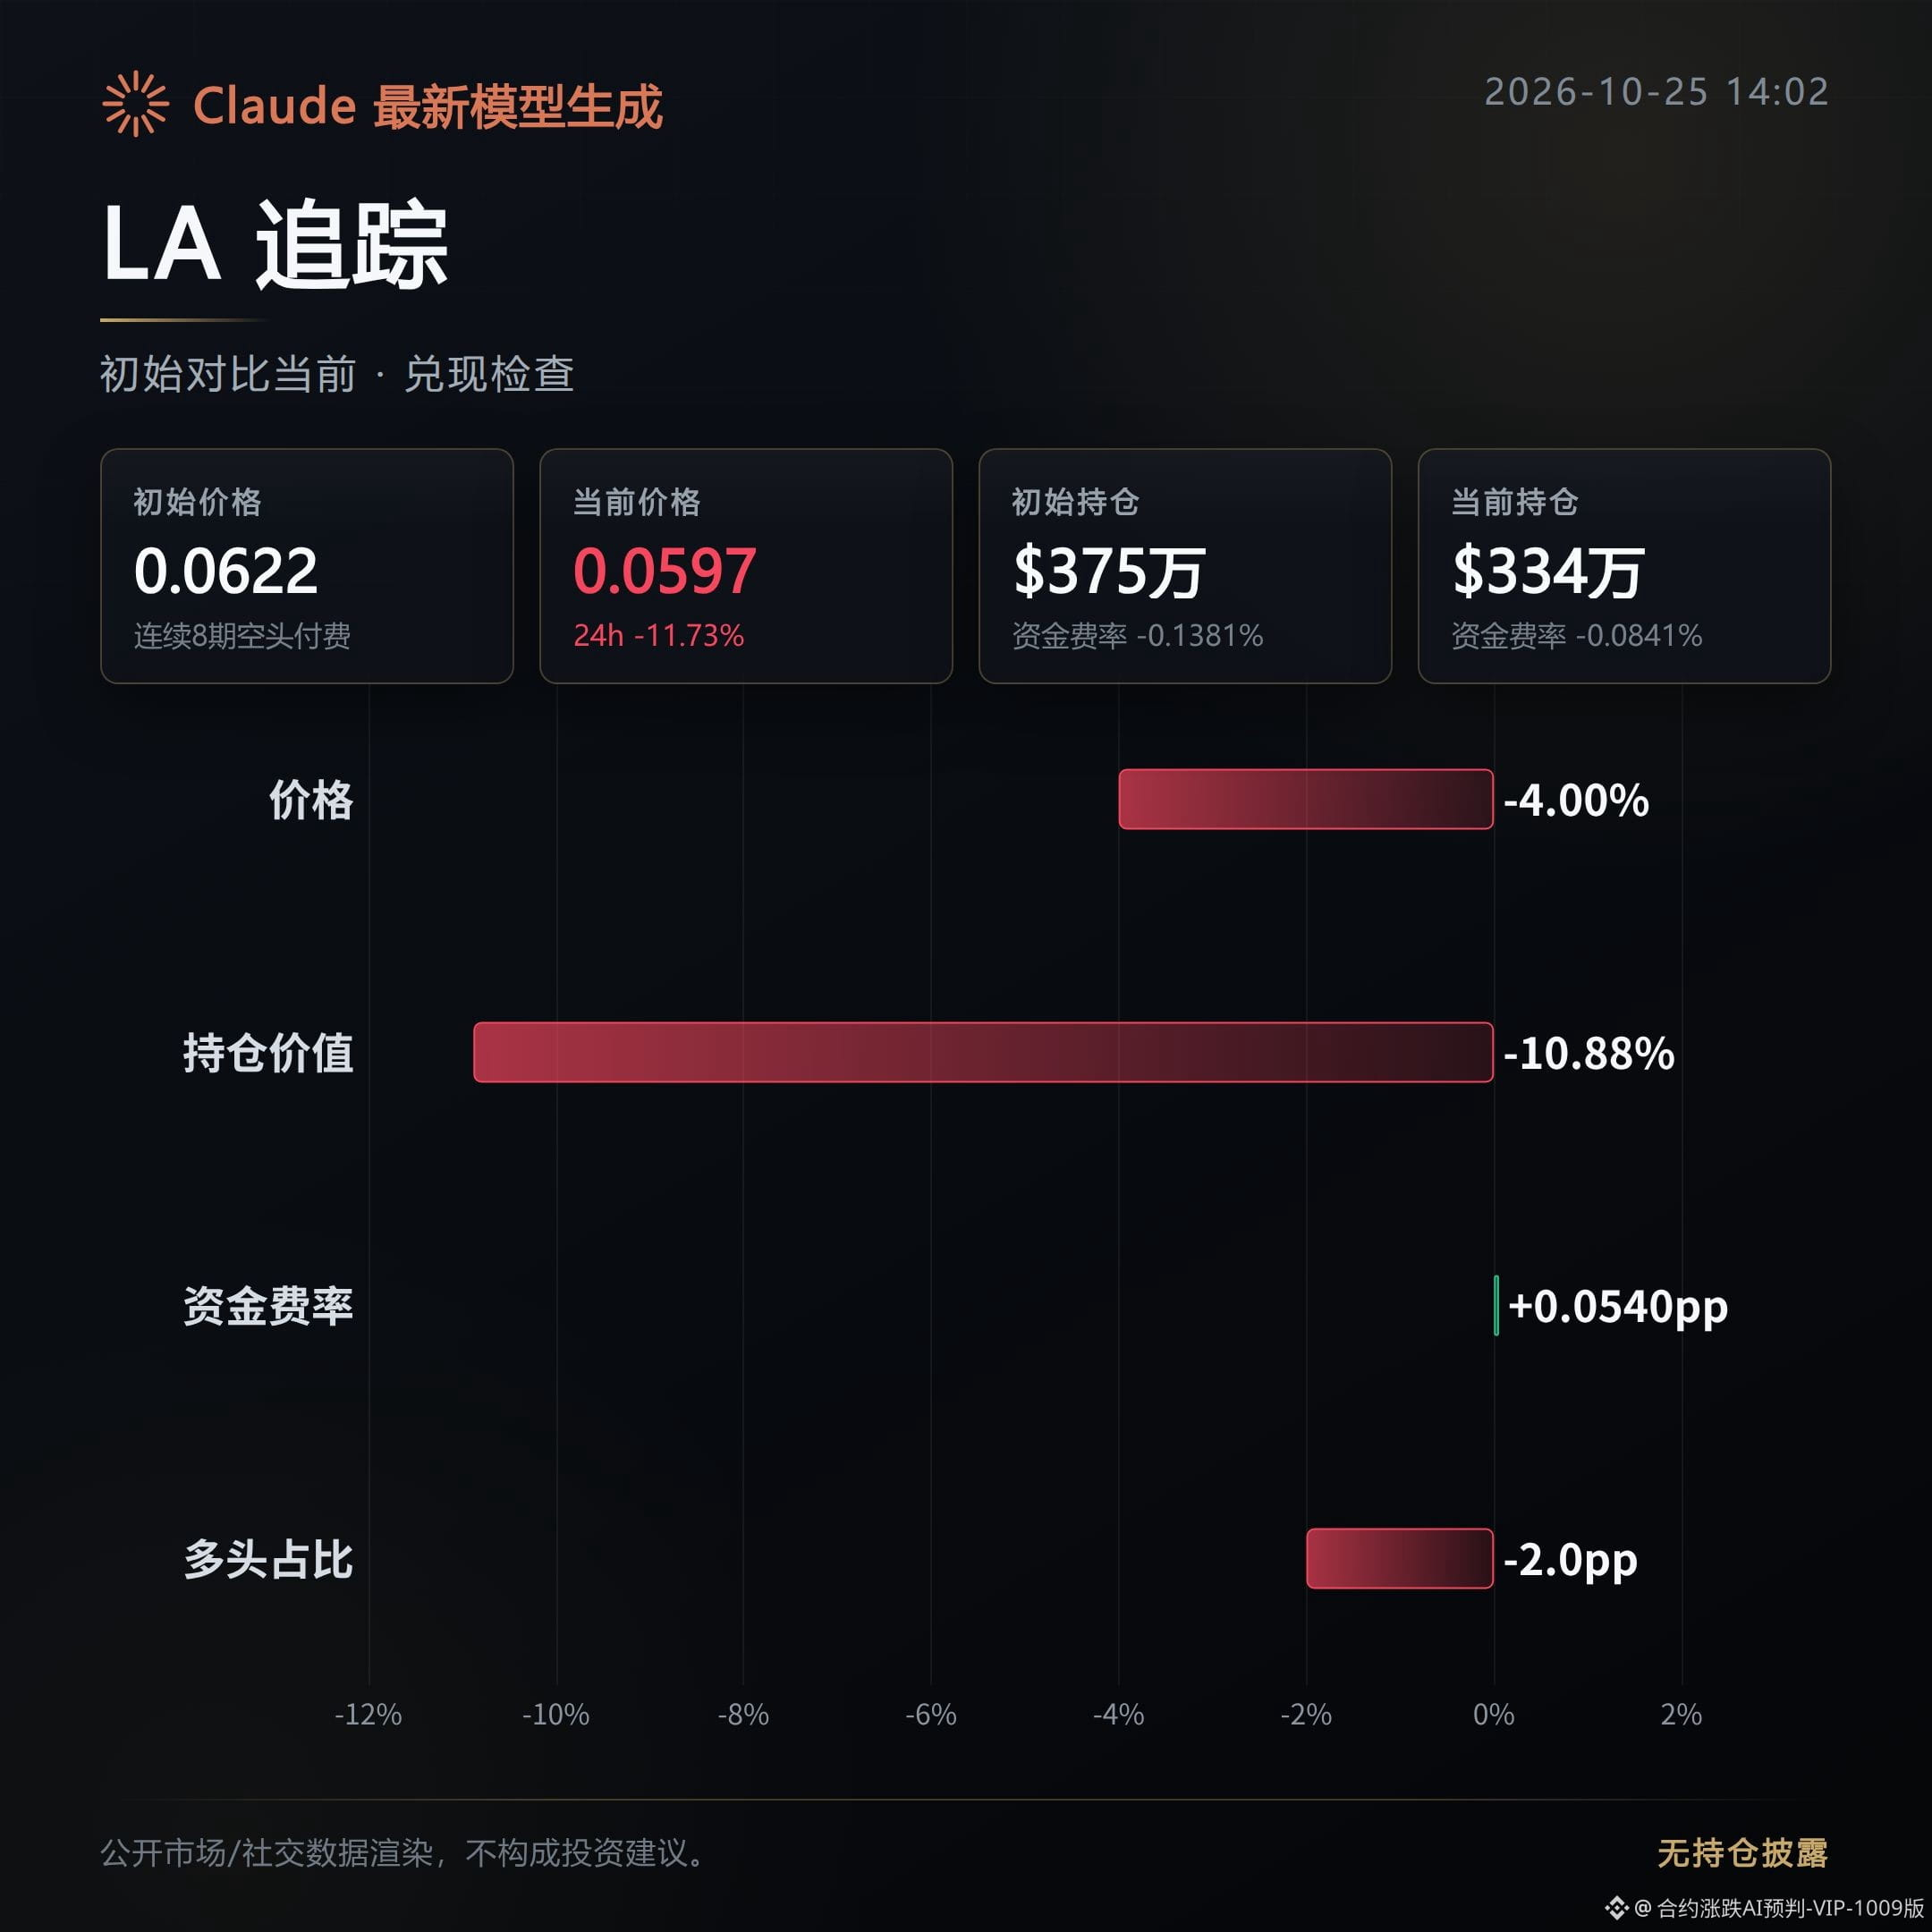
195
Log in to explore more content
Join global crypto users on Binance Square
⚡️ Get latest and useful information about crypto.
💬 Trusted by the world’s largest crypto exchange.
👍 Discover real insights from verified creators.
Email / Phone number