

小恐龙说趋势
406 Posts

小恐龙说趋势
Report
Block User
X:XiaoKongLong_88 , 6 年加密市场经历 , 牛市里见过疯狂,熊市里见过人性
6 Following
2.0K+ Followers
2.3K+ Liked
Posts
All
Live
·
--
73.6% of Bitcoin is back in profit, but big investors were the last to break even 🦖
[📈 进群看今日思路](https://app.binance.com/uni-qr/JpwCPfBj)
Glassnode’s latest reading shows that 73.6% of all Bitcoin in circulation is now in profit, up from just 69.3% a month ago—a jump of 4.3 percentage points
The structure is even more interesting: large entities have only just climbed back above their cost basis, while smaller wallets have been in profit ever since the June low. Back then, the average cost basis for small investors was around $48,000. In other words, the large holders long seen as a market barometer have taken longer to break even this time than retail investors 🐋
The reason is simple: large investors have higher entry costs, with their holdings more concentrated in the highs of the previous cycle. Meanwhile, spot Bitcoin ETF holders are also all back in profit, since many bought shares when their net asset value was below the current price
Here’s another figure to keep in mind: long-term holders control around 80% of Bitcoin’s wealth. That means this 73.6% figure is heavily weighed down by coins that haven’t moved in over a year. The coins that really determine the short-term direction aren’t these dormant ones, but the marginal coins changing hands every day 📈
Glassnode itself offers two reminders. On one hand, when the share of supply in profit rises above 70%, it usually points to a healthy holder structure, and large entities returning to profit could bring in buying pressure. On the other hand, the higher this figure goes, the greater the urge to take profits, which can cap further gains
This isn’t a buy signal; it’s a thermometer. It won’t tell you where the price is headed, only how many people are sitting on profits right now. If the price falls back to their cost basis, selling pressure will first come from the most marginal holders
My take: Bitcoin is currently trading in a range of around $85,000 to $86,000. The key things to watch with this 73.6% figure are whether ETF holders’ unrealized profits turn into redemptions, and whether a break below the cost basis of recent buyers triggers a cascade of profit-taking. Data is static; people are dynamic
Do you think this 73.6% reflects healthy turnover, or is it the last leap before a market reversal? Share your thoughts in the comments—and are your holdings still above water?
Every day, I bring you the latest on Bitcoin on-chain data—not just what’s happening in the news, but the logic and opportunities behind it 👀🚀
73.6% of Bitcoin is back in profit, but big investors were the last to break even 🦖
📈 进群看今日思路
Glassnode’s latest reading shows that 73.6% of all Bitcoin in circulation is now in profit, up from just 69.3% a month ago—a jump of 4.3 percentage points
The structure is even more interesting: large entities have only just climbed back above their cost basis, while smaller wallets have been in profit ever since the June low. Back then, the average cost basis for small investors was around $48,000. In other words, the large holders long seen as a market barometer have taken longer to break even this time than retail investors 🐋
The reason is simple: large investors have higher entry costs, with their holdings more concentrated in the highs of the previous cycle. Meanwhile, spot Bitcoin ETF holders are also all back in profit, since many bought shares when their net asset value was below the current price
Here’s another figure to keep in mind: long-term holders control around 80% of Bitcoin’s wealth. That means this 73.6% figure is heavily weighed down by coins that haven’t moved in over a year. The coins that really determine the short-term direction aren’t these dormant ones, but the marginal coins changing hands every day 📈
Glassnode itself offers two reminders. On one hand, when the share of supply in profit rises above 70%, it usually points to a healthy holder structure, and large entities returning to profit could bring in buying pressure. On the other hand, the higher this figure goes, the greater the urge to take profits, which can cap further gains
This isn’t a buy signal; it’s a thermometer. It won’t tell you where the price is headed, only how many people are sitting on profits right now. If the price falls back to their cost basis, selling pressure will first come from the most marginal holders
My take: Bitcoin is currently trading in a range of around $85,000 to $86,000. The key things to watch with this 73.6% figure are whether ETF holders’ unrealized profits turn into redemptions, and whether a break below the cost basis of recent buyers triggers a cascade of profit-taking. Data is static; people are dynamic
Do you think this 73.6% reflects healthy turnover, or is it the last leap before a market reversal? Share your thoughts in the comments—and are your holdings still above water?
Every day, I bring you the latest on Bitcoin on-chain data—not just what’s happening in the news, but the logic and opportunities behind it 👀🚀
📈 进群看今日思路
Glassnode’s latest reading shows that 73.6% of all Bitcoin in circulation is now in profit, up from just 69.3% a month ago—a jump of 4.3 percentage points
The structure is even more interesting: large entities have only just climbed back above their cost basis, while smaller wallets have been in profit ever since the June low. Back then, the average cost basis for small investors was around $48,000. In other words, the large holders long seen as a market barometer have taken longer to break even this time than retail investors 🐋
The reason is simple: large investors have higher entry costs, with their holdings more concentrated in the highs of the previous cycle. Meanwhile, spot Bitcoin ETF holders are also all back in profit, since many bought shares when their net asset value was below the current price
Here’s another figure to keep in mind: long-term holders control around 80% of Bitcoin’s wealth. That means this 73.6% figure is heavily weighed down by coins that haven’t moved in over a year. The coins that really determine the short-term direction aren’t these dormant ones, but the marginal coins changing hands every day 📈
Glassnode itself offers two reminders. On one hand, when the share of supply in profit rises above 70%, it usually points to a healthy holder structure, and large entities returning to profit could bring in buying pressure. On the other hand, the higher this figure goes, the greater the urge to take profits, which can cap further gains
This isn’t a buy signal; it’s a thermometer. It won’t tell you where the price is headed, only how many people are sitting on profits right now. If the price falls back to their cost basis, selling pressure will first come from the most marginal holders
My take: Bitcoin is currently trading in a range of around $85,000 to $86,000. The key things to watch with this 73.6% figure are whether ETF holders’ unrealized profits turn into redemptions, and whether a break below the cost basis of recent buyers triggers a cascade of profit-taking. Data is static; people are dynamic
Do you think this 73.6% reflects healthy turnover, or is it the last leap before a market reversal? Share your thoughts in the comments—and are your holdings still above water?
Every day, I bring you the latest on Bitcoin on-chain data—not just what’s happening in the news, but the logic and opportunities behind it 👀🚀

1
86
·
--
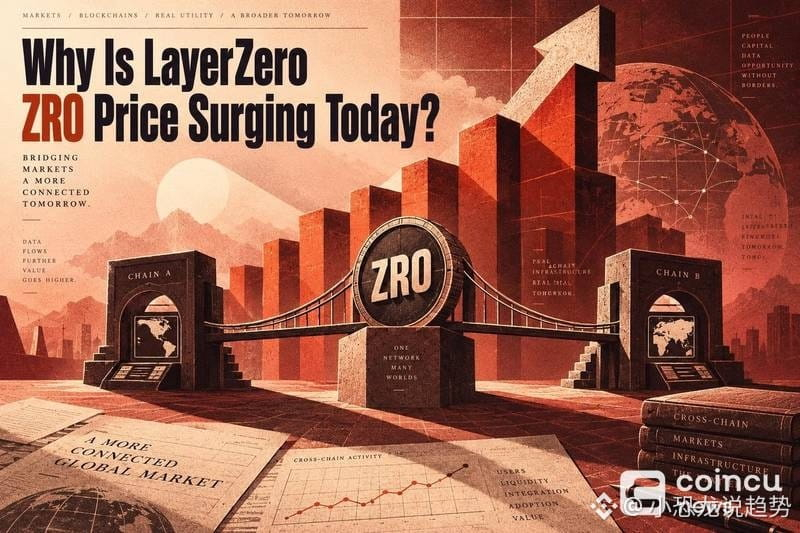
ZRO is up 10.55% in a day, yet tokens have been moving to exchanges for 8 straight days 🦖
[⚡ 有大动静群里说](https://app.binance.com/uni-qr/JpwCPfBj)
On October 6, ZRO, the token of cross-chain protocol LayerZero, climbed to $2.12, up 10.55% in 24 hours. But the same on-chain data shows net flows heading to exchanges for eight consecutive trading days. The largest single-day net deposit was on October 2, when deposits exceeded withdrawals by 4.64 million tokens—the biggest daily net inflow in the past nine days ⚠️
Even more striking is the trading volume. Reported 24-hour volume across the market was $170 million, but an on-chain wash-trading detection engine flagged 83% of it as artificially inflated. That leaves just $57.33 million in genuine trading volume—less than a third of the total. Behind it were 705 wallets engaged in zero-net-volume loops, trading back and forth 🐋
In other words, this rally isn’t happening because the supply of tokens available is shrinking. Tokens are flowing to exchanges as the price is pushed up—while holders distribute 📈
Today’s early-session data makes the situation even clearer: 102,316 tokens were deposited and 19,327 withdrawn, for a net inflow of 82,988. The direction hasn’t changed. September 29 was the only day in this period with net outflows, at 140,166 tokens, but that was quickly overwhelmed by the wave of deposits in October.
One group of wallets is worth watching separately. Five wallets flagged as accumulating collectively hold 0.63% of the supply, but their funds all lead to exchange hot and cold wallets. The largest holds 5.43 million tokens, or 0.57% of the supply. It has been active for five days, with six incoming transfers and no outgoing transfers. Its destination is an exchange hot wallet holding 21.12 million tokens, or 2.22% of the supply. This pattern looks more like distribution in stages than strategic accumulation.
Based on the data, there’s no clear official catalyst for this rally: no announcement, no upgrade. The project’s contracts appear clean, too. A security firm’s assessment found no minting function, honeypot behavior, or pause switch—removing one category of risk.
My take: when the price is rising while tokens are flowing onto exchanges, the biggest risk is mistaking fake volume for genuine buying. The two things that really matter are, first, when exchange net inflows turn into sustained net outflows—that would indicate buyers are stepping in—and second, whether genuine trading volume can rise significantly without total volume falling. If neither signal appears, this move looks more like a rebound than a reversal.
Let’s discuss in the comments: do you trust the price more, or the on-chain data?
Follow me for daily crypto trends—not just what’s in the news, but the logic and opportunities behind it 👀🚀
ZRO is up 10.55% in a day, yet tokens have been moving to exchanges for 8 straight days 🦖
⚡ 有大动静群里说
On October 6, ZRO, the token of cross-chain protocol LayerZero, climbed to $2.12, up 10.55% in 24 hours. But the same on-chain data shows net flows heading to exchanges for eight consecutive trading days. The largest single-day net deposit was on October 2, when deposits exceeded withdrawals by 4.64 million tokens—the biggest daily net inflow in the past nine days ⚠️
Even more striking is the trading volume. Reported 24-hour volume across the market was $170 million, but an on-chain wash-trading detection engine flagged 83% of it as artificially inflated. That leaves just $57.33 million in genuine trading volume—less than a third of the total. Behind it were 705 wallets engaged in zero-net-volume loops, trading back and forth 🐋
In other words, this rally isn’t happening because the supply of tokens available is shrinking. Tokens are flowing to exchanges as the price is pushed up—while holders distribute 📈
Today’s early-session data makes the situation even clearer: 102,316 tokens were deposited and 19,327 withdrawn, for a net inflow of 82,988. The direction hasn’t changed. September 29 was the only day in this period with net outflows, at 140,166 tokens, but that was quickly overwhelmed by the wave of deposits in October.
One group of wallets is worth watching separately. Five wallets flagged as accumulating collectively hold 0.63% of the supply, but their funds all lead to exchange hot and cold wallets. The largest holds 5.43 million tokens, or 0.57% of the supply. It has been active for five days, with six incoming transfers and no outgoing transfers. Its destination is an exchange hot wallet holding 21.12 million tokens, or 2.22% of the supply. This pattern looks more like distribution in stages than strategic accumulation.
Based on the data, there’s no clear official catalyst for this rally: no announcement, no upgrade. The project’s contracts appear clean, too. A security firm’s assessment found no minting function, honeypot behavior, or pause switch—removing one category of risk.
My take: when the price is rising while tokens are flowing onto exchanges, the biggest risk is mistaking fake volume for genuine buying. The two things that really matter are, first, when exchange net inflows turn into sustained net outflows—that would indicate buyers are stepping in—and second, whether genuine trading volume can rise significantly without total volume falling. If neither signal appears, this move looks more like a rebound than a reversal.
Let’s discuss in the comments: do you trust the price more, or the on-chain data?
Follow me for daily crypto trends—not just what’s in the news, but the logic and opportunities behind it 👀🚀
⚡ 有大动静群里说
On October 6, ZRO, the token of cross-chain protocol LayerZero, climbed to $2.12, up 10.55% in 24 hours. But the same on-chain data shows net flows heading to exchanges for eight consecutive trading days. The largest single-day net deposit was on October 2, when deposits exceeded withdrawals by 4.64 million tokens—the biggest daily net inflow in the past nine days ⚠️
Even more striking is the trading volume. Reported 24-hour volume across the market was $170 million, but an on-chain wash-trading detection engine flagged 83% of it as artificially inflated. That leaves just $57.33 million in genuine trading volume—less than a third of the total. Behind it were 705 wallets engaged in zero-net-volume loops, trading back and forth 🐋
In other words, this rally isn’t happening because the supply of tokens available is shrinking. Tokens are flowing to exchanges as the price is pushed up—while holders distribute 📈
Today’s early-session data makes the situation even clearer: 102,316 tokens were deposited and 19,327 withdrawn, for a net inflow of 82,988. The direction hasn’t changed. September 29 was the only day in this period with net outflows, at 140,166 tokens, but that was quickly overwhelmed by the wave of deposits in October.
One group of wallets is worth watching separately. Five wallets flagged as accumulating collectively hold 0.63% of the supply, but their funds all lead to exchange hot and cold wallets. The largest holds 5.43 million tokens, or 0.57% of the supply. It has been active for five days, with six incoming transfers and no outgoing transfers. Its destination is an exchange hot wallet holding 21.12 million tokens, or 2.22% of the supply. This pattern looks more like distribution in stages than strategic accumulation.
Based on the data, there’s no clear official catalyst for this rally: no announcement, no upgrade. The project’s contracts appear clean, too. A security firm’s assessment found no minting function, honeypot behavior, or pause switch—removing one category of risk.
My take: when the price is rising while tokens are flowing onto exchanges, the biggest risk is mistaking fake volume for genuine buying. The two things that really matter are, first, when exchange net inflows turn into sustained net outflows—that would indicate buyers are stepping in—and second, whether genuine trading volume can rise significantly without total volume falling. If neither signal appears, this move looks more like a rebound than a reversal.
Let’s discuss in the comments: do you trust the price more, or the on-chain data?
Follow me for daily crypto trends—not just what’s in the news, but the logic and opportunities behind it 👀🚀
132
·
--
A money-laundering network handling over $1 billion: A fake customer spent just $350,000 to expose the underground bank serving North Korean hackers 🦖
[🕐 最新解读群里更新](https://app.binance.com/uni-qr/JpwCPfBj)
On October 5, on-chain investigator ZachXBT revealed that he had posed as a paying customer to infiltrate a Chinese criminal network laundering money for North Korea’s Lazarus Group. The network had handled more than $1 billion in funds, and he made his move just days after $1.5 billion was stolen from Bybit.
To gain the network’s trust, he started by putting up $349,700 in stablecoins. He deliberately took a 5% loss on each transaction as a protection fee. His contact went by the alias Jimmy Green, and the operation spanned Hong Kong and mainland China.
The intelligence he obtained undercover helped him identify a cluster of addresses holding more than $12 million and directly linked to the stolen Bybit funds. Tether subsequently froze $442,000 in USDT from the cluster 🔍
Why is this worth a closer look? Because North Korea’s stolen crypto doesn’t simply vanish. It is laundered layer by layer through a well-established underground pipeline. Chainalysis estimates that North Korea-linked hackers had stolen at least $6.75 billion cumulatively by 2025—and behind every major heist stands the same group of intermediaries.
This is not an isolated case. In 2020, U.S. prosecutors charged two Chinese nationals with laundering more than $100 million for North Korean hackers. In 2023, OFAC sanctioned two traders—one in Hong Kong and one in mainland China. Then, in September this year, after $387.5 million was stolen from Bitget, and in April, after $292 million was stolen from Kelp DAO, ZachXBT traced the leads back to the same group of intermediaries ⚖️
Put simply, the real takeaway for ordinary crypto holders is that whether stablecoin issuers are willing to cooperate with freezes is becoming the dividing line between whether stolen funds can be recovered or not. Law enforcement is increasingly relying on on-chain investigators in the private sector to provide firsthand leads. This time, even the cost of going undercover was made public: $350,000 to uncover a pipeline handling $1 billion ⚠️
Do you think this kind of undercover investigation by independent investigators will become standard practice for recovering stolen funds? Share your thoughts in the comments.
Every day, we bring you the latest in crypto—not just what’s happening, but also the logic and opportunities behind the headlines 👀🚀
A money-laundering network handling over $1 billion: A fake customer spent just $350,000 to expose the underground bank serving North Korean hackers 🦖
🕐 最新解读群里更新
On October 5, on-chain investigator ZachXBT revealed that he had posed as a paying customer to infiltrate a Chinese criminal network laundering money for North Korea’s Lazarus Group. The network had handled more than $1 billion in funds, and he made his move just days after $1.5 billion was stolen from Bybit.
To gain the network’s trust, he started by putting up $349,700 in stablecoins. He deliberately took a 5% loss on each transaction as a protection fee. His contact went by the alias Jimmy Green, and the operation spanned Hong Kong and mainland China.
The intelligence he obtained undercover helped him identify a cluster of addresses holding more than $12 million and directly linked to the stolen Bybit funds. Tether subsequently froze $442,000 in USDT from the cluster 🔍
Why is this worth a closer look? Because North Korea’s stolen crypto doesn’t simply vanish. It is laundered layer by layer through a well-established underground pipeline. Chainalysis estimates that North Korea-linked hackers had stolen at least $6.75 billion cumulatively by 2025—and behind every major heist stands the same group of intermediaries.
This is not an isolated case. In 2020, U.S. prosecutors charged two Chinese nationals with laundering more than $100 million for North Korean hackers. In 2023, OFAC sanctioned two traders—one in Hong Kong and one in mainland China. Then, in September this year, after $387.5 million was stolen from Bitget, and in April, after $292 million was stolen from Kelp DAO, ZachXBT traced the leads back to the same group of intermediaries ⚖️
Put simply, the real takeaway for ordinary crypto holders is that whether stablecoin issuers are willing to cooperate with freezes is becoming the dividing line between whether stolen funds can be recovered or not. Law enforcement is increasingly relying on on-chain investigators in the private sector to provide firsthand leads. This time, even the cost of going undercover was made public: $350,000 to uncover a pipeline handling $1 billion ⚠️
Do you think this kind of undercover investigation by independent investigators will become standard practice for recovering stolen funds? Share your thoughts in the comments.
Every day, we bring you the latest in crypto—not just what’s happening, but also the logic and opportunities behind the headlines 👀🚀
🕐 最新解读群里更新
On October 5, on-chain investigator ZachXBT revealed that he had posed as a paying customer to infiltrate a Chinese criminal network laundering money for North Korea’s Lazarus Group. The network had handled more than $1 billion in funds, and he made his move just days after $1.5 billion was stolen from Bybit.
To gain the network’s trust, he started by putting up $349,700 in stablecoins. He deliberately took a 5% loss on each transaction as a protection fee. His contact went by the alias Jimmy Green, and the operation spanned Hong Kong and mainland China.
The intelligence he obtained undercover helped him identify a cluster of addresses holding more than $12 million and directly linked to the stolen Bybit funds. Tether subsequently froze $442,000 in USDT from the cluster 🔍
Why is this worth a closer look? Because North Korea’s stolen crypto doesn’t simply vanish. It is laundered layer by layer through a well-established underground pipeline. Chainalysis estimates that North Korea-linked hackers had stolen at least $6.75 billion cumulatively by 2025—and behind every major heist stands the same group of intermediaries.
This is not an isolated case. In 2020, U.S. prosecutors charged two Chinese nationals with laundering more than $100 million for North Korean hackers. In 2023, OFAC sanctioned two traders—one in Hong Kong and one in mainland China. Then, in September this year, after $387.5 million was stolen from Bitget, and in April, after $292 million was stolen from Kelp DAO, ZachXBT traced the leads back to the same group of intermediaries ⚖️
Put simply, the real takeaway for ordinary crypto holders is that whether stablecoin issuers are willing to cooperate with freezes is becoming the dividing line between whether stolen funds can be recovered or not. Law enforcement is increasingly relying on on-chain investigators in the private sector to provide firsthand leads. This time, even the cost of going undercover was made public: $350,000 to uncover a pipeline handling $1 billion ⚠️
Do you think this kind of undercover investigation by independent investigators will become standard practice for recovering stolen funds? Share your thoughts in the comments.
Every day, we bring you the latest in crypto—not just what’s happening, but also the logic and opportunities behind the headlines 👀🚀

1
100
·
--
Verified
A withdrawal from the treasury? First, wait 10 days. That’s the rule change up for a vote at Compound, the veteran DeFi lending protocol—and one wallet on the voter list has been accumulating votes with borrowed money 🦖
[🙋 想聊的进群](https://app.binance.com/uni-qr/JpwCPfBj)
Proposal 612 was submitted on October 2. Voting opened Sunday and ends Wednesday, October 7. It boils down to two changes: first, extend the waiting period for treasury withdrawals from 2 days to 10; second, give the governance timelock the power both to execute and to cancel. In other words, governance could halt a treasury transaction that’s already been approved but hasn’t yet gone through.
As of the afternoon of October 5, the on-chain governance interface showed roughly 1.75 million COMP in favor, 921,000 opposed, and no abstentions. The quorum is 400,000 COMP. What really changed the character of this vote was one supporting ballot: governance researcher Blockful traced a wallet that cast 1.75 million votes to Humpy. That single wallet had more votes than all the opposition combined at the time 🗳️
How were all those votes amassed? With a wrapper called dCOMP, built by API3. Users can wrap COMP into dCOMP, use it as collateral to borrow USDC from the lending protocol Morpho, and still retain the voting power of the wrapped COMP. Etherscan showed that around 1.75 million COMP sat in the wrapper on October 5, with the very address that cast those 1.75 million votes listed as its delegate.
On the surface, this is just extending the “braking distance” from 2 days to 10. Put another way: the old 2-day waiting period was shorter than the entire governance process, which takes about a week. Whether funds could be stopped depended entirely on whether a multisig group was willing to intervene manually. The change would put the veto power in the contract, while adding a 10-day cooldown for the custodian account and making withdrawals expire 17 days after they’re initiated. In an April report, auditor Certora had already pointed out that governance couldn’t independently cancel an individual withdrawal. It rated this a low-risk issue at the time, relying on a “faster safety valve” as a backstop ⏳
My take: winning the vote isn’t the whole story. The real variable is where governance power comes from. When voting power can be separated from collateral, lent out, and concentrated into a single ballot, the decentralization of on-chain governance depends not just on how many people hold tokens, but also on who is using leverage. The Compound Foundation has publicly stated that extending the waiting period would slow its progress on V4, and called this proposal a “malicious governance attack.” That’s the Foundation’s characterization, not a conclusion about the proposal itself.
Do you see this as governance taking out insurance, or as governance power becoming an asset that can be borrowed and lent? Let’s discuss in the comments 🔍
Tap the profile picture to watch the livestream
Every day, we bring you the latest crypto headlines—not just what’s happening, but the logic and opportunities behind it 👀🚀
A withdrawal from the treasury? First, wait 10 days. That’s the rule change up for a vote at Compound, the veteran DeFi lending protocol—and one wallet on the voter list has been accumulating votes with borrowed money 🦖
🙋 想聊的进群
Proposal 612 was submitted on October 2. Voting opened Sunday and ends Wednesday, October 7. It boils down to two changes: first, extend the waiting period for treasury withdrawals from 2 days to 10; second, give the governance timelock the power both to execute and to cancel. In other words, governance could halt a treasury transaction that’s already been approved but hasn’t yet gone through.
As of the afternoon of October 5, the on-chain governance interface showed roughly 1.75 million COMP in favor, 921,000 opposed, and no abstentions. The quorum is 400,000 COMP. What really changed the character of this vote was one supporting ballot: governance researcher Blockful traced a wallet that cast 1.75 million votes to Humpy. That single wallet had more votes than all the opposition combined at the time 🗳️
How were all those votes amassed? With a wrapper called dCOMP, built by API3. Users can wrap COMP into dCOMP, use it as collateral to borrow USDC from the lending protocol Morpho, and still retain the voting power of the wrapped COMP. Etherscan showed that around 1.75 million COMP sat in the wrapper on October 5, with the very address that cast those 1.75 million votes listed as its delegate.
On the surface, this is just extending the “braking distance” from 2 days to 10. Put another way: the old 2-day waiting period was shorter than the entire governance process, which takes about a week. Whether funds could be stopped depended entirely on whether a multisig group was willing to intervene manually. The change would put the veto power in the contract, while adding a 10-day cooldown for the custodian account and making withdrawals expire 17 days after they’re initiated. In an April report, auditor Certora had already pointed out that governance couldn’t independently cancel an individual withdrawal. It rated this a low-risk issue at the time, relying on a “faster safety valve” as a backstop ⏳
My take: winning the vote isn’t the whole story. The real variable is where governance power comes from. When voting power can be separated from collateral, lent out, and concentrated into a single ballot, the decentralization of on-chain governance depends not just on how many people hold tokens, but also on who is using leverage. The Compound Foundation has publicly stated that extending the waiting period would slow its progress on V4, and called this proposal a “malicious governance attack.” That’s the Foundation’s characterization, not a conclusion about the proposal itself.
Do you see this as governance taking out insurance, or as governance power becoming an asset that can be borrowed and lent? Let’s discuss in the comments 🔍
Tap the profile picture to watch the livestream
Every day, we bring you the latest crypto headlines—not just what’s happening, but the logic and opportunities behind it 👀🚀
🙋 想聊的进群
Proposal 612 was submitted on October 2. Voting opened Sunday and ends Wednesday, October 7. It boils down to two changes: first, extend the waiting period for treasury withdrawals from 2 days to 10; second, give the governance timelock the power both to execute and to cancel. In other words, governance could halt a treasury transaction that’s already been approved but hasn’t yet gone through.
As of the afternoon of October 5, the on-chain governance interface showed roughly 1.75 million COMP in favor, 921,000 opposed, and no abstentions. The quorum is 400,000 COMP. What really changed the character of this vote was one supporting ballot: governance researcher Blockful traced a wallet that cast 1.75 million votes to Humpy. That single wallet had more votes than all the opposition combined at the time 🗳️
How were all those votes amassed? With a wrapper called dCOMP, built by API3. Users can wrap COMP into dCOMP, use it as collateral to borrow USDC from the lending protocol Morpho, and still retain the voting power of the wrapped COMP. Etherscan showed that around 1.75 million COMP sat in the wrapper on October 5, with the very address that cast those 1.75 million votes listed as its delegate.
On the surface, this is just extending the “braking distance” from 2 days to 10. Put another way: the old 2-day waiting period was shorter than the entire governance process, which takes about a week. Whether funds could be stopped depended entirely on whether a multisig group was willing to intervene manually. The change would put the veto power in the contract, while adding a 10-day cooldown for the custodian account and making withdrawals expire 17 days after they’re initiated. In an April report, auditor Certora had already pointed out that governance couldn’t independently cancel an individual withdrawal. It rated this a low-risk issue at the time, relying on a “faster safety valve” as a backstop ⏳
My take: winning the vote isn’t the whole story. The real variable is where governance power comes from. When voting power can be separated from collateral, lent out, and concentrated into a single ballot, the decentralization of on-chain governance depends not just on how many people hold tokens, but also on who is using leverage. The Compound Foundation has publicly stated that extending the waiting period would slow its progress on V4, and called this proposal a “malicious governance attack.” That’s the Foundation’s characterization, not a conclusion about the proposal itself.
Do you see this as governance taking out insurance, or as governance power becoming an asset that can be borrowed and lent? Let’s discuss in the comments 🔍
Tap the profile picture to watch the livestream
Every day, we bring you the latest crypto headlines—not just what’s happening, but the logic and opportunities behind it 👀🚀

1
148
·
--
Bought 100,000 coins last week, just 26,000 this week—and the world’s second-largest SOL accumulator still says it’s moving at “lightning speed” 🦖
[💬 你站哪边?群里说](https://app.binance.com/uni-qr/JpwCPfBj)
In an 8-K filing submitted on October 5, Nasdaq-listed DeFi Development Corp. (ticker: DFDV) disclosed that it added just 26,203 SOL, worth about $3 million, from September 28 to October 2, bringing its holdings to 2,564,212 SOL, worth about $302 million on paper. The week before, it added 47,706 SOL; the week before that (through September 18), it added 101,381. That’s three straight weeks of buying being cut roughly in half.
The company’s CEO says, “The DFDV ship is moving at lightning speed, with our treasury up 11% since August 12.” But another figure disclosed the same day showed that its holdings had increased by only 1% since September 25.
This is what the “digital asset treasury” (DAT) playbook really looks like: take the approach Strategy uses for Bitcoin and apply it to Solana—issue preferred shares and stock, convert the proceeds into crypto, let the share price rise along with the coin price, then raise more money to buy more crypto 🐋. DFDV runs its own validator nodes and has also issued a preferred stock called CHAD, with a $10 face value and a 13% annual dividend ($1.30 per share). It paid its first dividend on October 1. The company also has a $300 million at-the-market (ATM) offering facility, and on September 1 it issued 2.2 million shares in one go.
So the slowdown in buying is more worth watching than the coin price itself ⚠️. The flywheel depends on crypto prices continuing to rise and financing remaining accessible. If SOL trades sideways or falls, the 13% dividend and ongoing share issuance could turn from an “amplifier” into a “backfire”—these companies’ share prices are designed to magnify SOL’s moves in both directions, so when it falls, the losses can be magnified too.
Think about it one step further: when some of the biggest crypto-hoarding companies slow their buying one after another, a portion of the market’s marginal demand disappears. That doesn’t mean they’re bearish, but it does suggest that the “issue shares to buy crypto” machine is calculating its costs more cautiously.
Let’s discuss in the comments: Do you think they’re deliberately tapping the brakes, or has the financing flywheel already started to lose momentum?
Tap the profile picture to watch the livestream
Every day, we bring you the latest crypto market trends—not just what’s happening, but also the logic and opportunities behind it 👀🚀
Bought 100,000 coins last week, just 26,000 this week—and the world’s second-largest SOL accumulator still says it’s moving at “lightning speed” 🦖
💬 你站哪边?群里说
In an 8-K filing submitted on October 5, Nasdaq-listed DeFi Development Corp. (ticker: DFDV) disclosed that it added just 26,203 SOL, worth about $3 million, from September 28 to October 2, bringing its holdings to 2,564,212 SOL, worth about $302 million on paper. The week before, it added 47,706 SOL; the week before that (through September 18), it added 101,381. That’s three straight weeks of buying being cut roughly in half.
The company’s CEO says, “The DFDV ship is moving at lightning speed, with our treasury up 11% since August 12.” But another figure disclosed the same day showed that its holdings had increased by only 1% since September 25.
This is what the “digital asset treasury” (DAT) playbook really looks like: take the approach Strategy uses for Bitcoin and apply it to Solana—issue preferred shares and stock, convert the proceeds into crypto, let the share price rise along with the coin price, then raise more money to buy more crypto 🐋. DFDV runs its own validator nodes and has also issued a preferred stock called CHAD, with a $10 face value and a 13% annual dividend ($1.30 per share). It paid its first dividend on October 1. The company also has a $300 million at-the-market (ATM) offering facility, and on September 1 it issued 2.2 million shares in one go.
So the slowdown in buying is more worth watching than the coin price itself ⚠️. The flywheel depends on crypto prices continuing to rise and financing remaining accessible. If SOL trades sideways or falls, the 13% dividend and ongoing share issuance could turn from an “amplifier” into a “backfire”—these companies’ share prices are designed to magnify SOL’s moves in both directions, so when it falls, the losses can be magnified too.
Think about it one step further: when some of the biggest crypto-hoarding companies slow their buying one after another, a portion of the market’s marginal demand disappears. That doesn’t mean they’re bearish, but it does suggest that the “issue shares to buy crypto” machine is calculating its costs more cautiously.
Let’s discuss in the comments: Do you think they’re deliberately tapping the brakes, or has the financing flywheel already started to lose momentum?
Tap the profile picture to watch the livestream
Every day, we bring you the latest crypto market trends—not just what’s happening, but also the logic and opportunities behind it 👀🚀
💬 你站哪边?群里说
In an 8-K filing submitted on October 5, Nasdaq-listed DeFi Development Corp. (ticker: DFDV) disclosed that it added just 26,203 SOL, worth about $3 million, from September 28 to October 2, bringing its holdings to 2,564,212 SOL, worth about $302 million on paper. The week before, it added 47,706 SOL; the week before that (through September 18), it added 101,381. That’s three straight weeks of buying being cut roughly in half.
The company’s CEO says, “The DFDV ship is moving at lightning speed, with our treasury up 11% since August 12.” But another figure disclosed the same day showed that its holdings had increased by only 1% since September 25.
This is what the “digital asset treasury” (DAT) playbook really looks like: take the approach Strategy uses for Bitcoin and apply it to Solana—issue preferred shares and stock, convert the proceeds into crypto, let the share price rise along with the coin price, then raise more money to buy more crypto 🐋. DFDV runs its own validator nodes and has also issued a preferred stock called CHAD, with a $10 face value and a 13% annual dividend ($1.30 per share). It paid its first dividend on October 1. The company also has a $300 million at-the-market (ATM) offering facility, and on September 1 it issued 2.2 million shares in one go.
So the slowdown in buying is more worth watching than the coin price itself ⚠️. The flywheel depends on crypto prices continuing to rise and financing remaining accessible. If SOL trades sideways or falls, the 13% dividend and ongoing share issuance could turn from an “amplifier” into a “backfire”—these companies’ share prices are designed to magnify SOL’s moves in both directions, so when it falls, the losses can be magnified too.
Think about it one step further: when some of the biggest crypto-hoarding companies slow their buying one after another, a portion of the market’s marginal demand disappears. That doesn’t mean they’re bearish, but it does suggest that the “issue shares to buy crypto” machine is calculating its costs more cautiously.
Let’s discuss in the comments: Do you think they’re deliberately tapping the brakes, or has the financing flywheel already started to lose momentum?
Tap the profile picture to watch the livestream
Every day, we bring you the latest crypto market trends—not just what’s happening, but also the logic and opportunities behind it 👀🚀

1
121
·
--
Verified
#ada涨10%突破0.27美元
Bitcoin stays put while ADA rockets 12% in a day to a five-month high 🦖
[📢 ⏰ 消息群里第一时间说](https://app.binance.com/uni-qr/JpwCPfBj)
On October 5, Cardano’s native token ADA touched an intraday high of $0.27, gaining around 12% on the day. It was ADA’s strongest day since May this year and its highest price in five months. Meanwhile, Bitcoin barely moved around $85,700, and Ethereum hovered around $2,712—the rally wasn’t following the broader market; it was doing its own thing.
The momentum came from two things. On the fundamentals side: RealFi launched its mainnet on October 1, bringing real-world assets (RWAs) onto the Cardano mainnet. At the same time, the USDr stablecoin was integrated into three DeFi apps: Lace, Liqwid, and SundaeSwap. On the narrative side: after ADA started climbing, its founder posted a 15-minute ADA/USDT chart showing the price rise from around 0.244 to 0.264, along with the hashtag #LeiosIsComing. It became the community’s rallying cry that day 📈.
So what exactly is Leios? Its full name is Linear Leios, its specification number is CIP-164, and it’s part of the Dijkstra hard fork. The idea isn’t to replace the existing main chain—Ouroboros Praos will continue to handle security and ordering, with an additional layer of “endorsement blocks” to bundle more transactions. Stake pools will verify these blocks using BLS signatures before they’re added to the ledger. Since June 2026, the system has been running on the Musashi Dojo testnet, with data processing speeds reaching around 6 times higher. Developers estimate that under ideal conditions, throughput could increase by 10 to 65 times.
The technical indicators are also lining up: the 50-day moving average has crossed above the 200-day moving average, forming a golden cross, while the daily momentum indicator has climbed to 68.69, nearing overbought territory. The next major hurdle above is $0.28.
But there’s a contrast worth watching. Actual trading volume for ADA on decentralized exchanges (DEXs) hasn’t kept pace with the price surge—the hype is running ahead of real usage. And Leios won’t actually go live until the end of 2026, alongside Dijkstra. After launch, stake pool operators will also need to manually register their cryptographic keys, and throughput will be increased gradually by tuning parameters—it won’t reach full power at the flip of a switch ⚠️.
In other words: this looks more like a “narrative-first” rally—a hashtag and a roadmap were enough to send a coin that had been decoupled from the broader market up 12%. What will really determine whether it can hold above $0.27 or even test $0.28 isn’t the next post, but whether DEX trading and staking interest on-chain can catch up.
Let’s talk in the comments: do you think this rally is pricing in upgrade expectations early, or is it another case of “news pumps the price, but on-chain activity doesn’t follow”?
Every day, we bring you the latest crypto market trends—not just what’s happening, but the logic and opportunities behind it 👀🚀
Tap the profile picture to watch the livestream
#ada涨10%突破0.27美元
Bitcoin stays put while ADA rockets 12% in a day to a five-month high 🦖
📢 ⏰ 消息群里第一时间说
On October 5, Cardano’s native token ADA touched an intraday high of $0.27, gaining around 12% on the day. It was ADA’s strongest day since May this year and its highest price in five months. Meanwhile, Bitcoin barely moved around $85,700, and Ethereum hovered around $2,712—the rally wasn’t following the broader market; it was doing its own thing.
The momentum came from two things. On the fundamentals side: RealFi launched its mainnet on October 1, bringing real-world assets (RWAs) onto the Cardano mainnet. At the same time, the USDr stablecoin was integrated into three DeFi apps: Lace, Liqwid, and SundaeSwap. On the narrative side: after ADA started climbing, its founder posted a 15-minute ADA/USDT chart showing the price rise from around 0.244 to 0.264, along with the hashtag #LeiosIsComing. It became the community’s rallying cry that day 📈.
So what exactly is Leios? Its full name is Linear Leios, its specification number is CIP-164, and it’s part of the Dijkstra hard fork. The idea isn’t to replace the existing main chain—Ouroboros Praos will continue to handle security and ordering, with an additional layer of “endorsement blocks” to bundle more transactions. Stake pools will verify these blocks using BLS signatures before they’re added to the ledger. Since June 2026, the system has been running on the Musashi Dojo testnet, with data processing speeds reaching around 6 times higher. Developers estimate that under ideal conditions, throughput could increase by 10 to 65 times.
The technical indicators are also lining up: the 50-day moving average has crossed above the 200-day moving average, forming a golden cross, while the daily momentum indicator has climbed to 68.69, nearing overbought territory. The next major hurdle above is $0.28.
But there’s a contrast worth watching. Actual trading volume for ADA on decentralized exchanges (DEXs) hasn’t kept pace with the price surge—the hype is running ahead of real usage. And Leios won’t actually go live until the end of 2026, alongside Dijkstra. After launch, stake pool operators will also need to manually register their cryptographic keys, and throughput will be increased gradually by tuning parameters—it won’t reach full power at the flip of a switch ⚠️.
In other words: this looks more like a “narrative-first” rally—a hashtag and a roadmap were enough to send a coin that had been decoupled from the broader market up 12%. What will really determine whether it can hold above $0.27 or even test $0.28 isn’t the next post, but whether DEX trading and staking interest on-chain can catch up.
Let’s talk in the comments: do you think this rally is pricing in upgrade expectations early, or is it another case of “news pumps the price, but on-chain activity doesn’t follow”?
Every day, we bring you the latest crypto market trends—not just what’s happening, but the logic and opportunities behind it 👀🚀
Tap the profile picture to watch the livestream
Bitcoin stays put while ADA rockets 12% in a day to a five-month high 🦖
📢 ⏰ 消息群里第一时间说
On October 5, Cardano’s native token ADA touched an intraday high of $0.27, gaining around 12% on the day. It was ADA’s strongest day since May this year and its highest price in five months. Meanwhile, Bitcoin barely moved around $85,700, and Ethereum hovered around $2,712—the rally wasn’t following the broader market; it was doing its own thing.
The momentum came from two things. On the fundamentals side: RealFi launched its mainnet on October 1, bringing real-world assets (RWAs) onto the Cardano mainnet. At the same time, the USDr stablecoin was integrated into three DeFi apps: Lace, Liqwid, and SundaeSwap. On the narrative side: after ADA started climbing, its founder posted a 15-minute ADA/USDT chart showing the price rise from around 0.244 to 0.264, along with the hashtag #LeiosIsComing. It became the community’s rallying cry that day 📈.
So what exactly is Leios? Its full name is Linear Leios, its specification number is CIP-164, and it’s part of the Dijkstra hard fork. The idea isn’t to replace the existing main chain—Ouroboros Praos will continue to handle security and ordering, with an additional layer of “endorsement blocks” to bundle more transactions. Stake pools will verify these blocks using BLS signatures before they’re added to the ledger. Since June 2026, the system has been running on the Musashi Dojo testnet, with data processing speeds reaching around 6 times higher. Developers estimate that under ideal conditions, throughput could increase by 10 to 65 times.
The technical indicators are also lining up: the 50-day moving average has crossed above the 200-day moving average, forming a golden cross, while the daily momentum indicator has climbed to 68.69, nearing overbought territory. The next major hurdle above is $0.28.
But there’s a contrast worth watching. Actual trading volume for ADA on decentralized exchanges (DEXs) hasn’t kept pace with the price surge—the hype is running ahead of real usage. And Leios won’t actually go live until the end of 2026, alongside Dijkstra. After launch, stake pool operators will also need to manually register their cryptographic keys, and throughput will be increased gradually by tuning parameters—it won’t reach full power at the flip of a switch ⚠️.
In other words: this looks more like a “narrative-first” rally—a hashtag and a roadmap were enough to send a coin that had been decoupled from the broader market up 12%. What will really determine whether it can hold above $0.27 or even test $0.28 isn’t the next post, but whether DEX trading and staking interest on-chain can catch up.
Let’s talk in the comments: do you think this rally is pricing in upgrade expectations early, or is it another case of “news pumps the price, but on-chain activity doesn’t follow”?
Every day, we bring you the latest crypto market trends—not just what’s happening, but the logic and opportunities behind it 👀🚀
Tap the profile picture to watch the livestream

2
2.2k
·
--
#美联储10月维持利率概率升至82.3%
Bitcoin rose 43% in three months, but hit a 5% wall 🦖
[⚡ 有大动静群里说](https://app.binance.com/uni-qr/JpwCPfBj)
This was Bitcoin’s best third quarter since 2017, but research firm Delphi Digital poured cold water on the rally in its latest weekly report: the real obstacle isn’t the crypto market itself—it’s U.S. Treasury yields, which have climbed above 5%, their highest level in decades.
Here’s what they said, translated: “When a government bond can offer a risk-free return of more than 5%, every risk asset has to work twice as hard to justify the investment.” 💥
Here are the numbers: Bitcoin briefly surged to $87,000 last week, gaining more than 35% since mid-August and 43% over the third quarter as a whole. Meanwhile, the U.S. Treasury repeatedly increased the scale of its long-term bond buybacks, taking them all the way up to $6 billion just to support liquidity in the bond market. The money hasn’t disappeared—it’s just found a more comfortable place to go.
The real turning point came last Friday. The U.S. added just 29,000 jobs in September, far below the market’s expectation of 80,000, according to the Bureau of Labor Statistics. That sent the market’s odds of a rate hike in October tumbling from above 75% a week earlier to around 24% (CME FedWatch). New York Fed President Williams also said: “Given what we’ve already done in September, there’s no need to rush.”
My take: In the short term, this gives Bitcoin some breathing room. Cooling rate expectations give risk assets a chance to catch their breath. But in the medium term, its real rival isn’t the Fed—it’s that 5% Treasury yield. As long as “5% risk-free” remains on offer, every Bitcoin rally has to prove it’s “worth more than Treasuries.” The “debasement trade”—the idea that government debt and money printing will dilute the dollar—makes sense in theory, but it takes time, not a sudden breakout.
Two things are worth watching: whether the Fed really holds rates steady at its October meeting, and whether long-term Treasury yields can fall back below 5%. A change in either could shift Bitcoin’s direction. 📉
Let’s talk in the comments: If risk-free returns really are 5%, how much of your portfolio would you still allocate to Bitcoin?
Tap the profile picture to watch the livestream.
Every day, we bring you the latest in crypto—not just what’s happening, but the logic and opportunities behind it 👀🚀
#美联储10月维持利率概率升至82.3%
Bitcoin rose 43% in three months, but hit a 5% wall 🦖
⚡ 有大动静群里说
This was Bitcoin’s best third quarter since 2017, but research firm Delphi Digital poured cold water on the rally in its latest weekly report: the real obstacle isn’t the crypto market itself—it’s U.S. Treasury yields, which have climbed above 5%, their highest level in decades.
Here’s what they said, translated: “When a government bond can offer a risk-free return of more than 5%, every risk asset has to work twice as hard to justify the investment.” 💥
Here are the numbers: Bitcoin briefly surged to $87,000 last week, gaining more than 35% since mid-August and 43% over the third quarter as a whole. Meanwhile, the U.S. Treasury repeatedly increased the scale of its long-term bond buybacks, taking them all the way up to $6 billion just to support liquidity in the bond market. The money hasn’t disappeared—it’s just found a more comfortable place to go.
The real turning point came last Friday. The U.S. added just 29,000 jobs in September, far below the market’s expectation of 80,000, according to the Bureau of Labor Statistics. That sent the market’s odds of a rate hike in October tumbling from above 75% a week earlier to around 24% (CME FedWatch). New York Fed President Williams also said: “Given what we’ve already done in September, there’s no need to rush.”
My take: In the short term, this gives Bitcoin some breathing room. Cooling rate expectations give risk assets a chance to catch their breath. But in the medium term, its real rival isn’t the Fed—it’s that 5% Treasury yield. As long as “5% risk-free” remains on offer, every Bitcoin rally has to prove it’s “worth more than Treasuries.” The “debasement trade”—the idea that government debt and money printing will dilute the dollar—makes sense in theory, but it takes time, not a sudden breakout.
Two things are worth watching: whether the Fed really holds rates steady at its October meeting, and whether long-term Treasury yields can fall back below 5%. A change in either could shift Bitcoin’s direction. 📉
Let’s talk in the comments: If risk-free returns really are 5%, how much of your portfolio would you still allocate to Bitcoin?
Tap the profile picture to watch the livestream.
Every day, we bring you the latest in crypto—not just what’s happening, but the logic and opportunities behind it 👀🚀
Bitcoin rose 43% in three months, but hit a 5% wall 🦖
⚡ 有大动静群里说
This was Bitcoin’s best third quarter since 2017, but research firm Delphi Digital poured cold water on the rally in its latest weekly report: the real obstacle isn’t the crypto market itself—it’s U.S. Treasury yields, which have climbed above 5%, their highest level in decades.
Here’s what they said, translated: “When a government bond can offer a risk-free return of more than 5%, every risk asset has to work twice as hard to justify the investment.” 💥
Here are the numbers: Bitcoin briefly surged to $87,000 last week, gaining more than 35% since mid-August and 43% over the third quarter as a whole. Meanwhile, the U.S. Treasury repeatedly increased the scale of its long-term bond buybacks, taking them all the way up to $6 billion just to support liquidity in the bond market. The money hasn’t disappeared—it’s just found a more comfortable place to go.
The real turning point came last Friday. The U.S. added just 29,000 jobs in September, far below the market’s expectation of 80,000, according to the Bureau of Labor Statistics. That sent the market’s odds of a rate hike in October tumbling from above 75% a week earlier to around 24% (CME FedWatch). New York Fed President Williams also said: “Given what we’ve already done in September, there’s no need to rush.”
My take: In the short term, this gives Bitcoin some breathing room. Cooling rate expectations give risk assets a chance to catch their breath. But in the medium term, its real rival isn’t the Fed—it’s that 5% Treasury yield. As long as “5% risk-free” remains on offer, every Bitcoin rally has to prove it’s “worth more than Treasuries.” The “debasement trade”—the idea that government debt and money printing will dilute the dollar—makes sense in theory, but it takes time, not a sudden breakout.
Two things are worth watching: whether the Fed really holds rates steady at its October meeting, and whether long-term Treasury yields can fall back below 5%. A change in either could shift Bitcoin’s direction. 📉
Let’s talk in the comments: If risk-free returns really are 5%, how much of your portfolio would you still allocate to Bitcoin?
Tap the profile picture to watch the livestream.
Every day, we bring you the latest in crypto—not just what’s happening, but the logic and opportunities behind it 👀🚀

1
511
·
--
#solana代币化股票9月交易量破44亿美元
Tokenized stocks: a month of trading volume reaches $4.4 billion. The NYSE parent company now wants to personally move 60+ U.S. stocks onto the blockchain 🦖
[💬 群里一起聊行情](https://app.binance.com/uni-qr/JpwCPfBj)
First, let’s talk about the new move. A leading crypto exchange has formed a 50-50 joint venture with the New York Stock Exchange’s parent company, Intercontinental Exchange (ICE). This month, the JV has already filed an application with the U.S. SEC, planning to operate a “Tokenized Securities Trading Venue” (TSV). The first batch will cover stocks from more than 60 companies listed in the U.S. The basis is the SEC’s “Innovation Exemption” issued in September—allowing certain on-chain venues to conduct limited trading of tokenized U.S. stocks. Trades would go through automated market makers and liquidity-pool matching, without needing to route through traditional matching venues.
Why is this timing worth watching? Because this track has already started heating up. Tokenized stocks on Solana saw trading volume exceed $4.4 billion in September, setting a monthly record. The main drivers are the on-chain trading venues Raydium and Orca. But here’s the cold shower: $4.4 billion is the cumulative trading amount between both buyers and sellers—it is not market cap, and it’s not new capital flowing in. In fact, the value of tokenized stocks truly circulating on Solana in September was only about $684 million.
Put the two together, and the context becomes clear: first, the SEC exemption cracks open the gate; then major institutions with licenses rush to get in. A player of this level from the NYSE parent company matters more than short-term trading volume—it signals that “stocks on-chain” is moving from a crypto-native niche into legitimate business that traditional exchanges also want to compete for.
For ordinary users, the most direct change could be this: in the future, you really may be able to trade U.S. stocks 24/7 using stablecoins, without waiting for traditional brokerages to open. But on the flip side, the pricing, clearing, and which country’s securities laws govern tokenized stocks—these gaps still haven’t been filled. ⚖️
There’s another more realistic problem: the current “pool” is only on the order of a few hundred million dollars. If a large institution truly moves in funds at the tens-of-millions or even millions scale, insufficient depth would immediately amplify the issue. You might think you’re buying “U.S. stocks,” but you may actually just be buying a thinly liquid instrument—or a voucher with regulatory questions still hanging over it. 📉
If one day Apple or Nvidia can truly buy U.S. stocks on-chain 24/7 with stablecoins, would you move part of your U.S. stock positions onto the chain? Let’s discuss in the comments.
Click the avatar to watch the livestream
Every day, I’ll take you through crypto hot topics—not just what happens in the news, but also the logic and opportunities behind it 👀🚀
#solana代币化股票9月交易量破44亿美元
Tokenized stocks: a month of trading volume reaches $4.4 billion. The NYSE parent company now wants to personally move 60+ U.S. stocks onto the blockchain 🦖
💬 群里一起聊行情
First, let’s talk about the new move. A leading crypto exchange has formed a 50-50 joint venture with the New York Stock Exchange’s parent company, Intercontinental Exchange (ICE). This month, the JV has already filed an application with the U.S. SEC, planning to operate a “Tokenized Securities Trading Venue” (TSV). The first batch will cover stocks from more than 60 companies listed in the U.S. The basis is the SEC’s “Innovation Exemption” issued in September—allowing certain on-chain venues to conduct limited trading of tokenized U.S. stocks. Trades would go through automated market makers and liquidity-pool matching, without needing to route through traditional matching venues.
Why is this timing worth watching? Because this track has already started heating up. Tokenized stocks on Solana saw trading volume exceed $4.4 billion in September, setting a monthly record. The main drivers are the on-chain trading venues Raydium and Orca. But here’s the cold shower: $4.4 billion is the cumulative trading amount between both buyers and sellers—it is not market cap, and it’s not new capital flowing in. In fact, the value of tokenized stocks truly circulating on Solana in September was only about $684 million.
Put the two together, and the context becomes clear: first, the SEC exemption cracks open the gate; then major institutions with licenses rush to get in. A player of this level from the NYSE parent company matters more than short-term trading volume—it signals that “stocks on-chain” is moving from a crypto-native niche into legitimate business that traditional exchanges also want to compete for.
For ordinary users, the most direct change could be this: in the future, you really may be able to trade U.S. stocks 24/7 using stablecoins, without waiting for traditional brokerages to open. But on the flip side, the pricing, clearing, and which country’s securities laws govern tokenized stocks—these gaps still haven’t been filled. ⚖️
There’s another more realistic problem: the current “pool” is only on the order of a few hundred million dollars. If a large institution truly moves in funds at the tens-of-millions or even millions scale, insufficient depth would immediately amplify the issue. You might think you’re buying “U.S. stocks,” but you may actually just be buying a thinly liquid instrument—or a voucher with regulatory questions still hanging over it. 📉
If one day Apple or Nvidia can truly buy U.S. stocks on-chain 24/7 with stablecoins, would you move part of your U.S. stock positions onto the chain? Let’s discuss in the comments.
Click the avatar to watch the livestream
Every day, I’ll take you through crypto hot topics—not just what happens in the news, but also the logic and opportunities behind it 👀🚀
Tokenized stocks: a month of trading volume reaches $4.4 billion. The NYSE parent company now wants to personally move 60+ U.S. stocks onto the blockchain 🦖
💬 群里一起聊行情
First, let’s talk about the new move. A leading crypto exchange has formed a 50-50 joint venture with the New York Stock Exchange’s parent company, Intercontinental Exchange (ICE). This month, the JV has already filed an application with the U.S. SEC, planning to operate a “Tokenized Securities Trading Venue” (TSV). The first batch will cover stocks from more than 60 companies listed in the U.S. The basis is the SEC’s “Innovation Exemption” issued in September—allowing certain on-chain venues to conduct limited trading of tokenized U.S. stocks. Trades would go through automated market makers and liquidity-pool matching, without needing to route through traditional matching venues.
Why is this timing worth watching? Because this track has already started heating up. Tokenized stocks on Solana saw trading volume exceed $4.4 billion in September, setting a monthly record. The main drivers are the on-chain trading venues Raydium and Orca. But here’s the cold shower: $4.4 billion is the cumulative trading amount between both buyers and sellers—it is not market cap, and it’s not new capital flowing in. In fact, the value of tokenized stocks truly circulating on Solana in September was only about $684 million.
Put the two together, and the context becomes clear: first, the SEC exemption cracks open the gate; then major institutions with licenses rush to get in. A player of this level from the NYSE parent company matters more than short-term trading volume—it signals that “stocks on-chain” is moving from a crypto-native niche into legitimate business that traditional exchanges also want to compete for.
For ordinary users, the most direct change could be this: in the future, you really may be able to trade U.S. stocks 24/7 using stablecoins, without waiting for traditional brokerages to open. But on the flip side, the pricing, clearing, and which country’s securities laws govern tokenized stocks—these gaps still haven’t been filled. ⚖️
There’s another more realistic problem: the current “pool” is only on the order of a few hundred million dollars. If a large institution truly moves in funds at the tens-of-millions or even millions scale, insufficient depth would immediately amplify the issue. You might think you’re buying “U.S. stocks,” but you may actually just be buying a thinly liquid instrument—or a voucher with regulatory questions still hanging over it. 📉
If one day Apple or Nvidia can truly buy U.S. stocks on-chain 24/7 with stablecoins, would you move part of your U.S. stock positions onto the chain? Let’s discuss in the comments.
Click the avatar to watch the livestream
Every day, I’ll take you through crypto hot topics—not just what happens in the news, but also the logic and opportunities behind it 👀🚀

735
·
--
Verified
#以太坊验证者退出队列增392%
850,000 ETH wait in line to “get off” : Verifiers exiting the queue—up 392% since early October, directly setting a 2026 high.🦖
[⚡ 有大动静群里说](https://app.binance.com/uni-qr/JpwCPfBj)
According to beaconcha.in’s data on validator exits, there are currently 850,736 ETH stuck in the queue waiting to withdraw. Estimated at about $2,700 per ETH, that’s worth roughly $2.3 billion. The wait time has been extended to about 14 days and 18 hours, with only 256 validators allowed through per epoch.
The trigger wasn’t a market crash—it was a wallet’s risk-control action. On September 30, MetaMask disclosed a security incident affecting its staking infrastructure. It then proactively and preventively exited around 17,000 validators, totaling about 523,000 ETH (around $1.4 billion). ⚠️ The official position is that users’ wallets weren’t directly threatened, but this batch of “preventive evacuations” was enough by itself to push the queue to the top.
Breaking down the numbers 📊: Total staked ETH across the network is about 43.6 million, with 878,089 active validators. This queue volume is about 2% of that. The proportion isn’t huge, but the direction is telling—it proves something: the large-scale migration of validators is driven not just by price, but by operational and security decisions.
My take: the exit queue is a “buffer valve,” not a sell-pressure switch. For ETH to go out, it has to wait for more than two weeks. The pace at which it truly hits spot is being deliberately slowed. So don’t read “850,000 ETH queued” as “850,000 ETH about to dump immediately.” What’s more worth watching is the metric “queue time” itself—once it keeps stretching, it indicates that exit demand exceeds the network’s processing capacity. That pressure then propagates into discounting on liquid staking derivatives, staking yields, and the redemption timing of related protocols.
What’s really being repriced this time is, in effect, “who is holding your staking.” A wallet’s risk-control decision can instantly change the flow of funds across the chain. The knock-on effects caused by this concentration are more worth worrying about than any price chart.
Do you think this wave of exits is just for risk avoidance, or a convenient profit-taking move? Let’s discuss in the comments.
Click the avatar to watch the live stream
Every day, I’ll keep you updated on Ethereum and the on-chain data hot spots—not only what happens in the news, but also how to understand the underlying logic and opportunities behind it 👀🚀
#以太坊验证者退出队列增392%
850,000 ETH wait in line to “get off” : Verifiers exiting the queue—up 392% since early October, directly setting a 2026 high.🦖
⚡ 有大动静群里说
According to beaconcha.in’s data on validator exits, there are currently 850,736 ETH stuck in the queue waiting to withdraw. Estimated at about $2,700 per ETH, that’s worth roughly $2.3 billion. The wait time has been extended to about 14 days and 18 hours, with only 256 validators allowed through per epoch.
The trigger wasn’t a market crash—it was a wallet’s risk-control action. On September 30, MetaMask disclosed a security incident affecting its staking infrastructure. It then proactively and preventively exited around 17,000 validators, totaling about 523,000 ETH (around $1.4 billion). ⚠️ The official position is that users’ wallets weren’t directly threatened, but this batch of “preventive evacuations” was enough by itself to push the queue to the top.
Breaking down the numbers 📊: Total staked ETH across the network is about 43.6 million, with 878,089 active validators. This queue volume is about 2% of that. The proportion isn’t huge, but the direction is telling—it proves something: the large-scale migration of validators is driven not just by price, but by operational and security decisions.
My take: the exit queue is a “buffer valve,” not a sell-pressure switch. For ETH to go out, it has to wait for more than two weeks. The pace at which it truly hits spot is being deliberately slowed. So don’t read “850,000 ETH queued” as “850,000 ETH about to dump immediately.” What’s more worth watching is the metric “queue time” itself—once it keeps stretching, it indicates that exit demand exceeds the network’s processing capacity. That pressure then propagates into discounting on liquid staking derivatives, staking yields, and the redemption timing of related protocols.
What’s really being repriced this time is, in effect, “who is holding your staking.” A wallet’s risk-control decision can instantly change the flow of funds across the chain. The knock-on effects caused by this concentration are more worth worrying about than any price chart.
Do you think this wave of exits is just for risk avoidance, or a convenient profit-taking move? Let’s discuss in the comments.
Click the avatar to watch the live stream
Every day, I’ll keep you updated on Ethereum and the on-chain data hot spots—not only what happens in the news, but also how to understand the underlying logic and opportunities behind it 👀🚀
850,000 ETH wait in line to “get off” : Verifiers exiting the queue—up 392% since early October, directly setting a 2026 high.🦖
⚡ 有大动静群里说
According to beaconcha.in’s data on validator exits, there are currently 850,736 ETH stuck in the queue waiting to withdraw. Estimated at about $2,700 per ETH, that’s worth roughly $2.3 billion. The wait time has been extended to about 14 days and 18 hours, with only 256 validators allowed through per epoch.
The trigger wasn’t a market crash—it was a wallet’s risk-control action. On September 30, MetaMask disclosed a security incident affecting its staking infrastructure. It then proactively and preventively exited around 17,000 validators, totaling about 523,000 ETH (around $1.4 billion). ⚠️ The official position is that users’ wallets weren’t directly threatened, but this batch of “preventive evacuations” was enough by itself to push the queue to the top.
Breaking down the numbers 📊: Total staked ETH across the network is about 43.6 million, with 878,089 active validators. This queue volume is about 2% of that. The proportion isn’t huge, but the direction is telling—it proves something: the large-scale migration of validators is driven not just by price, but by operational and security decisions.
My take: the exit queue is a “buffer valve,” not a sell-pressure switch. For ETH to go out, it has to wait for more than two weeks. The pace at which it truly hits spot is being deliberately slowed. So don’t read “850,000 ETH queued” as “850,000 ETH about to dump immediately.” What’s more worth watching is the metric “queue time” itself—once it keeps stretching, it indicates that exit demand exceeds the network’s processing capacity. That pressure then propagates into discounting on liquid staking derivatives, staking yields, and the redemption timing of related protocols.
What’s really being repriced this time is, in effect, “who is holding your staking.” A wallet’s risk-control decision can instantly change the flow of funds across the chain. The knock-on effects caused by this concentration are more worth worrying about than any price chart.
Do you think this wave of exits is just for risk avoidance, or a convenient profit-taking move? Let’s discuss in the comments.
Click the avatar to watch the live stream
Every day, I’ll keep you updated on Ethereum and the on-chain data hot spots—not only what happens in the news, but also how to understand the underlying logic and opportunities behind it 👀🚀
2
547
·
--
Three months, $10.2 billion in inflows: Bitcoin took $6.3 billion, yet its growth rate ranks last; the fastest mover only added $480 million 🦖
[🔎 进群看完整分析](https://app.binance.com/uni-qr/JpwCPfBj)
In the U.S. spot crypto ETFs, total net inflows in Q3 2026 came to $10.2 billion (SoSoValue data). Among them, the Bitcoin funds took $6.3 billion to secure the #1 spot; Ethereum funds received $3.1 billion, ranking second; Solana funds brought in $480 million, and XRP funds $308 million. In terms of sheer amount, Bitcoin is the biggest winner.
But when we switch the lens to “growth rate,” the story flips instantly 📈.
Looking at cumulative net inflows since listing, the Solana fund grew 42% in a quarter (from $1.1 billion to $1.6 billion), Ethereum +28%, XRP +21%, while Bitcoin was only +12%. Then consider an even more intuitive metric: net inflows this quarter as a percentage of the fund’s own net assets. Solana is 25.1%—the money that entered in just three months equals a full quarter of its total size. Ethereum is 17.3%, XRP 18.3%, and Bitcoin only 5.9%.
Where does the contrast come from? The answer is the base effect. By quarter-end, the Bitcoin ETF’s net assets are already $108 billion, while Solana has just $1.9 billion—over 50x difference. The bigger the “plate,” the smaller the percentage a same-sized amount can move. Because Solana’s “plate” is smaller, a single large inflow can push its growth rate up ⚠️.
To put it plainly: large money is still defaulting to Bitcoin—BlackRock’s IBIT is the industry’s “standard allocation.” But the incremental capital that truly changes direction at the margin is moving toward small-cap ETFs, with Solana getting the most of this round. Still, stay clear-eyed: part of what looks like #1 in growth rate is arithmetic from a low base, not necessarily that Solana’s absolute demand has already caught up with Ethereum. For the Solana fund to replicate another 42% next quarter, it would need additional net inflows of about $680 million—more than this quarter’s $480 million. That’s not easy.
For ordinary investors, ETF inflows are a slow variable, but they are also an “evidence of deposits” for institutional sentiment. If in Q4 Solana can still pull in more than $480 million, that would suggest this isn’t just a one-off momentum trade, but that the capital structure is quietly shifting tracks.
Do you think next quarter’s money will keep rotating toward small-cap ETFs like Solana, or will it flow back to Bitcoin? Let’s discuss in the comments.
Click the avatar to watch the live stream
Every day, I’ll help you track crypto ETF hotspots—not just what’s happening in the news, but also the logic and opportunities behind it 👀🚀
Three months, $10.2 billion in inflows: Bitcoin took $6.3 billion, yet its growth rate ranks last; the fastest mover only added $480 million 🦖
🔎 进群看完整分析
In the U.S. spot crypto ETFs, total net inflows in Q3 2026 came to $10.2 billion (SoSoValue data). Among them, the Bitcoin funds took $6.3 billion to secure the #1 spot; Ethereum funds received $3.1 billion, ranking second; Solana funds brought in $480 million, and XRP funds $308 million. In terms of sheer amount, Bitcoin is the biggest winner.
But when we switch the lens to “growth rate,” the story flips instantly 📈.
Looking at cumulative net inflows since listing, the Solana fund grew 42% in a quarter (from $1.1 billion to $1.6 billion), Ethereum +28%, XRP +21%, while Bitcoin was only +12%. Then consider an even more intuitive metric: net inflows this quarter as a percentage of the fund’s own net assets. Solana is 25.1%—the money that entered in just three months equals a full quarter of its total size. Ethereum is 17.3%, XRP 18.3%, and Bitcoin only 5.9%.
Where does the contrast come from? The answer is the base effect. By quarter-end, the Bitcoin ETF’s net assets are already $108 billion, while Solana has just $1.9 billion—over 50x difference. The bigger the “plate,” the smaller the percentage a same-sized amount can move. Because Solana’s “plate” is smaller, a single large inflow can push its growth rate up ⚠️.
To put it plainly: large money is still defaulting to Bitcoin—BlackRock’s IBIT is the industry’s “standard allocation.” But the incremental capital that truly changes direction at the margin is moving toward small-cap ETFs, with Solana getting the most of this round. Still, stay clear-eyed: part of what looks like #1 in growth rate is arithmetic from a low base, not necessarily that Solana’s absolute demand has already caught up with Ethereum. For the Solana fund to replicate another 42% next quarter, it would need additional net inflows of about $680 million—more than this quarter’s $480 million. That’s not easy.
For ordinary investors, ETF inflows are a slow variable, but they are also an “evidence of deposits” for institutional sentiment. If in Q4 Solana can still pull in more than $480 million, that would suggest this isn’t just a one-off momentum trade, but that the capital structure is quietly shifting tracks.
Do you think next quarter’s money will keep rotating toward small-cap ETFs like Solana, or will it flow back to Bitcoin? Let’s discuss in the comments.
Click the avatar to watch the live stream
Every day, I’ll help you track crypto ETF hotspots—not just what’s happening in the news, but also the logic and opportunities behind it 👀🚀
🔎 进群看完整分析
In the U.S. spot crypto ETFs, total net inflows in Q3 2026 came to $10.2 billion (SoSoValue data). Among them, the Bitcoin funds took $6.3 billion to secure the #1 spot; Ethereum funds received $3.1 billion, ranking second; Solana funds brought in $480 million, and XRP funds $308 million. In terms of sheer amount, Bitcoin is the biggest winner.
But when we switch the lens to “growth rate,” the story flips instantly 📈.
Looking at cumulative net inflows since listing, the Solana fund grew 42% in a quarter (from $1.1 billion to $1.6 billion), Ethereum +28%, XRP +21%, while Bitcoin was only +12%. Then consider an even more intuitive metric: net inflows this quarter as a percentage of the fund’s own net assets. Solana is 25.1%—the money that entered in just three months equals a full quarter of its total size. Ethereum is 17.3%, XRP 18.3%, and Bitcoin only 5.9%.
Where does the contrast come from? The answer is the base effect. By quarter-end, the Bitcoin ETF’s net assets are already $108 billion, while Solana has just $1.9 billion—over 50x difference. The bigger the “plate,” the smaller the percentage a same-sized amount can move. Because Solana’s “plate” is smaller, a single large inflow can push its growth rate up ⚠️.
To put it plainly: large money is still defaulting to Bitcoin—BlackRock’s IBIT is the industry’s “standard allocation.” But the incremental capital that truly changes direction at the margin is moving toward small-cap ETFs, with Solana getting the most of this round. Still, stay clear-eyed: part of what looks like #1 in growth rate is arithmetic from a low base, not necessarily that Solana’s absolute demand has already caught up with Ethereum. For the Solana fund to replicate another 42% next quarter, it would need additional net inflows of about $680 million—more than this quarter’s $480 million. That’s not easy.
For ordinary investors, ETF inflows are a slow variable, but they are also an “evidence of deposits” for institutional sentiment. If in Q4 Solana can still pull in more than $480 million, that would suggest this isn’t just a one-off momentum trade, but that the capital structure is quietly shifting tracks.
Do you think next quarter’s money will keep rotating toward small-cap ETFs like Solana, or will it flow back to Bitcoin? Let’s discuss in the comments.
Click the avatar to watch the live stream
Every day, I’ll help you track crypto ETF hotspots—not just what’s happening in the news, but also the logic and opportunities behind it 👀🚀
2
662
·
--
Verified
#zcash现货etf首现周度净流出9360万美元
Two weeks ago, it pulled in $98.2 million—ranked No. 1 across the entire crypto ETF market. This week, however, it saw a net outflow of $93.6 million—the Zcash ETF’s first-ever pattern of “only out, never in” 🦖
[💡 群里更新数据解读](https://app.binance.com/uni-qr/JpwCPfBj)
Grayscale’s Zcash spot ETF (ticker: ZCSH) has, since its launch in August, recorded its first weekly net outflow. This week, $93.6 million was redeemed. Meanwhile, over the same period, ZEC’s price slid from about $1,585 at the start of the week to around $1,300. Money flows and price—first time pointing in the same direction.
The details are even more straightforward: as of October 3, ZEC was trading around $1,308, down about 17.5% over the week, and retreating roughly 23% from its recent high of $1,690. According to SoSoValue data, this ETF hasn’t posted any single-day net inflow since September 22. The redemptions have been consecutive, not a one-off transaction 💰.
The contrast is stark: two weeks ago, ZCSH attracted $98.2 million in a single week—the largest inflow among all crypto ETFs that week. Going from inflow champion to the main outflow driver, the fund’s flow direction flipped by nearly $190 million. And remember, Zcash has gained over 20x this year—ETF inflows are one of the key fuels behind this leg of the rally. With the fuel being withdrawn in the opposite direction, the price naturally loses a pillar ⚠️.
But don’t put all the blame on the ETF. The report is clear: redemptions can explain some of the pressure, but they can’t explain the entire drop. What you really need to watch is the price itself: the $1,270 to $1,300 area below is where recent buyers have been stepping in. On the four-hour chart, the longer-term moving averages are also hovering around this level. As long as it holds, there’s reason to expect a rebound; if it breaks, the next reference point is $1,155—about 12% lower than the current price 📉.
Upward, short-term selling pressure is starting to ease. There may be a chance to bounce first toward $1,320 to $1,360. If it can reclaim and hold above $1,380 to $1,425, then the logic of challenging $1,500 in the latter part of October would be back on track. In one sentence: this round is “a two-legged story”—the privacy-coin narrative and ETF funds are walking on two legs, and now the funds’ leg is the first to feel weak.
Do you think this move in ZEC is a deep overextension correction, or that the market has truly topped? Let’s discuss in the comments.
Click your avatar to watch the livestream
Every day, I’ll take you through Zcash highlights—more than just reporting what happened, I’ll help you understand the underlying logic and opportunities 👀🚀
#zcash现货etf首现周度净流出9360万美元
Two weeks ago, it pulled in $98.2 million—ranked No. 1 across the entire crypto ETF market. This week, however, it saw a net outflow of $93.6 million—the Zcash ETF’s first-ever pattern of “only out, never in” 🦖
💡 群里更新数据解读
Grayscale’s Zcash spot ETF (ticker: ZCSH) has, since its launch in August, recorded its first weekly net outflow. This week, $93.6 million was redeemed. Meanwhile, over the same period, ZEC’s price slid from about $1,585 at the start of the week to around $1,300. Money flows and price—first time pointing in the same direction.
The details are even more straightforward: as of October 3, ZEC was trading around $1,308, down about 17.5% over the week, and retreating roughly 23% from its recent high of $1,690. According to SoSoValue data, this ETF hasn’t posted any single-day net inflow since September 22. The redemptions have been consecutive, not a one-off transaction 💰.
The contrast is stark: two weeks ago, ZCSH attracted $98.2 million in a single week—the largest inflow among all crypto ETFs that week. Going from inflow champion to the main outflow driver, the fund’s flow direction flipped by nearly $190 million. And remember, Zcash has gained over 20x this year—ETF inflows are one of the key fuels behind this leg of the rally. With the fuel being withdrawn in the opposite direction, the price naturally loses a pillar ⚠️.
But don’t put all the blame on the ETF. The report is clear: redemptions can explain some of the pressure, but they can’t explain the entire drop. What you really need to watch is the price itself: the $1,270 to $1,300 area below is where recent buyers have been stepping in. On the four-hour chart, the longer-term moving averages are also hovering around this level. As long as it holds, there’s reason to expect a rebound; if it breaks, the next reference point is $1,155—about 12% lower than the current price 📉.
Upward, short-term selling pressure is starting to ease. There may be a chance to bounce first toward $1,320 to $1,360. If it can reclaim and hold above $1,380 to $1,425, then the logic of challenging $1,500 in the latter part of October would be back on track. In one sentence: this round is “a two-legged story”—the privacy-coin narrative and ETF funds are walking on two legs, and now the funds’ leg is the first to feel weak.
Do you think this move in ZEC is a deep overextension correction, or that the market has truly topped? Let’s discuss in the comments.
Click your avatar to watch the livestream
Every day, I’ll take you through Zcash highlights—more than just reporting what happened, I’ll help you understand the underlying logic and opportunities 👀🚀
Two weeks ago, it pulled in $98.2 million—ranked No. 1 across the entire crypto ETF market. This week, however, it saw a net outflow of $93.6 million—the Zcash ETF’s first-ever pattern of “only out, never in” 🦖
💡 群里更新数据解读
Grayscale’s Zcash spot ETF (ticker: ZCSH) has, since its launch in August, recorded its first weekly net outflow. This week, $93.6 million was redeemed. Meanwhile, over the same period, ZEC’s price slid from about $1,585 at the start of the week to around $1,300. Money flows and price—first time pointing in the same direction.
The details are even more straightforward: as of October 3, ZEC was trading around $1,308, down about 17.5% over the week, and retreating roughly 23% from its recent high of $1,690. According to SoSoValue data, this ETF hasn’t posted any single-day net inflow since September 22. The redemptions have been consecutive, not a one-off transaction 💰.
The contrast is stark: two weeks ago, ZCSH attracted $98.2 million in a single week—the largest inflow among all crypto ETFs that week. Going from inflow champion to the main outflow driver, the fund’s flow direction flipped by nearly $190 million. And remember, Zcash has gained over 20x this year—ETF inflows are one of the key fuels behind this leg of the rally. With the fuel being withdrawn in the opposite direction, the price naturally loses a pillar ⚠️.
But don’t put all the blame on the ETF. The report is clear: redemptions can explain some of the pressure, but they can’t explain the entire drop. What you really need to watch is the price itself: the $1,270 to $1,300 area below is where recent buyers have been stepping in. On the four-hour chart, the longer-term moving averages are also hovering around this level. As long as it holds, there’s reason to expect a rebound; if it breaks, the next reference point is $1,155—about 12% lower than the current price 📉.
Upward, short-term selling pressure is starting to ease. There may be a chance to bounce first toward $1,320 to $1,360. If it can reclaim and hold above $1,380 to $1,425, then the logic of challenging $1,500 in the latter part of October would be back on track. In one sentence: this round is “a two-legged story”—the privacy-coin narrative and ETF funds are walking on two legs, and now the funds’ leg is the first to feel weak.
Do you think this move in ZEC is a deep overextension correction, or that the market has truly topped? Let’s discuss in the comments.
Click your avatar to watch the livestream
Every day, I’ll take you through Zcash highlights—more than just reporting what happened, I’ll help you understand the underlying logic and opportunities 👀🚀
1.6k
·
--
The U.S. Senate stalled the crypto bill—and the market went absolutely wild: one token surged 104% in 15 days 📈
[⚡ 有大动静群里说](https://app.binance.com/uni-qr/JpwCPfBj)
Let’s get the facts straight. On September 15, the U.S. Senate failed to advance the CLARITY Act (a bill on crypto market structure). At the time, nearly everyone treated it as a major bearish signal. But in a memo dated September 30, Matt Hougan, Chief Investment Officer at Bitwise Asset Management, reached the exact opposite conclusion: the bill died—and instead it loosened restrictions for four categories of businesses, sending token prices and stock prices soaring together.
The four categories he singled out are: stablecoin platforms, legacy exchanges, tokenization businesses, and projects that use revenue to repurchase their own tokens. For stablecoins, Hougan directly called out one leading U.S. compliant exchange as the biggest winner—because the “balance rewards” that the bill intended to tighten were preserved. Legacy exchanges also kept the competitive advantages they might have had trimmed.
What makes the point most clearly is the numbers. From the September 15 vote to September 30, among the projects that repurchase tokens: NEAR rose 104%, Uniswap rose 49%, Pump rose 19%, Hyperliquid rose 15%, and Lighter rose 10%. Over the same window, Bitcoin rose only 8% and Ethereum rose 7% 🌊
Hougan’s takeaway was blunt: “Crypto traded long-term certainty for faster, better rules.” The logic is that in the legislative negotiations, the industry had already accepted the proposed limits; when the bill failed to pass, those limits never took effect. But the SEC moved faster instead—opening a five-year trial pathway for trading venues for tokenized U.S. stocks.
My view: this is a classic case of a “regulatory vacuum windfall”—don’t get too excited too soon. Hougan himself also warned that decisions made by regulators are far less stable than legislation. When the government changes hands in January 2029 and the SEC and CFTC get a new batch of tougher leaders, the direction could change overnight ⚠️
So I want to ask you: would you rather have rules that are faster now—but could change anytime—or rules that take longer, but can provide certainty for a decade?🦖
Let’s chat in the comments.
Click the avatar to watch the livestream
Every day, I’ll take you through crypto regulatory hot spots—not just what’s happening, but the logic and the opportunities behind it 👀🚀
The U.S. Senate stalled the crypto bill—and the market went absolutely wild: one token surged 104% in 15 days 📈
⚡ 有大动静群里说
Let’s get the facts straight. On September 15, the U.S. Senate failed to advance the CLARITY Act (a bill on crypto market structure). At the time, nearly everyone treated it as a major bearish signal. But in a memo dated September 30, Matt Hougan, Chief Investment Officer at Bitwise Asset Management, reached the exact opposite conclusion: the bill died—and instead it loosened restrictions for four categories of businesses, sending token prices and stock prices soaring together.
The four categories he singled out are: stablecoin platforms, legacy exchanges, tokenization businesses, and projects that use revenue to repurchase their own tokens. For stablecoins, Hougan directly called out one leading U.S. compliant exchange as the biggest winner—because the “balance rewards” that the bill intended to tighten were preserved. Legacy exchanges also kept the competitive advantages they might have had trimmed.
What makes the point most clearly is the numbers. From the September 15 vote to September 30, among the projects that repurchase tokens: NEAR rose 104%, Uniswap rose 49%, Pump rose 19%, Hyperliquid rose 15%, and Lighter rose 10%. Over the same window, Bitcoin rose only 8% and Ethereum rose 7% 🌊
Hougan’s takeaway was blunt: “Crypto traded long-term certainty for faster, better rules.” The logic is that in the legislative negotiations, the industry had already accepted the proposed limits; when the bill failed to pass, those limits never took effect. But the SEC moved faster instead—opening a five-year trial pathway for trading venues for tokenized U.S. stocks.
My view: this is a classic case of a “regulatory vacuum windfall”—don’t get too excited too soon. Hougan himself also warned that decisions made by regulators are far less stable than legislation. When the government changes hands in January 2029 and the SEC and CFTC get a new batch of tougher leaders, the direction could change overnight ⚠️
So I want to ask you: would you rather have rules that are faster now—but could change anytime—or rules that take longer, but can provide certainty for a decade?🦖
Let’s chat in the comments.
Click the avatar to watch the livestream
Every day, I’ll take you through crypto regulatory hot spots—not just what’s happening, but the logic and the opportunities behind it 👀🚀
⚡ 有大动静群里说
Let’s get the facts straight. On September 15, the U.S. Senate failed to advance the CLARITY Act (a bill on crypto market structure). At the time, nearly everyone treated it as a major bearish signal. But in a memo dated September 30, Matt Hougan, Chief Investment Officer at Bitwise Asset Management, reached the exact opposite conclusion: the bill died—and instead it loosened restrictions for four categories of businesses, sending token prices and stock prices soaring together.
The four categories he singled out are: stablecoin platforms, legacy exchanges, tokenization businesses, and projects that use revenue to repurchase their own tokens. For stablecoins, Hougan directly called out one leading U.S. compliant exchange as the biggest winner—because the “balance rewards” that the bill intended to tighten were preserved. Legacy exchanges also kept the competitive advantages they might have had trimmed.
What makes the point most clearly is the numbers. From the September 15 vote to September 30, among the projects that repurchase tokens: NEAR rose 104%, Uniswap rose 49%, Pump rose 19%, Hyperliquid rose 15%, and Lighter rose 10%. Over the same window, Bitcoin rose only 8% and Ethereum rose 7% 🌊
Hougan’s takeaway was blunt: “Crypto traded long-term certainty for faster, better rules.” The logic is that in the legislative negotiations, the industry had already accepted the proposed limits; when the bill failed to pass, those limits never took effect. But the SEC moved faster instead—opening a five-year trial pathway for trading venues for tokenized U.S. stocks.
My view: this is a classic case of a “regulatory vacuum windfall”—don’t get too excited too soon. Hougan himself also warned that decisions made by regulators are far less stable than legislation. When the government changes hands in January 2029 and the SEC and CFTC get a new batch of tougher leaders, the direction could change overnight ⚠️
So I want to ask you: would you rather have rules that are faster now—but could change anytime—or rules that take longer, but can provide certainty for a decade?🦖
Let’s chat in the comments.
Click the avatar to watch the livestream
Every day, I’ll take you through crypto regulatory hot spots—not just what’s happening, but the logic and the opportunities behind it 👀🚀

887
·
--
#比特币升至8.5万美元附近
The odds of a rate hike in October dropped from 70% to 30% over one week. Bitcoin has risen for four straight days, climbing to $86,000 🦖
[⚡ 有大动静群里说](https://app.binance.com/uni-qr/JpwCPfBj)
Federal Reserve Vice Chair Jefferson’s remarks on Thursday caused the market’s rate-hike expectations to suddenly hit the brakes: the probability of another rate hike at the October 28 meeting fell from 70% to 30% within a week. The probability that there will be at least one more rate hike before year-end also slipped from 95% to 80%. Bitcoin rose for the fourth consecutive trading day, trading at about $86,200, up roughly 3% over 24 hours.📈
This rebound is also supported by the bond market. The 2-year U.S. Treasury yield fell 12.3 basis points in a day to 4.764%, and the 10-year yield dropped 9.4 basis points to 5.217%, briefly touching 5.36% intraday. Jefferson’s exact words were that since the September meeting, yields across various maturities have continued to rise, indicating investors are re-evaluating the macro environment. “My colleagues and I need to form our own judgment—this may require more time”—translated, it means: wait for more data, don’t rush.
But two signals can’t be ignored. First, the September ISM Manufacturing PMI came in at 54.5 and is still expanding, while the Prices Paid subcomponent jumped from 71.1 to 77.9—so inflation pressures are actually getting heavier. Second, August PCE year-over-year at 3.4% was below the 3.7% forecast, but this time the data methodology was adjusted. Some institutions estimate that the change in the definition alone could make core PCE look up to 20 basis points lower; plus, July was also revised down by 30 basis points. So the market is discounting those four words—“inflation cooling.” ⚠️
On-chain, there’s a bit of comfort. Glassnode pointed out that the coin-denominated open interest has shrunk by nearly 20% since the August low, while the price has risen 35%. Open interest is already at the lowest level since March—less leverage means this rally is less likely to be wiped back to square one by a single liquidation cascade. Bitcoin rose 42.7% in Q3, the strongest Q3 since 2017; Citi also raised its 12-month target price from $82,000 to $113,000. Ahead of Thursday’s U.S. stock market open, Strategy was up more than 3%, and one exchange/ Circle was up more than 2%.
My take: the core driver of this move isn’t something happening in the crypto sector itself—it’s that “rate hikes may be paused.” But tonight, if the U.S. September nonfarm payrolls report comes out and employment is still strong, the 30% rate-hike probability can bounce right back, and the key support at $82,500 could be tested again. Before you take action, look at the data.📉
After tonight’s jobs report, do you think Bitcoin will first surge to $90,000, or first pull back to $82,000? Let’s discuss in the comments.
Click the profile picture to watch the live stream
Every day, I’ll help you track Bitcoin hot topics—not just what’s happening in the news, but also the logic and opportunities behind it 👀🚀
#比特币升至8.5万美元附近
The odds of a rate hike in October dropped from 70% to 30% over one week. Bitcoin has risen for four straight days, climbing to $86,000 🦖
⚡ 有大动静群里说
Federal Reserve Vice Chair Jefferson’s remarks on Thursday caused the market’s rate-hike expectations to suddenly hit the brakes: the probability of another rate hike at the October 28 meeting fell from 70% to 30% within a week. The probability that there will be at least one more rate hike before year-end also slipped from 95% to 80%. Bitcoin rose for the fourth consecutive trading day, trading at about $86,200, up roughly 3% over 24 hours.📈
This rebound is also supported by the bond market. The 2-year U.S. Treasury yield fell 12.3 basis points in a day to 4.764%, and the 10-year yield dropped 9.4 basis points to 5.217%, briefly touching 5.36% intraday. Jefferson’s exact words were that since the September meeting, yields across various maturities have continued to rise, indicating investors are re-evaluating the macro environment. “My colleagues and I need to form our own judgment—this may require more time”—translated, it means: wait for more data, don’t rush.
But two signals can’t be ignored. First, the September ISM Manufacturing PMI came in at 54.5 and is still expanding, while the Prices Paid subcomponent jumped from 71.1 to 77.9—so inflation pressures are actually getting heavier. Second, August PCE year-over-year at 3.4% was below the 3.7% forecast, but this time the data methodology was adjusted. Some institutions estimate that the change in the definition alone could make core PCE look up to 20 basis points lower; plus, July was also revised down by 30 basis points. So the market is discounting those four words—“inflation cooling.” ⚠️
On-chain, there’s a bit of comfort. Glassnode pointed out that the coin-denominated open interest has shrunk by nearly 20% since the August low, while the price has risen 35%. Open interest is already at the lowest level since March—less leverage means this rally is less likely to be wiped back to square one by a single liquidation cascade. Bitcoin rose 42.7% in Q3, the strongest Q3 since 2017; Citi also raised its 12-month target price from $82,000 to $113,000. Ahead of Thursday’s U.S. stock market open, Strategy was up more than 3%, and one exchange/ Circle was up more than 2%.
My take: the core driver of this move isn’t something happening in the crypto sector itself—it’s that “rate hikes may be paused.” But tonight, if the U.S. September nonfarm payrolls report comes out and employment is still strong, the 30% rate-hike probability can bounce right back, and the key support at $82,500 could be tested again. Before you take action, look at the data.📉
After tonight’s jobs report, do you think Bitcoin will first surge to $90,000, or first pull back to $82,000? Let’s discuss in the comments.
Click the profile picture to watch the live stream
Every day, I’ll help you track Bitcoin hot topics—not just what’s happening in the news, but also the logic and opportunities behind it 👀🚀
The odds of a rate hike in October dropped from 70% to 30% over one week. Bitcoin has risen for four straight days, climbing to $86,000 🦖
⚡ 有大动静群里说
Federal Reserve Vice Chair Jefferson’s remarks on Thursday caused the market’s rate-hike expectations to suddenly hit the brakes: the probability of another rate hike at the October 28 meeting fell from 70% to 30% within a week. The probability that there will be at least one more rate hike before year-end also slipped from 95% to 80%. Bitcoin rose for the fourth consecutive trading day, trading at about $86,200, up roughly 3% over 24 hours.📈
This rebound is also supported by the bond market. The 2-year U.S. Treasury yield fell 12.3 basis points in a day to 4.764%, and the 10-year yield dropped 9.4 basis points to 5.217%, briefly touching 5.36% intraday. Jefferson’s exact words were that since the September meeting, yields across various maturities have continued to rise, indicating investors are re-evaluating the macro environment. “My colleagues and I need to form our own judgment—this may require more time”—translated, it means: wait for more data, don’t rush.
But two signals can’t be ignored. First, the September ISM Manufacturing PMI came in at 54.5 and is still expanding, while the Prices Paid subcomponent jumped from 71.1 to 77.9—so inflation pressures are actually getting heavier. Second, August PCE year-over-year at 3.4% was below the 3.7% forecast, but this time the data methodology was adjusted. Some institutions estimate that the change in the definition alone could make core PCE look up to 20 basis points lower; plus, July was also revised down by 30 basis points. So the market is discounting those four words—“inflation cooling.” ⚠️
On-chain, there’s a bit of comfort. Glassnode pointed out that the coin-denominated open interest has shrunk by nearly 20% since the August low, while the price has risen 35%. Open interest is already at the lowest level since March—less leverage means this rally is less likely to be wiped back to square one by a single liquidation cascade. Bitcoin rose 42.7% in Q3, the strongest Q3 since 2017; Citi also raised its 12-month target price from $82,000 to $113,000. Ahead of Thursday’s U.S. stock market open, Strategy was up more than 3%, and one exchange/ Circle was up more than 2%.
My take: the core driver of this move isn’t something happening in the crypto sector itself—it’s that “rate hikes may be paused.” But tonight, if the U.S. September nonfarm payrolls report comes out and employment is still strong, the 30% rate-hike probability can bounce right back, and the key support at $82,500 could be tested again. Before you take action, look at the data.📉
After tonight’s jobs report, do you think Bitcoin will first surge to $90,000, or first pull back to $82,000? Let’s discuss in the comments.
Click the profile picture to watch the live stream
Every day, I’ll help you track Bitcoin hot topics—not just what’s happening in the news, but also the logic and opportunities behind it 👀🚀
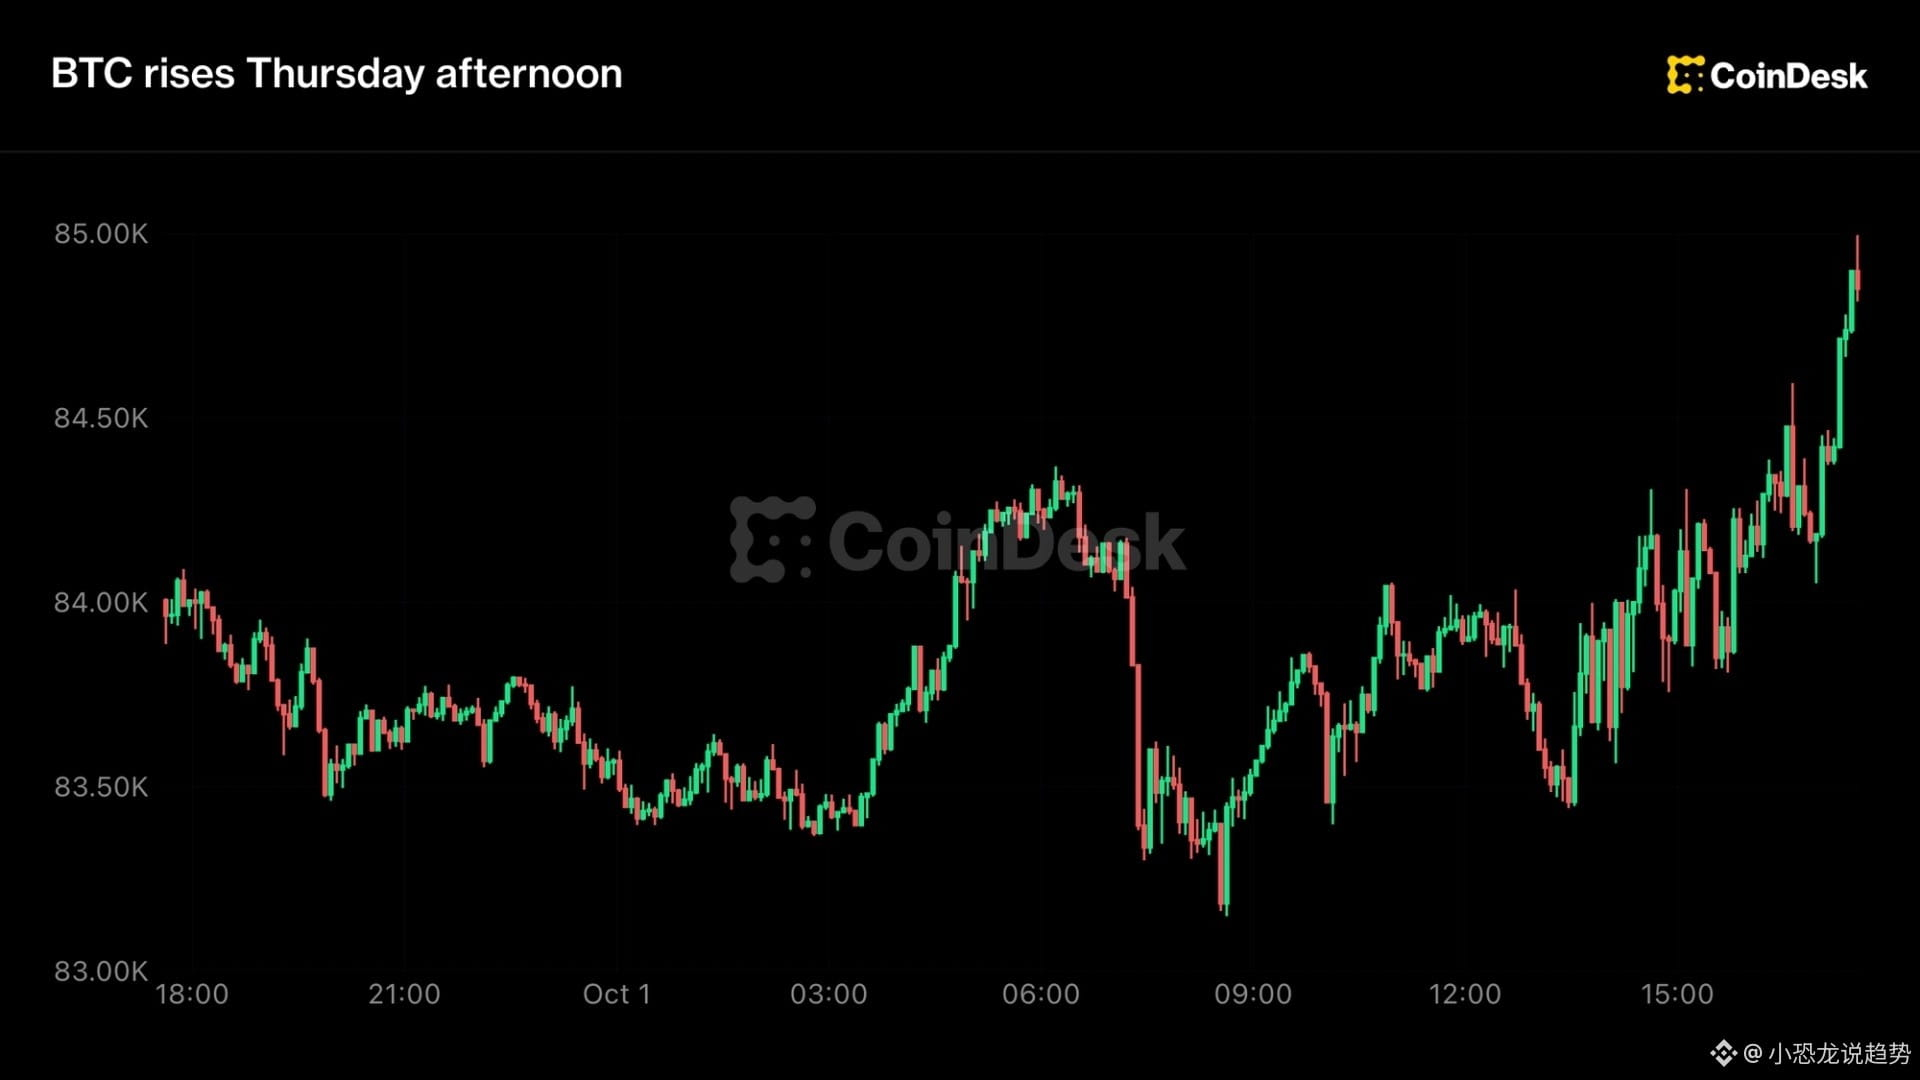
2
1.5k
·
--
#以太坊三季度涨70.9% #比特币etf三季度净流入63.4亿美元
A quarter saw $1.26 billion stolen—while Bitcoin in the same period rose by 40% 🦖
[📈 进群一起分析行情](https://app.binance.com/uni-qr/JpwCPfBj)
The third quarter has just wrapped up: CertiK’s latest data shows that in Q3 2026, the crypto industry suffered $1.26 billion in losses from security incidents, up 53.9% from the $819.4 million in Q2; the number of incidents rose from 219 to 247. The single largest theft was $387.5 million from a major exchange on September 24—accounting for 31% of the quarter’s total losses in one incident 💥
But in the very same quarter, Bitcoin rose by about 40% and Ethereum surged 70.9%. Bitcoin ETFs saw net inflows of $6.34 billion. On one side, a hackers’ harvest season; on the other, a bulls’ celebration season—this is the most unflattering side of a bull market ⚠️
First, let’s lay out the hackers’ scoreboard. September was the worst-hit month: $769 million lost in a single month, with 99 incidents—96% of which came from exploits. Besides that exchange’s $387.5 million, Liquid Network was hit for $319 million, Tectonic lost $120 million, and Coldcard was stolen for $112.7 million. Fortunately, about $273 million was frozen or recovered, bringing September’s net loss down to $495.3 million. The bigger trouble is money laundering pathways: the stolen funds are being transferred through privacy pools, making on-chain tracking increasingly difficult.
Now, let’s look at the bulls’ performance report. Bitcoin is back above $84,000, with $82,500 as the key support level. Citigroup has just raised its 12-month target price from $82,000 to $113,000, bullish on ETF fund returning; Ethereum’s quarterly gain is 70.9%, and the target price is set at $3,028 📈
My take: this cold and hot swing is actually two sides of the same thing. Institutional money is pouring in at scale through ETFs, inflating the total size of crypto assets—and pushing the amount stolen per incident into the hundreds-of-millions. Paper gains in a bull market can be very tempting, but the risk that “the assets are in someone else’s hands” is also being amplified at the same time. For everyday people, the biggest lesson of this quarter isn’t chasing pumps—it’s figuring out whose pocket your coins are really in.
Do you think this wave of hacks will slow down institutions’ pace of entry? Or do you think ETF buyers simply don’t care about these events? Let’s discuss in the comments.
Click the profile picture to watch the live stream
Every day, I’ll help you track crypto hotspots—not just what happened in the news, but also the logic and opportunities behind it 👀🚀
#以太坊三季度涨70.9% #比特币etf三季度净流入63.4亿美元
A quarter saw $1.26 billion stolen—while Bitcoin in the same period rose by 40% 🦖
📈 进群一起分析行情
The third quarter has just wrapped up: CertiK’s latest data shows that in Q3 2026, the crypto industry suffered $1.26 billion in losses from security incidents, up 53.9% from the $819.4 million in Q2; the number of incidents rose from 219 to 247. The single largest theft was $387.5 million from a major exchange on September 24—accounting for 31% of the quarter’s total losses in one incident 💥
But in the very same quarter, Bitcoin rose by about 40% and Ethereum surged 70.9%. Bitcoin ETFs saw net inflows of $6.34 billion. On one side, a hackers’ harvest season; on the other, a bulls’ celebration season—this is the most unflattering side of a bull market ⚠️
First, let’s lay out the hackers’ scoreboard. September was the worst-hit month: $769 million lost in a single month, with 99 incidents—96% of which came from exploits. Besides that exchange’s $387.5 million, Liquid Network was hit for $319 million, Tectonic lost $120 million, and Coldcard was stolen for $112.7 million. Fortunately, about $273 million was frozen or recovered, bringing September’s net loss down to $495.3 million. The bigger trouble is money laundering pathways: the stolen funds are being transferred through privacy pools, making on-chain tracking increasingly difficult.
Now, let’s look at the bulls’ performance report. Bitcoin is back above $84,000, with $82,500 as the key support level. Citigroup has just raised its 12-month target price from $82,000 to $113,000, bullish on ETF fund returning; Ethereum’s quarterly gain is 70.9%, and the target price is set at $3,028 📈
My take: this cold and hot swing is actually two sides of the same thing. Institutional money is pouring in at scale through ETFs, inflating the total size of crypto assets—and pushing the amount stolen per incident into the hundreds-of-millions. Paper gains in a bull market can be very tempting, but the risk that “the assets are in someone else’s hands” is also being amplified at the same time. For everyday people, the biggest lesson of this quarter isn’t chasing pumps—it’s figuring out whose pocket your coins are really in.
Do you think this wave of hacks will slow down institutions’ pace of entry? Or do you think ETF buyers simply don’t care about these events? Let’s discuss in the comments.
Click the profile picture to watch the live stream
Every day, I’ll help you track crypto hotspots—not just what happened in the news, but also the logic and opportunities behind it 👀🚀
A quarter saw $1.26 billion stolen—while Bitcoin in the same period rose by 40% 🦖
📈 进群一起分析行情
The third quarter has just wrapped up: CertiK’s latest data shows that in Q3 2026, the crypto industry suffered $1.26 billion in losses from security incidents, up 53.9% from the $819.4 million in Q2; the number of incidents rose from 219 to 247. The single largest theft was $387.5 million from a major exchange on September 24—accounting for 31% of the quarter’s total losses in one incident 💥
But in the very same quarter, Bitcoin rose by about 40% and Ethereum surged 70.9%. Bitcoin ETFs saw net inflows of $6.34 billion. On one side, a hackers’ harvest season; on the other, a bulls’ celebration season—this is the most unflattering side of a bull market ⚠️
First, let’s lay out the hackers’ scoreboard. September was the worst-hit month: $769 million lost in a single month, with 99 incidents—96% of which came from exploits. Besides that exchange’s $387.5 million, Liquid Network was hit for $319 million, Tectonic lost $120 million, and Coldcard was stolen for $112.7 million. Fortunately, about $273 million was frozen or recovered, bringing September’s net loss down to $495.3 million. The bigger trouble is money laundering pathways: the stolen funds are being transferred through privacy pools, making on-chain tracking increasingly difficult.
Now, let’s look at the bulls’ performance report. Bitcoin is back above $84,000, with $82,500 as the key support level. Citigroup has just raised its 12-month target price from $82,000 to $113,000, bullish on ETF fund returning; Ethereum’s quarterly gain is 70.9%, and the target price is set at $3,028 📈
My take: this cold and hot swing is actually two sides of the same thing. Institutional money is pouring in at scale through ETFs, inflating the total size of crypto assets—and pushing the amount stolen per incident into the hundreds-of-millions. Paper gains in a bull market can be very tempting, but the risk that “the assets are in someone else’s hands” is also being amplified at the same time. For everyday people, the biggest lesson of this quarter isn’t chasing pumps—it’s figuring out whose pocket your coins are really in.
Do you think this wave of hacks will slow down institutions’ pace of entry? Or do you think ETF buyers simply don’t care about these events? Let’s discuss in the comments.
Click the profile picture to watch the live stream
Every day, I’ll help you track crypto hotspots—not just what happened in the news, but also the logic and opportunities behind it 👀🚀

512
·
--
Verified
#美国10年期美债收益率逼近5.3%
US Treasury yields surge to 5.342%, the highest since 2002; yet Bitcoin stays above $84,000 and refuses to back down 🦖
[🕐 最新解读群里更新](https://app.binance.com/uni-qr/JpwCPfBj)
On Thursday, US stocks opened; at one point, the yield on the US 10-year Treasury touched 5.342%, the last time this level appeared was in April 2002. The 30-year yield also refreshed multi-year highs. At the same time, Bitcoin climbed above $84,000, up slightly on the day. Faced with the world’s most expensive cost of borrowing, it has stubbornly held its ground.
First, translate the numbers into plain language: 5.342% means the US government’s cost of borrowing has returned to levels from 24 years ago. As market concerns about government debt grow, Mahmood Pradhan, former Deputy Director of the IMF’s Europe department, told the media that global investors are now “very tense.” As yields keep rising, interest payments that countries have to make rise along with them.
Bitcoin’s reaction, in fact, has been more restrained than many people might expect. In August, the year-over-year PCE price index came in at 3.4%, below expectations, and the market barely got excited—analysts generally believe that a large part of this decline is due to changes in statistical measurement. Crypto analyst Benjamin Cowen put it more bluntly: “The bond market has revolted. Until the Fed truly gets inflation under control, this situation will likely keep going.”
On the technical side, the key levels indicated by liquidation data are $84,500 and $82,900. Over the past 24 hours, total net liquidations across the entire market were only about $25 million. Both bulls and bears are holding back, and price is being ground back and forth within a range. Rekt Capital reminds that Bitcoin will likely retest support around $82,500. “This pullback could get messy”—but he also says that as long as it’s defended, there’s still a chance to continue moving higher.
Let’s translate the key signal ⚖️: When the yield on the US 10-year Treasury gets close to 5.3%, pricing power is no longer in the crypto market—it’s in the bond market. With each step up in yields, the valuation pressure on risk assets increases. This week’s relatively soft PCE gives the bulls a chance to catch their breath, so what we’re seeing isn’t a crash, but “high-level consolidation—nobody dares to make the first move.” What truly matters now are two things: whether the 10-year yield can hold near 5.3% without surging higher again, and whether the $82,500 line can be defended. ⚠️
Do you think this move is rates weighing on Bitcoin, or Bitcoin waiting for rates to turn? Let us know your take in the comments.📈
Click the profile picture to watch the live stream
Every day, I’ll keep you on top of crypto macro hotspots—more than just reporting what happens in the news, I’ll help you understand the logic and opportunities behind it 👀🚀
#美国10年期美债收益率逼近5.3%
US Treasury yields surge to 5.342%, the highest since 2002; yet Bitcoin stays above $84,000 and refuses to back down 🦖
🕐 最新解读群里更新
On Thursday, US stocks opened; at one point, the yield on the US 10-year Treasury touched 5.342%, the last time this level appeared was in April 2002. The 30-year yield also refreshed multi-year highs. At the same time, Bitcoin climbed above $84,000, up slightly on the day. Faced with the world’s most expensive cost of borrowing, it has stubbornly held its ground.
First, translate the numbers into plain language: 5.342% means the US government’s cost of borrowing has returned to levels from 24 years ago. As market concerns about government debt grow, Mahmood Pradhan, former Deputy Director of the IMF’s Europe department, told the media that global investors are now “very tense.” As yields keep rising, interest payments that countries have to make rise along with them.
Bitcoin’s reaction, in fact, has been more restrained than many people might expect. In August, the year-over-year PCE price index came in at 3.4%, below expectations, and the market barely got excited—analysts generally believe that a large part of this decline is due to changes in statistical measurement. Crypto analyst Benjamin Cowen put it more bluntly: “The bond market has revolted. Until the Fed truly gets inflation under control, this situation will likely keep going.”
On the technical side, the key levels indicated by liquidation data are $84,500 and $82,900. Over the past 24 hours, total net liquidations across the entire market were only about $25 million. Both bulls and bears are holding back, and price is being ground back and forth within a range. Rekt Capital reminds that Bitcoin will likely retest support around $82,500. “This pullback could get messy”—but he also says that as long as it’s defended, there’s still a chance to continue moving higher.
Let’s translate the key signal ⚖️: When the yield on the US 10-year Treasury gets close to 5.3%, pricing power is no longer in the crypto market—it’s in the bond market. With each step up in yields, the valuation pressure on risk assets increases. This week’s relatively soft PCE gives the bulls a chance to catch their breath, so what we’re seeing isn’t a crash, but “high-level consolidation—nobody dares to make the first move.” What truly matters now are two things: whether the 10-year yield can hold near 5.3% without surging higher again, and whether the $82,500 line can be defended. ⚠️
Do you think this move is rates weighing on Bitcoin, or Bitcoin waiting for rates to turn? Let us know your take in the comments.📈
Click the profile picture to watch the live stream
Every day, I’ll keep you on top of crypto macro hotspots—more than just reporting what happens in the news, I’ll help you understand the logic and opportunities behind it 👀🚀
US Treasury yields surge to 5.342%, the highest since 2002; yet Bitcoin stays above $84,000 and refuses to back down 🦖
🕐 最新解读群里更新
On Thursday, US stocks opened; at one point, the yield on the US 10-year Treasury touched 5.342%, the last time this level appeared was in April 2002. The 30-year yield also refreshed multi-year highs. At the same time, Bitcoin climbed above $84,000, up slightly on the day. Faced with the world’s most expensive cost of borrowing, it has stubbornly held its ground.
First, translate the numbers into plain language: 5.342% means the US government’s cost of borrowing has returned to levels from 24 years ago. As market concerns about government debt grow, Mahmood Pradhan, former Deputy Director of the IMF’s Europe department, told the media that global investors are now “very tense.” As yields keep rising, interest payments that countries have to make rise along with them.
Bitcoin’s reaction, in fact, has been more restrained than many people might expect. In August, the year-over-year PCE price index came in at 3.4%, below expectations, and the market barely got excited—analysts generally believe that a large part of this decline is due to changes in statistical measurement. Crypto analyst Benjamin Cowen put it more bluntly: “The bond market has revolted. Until the Fed truly gets inflation under control, this situation will likely keep going.”
On the technical side, the key levels indicated by liquidation data are $84,500 and $82,900. Over the past 24 hours, total net liquidations across the entire market were only about $25 million. Both bulls and bears are holding back, and price is being ground back and forth within a range. Rekt Capital reminds that Bitcoin will likely retest support around $82,500. “This pullback could get messy”—but he also says that as long as it’s defended, there’s still a chance to continue moving higher.
Let’s translate the key signal ⚖️: When the yield on the US 10-year Treasury gets close to 5.3%, pricing power is no longer in the crypto market—it’s in the bond market. With each step up in yields, the valuation pressure on risk assets increases. This week’s relatively soft PCE gives the bulls a chance to catch their breath, so what we’re seeing isn’t a crash, but “high-level consolidation—nobody dares to make the first move.” What truly matters now are two things: whether the 10-year yield can hold near 5.3% without surging higher again, and whether the $82,500 line can be defended. ⚠️
Do you think this move is rates weighing on Bitcoin, or Bitcoin waiting for rates to turn? Let us know your take in the comments.📈
Click the profile picture to watch the live stream
Every day, I’ll keep you on top of crypto macro hotspots—more than just reporting what happens in the news, I’ll help you understand the logic and opportunities behind it 👀🚀

675
·
--
#美国10年期美债收益率逼近5.3%
The 10-year U.S. Treasury yield surged to 5.33%, the highest since April 2002— the last time I saw this number was April 2002. Global bond markets are collectively being dumped. 🦖
[📈 进群看今日思路](https://app.binance.com/uni-qr/JpwCPfBj)
On October 1 (Thursday), the yield on U.S. 10-year Treasuries rose by 4 basis points to 5.3338%, breaking above the level of April 2002; the yield on 30-year Treasuries rose by 3 basis points to 5.6702%, the highest since July 2002; and the yield on 2-year Treasuries also climbed by 2 basis points to 4.91%. On the same day, Brent crude oil moved back above $100. This isn’t a problem specific to one country—global government borrowing costs rose in sync on Thursday, driven by a triple squeeze: unmanaged fiscal deficits, sticky inflation that won’t come down, and interest rates still heading higher.
Why does this relate to crypto? Because the long-end U.S. Treasury yield is the “discount-rate anchor” for global assets. The higher it is, the lower the present value of future cash flows becomes, and the valuation ceiling for long-duration risk assets—stocks and crypto included—is pushed down. This is exactly the macro reason why Bitcoin, despite rising about 40% in Q3 (its strongest quarter since 2024), still couldn’t break out in the opening of Q4 and remained stuck in the $82,000 to $85,000 range.
But there’s also a suspenseful flip side. Nomi Prins, founder of Prinsights Global, said on CNBC that when yields reach this level, it would normally attract bargain hunters to step in and push yields back down. But sovereign wealth funds and other long-term holders in various countries likely won’t do that. Her view is that only a significant drop in oil prices, along with a concrete easing of the situation in the Middle East, could bring long-end yields down for real—in other words, what may “save” risk assets next could be geopolitics, not the Fed. ⚖️
Now look at the tug-of-war on both sides. On one side, fiscal deficits and high oil prices are propping up the long end; on the other, the U.S. Dollar Index has also hit a new high since May 2025. That combination— a strong dollar plus higher rates—has historically been a headwind for emerging markets and risk assets. ⚠️ But the market’s pricing logic is also quite nuanced: the simple relationship over the past two years—“the higher rates, the more Bitcoin falls”—has repeatedly failed. What truly pulled Bitcoin from $75,000 to above $80,000 wasn’t rates themselves, but ETF inflows and short-covering.
My view is that a 5.3% figure doesn’t call for panic, but it is a clear constraint. It determines how high institutions are willing to value risk assets, and it determines whether Bitcoin can push the $85,000 door open. In the coming week, just watch three things: whether the 10-year yield can hold above 5.3%, whether Brent crude keeps surging, and whether U.S. stocks and crypto show “rate dulling”—that is, yields rise again but assets stop falling in tandem. 📉
Let’s chat in the comments: do you think this spike in long-end rates is a roadblock for the crypto bull market, or has the market already priced it in?
Click the profile picture to watch the live stream
Every day, I’ll help you track macro and rate hotspots— not only what’s happening in the news, but also how to understand the logic and opportunities behind it 👀🚀
#美国10年期美债收益率逼近5.3%
The 10-year U.S. Treasury yield surged to 5.33%, the highest since April 2002— the last time I saw this number was April 2002. Global bond markets are collectively being dumped. 🦖
📈 进群看今日思路
On October 1 (Thursday), the yield on U.S. 10-year Treasuries rose by 4 basis points to 5.3338%, breaking above the level of April 2002; the yield on 30-year Treasuries rose by 3 basis points to 5.6702%, the highest since July 2002; and the yield on 2-year Treasuries also climbed by 2 basis points to 4.91%. On the same day, Brent crude oil moved back above $100. This isn’t a problem specific to one country—global government borrowing costs rose in sync on Thursday, driven by a triple squeeze: unmanaged fiscal deficits, sticky inflation that won’t come down, and interest rates still heading higher.
Why does this relate to crypto? Because the long-end U.S. Treasury yield is the “discount-rate anchor” for global assets. The higher it is, the lower the present value of future cash flows becomes, and the valuation ceiling for long-duration risk assets—stocks and crypto included—is pushed down. This is exactly the macro reason why Bitcoin, despite rising about 40% in Q3 (its strongest quarter since 2024), still couldn’t break out in the opening of Q4 and remained stuck in the $82,000 to $85,000 range.
But there’s also a suspenseful flip side. Nomi Prins, founder of Prinsights Global, said on CNBC that when yields reach this level, it would normally attract bargain hunters to step in and push yields back down. But sovereign wealth funds and other long-term holders in various countries likely won’t do that. Her view is that only a significant drop in oil prices, along with a concrete easing of the situation in the Middle East, could bring long-end yields down for real—in other words, what may “save” risk assets next could be geopolitics, not the Fed. ⚖️
Now look at the tug-of-war on both sides. On one side, fiscal deficits and high oil prices are propping up the long end; on the other, the U.S. Dollar Index has also hit a new high since May 2025. That combination— a strong dollar plus higher rates—has historically been a headwind for emerging markets and risk assets. ⚠️ But the market’s pricing logic is also quite nuanced: the simple relationship over the past two years—“the higher rates, the more Bitcoin falls”—has repeatedly failed. What truly pulled Bitcoin from $75,000 to above $80,000 wasn’t rates themselves, but ETF inflows and short-covering.
My view is that a 5.3% figure doesn’t call for panic, but it is a clear constraint. It determines how high institutions are willing to value risk assets, and it determines whether Bitcoin can push the $85,000 door open. In the coming week, just watch three things: whether the 10-year yield can hold above 5.3%, whether Brent crude keeps surging, and whether U.S. stocks and crypto show “rate dulling”—that is, yields rise again but assets stop falling in tandem. 📉
Let’s chat in the comments: do you think this spike in long-end rates is a roadblock for the crypto bull market, or has the market already priced it in?
Click the profile picture to watch the live stream
Every day, I’ll help you track macro and rate hotspots— not only what’s happening in the news, but also how to understand the logic and opportunities behind it 👀🚀
The 10-year U.S. Treasury yield surged to 5.33%, the highest since April 2002— the last time I saw this number was April 2002. Global bond markets are collectively being dumped. 🦖
📈 进群看今日思路
On October 1 (Thursday), the yield on U.S. 10-year Treasuries rose by 4 basis points to 5.3338%, breaking above the level of April 2002; the yield on 30-year Treasuries rose by 3 basis points to 5.6702%, the highest since July 2002; and the yield on 2-year Treasuries also climbed by 2 basis points to 4.91%. On the same day, Brent crude oil moved back above $100. This isn’t a problem specific to one country—global government borrowing costs rose in sync on Thursday, driven by a triple squeeze: unmanaged fiscal deficits, sticky inflation that won’t come down, and interest rates still heading higher.
Why does this relate to crypto? Because the long-end U.S. Treasury yield is the “discount-rate anchor” for global assets. The higher it is, the lower the present value of future cash flows becomes, and the valuation ceiling for long-duration risk assets—stocks and crypto included—is pushed down. This is exactly the macro reason why Bitcoin, despite rising about 40% in Q3 (its strongest quarter since 2024), still couldn’t break out in the opening of Q4 and remained stuck in the $82,000 to $85,000 range.
But there’s also a suspenseful flip side. Nomi Prins, founder of Prinsights Global, said on CNBC that when yields reach this level, it would normally attract bargain hunters to step in and push yields back down. But sovereign wealth funds and other long-term holders in various countries likely won’t do that. Her view is that only a significant drop in oil prices, along with a concrete easing of the situation in the Middle East, could bring long-end yields down for real—in other words, what may “save” risk assets next could be geopolitics, not the Fed. ⚖️
Now look at the tug-of-war on both sides. On one side, fiscal deficits and high oil prices are propping up the long end; on the other, the U.S. Dollar Index has also hit a new high since May 2025. That combination— a strong dollar plus higher rates—has historically been a headwind for emerging markets and risk assets. ⚠️ But the market’s pricing logic is also quite nuanced: the simple relationship over the past two years—“the higher rates, the more Bitcoin falls”—has repeatedly failed. What truly pulled Bitcoin from $75,000 to above $80,000 wasn’t rates themselves, but ETF inflows and short-covering.
My view is that a 5.3% figure doesn’t call for panic, but it is a clear constraint. It determines how high institutions are willing to value risk assets, and it determines whether Bitcoin can push the $85,000 door open. In the coming week, just watch three things: whether the 10-year yield can hold above 5.3%, whether Brent crude keeps surging, and whether U.S. stocks and crypto show “rate dulling”—that is, yields rise again but assets stop falling in tandem. 📉
Let’s chat in the comments: do you think this spike in long-end rates is a roadblock for the crypto bull market, or has the market already priced it in?
Click the profile picture to watch the live stream
Every day, I’ll help you track macro and rate hotspots— not only what’s happening in the news, but also how to understand the logic and opportunities behind it 👀🚀

592
·
--
#山寨季指数连续五日守稳60上方
Over the past quarter, Ethereum is up 71%, leaving Bitcoin’s 42.71% gain trailing by a full 28 percentage points 🦖
[🔍 进群聊行情](https://app.binance.com/uni-qr/JpwCPfBj)
With the third quarter now wrapped up, the results are in: Bitcoin is up 42.71%, marking the largest single-quarter gain since the fourth quarter of 2024 and the strongest third quarter since 2017; but the real protagonist has shifted to altcoins. In the same period, Ethereum is up about 71%, clearly outperforming.
The difference isn’t just in price. U.S. spot ETFs were very clear about where the money went in Q3: Bitcoin ETFs saw net inflows of about $6.34 billion, reversing roughly $5 billion of net outflows from Q2; Ethereum ETFs saw net inflows of about $3.05 billion, while Q2 was still a net outflow of about $714 million. Altcoin share is also rising: XRP-related ETFs pulled in about $308 million in Q3, pushing cumulative net inflows to about $1.79 billion; in September alone, SOL and ZEC ETFs had net inflows of about $272 million and $246 million, respectively.
Lights are on on both the on-chain and index fronts 📈. The altcoin season index has held above 60 for five straight days; Glassnode’s “altcoin cycle signal” turned bullish last week. Bitcoin’s market-cap share has been stuck between 58% and 60.4% since May 27, failing to break above 60%. On September 27, altcoins outside the top ten already accounted for about 9% of the entire market—the highest since February of this year.
But don’t rush to shout “altcoin season is here” ⚠️. CryptoQuant’s weekly report provided a set of opposite signals: on September 28, the seven-day total number of altcoin deposit transactions jumped to 78,000—the highest since October last year, about 160% higher than September 14. The number of addresses participating in deposits rose from about 17,600 to about 51,600—nearly three times. Its wording is very blunt: “Holders moving coins to exchanges usually means they’re preparing to sell.”
This is the most real contradiction right now: prices are outperforming and capital is rotating out, yet a large amount of old coins are simultaneously being moved to exchanges.
My view: don’t take “the index standing above 60” as a clarion call for altcoin season. 60 is just a passing grade. A true altcoin season usually starts above 75. Right now it looks more like a rotation cycle than a full-blown celebration; and when deposits suddenly surge, it often happens in the latter half of the rotation, not at the beginning. What we really need to watch next is this: are the coins moved into exchanges being absorbed by spot buy orders, or are they immediately dumped into a big red candle—healthy turnover in the first case, and the same top-forming script replayed in the second. 💥
Chat in the comments: do you think this round of altcoin outperformance is a prelude to altcoin season, or just bait—“pumping” for someone?
Click the profile icon to watch the live stream
Every day, I’ll help you track crypto market highlights—more than just news; I’ll help you understand the logic and opportunities behind it 👀🚀
#山寨季指数连续五日守稳60上方
Over the past quarter, Ethereum is up 71%, leaving Bitcoin’s 42.71% gain trailing by a full 28 percentage points 🦖
🔍 进群聊行情
With the third quarter now wrapped up, the results are in: Bitcoin is up 42.71%, marking the largest single-quarter gain since the fourth quarter of 2024 and the strongest third quarter since 2017; but the real protagonist has shifted to altcoins. In the same period, Ethereum is up about 71%, clearly outperforming.
The difference isn’t just in price. U.S. spot ETFs were very clear about where the money went in Q3: Bitcoin ETFs saw net inflows of about $6.34 billion, reversing roughly $5 billion of net outflows from Q2; Ethereum ETFs saw net inflows of about $3.05 billion, while Q2 was still a net outflow of about $714 million. Altcoin share is also rising: XRP-related ETFs pulled in about $308 million in Q3, pushing cumulative net inflows to about $1.79 billion; in September alone, SOL and ZEC ETFs had net inflows of about $272 million and $246 million, respectively.
Lights are on on both the on-chain and index fronts 📈. The altcoin season index has held above 60 for five straight days; Glassnode’s “altcoin cycle signal” turned bullish last week. Bitcoin’s market-cap share has been stuck between 58% and 60.4% since May 27, failing to break above 60%. On September 27, altcoins outside the top ten already accounted for about 9% of the entire market—the highest since February of this year.
But don’t rush to shout “altcoin season is here” ⚠️. CryptoQuant’s weekly report provided a set of opposite signals: on September 28, the seven-day total number of altcoin deposit transactions jumped to 78,000—the highest since October last year, about 160% higher than September 14. The number of addresses participating in deposits rose from about 17,600 to about 51,600—nearly three times. Its wording is very blunt: “Holders moving coins to exchanges usually means they’re preparing to sell.”
This is the most real contradiction right now: prices are outperforming and capital is rotating out, yet a large amount of old coins are simultaneously being moved to exchanges.
My view: don’t take “the index standing above 60” as a clarion call for altcoin season. 60 is just a passing grade. A true altcoin season usually starts above 75. Right now it looks more like a rotation cycle than a full-blown celebration; and when deposits suddenly surge, it often happens in the latter half of the rotation, not at the beginning. What we really need to watch next is this: are the coins moved into exchanges being absorbed by spot buy orders, or are they immediately dumped into a big red candle—healthy turnover in the first case, and the same top-forming script replayed in the second. 💥
Chat in the comments: do you think this round of altcoin outperformance is a prelude to altcoin season, or just bait—“pumping” for someone?
Click the profile icon to watch the live stream
Every day, I’ll help you track crypto market highlights—more than just news; I’ll help you understand the logic and opportunities behind it 👀🚀
Over the past quarter, Ethereum is up 71%, leaving Bitcoin’s 42.71% gain trailing by a full 28 percentage points 🦖
🔍 进群聊行情
With the third quarter now wrapped up, the results are in: Bitcoin is up 42.71%, marking the largest single-quarter gain since the fourth quarter of 2024 and the strongest third quarter since 2017; but the real protagonist has shifted to altcoins. In the same period, Ethereum is up about 71%, clearly outperforming.
The difference isn’t just in price. U.S. spot ETFs were very clear about where the money went in Q3: Bitcoin ETFs saw net inflows of about $6.34 billion, reversing roughly $5 billion of net outflows from Q2; Ethereum ETFs saw net inflows of about $3.05 billion, while Q2 was still a net outflow of about $714 million. Altcoin share is also rising: XRP-related ETFs pulled in about $308 million in Q3, pushing cumulative net inflows to about $1.79 billion; in September alone, SOL and ZEC ETFs had net inflows of about $272 million and $246 million, respectively.
Lights are on on both the on-chain and index fronts 📈. The altcoin season index has held above 60 for five straight days; Glassnode’s “altcoin cycle signal” turned bullish last week. Bitcoin’s market-cap share has been stuck between 58% and 60.4% since May 27, failing to break above 60%. On September 27, altcoins outside the top ten already accounted for about 9% of the entire market—the highest since February of this year.
But don’t rush to shout “altcoin season is here” ⚠️. CryptoQuant’s weekly report provided a set of opposite signals: on September 28, the seven-day total number of altcoin deposit transactions jumped to 78,000—the highest since October last year, about 160% higher than September 14. The number of addresses participating in deposits rose from about 17,600 to about 51,600—nearly three times. Its wording is very blunt: “Holders moving coins to exchanges usually means they’re preparing to sell.”
This is the most real contradiction right now: prices are outperforming and capital is rotating out, yet a large amount of old coins are simultaneously being moved to exchanges.
My view: don’t take “the index standing above 60” as a clarion call for altcoin season. 60 is just a passing grade. A true altcoin season usually starts above 75. Right now it looks more like a rotation cycle than a full-blown celebration; and when deposits suddenly surge, it often happens in the latter half of the rotation, not at the beginning. What we really need to watch next is this: are the coins moved into exchanges being absorbed by spot buy orders, or are they immediately dumped into a big red candle—healthy turnover in the first case, and the same top-forming script replayed in the second. 💥
Chat in the comments: do you think this round of altcoin outperformance is a prelude to altcoin season, or just bait—“pumping” for someone?
Click the profile icon to watch the live stream
Every day, I’ll help you track crypto market highlights—more than just news; I’ll help you understand the logic and opportunities behind it 👀🚀

2
783
·
--
#metamask安全事件后撤出lido验证节点
🦖 This year, North Korea-related thefts have just broken the $1 billion mark ⚖️ The world’s largest self-custody wallet promptly pulled out its own Ethereum validator nodes
[🙋 想聊的进群](https://app.binance.com/uni-qr/JpwCPfBj)
On September 30, MetaMask announced it is handling a security incident affecting part of its infrastructure. As a precaution, it began exiting the Ethereum validator nodes it operates under the Lido protocol. Lido subsequently confirmed: the affected validator nodes are expected to be fully exited by October 7. As for what the incident actually was, MetaMask did not say a word—only emphasizing that it has not found any direct threat to the wallet itself for now.
First, let’s lay out the facts. This time, MetaMask is moving its non-custodial staking business—users hand their ETH to it to run validator nodes, while the private keys always remain in the users’ possession. This exit is not a sell-off; the ETH will be returned to the protocol through the normal process. But Lido developer Will Shannon said that because the Ethereum queue to enter is so long, completing the full sequence—exit, withdrawal, and then restaking—could take up to about 45 days. The money is there; it’s just stuck on the road.
Zoom out and you’ll see why this move is worth scrutinizing. Just a few days ago, a major exchange had $387.5 million moved. The attacker then stuffed about 2,700 ZEC (about $3.8 million) into Zcash’s privacy pool. On-chain sleuth ZachXBT has publicly named the parties involved. Elliptic, a blockchain analytics firm, assessed that North Korea is “highly likely” to be behind it, and said this is the largest suspected North Korea theft incident of 2026—pushing this year’s losses from such activity past the $1 billion threshold. Security incidents are no longer occasional; they’ve become the norm.
The market reaction was straightforward: Ethereum’s current price is about $2,686, up only 0.4% in 24 hours—nothing special. But Lido’s native token LDO fell 7.16% in a day ⚠️. With the same news, tokens dropped while ETH didn’t move much, suggesting the market believes what’s been hit is trust in the staking business—not Ethereum itself.
My take: MetaMask’s move is the right call, but it doesn’t look good. It’s better to pull all validator nodes than to explain what happened—but that silence is itself a signal. It isn’t afraid of assets being stolen; it’s afraid of being questioned about its qualifications. For ordinary users, 🔒 your coins in the wallet are most likely fine. But the question of “who you hand your coins to in order to earn yield” will need to be re-accounted for in 2026. The boundaries of self-custody are expanding—from “who holds the private key” to “who runs the node on your behalf.”
Will you keep putting your ETH into staking built into your wallet? Or would you rather hold it yourself and leave it untouched? Let’s talk in the comments.
Every day, I’ll take you to follow the crypto security hot spots—not just to see what happened in the news, but to help you understand the logic and opportunities behind it 👀🚀
Click the profile photo to watch the live stream
#metamask安全事件后撤出lido验证节点
🦖 This year, North Korea-related thefts have just broken the $1 billion mark ⚖️ The world’s largest self-custody wallet promptly pulled out its own Ethereum validator nodes
🙋 想聊的进群
On September 30, MetaMask announced it is handling a security incident affecting part of its infrastructure. As a precaution, it began exiting the Ethereum validator nodes it operates under the Lido protocol. Lido subsequently confirmed: the affected validator nodes are expected to be fully exited by October 7. As for what the incident actually was, MetaMask did not say a word—only emphasizing that it has not found any direct threat to the wallet itself for now.
First, let’s lay out the facts. This time, MetaMask is moving its non-custodial staking business—users hand their ETH to it to run validator nodes, while the private keys always remain in the users’ possession. This exit is not a sell-off; the ETH will be returned to the protocol through the normal process. But Lido developer Will Shannon said that because the Ethereum queue to enter is so long, completing the full sequence—exit, withdrawal, and then restaking—could take up to about 45 days. The money is there; it’s just stuck on the road.
Zoom out and you’ll see why this move is worth scrutinizing. Just a few days ago, a major exchange had $387.5 million moved. The attacker then stuffed about 2,700 ZEC (about $3.8 million) into Zcash’s privacy pool. On-chain sleuth ZachXBT has publicly named the parties involved. Elliptic, a blockchain analytics firm, assessed that North Korea is “highly likely” to be behind it, and said this is the largest suspected North Korea theft incident of 2026—pushing this year’s losses from such activity past the $1 billion threshold. Security incidents are no longer occasional; they’ve become the norm.
The market reaction was straightforward: Ethereum’s current price is about $2,686, up only 0.4% in 24 hours—nothing special. But Lido’s native token LDO fell 7.16% in a day ⚠️. With the same news, tokens dropped while ETH didn’t move much, suggesting the market believes what’s been hit is trust in the staking business—not Ethereum itself.
My take: MetaMask’s move is the right call, but it doesn’t look good. It’s better to pull all validator nodes than to explain what happened—but that silence is itself a signal. It isn’t afraid of assets being stolen; it’s afraid of being questioned about its qualifications. For ordinary users, 🔒 your coins in the wallet are most likely fine. But the question of “who you hand your coins to in order to earn yield” will need to be re-accounted for in 2026. The boundaries of self-custody are expanding—from “who holds the private key” to “who runs the node on your behalf.”
Will you keep putting your ETH into staking built into your wallet? Or would you rather hold it yourself and leave it untouched? Let’s talk in the comments.
Every day, I’ll take you to follow the crypto security hot spots—not just to see what happened in the news, but to help you understand the logic and opportunities behind it 👀🚀
Click the profile photo to watch the live stream
🦖 This year, North Korea-related thefts have just broken the $1 billion mark ⚖️ The world’s largest self-custody wallet promptly pulled out its own Ethereum validator nodes
🙋 想聊的进群
On September 30, MetaMask announced it is handling a security incident affecting part of its infrastructure. As a precaution, it began exiting the Ethereum validator nodes it operates under the Lido protocol. Lido subsequently confirmed: the affected validator nodes are expected to be fully exited by October 7. As for what the incident actually was, MetaMask did not say a word—only emphasizing that it has not found any direct threat to the wallet itself for now.
First, let’s lay out the facts. This time, MetaMask is moving its non-custodial staking business—users hand their ETH to it to run validator nodes, while the private keys always remain in the users’ possession. This exit is not a sell-off; the ETH will be returned to the protocol through the normal process. But Lido developer Will Shannon said that because the Ethereum queue to enter is so long, completing the full sequence—exit, withdrawal, and then restaking—could take up to about 45 days. The money is there; it’s just stuck on the road.
Zoom out and you’ll see why this move is worth scrutinizing. Just a few days ago, a major exchange had $387.5 million moved. The attacker then stuffed about 2,700 ZEC (about $3.8 million) into Zcash’s privacy pool. On-chain sleuth ZachXBT has publicly named the parties involved. Elliptic, a blockchain analytics firm, assessed that North Korea is “highly likely” to be behind it, and said this is the largest suspected North Korea theft incident of 2026—pushing this year’s losses from such activity past the $1 billion threshold. Security incidents are no longer occasional; they’ve become the norm.
The market reaction was straightforward: Ethereum’s current price is about $2,686, up only 0.4% in 24 hours—nothing special. But Lido’s native token LDO fell 7.16% in a day ⚠️. With the same news, tokens dropped while ETH didn’t move much, suggesting the market believes what’s been hit is trust in the staking business—not Ethereum itself.
My take: MetaMask’s move is the right call, but it doesn’t look good. It’s better to pull all validator nodes than to explain what happened—but that silence is itself a signal. It isn’t afraid of assets being stolen; it’s afraid of being questioned about its qualifications. For ordinary users, 🔒 your coins in the wallet are most likely fine. But the question of “who you hand your coins to in order to earn yield” will need to be re-accounted for in 2026. The boundaries of self-custody are expanding—from “who holds the private key” to “who runs the node on your behalf.”
Will you keep putting your ETH into staking built into your wallet? Or would you rather hold it yourself and leave it untouched? Let’s talk in the comments.
Every day, I’ll take you to follow the crypto security hot spots—not just to see what happened in the news, but to help you understand the logic and opportunities behind it 👀🚀
Click the profile photo to watch the live stream

680
·
--
53 token issuances on a single chain were siphoned off by the same group—about $18.43 million in total.
[💬 加入行情讨论群](https://app.binance.com/uni-qr/EXpjD4Vi)
On-chain analyst Wazz traced at least 53 new-coin launches on the Robinhood Chain, all of which ultimately flowed to the same “rug-pull syndicate,” totaling about $18.43 million extracted. Averaged out, each token was siphoned for roughly $350,000.
First, let’s spell out the playbook.
To prevent bots from “front-running,” these new-token subscription platforms charge a punitive “sniper tax” on buyers at the exact moment of opening. But the rules leave a loophole: whitelisted addresses are exempt from tax.
Wazz found that the creators of this batch of projects put their own string of wallets into the tax-free whitelist. Then they used those addresses to sweep at the lowest price at opening. After retail investors see the price rising and follow in, pushing the price higher, they then concentrate their sell-off, withdraw liquidity, and leave.
The same template was copied 53 times. At least 10 of the problematic projects came from the V2 version of the same new-token subscription platform.
Even more worth watching is the chain reaction.
The platform’s own token, PONS, also couldn’t hold up. Recently, over a 24-hour period it fell by about 10%. A whale converted 5.34 million PONS in batches into 1,315 ETH (about $3.6 million), exiting at a loss of about $578,000. Platform fee revenue dropped from a peak of about $11.24 million at the beginning of September to about $2.37 million—shrinking about 5x in 19 days. In the past day, only 440,000 PONS were burned, just 0.044% of the total; compared with the more than 1 million burned the day before, this is clearly lower volume.
Technically, PONS is trading right along the $0.55 support line. Resistance is around $0.95 above. If $0.55 breaks, downside opens up toward roughly $0.37.
My take: the real risk of new-token subscriptions has never been whether “this coin will pump,” but rather “who sets the rules.”
The whitelist that exempts the anti-sniper tax, the permission to remove liquidity at opening, the on/off switch for the tax rate… the authority to interpret these tools is entirely in the hands of the project team. The platform tries to stop bots, but the same mechanism ends up becoming a legitimate “early boarding right” for insiders.
The $18.43 million is what accumulated across 53 issuances. For a platform whose daily fee income is still on the order of millions of dollars, this loss isn’t even that big. That’s the most alarming part—retail money in the system is treated as fuel, not as participants.
Will you still go on-chain to participate in new-token subscriptions? Chat in the comments.
Click the avatar to watch the live stream
Every day, I’ll bring you attention to the crypto market’s hot topics—not just what happens, but help you understand the logic and opportunities behind it 👀🚀
53 token issuances on a single chain were siphoned off by the same group—about $18.43 million in total.
💬 加入行情讨论群
On-chain analyst Wazz traced at least 53 new-coin launches on the Robinhood Chain, all of which ultimately flowed to the same “rug-pull syndicate,” totaling about $18.43 million extracted. Averaged out, each token was siphoned for roughly $350,000.
First, let’s spell out the playbook.
To prevent bots from “front-running,” these new-token subscription platforms charge a punitive “sniper tax” on buyers at the exact moment of opening. But the rules leave a loophole: whitelisted addresses are exempt from tax.
Wazz found that the creators of this batch of projects put their own string of wallets into the tax-free whitelist. Then they used those addresses to sweep at the lowest price at opening. After retail investors see the price rising and follow in, pushing the price higher, they then concentrate their sell-off, withdraw liquidity, and leave.
The same template was copied 53 times. At least 10 of the problematic projects came from the V2 version of the same new-token subscription platform.
Even more worth watching is the chain reaction.
The platform’s own token, PONS, also couldn’t hold up. Recently, over a 24-hour period it fell by about 10%. A whale converted 5.34 million PONS in batches into 1,315 ETH (about $3.6 million), exiting at a loss of about $578,000. Platform fee revenue dropped from a peak of about $11.24 million at the beginning of September to about $2.37 million—shrinking about 5x in 19 days. In the past day, only 440,000 PONS were burned, just 0.044% of the total; compared with the more than 1 million burned the day before, this is clearly lower volume.
Technically, PONS is trading right along the $0.55 support line. Resistance is around $0.95 above. If $0.55 breaks, downside opens up toward roughly $0.37.
My take: the real risk of new-token subscriptions has never been whether “this coin will pump,” but rather “who sets the rules.”
The whitelist that exempts the anti-sniper tax, the permission to remove liquidity at opening, the on/off switch for the tax rate… the authority to interpret these tools is entirely in the hands of the project team. The platform tries to stop bots, but the same mechanism ends up becoming a legitimate “early boarding right” for insiders.
The $18.43 million is what accumulated across 53 issuances. For a platform whose daily fee income is still on the order of millions of dollars, this loss isn’t even that big. That’s the most alarming part—retail money in the system is treated as fuel, not as participants.
Will you still go on-chain to participate in new-token subscriptions? Chat in the comments.
Click the avatar to watch the live stream
Every day, I’ll bring you attention to the crypto market’s hot topics—not just what happens, but help you understand the logic and opportunities behind it 👀🚀
💬 加入行情讨论群
On-chain analyst Wazz traced at least 53 new-coin launches on the Robinhood Chain, all of which ultimately flowed to the same “rug-pull syndicate,” totaling about $18.43 million extracted. Averaged out, each token was siphoned for roughly $350,000.
First, let’s spell out the playbook.
To prevent bots from “front-running,” these new-token subscription platforms charge a punitive “sniper tax” on buyers at the exact moment of opening. But the rules leave a loophole: whitelisted addresses are exempt from tax.
Wazz found that the creators of this batch of projects put their own string of wallets into the tax-free whitelist. Then they used those addresses to sweep at the lowest price at opening. After retail investors see the price rising and follow in, pushing the price higher, they then concentrate their sell-off, withdraw liquidity, and leave.
The same template was copied 53 times. At least 10 of the problematic projects came from the V2 version of the same new-token subscription platform.
Even more worth watching is the chain reaction.
The platform’s own token, PONS, also couldn’t hold up. Recently, over a 24-hour period it fell by about 10%. A whale converted 5.34 million PONS in batches into 1,315 ETH (about $3.6 million), exiting at a loss of about $578,000. Platform fee revenue dropped from a peak of about $11.24 million at the beginning of September to about $2.37 million—shrinking about 5x in 19 days. In the past day, only 440,000 PONS were burned, just 0.044% of the total; compared with the more than 1 million burned the day before, this is clearly lower volume.
Technically, PONS is trading right along the $0.55 support line. Resistance is around $0.95 above. If $0.55 breaks, downside opens up toward roughly $0.37.
My take: the real risk of new-token subscriptions has never been whether “this coin will pump,” but rather “who sets the rules.”
The whitelist that exempts the anti-sniper tax, the permission to remove liquidity at opening, the on/off switch for the tax rate… the authority to interpret these tools is entirely in the hands of the project team. The platform tries to stop bots, but the same mechanism ends up becoming a legitimate “early boarding right” for insiders.
The $18.43 million is what accumulated across 53 issuances. For a platform whose daily fee income is still on the order of millions of dollars, this loss isn’t even that big. That’s the most alarming part—retail money in the system is treated as fuel, not as participants.
Will you still go on-chain to participate in new-token subscriptions? Chat in the comments.
Click the avatar to watch the live stream
Every day, I’ll bring you attention to the crypto market’s hot topics—not just what happens, but help you understand the logic and opportunities behind it 👀🚀

2
1.5k
·
--
Verified
#bitwise提交near现货etf最终招股书
The NEAR spot ETF hasn’t officially started trading yet, but the coin price has already jumped 26% in two days: NEAR surged to a one-year high, leaving Bitcoin in the dust.
[🔄 加入行情讨论群](https://app.binance.com/uni-qr/EXpjD4Vi)
Bitwise’s NEAR spot ETF (ticker: NRR) has already obtained approval to be listed and traded on NYSE Arca, and the final registration statement (424B3) has also been posted on the SEC website. On social media, Bitwise only posted one line: “The future is near. 09/29/2026,” hinting that trading could begin as early as September 29. The same day the news broke, NEAR was lifted straight out of the pullback: up 17% on the day, another 9% over the next 24 hours, and roughly 26% cumulatively over two days—setting a one-year high. At the same time, Bitcoin rose by less than 1% over 24 hours.
What’s driving the gains isn’t only the ETF. The amount locked in Near Intents in the ecosystem has just refreshed to a new high of $249 million. Since February of this year, the protocol has used all of its revenue to conduct buybacks of NEAR in the open market—effectively pulling the circulating supply back every day. On top of that, the underlying protocol burns 70% of gas fees. And then there’s the custody setup: the ETF’s custodian is a U.S.-listed exchange, which in its terms will take NEAR to stake it, with roughly 67% of the staking rewards going to the custodian. So you get three pressures tightening at once: fresh money coming in while supply gets squeezed.
But the real question worth pondering is how big the disagreement is. In the prospectus Bitwise itself filed, the benchmark price for NEAR by 2030 is $155, with a bullish scenario of $562; the worst-case scenario is only $1.63. In the same document, the range differs by a factor of 344. And the reality right now is: NEAR’s current price is around $5.44. It gets pushed back once it hits $5.21; in the spot order book, about 760,000 coins were sold off, and the RSI also slipped from 66 down to 61.
My take: after SOL and Dogecoin, this batch of altcoin ETFs is really selling expectations of “the next asset to be added to mainstream portfolios.” Money comes first, and the product goes live later. That’s why this kind of momentum often arrives fast and also tends to be choppy and repeatable. What truly determines whether it can go the distance is whether there are sustained subscriptions after it lists—not just the approval.
Chat in the comments: Do you think this NEAR move is a real turnaround brought by the ETF, or is it once again “buy the expectation, sell the fact”? Do you still have any altcoins?
Click the profile picture to watch the live stream.
Every day, I’ll help you track the biggest crypto headlines and—more than just what happened—show you the logic and the opportunities behind it 👀🚀
#bitwise提交near现货etf最终招股书
The NEAR spot ETF hasn’t officially started trading yet, but the coin price has already jumped 26% in two days: NEAR surged to a one-year high, leaving Bitcoin in the dust.
🔄 加入行情讨论群
Bitwise’s NEAR spot ETF (ticker: NRR) has already obtained approval to be listed and traded on NYSE Arca, and the final registration statement (424B3) has also been posted on the SEC website. On social media, Bitwise only posted one line: “The future is near. 09/29/2026,” hinting that trading could begin as early as September 29. The same day the news broke, NEAR was lifted straight out of the pullback: up 17% on the day, another 9% over the next 24 hours, and roughly 26% cumulatively over two days—setting a one-year high. At the same time, Bitcoin rose by less than 1% over 24 hours.
What’s driving the gains isn’t only the ETF. The amount locked in Near Intents in the ecosystem has just refreshed to a new high of $249 million. Since February of this year, the protocol has used all of its revenue to conduct buybacks of NEAR in the open market—effectively pulling the circulating supply back every day. On top of that, the underlying protocol burns 70% of gas fees. And then there’s the custody setup: the ETF’s custodian is a U.S.-listed exchange, which in its terms will take NEAR to stake it, with roughly 67% of the staking rewards going to the custodian. So you get three pressures tightening at once: fresh money coming in while supply gets squeezed.
But the real question worth pondering is how big the disagreement is. In the prospectus Bitwise itself filed, the benchmark price for NEAR by 2030 is $155, with a bullish scenario of $562; the worst-case scenario is only $1.63. In the same document, the range differs by a factor of 344. And the reality right now is: NEAR’s current price is around $5.44. It gets pushed back once it hits $5.21; in the spot order book, about 760,000 coins were sold off, and the RSI also slipped from 66 down to 61.
My take: after SOL and Dogecoin, this batch of altcoin ETFs is really selling expectations of “the next asset to be added to mainstream portfolios.” Money comes first, and the product goes live later. That’s why this kind of momentum often arrives fast and also tends to be choppy and repeatable. What truly determines whether it can go the distance is whether there are sustained subscriptions after it lists—not just the approval.
Chat in the comments: Do you think this NEAR move is a real turnaround brought by the ETF, or is it once again “buy the expectation, sell the fact”? Do you still have any altcoins?
Click the profile picture to watch the live stream.
Every day, I’ll help you track the biggest crypto headlines and—more than just what happened—show you the logic and the opportunities behind it 👀🚀
The NEAR spot ETF hasn’t officially started trading yet, but the coin price has already jumped 26% in two days: NEAR surged to a one-year high, leaving Bitcoin in the dust.
🔄 加入行情讨论群
Bitwise’s NEAR spot ETF (ticker: NRR) has already obtained approval to be listed and traded on NYSE Arca, and the final registration statement (424B3) has also been posted on the SEC website. On social media, Bitwise only posted one line: “The future is near. 09/29/2026,” hinting that trading could begin as early as September 29. The same day the news broke, NEAR was lifted straight out of the pullback: up 17% on the day, another 9% over the next 24 hours, and roughly 26% cumulatively over two days—setting a one-year high. At the same time, Bitcoin rose by less than 1% over 24 hours.
What’s driving the gains isn’t only the ETF. The amount locked in Near Intents in the ecosystem has just refreshed to a new high of $249 million. Since February of this year, the protocol has used all of its revenue to conduct buybacks of NEAR in the open market—effectively pulling the circulating supply back every day. On top of that, the underlying protocol burns 70% of gas fees. And then there’s the custody setup: the ETF’s custodian is a U.S.-listed exchange, which in its terms will take NEAR to stake it, with roughly 67% of the staking rewards going to the custodian. So you get three pressures tightening at once: fresh money coming in while supply gets squeezed.
But the real question worth pondering is how big the disagreement is. In the prospectus Bitwise itself filed, the benchmark price for NEAR by 2030 is $155, with a bullish scenario of $562; the worst-case scenario is only $1.63. In the same document, the range differs by a factor of 344. And the reality right now is: NEAR’s current price is around $5.44. It gets pushed back once it hits $5.21; in the spot order book, about 760,000 coins were sold off, and the RSI also slipped from 66 down to 61.
My take: after SOL and Dogecoin, this batch of altcoin ETFs is really selling expectations of “the next asset to be added to mainstream portfolios.” Money comes first, and the product goes live later. That’s why this kind of momentum often arrives fast and also tends to be choppy and repeatable. What truly determines whether it can go the distance is whether there are sustained subscriptions after it lists—not just the approval.
Chat in the comments: Do you think this NEAR move is a real turnaround brought by the ETF, or is it once again “buy the expectation, sell the fact”? Do you still have any altcoins?
Click the profile picture to watch the live stream.
Every day, I’ll help you track the biggest crypto headlines and—more than just what happened—show you the logic and the opportunities behind it 👀🚀

2
785
Log in to explore more content
Join global crypto users on Binance Square
⚡️ Get latest and useful information about crypto.
💬 Trusted by the world’s largest crypto exchange.
👍 Discover real insights from verified creators.
Email / Phone number
Trending Topics
BinanceLaunchesBinanceIntelligence
16,775 views
260 Discussing
🚨 BINANCE JUST PUT AI DIRECTLY INSIDE THE EXCHANGE — AND THIS COULD CHANGE HOW RETAIL TRADES.
Binance has officially launched Binance Intelligence, a new AI layer built into the Binance ecosystem. It combines three products:
Binance AI for everyday users,
Binance AI Pro for automated trading workflows,
and Agent OS for developers building financial agents.
The part traders should care about?
Binance AI can surface market briefs, smart alerts, PnL recaps and personalized information, while AI Pro is designed to turn a plain-English trading idea into a visual strategy workflow.
That means the next phase of exchange competition may not be:
lowest fees vs deepest liquidity.
It could be:
who gives traders the best AI execution layer.
If Binance Intelligence actually drives heavier user activity, automated strategies and higher trading frequency, watch $BNB first.
AI adoption ↑
→ Binance engagement ↑
→ trading activity ↑
→ ecosystem narrative strengthens.
The catalyst I’d watch now:
global rollout + AI Pro launch + measurable user adoption.
Because once AI stops just telling you what the market is doing…
…and starts helping build the trade itself?
That’s when this gets much bigger than another chatbot. 👀
#binancelaunchesbinanceintelligence #EvernorthXRPTreasuryCompletesSPACMerger #ADAGains10%Above$0.27 #ETHUp70%InQ3ButLiquidityFalls #EthStakingExitQueueHits2026High
KimHotbae
·16 Likes
·22.5k views
EvernorthXRPTreasuryCompletesSPACMerger
20,328 views
190 Discussing
ADAGains10%Above$0.27
27,089 views
196 Discussing