

黑猫SabTheTrader
453 Posts

黑猫SabTheTrader
Report
Block User
👩💻4 Years NQ & Crypto Female Trader | 不管白猫黑猫,赚到钱的就是好猫 | X: SabTheTrader | Price action has the final say | 币安现货合约8折邀请码: SAB111
High-Frequency Trader
6.6 Years
161 Following
11.1K+ Followers
2.1K+ Liked
Posts
All
Quotes
Videos
PINNED
Verified
Yesterday, when I wrote the Micron $MUB earnings preview, I said:
The situation I’m most wary of is this—what if the earnings turn out great, but the stock price still falls?
And sure enough, it actually happened today.😂
Micron’s earnings report is very impressive. The three key areas we focused on yesterday were basically all hit.
1️⃣ Revenue: $54.23 billion
Micron’s prior guidance was $50 billion, with a range of ±$1 billion.
They ultimately delivered $54.23 billion—well above the $51 billion we were targeting yesterday.
2️⃣ Gross margin: 87%
The second thing we were watching yesterday was 86%.
After adjustments, gross margin reached 87%; the prior quarter was 84.9%.
This suggests that right now storage chip prices are still rising and supply is still tight—keeping Micron’s profits very high.
3️⃣ 2027 outlook remains strong
Micron expects revenue of about $61.5 billion in the next quarter, while the market had been expecting around $57 billion.
The company also said that by 2027, most of the high-bandwidth memory capacity has already been booked, and pricing is clearly higher than this year.
So far, they’ve signed 26 long-term customer agreements, with customers committing a total of $32 billion.
From the earnings report, at least for now, we still can’t see this storage super-cycle ending anytime soon.
💡 But with earnings this good, why hasn’t the stock price risen much?
After hours last night, Micron only moved up slightly. But into today’s pre-market, it’s actually down by about 1%.
I think the reason is simple:
The market already knew Micron would put out a strong earnings report.
$MUB has already surged by several times this year. Now, what investors want to see isn’t just “solid results”—even a normal beat might not be enough.
Also, Micron plans to keep increasing capital expenditures. Expanding production can address supply shortages, but the market will also start to worry:
With profits this high, how long can they stay that way? What happens once future supply increases?
After the market opens officially tonight, we can observe this:
With such a strong earnings report, can the stock price really move upward—or not.
If good news comes out but the price keeps failing to rise, I won’t rush to chase.
If the market digests the earnings and then turns strong again, we can consider new trading opportunities.👀
💡 Binance-related trading pairs: MU stock, bStock MUB, and MUUSDT perpetual.
Do you think Micron’s stock will rise or fall after it opens tonight?#股票财报季 #美光业绩超预期并上调指引
{future}(MUUSDT)
Yesterday, when I wrote the Micron $MUB earnings preview, I said:
The situation I’m most wary of is this—what if the earnings turn out great, but the stock price still falls?
And sure enough, it actually happened today.😂
Micron’s earnings report is very impressive. The three key areas we focused on yesterday were basically all hit.
1️⃣ Revenue: $54.23 billion
Micron’s prior guidance was $50 billion, with a range of ±$1 billion.
They ultimately delivered $54.23 billion—well above the $51 billion we were targeting yesterday.
2️⃣ Gross margin: 87%
The second thing we were watching yesterday was 86%.
After adjustments, gross margin reached 87%; the prior quarter was 84.9%.
This suggests that right now storage chip prices are still rising and supply is still tight—keeping Micron’s profits very high.
3️⃣ 2027 outlook remains strong
Micron expects revenue of about $61.5 billion in the next quarter, while the market had been expecting around $57 billion.
The company also said that by 2027, most of the high-bandwidth memory capacity has already been booked, and pricing is clearly higher than this year.
So far, they’ve signed 26 long-term customer agreements, with customers committing a total of $32 billion.
From the earnings report, at least for now, we still can’t see this storage super-cycle ending anytime soon.
💡 But with earnings this good, why hasn’t the stock price risen much?
After hours last night, Micron only moved up slightly. But into today’s pre-market, it’s actually down by about 1%.
I think the reason is simple:
The market already knew Micron would put out a strong earnings report.
$MUB has already surged by several times this year. Now, what investors want to see isn’t just “solid results”—even a normal beat might not be enough.
Also, Micron plans to keep increasing capital expenditures. Expanding production can address supply shortages, but the market will also start to worry:
With profits this high, how long can they stay that way? What happens once future supply increases?
After the market opens officially tonight, we can observe this:
With such a strong earnings report, can the stock price really move upward—or not.
If good news comes out but the price keeps failing to rise, I won’t rush to chase.
If the market digests the earnings and then turns strong again, we can consider new trading opportunities.👀
💡 Binance-related trading pairs: MU stock, bStock MUB, and MUUSDT perpetual.
Do you think Micron’s stock will rise or fall after it opens tonight?#股票财报季 #美光业绩超预期并上调指引
The situation I’m most wary of is this—what if the earnings turn out great, but the stock price still falls?
And sure enough, it actually happened today.😂
Micron’s earnings report is very impressive. The three key areas we focused on yesterday were basically all hit.
1️⃣ Revenue: $54.23 billion
Micron’s prior guidance was $50 billion, with a range of ±$1 billion.
They ultimately delivered $54.23 billion—well above the $51 billion we were targeting yesterday.
2️⃣ Gross margin: 87%
The second thing we were watching yesterday was 86%.
After adjustments, gross margin reached 87%; the prior quarter was 84.9%.
This suggests that right now storage chip prices are still rising and supply is still tight—keeping Micron’s profits very high.
3️⃣ 2027 outlook remains strong
Micron expects revenue of about $61.5 billion in the next quarter, while the market had been expecting around $57 billion.
The company also said that by 2027, most of the high-bandwidth memory capacity has already been booked, and pricing is clearly higher than this year.
So far, they’ve signed 26 long-term customer agreements, with customers committing a total of $32 billion.
From the earnings report, at least for now, we still can’t see this storage super-cycle ending anytime soon.
💡 But with earnings this good, why hasn’t the stock price risen much?
After hours last night, Micron only moved up slightly. But into today’s pre-market, it’s actually down by about 1%.
I think the reason is simple:
The market already knew Micron would put out a strong earnings report.
$MUB has already surged by several times this year. Now, what investors want to see isn’t just “solid results”—even a normal beat might not be enough.
Also, Micron plans to keep increasing capital expenditures. Expanding production can address supply shortages, but the market will also start to worry:
With profits this high, how long can they stay that way? What happens once future supply increases?
After the market opens officially tonight, we can observe this:
With such a strong earnings report, can the stock price really move upward—or not.
If good news comes out but the price keeps failing to rise, I won’t rush to chase.
If the market digests the earnings and then turns strong again, we can consider new trading opportunities.👀
💡 Binance-related trading pairs: MU stock, bStock MUB, and MUUSDT perpetual.
Do you think Micron’s stock will rise or fall after it opens tonight?#股票财报季 #美光业绩超预期并上调指引

3
4
6.9k
PINNED
Verified
Check out this SPCXx IPO Campaign on Binance Wallet, but make sure to understand the rules before diving in. 🚀
Basically, eligible users can submit their subscription intentions through Binance Wallet for a chance to snag SpaceX-related tokenized securities, SPCXx.
But let’s be clear:
SPCXx isn’t directly buying SpaceX stock, nor does it grant any shareholder rights in SpaceX.
It’s more like getting price exposure to SpaceX’s potential IPO through xStocks.
The minimum subscription amount is 100 USDC; the indicative price for each SPCXx is 135 USDC, excluding fees, plus a 5% underwriting service fee.
So, if we go by the indicative price, the estimated total cost per token would be around 141.75 USDC.
Of course, keep in mind:
1⃣ Submitting a subscription ≠ guaranteed allocation
2⃣ SPCXx ≠ direct ownership of SpaceX stock
3⃣ The final issue price isn’t fixed
4⃣ Some regional users may be unable to participate
5⃣ Always read the rules and assess the risks before joining in
What I find noteworthy here is:
Pre-IPO, tokenized securities, and US stock assets on-chain are no longer distant concepts.
More and more exchanges and wallets are slowly bringing traditional market asset exposure to users on-chain.
Binance Wallet’s SPCXx IPO Campaign feels like a new milestone in this trend.
What was once a distant Pre-IPO exposure for the average user is now becoming visible to more people at a lower barrier and more on-chain.
So, I’ll treat it as a case study.
It’s not about blindly chasing SpaceX; it doesn’t mean these types of products are fully matured either.
But the increasing appearance of traditional asset exposure in on-chain wallets is definitely a trend worth watching.
If you’re interested, go check out the rules.
Just make sure to read them carefully before participating. 🤣
* NFA, DYOR.
#币安钱包推出spcxxipo
Check out this SPCXx IPO Campaign on Binance Wallet, but make sure to understand the rules before diving in. 🚀
Basically, eligible users can submit their subscription intentions through Binance Wallet for a chance to snag SpaceX-related tokenized securities, SPCXx.
But let’s be clear:
SPCXx isn’t directly buying SpaceX stock, nor does it grant any shareholder rights in SpaceX.
It’s more like getting price exposure to SpaceX’s potential IPO through xStocks.
The minimum subscription amount is 100 USDC; the indicative price for each SPCXx is 135 USDC, excluding fees, plus a 5% underwriting service fee.
So, if we go by the indicative price, the estimated total cost per token would be around 141.75 USDC.
Of course, keep in mind:
1⃣ Submitting a subscription ≠ guaranteed allocation
2⃣ SPCXx ≠ direct ownership of SpaceX stock
3⃣ The final issue price isn’t fixed
4⃣ Some regional users may be unable to participate
5⃣ Always read the rules and assess the risks before joining in
What I find noteworthy here is:
Pre-IPO, tokenized securities, and US stock assets on-chain are no longer distant concepts.
More and more exchanges and wallets are slowly bringing traditional market asset exposure to users on-chain.
Binance Wallet’s SPCXx IPO Campaign feels like a new milestone in this trend.
What was once a distant Pre-IPO exposure for the average user is now becoming visible to more people at a lower barrier and more on-chain.
So, I’ll treat it as a case study.
It’s not about blindly chasing SpaceX; it doesn’t mean these types of products are fully matured either.
But the increasing appearance of traditional asset exposure in on-chain wallets is definitely a trend worth watching.
If you’re interested, go check out the rules.
Just make sure to read them carefully before participating. 🤣
* NFA, DYOR.
#币安钱包推出spcxxipo
Basically, eligible users can submit their subscription intentions through Binance Wallet for a chance to snag SpaceX-related tokenized securities, SPCXx.
But let’s be clear:
SPCXx isn’t directly buying SpaceX stock, nor does it grant any shareholder rights in SpaceX.
It’s more like getting price exposure to SpaceX’s potential IPO through xStocks.
The minimum subscription amount is 100 USDC; the indicative price for each SPCXx is 135 USDC, excluding fees, plus a 5% underwriting service fee.
So, if we go by the indicative price, the estimated total cost per token would be around 141.75 USDC.
Of course, keep in mind:
1⃣ Submitting a subscription ≠ guaranteed allocation
2⃣ SPCXx ≠ direct ownership of SpaceX stock
3⃣ The final issue price isn’t fixed
4⃣ Some regional users may be unable to participate
5⃣ Always read the rules and assess the risks before joining in
What I find noteworthy here is:
Pre-IPO, tokenized securities, and US stock assets on-chain are no longer distant concepts.
More and more exchanges and wallets are slowly bringing traditional market asset exposure to users on-chain.
Binance Wallet’s SPCXx IPO Campaign feels like a new milestone in this trend.
What was once a distant Pre-IPO exposure for the average user is now becoming visible to more people at a lower barrier and more on-chain.
So, I’ll treat it as a case study.
It’s not about blindly chasing SpaceX; it doesn’t mean these types of products are fully matured either.
But the increasing appearance of traditional asset exposure in on-chain wallets is definitely a trend worth watching.
If you’re interested, go check out the rules.
Just make sure to read them carefully before participating. 🤣
* NFA, DYOR.
#币安钱包推出spcxxipo

35
7
114
66k
Verified
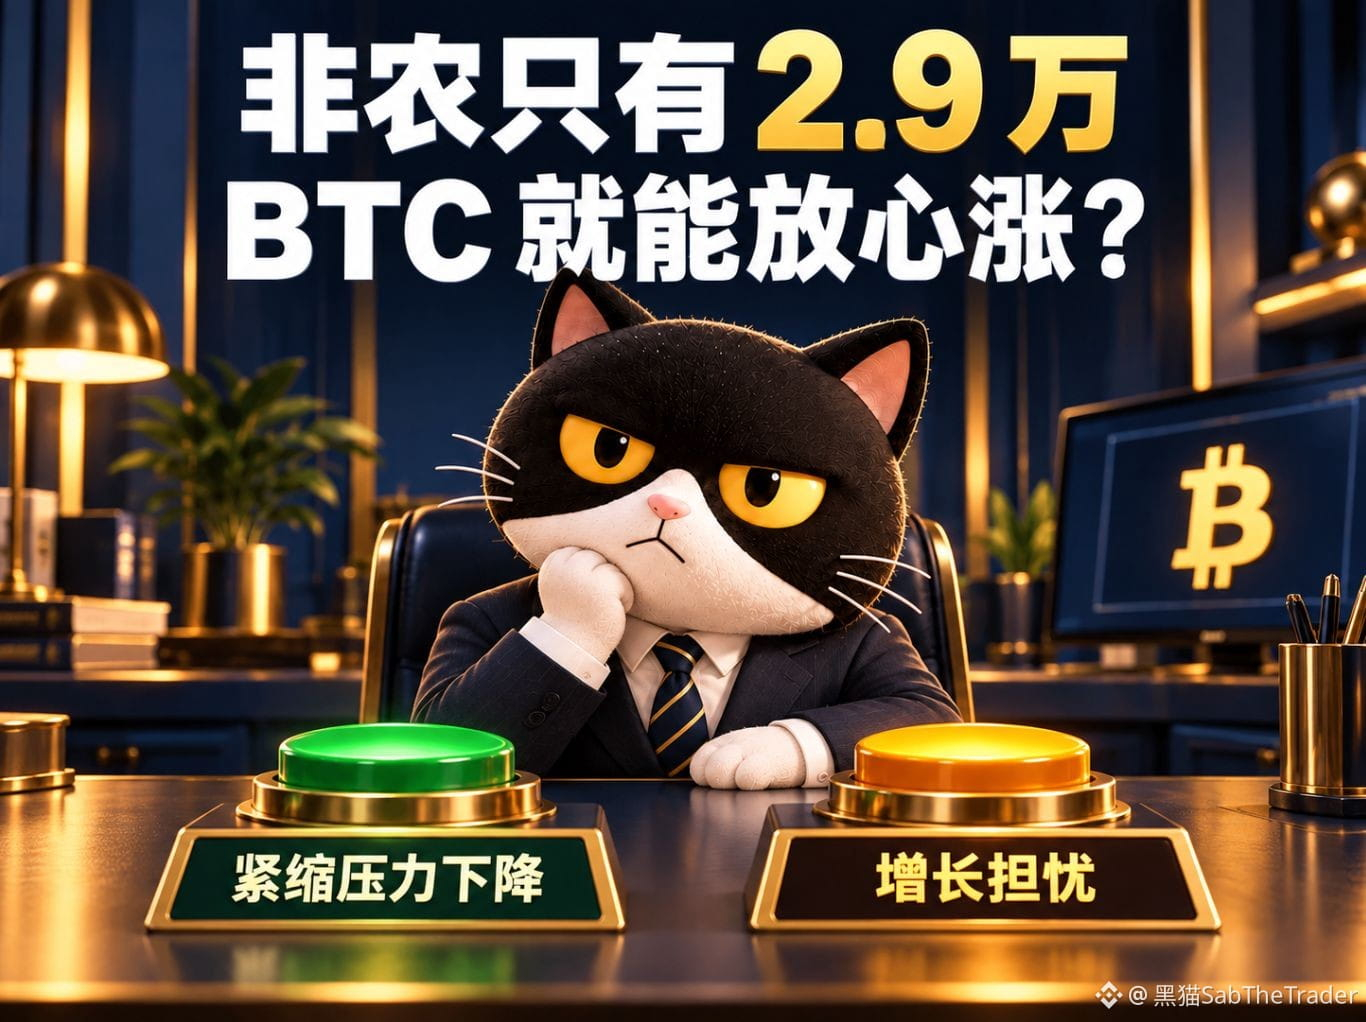
Only 29,000 in nonfarm payrolls—can the crypto market feel safe to surge? 👀
Last night, the U.S. September nonfarm payrolls added only 29,000 jobs, clearly below Reuters’ survey expectation of 90,000. Even more noteworthy, the combined data for July and August was revised down by another 60,000.
Seeing this, many people’s first reaction might be: employment is weakening, the Fed should cut rates—<a>$BTC </a> is bullish.
I think that conclusion is a step too fast.
Nonfarm payrolls can be understood as how many non-agricultural jobs the U.S. added this month. The low number of new jobs suggests hiring momentum is weak. The downward revisions from the prior two months also remind us that the employment picture we initially saw was not as strong as first reported.
Wages are also cooling: average hourly earnings rose only 0.1% month over month, and 3.0% year over year. Slower wage growth means inflation pressure driven by wages may be easing.
The issue is that the Fed also looks at prices of goods, housing, energy, and more. A cooling labor market may influence policy thinking, but a single nonfarm report is not enough to directly conclude that the Fed will definitely cut rates next.
For crypto, in the short term, you can watch whether rate-hike worries ease. Over a longer horizon, we need to see whether weaker employment gradually affects consumption and corporate earnings.
With the same weak data, the market might first price in falling tightening pressure, or it might later start worrying about economic growth. The timing and strength of these two effects still need to be observed.
Next, I’m going to shift my focus back to price:
If BTC can break above the recent high, and after a pullback it continues to hold, then there’s more reason to monitor whether the uptrend can extend. Give a reason with the news, and get confirmation from follow-through.
If it spikes higher and then falls back into the previous consolidation range, and the rebound still can’t get back on track, I’ll lower my expectations for the impact of this news. Especially when chasing with futures— even if your direction is right, you might still get swept out by volatility. 🙈
Also, the unemployment rate of 4.2% by itself can’t directly be read as “the U.S. economy suddenly collapsing.” The official report notes that since March, the unemployment rate has stayed in a narrow range of 4.1% to 4.3%.
So this time I’m more inclined to interpret it as: employment is adding more caution to continued tightening, and we’ll need to keep watching the inflation data and overall price performance afterward.
Do you think this nonfarm report can provide sustained momentum for BTC, or is it only enough for a short-term swing of sentiment?
*NFA, DYOR
#非农就业数据
Only 29,000 in nonfarm payrolls—can the crypto market feel safe to surge? 👀
Last night, the U.S. September nonfarm payrolls added only 29,000 jobs, clearly below Reuters’ survey expectation of 90,000. Even more noteworthy, the combined data for July and August was revised down by another 60,000.
Seeing this, many people’s first reaction might be: employment is weakening, the Fed should cut rates—<a>$BTC </a> is bullish.
I think that conclusion is a step too fast.
Nonfarm payrolls can be understood as how many non-agricultural jobs the U.S. added this month. The low number of new jobs suggests hiring momentum is weak. The downward revisions from the prior two months also remind us that the employment picture we initially saw was not as strong as first reported.
Wages are also cooling: average hourly earnings rose only 0.1% month over month, and 3.0% year over year. Slower wage growth means inflation pressure driven by wages may be easing.
The issue is that the Fed also looks at prices of goods, housing, energy, and more. A cooling labor market may influence policy thinking, but a single nonfarm report is not enough to directly conclude that the Fed will definitely cut rates next.
For crypto, in the short term, you can watch whether rate-hike worries ease. Over a longer horizon, we need to see whether weaker employment gradually affects consumption and corporate earnings.
With the same weak data, the market might first price in falling tightening pressure, or it might later start worrying about economic growth. The timing and strength of these two effects still need to be observed.
Next, I’m going to shift my focus back to price:
If BTC can break above the recent high, and after a pullback it continues to hold, then there’s more reason to monitor whether the uptrend can extend. Give a reason with the news, and get confirmation from follow-through.
If it spikes higher and then falls back into the previous consolidation range, and the rebound still can’t get back on track, I’ll lower my expectations for the impact of this news. Especially when chasing with futures— even if your direction is right, you might still get swept out by volatility. 🙈
Also, the unemployment rate of 4.2% by itself can’t directly be read as “the U.S. economy suddenly collapsing.” The official report notes that since March, the unemployment rate has stayed in a narrow range of 4.1% to 4.3%.
So this time I’m more inclined to interpret it as: employment is adding more caution to continued tightening, and we’ll need to keep watching the inflation data and overall price performance afterward.
Do you think this nonfarm report can provide sustained momentum for BTC, or is it only enough for a short-term swing of sentiment?
*NFA, DYOR
#非农就业数据
Last night, the U.S. September nonfarm payrolls added only 29,000 jobs, clearly below Reuters’ survey expectation of 90,000. Even more noteworthy, the combined data for July and August was revised down by another 60,000.
Seeing this, many people’s first reaction might be: employment is weakening, the Fed should cut rates—<a>$BTC </a> is bullish.
I think that conclusion is a step too fast.
Nonfarm payrolls can be understood as how many non-agricultural jobs the U.S. added this month. The low number of new jobs suggests hiring momentum is weak. The downward revisions from the prior two months also remind us that the employment picture we initially saw was not as strong as first reported.
Wages are also cooling: average hourly earnings rose only 0.1% month over month, and 3.0% year over year. Slower wage growth means inflation pressure driven by wages may be easing.
The issue is that the Fed also looks at prices of goods, housing, energy, and more. A cooling labor market may influence policy thinking, but a single nonfarm report is not enough to directly conclude that the Fed will definitely cut rates next.
For crypto, in the short term, you can watch whether rate-hike worries ease. Over a longer horizon, we need to see whether weaker employment gradually affects consumption and corporate earnings.
With the same weak data, the market might first price in falling tightening pressure, or it might later start worrying about economic growth. The timing and strength of these two effects still need to be observed.
Next, I’m going to shift my focus back to price:
If BTC can break above the recent high, and after a pullback it continues to hold, then there’s more reason to monitor whether the uptrend can extend. Give a reason with the news, and get confirmation from follow-through.
If it spikes higher and then falls back into the previous consolidation range, and the rebound still can’t get back on track, I’ll lower my expectations for the impact of this news. Especially when chasing with futures— even if your direction is right, you might still get swept out by volatility. 🙈
Also, the unemployment rate of 4.2% by itself can’t directly be read as “the U.S. economy suddenly collapsing.” The official report notes that since March, the unemployment rate has stayed in a narrow range of 4.1% to 4.3%.
So this time I’m more inclined to interpret it as: employment is adding more caution to continued tightening, and we’ll need to keep watching the inflation data and overall price performance afterward.
Do you think this nonfarm report can provide sustained momentum for BTC, or is it only enough for a short-term swing of sentiment?
*NFA, DYOR
#非农就业数据
1
1
244

@奋斗Hustle1688
is speaking[LIVE] 🎙️ DCA into BNB and research Binance wealth management
1.8k listens
76
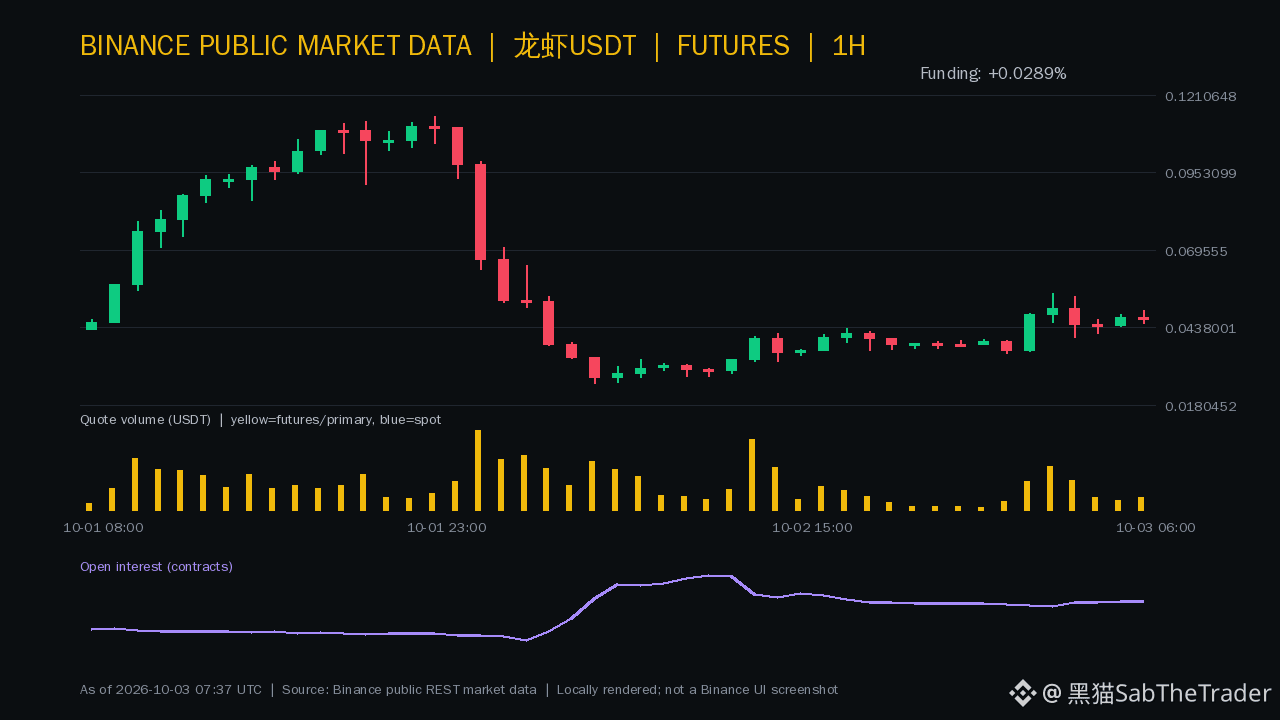
After a more than 70% daily rise, the market began to shift from a one-way surge to high-level churning. The publicly available Binance data at 15:36 (UTC+8) shows that $Lobster perpetuals still rose 76.93% over the past 24 hours, with trading volume of about 490 million USDT; however, in the last four complete hours it has fallen by 6.66%.
From the previous complete hour, the price went from 0.04705 down to 0.04693, a decline of 0.26%, yet trading volume increased by 29.13% month-over-month. With price not pushing higher on the increased volume, it suggests that divergence at high levels is growing. This instrument has only perpetuals—there is no spot order flow for cross-confirmation.
⚠️ The most recent OI (open interest) over the last hour has decreased by 0.11%, while the 30-point window still increased by 46.12%. The Funding indicator value is +0.0286%, and the most recent realized funding is +0.0358%. Medium-term leverage has clearly been built up, but new short-term positioning has already stopped; the risk-reward for chasing higher prices is not favorable.
I’ll first look at the previous complete hour’s 0.04510–0.04933 range. If it reclaims 0.04933 and trading volume remains sustained, that would indicate that there is still follow-through after the pullback. If it breaks below 0.04510 and OI continues to contract, it looks more like de-leveraging at high levels. The current hour has not closed yet, so an intraday bounce cannot replace confirmation.
After a more than 70% daily rise, the market began to shift from a one-way surge to high-level churning. The publicly available Binance data at 15:36 (UTC+8) shows that $Lobster perpetuals still rose 76.93% over the past 24 hours, with trading volume of about 490 million USDT; however, in the last four complete hours it has fallen by 6.66%.
From the previous complete hour, the price went from 0.04705 down to 0.04693, a decline of 0.26%, yet trading volume increased by 29.13% month-over-month. With price not pushing higher on the increased volume, it suggests that divergence at high levels is growing. This instrument has only perpetuals—there is no spot order flow for cross-confirmation.
⚠️ The most recent OI (open interest) over the last hour has decreased by 0.11%, while the 30-point window still increased by 46.12%. The Funding indicator value is +0.0286%, and the most recent realized funding is +0.0358%. Medium-term leverage has clearly been built up, but new short-term positioning has already stopped; the risk-reward for chasing higher prices is not favorable.
I’ll first look at the previous complete hour’s 0.04510–0.04933 range. If it reclaims 0.04933 and trading volume remains sustained, that would indicate that there is still follow-through after the pullback. If it breaks below 0.04510 and OI continues to contract, it looks more like de-leveraging at high levels. The current hour has not closed yet, so an intraday bounce cannot replace confirmation.
From the previous complete hour, the price went from 0.04705 down to 0.04693, a decline of 0.26%, yet trading volume increased by 29.13% month-over-month. With price not pushing higher on the increased volume, it suggests that divergence at high levels is growing. This instrument has only perpetuals—there is no spot order flow for cross-confirmation.
⚠️ The most recent OI (open interest) over the last hour has decreased by 0.11%, while the 30-point window still increased by 46.12%. The Funding indicator value is +0.0286%, and the most recent realized funding is +0.0358%. Medium-term leverage has clearly been built up, but new short-term positioning has already stopped; the risk-reward for chasing higher prices is not favorable.
I’ll first look at the previous complete hour’s 0.04510–0.04933 range. If it reclaims 0.04933 and trading volume remains sustained, that would indicate that there is still follow-through after the pullback. If it breaks below 0.04510 and OI continues to contract, it looks more like de-leveraging at high levels. The current hour has not closed yet, so an intraday bounce cannot replace confirmation.
750
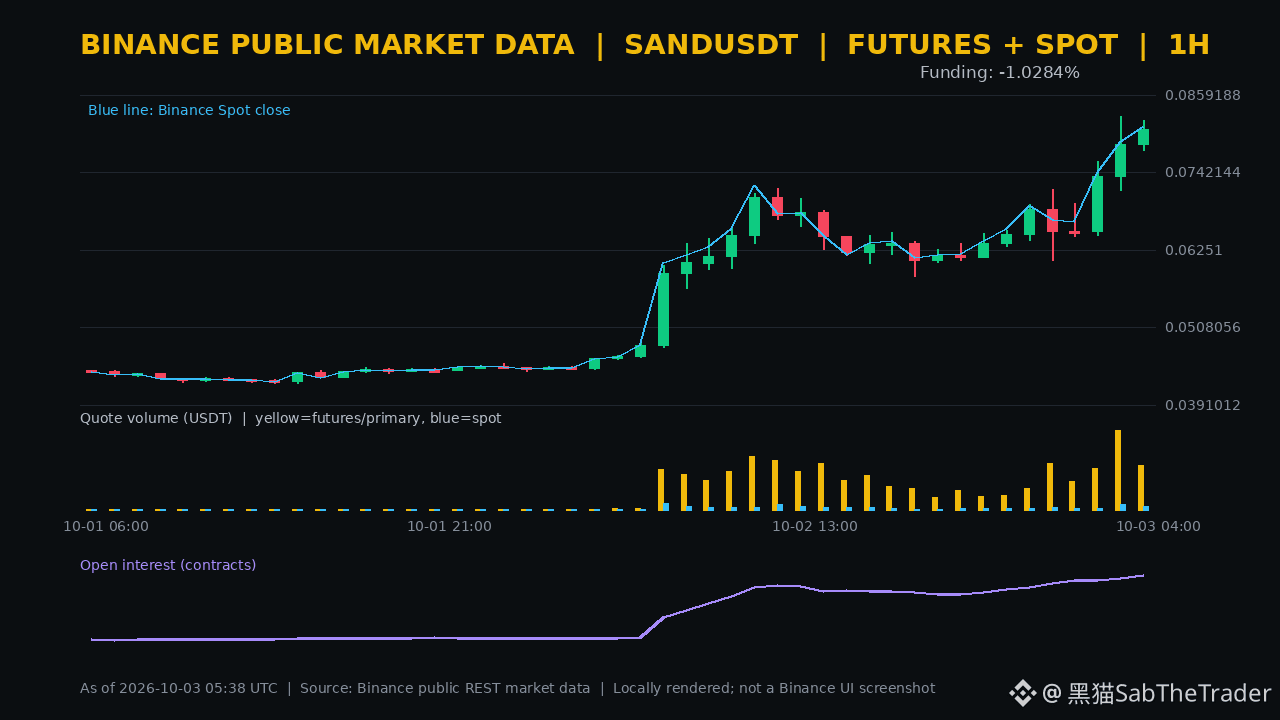
In a 24-hour market that’s nearly doubling, treating a single indicator as the answer for direction is more dangerous than the volatility itself. According to public Binance data at 13:37 (UTC+8), spot and perpetual contracts for $SAND are up 69.91% and 68.82% respectively, with perpetual trading volume of about 1.258 billion USDT.
The previous complete 1-hour period saw price rise from 0.07851 to 0.08070, up 2.79%, but that hour’s trading value fell 43.97% month-over-month; over the past 4 hours it’s still up 23.58%. The rally is still ongoing, but short-term volume momentum has clearly declined. Follow-through at the highs needs further confirmation.
⚠️ Quantity OI increased 3.74% over the most recent hour, with a 30-point window gain of 164.70%. The Funding indicator value is -1.0318%, while the most recent realized settlement is -0.7058%. This suggests leverage and long/short disagreement are both extremely high—but quantity OI doesn’t clearly show net long or net short, and deeply negative Funding does not necessarily mean price will keep rising.
I’m watching the 0.07754—0.08200 range first. If price reclaims 0.08200 and trading activity picks up, there will be grounds to believe the strong structure can continue; if it breaks below 0.07754 and is accompanied by OI contraction, it’s more like deleveraging at elevated levels. The current hour hasn’t closed yet, so don’t substitute intrahour pullbacks for a full candlestick confirmation.
In a 24-hour market that’s nearly doubling, treating a single indicator as the answer for direction is more dangerous than the volatility itself. According to public Binance data at 13:37 (UTC+8), spot and perpetual contracts for $SAND are up 69.91% and 68.82% respectively, with perpetual trading volume of about 1.258 billion USDT.
The previous complete 1-hour period saw price rise from 0.07851 to 0.08070, up 2.79%, but that hour’s trading value fell 43.97% month-over-month; over the past 4 hours it’s still up 23.58%. The rally is still ongoing, but short-term volume momentum has clearly declined. Follow-through at the highs needs further confirmation.
⚠️ Quantity OI increased 3.74% over the most recent hour, with a 30-point window gain of 164.70%. The Funding indicator value is -1.0318%, while the most recent realized settlement is -0.7058%. This suggests leverage and long/short disagreement are both extremely high—but quantity OI doesn’t clearly show net long or net short, and deeply negative Funding does not necessarily mean price will keep rising.
I’m watching the 0.07754—0.08200 range first. If price reclaims 0.08200 and trading activity picks up, there will be grounds to believe the strong structure can continue; if it breaks below 0.07754 and is accompanied by OI contraction, it’s more like deleveraging at elevated levels. The current hour hasn’t closed yet, so don’t substitute intrahour pullbacks for a full candlestick confirmation.
The previous complete 1-hour period saw price rise from 0.07851 to 0.08070, up 2.79%, but that hour’s trading value fell 43.97% month-over-month; over the past 4 hours it’s still up 23.58%. The rally is still ongoing, but short-term volume momentum has clearly declined. Follow-through at the highs needs further confirmation.
⚠️ Quantity OI increased 3.74% over the most recent hour, with a 30-point window gain of 164.70%. The Funding indicator value is -1.0318%, while the most recent realized settlement is -0.7058%. This suggests leverage and long/short disagreement are both extremely high—but quantity OI doesn’t clearly show net long or net short, and deeply negative Funding does not necessarily mean price will keep rising.
I’m watching the 0.07754—0.08200 range first. If price reclaims 0.08200 and trading activity picks up, there will be grounds to believe the strong structure can continue; if it breaks below 0.07754 and is accompanied by OI contraction, it’s more like deleveraging at elevated levels. The current hour hasn’t closed yet, so don’t substitute intrahour pullbacks for a full candlestick confirmation.
1
810

Sofi紫藤
·
--
红包雨🧧🧧🧧周末快乐
The market is never wrong; your bias is.
The market will never be wrong; what’s wrong is your subjective bias.
#币安广场
The market is never wrong; your bias is.
The market will never be wrong; what’s wrong is your subjective bias.
#币安广场

155

CJ_GraceWang1688
·
--
🎁🎁🎁
$BTC
#比特币资金费率升至10%未平仓合约回升
Short-term bias: bullish. Prices are rising alongside a rebound in open interest. Funding rates have risen to around 10% annualized, indicating that new leveraged long positions are covering from lower levels and supporting the market. However, the rate has only returned to the normal benchmark range rather than reaching extreme crowding levels, so this alone cannot be used to conclude that prices will definitely keep rising. During pullbacks, long liquidations are also likely to be triggered.
$BTC
#比特币资金费率升至10%未平仓合约回升
Short-term bias: bullish. Prices are rising alongside a rebound in open interest. Funding rates have risen to around 10% annualized, indicating that new leveraged long positions are covering from lower levels and supporting the market. However, the rate has only returned to the normal benchmark range rather than reaching extreme crowding levels, so this alone cannot be used to conclude that prices will definitely keep rising. During pullbacks, long liquidations are also likely to be triggered.
1
70

乘风Sunshine
·
--
The essence of trading is simply waiting for the flowers to bloom. When you’ve watched the order book and the candlestick charts long enough, you know where things will rise and where they’ll fall—everyone has that figured out. What’s hard is that most people just want the flowers to open immediately, to enter the market immediately, without the patience to wait for the season when they bloom. Their money either comes with a high price tag or ongoing costs, or it’s just waiting to pay rent and buy meals. So they can’t wait for the blooming season; they end up becoming fertilizer for the flowers too soon—turning into liquidity in the market itself and losing all their chips.

1
157
Binance has extended its USD1 airdrop campaign again. This time, the prize pool has been increased to 150 million tokens ($WLFI +), with a maximum of 2.5 million tokens ($USD1 ).👀
The activity began on October 2 and is split into two phases:
First phase: October 2 ~ October 16
👉 75 million WLFI
Second phase: October 16 ~ October 30
👉 75 million WLFI + up to 2.5 million USD1
Eligible users only need to hold USD1 in a Binance-supported account to participate according to the rules. Rewards are distributed once per week.
150 million WLFI is pretty wild. Based on the current approximate price of WLFI at about $0.055, it’s worth around $8.2 million. On top of that, with the second phase’s maximum additional 2.5 million USD1, the overall scale of the campaign is indeed significant.
That said, there are two sides to look at:
🟢 For USD1:
The most direct effect of this campaign is to attract people to buy and hold USD1.
To receive the weekly rewards, funds need to stay in USD1. This helps with USD1’s holdings, trading volume, and use cases.
🟡 For WLFI:
The campaign will bring exposure and attention to WLFI, but these rewards will be sent directly to users’ spot accounts every week.
In other words, there’s attention from the airdrop theme on one side, but on the other side you also need to consider potential selling that may happen after users receive the rewards.
So I won’t automatically interpret a “150 million WLFI airdrop” as meaning that WLFI must go up.
The market reaction so far has also been fairly mild—WLFI hasn’t seen a clear immediate surge due to this announcement.
Next, I’ll focus on two things:
① Whether there’s a noticeable increase in USD1 funds and trading volume
② After the weekly WLFI distribution, whether the price can withstand the additional selling pressure
Also, the full participation rules for the second phase have not been published yet. Binance will update them on October 16 or before. If the second phase adds more extra reward mechanisms, that might be the next time worth paying attention.
At this stage, I feel this is more like Binance continuing to route users toward the USD1 + WLFI ecosystem.
Do you think this 150 million WLFI airdrop is good news or selling pressure for $WLFI ?
{future}(WLFIUSDT)
Binance has extended its USD1 airdrop campaign again. This time, the prize pool has been increased to 150 million tokens ($WLFI +), with a maximum of 2.5 million tokens ($USD1 ).👀
The activity began on October 2 and is split into two phases:
First phase: October 2 ~ October 16
👉 75 million WLFI
Second phase: October 16 ~ October 30
👉 75 million WLFI + up to 2.5 million USD1
Eligible users only need to hold USD1 in a Binance-supported account to participate according to the rules. Rewards are distributed once per week.
150 million WLFI is pretty wild. Based on the current approximate price of WLFI at about $0.055, it’s worth around $8.2 million. On top of that, with the second phase’s maximum additional 2.5 million USD1, the overall scale of the campaign is indeed significant.
That said, there are two sides to look at:
🟢 For USD1:
The most direct effect of this campaign is to attract people to buy and hold USD1.
To receive the weekly rewards, funds need to stay in USD1. This helps with USD1’s holdings, trading volume, and use cases.
🟡 For WLFI:
The campaign will bring exposure and attention to WLFI, but these rewards will be sent directly to users’ spot accounts every week.
In other words, there’s attention from the airdrop theme on one side, but on the other side you also need to consider potential selling that may happen after users receive the rewards.
So I won’t automatically interpret a “150 million WLFI airdrop” as meaning that WLFI must go up.
The market reaction so far has also been fairly mild—WLFI hasn’t seen a clear immediate surge due to this announcement.
Next, I’ll focus on two things:
① Whether there’s a noticeable increase in USD1 funds and trading volume
② After the weekly WLFI distribution, whether the price can withstand the additional selling pressure
Also, the full participation rules for the second phase have not been published yet. Binance will update them on October 16 or before. If the second phase adds more extra reward mechanisms, that might be the next time worth paying attention.
At this stage, I feel this is more like Binance continuing to route users toward the USD1 + WLFI ecosystem.
Do you think this 150 million WLFI airdrop is good news or selling pressure for $WLFI ?
The activity began on October 2 and is split into two phases:
First phase: October 2 ~ October 16
👉 75 million WLFI
Second phase: October 16 ~ October 30
👉 75 million WLFI + up to 2.5 million USD1
Eligible users only need to hold USD1 in a Binance-supported account to participate according to the rules. Rewards are distributed once per week.
150 million WLFI is pretty wild. Based on the current approximate price of WLFI at about $0.055, it’s worth around $8.2 million. On top of that, with the second phase’s maximum additional 2.5 million USD1, the overall scale of the campaign is indeed significant.
That said, there are two sides to look at:
🟢 For USD1:
The most direct effect of this campaign is to attract people to buy and hold USD1.
To receive the weekly rewards, funds need to stay in USD1. This helps with USD1’s holdings, trading volume, and use cases.
🟡 For WLFI:
The campaign will bring exposure and attention to WLFI, but these rewards will be sent directly to users’ spot accounts every week.
In other words, there’s attention from the airdrop theme on one side, but on the other side you also need to consider potential selling that may happen after users receive the rewards.
So I won’t automatically interpret a “150 million WLFI airdrop” as meaning that WLFI must go up.
The market reaction so far has also been fairly mild—WLFI hasn’t seen a clear immediate surge due to this announcement.
Next, I’ll focus on two things:
① Whether there’s a noticeable increase in USD1 funds and trading volume
② After the weekly WLFI distribution, whether the price can withstand the additional selling pressure
Also, the full participation rules for the second phase have not been published yet. Binance will update them on October 16 or before. If the second phase adds more extra reward mechanisms, that might be the next time worth paying attention.
At this stage, I feel this is more like Binance continuing to route users toward the USD1 + WLFI ecosystem.
Do you think this 150 million WLFI airdrop is good news or selling pressure for $WLFI ?
1
1
226
CJ_GraceWang1688
·
--
When Non-Farm Payrolls hits, does the big BTC really flip the market? The data may not be that obedient.
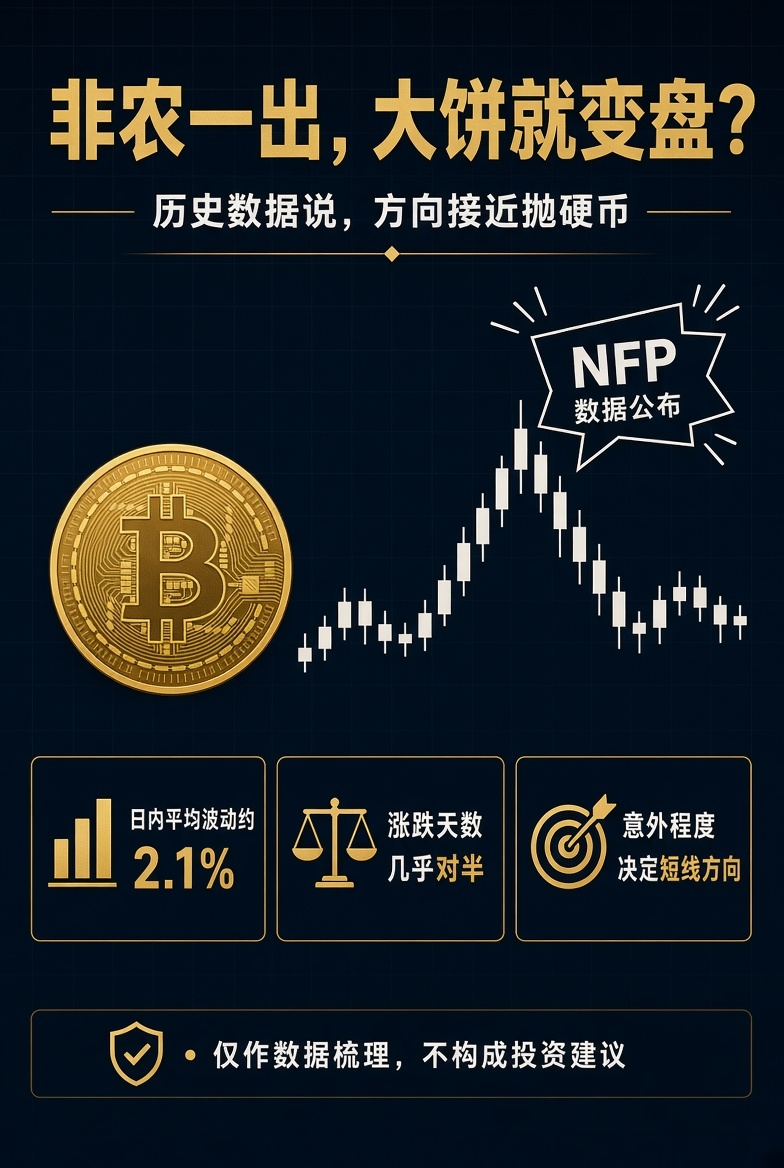
U.S. Non-Farm Payrolls are released once a month—12 times a year—usually on the first Friday of the month. Many people treat it like a “market switch” for Bitcoin, but history isn’t that straightforward.
CoinDesk analyzed about 79 Non-Farm release days since 2020: the intraday average volatility on BTC days is about 2.1%, roughly the same as a typical trading day; the number of up and down days is almost evenly split—39 up and 40 down. The direction is close to a coin toss.
What actually tends to amplify volatility is how surprising the data is relative to expectations—not the numbers themselves:
· Much stronger than expected: the U.S. dollar and Treasury yields rise, rate-cut expectations cool, and price action leans downward in the short term
· Roughly in line with expectations: after a quick spike, it often returns to the original trend
· Much weaker than expected: tighter-policy expectations ease, price action leans upward in the short term; if it’s weak enough to trigger recession fears, it may even rise first and then fall
The short-term window is more sensitive. In the first 30 minutes after release, the median price move is about 2x the usual. Extreme moves have happened too: during the 2022 bear market, one Non-Farm day saw BTC rise about 11.4%, and the next one fell about 7.8%.
Non-Farm is more like a trigger, not a direction playbook. The size depends on the magnitude of the surprise, the rate expectations at the time, and how crowded the contract leverage is. Volatility is typically highest within minutes to half an hour after the release, and then reverse spikes often follow.
The above is for data compilation only and does not constitute investment advice.
#比特币 #NonFarm #BTC #比特币升至8.5万美元附近
U.S. Non-Farm Payrolls are released once a month—12 times a year—usually on the first Friday of the month. Many people treat it like a “market switch” for Bitcoin, but history isn’t that straightforward.
CoinDesk analyzed about 79 Non-Farm release days since 2020: the intraday average volatility on BTC days is about 2.1%, roughly the same as a typical trading day; the number of up and down days is almost evenly split—39 up and 40 down. The direction is close to a coin toss.
What actually tends to amplify volatility is how surprising the data is relative to expectations—not the numbers themselves:
· Much stronger than expected: the U.S. dollar and Treasury yields rise, rate-cut expectations cool, and price action leans downward in the short term
· Roughly in line with expectations: after a quick spike, it often returns to the original trend
· Much weaker than expected: tighter-policy expectations ease, price action leans upward in the short term; if it’s weak enough to trigger recession fears, it may even rise first and then fall
The short-term window is more sensitive. In the first 30 minutes after release, the median price move is about 2x the usual. Extreme moves have happened too: during the 2022 bear market, one Non-Farm day saw BTC rise about 11.4%, and the next one fell about 7.8%.
Non-Farm is more like a trigger, not a direction playbook. The size depends on the magnitude of the surprise, the rate expectations at the time, and how crowded the contract leverage is. Volatility is typically highest within minutes to half an hour after the release, and then reverse spikes often follow.
The above is for data compilation only and does not constitute investment advice.
#比特币 #NonFarm #BTC #比特币升至8.5万美元附近
98
Tonight at 21:00, I’ll be going live on the square for the first time for a formal stream.🐱
After thinking for a long time, I’ve finally decided to bring my usual night trading process straight into the livestream.
I’ll mainly cover:
📈 Live trading of the Nasdaq $QQQB & S&P 500 $SPYB
📝 Pre-market plan / waiting for setups / entry and exit ideas
🔍 A simple recap after the trading session
If the Nasdaq session ends early, I’ll also take a look at $BTC , ETH, and the cryptocurrency market that night.
I’d really like everyone to see what a real night looks like for a full-time trader: if there’s a good opportunity, I’ll take it—if not, I’ll wait. Profits will be shown, and losses will be shown as well.
The livestream will be mainly in Chinese, and English交流 is also welcome.
Bilingual | CN / EN
Since it’s my first time going live, I guess there will still be quite a few things that need adjusting while I’m streaming 😂
If you’re around tonight on the square, feel free to drop by the livestream, chat, and watch the charts. And all seniors are also welcome to come support and offer guidance.
🕘 Tonight at 21:00
🔴《A Full-Time Trader’s Night|Nasdaq Live Trading Stream》
See you tonight.🐱
Tonight at 21:00, I’ll be going live on the square for the first time for a formal stream.🐱
After thinking for a long time, I’ve finally decided to bring my usual night trading process straight into the livestream.
I’ll mainly cover:
📈 Live trading of the Nasdaq $QQQB & S&P 500 $SPYB
📝 Pre-market plan / waiting for setups / entry and exit ideas
🔍 A simple recap after the trading session
If the Nasdaq session ends early, I’ll also take a look at $BTC , ETH, and the cryptocurrency market that night.
I’d really like everyone to see what a real night looks like for a full-time trader: if there’s a good opportunity, I’ll take it—if not, I’ll wait. Profits will be shown, and losses will be shown as well.
The livestream will be mainly in Chinese, and English交流 is also welcome.
Bilingual | CN / EN
Since it’s my first time going live, I guess there will still be quite a few things that need adjusting while I’m streaming 😂
If you’re around tonight on the square, feel free to drop by the livestream, chat, and watch the charts. And all seniors are also welcome to come support and offer guidance.
🕘 Tonight at 21:00
🔴《A Full-Time Trader’s Night|Nasdaq Live Trading Stream》
See you tonight.🐱
After thinking for a long time, I’ve finally decided to bring my usual night trading process straight into the livestream.
I’ll mainly cover:
📈 Live trading of the Nasdaq $QQQB & S&P 500 $SPYB
📝 Pre-market plan / waiting for setups / entry and exit ideas
🔍 A simple recap after the trading session
If the Nasdaq session ends early, I’ll also take a look at $BTC , ETH, and the cryptocurrency market that night.
I’d really like everyone to see what a real night looks like for a full-time trader: if there’s a good opportunity, I’ll take it—if not, I’ll wait. Profits will be shown, and losses will be shown as well.
The livestream will be mainly in Chinese, and English交流 is also welcome.
Bilingual | CN / EN
Since it’s my first time going live, I guess there will still be quite a few things that need adjusting while I’m streaming 😂
If you’re around tonight on the square, feel free to drop by the livestream, chat, and watch the charts. And all seniors are also welcome to come support and offer guidance.
🕘 Tonight at 21:00
🔴《A Full-Time Trader’s Night|Nasdaq Live Trading Stream》
See you tonight.🐱

1.5k
14
72
1.5k
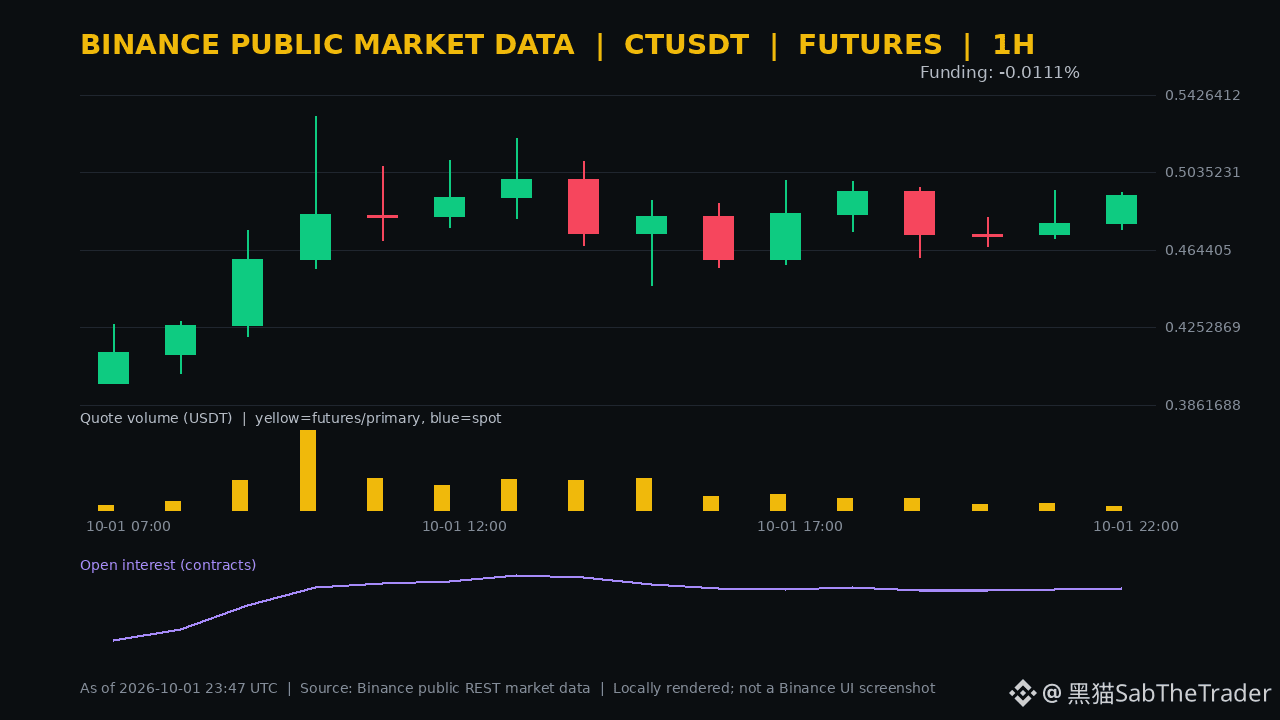
After the new contract went live, the market reaction was no longer just a spike beyond the first K-line. Public data from Binance at 07:46 (UTC+8) shows that $CT perpetual is at 0.49435, up 24.53% in 24 hours, with trading volume of roughly 104 million USDT; the official CT Alpha trading contest has also been launched.
In the previous full hour, the price rose from 0.47754 to 0.49204, up 3.04%, but the hourly trading volume compared with the prior hour fell by 42.07%. Over the past 4 hours, it even dipped slightly by 0.35%. Price remains strong, yet short-term volume has not expanded in step—this mismatch is the main divergence that needs to be watched.
📌 OI (open interest) has increased by 2.16% in the last hour, and within a 30-point window the growth rate reaches 759.74%. The Funding indicator value is -0.0105%, while the most recent actual settlement is -0.0063%. However, this is a new contract: since OI is measured from a low base, you cannot simply equate a 759% increase with sustained accumulation typical of mature contracts, nor can you infer the direction of newly added positions from this alone.
I’ll first see whether it can hold above the 0.49364 area. If price stays above it and trading volume expands again, then the event’s momentum may continue to translate into a trend. If it breaks below 0.47467 while OI contracts, it looks more like the de-risking phase after a rapid leverage build-up in the early stage of the listing. CT does not have Binance spot; the Alpha trading and the USDT perpetual should also be understood separately.
After the new contract went live, the market reaction was no longer just a spike beyond the first K-line. Public data from Binance at 07:46 (UTC+8) shows that $CT perpetual is at 0.49435, up 24.53% in 24 hours, with trading volume of roughly 104 million USDT; the official CT Alpha trading contest has also been launched.
In the previous full hour, the price rose from 0.47754 to 0.49204, up 3.04%, but the hourly trading volume compared with the prior hour fell by 42.07%. Over the past 4 hours, it even dipped slightly by 0.35%. Price remains strong, yet short-term volume has not expanded in step—this mismatch is the main divergence that needs to be watched.
📌 OI (open interest) has increased by 2.16% in the last hour, and within a 30-point window the growth rate reaches 759.74%. The Funding indicator value is -0.0105%, while the most recent actual settlement is -0.0063%. However, this is a new contract: since OI is measured from a low base, you cannot simply equate a 759% increase with sustained accumulation typical of mature contracts, nor can you infer the direction of newly added positions from this alone.
I’ll first see whether it can hold above the 0.49364 area. If price stays above it and trading volume expands again, then the event’s momentum may continue to translate into a trend. If it breaks below 0.47467 while OI contracts, it looks more like the de-risking phase after a rapid leverage build-up in the early stage of the listing. CT does not have Binance spot; the Alpha trading and the USDT perpetual should also be understood separately.
In the previous full hour, the price rose from 0.47754 to 0.49204, up 3.04%, but the hourly trading volume compared with the prior hour fell by 42.07%. Over the past 4 hours, it even dipped slightly by 0.35%. Price remains strong, yet short-term volume has not expanded in step—this mismatch is the main divergence that needs to be watched.
📌 OI (open interest) has increased by 2.16% in the last hour, and within a 30-point window the growth rate reaches 759.74%. The Funding indicator value is -0.0105%, while the most recent actual settlement is -0.0063%. However, this is a new contract: since OI is measured from a low base, you cannot simply equate a 759% increase with sustained accumulation typical of mature contracts, nor can you infer the direction of newly added positions from this alone.
I’ll first see whether it can hold above the 0.49364 area. If price stays above it and trading volume expands again, then the event’s momentum may continue to translate into a trend. If it breaks below 0.47467 while OI contracts, it looks more like the de-risking phase after a rapid leverage build-up in the early stage of the listing. CT does not have Binance spot; the Alpha trading and the USDT perpetual should also be understood separately.
514
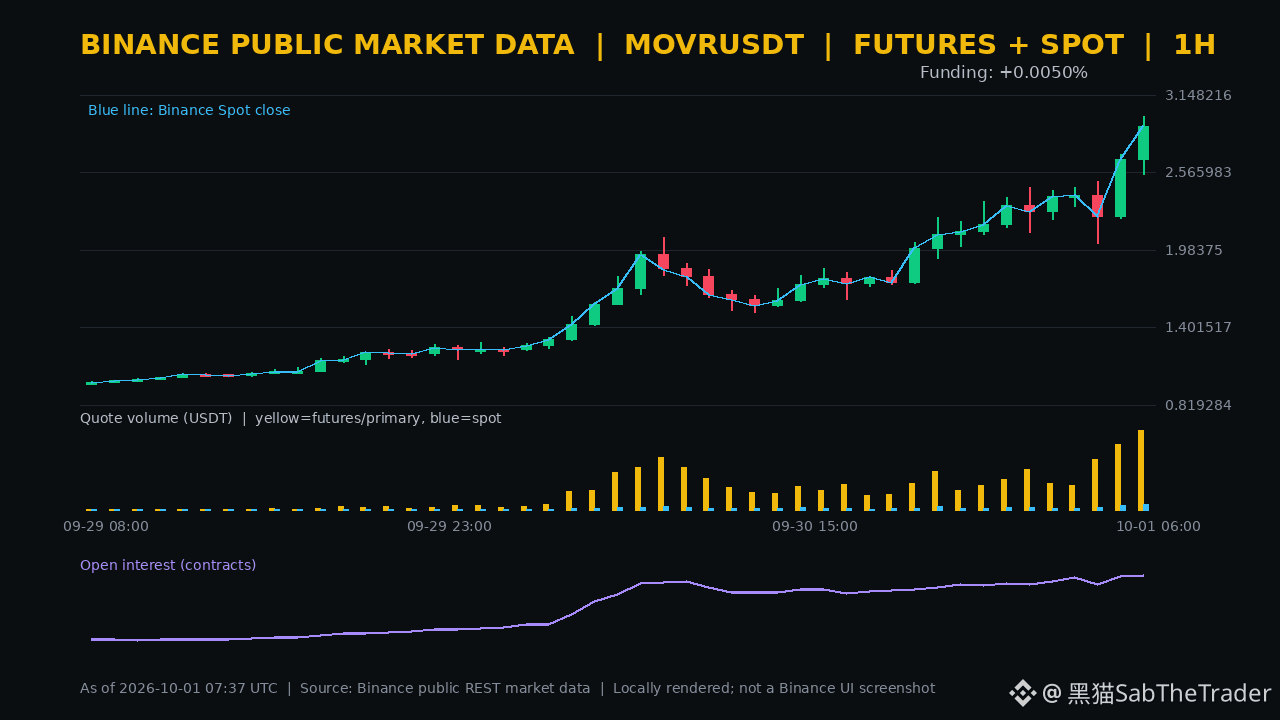
The second acceleration after the pullback has already formed a complete one-hour candlestick. According to Binance’s public data at 15:37 (UTC+8), $MOVR spot is quoted at 2.888, up 76.53% over the past 24 hours. Perpetuals are at 2.9034, up 76.13% over the past 24 hours, with perpetuals’ 24-hour trading volume of roughly 1.196 billion USDT.
The previous complete 1-hour period rose from 2.6644 to 2.9136, up 9.35%. The intrahour high was 2.9876. Trading volume during that hour was about 118 million USDT, an increase of 21.23% month-over-month. Over the past 4 hours, prices have gained 22.19%, indicating this is not just intraday whipsaw—it’s the reappearance of price expansion alongside rising volume after the pullback.
📌 OI (open interest) Quantity: Over the most recent hour, it increased by 1.25%; within a 30-point window, it accumulated an increase of 132.56%. The Funding indicator value and the most recent actual settlement are both +0.0050%. Price acceleration and a significant lift in the positioning “base” are evident, but the funding rate has not yet moved into extremely positive territory. OI alone can only show that the number of contracts has increased; it cannot determine the direction of the newly added positions.
I regard 2.9876 as a continuation confirmation level. Only if the market reaccumulates volume and breaks above this hour’s high, and OI expands in a steady, not out-of-control manner, would that support further probing higher. If price falls back below 2.5514 while OI contracts at the same time, then after a failed second acceleration, the risk of deleveraging would take priority over chasing the breakout.
The second acceleration after the pullback has already formed a complete one-hour candlestick. According to Binance’s public data at 15:37 (UTC+8), $MOVR spot is quoted at 2.888, up 76.53% over the past 24 hours. Perpetuals are at 2.9034, up 76.13% over the past 24 hours, with perpetuals’ 24-hour trading volume of roughly 1.196 billion USDT.
The previous complete 1-hour period rose from 2.6644 to 2.9136, up 9.35%. The intrahour high was 2.9876. Trading volume during that hour was about 118 million USDT, an increase of 21.23% month-over-month. Over the past 4 hours, prices have gained 22.19%, indicating this is not just intraday whipsaw—it’s the reappearance of price expansion alongside rising volume after the pullback.
📌 OI (open interest) Quantity: Over the most recent hour, it increased by 1.25%; within a 30-point window, it accumulated an increase of 132.56%. The Funding indicator value and the most recent actual settlement are both +0.0050%. Price acceleration and a significant lift in the positioning “base” are evident, but the funding rate has not yet moved into extremely positive territory. OI alone can only show that the number of contracts has increased; it cannot determine the direction of the newly added positions.
I regard 2.9876 as a continuation confirmation level. Only if the market reaccumulates volume and breaks above this hour’s high, and OI expands in a steady, not out-of-control manner, would that support further probing higher. If price falls back below 2.5514 while OI contracts at the same time, then after a failed second acceleration, the risk of deleveraging would take priority over chasing the breakout.
The previous complete 1-hour period rose from 2.6644 to 2.9136, up 9.35%. The intrahour high was 2.9876. Trading volume during that hour was about 118 million USDT, an increase of 21.23% month-over-month. Over the past 4 hours, prices have gained 22.19%, indicating this is not just intraday whipsaw—it’s the reappearance of price expansion alongside rising volume after the pullback.
📌 OI (open interest) Quantity: Over the most recent hour, it increased by 1.25%; within a 30-point window, it accumulated an increase of 132.56%. The Funding indicator value and the most recent actual settlement are both +0.0050%. Price acceleration and a significant lift in the positioning “base” are evident, but the funding rate has not yet moved into extremely positive territory. OI alone can only show that the number of contracts has increased; it cannot determine the direction of the newly added positions.
I regard 2.9876 as a continuation confirmation level. Only if the market reaccumulates volume and breaks above this hour’s high, and OI expands in a steady, not out-of-control manner, would that support further probing higher. If price falls back below 2.5514 while OI contracts at the same time, then after a failed second acceleration, the risk of deleveraging would take priority over chasing the breakout.
1
180
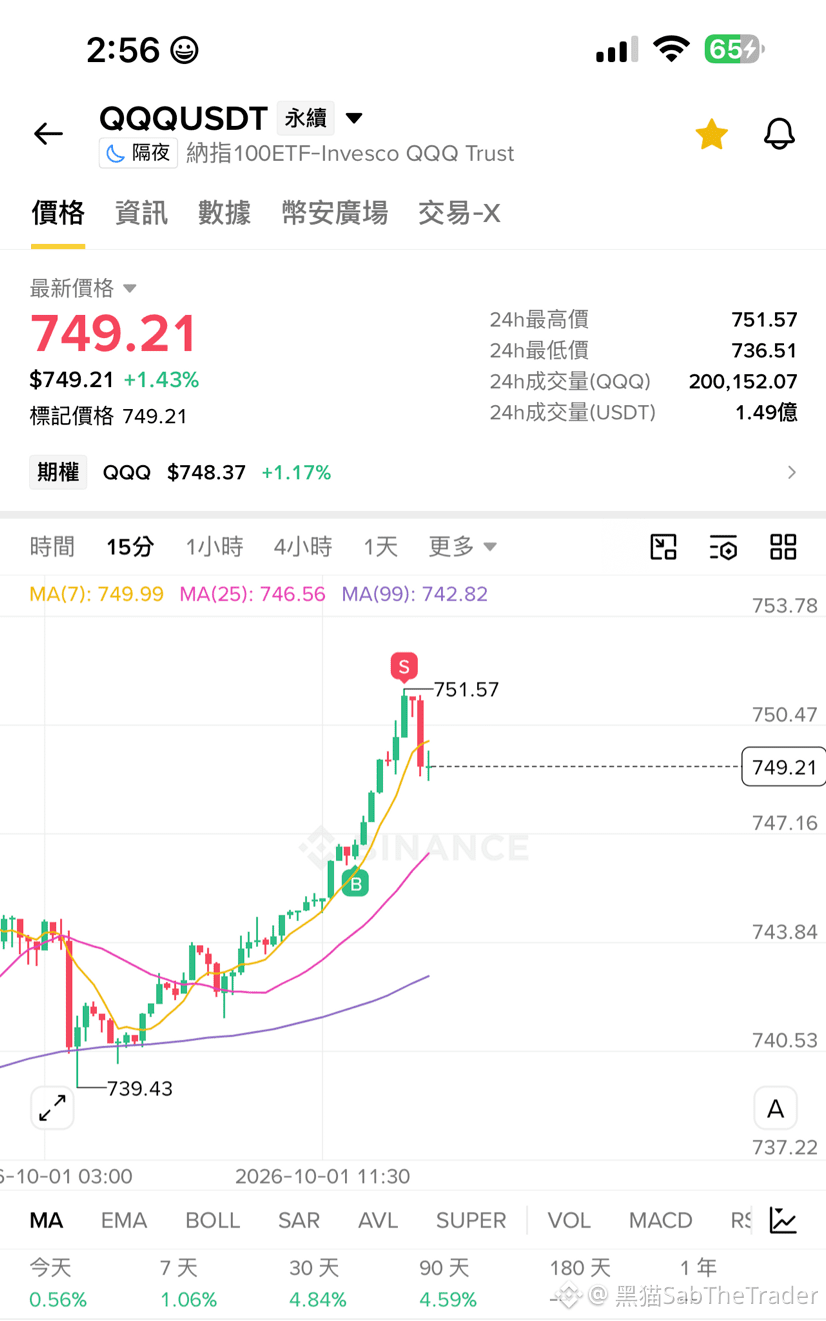
While preparing food at noon, I saw that $QQQB 15 minutes had a great opportunity. Without even turning on my computer, I went straight to my phone and placed an order on Binance.
During lunch, I was able to take profit smoothly; the rest is just waiting for tonight’s market open :)
At 8:30 tonight, there will be the week’s initial jobless claims data. The fluctuations before and after will be relatively large, so try to avoid trading around that time.
Plus tomorrow night is the Non-Farm Payrolls, and the market will have many opportunities. Just be patient and wait until the time when you can understand it clearly before entering.
{spot}(QQQBUSDT)
While preparing food at noon, I saw that $QQQB 15 minutes had a great opportunity. Without even turning on my computer, I went straight to my phone and placed an order on Binance.
During lunch, I was able to take profit smoothly; the rest is just waiting for tonight’s market open :)
At 8:30 tonight, there will be the week’s initial jobless claims data. The fluctuations before and after will be relatively large, so try to avoid trading around that time.
Plus tomorrow night is the Non-Farm Payrolls, and the market will have many opportunities. Just be patient and wait until the time when you can understand it clearly before entering.
During lunch, I was able to take profit smoothly; the rest is just waiting for tonight’s market open :)
At 8:30 tonight, there will be the week’s initial jobless claims data. The fluctuations before and after will be relatively large, so try to avoid trading around that time.
Plus tomorrow night is the Non-Farm Payrolls, and the market will have many opportunities. Just be patient and wait until the time when you can understand it clearly before entering.
366
Partly True
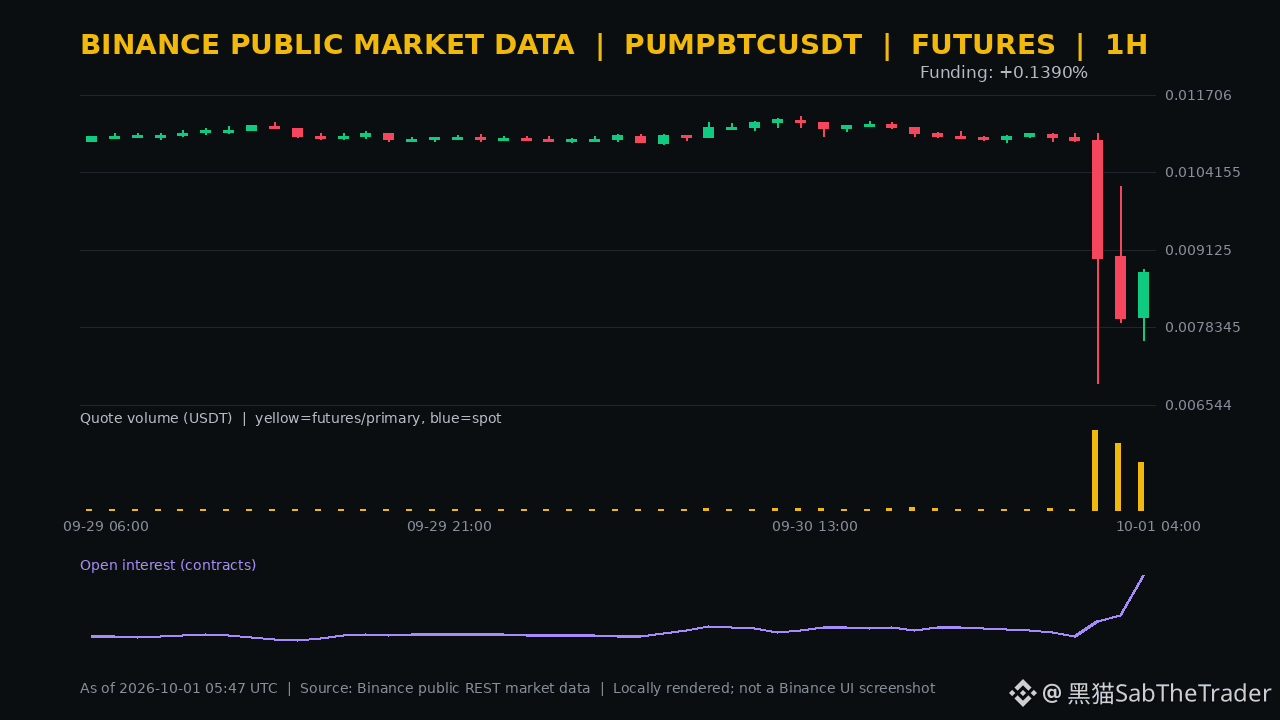
After the delisting news takes effect, PUMPBTC didn’t finish a one-way move and instead entered an even more aggressive repricing phase. Binance has confirmed that at 17:00 on October 5 (UTC+8) there will be an automatic settlement and the delisting of three U-margined perpetual contracts; starting from 16:30, you can no longer add non-reduce-only orders. The current price of $PUMPBTC is 0.00859, still down 22.12% over the past 24 hours.
The previous full hour rebounded from 0.00800 to 0.00875, up 9.38%, but over the last 4 hours the cumulative move is still down 20.45%. Trading volume in this hour was about 1.36 million USDT, down 27.76% month-over-month. The rebound strength didn’t expand further with higher volume to confirm.
On the positioning side, it’s actually getting more crowded: open interest (OI) increased by 5.33% over the hour, and the funding indicator rose to +0.1390%, while the most recent actual settlement is still -0.0506%. Moving from negative settlement to a strongly positive funding signal suggests that the risk of short-term chasing and squeeze pressure on both sides is rising at the same time. OI can only indicate increased positions, but it can’t determine net long vs. net short.
I’ll treat the 0.00875–0.00880 range as the rebound confirmation zone. Only if price holds above it and OI growth and funding both cool down will there be conditions to discuss structural recovery. If it continues to press below this range, or falls back to 0.00761 while OI keeps increasing, risks related to imminent liquidation, ADL, and liquidity will come before any directional judgment.
After the delisting news takes effect, PUMPBTC didn’t finish a one-way move and instead entered an even more aggressive repricing phase. Binance has confirmed that at 17:00 on October 5 (UTC+8) there will be an automatic settlement and the delisting of three U-margined perpetual contracts; starting from 16:30, you can no longer add non-reduce-only orders. The current price of $PUMPBTC is 0.00859, still down 22.12% over the past 24 hours.
The previous full hour rebounded from 0.00800 to 0.00875, up 9.38%, but over the last 4 hours the cumulative move is still down 20.45%. Trading volume in this hour was about 1.36 million USDT, down 27.76% month-over-month. The rebound strength didn’t expand further with higher volume to confirm.
On the positioning side, it’s actually getting more crowded: open interest (OI) increased by 5.33% over the hour, and the funding indicator rose to +0.1390%, while the most recent actual settlement is still -0.0506%. Moving from negative settlement to a strongly positive funding signal suggests that the risk of short-term chasing and squeeze pressure on both sides is rising at the same time. OI can only indicate increased positions, but it can’t determine net long vs. net short.
I’ll treat the 0.00875–0.00880 range as the rebound confirmation zone. Only if price holds above it and OI growth and funding both cool down will there be conditions to discuss structural recovery. If it continues to press below this range, or falls back to 0.00761 while OI keeps increasing, risks related to imminent liquidation, ADL, and liquidity will come before any directional judgment.
The previous full hour rebounded from 0.00800 to 0.00875, up 9.38%, but over the last 4 hours the cumulative move is still down 20.45%. Trading volume in this hour was about 1.36 million USDT, down 27.76% month-over-month. The rebound strength didn’t expand further with higher volume to confirm.
On the positioning side, it’s actually getting more crowded: open interest (OI) increased by 5.33% over the hour, and the funding indicator rose to +0.1390%, while the most recent actual settlement is still -0.0506%. Moving from negative settlement to a strongly positive funding signal suggests that the risk of short-term chasing and squeeze pressure on both sides is rising at the same time. OI can only indicate increased positions, but it can’t determine net long vs. net short.
I’ll treat the 0.00875–0.00880 range as the rebound confirmation zone. Only if price holds above it and OI growth and funding both cool down will there be conditions to discuss structural recovery. If it continues to press below this range, or falls back to 0.00761 while OI keeps increasing, risks related to imminent liquidation, ADL, and liquidity will come before any directional judgment.
815
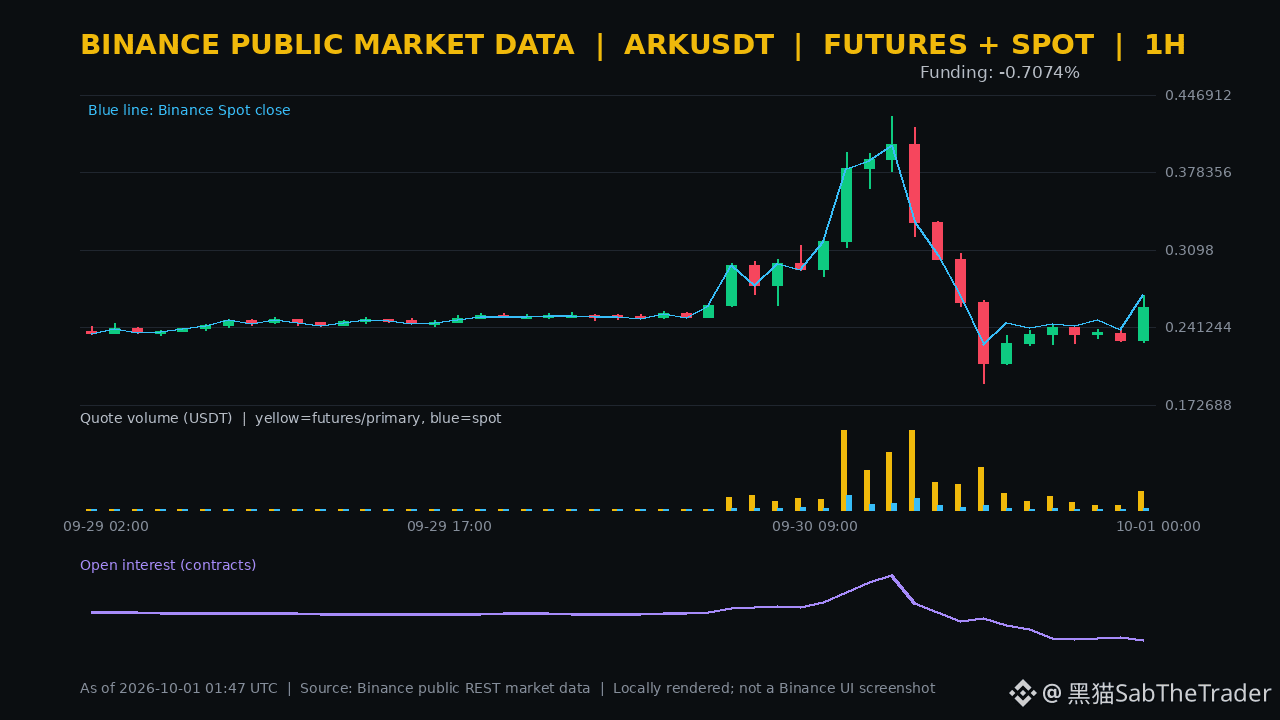
After ARK’s rebound that saw a sharp “price surge” alongside continued position reductions. The publicly available data from Binance at 09:47 (UTC+8) shows that the $ARK perpetual contract is at 0.2715, up 9.04% in 24 hours. The spot market is up 15.38% over the past 24 hours, with both markets moving in the same direction.
In the previous complete 1-hour period, the perpetual contract rose from 0.2301 to 0.2587, up 12.43%. Trading volume was about 12.32 million USDT, with the quarter-over-quarter (QoQ) change increasing 324.64%. Spot rose 12.86% in the same hour, and the trading volume’s QoQ change increased 602.76%. The current price is also 4.95% higher than that hour’s close, but this is not a synchronized chase with new positions.
Quantity OI decreased by 3.39% in the most recent hour, and the 30-point window decreased by 25.72%. The Funding indicator value is -0.7074%, and the most recent settlement is also -0.7026%. Price rebounding, OI contracting, and deeply negative Funding occurring at the same time looks more like shorts getting squeezed after de-leveraging rather than a newly confirmed uptrend of fresh longs; OI alone also cannot distinguish the direction of the remaining positions.
0.2694 was the high of the previous complete hour. Only if the price holds above that level, trading activity continues, and OI stops falling, might this rebound turn into a more stable follow-through. If it drops back below 0.2587 and continues to shrink positions, I will treat this upswing as a short squeeze for now and won’t chase higher prices.
After ARK’s rebound that saw a sharp “price surge” alongside continued position reductions. The publicly available data from Binance at 09:47 (UTC+8) shows that the $ARK perpetual contract is at 0.2715, up 9.04% in 24 hours. The spot market is up 15.38% over the past 24 hours, with both markets moving in the same direction.
In the previous complete 1-hour period, the perpetual contract rose from 0.2301 to 0.2587, up 12.43%. Trading volume was about 12.32 million USDT, with the quarter-over-quarter (QoQ) change increasing 324.64%. Spot rose 12.86% in the same hour, and the trading volume’s QoQ change increased 602.76%. The current price is also 4.95% higher than that hour’s close, but this is not a synchronized chase with new positions.
Quantity OI decreased by 3.39% in the most recent hour, and the 30-point window decreased by 25.72%. The Funding indicator value is -0.7074%, and the most recent settlement is also -0.7026%. Price rebounding, OI contracting, and deeply negative Funding occurring at the same time looks more like shorts getting squeezed after de-leveraging rather than a newly confirmed uptrend of fresh longs; OI alone also cannot distinguish the direction of the remaining positions.
0.2694 was the high of the previous complete hour. Only if the price holds above that level, trading activity continues, and OI stops falling, might this rebound turn into a more stable follow-through. If it drops back below 0.2587 and continues to shrink positions, I will treat this upswing as a short squeeze for now and won’t chase higher prices.
In the previous complete 1-hour period, the perpetual contract rose from 0.2301 to 0.2587, up 12.43%. Trading volume was about 12.32 million USDT, with the quarter-over-quarter (QoQ) change increasing 324.64%. Spot rose 12.86% in the same hour, and the trading volume’s QoQ change increased 602.76%. The current price is also 4.95% higher than that hour’s close, but this is not a synchronized chase with new positions.
Quantity OI decreased by 3.39% in the most recent hour, and the 30-point window decreased by 25.72%. The Funding indicator value is -0.7074%, and the most recent settlement is also -0.7026%. Price rebounding, OI contracting, and deeply negative Funding occurring at the same time looks more like shorts getting squeezed after de-leveraging rather than a newly confirmed uptrend of fresh longs; OI alone also cannot distinguish the direction of the remaining positions.
0.2694 was the high of the previous complete hour. Only if the price holds above that level, trading activity continues, and OI stops falling, might this rebound turn into a more stable follow-through. If it drops back below 0.2587 and continues to shrink positions, I will treat this upswing as a short squeeze for now and won’t chase higher prices.
424
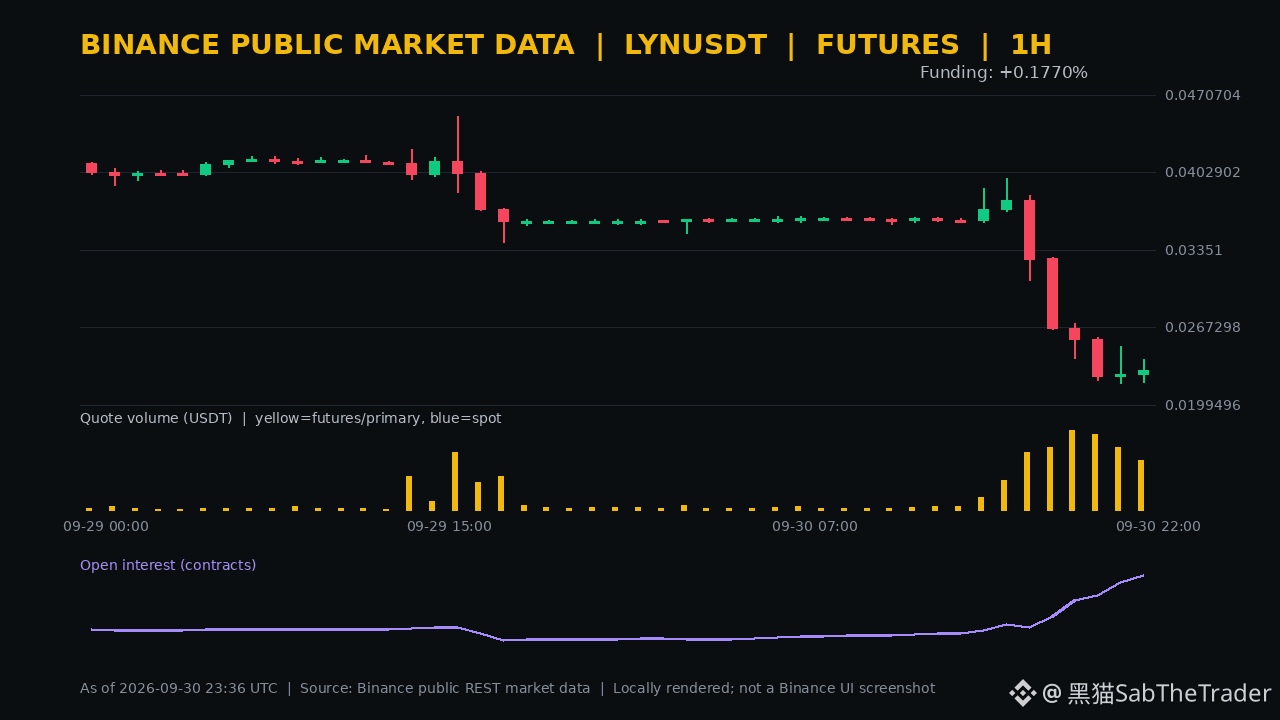
After falling by nearly 30%, LYN is now showing a very urgent intraday pullback. According to public Binance data at 07:37 (UTC+8), perpetual contract $LYN is at 0.02548, down 29.05% over the past 24 hours, with trading volume of about 52.06 million USDT. For this asset, only the perpetual market has currently been confirmed.
In the previous complete hour, it rebounded from 0.02265 to 0.02299, up 1.50%, with trading volume of about 5.23 million USDT, down 20.21% month-over-month; over the last 4 hours it is still down 13.70%. The current price is also 10.83% higher than that hour’s close. The rebound pace is faster than the already confirmed hour’s volume suggests, so short-term price discovery remains unstable.
OI (open interest) in the most recent hour increased by 4.71%, and within a 30-point window it rose by 59.26%. The Funding indicator value is +0.1770%, and the most recent settlement was -0.0027%. During the period of a sharp drop in price, positions were actually being built up. Meanwhile, the Funding indicator turned clearly positive, which could either amplify the rebound squeeze, or increase the burden on long traders chasing the rebound as the next round of deleveraging hits; OI itself cannot determine the direction of the newly added positions.
0.02393 was the high of the previous complete hour. Only if it pulls back and still holds, with trading activity recovering and the OI growth rate cooling down, will the rebound structure be more stable. If it breaks below 0.02190 and is accompanied by a contraction in OI, I will first treat it as a retreat based on crowded positions and will not chase this pullback.
After falling by nearly 30%, LYN is now showing a very urgent intraday pullback. According to public Binance data at 07:37 (UTC+8), perpetual contract $LYN is at 0.02548, down 29.05% over the past 24 hours, with trading volume of about 52.06 million USDT. For this asset, only the perpetual market has currently been confirmed.
In the previous complete hour, it rebounded from 0.02265 to 0.02299, up 1.50%, with trading volume of about 5.23 million USDT, down 20.21% month-over-month; over the last 4 hours it is still down 13.70%. The current price is also 10.83% higher than that hour’s close. The rebound pace is faster than the already confirmed hour’s volume suggests, so short-term price discovery remains unstable.
OI (open interest) in the most recent hour increased by 4.71%, and within a 30-point window it rose by 59.26%. The Funding indicator value is +0.1770%, and the most recent settlement was -0.0027%. During the period of a sharp drop in price, positions were actually being built up. Meanwhile, the Funding indicator turned clearly positive, which could either amplify the rebound squeeze, or increase the burden on long traders chasing the rebound as the next round of deleveraging hits; OI itself cannot determine the direction of the newly added positions.
0.02393 was the high of the previous complete hour. Only if it pulls back and still holds, with trading activity recovering and the OI growth rate cooling down, will the rebound structure be more stable. If it breaks below 0.02190 and is accompanied by a contraction in OI, I will first treat it as a retreat based on crowded positions and will not chase this pullback.
In the previous complete hour, it rebounded from 0.02265 to 0.02299, up 1.50%, with trading volume of about 5.23 million USDT, down 20.21% month-over-month; over the last 4 hours it is still down 13.70%. The current price is also 10.83% higher than that hour’s close. The rebound pace is faster than the already confirmed hour’s volume suggests, so short-term price discovery remains unstable.
OI (open interest) in the most recent hour increased by 4.71%, and within a 30-point window it rose by 59.26%. The Funding indicator value is +0.1770%, and the most recent settlement was -0.0027%. During the period of a sharp drop in price, positions were actually being built up. Meanwhile, the Funding indicator turned clearly positive, which could either amplify the rebound squeeze, or increase the burden on long traders chasing the rebound as the next round of deleveraging hits; OI itself cannot determine the direction of the newly added positions.
0.02393 was the high of the previous complete hour. Only if it pulls back and still holds, with trading activity recovering and the OI growth rate cooling down, will the rebound structure be more stable. If it breaks below 0.02190 and is accompanied by a contraction in OI, I will first treat it as a retreat based on crowded positions and will not chase this pullback.
1.5k
Micron hands in their exam tonight—everyone come take a look 👀
Micron hands in their exam tonight—everyone come take a look 👀
Quoted content has been removed
129
Verified
$BTC Today it’s still hovering around $83,000, oscillating nearby. Over the past couple of days, US Treasury yields have also been trading at multi-year highs, and the market is clearly waiting for tonight’s data.👀
In the Eastern 8th time zone, 20:30, the US August Core PCE (the “mini non-farm payroll”) will be released—one of the inflation indicators the Fed pays close attention to. Volatility could be amplified before and after the data comes out. My old habit still stands: don’t run ahead—wait for the price to move on its own.
#PCE
$BTC Today it’s still hovering around $83,000, oscillating nearby. Over the past couple of days, US Treasury yields have also been trading at multi-year highs, and the market is clearly waiting for tonight’s data.👀
In the Eastern 8th time zone, 20:30, the US August Core PCE (the “mini non-farm payroll”) will be released—one of the inflation indicators the Fed pays close attention to. Volatility could be amplified before and after the data comes out. My old habit still stands: don’t run ahead—wait for the price to move on its own.
#PCE
In the Eastern 8th time zone, 20:30, the US August Core PCE (the “mini non-farm payroll”) will be released—one of the inflation indicators the Fed pays close attention to. Volatility could be amplified before and after the data comes out. My old habit still stands: don’t run ahead—wait for the price to move on its own.
#PCE

2.2k
16
117
2.2k
Log in to explore more content
Join global crypto users on Binance Square
⚡️ Get latest and useful information about crypto.
💬 Trusted by the world’s largest crypto exchange.
👍 Discover real insights from verified creators.
Email / Phone number