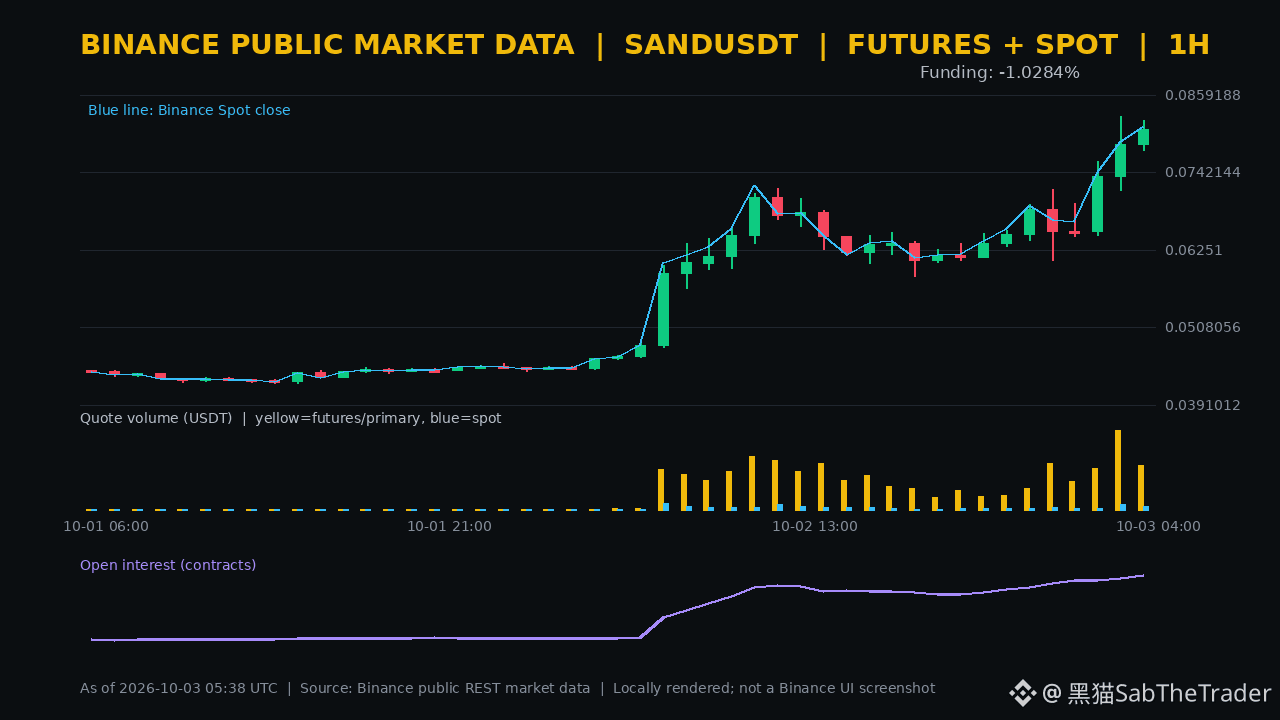
In a 24-hour market that’s nearly doubling, treating a single indicator as the answer for direction is more dangerous than the volatility itself. According to public Binance data at 13:37 (UTC+8), spot and perpetual contracts for $SAND are up 69.91% and 68.82% respectively, with perpetual trading volume of about 1.258 billion USDT.
The previous complete 1-hour period saw price rise from 0.07851 to 0.08070, up 2.79%, but that hour’s trading value fell 43.97% month-over-month; over the past 4 hours it’s still up 23.58%. The rally is still ongoing, but short-term volume momentum has clearly declined. Follow-through at the highs needs further confirmation.
⚠️ Quantity OI increased 3.74% over the most recent hour, with a 30-point window gain of 164.70%. The Funding indicator value is -1.0318%, while the most recent realized settlement is -0.7058%. This suggests leverage and long/short disagreement are both extremely high—but quantity OI doesn’t clearly show net long or net short, and deeply negative Funding does not necessarily mean price will keep rising.
I’m watching the 0.07754—0.08200 range first. If price reclaims 0.08200 and trading activity picks up, there will be grounds to believe the strong structure can continue; if it breaks below 0.07754 and is accompanied by OI contraction, it’s more like deleveraging at elevated levels. The current hour hasn’t closed yet, so don’t substitute intrahour pullbacks for a full candlestick confirmation.
The previous complete 1-hour period saw price rise from 0.07851 to 0.08070, up 2.79%, but that hour’s trading value fell 43.97% month-over-month; over the past 4 hours it’s still up 23.58%. The rally is still ongoing, but short-term volume momentum has clearly declined. Follow-through at the highs needs further confirmation.
⚠️ Quantity OI increased 3.74% over the most recent hour, with a 30-point window gain of 164.70%. The Funding indicator value is -1.0318%, while the most recent realized settlement is -0.7058%. This suggests leverage and long/short disagreement are both extremely high—but quantity OI doesn’t clearly show net long or net short, and deeply negative Funding does not necessarily mean price will keep rising.
I’m watching the 0.07754—0.08200 range first. If price reclaims 0.08200 and trading activity picks up, there will be grounds to believe the strong structure can continue; if it breaks below 0.07754 and is accompanied by OI contraction, it’s more like deleveraging at elevated levels. The current hour hasn’t closed yet, so don’t substitute intrahour pullbacks for a full candlestick confirmation.