
ZeroBlock
4.8k Posts

ZeroBlock
Report
Block User
BTC LOVER GOLD TRADER , SQUARE CRATOR
Open Trade
Frequent Trader
1.2 Years
238 Following
25.2K+ Followers
13.0K+ Liked
Posts
Portfolio
All
Videos
Live
·
--

Article
Robinhood Just Flipped Solana In Daily DEX VolumeSomething interesting is happening with on chain activity.
Solana has been one of the biggest names in DEX volume for a long time. But Robinhood Chain just recorded something that deserves attention.
On September 5 Robinhood processed around $1.45 billion in daily DEX volume.
Solana recorded around $1.25 billion.
That means Robinhood became the first chain to flip Solana in daily DEX volume.
The lead is not just appearing for one moment either.
Intraday volume was around $1.36 billion for Robinhood compared with roughly $1.28 billion for Solana.
That does not mean Solana has suddenly lost its position.
Over the last 30 days Solana still had more than $65 billion in DEX volume. That is far ahead of most other chains.
But Robinhood is growing very quickly.
Daily DEX volume recently crossed $3 billion for the first time.
Around $880 million is now locked on the chain. That is roughly 30 percent higher than one week earlier.
Deposits are also approaching $1 billion.
This is where the story becomes more interesting for Ethereum.
Robinhood Chain is built on Ethereum.
So when activity grows on the chain it can also create more demand for the Ethereum ecosystem.
The revenue numbers are already showing that activity is becoming meaningful.
Robinhood recently generated around $6.8 million in earnings. That was reported as a record level for an Ethereum Layer 2.
At the same time some activity on Solana is showing signs of cooling.
Pump.fun volume dropped from around $3.16 million to $1.18 million within eight days.
Solana transaction activity also fell around 37 percent from its August 28 peak.
I would not call this the end of Solana's DEX dominance.
One day of volume is not enough to change a long term trend.
But the rotation is worth watching.
For more than a year the SOL to ETH ratio has been moving around the 0.04 area.
If Solana continues losing part of its DEX activity while Ethereum keeps gaining activity through new Layer 2 growth then that ratio could become much more interesting going into Q4.
The important thing here is that Ethereum does not necessarily need to beat Solana directly.
It may only need the market to start valuing Ethereum's growing activity differently.
Robinhood is creating another source of on chain volume.
Liquidity is increasing.
Fees are growing.
And Ethereum is sitting underneath that activity.
For me the next few weeks matter more than this single volume flip.
If Robinhood can keep these numbers high then the market may start asking a different question.
Not whether Solana is still strong.
But whether Ethereum is finally getting enough real activity to close the gap.
Robinhood Just Flipped Solana In Daily DEX Volume
Something interesting is happening with on chain activity.
Solana has been one of the biggest names in DEX volume for a long time. But Robinhood Chain just recorded something that deserves attention.
On September 5 Robinhood processed around $1.45 billion in daily DEX volume.
Solana recorded around $1.25 billion.
That means Robinhood became the first chain to flip Solana in daily DEX volume.
The lead is not just appearing for one moment either.
Intraday volume was around $1.36 billion for Robinhood compared with roughly $1.28 billion for Solana.
That does not mean Solana has suddenly lost its position.
Over the last 30 days Solana still had more than $65 billion in DEX volume. That is far ahead of most other chains.
But Robinhood is growing very quickly.
Daily DEX volume recently crossed $3 billion for the first time.
Around $880 million is now locked on the chain. That is roughly 30 percent higher than one week earlier.
Deposits are also approaching $1 billion.
This is where the story becomes more interesting for Ethereum.
Robinhood Chain is built on Ethereum.
So when activity grows on the chain it can also create more demand for the Ethereum ecosystem.
The revenue numbers are already showing that activity is becoming meaningful.
Robinhood recently generated around $6.8 million in earnings. That was reported as a record level for an Ethereum Layer 2.
At the same time some activity on Solana is showing signs of cooling.
Pump.fun volume dropped from around $3.16 million to $1.18 million within eight days.
Solana transaction activity also fell around 37 percent from its August 28 peak.
I would not call this the end of Solana's DEX dominance.
One day of volume is not enough to change a long term trend.
But the rotation is worth watching.
For more than a year the SOL to ETH ratio has been moving around the 0.04 area.
If Solana continues losing part of its DEX activity while Ethereum keeps gaining activity through new Layer 2 growth then that ratio could become much more interesting going into Q4.
The important thing here is that Ethereum does not necessarily need to beat Solana directly.
It may only need the market to start valuing Ethereum's growing activity differently.
Robinhood is creating another source of on chain volume.
Liquidity is increasing.
Fees are growing.
And Ethereum is sitting underneath that activity.
For me the next few weeks matter more than this single volume flip.
If Robinhood can keep these numbers high then the market may start asking a different question.
Not whether Solana is still strong.
But whether Ethereum is finally getting enough real activity to close the gap.
Solana has been one of the biggest names in DEX volume for a long time. But Robinhood Chain just recorded something that deserves attention.
On September 5 Robinhood processed around $1.45 billion in daily DEX volume.
Solana recorded around $1.25 billion.
That means Robinhood became the first chain to flip Solana in daily DEX volume.
The lead is not just appearing for one moment either.
Intraday volume was around $1.36 billion for Robinhood compared with roughly $1.28 billion for Solana.
That does not mean Solana has suddenly lost its position.
Over the last 30 days Solana still had more than $65 billion in DEX volume. That is far ahead of most other chains.
But Robinhood is growing very quickly.
Daily DEX volume recently crossed $3 billion for the first time.
Around $880 million is now locked on the chain. That is roughly 30 percent higher than one week earlier.
Deposits are also approaching $1 billion.
This is where the story becomes more interesting for Ethereum.
Robinhood Chain is built on Ethereum.
So when activity grows on the chain it can also create more demand for the Ethereum ecosystem.
The revenue numbers are already showing that activity is becoming meaningful.
Robinhood recently generated around $6.8 million in earnings. That was reported as a record level for an Ethereum Layer 2.
At the same time some activity on Solana is showing signs of cooling.
Pump.fun volume dropped from around $3.16 million to $1.18 million within eight days.
Solana transaction activity also fell around 37 percent from its August 28 peak.
I would not call this the end of Solana's DEX dominance.
One day of volume is not enough to change a long term trend.
But the rotation is worth watching.
For more than a year the SOL to ETH ratio has been moving around the 0.04 area.
If Solana continues losing part of its DEX activity while Ethereum keeps gaining activity through new Layer 2 growth then that ratio could become much more interesting going into Q4.
The important thing here is that Ethereum does not necessarily need to beat Solana directly.
It may only need the market to start valuing Ethereum's growing activity differently.
Robinhood is creating another source of on chain volume.
Liquidity is increasing.
Fees are growing.
And Ethereum is sitting underneath that activity.
For me the next few weeks matter more than this single volume flip.
If Robinhood can keep these numbers high then the market may start asking a different question.
Not whether Solana is still strong.
But whether Ethereum is finally getting enough real activity to close the gap.
2
246
·
--

Article
HYPE Has An $860 Million Unlock Coming And This Is The Part I Am WatchingHYPE is heading toward one of its biggest supply tests yet.
On October 6 around 9.92 million HYPE tokens are scheduled to unlock.
At current prices that is close to $860 million worth of tokens.
That number immediately looks scary.
But I think the more important question is not how big the unlock is.
It is how much of that supply actually reaches the market.
The September distribution gives us an interesting clue.
Only around 0.19 percent of HYPE was released on September 6 which was worth about $36.56 million. That was much lower than the scheduled allocation.
So the October event does not automatically mean $860 million worth of HYPE will suddenly be sold.
Contributor wallet activity will matter much more.
If contributors hold their tokens then the immediate selling pressure could stay limited.
If large amounts move toward the market then liquidity becomes the real problem.
The October unlock represents roughly 3.9 percent to 4.5 percent of circulating supply.
That is large compared with normal daily spot activity.
Now there is another side of the equation.
Institutional demand is already showing up.
Bitwise buyers added around $10.5 million worth of HYPE on September 4 after several days without purchases.
That was roughly 123500 HYPE at an average price near $85.
Cumulative purchases by those investors have reached around $166.3 million.
But even this is not enough to absorb the full October unlock by itself.
The difference is important.
Institutional buying can create a buffer.
It cannot completely remove the risk from a large contributor distribution.
Then there is the internal demand created by Hyperliquid itself.
Around $859500 in fees generated roughly $823800 in HYPE directed revenue over the last 24 hours.
That money was used to buy around 9730 HYPE.
Those tokens were then permanently burned.
This is different from normal buying because the tokens are removed from the available supply.
Lifetime HYPE burns have now reached around 48.42 million tokens.
That is still only 4.84 percent of the maximum supply.
So the burns are meaningful over time but they are nowhere near large enough to cancel a $860 million unlock immediately.
This is why October could become a real supply and demand test.
If contributor wallets keep holding while institutional demand continues and protocol activity stays strong then the market may absorb the new supply better than the headline suggests.
But if contributors start selling heavily at the same time demand slows then HYPE could face serious pressure.
For me the key signal is not the unlock date itself.
It is what those unlocked tokens actually do afterward.
Tokens sitting in wallets are one thing.
Tokens moving toward the market are another.
October will show us which one this really is.
HYPE Has An $860 Million Unlock Coming And This Is The Part I Am Watching
HYPE is heading toward one of its biggest supply tests yet.
On October 6 around 9.92 million HYPE tokens are scheduled to unlock.
At current prices that is close to $860 million worth of tokens.
That number immediately looks scary.
But I think the more important question is not how big the unlock is.
It is how much of that supply actually reaches the market.
The September distribution gives us an interesting clue.
Only around 0.19 percent of HYPE was released on September 6 which was worth about $36.56 million. That was much lower than the scheduled allocation.
So the October event does not automatically mean $860 million worth of HYPE will suddenly be sold.
Contributor wallet activity will matter much more.
If contributors hold their tokens then the immediate selling pressure could stay limited.
If large amounts move toward the market then liquidity becomes the real problem.
The October unlock represents roughly 3.9 percent to 4.5 percent of circulating supply.
That is large compared with normal daily spot activity.
Now there is another side of the equation.
Institutional demand is already showing up.
Bitwise buyers added around $10.5 million worth of HYPE on September 4 after several days without purchases.
That was roughly 123500 HYPE at an average price near $85.
Cumulative purchases by those investors have reached around $166.3 million.
But even this is not enough to absorb the full October unlock by itself.
The difference is important.
Institutional buying can create a buffer.
It cannot completely remove the risk from a large contributor distribution.
Then there is the internal demand created by Hyperliquid itself.
Around $859500 in fees generated roughly $823800 in HYPE directed revenue over the last 24 hours.
That money was used to buy around 9730 HYPE.
Those tokens were then permanently burned.
This is different from normal buying because the tokens are removed from the available supply.
Lifetime HYPE burns have now reached around 48.42 million tokens.
That is still only 4.84 percent of the maximum supply.
So the burns are meaningful over time but they are nowhere near large enough to cancel a $860 million unlock immediately.
This is why October could become a real supply and demand test.
If contributor wallets keep holding while institutional demand continues and protocol activity stays strong then the market may absorb the new supply better than the headline suggests.
But if contributors start selling heavily at the same time demand slows then HYPE could face serious pressure.
For me the key signal is not the unlock date itself.
It is what those unlocked tokens actually do afterward.
Tokens sitting in wallets are one thing.
Tokens moving toward the market are another.
October will show us which one this really is.
On October 6 around 9.92 million HYPE tokens are scheduled to unlock.
At current prices that is close to $860 million worth of tokens.
That number immediately looks scary.
But I think the more important question is not how big the unlock is.
It is how much of that supply actually reaches the market.
The September distribution gives us an interesting clue.
Only around 0.19 percent of HYPE was released on September 6 which was worth about $36.56 million. That was much lower than the scheduled allocation.
So the October event does not automatically mean $860 million worth of HYPE will suddenly be sold.
Contributor wallet activity will matter much more.
If contributors hold their tokens then the immediate selling pressure could stay limited.
If large amounts move toward the market then liquidity becomes the real problem.
The October unlock represents roughly 3.9 percent to 4.5 percent of circulating supply.
That is large compared with normal daily spot activity.
Now there is another side of the equation.
Institutional demand is already showing up.
Bitwise buyers added around $10.5 million worth of HYPE on September 4 after several days without purchases.
That was roughly 123500 HYPE at an average price near $85.
Cumulative purchases by those investors have reached around $166.3 million.
But even this is not enough to absorb the full October unlock by itself.
The difference is important.
Institutional buying can create a buffer.
It cannot completely remove the risk from a large contributor distribution.
Then there is the internal demand created by Hyperliquid itself.
Around $859500 in fees generated roughly $823800 in HYPE directed revenue over the last 24 hours.
That money was used to buy around 9730 HYPE.
Those tokens were then permanently burned.
This is different from normal buying because the tokens are removed from the available supply.
Lifetime HYPE burns have now reached around 48.42 million tokens.
That is still only 4.84 percent of the maximum supply.
So the burns are meaningful over time but they are nowhere near large enough to cancel a $860 million unlock immediately.
This is why October could become a real supply and demand test.
If contributor wallets keep holding while institutional demand continues and protocol activity stays strong then the market may absorb the new supply better than the headline suggests.
But if contributors start selling heavily at the same time demand slows then HYPE could face serious pressure.
For me the key signal is not the unlock date itself.
It is what those unlocked tokens actually do afterward.
Tokens sitting in wallets are one thing.
Tokens moving toward the market are another.
October will show us which one this really is.
1
216
·
--
Article
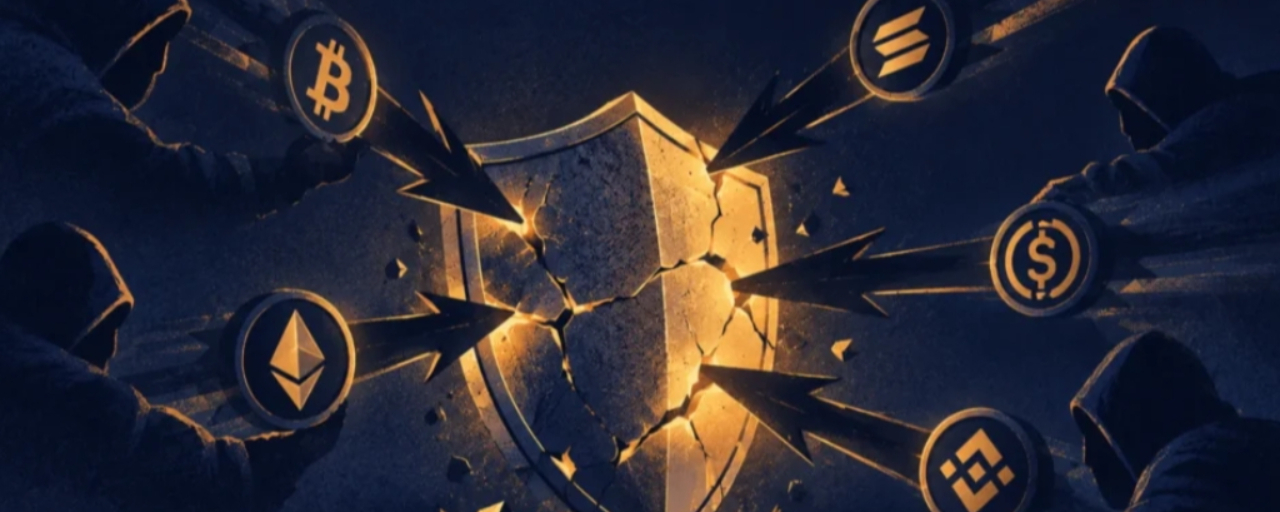
Four Crypto Scams Appeared In Just 12 HoursThe number that caught my attention is not the amount stolen.
It is how different these attacks were.
Within just 12 hours the crypto market saw four separate security threats. Each one used a different weakness and that tells me something important about the current risk.
The first involved a malicious governance proposal targeting Olas.
Around 40.196 ETH worth roughly $100000 was placed at risk.
The attacker used an ENS name that looked connected to the project and disguised the proposal as a normal treasury ownership migration.
But executing it would have moved treasury control to an attacker controlled contract.
This is the kind of attack that can look completely normal if someone only reads the proposal title.
Then another issue appeared on Reddio.
A cross vault accounting flaw reportedly caused stETH to be counted twice as backing for different assets.
The estimated loss was around 9.25 ETH.
The bigger concern was that the flaw could potentially be abused through a flash loan to create artificial value and withdraw excess ETH.
At the same time another threat was targeting ordinary wallet users.
A theft toolkit was reportedly being sold that focused on Ledger and Trezor users.
The important part is that this was not about breaking the hardware itself.
The attack relied on social engineering and fake transaction signing requests.
A user could believe they were approving a normal transaction while actually giving permission for a malicious transfer.
Then came another social media attack.
Base co founder Jesse Pollak warned that a compromised third party app connected to his social account was used to post scam content.
The access was later removed.
And this happened around the same time as the compromised Neuralink related account that pushed the SLINK memecoin.
That case showed how powerful one trusted reaction can be.
Elon Musk replied to the post and traders treated that reaction as confirmation.
The token then surged before crashing more than 95 percent.
Looking at all four cases together gives me a different view of crypto security.
The biggest weakness is not always smart contract code.
Sometimes it is governance.
Sometimes it is accounting.
Sometimes it is a wallet signature.
Sometimes it is simply trust.
DeFiLlama data cited in the report puts losses between September 2025 and September 2026 at around $1.732 billion.
That is a serious number.
But there is also an important comparison.
H1 2025 reportedly lost around $2.3 billion while H1 2026 crossed $1 billion.
So 2026 is not automatically worse than 2025 yet.
For me the lesson is simple.
Never approve a governance proposal just because the name looks familiar.
Never sign a transaction you do not fully understand.
Never treat a celebrity reaction as proof that a token is legitimate.
And never assume a connected social account is safe just because it belongs to someone you trust.
Crypto gives users control over their money.
That also means users have to verify what they are signing before that control becomes someone else’s.
Four Crypto Scams Appeared In Just 12 Hours
The number that caught my attention is not the amount stolen.
It is how different these attacks were.
Within just 12 hours the crypto market saw four separate security threats. Each one used a different weakness and that tells me something important about the current risk.
The first involved a malicious governance proposal targeting Olas.
Around 40.196 ETH worth roughly $100000 was placed at risk.
The attacker used an ENS name that looked connected to the project and disguised the proposal as a normal treasury ownership migration.
But executing it would have moved treasury control to an attacker controlled contract.
This is the kind of attack that can look completely normal if someone only reads the proposal title.
Then another issue appeared on Reddio.
A cross vault accounting flaw reportedly caused stETH to be counted twice as backing for different assets.
The estimated loss was around 9.25 ETH.
The bigger concern was that the flaw could potentially be abused through a flash loan to create artificial value and withdraw excess ETH.
At the same time another threat was targeting ordinary wallet users.
A theft toolkit was reportedly being sold that focused on Ledger and Trezor users.
The important part is that this was not about breaking the hardware itself.
The attack relied on social engineering and fake transaction signing requests.
A user could believe they were approving a normal transaction while actually giving permission for a malicious transfer.
Then came another social media attack.
Base co founder Jesse Pollak warned that a compromised third party app connected to his social account was used to post scam content.
The access was later removed.
And this happened around the same time as the compromised Neuralink related account that pushed the SLINK memecoin.
That case showed how powerful one trusted reaction can be.
Elon Musk replied to the post and traders treated that reaction as confirmation.
The token then surged before crashing more than 95 percent.
Looking at all four cases together gives me a different view of crypto security.
The biggest weakness is not always smart contract code.
Sometimes it is governance.
Sometimes it is accounting.
Sometimes it is a wallet signature.
Sometimes it is simply trust.
DeFiLlama data cited in the report puts losses between September 2025 and September 2026 at around $1.732 billion.
That is a serious number.
But there is also an important comparison.
H1 2025 reportedly lost around $2.3 billion while H1 2026 crossed $1 billion.
So 2026 is not automatically worse than 2025 yet.
For me the lesson is simple.
Never approve a governance proposal just because the name looks familiar.
Never sign a transaction you do not fully understand.
Never treat a celebrity reaction as proof that a token is legitimate.
And never assume a connected social account is safe just because it belongs to someone you trust.
Crypto gives users control over their money.
That also means users have to verify what they are signing before that control becomes someone else’s.
It is how different these attacks were.
Within just 12 hours the crypto market saw four separate security threats. Each one used a different weakness and that tells me something important about the current risk.
The first involved a malicious governance proposal targeting Olas.
Around 40.196 ETH worth roughly $100000 was placed at risk.
The attacker used an ENS name that looked connected to the project and disguised the proposal as a normal treasury ownership migration.
But executing it would have moved treasury control to an attacker controlled contract.
This is the kind of attack that can look completely normal if someone only reads the proposal title.
Then another issue appeared on Reddio.
A cross vault accounting flaw reportedly caused stETH to be counted twice as backing for different assets.
The estimated loss was around 9.25 ETH.
The bigger concern was that the flaw could potentially be abused through a flash loan to create artificial value and withdraw excess ETH.
At the same time another threat was targeting ordinary wallet users.
A theft toolkit was reportedly being sold that focused on Ledger and Trezor users.
The important part is that this was not about breaking the hardware itself.
The attack relied on social engineering and fake transaction signing requests.
A user could believe they were approving a normal transaction while actually giving permission for a malicious transfer.
Then came another social media attack.
Base co founder Jesse Pollak warned that a compromised third party app connected to his social account was used to post scam content.
The access was later removed.
And this happened around the same time as the compromised Neuralink related account that pushed the SLINK memecoin.
That case showed how powerful one trusted reaction can be.
Elon Musk replied to the post and traders treated that reaction as confirmation.
The token then surged before crashing more than 95 percent.
Looking at all four cases together gives me a different view of crypto security.
The biggest weakness is not always smart contract code.
Sometimes it is governance.
Sometimes it is accounting.
Sometimes it is a wallet signature.
Sometimes it is simply trust.
DeFiLlama data cited in the report puts losses between September 2025 and September 2026 at around $1.732 billion.
That is a serious number.
But there is also an important comparison.
H1 2025 reportedly lost around $2.3 billion while H1 2026 crossed $1 billion.
So 2026 is not automatically worse than 2025 yet.
For me the lesson is simple.
Never approve a governance proposal just because the name looks familiar.
Never sign a transaction you do not fully understand.
Never treat a celebrity reaction as proof that a token is legitimate.
And never assume a connected social account is safe just because it belongs to someone you trust.
Crypto gives users control over their money.
That also means users have to verify what they are signing before that control becomes someone else’s.
2
172
·
--

Article
UNI Burns Just Crossed $1 Million In A Single DaySomething interesting is happening around Uniswap right now.
The protocol just recorded its highest daily UNI burn value ever at around $1.15 million.
Around 184000 UNI were burned that day. That is the second highest daily burn amount on record.
The part that caught my attention is where much of this activity came from.
Robinhood Chain generated around 150000 UNI of the burn.
Robinhood Chain has been growing quickly with tokenized stock activity. Its tokenized stock holders reportedly reached around 863800 in only two months.
Daily trading volume has also been sitting around $100 million to $130 million.
Then on September 4 the chain recorded around $6 million in daily fees and about $5.4 million in revenue.
That activity is important for Uniswap because more trading creates more fees and more activity through the protocol can lead to more UNI being burned.
The numbers from Uniswap were also strong.
Daily fees reached around $12.5 million while revenue moved above $1 million.
The bigger picture is that UNI is now seeing real economic activity behind the token.
But there is an important difference between token burns and price growth.
Burning tokens reduces supply.
It does not automatically create demand.
If buyers are not willing to pay higher prices then even a large burn can have limited impact on the market.
That is exactly what makes the current UNI setup interesting.
Spot netflow turned positive at around $2.1 million after being negative by $6.6 million in the previous session.
That suggests some holders may be moving tokens toward selling.
At the same time the market structure still looks positive.
The positive directional indicator remains above the negative directional indicator. ADX is also holding above its average which suggests the current trend still has strength.
So I would not look at the $1.15 million burn and assume UNI must go up.
I would watch the price levels instead.
$6 is the level I would keep an eye on first.
If UNI can hold $6 while demand improves then $6.50 becomes an important level. A clean move above that could open the door toward $7.
But losing $6 changes the setup.
The next important support would then be around $5.60.
For me the most interesting part is not the burn itself.
It is the fact that Uniswap is generating stronger activity while the token still needs buyers to recognize that value.
The burn mechanism is working.
Now the market has to decide what that activity is worth.
UNI Burns Just Crossed $1 Million In A Single Day
Something interesting is happening around Uniswap right now.
The protocol just recorded its highest daily UNI burn value ever at around $1.15 million.
Around 184000 UNI were burned that day. That is the second highest daily burn amount on record.
The part that caught my attention is where much of this activity came from.
Robinhood Chain generated around 150000 UNI of the burn.
Robinhood Chain has been growing quickly with tokenized stock activity. Its tokenized stock holders reportedly reached around 863800 in only two months.
Daily trading volume has also been sitting around $100 million to $130 million.
Then on September 4 the chain recorded around $6 million in daily fees and about $5.4 million in revenue.
That activity is important for Uniswap because more trading creates more fees and more activity through the protocol can lead to more UNI being burned.
The numbers from Uniswap were also strong.
Daily fees reached around $12.5 million while revenue moved above $1 million.
The bigger picture is that UNI is now seeing real economic activity behind the token.
But there is an important difference between token burns and price growth.
Burning tokens reduces supply.
It does not automatically create demand.
If buyers are not willing to pay higher prices then even a large burn can have limited impact on the market.
That is exactly what makes the current UNI setup interesting.
Spot netflow turned positive at around $2.1 million after being negative by $6.6 million in the previous session.
That suggests some holders may be moving tokens toward selling.
At the same time the market structure still looks positive.
The positive directional indicator remains above the negative directional indicator. ADX is also holding above its average which suggests the current trend still has strength.
So I would not look at the $1.15 million burn and assume UNI must go up.
I would watch the price levels instead.
$6 is the level I would keep an eye on first.
If UNI can hold $6 while demand improves then $6.50 becomes an important level. A clean move above that could open the door toward $7.
But losing $6 changes the setup.
The next important support would then be around $5.60.
For me the most interesting part is not the burn itself.
It is the fact that Uniswap is generating stronger activity while the token still needs buyers to recognize that value.
The burn mechanism is working.
Now the market has to decide what that activity is worth.
The protocol just recorded its highest daily UNI burn value ever at around $1.15 million.
Around 184000 UNI were burned that day. That is the second highest daily burn amount on record.
The part that caught my attention is where much of this activity came from.
Robinhood Chain generated around 150000 UNI of the burn.
Robinhood Chain has been growing quickly with tokenized stock activity. Its tokenized stock holders reportedly reached around 863800 in only two months.
Daily trading volume has also been sitting around $100 million to $130 million.
Then on September 4 the chain recorded around $6 million in daily fees and about $5.4 million in revenue.
That activity is important for Uniswap because more trading creates more fees and more activity through the protocol can lead to more UNI being burned.
The numbers from Uniswap were also strong.
Daily fees reached around $12.5 million while revenue moved above $1 million.
The bigger picture is that UNI is now seeing real economic activity behind the token.
But there is an important difference between token burns and price growth.
Burning tokens reduces supply.
It does not automatically create demand.
If buyers are not willing to pay higher prices then even a large burn can have limited impact on the market.
That is exactly what makes the current UNI setup interesting.
Spot netflow turned positive at around $2.1 million after being negative by $6.6 million in the previous session.
That suggests some holders may be moving tokens toward selling.
At the same time the market structure still looks positive.
The positive directional indicator remains above the negative directional indicator. ADX is also holding above its average which suggests the current trend still has strength.
So I would not look at the $1.15 million burn and assume UNI must go up.
I would watch the price levels instead.
$6 is the level I would keep an eye on first.
If UNI can hold $6 while demand improves then $6.50 becomes an important level. A clean move above that could open the door toward $7.
But losing $6 changes the setup.
The next important support would then be around $5.60.
For me the most interesting part is not the burn itself.
It is the fact that Uniswap is generating stronger activity while the token still needs buyers to recognize that value.
The burn mechanism is working.
Now the market has to decide what that activity is worth.
381
·
--

Article
Bitcoin ETFs Just Had Their Strongest Day In MonthsBitcoin ETFs just gave the market a signal that is hard to ignore.
On September 3 spot Bitcoin ETFs recorded around $730.8 million in net inflows. That was the strongest single day since January 14.
The biggest part came from BlackRock’s IBIT with around $454 million. ARKB added about $137.7 million while FBTC brought in around $74.4 million.
What makes this more interesting is the timing.
September has usually been a difficult month for Bitcoin. But this time the first few days are showing something different.
September 1 brought around $236.5 million in ETF outflows.
Then the direction changed.
September 2 brought around $101 million in inflows.
September 3 brought the huge $730.8 million inflow.
September 4 added another $174.6 million.
So despite the large withdrawal at the start of the month Bitcoin ETFs still ended this four day period with roughly $770 million in net inflows.
For me the bigger question is why institutions are buying during a month that usually brings a lot of volatility.
One reason could be the changing expectations around US interest rates.
Federal Reserve Governor Christopher Waller recently made comments that markets viewed as supportive of keeping rates at their current level.
That can matter for Bitcoin because easier financial conditions can make risk assets more attractive.
But there is one level I am watching closely.
$80K.
Bitcoin moved above $80K but is now back near $79.6K. The next important step is not simply breaking $80K.
Bitcoin needs to turn $80K into support.
If buyers can defend that area then the recent ETF demand starts to look much more meaningful.
If Bitcoin keeps failing around $80K then the huge ETF inflows may not be enough to push price higher immediately.
The volatility is also still there. Wider Bollinger Bands are showing that large moves can continue.
Another thing caught my attention.
Bitcoin has historically spent surprisingly little time above $70K. Only around 12.7 percent of recorded daily closes were above that level.
So the market is still operating in a relatively unusual price zone.
I would not call September bullish yet.
But after years of watching September bring weakness this start is certainly different.
Institutional money is coming in.
Now Bitcoin has to prove that buyers are strong enough to hold the levels they are buying into.
Bitcoin ETFs Just Had Their Strongest Day In Months
Bitcoin ETFs just gave the market a signal that is hard to ignore.
On September 3 spot Bitcoin ETFs recorded around $730.8 million in net inflows. That was the strongest single day since January 14.
The biggest part came from BlackRock’s IBIT with around $454 million. ARKB added about $137.7 million while FBTC brought in around $74.4 million.
What makes this more interesting is the timing.
September has usually been a difficult month for Bitcoin. But this time the first few days are showing something different.
September 1 brought around $236.5 million in ETF outflows.
Then the direction changed.
September 2 brought around $101 million in inflows.
September 3 brought the huge $730.8 million inflow.
September 4 added another $174.6 million.
So despite the large withdrawal at the start of the month Bitcoin ETFs still ended this four day period with roughly $770 million in net inflows.
For me the bigger question is why institutions are buying during a month that usually brings a lot of volatility.
One reason could be the changing expectations around US interest rates.
Federal Reserve Governor Christopher Waller recently made comments that markets viewed as supportive of keeping rates at their current level.
That can matter for Bitcoin because easier financial conditions can make risk assets more attractive.
But there is one level I am watching closely.
$80K.
Bitcoin moved above $80K but is now back near $79.6K. The next important step is not simply breaking $80K.
Bitcoin needs to turn $80K into support.
If buyers can defend that area then the recent ETF demand starts to look much more meaningful.
If Bitcoin keeps failing around $80K then the huge ETF inflows may not be enough to push price higher immediately.
The volatility is also still there. Wider Bollinger Bands are showing that large moves can continue.
Another thing caught my attention.
Bitcoin has historically spent surprisingly little time above $70K. Only around 12.7 percent of recorded daily closes were above that level.
So the market is still operating in a relatively unusual price zone.
I would not call September bullish yet.
But after years of watching September bring weakness this start is certainly different.
Institutional money is coming in.
Now Bitcoin has to prove that buyers are strong enough to hold the levels they are buying into.
On September 3 spot Bitcoin ETFs recorded around $730.8 million in net inflows. That was the strongest single day since January 14.
The biggest part came from BlackRock’s IBIT with around $454 million. ARKB added about $137.7 million while FBTC brought in around $74.4 million.
What makes this more interesting is the timing.
September has usually been a difficult month for Bitcoin. But this time the first few days are showing something different.
September 1 brought around $236.5 million in ETF outflows.
Then the direction changed.
September 2 brought around $101 million in inflows.
September 3 brought the huge $730.8 million inflow.
September 4 added another $174.6 million.
So despite the large withdrawal at the start of the month Bitcoin ETFs still ended this four day period with roughly $770 million in net inflows.
For me the bigger question is why institutions are buying during a month that usually brings a lot of volatility.
One reason could be the changing expectations around US interest rates.
Federal Reserve Governor Christopher Waller recently made comments that markets viewed as supportive of keeping rates at their current level.
That can matter for Bitcoin because easier financial conditions can make risk assets more attractive.
But there is one level I am watching closely.
$80K.
Bitcoin moved above $80K but is now back near $79.6K. The next important step is not simply breaking $80K.
Bitcoin needs to turn $80K into support.
If buyers can defend that area then the recent ETF demand starts to look much more meaningful.
If Bitcoin keeps failing around $80K then the huge ETF inflows may not be enough to push price higher immediately.
The volatility is also still there. Wider Bollinger Bands are showing that large moves can continue.
Another thing caught my attention.
Bitcoin has historically spent surprisingly little time above $70K. Only around 12.7 percent of recorded daily closes were above that level.
So the market is still operating in a relatively unusual price zone.
I would not call September bullish yet.
But after years of watching September bring weakness this start is certainly different.
Institutional money is coming in.
Now Bitcoin has to prove that buyers are strong enough to hold the levels they are buying into.
144
·
--

Article
Elon Musk Did Not Need To Promote SLINK For The Scam To WorkWhat happened with SLINK is a good example of how dangerous social engineering can be in crypto.
The hacker did not need access to Elon Musk’s account. Instead they targeted an account connected to him through Shivon Zilis who is a Neuralink executive and the mother of Musk’s children.
The compromised account posted about SLINK in a way that did not immediately look like a crypto promotion. Then Elon replied to the post with an emoji.
That small reaction was enough to change the situation.
Traders saw Elon interacting with the post and many assumed he was supporting the project. The token quickly moved past an $80 million market cap.
This is where the real danger appeared.
People were not buying because they had studied the token. They were buying because they believed they had seen a signal from someone with huge influence.
Then the post was deleted.
SLINK collapsed by more than 95 percent and its market cap dropped below $1 million.
The damage was massive for traders who entered after the move. Four large wallets were reported to have losses above $807000.
But some wallets were already positioned before the crowd arrived.
The top 30 insider wallets reportedly made around $4.7 million from the move. Some of those wallets turned very early entries into more than 1200 times their initial value.
That part is what stands out to me.
The scam did not depend on complicated technology. It depended on trust.
A familiar name created attention. A simple reaction created legitimacy. FOMO brought buyers. Then insiders had liquidity to sell into.
This is why I think meme coin traders need to be more careful with social signals.
A celebrity reaction is not proof of ownership.
A post from a related account is not proof of an official project.
Even a screenshot can be misleading.
Before buying something that suddenly moves because of a famous person I would check the official account. The contract address. The token history. Wallet activity. Liquidity and who bought before the crowd arrived.
The biggest lesson from SLINK is simple.
In crypto you can lose money without anyone hacking your wallet.
Sometimes all it takes is one fake signal that makes you believe everyone else already knows something.
Elon Musk Did Not Need To Promote SLINK For The Scam To Work
What happened with SLINK is a good example of how dangerous social engineering can be in crypto.
The hacker did not need access to Elon Musk’s account. Instead they targeted an account connected to him through Shivon Zilis who is a Neuralink executive and the mother of Musk’s children.
The compromised account posted about SLINK in a way that did not immediately look like a crypto promotion. Then Elon replied to the post with an emoji.
That small reaction was enough to change the situation.
Traders saw Elon interacting with the post and many assumed he was supporting the project. The token quickly moved past an $80 million market cap.
This is where the real danger appeared.
People were not buying because they had studied the token. They were buying because they believed they had seen a signal from someone with huge influence.
Then the post was deleted.
SLINK collapsed by more than 95 percent and its market cap dropped below $1 million.
The damage was massive for traders who entered after the move. Four large wallets were reported to have losses above $807000.
But some wallets were already positioned before the crowd arrived.
The top 30 insider wallets reportedly made around $4.7 million from the move. Some of those wallets turned very early entries into more than 1200 times their initial value.
That part is what stands out to me.
The scam did not depend on complicated technology. It depended on trust.
A familiar name created attention. A simple reaction created legitimacy. FOMO brought buyers. Then insiders had liquidity to sell into.
This is why I think meme coin traders need to be more careful with social signals.
A celebrity reaction is not proof of ownership.
A post from a related account is not proof of an official project.
Even a screenshot can be misleading.
Before buying something that suddenly moves because of a famous person I would check the official account. The contract address. The token history. Wallet activity. Liquidity and who bought before the crowd arrived.
The biggest lesson from SLINK is simple.
In crypto you can lose money without anyone hacking your wallet.
Sometimes all it takes is one fake signal that makes you believe everyone else already knows something.
The hacker did not need access to Elon Musk’s account. Instead they targeted an account connected to him through Shivon Zilis who is a Neuralink executive and the mother of Musk’s children.
The compromised account posted about SLINK in a way that did not immediately look like a crypto promotion. Then Elon replied to the post with an emoji.
That small reaction was enough to change the situation.
Traders saw Elon interacting with the post and many assumed he was supporting the project. The token quickly moved past an $80 million market cap.
This is where the real danger appeared.
People were not buying because they had studied the token. They were buying because they believed they had seen a signal from someone with huge influence.
Then the post was deleted.
SLINK collapsed by more than 95 percent and its market cap dropped below $1 million.
The damage was massive for traders who entered after the move. Four large wallets were reported to have losses above $807000.
But some wallets were already positioned before the crowd arrived.
The top 30 insider wallets reportedly made around $4.7 million from the move. Some of those wallets turned very early entries into more than 1200 times their initial value.
That part is what stands out to me.
The scam did not depend on complicated technology. It depended on trust.
A familiar name created attention. A simple reaction created legitimacy. FOMO brought buyers. Then insiders had liquidity to sell into.
This is why I think meme coin traders need to be more careful with social signals.
A celebrity reaction is not proof of ownership.
A post from a related account is not proof of an official project.
Even a screenshot can be misleading.
Before buying something that suddenly moves because of a famous person I would check the official account. The contract address. The token history. Wallet activity. Liquidity and who bought before the crowd arrived.
The biggest lesson from SLINK is simple.
In crypto you can lose money without anyone hacking your wallet.
Sometimes all it takes is one fake signal that makes you believe everyone else already knows something.
286
·
--

Article
LIT Is Up 13 Percent But The Real Question Is Whether Buyers Can Keep It ThereLighter has been moving very fast lately.
LIT gained another 13 percent in the last 24 hours and reached a new local high around $4.67.
That makes it three straight green days.
What caught my attention is that this move is not happening without activity behind it.
Lighter was recently added to Robinhood Wallet and network activity picked up after the integration.
Protocol fees also jumped from around $124K to $195K in just 24 hours.
That matters because part of those fees is used to buy back LIT.
If this activity continues then the token could get support from real usage instead of only market speculation.
The numbers around open interest are also interesting.
LIT open interest increased from around $138 million at the start of September to roughly $180 million.
That shows traders are becoming more active around the token.
But there is a risk here.
Lighter has moved a long way in a short period.
The token was already up around 465 percent while HYPE was up around 136 percent and ETH was up around 24 percent over the period mentioned in the report.
That kind of performance can attract buyers quickly.
It can also attract profit taking just as quickly.
Another thing I noticed is the size difference.
Lighter's market value is around $1.09 billion while HYPE is around $21.92 billion.
That means LIT is still much smaller.
So even a relatively small amount of new money can have a bigger effect on its price compared with a much larger asset.
Network activity is also growing.
LIT transfer activity increased from 1914 on August 29 to 6196 six days later.
That is a major jump in activity.
The Robinhood Wallet integration appears to be playing an important role here.
But I would still separate network growth from price expectations.
More users and higher fees are positive.
They do not guarantee that LIT will keep making new highs.
For the chart I would watch the old range between $3.20 and $3.85.
LIT has moved well above that area now.
If the price pulls back and buyers defend the previous range then it could show that the breakout has some strength behind it.
If the price falls back into the range and loses it then the recent move could start looking more like a short term spike.
For now LIT has a lot going for it.
Strong price momentum.
Higher open interest.
More network activity.
Higher protocol fees.
And a major wallet integration bringing more attention to the project.
But after a 13 percent daily move I would not chase blindly.
The next pullback may tell us more than the next green candle.
The real test is whether LIT can turn this recent strength into lasting demand.
LIT Is Up 13 Percent But The Real Question Is Whether Buyers Can Keep It There
Lighter has been moving very fast lately.
LIT gained another 13 percent in the last 24 hours and reached a new local high around $4.67.
That makes it three straight green days.
What caught my attention is that this move is not happening without activity behind it.
Lighter was recently added to Robinhood Wallet and network activity picked up after the integration.
Protocol fees also jumped from around $124K to $195K in just 24 hours.
That matters because part of those fees is used to buy back LIT.
If this activity continues then the token could get support from real usage instead of only market speculation.
The numbers around open interest are also interesting.
LIT open interest increased from around $138 million at the start of September to roughly $180 million.
That shows traders are becoming more active around the token.
But there is a risk here.
Lighter has moved a long way in a short period.
The token was already up around 465 percent while HYPE was up around 136 percent and ETH was up around 24 percent over the period mentioned in the report.
That kind of performance can attract buyers quickly.
It can also attract profit taking just as quickly.
Another thing I noticed is the size difference.
Lighter's market value is around $1.09 billion while HYPE is around $21.92 billion.
That means LIT is still much smaller.
So even a relatively small amount of new money can have a bigger effect on its price compared with a much larger asset.
Network activity is also growing.
LIT transfer activity increased from 1914 on August 29 to 6196 six days later.
That is a major jump in activity.
The Robinhood Wallet integration appears to be playing an important role here.
But I would still separate network growth from price expectations.
More users and higher fees are positive.
They do not guarantee that LIT will keep making new highs.
For the chart I would watch the old range between $3.20 and $3.85.
LIT has moved well above that area now.
If the price pulls back and buyers defend the previous range then it could show that the breakout has some strength behind it.
If the price falls back into the range and loses it then the recent move could start looking more like a short term spike.
For now LIT has a lot going for it.
Strong price momentum.
Higher open interest.
More network activity.
Higher protocol fees.
And a major wallet integration bringing more attention to the project.
But after a 13 percent daily move I would not chase blindly.
The next pullback may tell us more than the next green candle.
The real test is whether LIT can turn this recent strength into lasting demand.
LIT gained another 13 percent in the last 24 hours and reached a new local high around $4.67.
That makes it three straight green days.
What caught my attention is that this move is not happening without activity behind it.
Lighter was recently added to Robinhood Wallet and network activity picked up after the integration.
Protocol fees also jumped from around $124K to $195K in just 24 hours.
That matters because part of those fees is used to buy back LIT.
If this activity continues then the token could get support from real usage instead of only market speculation.
The numbers around open interest are also interesting.
LIT open interest increased from around $138 million at the start of September to roughly $180 million.
That shows traders are becoming more active around the token.
But there is a risk here.
Lighter has moved a long way in a short period.
The token was already up around 465 percent while HYPE was up around 136 percent and ETH was up around 24 percent over the period mentioned in the report.
That kind of performance can attract buyers quickly.
It can also attract profit taking just as quickly.
Another thing I noticed is the size difference.
Lighter's market value is around $1.09 billion while HYPE is around $21.92 billion.
That means LIT is still much smaller.
So even a relatively small amount of new money can have a bigger effect on its price compared with a much larger asset.
Network activity is also growing.
LIT transfer activity increased from 1914 on August 29 to 6196 six days later.
That is a major jump in activity.
The Robinhood Wallet integration appears to be playing an important role here.
But I would still separate network growth from price expectations.
More users and higher fees are positive.
They do not guarantee that LIT will keep making new highs.
For the chart I would watch the old range between $3.20 and $3.85.
LIT has moved well above that area now.
If the price pulls back and buyers defend the previous range then it could show that the breakout has some strength behind it.
If the price falls back into the range and loses it then the recent move could start looking more like a short term spike.
For now LIT has a lot going for it.
Strong price momentum.
Higher open interest.
More network activity.
Higher protocol fees.
And a major wallet integration bringing more attention to the project.
But after a 13 percent daily move I would not chase blindly.
The next pullback may tell us more than the next green candle.
The real test is whether LIT can turn this recent strength into lasting demand.
390
·
--

Article
Bitcoin Had A Strong August But September Could Tell A Different StoryBitcoin entered September after a very strong August.
BTC moved from around $64.7K to $78.3K during the month. That was almost a 25 percent gain.
But here is the part that caught my attention.
The market did not look as confident as the price.
Santiment data showed average Bitcoin sentiment at around +32 in August. That was much lower than the +72 level seen in July.
So Bitcoin was going up while traders were still not fully convinced.
Now September has started and Bitcoin is still struggling to stay above $80K.
That is where the risk starts becoming interesting.
Traders have become more long biased during the past week. The Bitcoin long short ratio moved above 1 and reached around 1.08.
Funding rates are also positive.
This tells us that many traders are positioning for a breakout.
They are basically betting that Bitcoin will finally move above the resistance that has been holding it back.
But crowded long positions can become a problem if the breakout does not happen.
If Bitcoin suddenly moves lower then those traders may rush to close their positions. That can add more selling pressure to an already weak market.
Some traders are even looking much lower.
One analyst has suggested that Bitcoin could eventually fall toward $52K before finding a stronger bottom.
I would not treat that target as a prediction.
It is simply one possible downside scenario if the current structure breaks badly.
There is another thing worth watching too.
ETH/BTC finished August above its 20 month moving average.
If Ethereum continues gaining strength against Bitcoin then Bitcoin dominance could weaken further.
That could make September even more difficult for BTC.
This is why the September trap idea is getting attention.
Bitcoin had a strong August but strong August performances have sometimes been followed by weaker September moves.
That does not mean history must repeat itself.
Bitcoin can still break above $80K and completely change the picture.
But right now the market is sitting between two very different possibilities.
A breakout could bring fresh buyers and push BTC toward new highs.
A failed breakout could create a wave of long liquidations and send Bitcoin into a deeper correction.
For me the key thing is not the $52K target.
The first thing I would watch is whether Bitcoin can finally hold above $80K.
If it cannot then the market needs to respect the downside levels.
The September trap is not confirmed yet.
But with long positions increasing and demand signals looking weaker I think traders should be ready for both directions.
Sometimes the biggest risk comes when everyone is positioned for the same breakout and the market decides to move the other way.
Bitcoin Had A Strong August But September Could Tell A Different Story
Bitcoin entered September after a very strong August.
BTC moved from around $64.7K to $78.3K during the month. That was almost a 25 percent gain.
But here is the part that caught my attention.
The market did not look as confident as the price.
Santiment data showed average Bitcoin sentiment at around +32 in August. That was much lower than the +72 level seen in July.
So Bitcoin was going up while traders were still not fully convinced.
Now September has started and Bitcoin is still struggling to stay above $80K.
That is where the risk starts becoming interesting.
Traders have become more long biased during the past week. The Bitcoin long short ratio moved above 1 and reached around 1.08.
Funding rates are also positive.
This tells us that many traders are positioning for a breakout.
They are basically betting that Bitcoin will finally move above the resistance that has been holding it back.
But crowded long positions can become a problem if the breakout does not happen.
If Bitcoin suddenly moves lower then those traders may rush to close their positions. That can add more selling pressure to an already weak market.
Some traders are even looking much lower.
One analyst has suggested that Bitcoin could eventually fall toward $52K before finding a stronger bottom.
I would not treat that target as a prediction.
It is simply one possible downside scenario if the current structure breaks badly.
There is another thing worth watching too.
ETH/BTC finished August above its 20 month moving average.
If Ethereum continues gaining strength against Bitcoin then Bitcoin dominance could weaken further.
That could make September even more difficult for BTC.
This is why the September trap idea is getting attention.
Bitcoin had a strong August but strong August performances have sometimes been followed by weaker September moves.
That does not mean history must repeat itself.
Bitcoin can still break above $80K and completely change the picture.
But right now the market is sitting between two very different possibilities.
A breakout could bring fresh buyers and push BTC toward new highs.
A failed breakout could create a wave of long liquidations and send Bitcoin into a deeper correction.
For me the key thing is not the $52K target.
The first thing I would watch is whether Bitcoin can finally hold above $80K.
If it cannot then the market needs to respect the downside levels.
The September trap is not confirmed yet.
But with long positions increasing and demand signals looking weaker I think traders should be ready for both directions.
Sometimes the biggest risk comes when everyone is positioned for the same breakout and the market decides to move the other way.
BTC moved from around $64.7K to $78.3K during the month. That was almost a 25 percent gain.
But here is the part that caught my attention.
The market did not look as confident as the price.
Santiment data showed average Bitcoin sentiment at around +32 in August. That was much lower than the +72 level seen in July.
So Bitcoin was going up while traders were still not fully convinced.
Now September has started and Bitcoin is still struggling to stay above $80K.
That is where the risk starts becoming interesting.
Traders have become more long biased during the past week. The Bitcoin long short ratio moved above 1 and reached around 1.08.
Funding rates are also positive.
This tells us that many traders are positioning for a breakout.
They are basically betting that Bitcoin will finally move above the resistance that has been holding it back.
But crowded long positions can become a problem if the breakout does not happen.
If Bitcoin suddenly moves lower then those traders may rush to close their positions. That can add more selling pressure to an already weak market.
Some traders are even looking much lower.
One analyst has suggested that Bitcoin could eventually fall toward $52K before finding a stronger bottom.
I would not treat that target as a prediction.
It is simply one possible downside scenario if the current structure breaks badly.
There is another thing worth watching too.
ETH/BTC finished August above its 20 month moving average.
If Ethereum continues gaining strength against Bitcoin then Bitcoin dominance could weaken further.
That could make September even more difficult for BTC.
This is why the September trap idea is getting attention.
Bitcoin had a strong August but strong August performances have sometimes been followed by weaker September moves.
That does not mean history must repeat itself.
Bitcoin can still break above $80K and completely change the picture.
But right now the market is sitting between two very different possibilities.
A breakout could bring fresh buyers and push BTC toward new highs.
A failed breakout could create a wave of long liquidations and send Bitcoin into a deeper correction.
For me the key thing is not the $52K target.
The first thing I would watch is whether Bitcoin can finally hold above $80K.
If it cannot then the market needs to respect the downside levels.
The September trap is not confirmed yet.
But with long positions increasing and demand signals looking weaker I think traders should be ready for both directions.
Sometimes the biggest risk comes when everyone is positioned for the same breakout and the market decides to move the other way.
157
·
--
Article
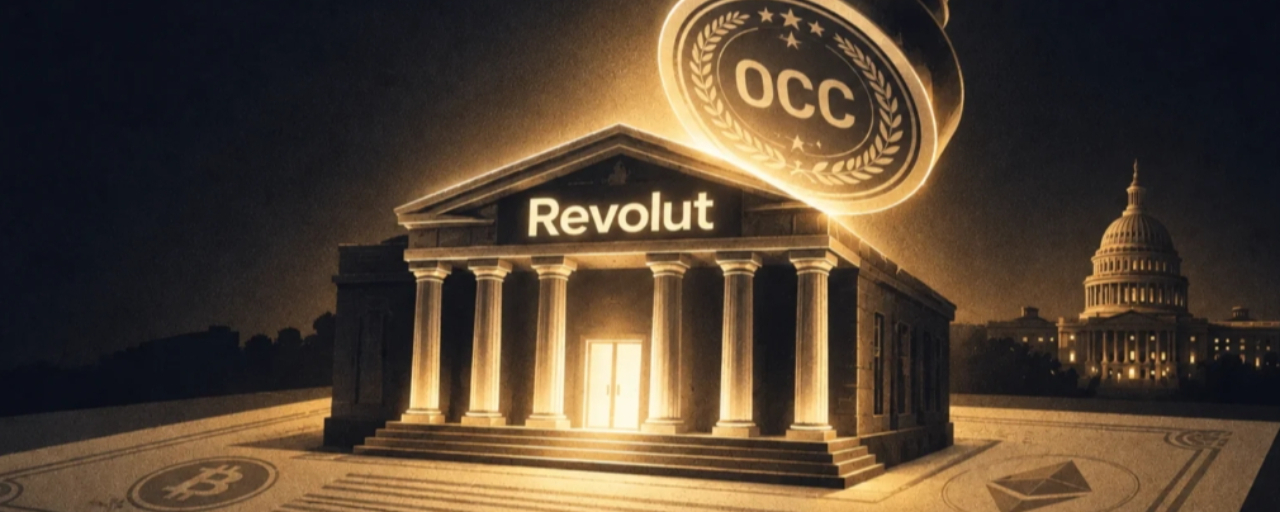
Revolut Just Got A Green Light But The Bigger Crypto Story Is Still AheadRevolut has taken an important step into the US banking market.
The Office of the Comptroller of the Currency has given Revolut conditional approval to establish a national bank.
This is a big move because it would allow Revolut to build its own banking system under federal supervision in the US.
But there is an important detail.
This is not the final approval yet.
Revolut still needs to meet the conditions set by the OCC. It also needs approval from the FDIC and the Federal Reserve before it can fully begin banking operations.
Still this move is interesting for crypto.
Revolut already has its euro backed stablecoin called EURR.
The stablecoin has received mixed reactions since its launch. But having a regulated banking structure in the US could give Revolut more room to build financial products around digital assets and stablecoins.
That is where I think the bigger story is.
Crypto companies are slowly moving closer to the traditional banking system.
Over the past year several major crypto firms have also received conditional approvals for national trust bank charters.
This shows that US regulators are creating a path for companies working with digital assets to operate under federal banking supervision.
But not every approval will automatically be good for crypto.
The important part is how these companies use the access they receive.
A bank charter can bring more trust and stronger infrastructure. But it also brings more rules and more responsibility.
For Revolut the next challenge is proving that it can satisfy the remaining requirements.
There is also a bigger regulatory question hanging over the market.
The CLARITY Act has already faced delays and the House now has a very limited voting schedule in September.
That means the crypto industry could still be waiting for broader market structure rules while individual companies continue moving forward through existing regulatory channels.
This is an interesting situation.
The legislation is moving slowly.
But the industry itself is not waiting.
Companies are finding ways to build regulated products and financial services while the wider legal framework is still being discussed.
Revolut's conditional approval does not mean crypto has suddenly received full regulatory clarity in the US.
But it does show that digital asset companies can move deeper into the banking system if they meet the required standards.
And EURR makes this even more interesting.
A euro backed stablecoin combined with a US banking structure could give Revolut a much larger platform for future financial products.
For now I would not treat this as the finish line.
It is the first major step.
The real story will be what Revolut does after getting through the remaining approvals.
That is where the impact on stablecoins and crypto could become much clearer.
Revolut Just Got A Green Light But The Bigger Crypto Story Is Still Ahead
Revolut has taken an important step into the US banking market.
The Office of the Comptroller of the Currency has given Revolut conditional approval to establish a national bank.
This is a big move because it would allow Revolut to build its own banking system under federal supervision in the US.
But there is an important detail.
This is not the final approval yet.
Revolut still needs to meet the conditions set by the OCC. It also needs approval from the FDIC and the Federal Reserve before it can fully begin banking operations.
Still this move is interesting for crypto.
Revolut already has its euro backed stablecoin called EURR.
The stablecoin has received mixed reactions since its launch. But having a regulated banking structure in the US could give Revolut more room to build financial products around digital assets and stablecoins.
That is where I think the bigger story is.
Crypto companies are slowly moving closer to the traditional banking system.
Over the past year several major crypto firms have also received conditional approvals for national trust bank charters.
This shows that US regulators are creating a path for companies working with digital assets to operate under federal banking supervision.
But not every approval will automatically be good for crypto.
The important part is how these companies use the access they receive.
A bank charter can bring more trust and stronger infrastructure. But it also brings more rules and more responsibility.
For Revolut the next challenge is proving that it can satisfy the remaining requirements.
There is also a bigger regulatory question hanging over the market.
The CLARITY Act has already faced delays and the House now has a very limited voting schedule in September.
That means the crypto industry could still be waiting for broader market structure rules while individual companies continue moving forward through existing regulatory channels.
This is an interesting situation.
The legislation is moving slowly.
But the industry itself is not waiting.
Companies are finding ways to build regulated products and financial services while the wider legal framework is still being discussed.
Revolut's conditional approval does not mean crypto has suddenly received full regulatory clarity in the US.
But it does show that digital asset companies can move deeper into the banking system if they meet the required standards.
And EURR makes this even more interesting.
A euro backed stablecoin combined with a US banking structure could give Revolut a much larger platform for future financial products.
For now I would not treat this as the finish line.
It is the first major step.
The real story will be what Revolut does after getting through the remaining approvals.
That is where the impact on stablecoins and crypto could become much clearer.
The Office of the Comptroller of the Currency has given Revolut conditional approval to establish a national bank.
This is a big move because it would allow Revolut to build its own banking system under federal supervision in the US.
But there is an important detail.
This is not the final approval yet.
Revolut still needs to meet the conditions set by the OCC. It also needs approval from the FDIC and the Federal Reserve before it can fully begin banking operations.
Still this move is interesting for crypto.
Revolut already has its euro backed stablecoin called EURR.
The stablecoin has received mixed reactions since its launch. But having a regulated banking structure in the US could give Revolut more room to build financial products around digital assets and stablecoins.
That is where I think the bigger story is.
Crypto companies are slowly moving closer to the traditional banking system.
Over the past year several major crypto firms have also received conditional approvals for national trust bank charters.
This shows that US regulators are creating a path for companies working with digital assets to operate under federal banking supervision.
But not every approval will automatically be good for crypto.
The important part is how these companies use the access they receive.
A bank charter can bring more trust and stronger infrastructure. But it also brings more rules and more responsibility.
For Revolut the next challenge is proving that it can satisfy the remaining requirements.
There is also a bigger regulatory question hanging over the market.
The CLARITY Act has already faced delays and the House now has a very limited voting schedule in September.
That means the crypto industry could still be waiting for broader market structure rules while individual companies continue moving forward through existing regulatory channels.
This is an interesting situation.
The legislation is moving slowly.
But the industry itself is not waiting.
Companies are finding ways to build regulated products and financial services while the wider legal framework is still being discussed.
Revolut's conditional approval does not mean crypto has suddenly received full regulatory clarity in the US.
But it does show that digital asset companies can move deeper into the banking system if they meet the required standards.
And EURR makes this even more interesting.
A euro backed stablecoin combined with a US banking structure could give Revolut a much larger platform for future financial products.
For now I would not treat this as the finish line.
It is the first major step.
The real story will be what Revolut does after getting through the remaining approvals.
That is where the impact on stablecoins and crypto could become much clearer.
123
·
--

Article
El Salvador Is Still Adding Bitcoin But The IMF Says There Is A Different ReasonEl Salvador's Bitcoin story has taken another interesting turn.
The country's official Bitcoin balance has continued to grow even though its agreement with the IMF placed limits on new public sector Bitcoin purchases.
So how did the balance keep increasing?
The IMF has now explained that the Bitcoin added to official holdings since June 2025 came from private donations.
According to the IMF there were no new public purchases behind this increase. It also said that no further buying beyond the documented donations is expected.
This explains the growing balance.
El Salvador's official tracker showed around 7764 BTC at the time of the report.
The balance also received a major increase of around 1000 BTC in November. After that the country continued receiving around one Bitcoin per day.
The interesting part is that the IMF did not disclose who the donors were or exactly how much Bitcoin each person or group provided.
That leaves some questions open.
But the main point is clear.
The increase in Bitcoin holdings was not coming from the government simply buying more BTC with public money.
This matters because Bitcoin has been one of the biggest points of discussion between El Salvador and the IMF.
The country agreed to several changes as part of its $1.4 billion financing programme.
One of those changes was making Bitcoin acceptance voluntary for private businesses.
The government also agreed to limit its involvement in Bitcoin purchases.
Another major change involved the Chivo wallet.
Most of its operations and ownership control were moved to a private operator while the government kept responsibility for customer asset custody.
This shows how different El Salvador's Bitcoin strategy looks today compared with 2021.
Back then the country made Bitcoin legal tender and wanted it to become part of everyday payments.
But actual usage did not grow as much as expected.
Over time the focus shifted more toward holding Bitcoin rather than using it for daily purchases.
And now the country continues to hold a large Bitcoin balance while the increase is being explained through private donations.
I think this is an important distinction.
Seeing El Salvador's Bitcoin balance rise does not automatically mean the government has restarted aggressive buying.
The source of those coins matters.
For Bitcoin supporters this may still be a positive story because it shows that private groups are willing to contribute BTC to the country's official holdings.
But from an investment point of view the bigger story is how El Salvador's role with Bitcoin has changed.
The country started with the idea of everyday Bitcoin use.
Today it looks much more like a long term Bitcoin holding strategy.
The IMF clarification removes some confusion around why the balance keeps rising.
But it also shows that El Salvador's Bitcoin experiment is still evolving.
El Salvador Is Still Adding Bitcoin But The IMF Says There Is A Different Reason
El Salvador's Bitcoin story has taken another interesting turn.
The country's official Bitcoin balance has continued to grow even though its agreement with the IMF placed limits on new public sector Bitcoin purchases.
So how did the balance keep increasing?
The IMF has now explained that the Bitcoin added to official holdings since June 2025 came from private donations.
According to the IMF there were no new public purchases behind this increase. It also said that no further buying beyond the documented donations is expected.
This explains the growing balance.
El Salvador's official tracker showed around 7764 BTC at the time of the report.
The balance also received a major increase of around 1000 BTC in November. After that the country continued receiving around one Bitcoin per day.
The interesting part is that the IMF did not disclose who the donors were or exactly how much Bitcoin each person or group provided.
That leaves some questions open.
But the main point is clear.
The increase in Bitcoin holdings was not coming from the government simply buying more BTC with public money.
This matters because Bitcoin has been one of the biggest points of discussion between El Salvador and the IMF.
The country agreed to several changes as part of its $1.4 billion financing programme.
One of those changes was making Bitcoin acceptance voluntary for private businesses.
The government also agreed to limit its involvement in Bitcoin purchases.
Another major change involved the Chivo wallet.
Most of its operations and ownership control were moved to a private operator while the government kept responsibility for customer asset custody.
This shows how different El Salvador's Bitcoin strategy looks today compared with 2021.
Back then the country made Bitcoin legal tender and wanted it to become part of everyday payments.
But actual usage did not grow as much as expected.
Over time the focus shifted more toward holding Bitcoin rather than using it for daily purchases.
And now the country continues to hold a large Bitcoin balance while the increase is being explained through private donations.
I think this is an important distinction.
Seeing El Salvador's Bitcoin balance rise does not automatically mean the government has restarted aggressive buying.
The source of those coins matters.
For Bitcoin supporters this may still be a positive story because it shows that private groups are willing to contribute BTC to the country's official holdings.
But from an investment point of view the bigger story is how El Salvador's role with Bitcoin has changed.
The country started with the idea of everyday Bitcoin use.
Today it looks much more like a long term Bitcoin holding strategy.
The IMF clarification removes some confusion around why the balance keeps rising.
But it also shows that El Salvador's Bitcoin experiment is still evolving.
The country's official Bitcoin balance has continued to grow even though its agreement with the IMF placed limits on new public sector Bitcoin purchases.
So how did the balance keep increasing?
The IMF has now explained that the Bitcoin added to official holdings since June 2025 came from private donations.
According to the IMF there were no new public purchases behind this increase. It also said that no further buying beyond the documented donations is expected.
This explains the growing balance.
El Salvador's official tracker showed around 7764 BTC at the time of the report.
The balance also received a major increase of around 1000 BTC in November. After that the country continued receiving around one Bitcoin per day.
The interesting part is that the IMF did not disclose who the donors were or exactly how much Bitcoin each person or group provided.
That leaves some questions open.
But the main point is clear.
The increase in Bitcoin holdings was not coming from the government simply buying more BTC with public money.
This matters because Bitcoin has been one of the biggest points of discussion between El Salvador and the IMF.
The country agreed to several changes as part of its $1.4 billion financing programme.
One of those changes was making Bitcoin acceptance voluntary for private businesses.
The government also agreed to limit its involvement in Bitcoin purchases.
Another major change involved the Chivo wallet.
Most of its operations and ownership control were moved to a private operator while the government kept responsibility for customer asset custody.
This shows how different El Salvador's Bitcoin strategy looks today compared with 2021.
Back then the country made Bitcoin legal tender and wanted it to become part of everyday payments.
But actual usage did not grow as much as expected.
Over time the focus shifted more toward holding Bitcoin rather than using it for daily purchases.
And now the country continues to hold a large Bitcoin balance while the increase is being explained through private donations.
I think this is an important distinction.
Seeing El Salvador's Bitcoin balance rise does not automatically mean the government has restarted aggressive buying.
The source of those coins matters.
For Bitcoin supporters this may still be a positive story because it shows that private groups are willing to contribute BTC to the country's official holdings.
But from an investment point of view the bigger story is how El Salvador's role with Bitcoin has changed.
The country started with the idea of everyday Bitcoin use.
Today it looks much more like a long term Bitcoin holding strategy.
The IMF clarification removes some confusion around why the balance keeps rising.
But it also shows that El Salvador's Bitcoin experiment is still evolving.
104
·
--

Article
El Salvador Is Still Adding Bitcoin But The IMF Says There Is A Different ReasonEl Salvador's Bitcoin story has taken another interesting turn.
The country's official Bitcoin balance has continued to grow even though its agreement with the IMF placed limits on new public sector Bitcoin purchases.
So how did the balance keep increasing?
The IMF has now explained that the Bitcoin added to official holdings since June 2025 came from private donations.
According to the IMF there were no new public purchases behind this increase. It also said that no further buying beyond the documented donations is expected.
This explains the growing balance.
El Salvador's official tracker showed around 7764 BTC at the time of the report.
The balance also received a major increase of around 1000 BTC in November. After that the country continued receiving around one Bitcoin per day.
The interesting part is that the IMF did not disclose who the donors were or exactly how much Bitcoin each person or group provided.
That leaves some questions open.
But the main point is clear.
The increase in Bitcoin holdings was not coming from the government simply buying more BTC with public money.
This matters because Bitcoin has been one of the biggest points of discussion between El Salvador and the IMF.
The country agreed to several changes as part of its $1.4 billion financing programme.
One of those changes was making Bitcoin acceptance voluntary for private businesses.
The government also agreed to limit its involvement in Bitcoin purchases.
Another major change involved the Chivo wallet.
Most of its operations and ownership control were moved to a private operator while the government kept responsibility for customer asset custody.
This shows how different El Salvador's Bitcoin strategy looks today compared with 2021.
Back then the country made Bitcoin legal tender and wanted it to become part of everyday payments.
But actual usage did not grow as much as expected.
Over time the focus shifted more toward holding Bitcoin rather than using it for daily purchases.
And now the country continues to hold a large Bitcoin balance while the increase is being explained through private donations.
I think this is an important distinction.
Seeing El Salvador's Bitcoin balance rise does not automatically mean the government has restarted aggressive buying.
The source of those coins matters.
For Bitcoin supporters this may still be a positive story because it shows that private groups are willing to contribute BTC to the country's official holdings.
But from an investment point of view the bigger story is how El Salvador's role with Bitcoin has changed.
The country started with the idea of everyday Bitcoin use.
Today it looks much more like a long term Bitcoin holding strategy.
The IMF clarification removes some confusion around why the balance keeps rising.
But it also shows that El Salvador's Bitcoin experiment is still evolving.
El Salvador Is Still Adding Bitcoin But The IMF Says There Is A Different Reason
El Salvador's Bitcoin story has taken another interesting turn.
The country's official Bitcoin balance has continued to grow even though its agreement with the IMF placed limits on new public sector Bitcoin purchases.
So how did the balance keep increasing?
The IMF has now explained that the Bitcoin added to official holdings since June 2025 came from private donations.
According to the IMF there were no new public purchases behind this increase. It also said that no further buying beyond the documented donations is expected.
This explains the growing balance.
El Salvador's official tracker showed around 7764 BTC at the time of the report.
The balance also received a major increase of around 1000 BTC in November. After that the country continued receiving around one Bitcoin per day.
The interesting part is that the IMF did not disclose who the donors were or exactly how much Bitcoin each person or group provided.
That leaves some questions open.
But the main point is clear.
The increase in Bitcoin holdings was not coming from the government simply buying more BTC with public money.
This matters because Bitcoin has been one of the biggest points of discussion between El Salvador and the IMF.
The country agreed to several changes as part of its $1.4 billion financing programme.
One of those changes was making Bitcoin acceptance voluntary for private businesses.
The government also agreed to limit its involvement in Bitcoin purchases.
Another major change involved the Chivo wallet.
Most of its operations and ownership control were moved to a private operator while the government kept responsibility for customer asset custody.
This shows how different El Salvador's Bitcoin strategy looks today compared with 2021.
Back then the country made Bitcoin legal tender and wanted it to become part of everyday payments.
But actual usage did not grow as much as expected.
Over time the focus shifted more toward holding Bitcoin rather than using it for daily purchases.
And now the country continues to hold a large Bitcoin balance while the increase is being explained through private donations.
I think this is an important distinction.
Seeing El Salvador's Bitcoin balance rise does not automatically mean the government has restarted aggressive buying.
The source of those coins matters.
For Bitcoin supporters this may still be a positive story because it shows that private groups are willing to contribute BTC to the country's official holdings.
But from an investment point of view the bigger story is how El Salvador's role with Bitcoin has changed.
The country started with the idea of everyday Bitcoin use.
Today it looks much more like a long term Bitcoin holding strategy.
The IMF clarification removes some confusion around why the balance keeps rising.
But it also shows that El Salvador's Bitcoin experiment is still evolving.
The country's official Bitcoin balance has continued to grow even though its agreement with the IMF placed limits on new public sector Bitcoin purchases.
So how did the balance keep increasing?
The IMF has now explained that the Bitcoin added to official holdings since June 2025 came from private donations.
According to the IMF there were no new public purchases behind this increase. It also said that no further buying beyond the documented donations is expected.
This explains the growing balance.
El Salvador's official tracker showed around 7764 BTC at the time of the report.
The balance also received a major increase of around 1000 BTC in November. After that the country continued receiving around one Bitcoin per day.
The interesting part is that the IMF did not disclose who the donors were or exactly how much Bitcoin each person or group provided.
That leaves some questions open.
But the main point is clear.
The increase in Bitcoin holdings was not coming from the government simply buying more BTC with public money.
This matters because Bitcoin has been one of the biggest points of discussion between El Salvador and the IMF.
The country agreed to several changes as part of its $1.4 billion financing programme.
One of those changes was making Bitcoin acceptance voluntary for private businesses.
The government also agreed to limit its involvement in Bitcoin purchases.
Another major change involved the Chivo wallet.
Most of its operations and ownership control were moved to a private operator while the government kept responsibility for customer asset custody.
This shows how different El Salvador's Bitcoin strategy looks today compared with 2021.
Back then the country made Bitcoin legal tender and wanted it to become part of everyday payments.
But actual usage did not grow as much as expected.
Over time the focus shifted more toward holding Bitcoin rather than using it for daily purchases.
And now the country continues to hold a large Bitcoin balance while the increase is being explained through private donations.
I think this is an important distinction.
Seeing El Salvador's Bitcoin balance rise does not automatically mean the government has restarted aggressive buying.
The source of those coins matters.
For Bitcoin supporters this may still be a positive story because it shows that private groups are willing to contribute BTC to the country's official holdings.
But from an investment point of view the bigger story is how El Salvador's role with Bitcoin has changed.
The country started with the idea of everyday Bitcoin use.
Today it looks much more like a long term Bitcoin holding strategy.
The IMF clarification removes some confusion around why the balance keeps rising.
But it also shows that El Salvador's Bitcoin experiment is still evolving.
122
·
--

Article
ZEC Just Broke $1000 But The Real Test Is Still AheadZcash has suddenly become one of the biggest stories in crypto.
ZEC briefly moved above $1000 before pulling back toward the $980 area. The move pushed Zcash into the top ten crypto assets by market value.
Its market value reached around $16.5 billion.
The trading activity is also hard to ignore.
ZEC trading volume jumped by 173% and reached around $1.62 billion in 24 hours.
That is a huge amount of activity for a coin that was trading below $500 back in August.
Since then the move has been almost nonstop.
ZEC moved above $800 and then pushed toward the $1000 level. The broader crypto market has also improved during this period which has helped create better conditions for buyers.
But crossing $1000 is one thing.
Holding above $1000 is another.
ZEC reached around $1027.80 before falling back below the milestone.
That quick rejection tells me some holders were ready to take profits once the psychological $1000 level was reached.
This is not automatically a bad sign.
After such a strong move it is normal for early buyers to take some money off the table.
The bigger question is whether new buyers are strong enough to absorb that selling.
The current momentum reading is around 78.33 which shows how strong the recent buying has been.
But it also tells us that the move has become stretched in a short period.
When a coin moves this quickly the risk of sharp pullbacks also increases.
For me there are two levels that matter now.
The first is $1000.
If ZEC can reclaim $1000 and then break above the recent high around $1028 with strong volume then the bullish move could continue.
But if buyers fail to reclaim the level then I would watch $900.
That area could become the first serious test of whether buyers are willing to step back in after the recent rally.
The most important thing here is not the number $1000 itself.
It is how ZEC behaves after reaching it.
A strong coin should eventually turn an old resistance level into support.
If ZEC can do that then this move could have more room.
If it keeps getting rejected around $1000 then the market may need more time to cool down.
Right now ZEC has strong momentum and huge trading activity.
But after a move this fast I would rather watch the pullback than chase the green candles.
The next reaction around $1000 and $900 could tell us much more than the move above $1000 itself.
ZEC Just Broke $1000 But The Real Test Is Still Ahead
Zcash has suddenly become one of the biggest stories in crypto.
ZEC briefly moved above $1000 before pulling back toward the $980 area. The move pushed Zcash into the top ten crypto assets by market value.
Its market value reached around $16.5 billion.
The trading activity is also hard to ignore.
ZEC trading volume jumped by 173% and reached around $1.62 billion in 24 hours.
That is a huge amount of activity for a coin that was trading below $500 back in August.
Since then the move has been almost nonstop.
ZEC moved above $800 and then pushed toward the $1000 level. The broader crypto market has also improved during this period which has helped create better conditions for buyers.
But crossing $1000 is one thing.
Holding above $1000 is another.
ZEC reached around $1027.80 before falling back below the milestone.
That quick rejection tells me some holders were ready to take profits once the psychological $1000 level was reached.
This is not automatically a bad sign.
After such a strong move it is normal for early buyers to take some money off the table.
The bigger question is whether new buyers are strong enough to absorb that selling.
The current momentum reading is around 78.33 which shows how strong the recent buying has been.
But it also tells us that the move has become stretched in a short period.
When a coin moves this quickly the risk of sharp pullbacks also increases.
For me there are two levels that matter now.
The first is $1000.
If ZEC can reclaim $1000 and then break above the recent high around $1028 with strong volume then the bullish move could continue.
But if buyers fail to reclaim the level then I would watch $900.
That area could become the first serious test of whether buyers are willing to step back in after the recent rally.
The most important thing here is not the number $1000 itself.
It is how ZEC behaves after reaching it.
A strong coin should eventually turn an old resistance level into support.
If ZEC can do that then this move could have more room.
If it keeps getting rejected around $1000 then the market may need more time to cool down.
Right now ZEC has strong momentum and huge trading activity.
But after a move this fast I would rather watch the pullback than chase the green candles.
The next reaction around $1000 and $900 could tell us much more than the move above $1000 itself.
ZEC briefly moved above $1000 before pulling back toward the $980 area. The move pushed Zcash into the top ten crypto assets by market value.
Its market value reached around $16.5 billion.
The trading activity is also hard to ignore.
ZEC trading volume jumped by 173% and reached around $1.62 billion in 24 hours.
That is a huge amount of activity for a coin that was trading below $500 back in August.
Since then the move has been almost nonstop.
ZEC moved above $800 and then pushed toward the $1000 level. The broader crypto market has also improved during this period which has helped create better conditions for buyers.
But crossing $1000 is one thing.
Holding above $1000 is another.
ZEC reached around $1027.80 before falling back below the milestone.
That quick rejection tells me some holders were ready to take profits once the psychological $1000 level was reached.
This is not automatically a bad sign.
After such a strong move it is normal for early buyers to take some money off the table.
The bigger question is whether new buyers are strong enough to absorb that selling.
The current momentum reading is around 78.33 which shows how strong the recent buying has been.
But it also tells us that the move has become stretched in a short period.
When a coin moves this quickly the risk of sharp pullbacks also increases.
For me there are two levels that matter now.
The first is $1000.
If ZEC can reclaim $1000 and then break above the recent high around $1028 with strong volume then the bullish move could continue.
But if buyers fail to reclaim the level then I would watch $900.
That area could become the first serious test of whether buyers are willing to step back in after the recent rally.
The most important thing here is not the number $1000 itself.
It is how ZEC behaves after reaching it.
A strong coin should eventually turn an old resistance level into support.
If ZEC can do that then this move could have more room.
If it keeps getting rejected around $1000 then the market may need more time to cool down.
Right now ZEC has strong momentum and huge trading activity.
But after a move this fast I would rather watch the pullback than chase the green candles.
The next reaction around $1000 and $900 could tell us much more than the move above $1000 itself.
426
·
--

Article
Bitcoin Rejected $82K And The Next Move Could Be ImportantBitcoin pushed above $82K on September 3 but the move did not last long.
BTC quickly faced selling pressure near $82.2K and pulled back from the level.
What makes this move interesting is that Bitcoin had some strong support behind it.
Spot Bitcoin ETFs recorded around $730.8 million in net inflows on Thursday. Comments from Federal Reserve Governor Christopher Waller also helped the market as expectations around a September rate hike became weaker.
Yet Bitcoin still could not hold above $82K.
That tells me the problem may not be the lack of money coming into Bitcoin ETFs.
The bigger issue could be the lack of wider demand.
One important level right now is the 365 day moving average. It sits around $82.2K and Bitcoin was rejected almost exactly there.
This level has been important during previous market cycles. Breaking above it and holding could give bulls a much stronger setup.
But Bitcoin has not done that yet.
Another warning comes from apparent demand.
This metric has been showing weaker demand around the current price area. That means the rally is facing resistance while fresh buying is not growing as strongly as bulls would want.
The Coinbase Premium Index is also worth watching.
It briefly moved positive in late August which suggested stronger demand from US investors. But it has since weakened again.
So the picture is mixed.
ETF money is coming back.
But some of the broader demand signals are moving in the opposite direction.
There is also another risk.
Bitcoin's Capital and Flow Regime Index has stayed at a level that has previously appeared during periods before price declines.
This does not mean Bitcoin must crash.
But when several warning signs appear near a major resistance level I would rather watch the reaction than chase the move.
The $82K area is now very important.
Bitcoin also has the previous swing high around $82.85K sitting above it. A clean break above that zone could change the picture and bring more confidence to the bullish side.
But if BTC starts losing support then the downside levels become important.
A break below $75.5K could open the door toward $70.2K.
If that level also fails then $66.9K becomes another possible target.
For now I think Bitcoin is at a decision point.
The ETF inflows are clearly positive.
But price needs to prove that fresh demand is strong enough to absorb sellers around $82K.
Until Bitcoin can reclaim this area and hold it I would stay careful.
The next move could tell us whether this was the start of a bigger breakout or simply another rejection near a major resistance zone.
Bitcoin Rejected $82K And The Next Move Could Be Important
Bitcoin pushed above $82K on September 3 but the move did not last long.
BTC quickly faced selling pressure near $82.2K and pulled back from the level.
What makes this move interesting is that Bitcoin had some strong support behind it.
Spot Bitcoin ETFs recorded around $730.8 million in net inflows on Thursday. Comments from Federal Reserve Governor Christopher Waller also helped the market as expectations around a September rate hike became weaker.
Yet Bitcoin still could not hold above $82K.
That tells me the problem may not be the lack of money coming into Bitcoin ETFs.
The bigger issue could be the lack of wider demand.
One important level right now is the 365 day moving average. It sits around $82.2K and Bitcoin was rejected almost exactly there.
This level has been important during previous market cycles. Breaking above it and holding could give bulls a much stronger setup.
But Bitcoin has not done that yet.
Another warning comes from apparent demand.
This metric has been showing weaker demand around the current price area. That means the rally is facing resistance while fresh buying is not growing as strongly as bulls would want.
The Coinbase Premium Index is also worth watching.
It briefly moved positive in late August which suggested stronger demand from US investors. But it has since weakened again.
So the picture is mixed.
ETF money is coming back.
But some of the broader demand signals are moving in the opposite direction.
There is also another risk.
Bitcoin's Capital and Flow Regime Index has stayed at a level that has previously appeared during periods before price declines.
This does not mean Bitcoin must crash.
But when several warning signs appear near a major resistance level I would rather watch the reaction than chase the move.
The $82K area is now very important.
Bitcoin also has the previous swing high around $82.85K sitting above it. A clean break above that zone could change the picture and bring more confidence to the bullish side.
But if BTC starts losing support then the downside levels become important.
A break below $75.5K could open the door toward $70.2K.
If that level also fails then $66.9K becomes another possible target.
For now I think Bitcoin is at a decision point.
The ETF inflows are clearly positive.
But price needs to prove that fresh demand is strong enough to absorb sellers around $82K.
Until Bitcoin can reclaim this area and hold it I would stay careful.
The next move could tell us whether this was the start of a bigger breakout or simply another rejection near a major resistance zone.
BTC quickly faced selling pressure near $82.2K and pulled back from the level.
What makes this move interesting is that Bitcoin had some strong support behind it.
Spot Bitcoin ETFs recorded around $730.8 million in net inflows on Thursday. Comments from Federal Reserve Governor Christopher Waller also helped the market as expectations around a September rate hike became weaker.
Yet Bitcoin still could not hold above $82K.
That tells me the problem may not be the lack of money coming into Bitcoin ETFs.
The bigger issue could be the lack of wider demand.
One important level right now is the 365 day moving average. It sits around $82.2K and Bitcoin was rejected almost exactly there.
This level has been important during previous market cycles. Breaking above it and holding could give bulls a much stronger setup.
But Bitcoin has not done that yet.
Another warning comes from apparent demand.
This metric has been showing weaker demand around the current price area. That means the rally is facing resistance while fresh buying is not growing as strongly as bulls would want.
The Coinbase Premium Index is also worth watching.
It briefly moved positive in late August which suggested stronger demand from US investors. But it has since weakened again.
So the picture is mixed.
ETF money is coming back.
But some of the broader demand signals are moving in the opposite direction.
There is also another risk.
Bitcoin's Capital and Flow Regime Index has stayed at a level that has previously appeared during periods before price declines.
This does not mean Bitcoin must crash.
But when several warning signs appear near a major resistance level I would rather watch the reaction than chase the move.
The $82K area is now very important.
Bitcoin also has the previous swing high around $82.85K sitting above it. A clean break above that zone could change the picture and bring more confidence to the bullish side.
But if BTC starts losing support then the downside levels become important.
A break below $75.5K could open the door toward $70.2K.
If that level also fails then $66.9K becomes another possible target.
For now I think Bitcoin is at a decision point.
The ETF inflows are clearly positive.
But price needs to prove that fresh demand is strong enough to absorb sellers around $82K.
Until Bitcoin can reclaim this area and hold it I would stay careful.
The next move could tell us whether this was the start of a bigger breakout or simply another rejection near a major resistance zone.
221
·
--

Article
XRP ETF Demand Is Growing But XRP Price Is Still Not RespondingXRP has an interesting problem right now.
Money is flowing into XRP ETFs but the price is still struggling.
By the end of August cumulative XRP ETF inflows had reached around $1.67 billion. Weekly inflows also increased from about $39.78 million to $110.49 million.
Weekly trading volume moved higher as well. It increased from around $253 million to more than $363 million.
ETF assets also grew from about $1.33 billion to $1.44 billion.
Normally this kind of demand should give XRP some support.
But the price tells a different story.
XRP moved from around $1.70 down toward the $1.35 to $1.40 area during the same period.
That tells me something important.
Strong ETF demand does not automatically mean the price will rise.
There is still enough selling in the wider market to absorb that demand.
Another interesting part is the amount of XRP being held through these ETF products.
The seven XRP ETFs together are estimated to hold around 1.11 billion XRP.
That means more than 1 percent of the total supply has been taken away from immediate market circulation.
This could become more important over time.
If ETF products continue collecting XRP while fewer coins remain available for trading then even a moderate increase in new demand could have a bigger effect on price.
There is also growing interest from large financial firms.
Goldman Sachs reportedly holds around $87.4 million in XRP exposure and increased its position by more than $80 million compared with the previous quarter.
Jane Street and Millennium also have exposure of around $16 million each.
Yet XRP is still around $1.38.
So the main question is not whether institutions are buying.
The bigger question is whether their buying is strong enough to overcome the sellers already in the market.
The growing number of XRP ETF products is another positive development.
More products give investors more ways to get regulated exposure to XRP. It also spreads trading activity across different funds instead of keeping everything concentrated in one place.
But I would still be careful here.
ETF inflows are a good sign for long term demand. They are not a guarantee of an immediate price breakout.
For XRP to really change its trend the market needs to see stronger fresh demand outside these ETF flows too.
Right now the setup is interesting.
More XRP is being locked away while the price remains weak.
If selling pressure finally slows down then all that accumulated demand could start becoming much more visible in the price.
Until then I would watch the $1.35 area closely.
Holding that zone could give XRP room to recover.
Losing it could show that sellers still have control despite the strong ETF numbers.
XRP ETF Demand Is Growing But XRP Price Is Still Not Responding
XRP has an interesting problem right now.
Money is flowing into XRP ETFs but the price is still struggling.
By the end of August cumulative XRP ETF inflows had reached around $1.67 billion. Weekly inflows also increased from about $39.78 million to $110.49 million.
Weekly trading volume moved higher as well. It increased from around $253 million to more than $363 million.
ETF assets also grew from about $1.33 billion to $1.44 billion.
Normally this kind of demand should give XRP some support.
But the price tells a different story.
XRP moved from around $1.70 down toward the $1.35 to $1.40 area during the same period.
That tells me something important.
Strong ETF demand does not automatically mean the price will rise.
There is still enough selling in the wider market to absorb that demand.
Another interesting part is the amount of XRP being held through these ETF products.
The seven XRP ETFs together are estimated to hold around 1.11 billion XRP.
That means more than 1 percent of the total supply has been taken away from immediate market circulation.
This could become more important over time.
If ETF products continue collecting XRP while fewer coins remain available for trading then even a moderate increase in new demand could have a bigger effect on price.
There is also growing interest from large financial firms.
Goldman Sachs reportedly holds around $87.4 million in XRP exposure and increased its position by more than $80 million compared with the previous quarter.
Jane Street and Millennium also have exposure of around $16 million each.
Yet XRP is still around $1.38.
So the main question is not whether institutions are buying.
The bigger question is whether their buying is strong enough to overcome the sellers already in the market.
The growing number of XRP ETF products is another positive development.
More products give investors more ways to get regulated exposure to XRP. It also spreads trading activity across different funds instead of keeping everything concentrated in one place.
But I would still be careful here.
ETF inflows are a good sign for long term demand. They are not a guarantee of an immediate price breakout.
For XRP to really change its trend the market needs to see stronger fresh demand outside these ETF flows too.
Right now the setup is interesting.
More XRP is being locked away while the price remains weak.
If selling pressure finally slows down then all that accumulated demand could start becoming much more visible in the price.
Until then I would watch the $1.35 area closely.
Holding that zone could give XRP room to recover.
Losing it could show that sellers still have control despite the strong ETF numbers.
Money is flowing into XRP ETFs but the price is still struggling.
By the end of August cumulative XRP ETF inflows had reached around $1.67 billion. Weekly inflows also increased from about $39.78 million to $110.49 million.
Weekly trading volume moved higher as well. It increased from around $253 million to more than $363 million.
ETF assets also grew from about $1.33 billion to $1.44 billion.
Normally this kind of demand should give XRP some support.
But the price tells a different story.
XRP moved from around $1.70 down toward the $1.35 to $1.40 area during the same period.
That tells me something important.
Strong ETF demand does not automatically mean the price will rise.
There is still enough selling in the wider market to absorb that demand.
Another interesting part is the amount of XRP being held through these ETF products.
The seven XRP ETFs together are estimated to hold around 1.11 billion XRP.
That means more than 1 percent of the total supply has been taken away from immediate market circulation.
This could become more important over time.
If ETF products continue collecting XRP while fewer coins remain available for trading then even a moderate increase in new demand could have a bigger effect on price.
There is also growing interest from large financial firms.
Goldman Sachs reportedly holds around $87.4 million in XRP exposure and increased its position by more than $80 million compared with the previous quarter.
Jane Street and Millennium also have exposure of around $16 million each.
Yet XRP is still around $1.38.
So the main question is not whether institutions are buying.
The bigger question is whether their buying is strong enough to overcome the sellers already in the market.
The growing number of XRP ETF products is another positive development.
More products give investors more ways to get regulated exposure to XRP. It also spreads trading activity across different funds instead of keeping everything concentrated in one place.
But I would still be careful here.
ETF inflows are a good sign for long term demand. They are not a guarantee of an immediate price breakout.
For XRP to really change its trend the market needs to see stronger fresh demand outside these ETF flows too.
Right now the setup is interesting.
More XRP is being locked away while the price remains weak.
If selling pressure finally slows down then all that accumulated demand could start becoming much more visible in the price.
Until then I would watch the $1.35 area closely.
Holding that zone could give XRP room to recover.
Losing it could show that sellers still have control despite the strong ETF numbers.
3
442
·
--

Article
CLARITY Act Delay Could Become A Bigger Problem For CryptoThe CLARITY Act was expected to get an important vote on September 15. But now the situation looks much less certain.
The biggest issue is the House schedule.
House Republican leaders have reportedly canceled the voting weeks planned for September 21 and September 28. That leaves lawmakers with only a small number of working days in September before they leave Washington for the midterm election campaign.
This creates a serious timing problem for the bill.
Even if the Senate moves quickly and passes the CLARITY Act on September 15 the House may not have enough time to take up the new version before lawmakers leave.
There is another problem too.
The bill still has major disagreements around its details. So even with a tight schedule there is no guarantee that both sides can reach an agreement quickly.
Still there is some optimism.
House Financial Services Committee Chairman French Hill has called September 15 an important test for the bill. He also pointed out that the House already passed the CLARITY Act last year with support from 78 Democrats.
That shows there has already been some room for both sides to work together.
But the market does not seem very confident right now.
The approval odds have fallen sharply and are currently around 18 percent according to the data mentioned in the report.
That is a big change from the optimism seen earlier.
For the crypto market this matters because the CLARITY Act is not just another political story. A clear market structure law could give crypto companies and large investors a better idea of what rules they will have to follow.
Without that clarity the market may continue dealing with uncertainty.
Interestingly the SEC and CFTC are still moving ahead with their own crypto rulemaking.
That could help fill some of the gap if Congress fails to move the bill forward. But agency rules are not the same as a full market structure law passed by Congress.
So I think September 15 should be watched closely.
The important question is not only whether the Senate votes.
The bigger question is whether lawmakers can actually find enough common ground to move the bill through the next stage before the election schedule takes over.
If the House runs out of time then the CLARITY Act could face another long delay.
For crypto investors that would mean more waiting for the regulatory clarity that the market has been expecting.
Right now the September 15 vote looks important.
But getting the bill across the finish line is a much bigger challenge.
CLARITY Act Delay Could Become A Bigger Problem For Crypto
The CLARITY Act was expected to get an important vote on September 15. But now the situation looks much less certain.
The biggest issue is the House schedule.
House Republican leaders have reportedly canceled the voting weeks planned for September 21 and September 28. That leaves lawmakers with only a small number of working days in September before they leave Washington for the midterm election campaign.
This creates a serious timing problem for the bill.
Even if the Senate moves quickly and passes the CLARITY Act on September 15 the House may not have enough time to take up the new version before lawmakers leave.
There is another problem too.
The bill still has major disagreements around its details. So even with a tight schedule there is no guarantee that both sides can reach an agreement quickly.
Still there is some optimism.
House Financial Services Committee Chairman French Hill has called September 15 an important test for the bill. He also pointed out that the House already passed the CLARITY Act last year with support from 78 Democrats.
That shows there has already been some room for both sides to work together.
But the market does not seem very confident right now.
The approval odds have fallen sharply and are currently around 18 percent according to the data mentioned in the report.
That is a big change from the optimism seen earlier.
For the crypto market this matters because the CLARITY Act is not just another political story. A clear market structure law could give crypto companies and large investors a better idea of what rules they will have to follow.
Without that clarity the market may continue dealing with uncertainty.
Interestingly the SEC and CFTC are still moving ahead with their own crypto rulemaking.
That could help fill some of the gap if Congress fails to move the bill forward. But agency rules are not the same as a full market structure law passed by Congress.
So I think September 15 should be watched closely.
The important question is not only whether the Senate votes.
The bigger question is whether lawmakers can actually find enough common ground to move the bill through the next stage before the election schedule takes over.
If the House runs out of time then the CLARITY Act could face another long delay.
For crypto investors that would mean more waiting for the regulatory clarity that the market has been expecting.
Right now the September 15 vote looks important.
But getting the bill across the finish line is a much bigger challenge.
The biggest issue is the House schedule.
House Republican leaders have reportedly canceled the voting weeks planned for September 21 and September 28. That leaves lawmakers with only a small number of working days in September before they leave Washington for the midterm election campaign.
This creates a serious timing problem for the bill.
Even if the Senate moves quickly and passes the CLARITY Act on September 15 the House may not have enough time to take up the new version before lawmakers leave.
There is another problem too.
The bill still has major disagreements around its details. So even with a tight schedule there is no guarantee that both sides can reach an agreement quickly.
Still there is some optimism.
House Financial Services Committee Chairman French Hill has called September 15 an important test for the bill. He also pointed out that the House already passed the CLARITY Act last year with support from 78 Democrats.
That shows there has already been some room for both sides to work together.
But the market does not seem very confident right now.
The approval odds have fallen sharply and are currently around 18 percent according to the data mentioned in the report.
That is a big change from the optimism seen earlier.
For the crypto market this matters because the CLARITY Act is not just another political story. A clear market structure law could give crypto companies and large investors a better idea of what rules they will have to follow.
Without that clarity the market may continue dealing with uncertainty.
Interestingly the SEC and CFTC are still moving ahead with their own crypto rulemaking.
That could help fill some of the gap if Congress fails to move the bill forward. But agency rules are not the same as a full market structure law passed by Congress.
So I think September 15 should be watched closely.
The important question is not only whether the Senate votes.
The bigger question is whether lawmakers can actually find enough common ground to move the bill through the next stage before the election schedule takes over.
If the House runs out of time then the CLARITY Act could face another long delay.
For crypto investors that would mean more waiting for the regulatory clarity that the market has been expecting.
Right now the September 15 vote looks important.
But getting the bill across the finish line is a much bigger challenge.
2
1.2k
·
--

Article
Bitcoin Crossed $80K But $76K Is Still The Level I Am WatchingBitcoin has pushed back above $80K and at first look the move feels very bullish. But I think it is still too early to call this the start of another strong Bitcoin rally.
What I find interesting is that some data is actually showing investors are holding their Bitcoin instead of moving it around.
Bitcoin's 1 year active supply recently dropped to around 7.49 million BTC. This means fewer coins have been moving over the past year.
Usually this kind of decline can show that holders are becoming more patient. People are keeping their Bitcoin instead of selling it quickly. That can be a positive sign when the market is trying to build a new move higher.
Bitcoin reserves on exchanges have also fallen.
Reserves reached around 2.73 million BTC on August 17 before dropping to around 2.70 million BTC.
That may not look like a huge change but it matters because fewer coins sitting on exchanges can mean less immediate selling pressure.
But this is where things get interesting.
The price is rising while sellers are still active.
Around $1.2 billion worth of Bitcoin was sold between August 23 and September 1. That comes to roughly $120 million in selling every day.
Bitcoin's apparent demand also turned negative over the last 24 hours. This suggests that the recent price move is not being supported by strong fresh demand yet.
There was also a large amount of Bitcoin leaving exchanges. Around 127940 BTC moved out during the period.
So we have two different stories happening at the same time.
On one side holders seem willing to keep their coins. Exchange reserves are falling and long term holding behavior looks stronger.
On the other side sellers are still taking profit and fresh demand has not fully returned.
This is why I would not chase Bitcoin just because it crossed $80K.
For me the bigger test is still around $76K.
If Bitcoin can stay clearly above this area after a pullback then the recent move could start looking much healthier.
But if BTC loses $76K and sellers become more aggressive then this move above $80K could turn into another local high.
Right now Bitcoin looks strong on the chart but the data is giving a more mixed picture.
The next move matters more than the $80K headline.
Bitcoin Crossed $80K But $76K Is Still The Level I Am Watching
Bitcoin has pushed back above $80K and at first look the move feels very bullish. But I think it is still too early to call this the start of another strong Bitcoin rally.
What I find interesting is that some data is actually showing investors are holding their Bitcoin instead of moving it around.
Bitcoin's 1 year active supply recently dropped to around 7.49 million BTC. This means fewer coins have been moving over the past year.
Usually this kind of decline can show that holders are becoming more patient. People are keeping their Bitcoin instead of selling it quickly. That can be a positive sign when the market is trying to build a new move higher.
Bitcoin reserves on exchanges have also fallen.
Reserves reached around 2.73 million BTC on August 17 before dropping to around 2.70 million BTC.
That may not look like a huge change but it matters because fewer coins sitting on exchanges can mean less immediate selling pressure.
But this is where things get interesting.
The price is rising while sellers are still active.
Around $1.2 billion worth of Bitcoin was sold between August 23 and September 1. That comes to roughly $120 million in selling every day.
Bitcoin's apparent demand also turned negative over the last 24 hours. This suggests that the recent price move is not being supported by strong fresh demand yet.
There was also a large amount of Bitcoin leaving exchanges. Around 127940 BTC moved out during the period.
So we have two different stories happening at the same time.
On one side holders seem willing to keep their coins. Exchange reserves are falling and long term holding behavior looks stronger.
On the other side sellers are still taking profit and fresh demand has not fully returned.
This is why I would not chase Bitcoin just because it crossed $80K.
For me the bigger test is still around $76K.
If Bitcoin can stay clearly above this area after a pullback then the recent move could start looking much healthier.
But if BTC loses $76K and sellers become more aggressive then this move above $80K could turn into another local high.
Right now Bitcoin looks strong on the chart but the data is giving a more mixed picture.
The next move matters more than the $80K headline.
What I find interesting is that some data is actually showing investors are holding their Bitcoin instead of moving it around.
Bitcoin's 1 year active supply recently dropped to around 7.49 million BTC. This means fewer coins have been moving over the past year.
Usually this kind of decline can show that holders are becoming more patient. People are keeping their Bitcoin instead of selling it quickly. That can be a positive sign when the market is trying to build a new move higher.
Bitcoin reserves on exchanges have also fallen.
Reserves reached around 2.73 million BTC on August 17 before dropping to around 2.70 million BTC.
That may not look like a huge change but it matters because fewer coins sitting on exchanges can mean less immediate selling pressure.
But this is where things get interesting.
The price is rising while sellers are still active.
Around $1.2 billion worth of Bitcoin was sold between August 23 and September 1. That comes to roughly $120 million in selling every day.
Bitcoin's apparent demand also turned negative over the last 24 hours. This suggests that the recent price move is not being supported by strong fresh demand yet.
There was also a large amount of Bitcoin leaving exchanges. Around 127940 BTC moved out during the period.
So we have two different stories happening at the same time.
On one side holders seem willing to keep their coins. Exchange reserves are falling and long term holding behavior looks stronger.
On the other side sellers are still taking profit and fresh demand has not fully returned.
This is why I would not chase Bitcoin just because it crossed $80K.
For me the bigger test is still around $76K.
If Bitcoin can stay clearly above this area after a pullback then the recent move could start looking much healthier.
But if BTC loses $76K and sellers become more aggressive then this move above $80K could turn into another local high.
Right now Bitcoin looks strong on the chart but the data is giving a more mixed picture.
The next move matters more than the $80K headline.
1
162
·
--
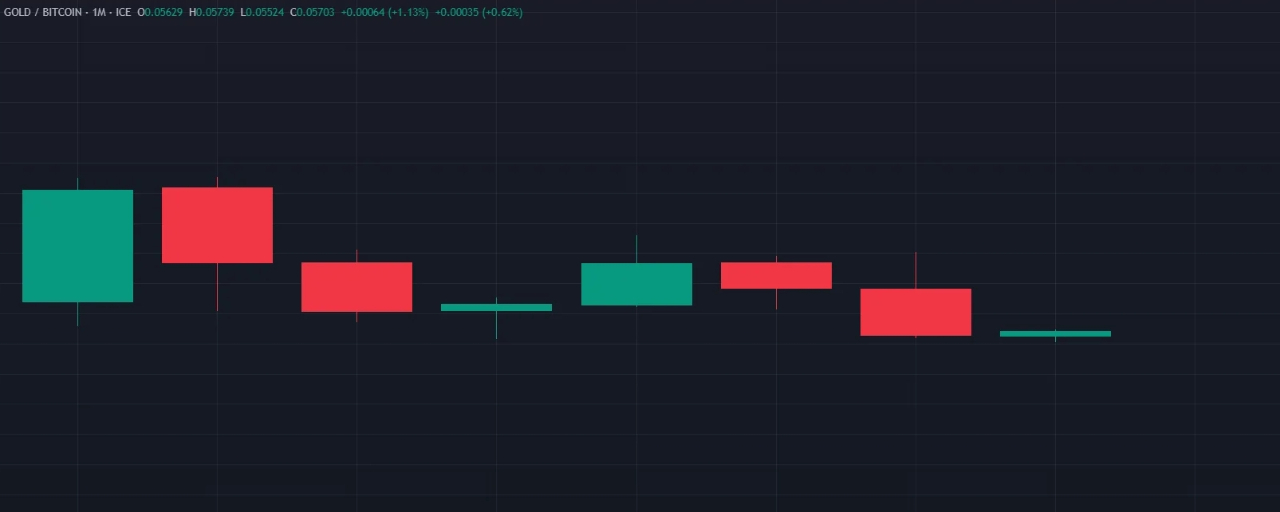
Article
Bitcoin Is Starting To Look More Like GoldBitcoin has been through another interesting change.
Its connection with gold is getting stronger while its connection with tech stocks is getting weaker.
According to recent data Bitcoin’s correlation with gold has reached around 50 percent.
At the same time its correlation with the Nasdaq has fallen from around 60 percent to about 30 percent.
That caught my attention.
For years Bitcoin often moved like a risk asset. When stocks were weak Bitcoin could feel the pressure too.
Now the picture looks a little different.
The market is becoming more worried about rates and the wider economy.
The US 10 year Treasury yield reached around 4.79 percent on September 1. That was its highest level since January 2025.
Higher yields can make investors more careful with risky assets because safer investments start looking more attractive.
There are also fresh concerns around oil prices and rising tensions between the US and Iran.
So the market has plenty of reasons to stay cautious.
But Bitcoin has not reacted like a normal risk asset.
August gave BTC a strong 25 percent rally and its growing link with gold adds another interesting part to the story.
The BTC and gold relationship does not mean Bitcoin is now a perfect safe haven.
Correlation can change quickly.
That is the part I would keep in mind.
Bitcoin still has to prove that it can hold up when markets become truly nervous.
Interestingly the BTC to gold ratio is also showing strength.
Bitcoin has been gaining against gold this month after two months of weakness.
That suggests some investors are still willing to choose BTC even while traditional safe haven assets are getting attention.
There is also a possible source of support from the Federal Reserve.
The Fed is expected to purchase around $12.5 billion in US Treasury debt. This is not the same as quantitative easing but it could add some liquidity to the market.
So Bitcoin is sitting between two forces.
Higher yields can put pressure on it.
More liquidity can help it.
The most interesting part is that BTC is showing signs of becoming less tied to stocks and more connected to gold.
If that continues then the safe haven story around Bitcoin becomes much more interesting.
But I would not call it proven yet.
The next major market shock may tell us more than any correlation chart can.
Bitcoin Is Starting To Look More Like Gold
Bitcoin has been through another interesting change.
Its connection with gold is getting stronger while its connection with tech stocks is getting weaker.
According to recent data Bitcoin’s correlation with gold has reached around 50 percent.
At the same time its correlation with the Nasdaq has fallen from around 60 percent to about 30 percent.
That caught my attention.
For years Bitcoin often moved like a risk asset. When stocks were weak Bitcoin could feel the pressure too.
Now the picture looks a little different.
The market is becoming more worried about rates and the wider economy.
The US 10 year Treasury yield reached around 4.79 percent on September 1. That was its highest level since January 2025.
Higher yields can make investors more careful with risky assets because safer investments start looking more attractive.
There are also fresh concerns around oil prices and rising tensions between the US and Iran.
So the market has plenty of reasons to stay cautious.
But Bitcoin has not reacted like a normal risk asset.
August gave BTC a strong 25 percent rally and its growing link with gold adds another interesting part to the story.
The BTC and gold relationship does not mean Bitcoin is now a perfect safe haven.
Correlation can change quickly.
That is the part I would keep in mind.
Bitcoin still has to prove that it can hold up when markets become truly nervous.
Interestingly the BTC to gold ratio is also showing strength.
Bitcoin has been gaining against gold this month after two months of weakness.
That suggests some investors are still willing to choose BTC even while traditional safe haven assets are getting attention.
There is also a possible source of support from the Federal Reserve.
The Fed is expected to purchase around $12.5 billion in US Treasury debt. This is not the same as quantitative easing but it could add some liquidity to the market.
So Bitcoin is sitting between two forces.
Higher yields can put pressure on it.
More liquidity can help it.
The most interesting part is that BTC is showing signs of becoming less tied to stocks and more connected to gold.
If that continues then the safe haven story around Bitcoin becomes much more interesting.
But I would not call it proven yet.
The next major market shock may tell us more than any correlation chart can.
Its connection with gold is getting stronger while its connection with tech stocks is getting weaker.
According to recent data Bitcoin’s correlation with gold has reached around 50 percent.
At the same time its correlation with the Nasdaq has fallen from around 60 percent to about 30 percent.
That caught my attention.
For years Bitcoin often moved like a risk asset. When stocks were weak Bitcoin could feel the pressure too.
Now the picture looks a little different.
The market is becoming more worried about rates and the wider economy.
The US 10 year Treasury yield reached around 4.79 percent on September 1. That was its highest level since January 2025.
Higher yields can make investors more careful with risky assets because safer investments start looking more attractive.
There are also fresh concerns around oil prices and rising tensions between the US and Iran.
So the market has plenty of reasons to stay cautious.
But Bitcoin has not reacted like a normal risk asset.
August gave BTC a strong 25 percent rally and its growing link with gold adds another interesting part to the story.
The BTC and gold relationship does not mean Bitcoin is now a perfect safe haven.
Correlation can change quickly.
That is the part I would keep in mind.
Bitcoin still has to prove that it can hold up when markets become truly nervous.
Interestingly the BTC to gold ratio is also showing strength.
Bitcoin has been gaining against gold this month after two months of weakness.
That suggests some investors are still willing to choose BTC even while traditional safe haven assets are getting attention.
There is also a possible source of support from the Federal Reserve.
The Fed is expected to purchase around $12.5 billion in US Treasury debt. This is not the same as quantitative easing but it could add some liquidity to the market.
So Bitcoin is sitting between two forces.
Higher yields can put pressure on it.
More liquidity can help it.
The most interesting part is that BTC is showing signs of becoming less tied to stocks and more connected to gold.
If that continues then the safe haven story around Bitcoin becomes much more interesting.
But I would not call it proven yet.
The next major market shock may tell us more than any correlation chart can.
131
·
--
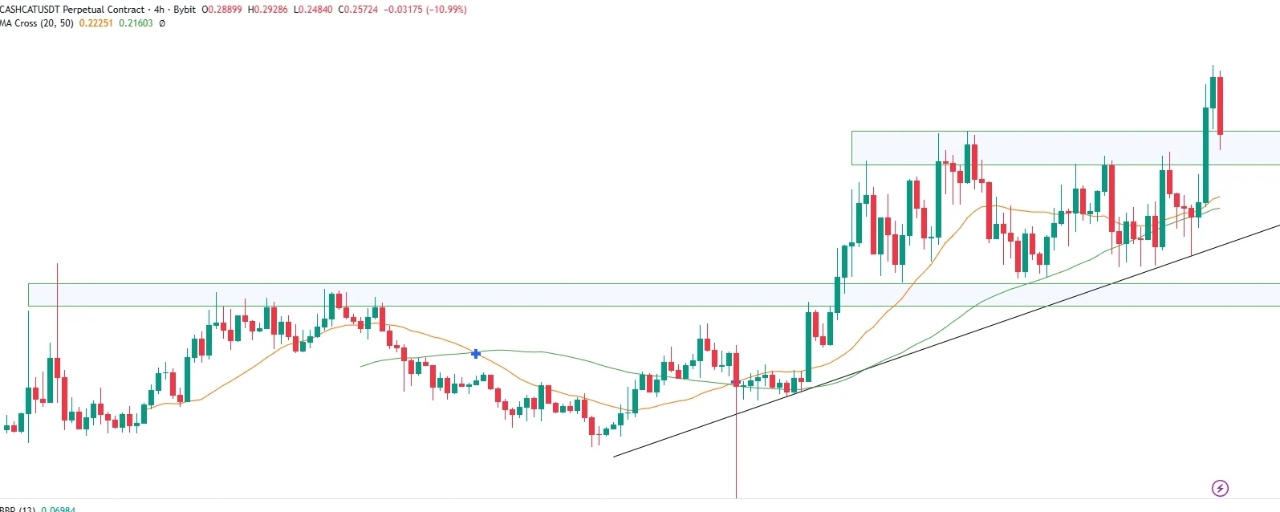
Article
CASHCAT Just Jumped 29 Percent But The Real Test Is Still AheadCASHCAT has been moving very fast.
The memecoin gained more than 29 percent in one day and reached a new high around $0.30.
Its weekly gain is now above 40 percent.
That is a big move for any coin. But with memecoins I always want to look beyond the price.
A big part of this move seems to be coming from the growing meme activity on Robinhood Chain.
CASHCAT is now one of the biggest meme coins on the network by market value.
Trading activity has also picked up across the chain. This has brought more attention and more money into these coins.
There is another reason the move became so strong.
A large number of short positions were closed as the price moved higher.
More than $611K in short positions were liquidated within the day. More than $377K was wiped out in less than an hour.
When shorts get forced out during a fast move it can push the price even higher.
But this also creates a problem.
CASHCAT is now sitting at a new high after a very quick move.
The next test is whether buyers can keep the price above the old high near $0.259.
If that level turns into support then the current trend still looks healthy.
If the price falls back below it then the recent breakout could start losing strength.
There is another area around $0.217 to $0.225 that could matter during a deeper pullback.
But the bigger support sits around $0.17.
That level has held during the recent price action and could be the line that keeps the larger trend alive.
If CASHCAT loses $0.17 then the story changes quickly.
For now the bulls are clearly in control.
But after a 29 percent daily move I would be more interested in seeing how the price behaves during a pullback than chasing another green candle.
A strong coin should be able to hold its old high after breaking it.
That is the test CASHCAT faces now.
The next move will tell us whether this is just another memecoin spike or a trend that still has buyers behind it.
CASHCAT Just Jumped 29 Percent But The Real Test Is Still Ahead
CASHCAT has been moving very fast.
The memecoin gained more than 29 percent in one day and reached a new high around $0.30.
Its weekly gain is now above 40 percent.
That is a big move for any coin. But with memecoins I always want to look beyond the price.
A big part of this move seems to be coming from the growing meme activity on Robinhood Chain.
CASHCAT is now one of the biggest meme coins on the network by market value.
Trading activity has also picked up across the chain. This has brought more attention and more money into these coins.
There is another reason the move became so strong.
A large number of short positions were closed as the price moved higher.
More than $611K in short positions were liquidated within the day. More than $377K was wiped out in less than an hour.
When shorts get forced out during a fast move it can push the price even higher.
But this also creates a problem.
CASHCAT is now sitting at a new high after a very quick move.
The next test is whether buyers can keep the price above the old high near $0.259.
If that level turns into support then the current trend still looks healthy.
If the price falls back below it then the recent breakout could start losing strength.
There is another area around $0.217 to $0.225 that could matter during a deeper pullback.
But the bigger support sits around $0.17.
That level has held during the recent price action and could be the line that keeps the larger trend alive.
If CASHCAT loses $0.17 then the story changes quickly.
For now the bulls are clearly in control.
But after a 29 percent daily move I would be more interested in seeing how the price behaves during a pullback than chasing another green candle.
A strong coin should be able to hold its old high after breaking it.
That is the test CASHCAT faces now.
The next move will tell us whether this is just another memecoin spike or a trend that still has buyers behind it.
The memecoin gained more than 29 percent in one day and reached a new high around $0.30.
Its weekly gain is now above 40 percent.
That is a big move for any coin. But with memecoins I always want to look beyond the price.
A big part of this move seems to be coming from the growing meme activity on Robinhood Chain.
CASHCAT is now one of the biggest meme coins on the network by market value.
Trading activity has also picked up across the chain. This has brought more attention and more money into these coins.
There is another reason the move became so strong.
A large number of short positions were closed as the price moved higher.
More than $611K in short positions were liquidated within the day. More than $377K was wiped out in less than an hour.
When shorts get forced out during a fast move it can push the price even higher.
But this also creates a problem.
CASHCAT is now sitting at a new high after a very quick move.
The next test is whether buyers can keep the price above the old high near $0.259.
If that level turns into support then the current trend still looks healthy.
If the price falls back below it then the recent breakout could start losing strength.
There is another area around $0.217 to $0.225 that could matter during a deeper pullback.
But the bigger support sits around $0.17.
That level has held during the recent price action and could be the line that keeps the larger trend alive.
If CASHCAT loses $0.17 then the story changes quickly.
For now the bulls are clearly in control.
But after a 29 percent daily move I would be more interested in seeing how the price behaves during a pullback than chasing another green candle.
A strong coin should be able to hold its old high after breaking it.
That is the test CASHCAT faces now.
The next move will tell us whether this is just another memecoin spike or a trend that still has buyers behind it.
1
148
·
--
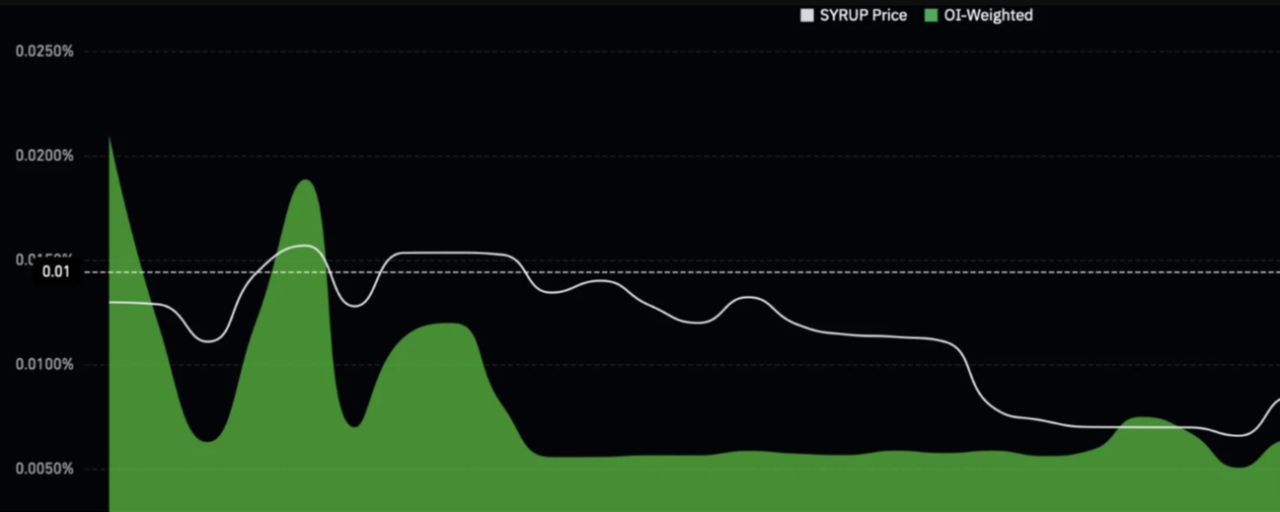
Article
SYRUP Just Jumped 14 Percent But The Bigger Story Is What Is Happening UnderneathSYRUP has made a strong move over the past day.
The token gained around 14 percent while Maple Finance also showed some solid numbers.
What caught my attention is that the price move is happening at the same time as the protocol is growing.
Maple Finance made around $1.13 million in profit in August.
That is not its best month this year since April was higher at around $1.32 million.
Still the number shows that the protocol is generating real income while the market is recovering.
TVL is also worth watching.
Maple Finance crossed $3 billion in TVL for the second time this year. It reached around $3.07 billion on August 25 before moving slightly lower to around $2.97 billion.
That means the recent growth has not simply been a price story.
There is still a large amount of money sitting inside the protocol.
The trading side is also getting more active.
SYRUP open interest jumped around 26 percent and reached about $29 million.
Funding also stayed positive at around 0.0077 percent.
This tells me that many traders are leaning toward the upside.
But there is one thing I would be careful about.
When price rises quickly and traders start adding leverage at the same time the move can become crowded.
If SYRUP keeps rising without too much leverage building up then the move may have room to continue.
If leverage grows too fast then even a small drop can force some traders to close their positions.
There is also more attention around SYRUP right now.
Mentions increased around 20 percent in one day and reached nearly 1,490.
Market sentiment was also strongly positive.
So the story around SYRUP is getting louder.
But I would not use that alone as a reason to buy.
The more useful thing to watch is whether Maple can keep its TVL close to $3 billion while continuing to generate strong income.
If that happens then the recent 14 percent move starts to look less like a random pump.
It starts looking like the market is reacting to better numbers from the actual protocol.
For now SYRUP has momentum.
The next test is whether that momentum can stay healthy without too much leverage getting involved
SYRUP Just Jumped 14 Percent But The Bigger Story Is What Is Happening Underneath
SYRUP has made a strong move over the past day.
The token gained around 14 percent while Maple Finance also showed some solid numbers.
What caught my attention is that the price move is happening at the same time as the protocol is growing.
Maple Finance made around $1.13 million in profit in August.
That is not its best month this year since April was higher at around $1.32 million.
Still the number shows that the protocol is generating real income while the market is recovering.
TVL is also worth watching.
Maple Finance crossed $3 billion in TVL for the second time this year. It reached around $3.07 billion on August 25 before moving slightly lower to around $2.97 billion.
That means the recent growth has not simply been a price story.
There is still a large amount of money sitting inside the protocol.
The trading side is also getting more active.
SYRUP open interest jumped around 26 percent and reached about $29 million.
Funding also stayed positive at around 0.0077 percent.
This tells me that many traders are leaning toward the upside.
But there is one thing I would be careful about.
When price rises quickly and traders start adding leverage at the same time the move can become crowded.
If SYRUP keeps rising without too much leverage building up then the move may have room to continue.
If leverage grows too fast then even a small drop can force some traders to close their positions.
There is also more attention around SYRUP right now.
Mentions increased around 20 percent in one day and reached nearly 1,490.
Market sentiment was also strongly positive.
So the story around SYRUP is getting louder.
But I would not use that alone as a reason to buy.
The more useful thing to watch is whether Maple can keep its TVL close to $3 billion while continuing to generate strong income.
If that happens then the recent 14 percent move starts to look less like a random pump.
It starts looking like the market is reacting to better numbers from the actual protocol.
For now SYRUP has momentum.
The next test is whether that momentum can stay healthy without too much leverage getting involved
The token gained around 14 percent while Maple Finance also showed some solid numbers.
What caught my attention is that the price move is happening at the same time as the protocol is growing.
Maple Finance made around $1.13 million in profit in August.
That is not its best month this year since April was higher at around $1.32 million.
Still the number shows that the protocol is generating real income while the market is recovering.
TVL is also worth watching.
Maple Finance crossed $3 billion in TVL for the second time this year. It reached around $3.07 billion on August 25 before moving slightly lower to around $2.97 billion.
That means the recent growth has not simply been a price story.
There is still a large amount of money sitting inside the protocol.
The trading side is also getting more active.
SYRUP open interest jumped around 26 percent and reached about $29 million.
Funding also stayed positive at around 0.0077 percent.
This tells me that many traders are leaning toward the upside.
But there is one thing I would be careful about.
When price rises quickly and traders start adding leverage at the same time the move can become crowded.
If SYRUP keeps rising without too much leverage building up then the move may have room to continue.
If leverage grows too fast then even a small drop can force some traders to close their positions.
There is also more attention around SYRUP right now.
Mentions increased around 20 percent in one day and reached nearly 1,490.
Market sentiment was also strongly positive.
So the story around SYRUP is getting louder.
But I would not use that alone as a reason to buy.
The more useful thing to watch is whether Maple can keep its TVL close to $3 billion while continuing to generate strong income.
If that happens then the recent 14 percent move starts to look less like a random pump.
It starts looking like the market is reacting to better numbers from the actual protocol.
For now SYRUP has momentum.
The next test is whether that momentum can stay healthy without too much leverage getting involved
233
·
--
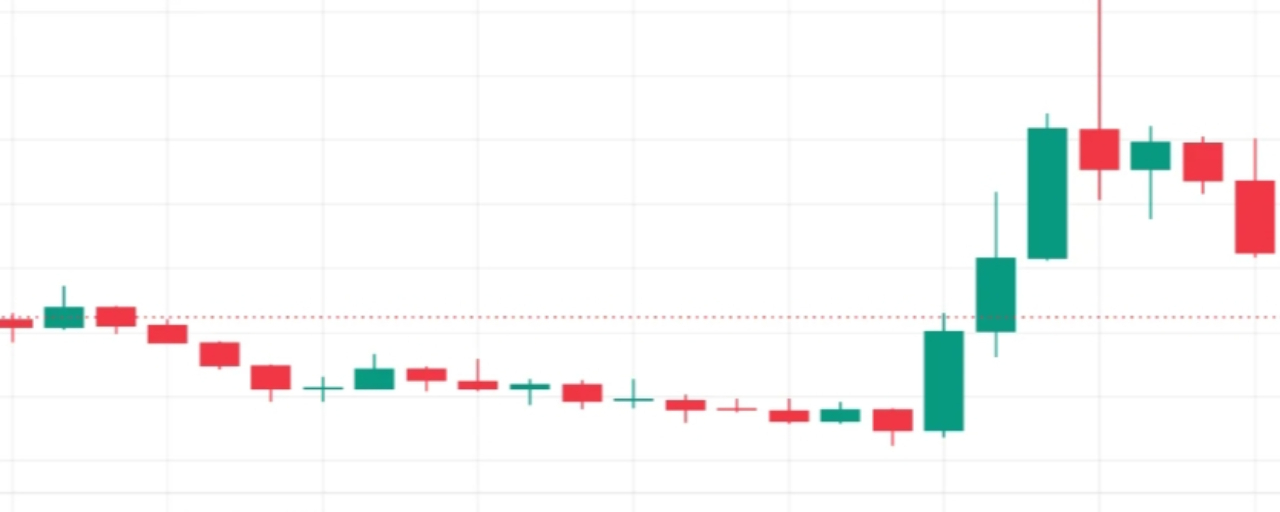
Article
XLM Looks Weak Right Now But October Could Change The StoryXLM has lost some of its recent strength.
The token moved above $0.20 in late August but has slowly given back part of that move. It is now trading around $0.172.
The short term chart does not look very strong either.
The RSI is close to the middle which shows that buyers are not in full control. The MACD has also turned weaker and is now below its signal line.
The derivatives market tells a similar story.
Open interest dropped from around $95 million to about $78.6 million during the past week.
That means traders are using less leverage than before.
Funding is still slightly positive though. So traders are not fully betting against XLM.
They just do not seem very confident right now.
But this is where the bigger story gets interesting.
Stellar could have something important coming later this year.
DTCC is preparing to launch its tokenization service in October. Stellar is expected to be part of the rollout.
This matters because DTCC is already working with tokenized assets and major institutions.
Stellar is also expected to have tokenized DTC assets available on its network in the first half of 2027.
That does not mean XLM will suddenly jump when October arrives.
Crypto markets do not always price real world progress immediately.
Sometimes the market reacts first.
Sometimes it waits for actual usage.
That is why I think the October launch is more important as a test than as a simple price catalyst.
It could give the market a clearer idea of how much public blockchains can actually be used for large scale tokenized assets.
And Stellar is going to be part of that conversation.
For now the price still needs to prove itself.
Holding around the current area would be a good start.
A move back above $0.20 would make the chart look much healthier.
Until then XLM remains a coin with an interesting future story but a weak short term setup.
The next few weeks may be quiet.
But October could give the market something much more important than another short lived price pump.
It could give investors a better idea of whether Stellar is actually becoming part of the growing tokenized asset market.
XLM Looks Weak Right Now But October Could Change The Story
XLM has lost some of its recent strength.
The token moved above $0.20 in late August but has slowly given back part of that move. It is now trading around $0.172.
The short term chart does not look very strong either.
The RSI is close to the middle which shows that buyers are not in full control. The MACD has also turned weaker and is now below its signal line.
The derivatives market tells a similar story.
Open interest dropped from around $95 million to about $78.6 million during the past week.
That means traders are using less leverage than before.
Funding is still slightly positive though. So traders are not fully betting against XLM.
They just do not seem very confident right now.
But this is where the bigger story gets interesting.
Stellar could have something important coming later this year.
DTCC is preparing to launch its tokenization service in October. Stellar is expected to be part of the rollout.
This matters because DTCC is already working with tokenized assets and major institutions.
Stellar is also expected to have tokenized DTC assets available on its network in the first half of 2027.
That does not mean XLM will suddenly jump when October arrives.
Crypto markets do not always price real world progress immediately.
Sometimes the market reacts first.
Sometimes it waits for actual usage.
That is why I think the October launch is more important as a test than as a simple price catalyst.
It could give the market a clearer idea of how much public blockchains can actually be used for large scale tokenized assets.
And Stellar is going to be part of that conversation.
For now the price still needs to prove itself.
Holding around the current area would be a good start.
A move back above $0.20 would make the chart look much healthier.
Until then XLM remains a coin with an interesting future story but a weak short term setup.
The next few weeks may be quiet.
But October could give the market something much more important than another short lived price pump.
It could give investors a better idea of whether Stellar is actually becoming part of the growing tokenized asset market.
The token moved above $0.20 in late August but has slowly given back part of that move. It is now trading around $0.172.
The short term chart does not look very strong either.
The RSI is close to the middle which shows that buyers are not in full control. The MACD has also turned weaker and is now below its signal line.
The derivatives market tells a similar story.
Open interest dropped from around $95 million to about $78.6 million during the past week.
That means traders are using less leverage than before.
Funding is still slightly positive though. So traders are not fully betting against XLM.
They just do not seem very confident right now.
But this is where the bigger story gets interesting.
Stellar could have something important coming later this year.
DTCC is preparing to launch its tokenization service in October. Stellar is expected to be part of the rollout.
This matters because DTCC is already working with tokenized assets and major institutions.
Stellar is also expected to have tokenized DTC assets available on its network in the first half of 2027.
That does not mean XLM will suddenly jump when October arrives.
Crypto markets do not always price real world progress immediately.
Sometimes the market reacts first.
Sometimes it waits for actual usage.
That is why I think the October launch is more important as a test than as a simple price catalyst.
It could give the market a clearer idea of how much public blockchains can actually be used for large scale tokenized assets.
And Stellar is going to be part of that conversation.
For now the price still needs to prove itself.
Holding around the current area would be a good start.
A move back above $0.20 would make the chart look much healthier.
Until then XLM remains a coin with an interesting future story but a weak short term setup.
The next few weeks may be quiet.
But October could give the market something much more important than another short lived price pump.
It could give investors a better idea of whether Stellar is actually becoming part of the growing tokenized asset market.
2
202
Log in to explore more content
Join global crypto users on Binance Square
⚡️ Get latest and useful information about crypto.
💬 Trusted by the world’s largest crypto exchange.
👍 Discover real insights from verified creators.
Email / Phone number
Trending Topics
RussiaUkraine72-hourCeasefire
164,023 views
2,192 Discussing
#russiaukraine72-hourceasefire
Ceasefire Declared: How Will Global Markets & Crypto React in the Next 72 Hours?
A dramatic 72-hour ceasefire has just been announced between Russia and Ukraine, offering a potential—if brief—break in hostilities. For global markets and the cryptocurrency sector, this news is a massive shift in sentiment.
How will investors react in the next 72 hours? Here are the key narratives playing out right now:
Risk-On Bounce: Will the sudden easing of geopolitical tension drive a rotation back into "risk-on" assets like growth stocks and high-beta altcoins? We often see markets rally on news of peace, even if it's temporary.
The Safe-Haven Dilemma: Paradoxically, Bitcoin ($BTC) and Gold ($GLD) often act as safe-haven assets during crises. While peace is good, will it dampen the "crisis hedging" demand for Bitcoin in the immediate term?
Oil and Commodities: Energy prices are likely to experience high volatility. A cooling of tensions could mean a reduction in supply fears.
My Take: While this is a temporary window, expect extreme volatility in both directions. Traders will be highly reactive to any news indicating whether the ceasefire is holding. I anticipate a short-term rally in crypto, but sustainable momentum depends on longer-term outcomes.
What are your predictions for the next 72 hours? Is this the start of a broader de-escalation, or just a temporary pause before more chaos?
👇 Let’s discuss in the comments below! 👇
$BTC
#RussiaUkraineWar #CryptoNews #bitcoin
Lily星星
·6 Likes
·2k views
CNPYAirdropOnBinanceAlpha
41,199 views
681 Discussing
ZEC'sMarketCapSurpassedDOGE
99,368 views
782 Discussing