

#vwap
vwap
29,091 views
107 Discussing
Hot
Latest

·
--
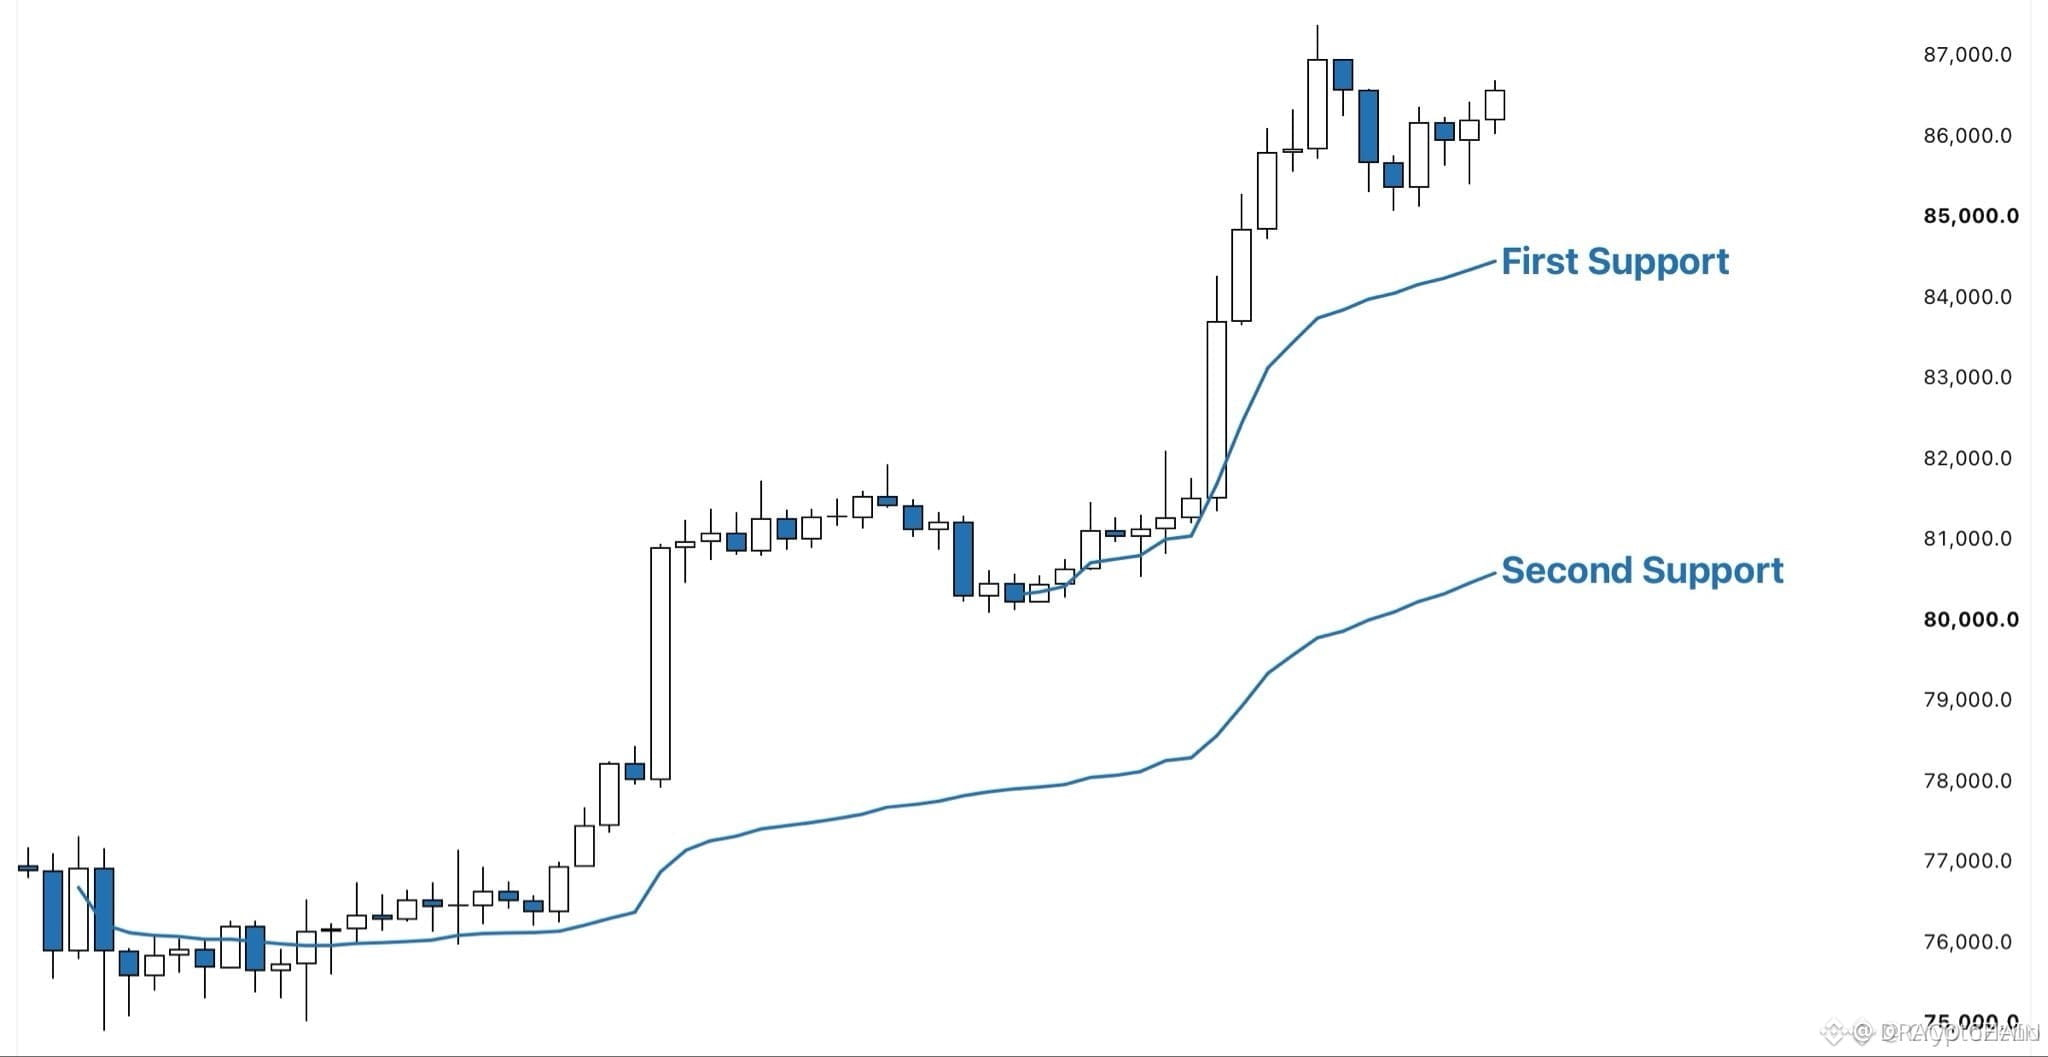
🚨 $BTC A VWAP TEST THREATENS UPSIDE MOMENTUM 💥
Entry: 85,000 ⚡
📊 The 4‑hour aVWAP around 81k serves as the institutional liquidity gate; a break below would flip the trend and signal smart‑money capitulation 🌊.
🔍 Holding above this line, the 85k VWAP‑aligned support remains a pristine scalp zone, with order‑block absorption keeping sellers at bay 📈.
💬 Are you positioning for a clean retest of 85k or waiting for the aVWAP to hold firm? 👇
⚠️ Not financial advice. Always manage your risk. 🛡️
🏷️ #BTC #LongSetup #VWAP #Crypto
🔥 💎
🚨 $BTC A VWAP TEST THREATENS UPSIDE MOMENTUM 💥
Entry: 85,000 ⚡
📊 The 4‑hour aVWAP around 81k serves as the institutional liquidity gate; a break below would flip the trend and signal smart‑money capitulation 🌊.
🔍 Holding above this line, the 85k VWAP‑aligned support remains a pristine scalp zone, with order‑block absorption keeping sellers at bay 📈.
💬 Are you positioning for a clean retest of 85k or waiting for the aVWAP to hold firm? 👇
⚠️ Not financial advice. Always manage your risk. 🛡️
🏷️ #BTC #LongSetup #VWAP #Crypto
🔥 💎
Entry: 85,000 ⚡
📊 The 4‑hour aVWAP around 81k serves as the institutional liquidity gate; a break below would flip the trend and signal smart‑money capitulation 🌊.
🔍 Holding above this line, the 85k VWAP‑aligned support remains a pristine scalp zone, with order‑block absorption keeping sellers at bay 📈.
💬 Are you positioning for a clean retest of 85k or waiting for the aVWAP to hold firm? 👇
⚠️ Not financial advice. Always manage your risk. 🛡️
🏷️ #BTC #LongSetup #VWAP #Crypto
🔥 💎
15

·
--
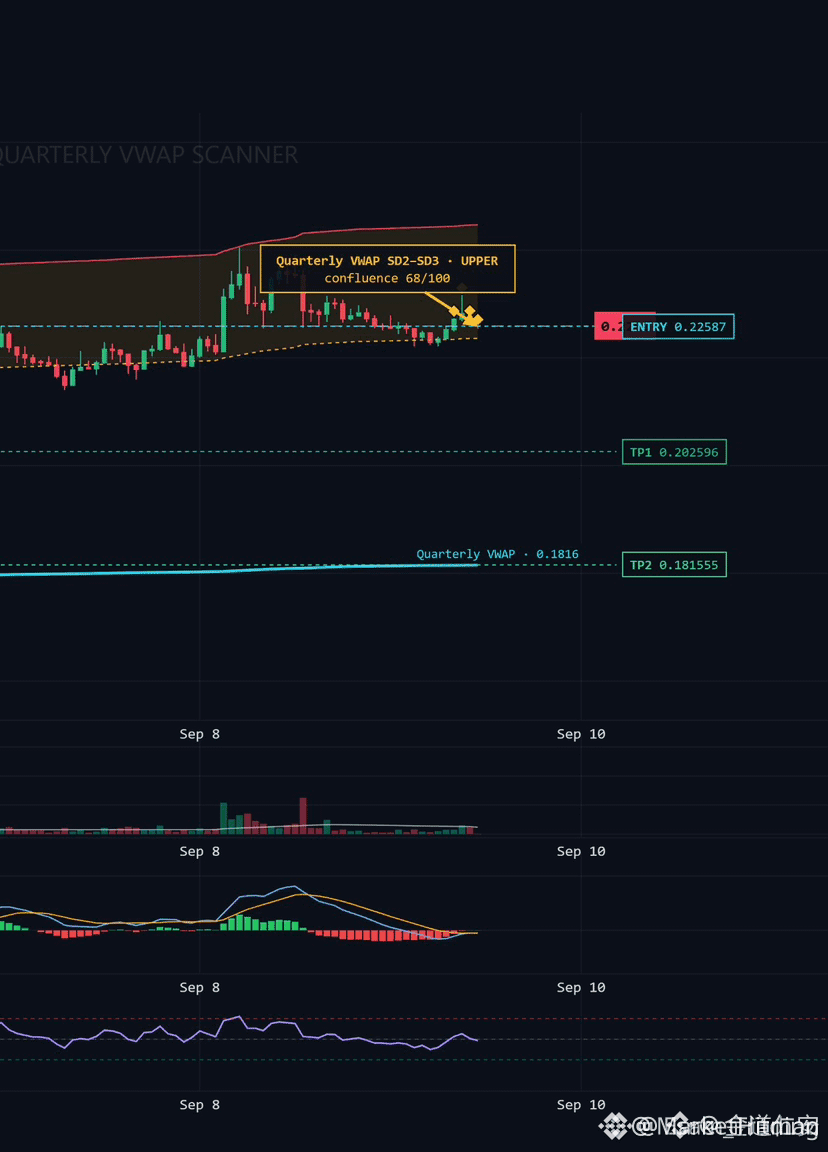
🚨 $SYRUP SLIDES THROUGH VWAP BAND, SHORT OPPORTUNITY! 💥
Entry: 0.22587 ⚡
Target: 0.20259 🎯
Target: 0.18155 🎯
Stop Loss: 0.2620 ⚠️
📊 The 1H VWAP band just cracked, exposing a fresh liquidity pocket where bears are gobbling every stray buy. 🌊 Sellers are stacking orders just below the band, forcing a rapid price dive as the market flips to short bias. ⚡ Volume spikes confirm the pressure is real, and the momentum curve points straight toward the lower targets.
💡 With a crisp 1:2+ risk‑reward, this setup rewards disciplined short entries before the next liquidity sweep. 💬 Are you ready to ride the down‑trend or waiting for the next pullback? 👇
⚠️ Not financial advice. Always manage your risk. 🛡️
🏷️ #SYRUP #ShortSetup #VWAP #Crypto
🔥 💎
🚨 $SYRUP SLIDES THROUGH VWAP BAND, SHORT OPPORTUNITY! 💥
Entry: 0.22587 ⚡
Target: 0.20259 🎯
Target: 0.18155 🎯
Stop Loss: 0.2620 ⚠️
📊 The 1H VWAP band just cracked, exposing a fresh liquidity pocket where bears are gobbling every stray buy. 🌊 Sellers are stacking orders just below the band, forcing a rapid price dive as the market flips to short bias. ⚡ Volume spikes confirm the pressure is real, and the momentum curve points straight toward the lower targets.
💡 With a crisp 1:2+ risk‑reward, this setup rewards disciplined short entries before the next liquidity sweep. 💬 Are you ready to ride the down‑trend or waiting for the next pullback? 👇
⚠️ Not financial advice. Always manage your risk. 🛡️
🏷️ #SYRUP #ShortSetup #VWAP #Crypto
🔥 💎
Entry: 0.22587 ⚡
Target: 0.20259 🎯
Target: 0.18155 🎯
Stop Loss: 0.2620 ⚠️
📊 The 1H VWAP band just cracked, exposing a fresh liquidity pocket where bears are gobbling every stray buy. 🌊 Sellers are stacking orders just below the band, forcing a rapid price dive as the market flips to short bias. ⚡ Volume spikes confirm the pressure is real, and the momentum curve points straight toward the lower targets.
💡 With a crisp 1:2+ risk‑reward, this setup rewards disciplined short entries before the next liquidity sweep. 💬 Are you ready to ride the down‑trend or waiting for the next pullback? 👇
⚠️ Not financial advice. Always manage your risk. 🛡️
🏷️ #SYRUP #ShortSetup #VWAP #Crypto
🔥 💎
37
·
--
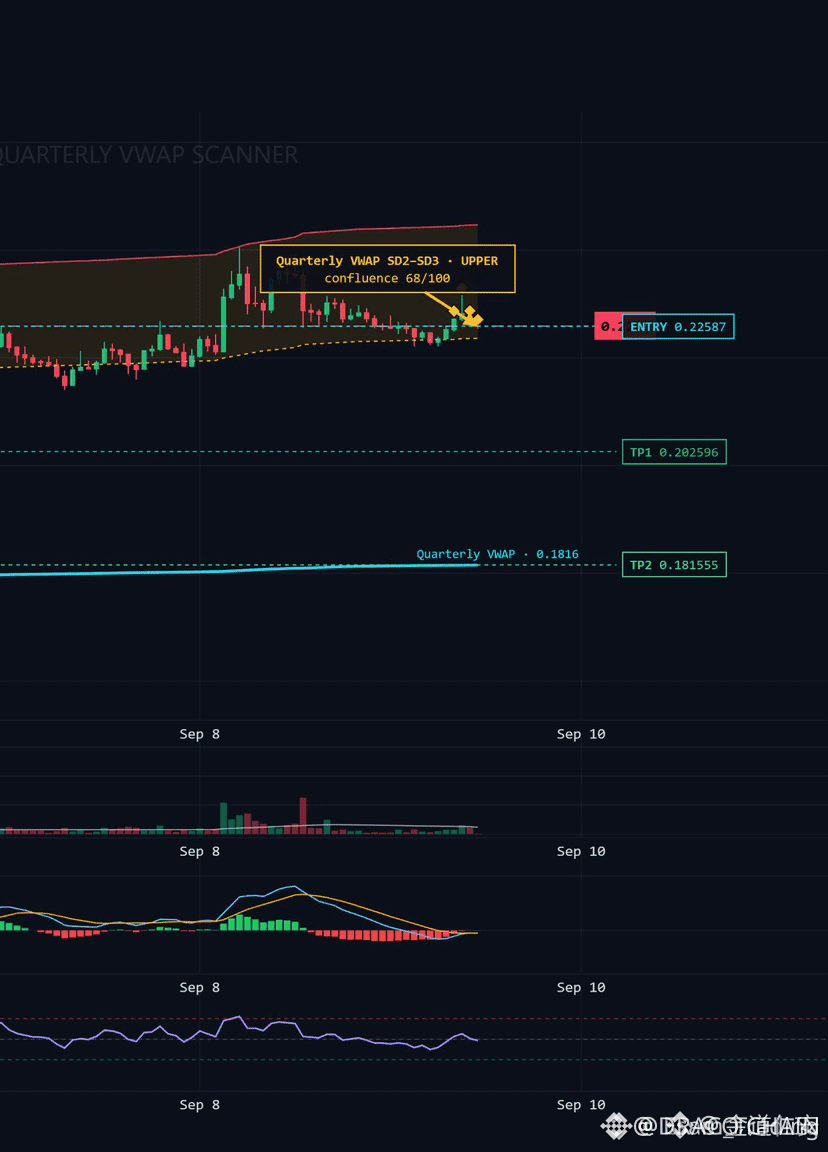
⚡ $SYRUP 1H SHORT ALERT: VWAP BAND CRUSHES LIQUIDITY 🦈
Entry: 0.22587 ⚡
Target: 0.20259 🎯
Target: 0.18155 🎯
Stop Loss: 0.2620 ⚠️
The 1‑hour VWAP band has turned into a bearish conduit, swallowing liquidity at 0.22587. 📊 A swift price dip below the band signals smart‑money aggression, with order flow spilling into the next demand zone.
Volume spikes align with a classic liquidity hunt, reinforcing the short bias. 🦈 Expect the market to hunt the 0.2620 stop before diving toward the first profit corridor at 0.20259 and the deeper 0.18155. ⚡
💬 Do you see the next sweep confirming the downtrend?
⚠️ Not financial advice. Always manage your risk. 🛡️
🏷️ #SYRUP #ShortSetup #VWAP #Crypto
🦈 🔥
⚡ $SYRUP 1H SHORT ALERT: VWAP BAND CRUSHES LIQUIDITY 🦈
Entry: 0.22587 ⚡
Target: 0.20259 🎯
Target: 0.18155 🎯
Stop Loss: 0.2620 ⚠️
The 1‑hour VWAP band has turned into a bearish conduit, swallowing liquidity at 0.22587. 📊 A swift price dip below the band signals smart‑money aggression, with order flow spilling into the next demand zone.
Volume spikes align with a classic liquidity hunt, reinforcing the short bias. 🦈 Expect the market to hunt the 0.2620 stop before diving toward the first profit corridor at 0.20259 and the deeper 0.18155. ⚡
💬 Do you see the next sweep confirming the downtrend?
⚠️ Not financial advice. Always manage your risk. 🛡️
🏷️ #SYRUP #ShortSetup #VWAP #Crypto
🦈 🔥
Entry: 0.22587 ⚡
Target: 0.20259 🎯
Target: 0.18155 🎯
Stop Loss: 0.2620 ⚠️
The 1‑hour VWAP band has turned into a bearish conduit, swallowing liquidity at 0.22587. 📊 A swift price dip below the band signals smart‑money aggression, with order flow spilling into the next demand zone.
Volume spikes align with a classic liquidity hunt, reinforcing the short bias. 🦈 Expect the market to hunt the 0.2620 stop before diving toward the first profit corridor at 0.20259 and the deeper 0.18155. ⚡
💬 Do you see the next sweep confirming the downtrend?
⚠️ Not financial advice. Always manage your risk. 🛡️
🏷️ #SYRUP #ShortSetup #VWAP #Crypto
🦈 🔥
19

: The indicator 90% of traders ignore (and should use every day) 📊⚠️
Text:
Today we’re going to talk about something that isn’t RSI, isn’t MACD, and isn’t support and resistance.
We’re talking about VOLUME WEIGHTED AVERAGE PRICE (VWAP). 📉
What is it? Basically, it’s the average price at which an asset has been traded, weighted by the volume of each trade. It’s the institutional favorite indicator to know whether they’re buying “expensive” or “cheap” versus the day’s average.
Why is it so useful for us?
✅ It tells you whether the current price is above or below the day’s “fair value.”
✅ When price is far above the VWAP, there may be temporary overbought conditions.
✅ When it’s far below, there are often good buy opportunities with a solid risk/reward ratio.
Practical rule I use:
👉 If price is above the VWAP and the volume supports it = a healthy uptrend.
👉 If price is below the VWAP and volume drops = a weakness signal.
Heads up, it’s not magic: Like any indicator, it works best with context. But if you add it to your Trading Toolkit, you’ll start seeing the market in a different way. 🔍
Now I want to know from you: Have you already been using VWAP? Or are you lifelong RSI/MACD team? Tell me in the comments 👇
If this post added value to you, hit 🔥 and save it to review later.
#EducacionCrypto #BinaceSquare #AprenderTrading #VWAP #bitcoin .$NVDAB
: The indicator 90% of traders ignore (and should use every day) 📊⚠️
Text:
Today we’re going to talk about something that isn’t RSI, isn’t MACD, and isn’t support and resistance.
We’re talking about VOLUME WEIGHTED AVERAGE PRICE (VWAP). 📉
What is it? Basically, it’s the average price at which an asset has been traded, weighted by the volume of each trade. It’s the institutional favorite indicator to know whether they’re buying “expensive” or “cheap” versus the day’s average.
Why is it so useful for us?
✅ It tells you whether the current price is above or below the day’s “fair value.”
✅ When price is far above the VWAP, there may be temporary overbought conditions.
✅ When it’s far below, there are often good buy opportunities with a solid risk/reward ratio.
Practical rule I use:
👉 If price is above the VWAP and the volume supports it = a healthy uptrend.
👉 If price is below the VWAP and volume drops = a weakness signal.
Heads up, it’s not magic: Like any indicator, it works best with context. But if you add it to your Trading Toolkit, you’ll start seeing the market in a different way. 🔍
Now I want to know from you: Have you already been using VWAP? Or are you lifelong RSI/MACD team? Tell me in the comments 👇
If this post added value to you, hit 🔥 and save it to review later.
#EducacionCrypto #BinaceSquare #AprenderTrading #VWAP #bitcoin .$NVDAB
Text:
Today we’re going to talk about something that isn’t RSI, isn’t MACD, and isn’t support and resistance.
We’re talking about VOLUME WEIGHTED AVERAGE PRICE (VWAP). 📉
What is it? Basically, it’s the average price at which an asset has been traded, weighted by the volume of each trade. It’s the institutional favorite indicator to know whether they’re buying “expensive” or “cheap” versus the day’s average.
Why is it so useful for us?
✅ It tells you whether the current price is above or below the day’s “fair value.”
✅ When price is far above the VWAP, there may be temporary overbought conditions.
✅ When it’s far below, there are often good buy opportunities with a solid risk/reward ratio.
Practical rule I use:
👉 If price is above the VWAP and the volume supports it = a healthy uptrend.
👉 If price is below the VWAP and volume drops = a weakness signal.
Heads up, it’s not magic: Like any indicator, it works best with context. But if you add it to your Trading Toolkit, you’ll start seeing the market in a different way. 🔍
Now I want to know from you: Have you already been using VWAP? Or are you lifelong RSI/MACD team? Tell me in the comments 👇
If this post added value to you, hit 🔥 and save it to review later.
#EducacionCrypto #BinaceSquare #AprenderTrading #VWAP #bitcoin .$NVDAB
75

·
--
Bullish
30D trade $BTC 156.1 USDT
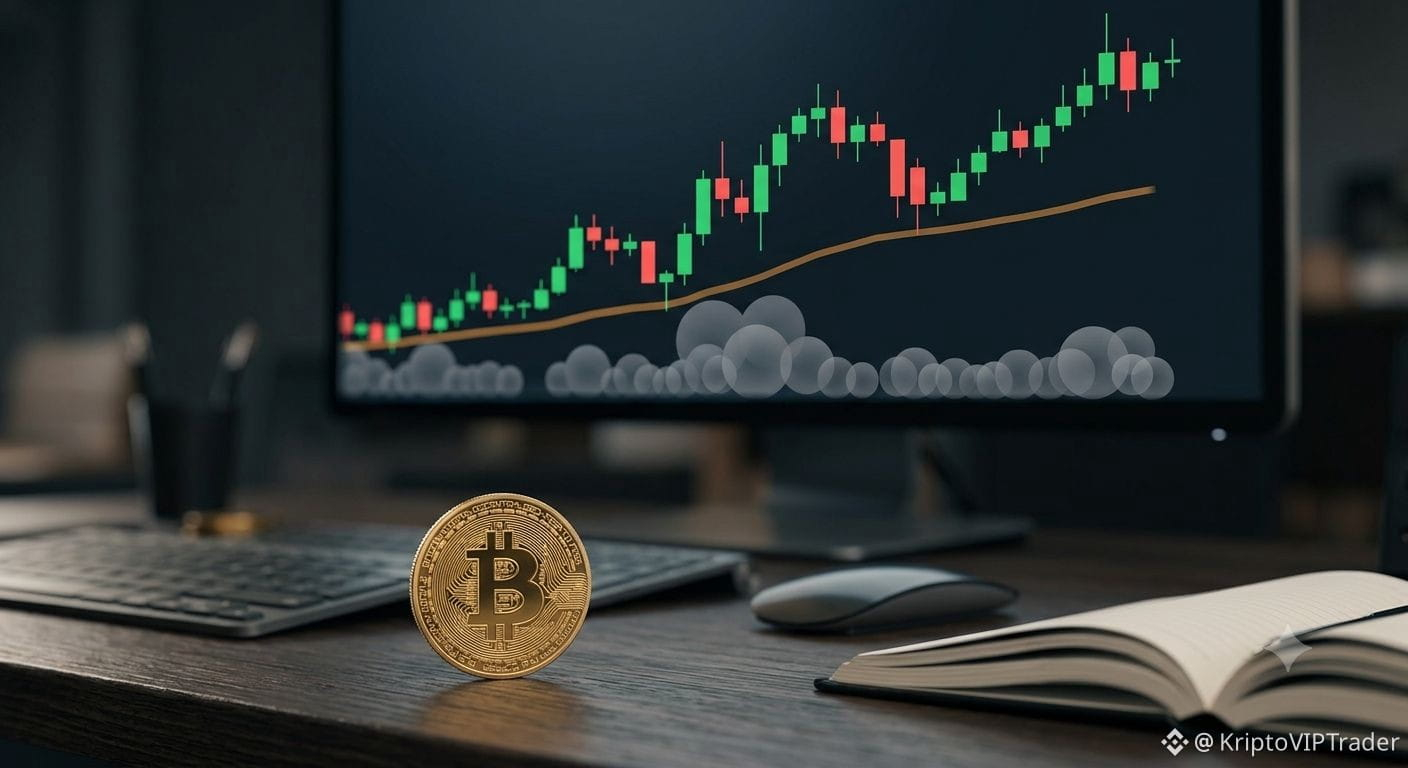
BTC is holding strength, trading at $78,840.0, up +1.25% in the last 24 hours. When looking at the 4-hour chart, it's trading cleanly above its Volume Weighted Average Price (VWAP), which currently sits at $78,413.7.
VWAP isn’t just an average price. It weights every trade by its size. This gives you the session’s true center of gravity — the exact level where the bulk of the market’s volume actually traded and where institutional size found agreement.
Right now, $78,413.7 on the 4-hour timeframe is the reference point showing where the heaviest commitments were made. BTC trading above this level means current price action is stronger than the average price anchored by the day's heaviest volume.
$BTC #VWAP #Write2Earn
BTC is holding strength, trading at $78,840.0, up +1.25% in the last 24 hours. When looking at the 4-hour chart, it's trading cleanly above its Volume Weighted Average Price (VWAP), which currently sits at $78,413.7.
VWAP isn’t just an average price. It weights every trade by its size. This gives you the session’s true center of gravity — the exact level where the bulk of the market’s volume actually traded and where institutional size found agreement.
Right now, $78,413.7 on the 4-hour timeframe is the reference point showing where the heaviest commitments were made. BTC trading above this level means current price action is stronger than the average price anchored by the day's heaviest volume.
$BTC #VWAP #Write2Earn
VWAP isn’t just an average price. It weights every trade by its size. This gives you the session’s true center of gravity — the exact level where the bulk of the market’s volume actually traded and where institutional size found agreement.
Right now, $78,413.7 on the 4-hour timeframe is the reference point showing where the heaviest commitments were made. BTC trading above this level means current price action is stronger than the average price anchored by the day's heaviest volume.
$BTC #VWAP #Write2Earn
1
60

·
--
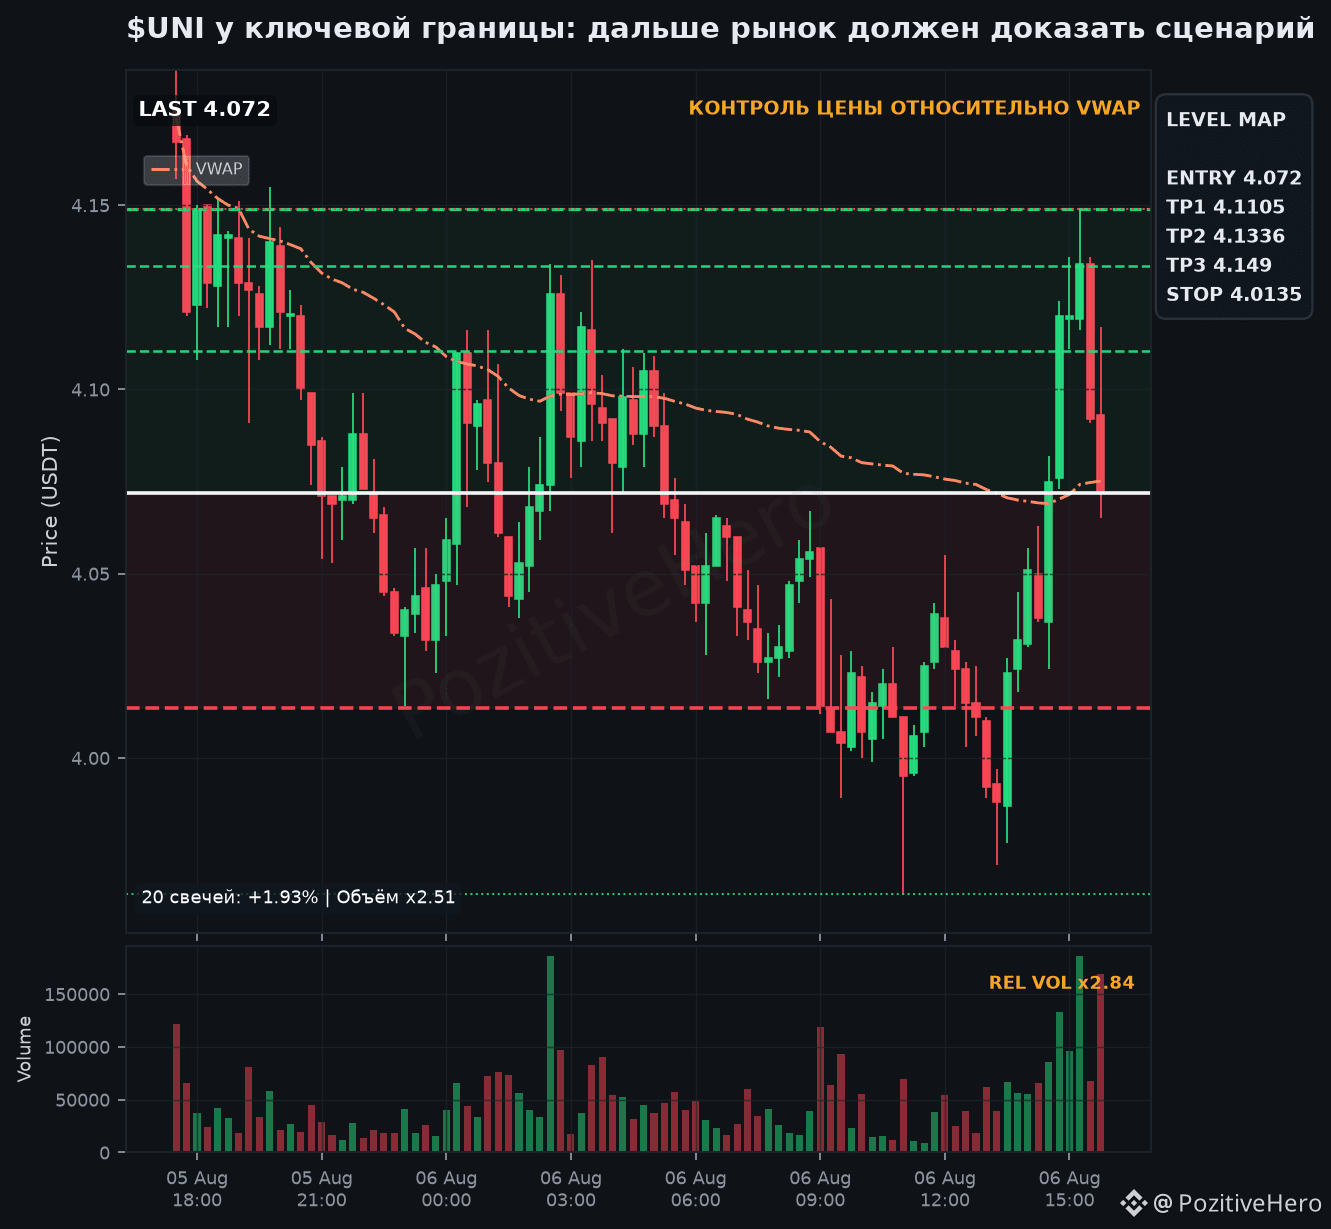
$UNI at the key boundary: beyond this, the market must prove the scenario
Key boundary: 4.149 USDT. While price is near, the forecast is less useful than observing how the market reacts.
The LONG scenario is confirmed if the market shows price holding above 4.149 and a buyer reaction.
Why this level matters: Price is above VWAP 4.0595. Current: 15M -0.49%, 45M -1.17%.
Key level: 4.149 USDT
LONG is confirmed by a reaction at the level. First target: 4.1105. Invalidation: 4.0135.
My position: The market always tells the truth, but it requires the correct interpretation
Invalidation: After a stop is confirmed by consolidation, the hypothesis no longer holds; averaging is not used.
#VWAP
$UNI at the key boundary: beyond this, the market must prove the scenario
Key boundary: 4.149 USDT. While price is near, the forecast is less useful than observing how the market reacts.
The LONG scenario is confirmed if the market shows price holding above 4.149 and a buyer reaction.
Why this level matters: Price is above VWAP 4.0595. Current: 15M -0.49%, 45M -1.17%.
Key level: 4.149 USDT
LONG is confirmed by a reaction at the level. First target: 4.1105. Invalidation: 4.0135.
My position: The market always tells the truth, but it requires the correct interpretation
Invalidation: After a stop is confirmed by consolidation, the hypothesis no longer holds; averaging is not used.
#VWAP
Key boundary: 4.149 USDT. While price is near, the forecast is less useful than observing how the market reacts.
The LONG scenario is confirmed if the market shows price holding above 4.149 and a buyer reaction.
Why this level matters: Price is above VWAP 4.0595. Current: 15M -0.49%, 45M -1.17%.
Key level: 4.149 USDT
LONG is confirmed by a reaction at the level. First target: 4.1105. Invalidation: 4.0135.
My position: The market always tells the truth, but it requires the correct interpretation
Invalidation: After a stop is confirmed by consolidation, the hypothesis no longer holds; averaging is not used.
#VWAP
52
·
--
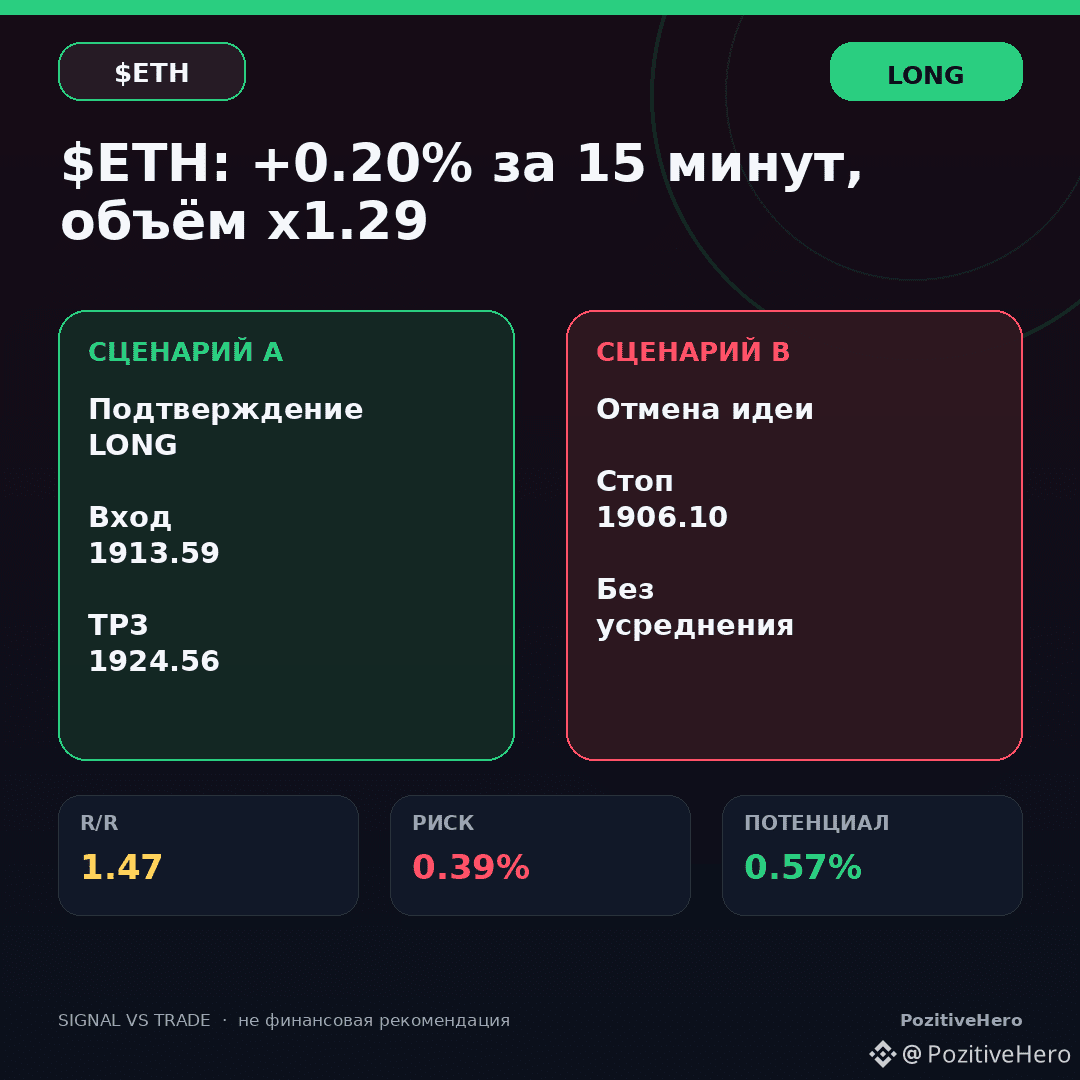
$ETH: +0.20% in 15 minutes, volume x1.29
The trade appears only after the condition is met: price holding above 1924.56 and buyer reaction.
Signal direction: LONG. The position relative to VWAP confirms one-sided market control. Core idea: price control relative to VWAP. RSI 57.6, ADX 17.8. Price is above VWAP 1909.01.
Before confirmation, this is an analytical observation, not necessarily a reason to open a position.
Cancellation: Exiting beyond the stop level means the plan is canceled, not a reason to increase the position.
Price path
Entry: 1913.59 USDT
Targets: 1919.07 / 1922.37 / 1924.56 USDT
R/R: 1.47
Stop-loss: 1906.10 USDT
I separate direction from execution: a correct idea can still have a bad entry price.
What sign would make you skip this trade?
#VWAP
$ETH : +0.20% in 15 minutes, volume x1.29
The trade appears only after the condition is met: price holding above 1924.56 and buyer reaction.
Signal direction: LONG. The position relative to VWAP confirms one-sided market control. Core idea: price control relative to VWAP. RSI 57.6, ADX 17.8. Price is above VWAP 1909.01.
Before confirmation, this is an analytical observation, not necessarily a reason to open a position.
Cancellation: Exiting beyond the stop level means the plan is canceled, not a reason to increase the position.
Price path
Entry: 1913.59 USDT
Targets: 1919.07 / 1922.37 / 1924.56 USDT
R/R: 1.47
Stop-loss: 1906.10 USDT
I separate direction from execution: a correct idea can still have a bad entry price.
What sign would make you skip this trade?
#VWAP
The trade appears only after the condition is met: price holding above 1924.56 and buyer reaction.
Signal direction: LONG. The position relative to VWAP confirms one-sided market control. Core idea: price control relative to VWAP. RSI 57.6, ADX 17.8. Price is above VWAP 1909.01.
Before confirmation, this is an analytical observation, not necessarily a reason to open a position.
Cancellation: Exiting beyond the stop level means the plan is canceled, not a reason to increase the position.
Price path
Entry: 1913.59 USDT
Targets: 1919.07 / 1922.37 / 1924.56 USDT
R/R: 1.47
Stop-loss: 1906.10 USDT
I separate direction from execution: a correct idea can still have a bad entry price.
What sign would make you skip this trade?
#VWAP
45

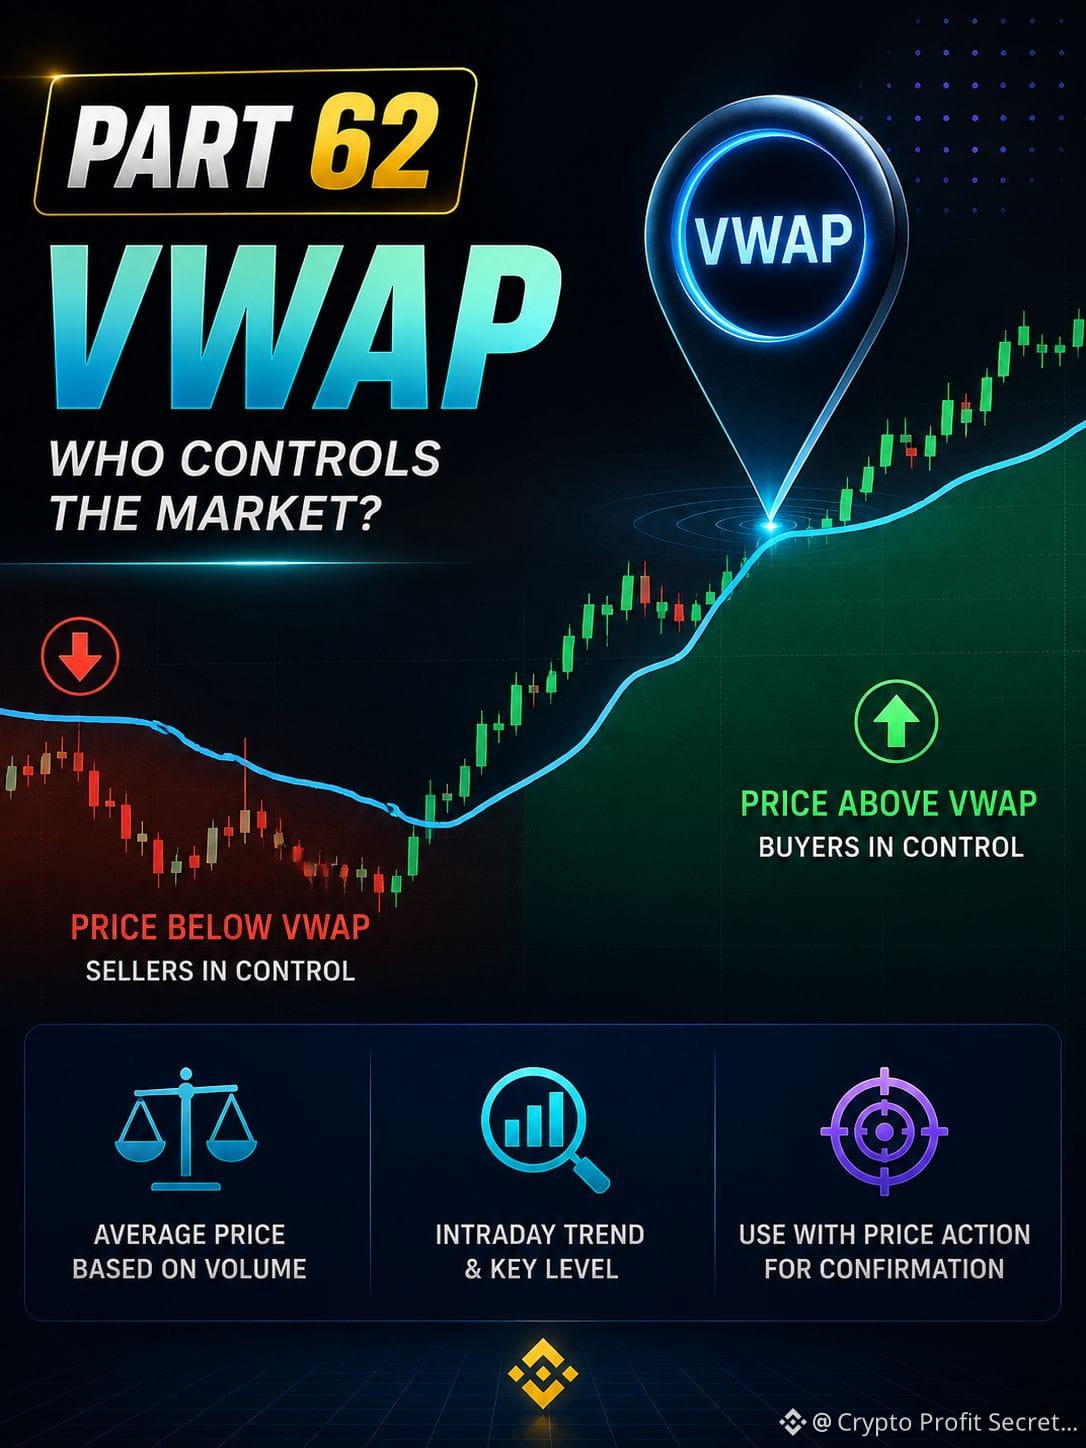
📚 Crypto Learning Series – Part 62
📍 What is VWAP?
VWAP, or Volume Weighted Average Price, is an indicator that averages the price based on volume.
In simple words:
VWAP tells you around which price the market traded on average along with volume.
📈 If the price is above VWAP
→ Buyers’ control may be relatively strong.
📉 If the price is below VWAP
→ Sellers’ pressure may be higher.
💡 Traders often use VWAP to understand intraday trends, support, and resistance.
⚠️ Don’t treat VWAP as a standalone Buy/Sell signal. Also look at price action and market structure.
📌 Remember
✅ VWAP = average price with volume
✅ Price above VWAP = possible bullish bias
✅ Price below VWAP = possible bearish bias
🧠 Simple Rule
"Compare the price with VWAP."
🔑 Golden Rule
"VWAP helps with direction, not decisions."
#CryptoLearning #VWAP #trading #BTC #BinanceSquare $BTC
{spot}(BTCUSDT)
📚 Crypto Learning Series – Part 62
📍 What is VWAP?
VWAP, or Volume Weighted Average Price, is an indicator that averages the price based on volume.
In simple words:
VWAP tells you around which price the market traded on average along with volume.
📈 If the price is above VWAP
→ Buyers’ control may be relatively strong.
📉 If the price is below VWAP
→ Sellers’ pressure may be higher.
💡 Traders often use VWAP to understand intraday trends, support, and resistance.
⚠️ Don’t treat VWAP as a standalone Buy/Sell signal. Also look at price action and market structure.
📌 Remember
✅ VWAP = average price with volume
✅ Price above VWAP = possible bullish bias
✅ Price below VWAP = possible bearish bias
🧠 Simple Rule
"Compare the price with VWAP."
🔑 Golden Rule
"VWAP helps with direction, not decisions."
#CryptoLearning #VWAP #trading #BTC #BinanceSquare $BTC
📍 What is VWAP?
VWAP, or Volume Weighted Average Price, is an indicator that averages the price based on volume.
In simple words:
VWAP tells you around which price the market traded on average along with volume.
📈 If the price is above VWAP
→ Buyers’ control may be relatively strong.
📉 If the price is below VWAP
→ Sellers’ pressure may be higher.
💡 Traders often use VWAP to understand intraday trends, support, and resistance.
⚠️ Don’t treat VWAP as a standalone Buy/Sell signal. Also look at price action and market structure.
📌 Remember
✅ VWAP = average price with volume
✅ Price above VWAP = possible bullish bias
✅ Price below VWAP = possible bearish bias
🧠 Simple Rule
"Compare the price with VWAP."
🔑 Golden Rule
"VWAP helps with direction, not decisions."
#CryptoLearning #VWAP #trading #BTC #BinanceSquare $BTC
2
87

·
--
Bullish
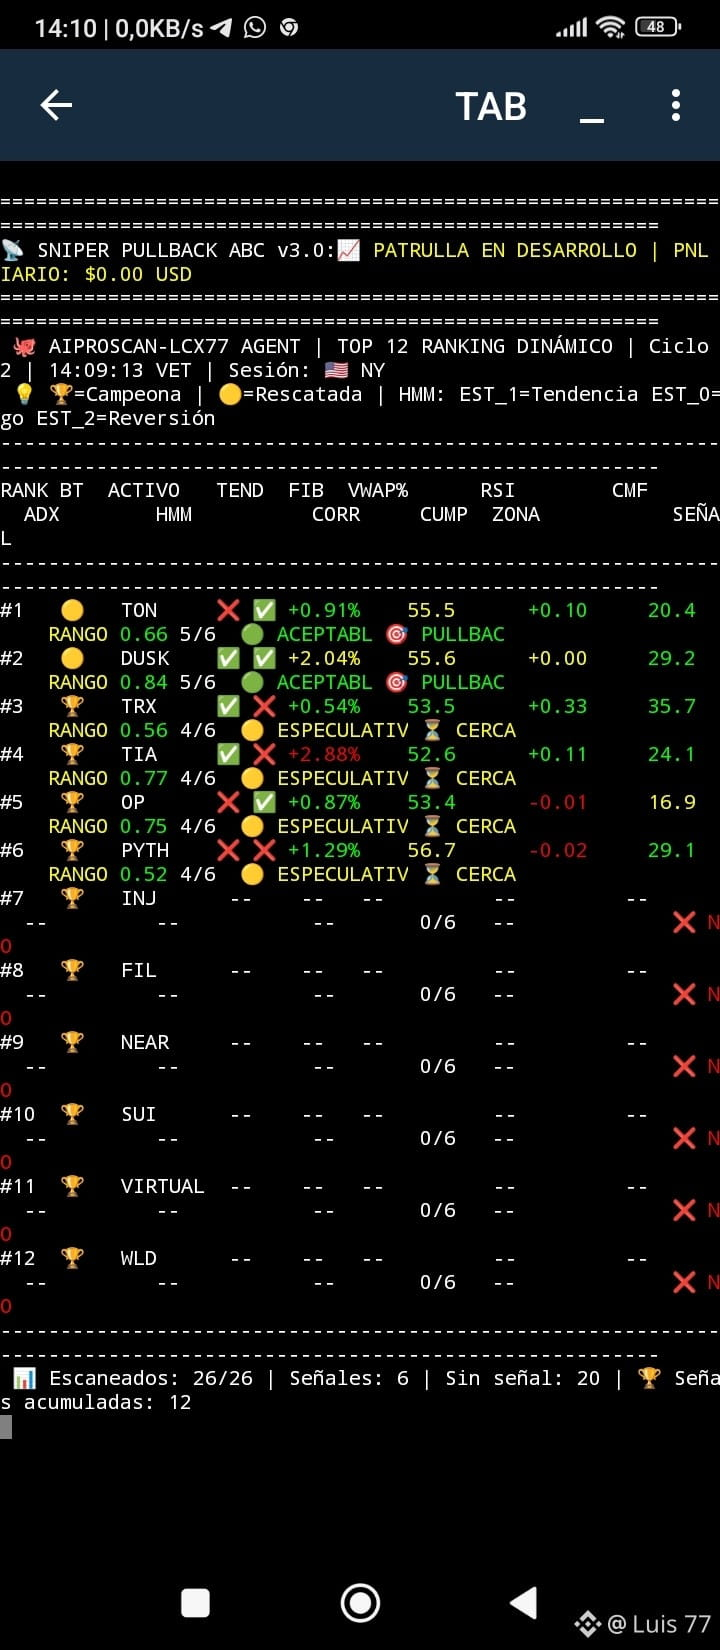
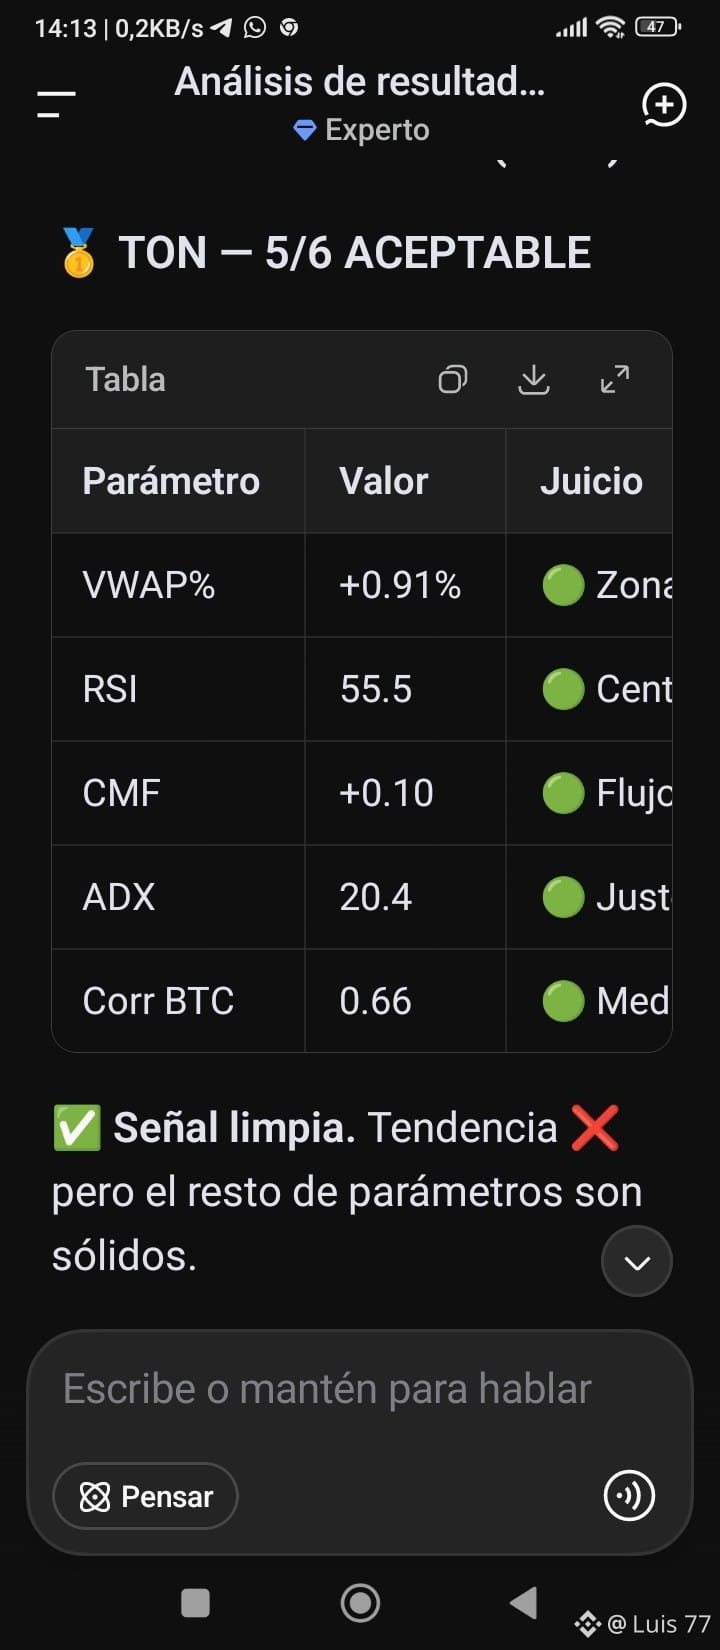
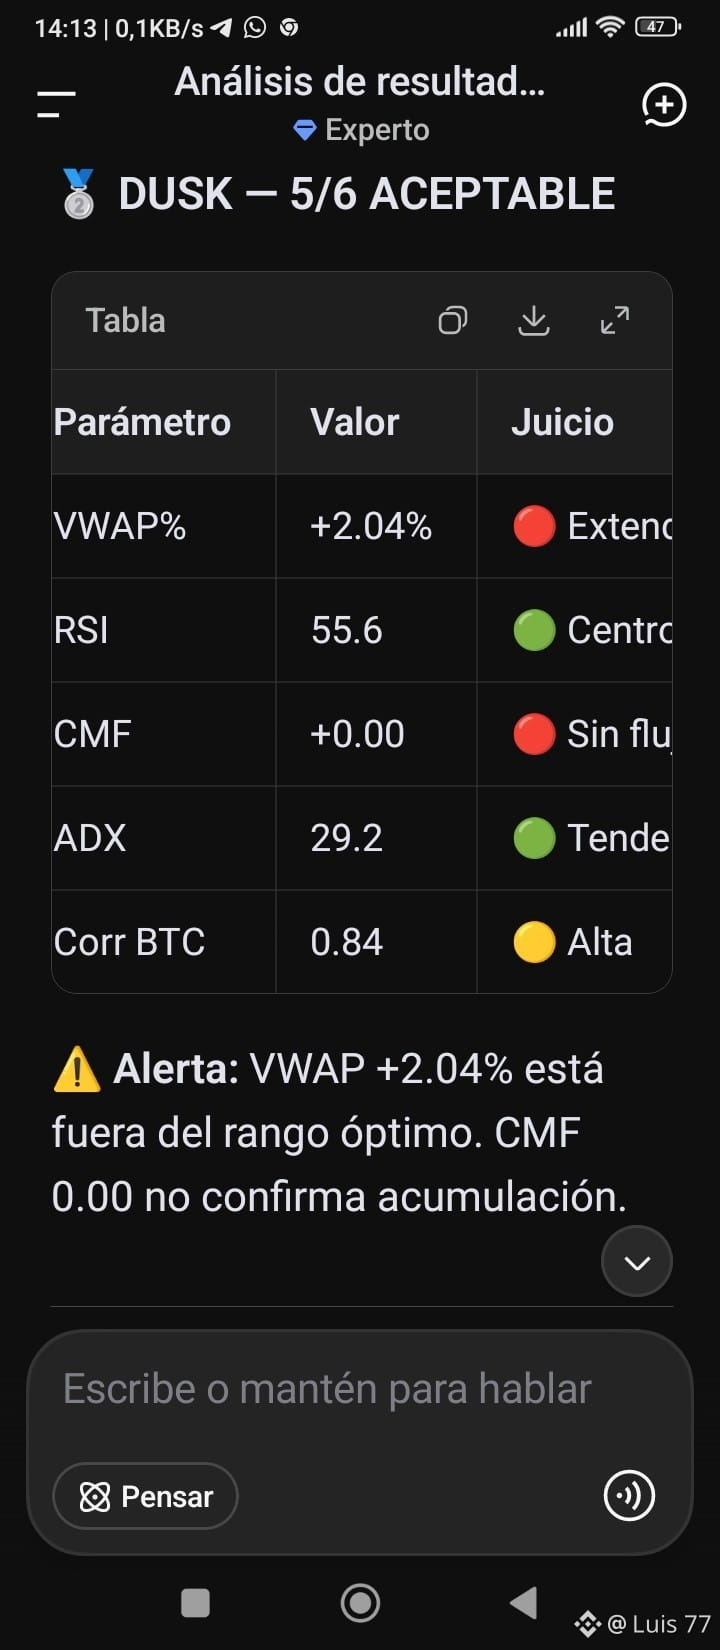
It's not enough to just see a moving average cross: here's how to validate a trade with VWAP and ADX 🔥:
Many traders make a basic mistake: they see a moving average cross and jump in immediately, as if that alone confirms a trend.
But in fast markets, a cross without validation can just be noise.
If you want to trade with logic that's closer to institutional reading, you need confirmation of context, strength, and price position. This is where three key tools come into play: moving averages, VWAP, and ADX.
1) Moving Averages: the structure
The averages don't predict; they organize price.
When the EMA 9 crosses above the EMA 21, an early momentum signal appears.
If the price also stays above the EMA 50, the structure gains strength. This helps distinguish between a weak bounce and a move with intention.
2) VWAP: the execution validator
VWAP is a highly watched reference because it shows the volume-weighted average price.
In simple terms:
It helps know if the price is trading in an efficient zone or if it's too stretched out.
For longs, the reading improves when:
the price is above VWAP
the asset is not excessively far from the VWAP
there's a clean reaction near that reference
This prevents entering late, chasing an inflated candlestick.
3) ADX: the strength filter
The ADX doesn't tell you direction; it tells you if the trend has strength.
An ADX above 20 already suggests directional intent.
If it exceeds 25, the structure usually becomes more reliable.
Conclusion
A higher quality trade doesn't just come from a cross.
It comes when the averages align the structure, the VWAP validates the price location, and the ADX confirms the strength of the move.
That's transitioning from trading isolated signals to trading with context.
💬 If you want, in the next post I'll give you an exact entry template, stop loss, and confirmation on 1H.
#VWAP #SpaceXPremarketFalls4.6% #BinanceSquare #BinanceToOpenXLMSpotTrading #LUIS77 $BTC
{future}(TONUSDT)
{future}(DUSKUSDT)
{future}(BTCUSDT)
It's not enough to just see a moving average cross: here's how to validate a trade with VWAP and ADX 🔥:
Many traders make a basic mistake: they see a moving average cross and jump in immediately, as if that alone confirms a trend.
But in fast markets, a cross without validation can just be noise.
If you want to trade with logic that's closer to institutional reading, you need confirmation of context, strength, and price position. This is where three key tools come into play: moving averages, VWAP, and ADX.
1) Moving Averages: the structure
The averages don't predict; they organize price.
When the EMA 9 crosses above the EMA 21, an early momentum signal appears.
If the price also stays above the EMA 50, the structure gains strength. This helps distinguish between a weak bounce and a move with intention.
2) VWAP: the execution validator
VWAP is a highly watched reference because it shows the volume-weighted average price.
In simple terms:
It helps know if the price is trading in an efficient zone or if it's too stretched out.
For longs, the reading improves when:
the price is above VWAP
the asset is not excessively far from the VWAP
there's a clean reaction near that reference
This prevents entering late, chasing an inflated candlestick.
3) ADX: the strength filter
The ADX doesn't tell you direction; it tells you if the trend has strength.
An ADX above 20 already suggests directional intent.
If it exceeds 25, the structure usually becomes more reliable.
Conclusion
A higher quality trade doesn't just come from a cross.
It comes when the averages align the structure, the VWAP validates the price location, and the ADX confirms the strength of the move.
That's transitioning from trading isolated signals to trading with context.
💬 If you want, in the next post I'll give you an exact entry template, stop loss, and confirmation on 1H.
#VWAP #SpaceXPremarketFalls4.6% #BinanceSquare #BinanceToOpenXLMSpotTrading #LUIS77 $BTC
Many traders make a basic mistake: they see a moving average cross and jump in immediately, as if that alone confirms a trend.
But in fast markets, a cross without validation can just be noise.
If you want to trade with logic that's closer to institutional reading, you need confirmation of context, strength, and price position. This is where three key tools come into play: moving averages, VWAP, and ADX.
1) Moving Averages: the structure
The averages don't predict; they organize price.
When the EMA 9 crosses above the EMA 21, an early momentum signal appears.
If the price also stays above the EMA 50, the structure gains strength. This helps distinguish between a weak bounce and a move with intention.
2) VWAP: the execution validator
VWAP is a highly watched reference because it shows the volume-weighted average price.
In simple terms:
It helps know if the price is trading in an efficient zone or if it's too stretched out.
For longs, the reading improves when:
the price is above VWAP
the asset is not excessively far from the VWAP
there's a clean reaction near that reference
This prevents entering late, chasing an inflated candlestick.
3) ADX: the strength filter
The ADX doesn't tell you direction; it tells you if the trend has strength.
An ADX above 20 already suggests directional intent.
If it exceeds 25, the structure usually becomes more reliable.
Conclusion
A higher quality trade doesn't just come from a cross.
It comes when the averages align the structure, the VWAP validates the price location, and the ADX confirms the strength of the move.
That's transitioning from trading isolated signals to trading with context.
💬 If you want, in the next post I'll give you an exact entry template, stop loss, and confirmation on 1H.
#VWAP #SpaceXPremarketFalls4.6% #BinanceSquare #BinanceToOpenXLMSpotTrading #LUIS77 $BTC
162
·
--
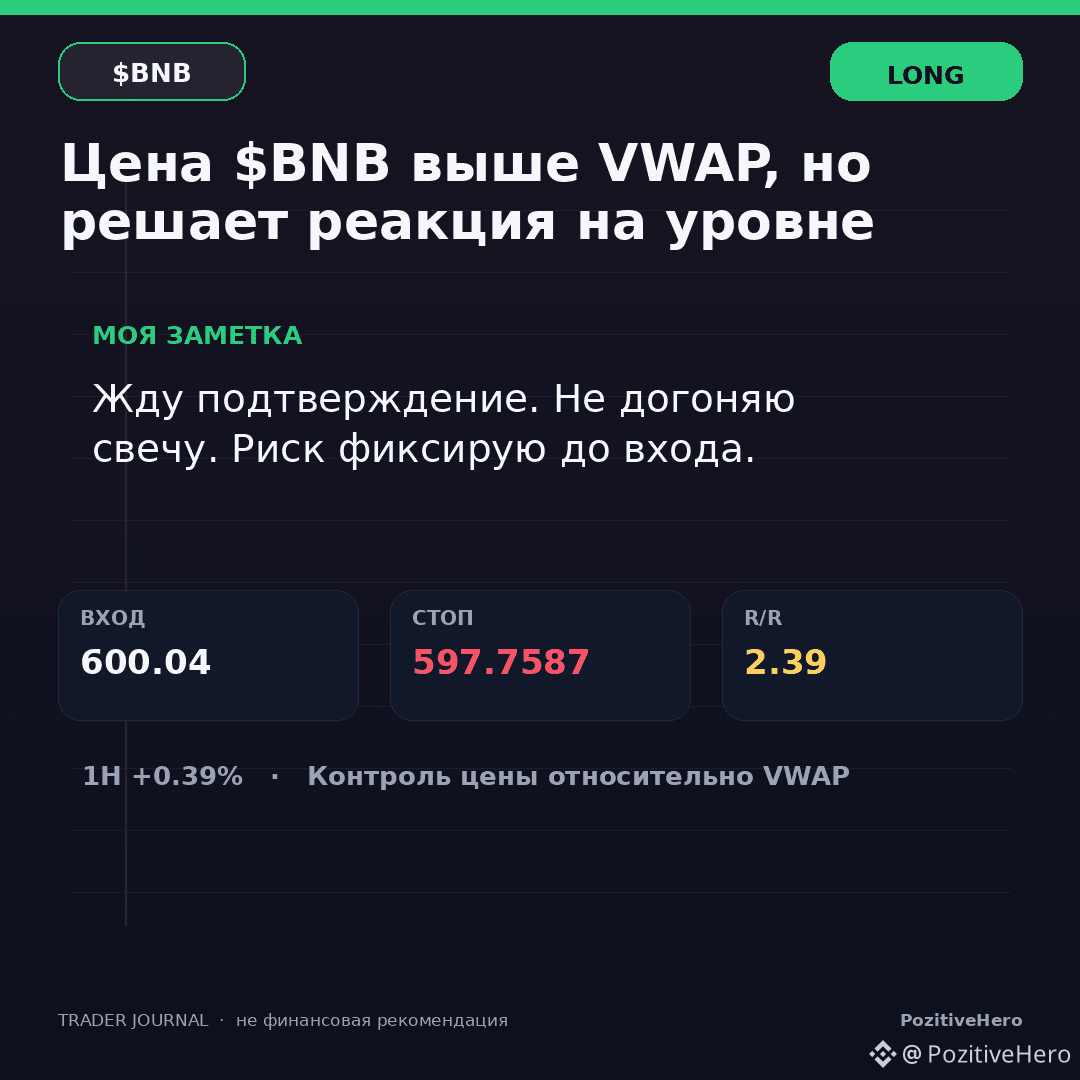
Price $BNB is above VWAP, but the reaction at the level decides
Journal entry. I separate direction from execution: a correct idea can have a bad entry price.
What I see: LONG direction. The position relative to VWAP confirms control by one side of the market. The volume of the latest closed 15M candle x1.13 versus the median of 20 candles. The core of the thesis: control of price relative to VWAP.
What should happen before the trade: price holding above 605.5 and buyers reacting.
What I’m watching: 605.5 USDT
Target on confirmation: 602.3213. Error boundary: 597.7587.
Where I acknowledge a mistake: If the price accepts the area after the stop, the scenario ends without moving the error boundary.
Would you execute such a plan with one order or in parts?
#VWAP
Price $BNB is above VWAP, but the reaction at the level decides
Journal entry. I separate direction from execution: a correct idea can have a bad entry price.
What I see: LONG direction. The position relative to VWAP confirms control by one side of the market. The volume of the latest closed 15M candle x1.13 versus the median of 20 candles. The core of the thesis: control of price relative to VWAP.
What should happen before the trade: price holding above 605.5 and buyers reacting.
What I’m watching: 605.5 USDT
Target on confirmation: 602.3213. Error boundary: 597.7587.
Where I acknowledge a mistake: If the price accepts the area after the stop, the scenario ends without moving the error boundary.
Would you execute such a plan with one order or in parts?
#VWAP
Journal entry. I separate direction from execution: a correct idea can have a bad entry price.
What I see: LONG direction. The position relative to VWAP confirms control by one side of the market. The volume of the latest closed 15M candle x1.13 versus the median of 20 candles. The core of the thesis: control of price relative to VWAP.
What should happen before the trade: price holding above 605.5 and buyers reacting.
What I’m watching: 605.5 USDT
Target on confirmation: 602.3213. Error boundary: 597.7587.
Where I acknowledge a mistake: If the price accepts the area after the stop, the scenario ends without moving the error boundary.
Would you execute such a plan with one order or in parts?
#VWAP
49
·
--
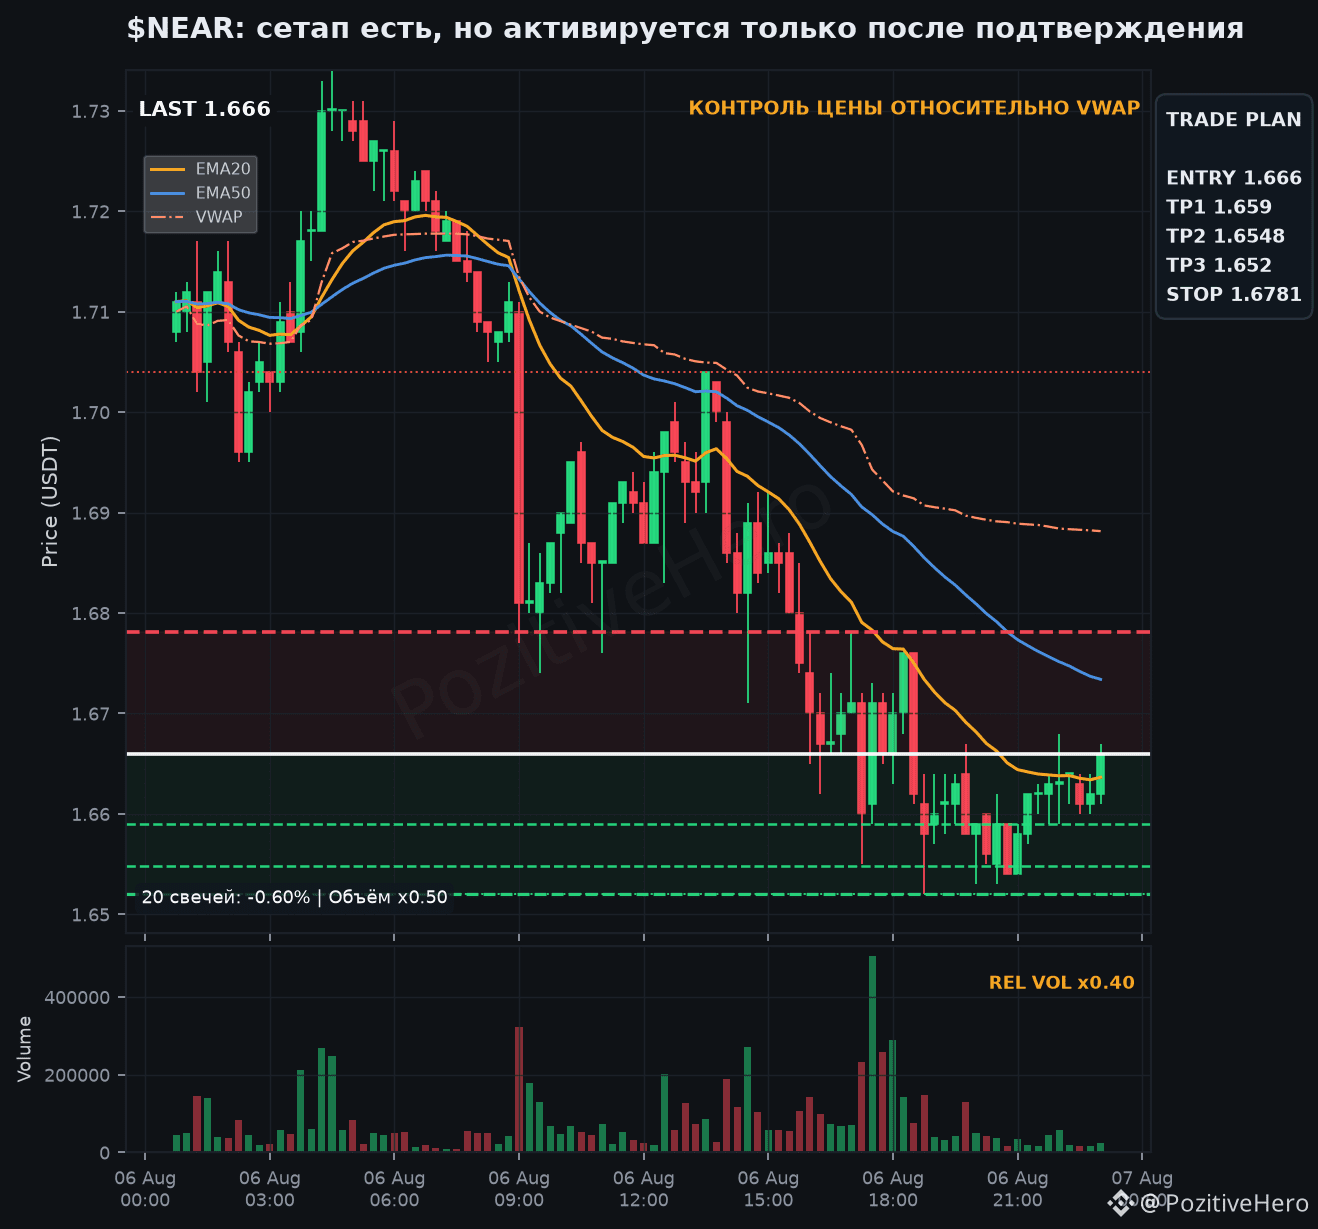
$NEAR: the setup is in place, but it only activates after confirmation
Direction: SHORT. The position relative to VWAP confirms control by one side of the market.
Scenario parameters
Entry: 1.666 USDT
Stop-loss: 1.6781 USDT
Targets: 1.659 / 1.6548 / 1.652 USDT
R/R: 1.16
Higher timeframes: 3/3 align with the direction (1H bullish, 4H bullish, 1D bullish). Control range 1.652–1.704. Currently: 15M +0.24%, 45M +0.12%.
Trigger: price holding below 1.652 and sellers reacting.
A separate indicator here changes nothing; what matters is the combination of factors.
Invalidation: the stop is the technical boundary of the idea: the market crossed it — the position is closed.
What sign would make you skip this trade?
#VWAP
$NEAR : the setup is in place, but it only activates after confirmation
Direction: SHORT. The position relative to VWAP confirms control by one side of the market.
Scenario parameters
Entry: 1.666 USDT
Stop-loss: 1.6781 USDT
Targets: 1.659 / 1.6548 / 1.652 USDT
R/R: 1.16
Higher timeframes: 3/3 align with the direction (1H bullish, 4H bullish, 1D bullish). Control range 1.652–1.704. Currently: 15M +0.24%, 45M +0.12%.
Trigger: price holding below 1.652 and sellers reacting.
A separate indicator here changes nothing; what matters is the combination of factors.
Invalidation: the stop is the technical boundary of the idea: the market crossed it — the position is closed.
What sign would make you skip this trade?
#VWAP
Direction: SHORT. The position relative to VWAP confirms control by one side of the market.
Scenario parameters
Entry: 1.666 USDT
Stop-loss: 1.6781 USDT
Targets: 1.659 / 1.6548 / 1.652 USDT
R/R: 1.16
Higher timeframes: 3/3 align with the direction (1H bullish, 4H bullish, 1D bullish). Control range 1.652–1.704. Currently: 15M +0.24%, 45M +0.12%.
Trigger: price holding below 1.652 and sellers reacting.
A separate indicator here changes nothing; what matters is the combination of factors.
Invalidation: the stop is the technical boundary of the idea: the market crossed it — the position is closed.
What sign would make you skip this trade?
#VWAP
32

·
--
Article
VWAP: The Indicator That Separates Smart Traders From the NoiseMost traders stare at moving averages and hope for the best.Smart traders use VWAP.Here's everything you need to know — no jargon, no fluff.
What is VWAP?
VWAP stands for Volume Weighted Average Price.
It sounds complicated. It isn't.
It answers one simple question: What is the average price traders actually paid today, weighted by how much they traded at each level?
A regular moving average treats every price equally. VWAP doesn't. It gives more weight to prices where heavy volume traded. That makes it far more honest about where the market really is.
The formula looks like this:
VWAP = (Price × Volume) ÷ Total Volume
But you don't need to calculate it. Every charting platform draws it automatically. One click. It resets every day at market open.
Why does it matter?
Institutions — banks, hedge funds, pension funds — use VWAP as their benchmark. When they need to buy $500 million of Bitcoin without moving the market, they try to do it near VWAP. It proves to their clients they got a fair price.
This means VWAP is not just a line on your chart. It's where the biggest money in the market is anchored.
When price is above VWAP → buyers are in control. Institutions are paying above average. Bullish.
When price is below VWAP → sellers are in control. The market is trading below its fair value. Bearish.
Simple. Powerful.
VWAP for Breakout Strategies
This is where it gets practical.
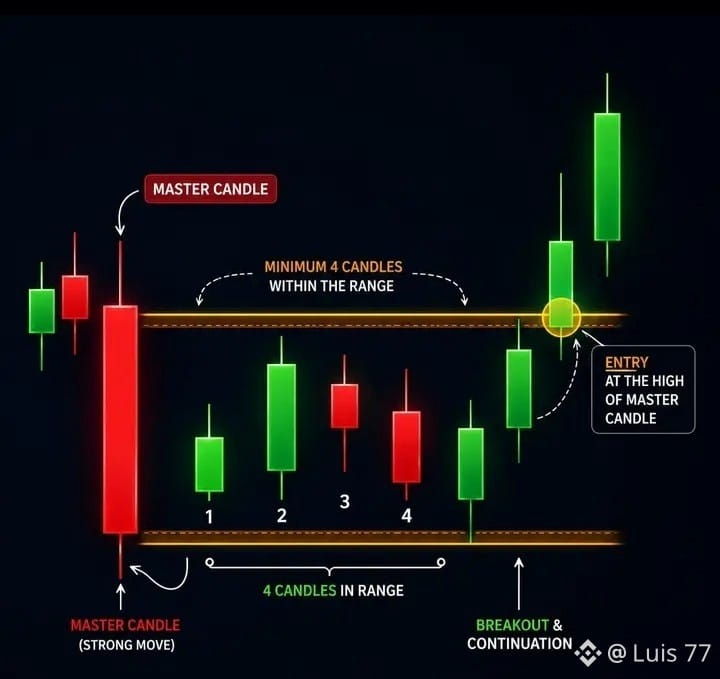
A breakout trader looks for moments when price escapes a range and starts a new move. VWAP helps you separate real breakouts from fake ones.
The setup:
Price consolidates below VWAP for several candles. Volume is low and flat. Then suddenly — one candle closes above VWAP with a significant volume spike.
That's the signal.
Why does it work? Because price crossing VWAP with high volume means institutional money just shifted sides. They stopped selling and started buying. That's not retail. That's conviction.
What to do:
Enter on the first candle that closes above VWAP with above-average volume. Place your stop just below VWAP. If price comes back and closes below it — the breakout failed. Exit clean.
Target the next major resistance level. Don't be greedy.
The trap to avoid:
Price pokes above VWAP briefly but volume is weak. That's a fake breakout. Institutions aren't involved. Wait for volume confirmation every time. Without it, it's just noise.
VWAP for Reversal Strategies
Breakouts are exciting. But reversals at VWAP are often cleaner — and more predictable.
Here's why: when price moves far away from VWAP, the market is stretched. It almost always snaps back. Traders call this mean reversion. VWAP is the mean it reverts to.
The setup:
Price drops sharply below VWAP on panic selling. Then it slows down. Volume starts drying up on the downside. A small green candle forms near a support level below VWAP.
That's your reversal signal.
What to do:
Enter when price starts pushing back toward VWAP. Your target is VWAP itself — that's where the natural magnet is. Stop goes below the recent low.
The same works in reverse. Price spikes far above VWAP on hype. Volume fades. A red candle forms. Short back toward VWAP.
The key rule:
Never fade a move toward VWAP if the broader trend is strong. VWAP reversals work best in ranging or choppy markets. In a strong trend, price can stay above or below VWAP for hours. Respect the trend first.
Three Rules Every VWAP Trader Lives By
Rule 1: Volume is everything.
A VWAP cross without volume is a lie. Always check if volume confirms the move. If it doesn't — ignore it.
Rule 2: VWAP resets daily.
It's a same-day tool. Don't look at yesterday's VWAP. Each trading session starts fresh. The line you draw today only tells you about today.
Rule 3: Combine it with structure.
VWAP alone is not a strategy. It's a filter. Use it with support and resistance levels, trend direction, and market context. When VWAP aligns with a key support or resistance level — that's when the signal becomes strong.
The Bottom Line
Most retail traders ignore VWAP because it looks boring. That's exactly why it works.
Institutions use it. Algorithms use it. Market makers use it.
When you understand where the big money is anchored — and you trade in the same direction — you stop fighting the market.
You start reading it.
Not financial advice. DYOR. 🎯
#VWAP #tradingeducation #CryptoTA $ETH
VWAP: The Indicator That Separates Smart Traders From the Noise
Most traders stare at moving averages and hope for the best.Smart traders use VWAP.Here's everything you need to know — no jargon, no fluff.
What is VWAP?
VWAP stands for Volume Weighted Average Price.
It sounds complicated. It isn't.
It answers one simple question: What is the average price traders actually paid today, weighted by how much they traded at each level?
A regular moving average treats every price equally. VWAP doesn't. It gives more weight to prices where heavy volume traded. That makes it far more honest about where the market really is.
The formula looks like this:
VWAP = (Price × Volume) ÷ Total Volume
But you don't need to calculate it. Every charting platform draws it automatically. One click. It resets every day at market open.
Why does it matter?
Institutions — banks, hedge funds, pension funds — use VWAP as their benchmark. When they need to buy $500 million of Bitcoin without moving the market, they try to do it near VWAP. It proves to their clients they got a fair price.
This means VWAP is not just a line on your chart. It's where the biggest money in the market is anchored.
When price is above VWAP → buyers are in control. Institutions are paying above average. Bullish.
When price is below VWAP → sellers are in control. The market is trading below its fair value. Bearish.
Simple. Powerful.
VWAP for Breakout Strategies
This is where it gets practical.
A breakout trader looks for moments when price escapes a range and starts a new move. VWAP helps you separate real breakouts from fake ones.
The setup:
Price consolidates below VWAP for several candles. Volume is low and flat. Then suddenly — one candle closes above VWAP with a significant volume spike.
That's the signal.
Why does it work? Because price crossing VWAP with high volume means institutional money just shifted sides. They stopped selling and started buying. That's not retail. That's conviction.
What to do:
Enter on the first candle that closes above VWAP with above-average volume. Place your stop just below VWAP. If price comes back and closes below it — the breakout failed. Exit clean.
Target the next major resistance level. Don't be greedy.
The trap to avoid:
Price pokes above VWAP briefly but volume is weak. That's a fake breakout. Institutions aren't involved. Wait for volume confirmation every time. Without it, it's just noise.
VWAP for Reversal Strategies
Breakouts are exciting. But reversals at VWAP are often cleaner — and more predictable.
Here's why: when price moves far away from VWAP, the market is stretched. It almost always snaps back. Traders call this mean reversion. VWAP is the mean it reverts to.
The setup:
Price drops sharply below VWAP on panic selling. Then it slows down. Volume starts drying up on the downside. A small green candle forms near a support level below VWAP.
That's your reversal signal.
What to do:
Enter when price starts pushing back toward VWAP. Your target is VWAP itself — that's where the natural magnet is. Stop goes below the recent low.
The same works in reverse. Price spikes far above VWAP on hype. Volume fades. A red candle forms. Short back toward VWAP.
The key rule:
Never fade a move toward VWAP if the broader trend is strong. VWAP reversals work best in ranging or choppy markets. In a strong trend, price can stay above or below VWAP for hours. Respect the trend first.
Three Rules Every VWAP Trader Lives By
Rule 1: Volume is everything.
A VWAP cross without volume is a lie. Always check if volume confirms the move. If it doesn't — ignore it.
Rule 2: VWAP resets daily.
It's a same-day tool. Don't look at yesterday's VWAP. Each trading session starts fresh. The line you draw today only tells you about today.
Rule 3: Combine it with structure.
VWAP alone is not a strategy. It's a filter. Use it with support and resistance levels, trend direction, and market context. When VWAP aligns with a key support or resistance level — that's when the signal becomes strong.
The Bottom Line
Most retail traders ignore VWAP because it looks boring. That's exactly why it works.
Institutions use it. Algorithms use it. Market makers use it.
When you understand where the big money is anchored — and you trade in the same direction — you stop fighting the market.
You start reading it.
Not financial advice. DYOR. 🎯
#VWAP #tradingeducation #CryptoTA $ETH
What is VWAP?
VWAP stands for Volume Weighted Average Price.
It sounds complicated. It isn't.
It answers one simple question: What is the average price traders actually paid today, weighted by how much they traded at each level?
A regular moving average treats every price equally. VWAP doesn't. It gives more weight to prices where heavy volume traded. That makes it far more honest about where the market really is.
The formula looks like this:
VWAP = (Price × Volume) ÷ Total Volume
But you don't need to calculate it. Every charting platform draws it automatically. One click. It resets every day at market open.
Why does it matter?
Institutions — banks, hedge funds, pension funds — use VWAP as their benchmark. When they need to buy $500 million of Bitcoin without moving the market, they try to do it near VWAP. It proves to their clients they got a fair price.
This means VWAP is not just a line on your chart. It's where the biggest money in the market is anchored.
When price is above VWAP → buyers are in control. Institutions are paying above average. Bullish.
When price is below VWAP → sellers are in control. The market is trading below its fair value. Bearish.
Simple. Powerful.
VWAP for Breakout Strategies
This is where it gets practical.
A breakout trader looks for moments when price escapes a range and starts a new move. VWAP helps you separate real breakouts from fake ones.
The setup:
Price consolidates below VWAP for several candles. Volume is low and flat. Then suddenly — one candle closes above VWAP with a significant volume spike.
That's the signal.
Why does it work? Because price crossing VWAP with high volume means institutional money just shifted sides. They stopped selling and started buying. That's not retail. That's conviction.
What to do:
Enter on the first candle that closes above VWAP with above-average volume. Place your stop just below VWAP. If price comes back and closes below it — the breakout failed. Exit clean.
Target the next major resistance level. Don't be greedy.
The trap to avoid:
Price pokes above VWAP briefly but volume is weak. That's a fake breakout. Institutions aren't involved. Wait for volume confirmation every time. Without it, it's just noise.
VWAP for Reversal Strategies
Breakouts are exciting. But reversals at VWAP are often cleaner — and more predictable.
Here's why: when price moves far away from VWAP, the market is stretched. It almost always snaps back. Traders call this mean reversion. VWAP is the mean it reverts to.
The setup:
Price drops sharply below VWAP on panic selling. Then it slows down. Volume starts drying up on the downside. A small green candle forms near a support level below VWAP.
That's your reversal signal.
What to do:
Enter when price starts pushing back toward VWAP. Your target is VWAP itself — that's where the natural magnet is. Stop goes below the recent low.
The same works in reverse. Price spikes far above VWAP on hype. Volume fades. A red candle forms. Short back toward VWAP.
The key rule:
Never fade a move toward VWAP if the broader trend is strong. VWAP reversals work best in ranging or choppy markets. In a strong trend, price can stay above or below VWAP for hours. Respect the trend first.
Three Rules Every VWAP Trader Lives By
Rule 1: Volume is everything.
A VWAP cross without volume is a lie. Always check if volume confirms the move. If it doesn't — ignore it.
Rule 2: VWAP resets daily.
It's a same-day tool. Don't look at yesterday's VWAP. Each trading session starts fresh. The line you draw today only tells you about today.
Rule 3: Combine it with structure.
VWAP alone is not a strategy. It's a filter. Use it with support and resistance levels, trend direction, and market context. When VWAP aligns with a key support or resistance level — that's when the signal becomes strong.
The Bottom Line
Most retail traders ignore VWAP because it looks boring. That's exactly why it works.
Institutions use it. Algorithms use it. Market makers use it.
When you understand where the big money is anchored — and you trade in the same direction — you stop fighting the market.
You start reading it.
Not financial advice. DYOR. 🎯
#VWAP #tradingeducation #CryptoTA $ETH
2
119
·
--
Article
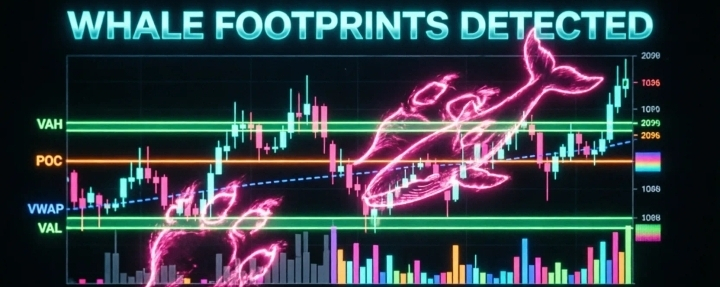
FOLLOWING THE WHALE TRACK 🐋.🐋 Detecting Institutional Footprints: The Secret 95% Ignore
Why does the price bounce at an invisible level? Why does it whip around just as you were about to enter? The answer is simple: the whales left their tracks and you didn’t see them.
Institutions move billions and can’t hide their volume. The professional trader doesn’t guess direction with basic RSI; learn to read the footprints (tracks) of smart money.
🎯 The 4 Tracks of Institutional Value
POC (Point of Control): The exact price where the most capital changed hands.
FOLLOWING THE WHALE TRACK 🐋.
🐋 Detecting Institutional Footprints: The Secret 95% Ignore
Why does the price bounce at an invisible level? Why does it whip around just as you were about to enter? The answer is simple: the whales left their tracks and you didn’t see them.
Institutions move billions and can’t hide their volume. The professional trader doesn’t guess direction with basic RSI; learn to read the footprints (tracks) of smart money.
🎯 The 4 Tracks of Institutional Value
POC (Point of Control): The exact price where the most capital changed hands.
Why does the price bounce at an invisible level? Why does it whip around just as you were about to enter? The answer is simple: the whales left their tracks and you didn’t see them.
Institutions move billions and can’t hide their volume. The professional trader doesn’t guess direction with basic RSI; learn to read the footprints (tracks) of smart money.
🎯 The 4 Tracks of Institutional Value
POC (Point of Control): The exact price where the most capital changed hands.
1
177
·
--
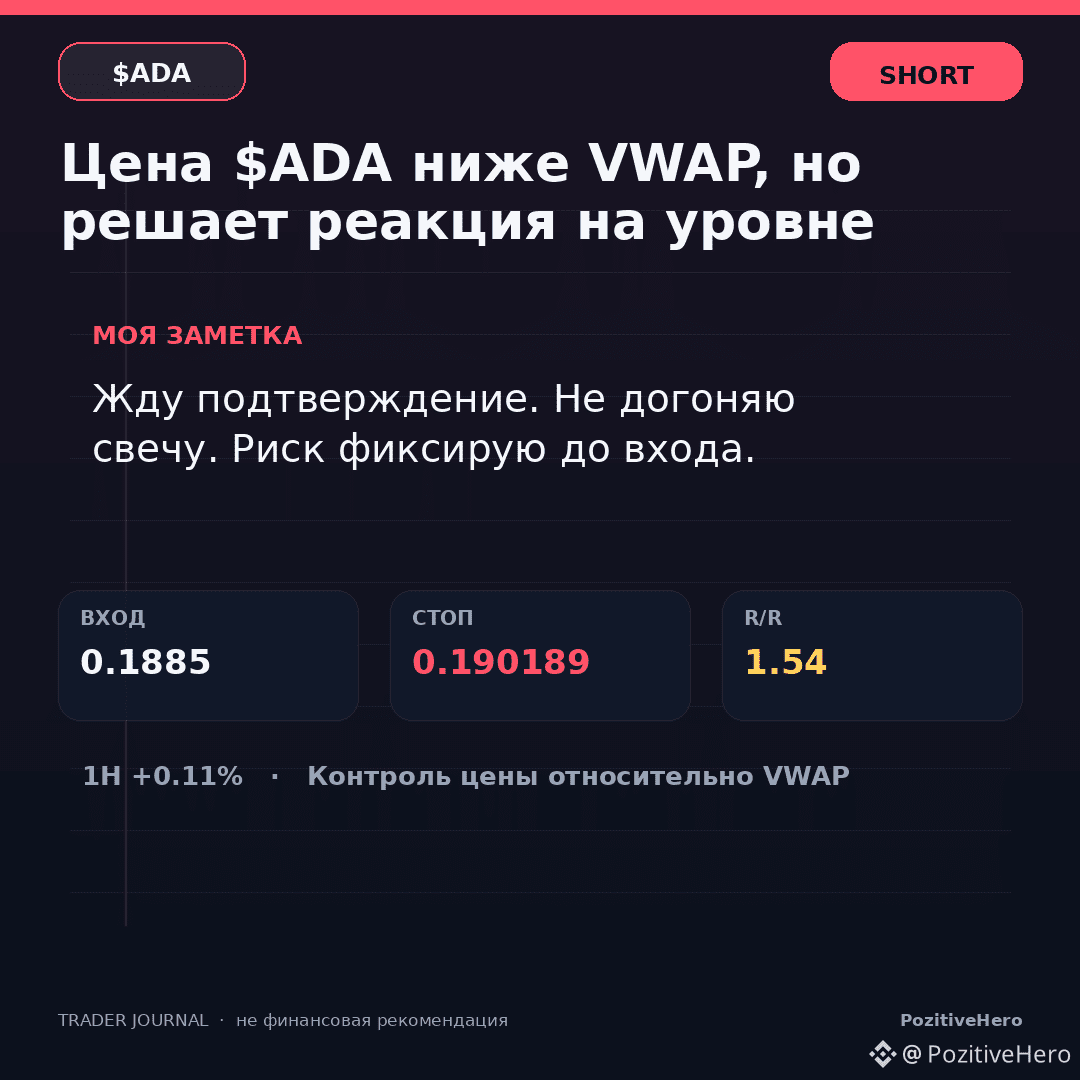
Price $ADA below the VWAP, but the market reacts at the level
What I see: SHORT direction. The position relative to the VWAP confirms one-sided market control. Higher timeframes: 2/3 align with the direction (1H in favor, 4H against, 1D in favor). Currently: 15M +0.11%, 45M -0.26%.
Journal entry. I separate direction from execution: a correct idea can still have a bad entry price.
What must happen before the trade: the price holding below 0.1859 and sellers reacting.
Decision level: 0.1859 USDT
Above/below it, the market confirms SHORT; stop scenario: 0.190189. TP1: 0.1872.
Where I admit the mistake: the mistake point is known in advance; beyond the stop I don’t defend the scenario with words.
#VWAP
Price $ADA below the VWAP, but the market reacts at the level
What I see: SHORT direction. The position relative to the VWAP confirms one-sided market control. Higher timeframes: 2/3 align with the direction (1H in favor, 4H against, 1D in favor). Currently: 15M +0.11%, 45M -0.26%.
Journal entry. I separate direction from execution: a correct idea can still have a bad entry price.
What must happen before the trade: the price holding below 0.1859 and sellers reacting.
Decision level: 0.1859 USDT
Above/below it, the market confirms SHORT; stop scenario: 0.190189. TP1: 0.1872.
Where I admit the mistake: the mistake point is known in advance; beyond the stop I don’t defend the scenario with words.
#VWAP
What I see: SHORT direction. The position relative to the VWAP confirms one-sided market control. Higher timeframes: 2/3 align with the direction (1H in favor, 4H against, 1D in favor). Currently: 15M +0.11%, 45M -0.26%.
Journal entry. I separate direction from execution: a correct idea can still have a bad entry price.
What must happen before the trade: the price holding below 0.1859 and sellers reacting.
Decision level: 0.1859 USDT
Above/below it, the market confirms SHORT; stop scenario: 0.190189. TP1: 0.1872.
Where I admit the mistake: the mistake point is known in advance; beyond the stop I don’t defend the scenario with words.
#VWAP
100

·
--
Bearish
🚨 What if the breakout you're chasing is exactly what the market wants you to see?
A price breaks above resistance. Traders jump in. Then suddenly, price reverses and closes back below the level.
The breakout was a trap. 🪤
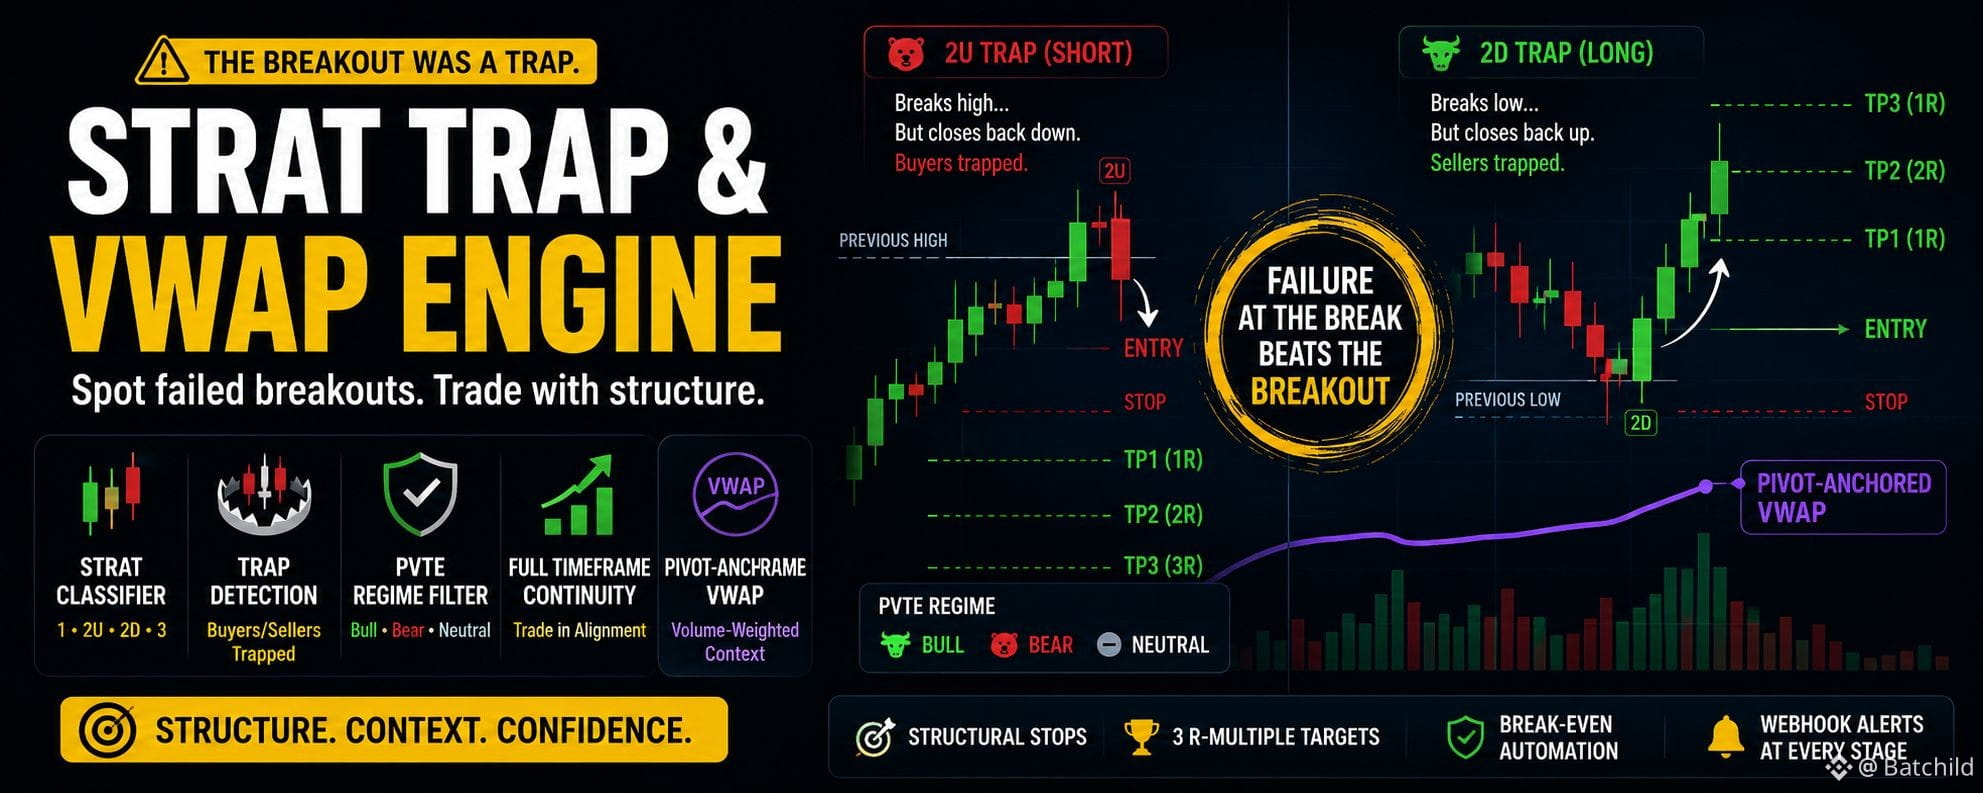
I just published a beginner-friendly breakdown of the STRAT Trap & VWAP Engine, covering:
🔹 How 2U & 2D traps work
🔹 How the system detects trapped buyers and sellers
🔹 Why market regime matters
🔹 How VWAP adds context
🔹 How higher timeframes can confirm the setup
🔹 How stops and 1R/2R/3R targets are structured
The key idea is simple:
Don't just watch the breakout. Watch what happens after it.
📖 Read the full article [here](https://app.binance.com/uni-qr/cart/355205178507505?l=en&r=BGUSO02M&uc=web_square_share_link&uco=8GXs6aAjPOl7FyH8vg0BEg&us=copylink) and learn how this framework turns failed breakouts into structured trade setups.
⚠️ Educational content only. Always manage your risk.
#Trading #CryptoTrading #VWAP #PriceAction #TechnicalAnalysis
🚨 What if the breakout you're chasing is exactly what the market wants you to see?
A price breaks above resistance. Traders jump in. Then suddenly, price reverses and closes back below the level.
The breakout was a trap. 🪤
I just published a beginner-friendly breakdown of the STRAT Trap & VWAP Engine, covering:
🔹 How 2U & 2D traps work
🔹 How the system detects trapped buyers and sellers
🔹 Why market regime matters
🔹 How VWAP adds context
🔹 How higher timeframes can confirm the setup
🔹 How stops and 1R/2R/3R targets are structured
The key idea is simple:
Don't just watch the breakout. Watch what happens after it.
📖 Read the full article here and learn how this framework turns failed breakouts into structured trade setups.
⚠️ Educational content only. Always manage your risk.
#Trading #CryptoTrading #VWAP #PriceAction #TechnicalAnalysis
A price breaks above resistance. Traders jump in. Then suddenly, price reverses and closes back below the level.
The breakout was a trap. 🪤
I just published a beginner-friendly breakdown of the STRAT Trap & VWAP Engine, covering:
🔹 How 2U & 2D traps work
🔹 How the system detects trapped buyers and sellers
🔹 Why market regime matters
🔹 How VWAP adds context
🔹 How higher timeframes can confirm the setup
🔹 How stops and 1R/2R/3R targets are structured
The key idea is simple:
Don't just watch the breakout. Watch what happens after it.
📖 Read the full article here and learn how this framework turns failed breakouts into structured trade setups.
⚠️ Educational content only. Always manage your risk.
#Trading #CryptoTrading #VWAP #PriceAction #TechnicalAnalysis
3
3
1.7k
·
--
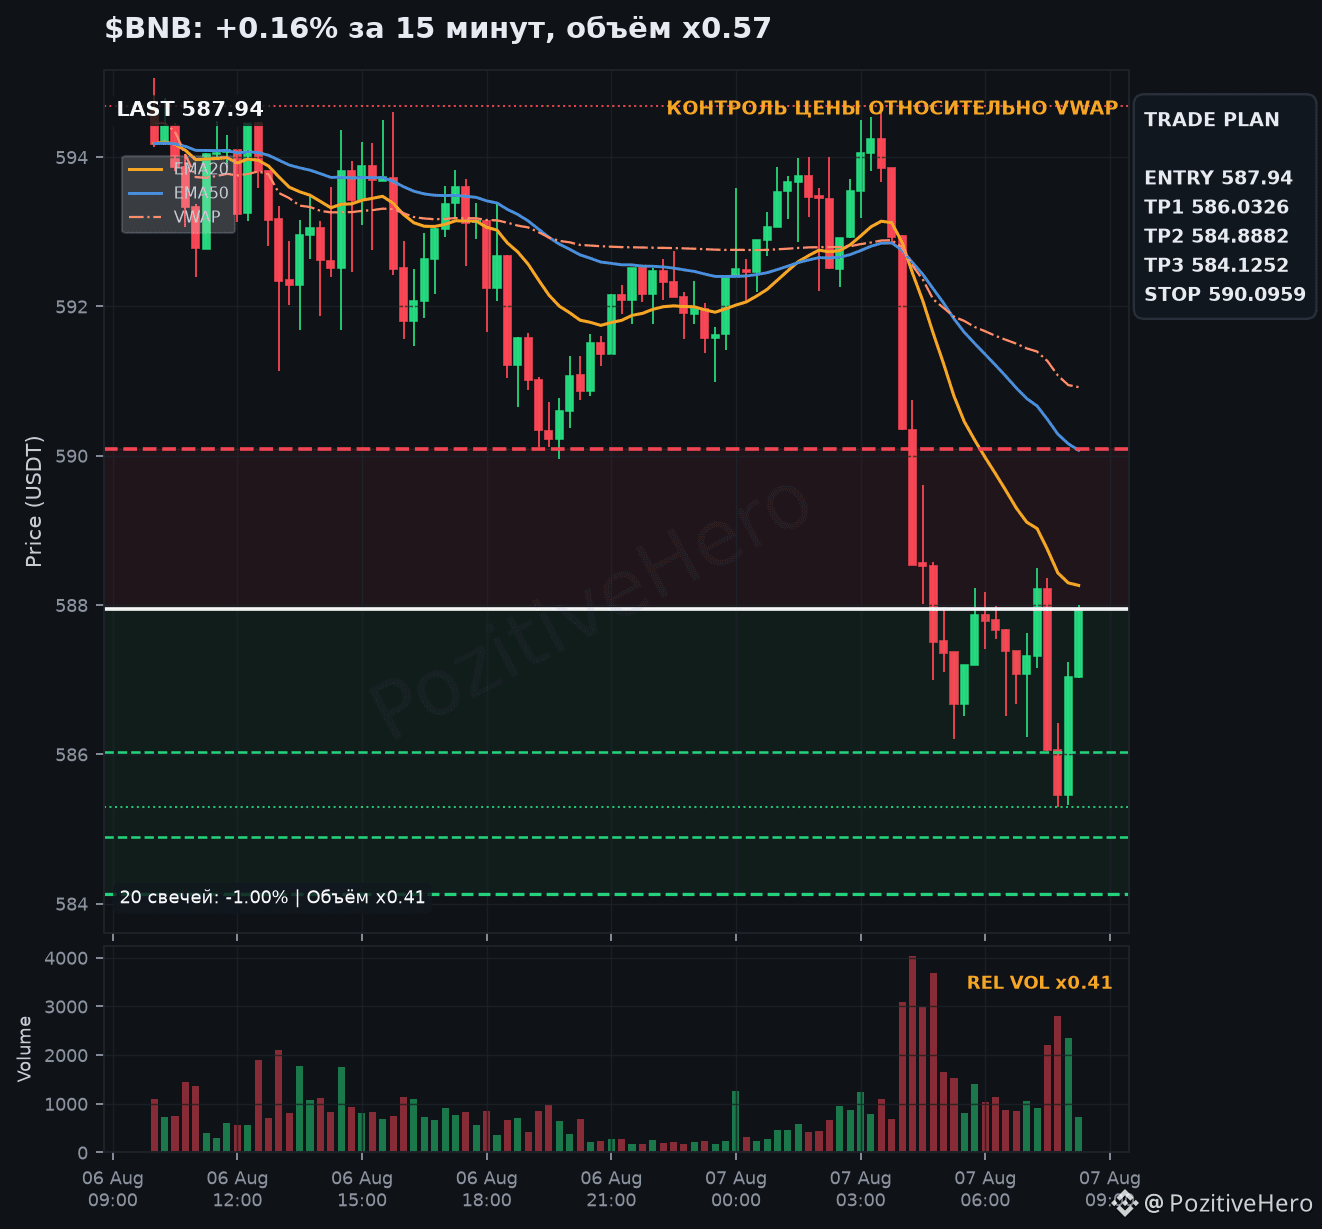
$BNB: +0.16% in 15 minutes, volume x0.57
Now: 15M +0.16%, 45M +0.32%. The volume of the last closed 15M candle is x0.57 vs the 20-candle median. Core idea: price control relative to vwap.
Direction: SHORT. Position relative to VWAP confirms control from one side of the market.
Trigger: price holding below 585.3 and a sellers’ reaction.
For me, the signal is the alignment of factors, not a single green indicator.
Price route
Entry: 587.94 USDT
Targets: 586.0326 / 584.8882 / 584.1252 USDT
R/R: 1.77
Stop-loss: 590.0959 USDT
Invalidation: Close below the stop level invalidates the idea; no averaging.
What’s more important here for the decision: the level, the volume, or the higher-timeframe context?
#VWAP
$BNB : +0.16% in 15 minutes, volume x0.57
Now: 15M +0.16%, 45M +0.32%. The volume of the last closed 15M candle is x0.57 vs the 20-candle median. Core idea: price control relative to vwap.
Direction: SHORT. Position relative to VWAP confirms control from one side of the market.
Trigger: price holding below 585.3 and a sellers’ reaction.
For me, the signal is the alignment of factors, not a single green indicator.
Price route
Entry: 587.94 USDT
Targets: 586.0326 / 584.8882 / 584.1252 USDT
R/R: 1.77
Stop-loss: 590.0959 USDT
Invalidation: Close below the stop level invalidates the idea; no averaging.
What’s more important here for the decision: the level, the volume, or the higher-timeframe context?
#VWAP
Now: 15M +0.16%, 45M +0.32%. The volume of the last closed 15M candle is x0.57 vs the 20-candle median. Core idea: price control relative to vwap.
Direction: SHORT. Position relative to VWAP confirms control from one side of the market.
Trigger: price holding below 585.3 and a sellers’ reaction.
For me, the signal is the alignment of factors, not a single green indicator.
Price route
Entry: 587.94 USDT
Targets: 586.0326 / 584.8882 / 584.1252 USDT
R/R: 1.77
Stop-loss: 590.0959 USDT
Invalidation: Close below the stop level invalidates the idea; no averaging.
What’s more important here for the decision: the level, the volume, or the higher-timeframe context?
#VWAP
25
·
--
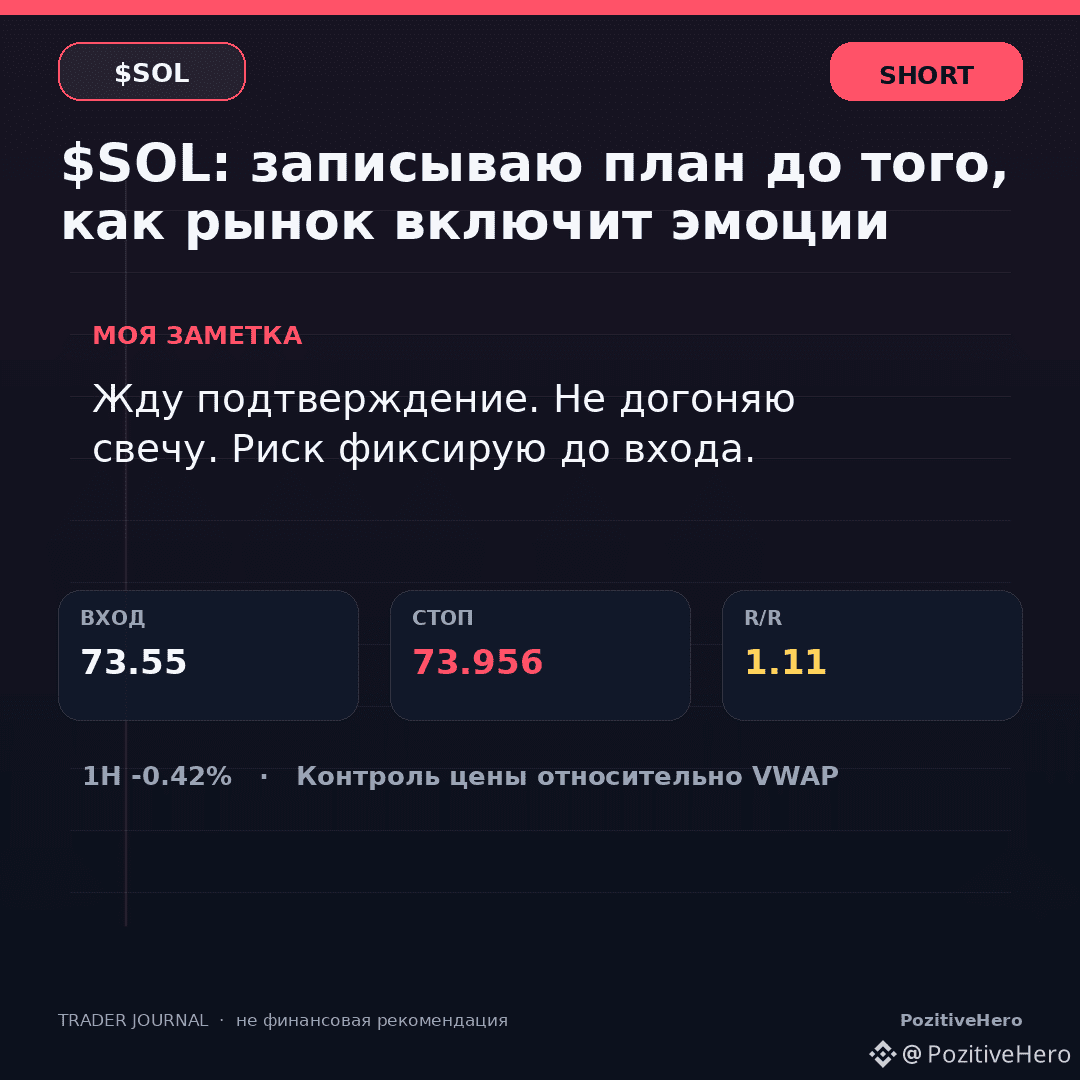
$SOL: I'm writing the plan before the market turns on emotions
Journal entry. I separate direction from execution: a good idea can have a bad entry price.
What I see: SHORT direction. The position relative to VWAP confirms control by one side of the market. Higher timeframes: 2/3 align with the direction (1H against, 4H in favor, 1D in favor). Now: 15M -0.12%, 45M -0.54%.
What should happen before the trade: price holding below 73.1 and sellers responding.
Decision level: 73.1 USDT
Above/below it the market confirms SHORT; stop scenario: 73.956. TP1: 73.325.
Where I admit the mistake: The error point is known in advance; after the stop, I don't protect the scenario with words.
#VWAP
$SOL : I'm writing the plan before the market turns on emotions
Journal entry. I separate direction from execution: a good idea can have a bad entry price.
What I see: SHORT direction. The position relative to VWAP confirms control by one side of the market. Higher timeframes: 2/3 align with the direction (1H against, 4H in favor, 1D in favor). Now: 15M -0.12%, 45M -0.54%.
What should happen before the trade: price holding below 73.1 and sellers responding.
Decision level: 73.1 USDT
Above/below it the market confirms SHORT; stop scenario: 73.956. TP1: 73.325.
Where I admit the mistake: The error point is known in advance; after the stop, I don't protect the scenario with words.
#VWAP
Journal entry. I separate direction from execution: a good idea can have a bad entry price.
What I see: SHORT direction. The position relative to VWAP confirms control by one side of the market. Higher timeframes: 2/3 align with the direction (1H against, 4H in favor, 1D in favor). Now: 15M -0.12%, 45M -0.54%.
What should happen before the trade: price holding below 73.1 and sellers responding.
Decision level: 73.1 USDT
Above/below it the market confirms SHORT; stop scenario: 73.956. TP1: 73.325.
Where I admit the mistake: The error point is known in advance; after the stop, I don't protect the scenario with words.
#VWAP
79

·
--
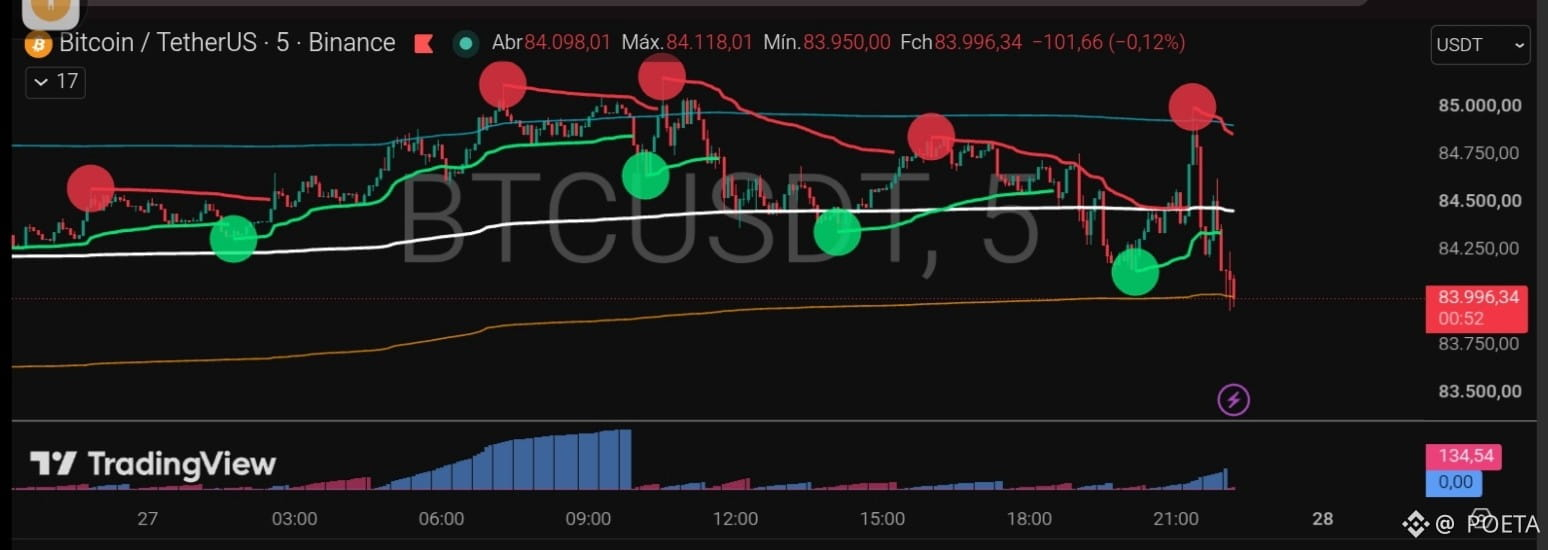
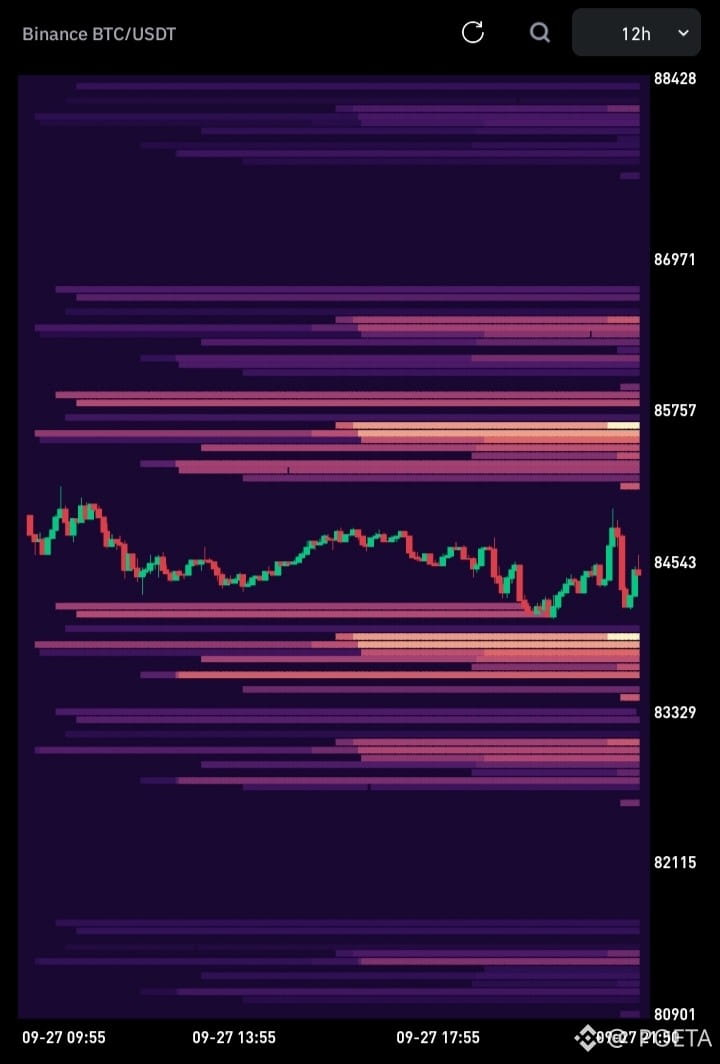
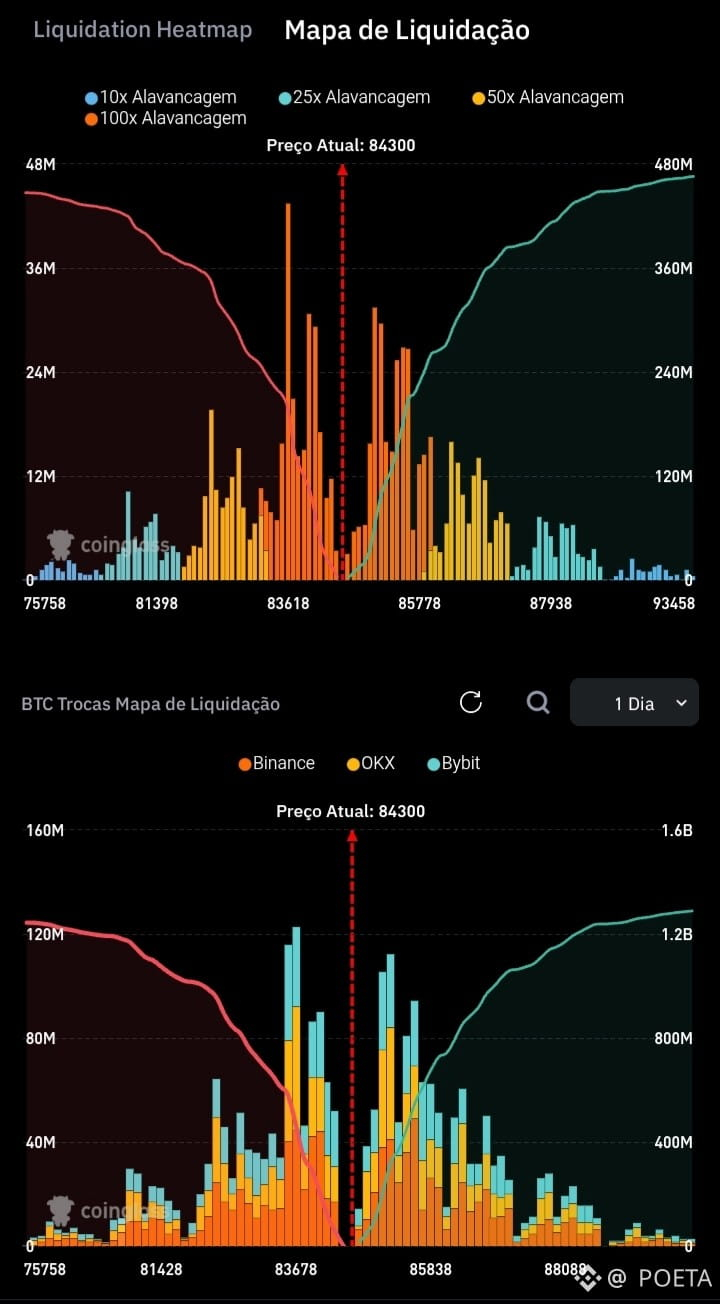
Bitcoin faces a strong rejection in the $85,000 USDT range on the 5-minute chart, being pushed toward the $83,996 USDT region.
Below the current price, there is a high concentration of liquidations from long positions between $83,600 and $83,800 USDT, acting as a strong magnet of attraction in the short term. At the same time, Binance’s order book shows a large wall of accumulated buy orders in the $83,300 to $83,800 USDT zone, positioned to absorb this drop.
The most likely move over the next few hours is an immediate search for liquidity in the $83,600–$83,800 USDT range, where the support from the buy orders should act in an attempt to trigger a rebound back to the higher resistance levels.
#btc #BTC #vwap #VWAPs #heatmap
Bitcoin faces a strong rejection in the $85,000 USDT range on the 5-minute chart, being pushed toward the $83,996 USDT region.
Below the current price, there is a high concentration of liquidations from long positions between $83,600 and $83,800 USDT, acting as a strong magnet of attraction in the short term. At the same time, Binance’s order book shows a large wall of accumulated buy orders in the $83,300 to $83,800 USDT zone, positioned to absorb this drop.
The most likely move over the next few hours is an immediate search for liquidity in the $83,600–$83,800 USDT range, where the support from the buy orders should act in an attempt to trigger a rebound back to the higher resistance levels.
#btc #BTC #vwap #VWAPs #heatmap
Below the current price, there is a high concentration of liquidations from long positions between $83,600 and $83,800 USDT, acting as a strong magnet of attraction in the short term. At the same time, Binance’s order book shows a large wall of accumulated buy orders in the $83,300 to $83,800 USDT zone, positioned to absorb this drop.
The most likely move over the next few hours is an immediate search for liquidity in the $83,600–$83,800 USDT range, where the support from the buy orders should act in an attempt to trigger a rebound back to the higher resistance levels.
#btc #BTC #vwap #VWAPs #heatmap
188

$NEAR STABILIZES VWAP AT $3.33 AS INSTITUTIONAL MILESTONE TOKENS UNLOCK 📊 🦈
NEAR Protocol structural activity highlights tight consolidation as $NEAR maintains a 3-day VWAP at $3.33. 📈 This key structural anchor fulfills the conversion threshold for 333,333 milestone tokens following Confidential Intents TVL reaching $70M.
Institutional footprint remains evident as strict privacy balance requirements absorb localized market supply. 💡 As non-transferable milestone tokens shift into tradable supply, monitoring price behavior at this $3.33 equilibrium zone is essential for assessing true demand strength. 💬 Do you expect this VWAP stabilization to drive continuous expansion, or will unlocked supply cap momentum short-term? 👇
⚠️ Not financial advice. Always manage your risk. 🛡️
🏷️ #NEAR #Crypto #ProtocolUpdate #VWAP #DeFi
🎯 🦈
$NEAR STABILIZES VWAP AT $3.33 AS INSTITUTIONAL MILESTONE TOKENS UNLOCK 📊 🦈
NEAR Protocol structural activity highlights tight consolidation as $NEAR maintains a 3-day VWAP at $3.33. 📈 This key structural anchor fulfills the conversion threshold for 333,333 milestone tokens following Confidential Intents TVL reaching $70M.
Institutional footprint remains evident as strict privacy balance requirements absorb localized market supply. 💡 As non-transferable milestone tokens shift into tradable supply, monitoring price behavior at this $3.33 equilibrium zone is essential for assessing true demand strength. 💬 Do you expect this VWAP stabilization to drive continuous expansion, or will unlocked supply cap momentum short-term? 👇
⚠️ Not financial advice. Always manage your risk. 🛡️
🏷️ #NEAR #Crypto #ProtocolUpdate #VWAP #DeFi
🎯 🦈
NEAR Protocol structural activity highlights tight consolidation as $NEAR maintains a 3-day VWAP at $3.33. 📈 This key structural anchor fulfills the conversion threshold for 333,333 milestone tokens following Confidential Intents TVL reaching $70M.
Institutional footprint remains evident as strict privacy balance requirements absorb localized market supply. 💡 As non-transferable milestone tokens shift into tradable supply, monitoring price behavior at this $3.33 equilibrium zone is essential for assessing true demand strength. 💬 Do you expect this VWAP stabilization to drive continuous expansion, or will unlocked supply cap momentum short-term? 👇
⚠️ Not financial advice. Always manage your risk. 🛡️
🏷️ #NEAR #Crypto #ProtocolUpdate #VWAP #DeFi
🎯 🦈
13

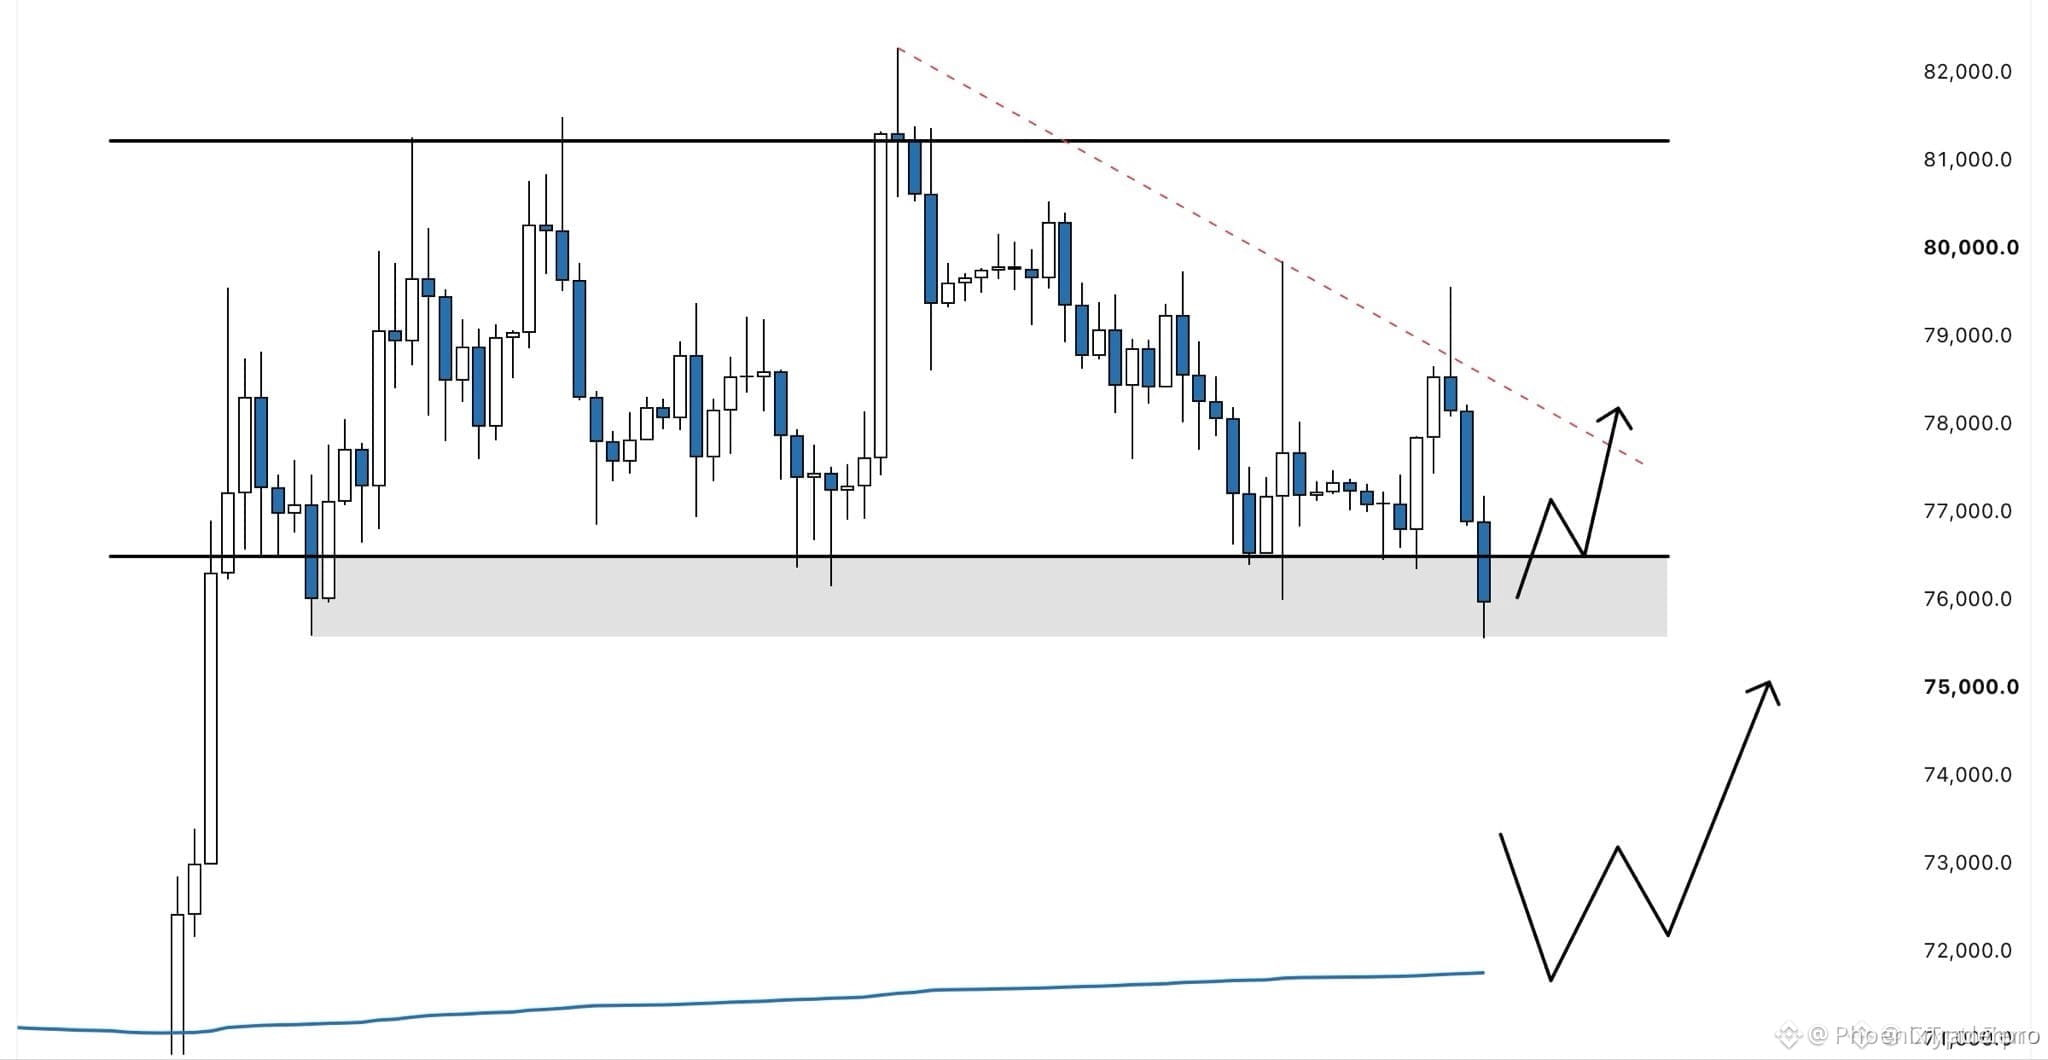
$BTC A VWAP MAGNET AT 72K IF SUPPORT BIDDERS FADE 📉
Entry: 72,000 ⚡
Target: 70,000 🎯
Price has knocked on the main support door, and $BTC needs real bid conviction to hold it. 🦈
If demand can’t absorb the sellers, the aVWAP near 72,000 becomes the gravity point, with 70,000 the deepest likely revisit. ⚠️ This is a liquidity trap or launchpad setup: strong hands can defend it, weak hands get shaken toward the mean. 📊
💬 Are you bidding the support bounce, or fading any 72K retest?
⚠️ Not financial advice. Always manage your risk. 🛡️
🏷️ #BTC #SupportTest #VWAP #Liquidity #Crypto
🐻 📉
$BTC A VWAP MAGNET AT 72K IF SUPPORT BIDDERS FADE 📉
Entry: 72,000 ⚡
Target: 70,000 🎯
Price has knocked on the main support door, and $BTC needs real bid conviction to hold it. 🦈
If demand can’t absorb the sellers, the aVWAP near 72,000 becomes the gravity point, with 70,000 the deepest likely revisit. ⚠️ This is a liquidity trap or launchpad setup: strong hands can defend it, weak hands get shaken toward the mean. 📊
💬 Are you bidding the support bounce, or fading any 72K retest?
⚠️ Not financial advice. Always manage your risk. 🛡️
🏷️ #BTC #SupportTest #VWAP #Liquidity #Crypto
🐻 📉
Entry: 72,000 ⚡
Target: 70,000 🎯
Price has knocked on the main support door, and $BTC needs real bid conviction to hold it. 🦈
If demand can’t absorb the sellers, the aVWAP near 72,000 becomes the gravity point, with 70,000 the deepest likely revisit. ⚠️ This is a liquidity trap or launchpad setup: strong hands can defend it, weak hands get shaken toward the mean. 📊
💬 Are you bidding the support bounce, or fading any 72K retest?
⚠️ Not financial advice. Always manage your risk. 🛡️
🏷️ #BTC #SupportTest #VWAP #Liquidity #Crypto
🐻 📉
13
Log in to explore more content
Join global crypto users on Binance Square
⚡️ Get latest and useful information about crypto.
💬 Trusted by the world’s largest crypto exchange.
👍 Discover real insights from verified creators.
Email / Phone number
Trending Topics
1
#GoldFallsTo$4144
0 views
0 Discussing
2
#QNTFallsOver40%FromMorningHigh
0 views
4 Discussing
3
#BitgetCEOConfirms$388MStolenInHack
0 views
0 Discussing
4
#BTCFallsBelow$83000
5,150 views
76 Discussing
5
#BitgetDetailsSecurityIncidentTimeline
948 views
83 Discussing
6
#BitcoinSpotETFs$2.39BWeeklyNetInflow
704 views
14 Discussing
7
#FedProposesPaymentStablecoinRules
21,303 views
446 Discussing
8
#ChinaMayLetAlibabaByteDanceBuyNvidiaChips
23,311 views
477 Discussing
9
#USChinaRelease$30BTariffCutProductLists
2,965 views
49 Discussing
10
#SKoreaFSCConsidersVirtualAssetMarketMaker
15,233 views
366 Discussing