

#bubblemaps
bubblemaps
5.9M views
30,768 Discussing
Hot
Latest


·
--

Article
I Tested the New Bubblemaps — Here’s What Actually ChangedI Tested the New Bubblemaps — Here’s What Actually Changed 🔍
When I receive a new tool for traders, I prefer to test it myself before talking about it.
So today I spent time exploring the revamped @bubblemaps platform and testing its new features with real tokens.
And I think the biggest change is simple:
Bubblemaps is no longer just a place where you look at bubbles. It is becoming a complete token discovery and research platform.
You can discover a token, investigate its holder structure, check wallet connections, analyze historical distribution and even swap — without leaving the platform.
Here is what I tested personally.
1. Trending & Fresh Token Discovery
I started from the new token feed.
Instead of searching for a specific project, I could browse tokens currently gaining activity and immediately see important market information such as:
Market Cap | Price | Price Change | Volume | Liquidity | Bubblemaps Score
The feed can also be filtered by blockchain and launchpad.
I tested the chain filter with BNB Chain, then combined it with the Fourmeme launchpad filter.
The platform supports many networks including Solana, Ethereum, BNB Chain, Base, Arbitrum, Polygon, Avalanche, Tron, TON and Arc, among others.
For traders hunting for new opportunities, having discovery and preliminary analysis in the same interface saves a lot of unnecessary switching between platforms.
2. Instant Bubble Map Before Opening a Token
This was one of the simplest features, but also one of my favorites.
I hovered my mouse over a token in the feed and Bubblemaps immediately displayed a miniature Bubble Map.
No need to open another page.
You can get an immediate visual impression of the holder structure before deciding whether the project deserves deeper research.
For someone scanning many projects every day, this is useful.
3. Bubblemaps Score
The feed also gives every analyzed token a Bubblemaps Score.
During my test I found projects with relatively high scores and others with significantly lower scores — for example, one token in my feed showed 58 while others were above 80.
This gives you another quick screening layer before opening the full analysis.
The score is designed to help flag potentially concerning structures such as insider clusters and bundled wallets.
I would still never make a trading decision based on one score alone — but as a first filter, it gives me another piece of information to investigate.
4. Wallet Clusters Become Immediately Visible
After opening a token, the full Bubble Map shows how major wallets are distributed and connected.
During my testing I could see separate clusters containing multiple connected addresses and the percentage of supply associated with each cluster.
I could then select individual bubbles and inspect information such as:
wallet balance, percentage of supply, transfers, wallet type and known labels.
Some addresses were automatically labeled by Bubblemaps — including exchange, liquidity and creator-related addresses.
This is where the visualization becomes much more useful than simply looking at a traditional holder list.
5. This Was Probably My Favorite Feature
I clicked an older candle on the price chart.
Bubblemaps asked whether I wanted to move the Bubble Map to that exact point in time.
I selected Yes.
And the holder map changed to the historical distribution from that moment.
That means I could compare:
What was the price doing?
with:
How was the token supply distributed at exactly that time?
I tested this again by moving to the earliest available date of another token. The difference between its initial holder structure and its current distribution was immediately visible.
For research, I find this considerably more useful than seeing only today's holder distribution.
6. Wallet Labels
Another feature I tested was wallet labeling.
Instead of showing only long blockchain addresses, Bubblemaps identified some wallets and contracts with recognizable labels.
This makes the map much easier to investigate because you can distinguish known entities from unidentified wallets.
According to Bubblemaps, wallet labels are reviewed by professional on-chain sleuths.
Of course, a label or wallet connection should not automatically be interpreted as proof of wrongdoing. It is information that can help you decide what deserves further investigation.
7. Powerful Filters
I also tested the filtering system.
You can narrow the token feed using blockchain, launchpad and additional criteria, while market columns allow you to organize projects using information such as price, volume and liquidity.
I tested combinations such as:
BNB Chain → Fourmeme → additional token filters
The feed updated immediately based on my selections.
This can be particularly useful when you don't want to search through hundreds of unrelated tokens.
8. Token Boosting Is Built Into the Platform
Bubblemaps also has its own token boosting system.
I opened it during my test.
Projects can purchase Bolts ⚡ to increase their visibility in the feed. The interface showed different Bolt packages, a 24-hour boost period and a discount when paying with $BMT .
This means discovery and project promotion are also becoming part of the same ecosystem.
9. You Can Even Swap Without Leaving Bubblemaps
Finally, I tested the integrated swap interface — without executing a transaction.
The interface allows users to Buy / Sell directly inside Bubblemaps.
I opened the transaction settings and confirmed a displayed:
Platform fee: 0.5%
The interface also provides slippage settings, transaction priority and MEV protection.
This completes the idea behind the new platform:
Find → Vet → Analyze → Buy
without having to leave Bubblemaps.
My Experience After Testing It
For me, the most interesting part of this update isn't one individual feature.
It's the fact that everything is being brought together.
Previously, a trader might discover a token on one platform, check holders somewhere else, investigate wallets with another tool and finally move to a DEX to trade it.
Bubblemaps is trying to compress that process into one workflow.
And when dealing with new or highly speculative tokens, having more information before pressing Buy matters.
No analytics platform can make a token automatically safe, and tools should never replace your own risk management.
But giving traders faster access to holder concentration, wallet relationships, historical distribution and on-chain context can help them identify risks they otherwise might never notice.
After testing the revamped platform myself, I can say that Bubblemaps has moved significantly beyond the simple bubble visualization I originally associated with it.
Discover the token.
Check the structure.
Investigate the wallets.
Compare the history.
Then make your own decision.
That is the workflow that makes sense to me.
🔍 @bubblemaps
🫧 $BMT
#Bubblemaps
{spot}(BMTUSDT)
Always DYOR.
I Tested the New Bubblemaps — Here’s What Actually Changed
I Tested the New Bubblemaps — Here’s What Actually Changed 🔍
When I receive a new tool for traders, I prefer to test it myself before talking about it.
So today I spent time exploring the revamped @Bubblemaps.io platform and testing its new features with real tokens.
And I think the biggest change is simple:
Bubblemaps is no longer just a place where you look at bubbles. It is becoming a complete token discovery and research platform.
You can discover a token, investigate its holder structure, check wallet connections, analyze historical distribution and even swap — without leaving the platform.
Here is what I tested personally.
1. Trending & Fresh Token Discovery
I started from the new token feed.
Instead of searching for a specific project, I could browse tokens currently gaining activity and immediately see important market information such as:
Market Cap | Price | Price Change | Volume | Liquidity | Bubblemaps Score
The feed can also be filtered by blockchain and launchpad.
I tested the chain filter with BNB Chain, then combined it with the Fourmeme launchpad filter.
The platform supports many networks including Solana, Ethereum, BNB Chain, Base, Arbitrum, Polygon, Avalanche, Tron, TON and Arc, among others.
For traders hunting for new opportunities, having discovery and preliminary analysis in the same interface saves a lot of unnecessary switching between platforms.
2. Instant Bubble Map Before Opening a Token
This was one of the simplest features, but also one of my favorites.
I hovered my mouse over a token in the feed and Bubblemaps immediately displayed a miniature Bubble Map.
No need to open another page.
You can get an immediate visual impression of the holder structure before deciding whether the project deserves deeper research.
For someone scanning many projects every day, this is useful.
3. Bubblemaps Score
The feed also gives every analyzed token a Bubblemaps Score.
During my test I found projects with relatively high scores and others with significantly lower scores — for example, one token in my feed showed 58 while others were above 80.
This gives you another quick screening layer before opening the full analysis.
The score is designed to help flag potentially concerning structures such as insider clusters and bundled wallets.
I would still never make a trading decision based on one score alone — but as a first filter, it gives me another piece of information to investigate.
4. Wallet Clusters Become Immediately Visible
After opening a token, the full Bubble Map shows how major wallets are distributed and connected.
During my testing I could see separate clusters containing multiple connected addresses and the percentage of supply associated with each cluster.
I could then select individual bubbles and inspect information such as:
wallet balance, percentage of supply, transfers, wallet type and known labels.
Some addresses were automatically labeled by Bubblemaps — including exchange, liquidity and creator-related addresses.
This is where the visualization becomes much more useful than simply looking at a traditional holder list.
5. This Was Probably My Favorite Feature
I clicked an older candle on the price chart.
Bubblemaps asked whether I wanted to move the Bubble Map to that exact point in time.
I selected Yes.
And the holder map changed to the historical distribution from that moment.
That means I could compare:
What was the price doing?
with:
How was the token supply distributed at exactly that time?
I tested this again by moving to the earliest available date of another token. The difference between its initial holder structure and its current distribution was immediately visible.
For research, I find this considerably more useful than seeing only today's holder distribution.
6. Wallet Labels
Another feature I tested was wallet labeling.
Instead of showing only long blockchain addresses, Bubblemaps identified some wallets and contracts with recognizable labels.
This makes the map much easier to investigate because you can distinguish known entities from unidentified wallets.
According to Bubblemaps, wallet labels are reviewed by professional on-chain sleuths.
Of course, a label or wallet connection should not automatically be interpreted as proof of wrongdoing. It is information that can help you decide what deserves further investigation.
7. Powerful Filters
I also tested the filtering system.
You can narrow the token feed using blockchain, launchpad and additional criteria, while market columns allow you to organize projects using information such as price, volume and liquidity.
I tested combinations such as:
BNB Chain → Fourmeme → additional token filters
The feed updated immediately based on my selections.
This can be particularly useful when you don't want to search through hundreds of unrelated tokens.
8. Token Boosting Is Built Into the Platform
Bubblemaps also has its own token boosting system.
I opened it during my test.
Projects can purchase Bolts ⚡ to increase their visibility in the feed. The interface showed different Bolt packages, a 24-hour boost period and a discount when paying with $BMT .
This means discovery and project promotion are also becoming part of the same ecosystem.
9. You Can Even Swap Without Leaving Bubblemaps
Finally, I tested the integrated swap interface — without executing a transaction.
The interface allows users to Buy / Sell directly inside Bubblemaps.
I opened the transaction settings and confirmed a displayed:
Platform fee: 0.5%
The interface also provides slippage settings, transaction priority and MEV protection.
This completes the idea behind the new platform:
Find → Vet → Analyze → Buy
without having to leave Bubblemaps.
My Experience After Testing It
For me, the most interesting part of this update isn't one individual feature.
It's the fact that everything is being brought together.
Previously, a trader might discover a token on one platform, check holders somewhere else, investigate wallets with another tool and finally move to a DEX to trade it.
Bubblemaps is trying to compress that process into one workflow.
And when dealing with new or highly speculative tokens, having more information before pressing Buy matters.
No analytics platform can make a token automatically safe, and tools should never replace your own risk management.
But giving traders faster access to holder concentration, wallet relationships, historical distribution and on-chain context can help them identify risks they otherwise might never notice.
After testing the revamped platform myself, I can say that Bubblemaps has moved significantly beyond the simple bubble visualization I originally associated with it.
Discover the token.
Check the structure.
Investigate the wallets.
Compare the history.
Then make your own decision.
That is the workflow that makes sense to me.
🔍 @Bubblemaps.io
🫧 $BMT
#Bubblemaps
Always DYOR.
When I receive a new tool for traders, I prefer to test it myself before talking about it.
So today I spent time exploring the revamped @Bubblemaps.io platform and testing its new features with real tokens.
And I think the biggest change is simple:
Bubblemaps is no longer just a place where you look at bubbles. It is becoming a complete token discovery and research platform.
You can discover a token, investigate its holder structure, check wallet connections, analyze historical distribution and even swap — without leaving the platform.
Here is what I tested personally.
1. Trending & Fresh Token Discovery
I started from the new token feed.
Instead of searching for a specific project, I could browse tokens currently gaining activity and immediately see important market information such as:
Market Cap | Price | Price Change | Volume | Liquidity | Bubblemaps Score
The feed can also be filtered by blockchain and launchpad.
I tested the chain filter with BNB Chain, then combined it with the Fourmeme launchpad filter.
The platform supports many networks including Solana, Ethereum, BNB Chain, Base, Arbitrum, Polygon, Avalanche, Tron, TON and Arc, among others.
For traders hunting for new opportunities, having discovery and preliminary analysis in the same interface saves a lot of unnecessary switching between platforms.
2. Instant Bubble Map Before Opening a Token
This was one of the simplest features, but also one of my favorites.
I hovered my mouse over a token in the feed and Bubblemaps immediately displayed a miniature Bubble Map.
No need to open another page.
You can get an immediate visual impression of the holder structure before deciding whether the project deserves deeper research.
For someone scanning many projects every day, this is useful.
3. Bubblemaps Score
The feed also gives every analyzed token a Bubblemaps Score.
During my test I found projects with relatively high scores and others with significantly lower scores — for example, one token in my feed showed 58 while others were above 80.
This gives you another quick screening layer before opening the full analysis.
The score is designed to help flag potentially concerning structures such as insider clusters and bundled wallets.
I would still never make a trading decision based on one score alone — but as a first filter, it gives me another piece of information to investigate.
4. Wallet Clusters Become Immediately Visible
After opening a token, the full Bubble Map shows how major wallets are distributed and connected.
During my testing I could see separate clusters containing multiple connected addresses and the percentage of supply associated with each cluster.
I could then select individual bubbles and inspect information such as:
wallet balance, percentage of supply, transfers, wallet type and known labels.
Some addresses were automatically labeled by Bubblemaps — including exchange, liquidity and creator-related addresses.
This is where the visualization becomes much more useful than simply looking at a traditional holder list.
5. This Was Probably My Favorite Feature
I clicked an older candle on the price chart.
Bubblemaps asked whether I wanted to move the Bubble Map to that exact point in time.
I selected Yes.
And the holder map changed to the historical distribution from that moment.
That means I could compare:
What was the price doing?
with:
How was the token supply distributed at exactly that time?
I tested this again by moving to the earliest available date of another token. The difference between its initial holder structure and its current distribution was immediately visible.
For research, I find this considerably more useful than seeing only today's holder distribution.
6. Wallet Labels
Another feature I tested was wallet labeling.
Instead of showing only long blockchain addresses, Bubblemaps identified some wallets and contracts with recognizable labels.
This makes the map much easier to investigate because you can distinguish known entities from unidentified wallets.
According to Bubblemaps, wallet labels are reviewed by professional on-chain sleuths.
Of course, a label or wallet connection should not automatically be interpreted as proof of wrongdoing. It is information that can help you decide what deserves further investigation.
7. Powerful Filters
I also tested the filtering system.
You can narrow the token feed using blockchain, launchpad and additional criteria, while market columns allow you to organize projects using information such as price, volume and liquidity.
I tested combinations such as:
BNB Chain → Fourmeme → additional token filters
The feed updated immediately based on my selections.
This can be particularly useful when you don't want to search through hundreds of unrelated tokens.
8. Token Boosting Is Built Into the Platform
Bubblemaps also has its own token boosting system.
I opened it during my test.
Projects can purchase Bolts ⚡ to increase their visibility in the feed. The interface showed different Bolt packages, a 24-hour boost period and a discount when paying with $BMT .
This means discovery and project promotion are also becoming part of the same ecosystem.
9. You Can Even Swap Without Leaving Bubblemaps
Finally, I tested the integrated swap interface — without executing a transaction.
The interface allows users to Buy / Sell directly inside Bubblemaps.
I opened the transaction settings and confirmed a displayed:
Platform fee: 0.5%
The interface also provides slippage settings, transaction priority and MEV protection.
This completes the idea behind the new platform:
Find → Vet → Analyze → Buy
without having to leave Bubblemaps.
My Experience After Testing It
For me, the most interesting part of this update isn't one individual feature.
It's the fact that everything is being brought together.
Previously, a trader might discover a token on one platform, check holders somewhere else, investigate wallets with another tool and finally move to a DEX to trade it.
Bubblemaps is trying to compress that process into one workflow.
And when dealing with new or highly speculative tokens, having more information before pressing Buy matters.
No analytics platform can make a token automatically safe, and tools should never replace your own risk management.
But giving traders faster access to holder concentration, wallet relationships, historical distribution and on-chain context can help them identify risks they otherwise might never notice.
After testing the revamped platform myself, I can say that Bubblemaps has moved significantly beyond the simple bubble visualization I originally associated with it.
Discover the token.
Check the structure.
Investigate the wallets.
Compare the history.
Then make your own decision.
That is the workflow that makes sense to me.
🔍 @Bubblemaps.io
🫧 $BMT
#Bubblemaps
Always DYOR.
AngelOfCrypto_-:
nice
5
2
10
20.3k

·
--
Verified
Bubblemaps V2 Makes Token Research Much More Practical
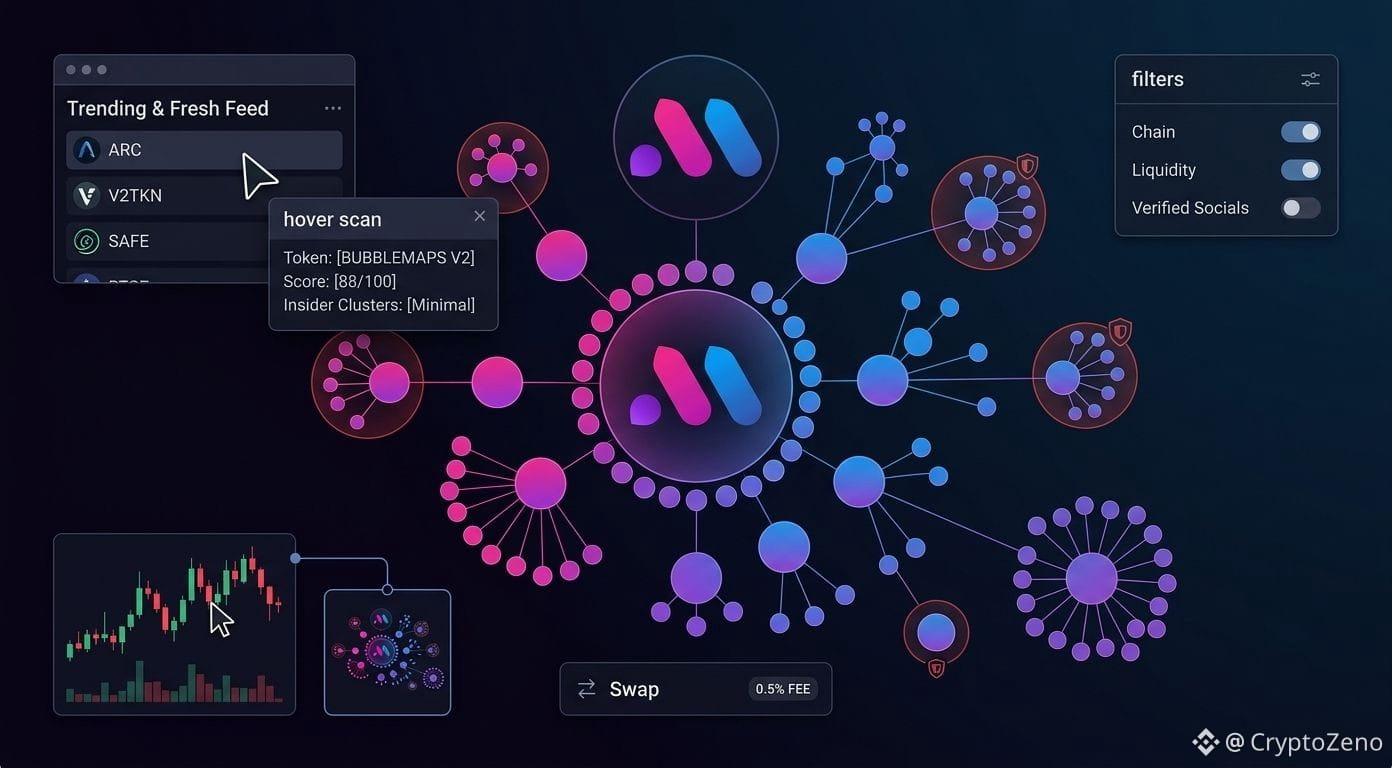
I spent some time testing the new Bubblemaps platform, and the biggest change for me is how much earlier I can check risk before making a trade. The new Trending and Fresh feed brings tokens from different chains into one place, with Arc supported from day one. Instead of finding a token first and researching it somewhere else, I can start here and filter what I actually want to explore.
The hover scan is one feature I kept coming back to. Moving over a token instantly opens its bubble map, while the Bubblemaps Score helps flag insider clusters and bundled wallets. I also tested the historical chart and liked being able to click on a specific candle to see holder distribution at that exact moment. It gives me a much clearer picture of how ownership changed over time.
I can narrow the feed by chain, launchpad, price, volume, liquidity and more, then check verified and reviewed project socials without jumping between multiple platforms. Wallet labels reviewed by professional on chain sleuths add another useful layer when I want to understand who is actually behind a cluster.
Once I find and vet a token, I can swap directly inside @bubblemaps at 0.5%, positioned as the lowest fee on the market. There is also in app token boosting, so discovery, analysis and execution are connected instead of being separate steps.
For me, this makes the trading process safer by putting the research before the purchase rather than after it. I can find a token, inspect its wallet structure, check its history, verify the project and buy without leaving the platform. After testing the new workflow myself, I can see myself using Bubblemaps as a first stop whenever I come across a new token worth researching. If you are already trading new launches, the updated platform is worth trying before making that next purchase. With $BMT sitting within the broader ecosystem.
#Bubblemaps @bubblemaps
Bubblemaps V2 Makes Token Research Much More Practical
I spent some time testing the new Bubblemaps platform, and the biggest change for me is how much earlier I can check risk before making a trade. The new Trending and Fresh feed brings tokens from different chains into one place, with Arc supported from day one. Instead of finding a token first and researching it somewhere else, I can start here and filter what I actually want to explore.
The hover scan is one feature I kept coming back to. Moving over a token instantly opens its bubble map, while the Bubblemaps Score helps flag insider clusters and bundled wallets. I also tested the historical chart and liked being able to click on a specific candle to see holder distribution at that exact moment. It gives me a much clearer picture of how ownership changed over time.
I can narrow the feed by chain, launchpad, price, volume, liquidity and more, then check verified and reviewed project socials without jumping between multiple platforms. Wallet labels reviewed by professional on chain sleuths add another useful layer when I want to understand who is actually behind a cluster.
Once I find and vet a token, I can swap directly inside @Bubblemaps.io at 0.5%, positioned as the lowest fee on the market. There is also in app token boosting, so discovery, analysis and execution are connected instead of being separate steps.
For me, this makes the trading process safer by putting the research before the purchase rather than after it. I can find a token, inspect its wallet structure, check its history, verify the project and buy without leaving the platform. After testing the new workflow myself, I can see myself using Bubblemaps as a first stop whenever I come across a new token worth researching. If you are already trading new launches, the updated platform is worth trying before making that next purchase. With $BMT sitting within the broader ecosystem.
#Bubblemaps @Bubblemaps.io
I spent some time testing the new Bubblemaps platform, and the biggest change for me is how much earlier I can check risk before making a trade. The new Trending and Fresh feed brings tokens from different chains into one place, with Arc supported from day one. Instead of finding a token first and researching it somewhere else, I can start here and filter what I actually want to explore.
The hover scan is one feature I kept coming back to. Moving over a token instantly opens its bubble map, while the Bubblemaps Score helps flag insider clusters and bundled wallets. I also tested the historical chart and liked being able to click on a specific candle to see holder distribution at that exact moment. It gives me a much clearer picture of how ownership changed over time.
I can narrow the feed by chain, launchpad, price, volume, liquidity and more, then check verified and reviewed project socials without jumping between multiple platforms. Wallet labels reviewed by professional on chain sleuths add another useful layer when I want to understand who is actually behind a cluster.
Once I find and vet a token, I can swap directly inside @Bubblemaps.io at 0.5%, positioned as the lowest fee on the market. There is also in app token boosting, so discovery, analysis and execution are connected instead of being separate steps.
For me, this makes the trading process safer by putting the research before the purchase rather than after it. I can find a token, inspect its wallet structure, check its history, verify the project and buy without leaving the platform. After testing the new workflow myself, I can see myself using Bubblemaps as a first stop whenever I come across a new token worth researching. If you are already trading new launches, the updated platform is worth trying before making that next purchase. With $BMT sitting within the broader ecosystem.
#Bubblemaps @Bubblemaps.io
Tacabase:
Hover scan đúng kiểu must-have, soi bundle với insider trước khi mua luôn. Mà phí 0.5% nghe hơi đau ví đó bro.
8
8
8.4k

The on-chain position structure is cooling things down for $BMT . Bubblemaps’ current price is about $0.01786, with roughly $5.94 million in 24-hour trading volume and a market cap of about $12.94 million. However, the fund flow signals are relatively weak: traders who recently chased the price are generally sitting on losses, and the holding addresses are concentrated in new wallets that lack historical records.
This kind of positioning typically suggests short-term speculation dominates and there is insufficient evidence of genuine long-term holding intent. If buying momentum slows, concentrated stop-losses from these new wallets could amplify price volatility. Instead of only looking at the candlestick chart, keep monitoring the share of holdings held in new wallets, changes in old addresses (net increases or decreases), and whether trading volume can effectively expand. If the price can’t reclaim and hold key levels, any rebound may be more like a de-risking window—be sure to manage your position size.
#Bubblemaps #链上数据 #加密货币
The on-chain position structure is cooling things down for $BMT . Bubblemaps’ current price is about $0.01786, with roughly $5.94 million in 24-hour trading volume and a market cap of about $12.94 million. However, the fund flow signals are relatively weak: traders who recently chased the price are generally sitting on losses, and the holding addresses are concentrated in new wallets that lack historical records.
This kind of positioning typically suggests short-term speculation dominates and there is insufficient evidence of genuine long-term holding intent. If buying momentum slows, concentrated stop-losses from these new wallets could amplify price volatility. Instead of only looking at the candlestick chart, keep monitoring the share of holdings held in new wallets, changes in old addresses (net increases or decreases), and whether trading volume can effectively expand. If the price can’t reclaim and hold key levels, any rebound may be more like a de-risking window—be sure to manage your position size.
#Bubblemaps #链上数据 #加密货币
This kind of positioning typically suggests short-term speculation dominates and there is insufficient evidence of genuine long-term holding intent. If buying momentum slows, concentrated stop-losses from these new wallets could amplify price volatility. Instead of only looking at the candlestick chart, keep monitoring the share of holdings held in new wallets, changes in old addresses (net increases or decreases), and whether trading volume can effectively expand. If the price can’t reclaim and hold key levels, any rebound may be more like a de-risking window—be sure to manage your position size.
#Bubblemaps #链上数据 #加密货币
92

·
--
The on-chain position structure is ringing a warning bell for $BMT . Bubblemaps data shows that the recently entered addresses generally lack a history of prior transactions, most of which are new wallets. Chips are concentrated among short-term speculators rather than long-term holders. At the current price of about $0.01786, the 24-hour trading volume is approximately $5.94 million, and the market cap is about $12.94 million. However, despite active turnover, the fact remains that most participants are sitting on relatively heavy unrealized losses. New wallets are taking over, but there is insufficient genuine intent to hold. Once volatility increases, selling pressure could be amplified. For short-term trading, don’t just look at trading volume—more importantly, track the movements of older wallets, the quality of newly funded addresses, and the strength of bid-side absorption. #BMT #Bubblemaps #On-chain data
The on-chain position structure is ringing a warning bell for $BMT . Bubblemaps data shows that the recently entered addresses generally lack a history of prior transactions, most of which are new wallets. Chips are concentrated among short-term speculators rather than long-term holders. At the current price of about $0.01786, the 24-hour trading volume is approximately $5.94 million, and the market cap is about $12.94 million. However, despite active turnover, the fact remains that most participants are sitting on relatively heavy unrealized losses. New wallets are taking over, but there is insufficient genuine intent to hold. Once volatility increases, selling pressure could be amplified. For short-term trading, don’t just look at trading volume—more importantly, track the movements of older wallets, the quality of newly funded addresses, and the strength of bid-side absorption. #BMT #Bubblemaps #On-chain data
71
#链上数据 Warning: Bubblemaps monitoring shows that among the primary coin-holding addresses for the LAPTOP, about 60% are new wallets that received funds within the last 10 days—most of them even receiving funds just today.
This does not automatically mean the team is unloading tokens or that it’s a “changepuffer/pirate” market, but it indicates that early holdings are highly concentrated in a set of addresses that lack historical records. Later, if those funds are synchronized into exchanges or sold in batches, price volatility may be amplified significantly.
When you see price increases and social hype, it’s recommended to verify first: the concentration of holdings, the source of funds for new wallets, contract permissions, whether liquidity is locked, and whether large batch transfers appear on-chain. You can chase a new high for the story, but position sizing and stop-loss should come before emotions.
#加密风控 #BubbleMaps
#链上数据 Warning: Bubblemaps monitoring shows that among the primary coin-holding addresses for the LAPTOP, about 60% are new wallets that received funds within the last 10 days—most of them even receiving funds just today.
This does not automatically mean the team is unloading tokens or that it’s a “changepuffer/pirate” market, but it indicates that early holdings are highly concentrated in a set of addresses that lack historical records. Later, if those funds are synchronized into exchanges or sold in batches, price volatility may be amplified significantly.
When you see price increases and social hype, it’s recommended to verify first: the concentration of holdings, the source of funds for new wallets, contract permissions, whether liquidity is locked, and whether large batch transfers appear on-chain. You can chase a new high for the story, but position sizing and stop-loss should come before emotions.
#加密风控 #BubbleMaps
This does not automatically mean the team is unloading tokens or that it’s a “changepuffer/pirate” market, but it indicates that early holdings are highly concentrated in a set of addresses that lack historical records. Later, if those funds are synchronized into exchanges or sold in batches, price volatility may be amplified significantly.
When you see price increases and social hype, it’s recommended to verify first: the concentration of holdings, the source of funds for new wallets, contract permissions, whether liquidity is locked, and whether large batch transfers appear on-chain. You can chase a new high for the story, but position sizing and stop-loss should come before emotions.
#加密风控 #BubbleMaps
19

·
--
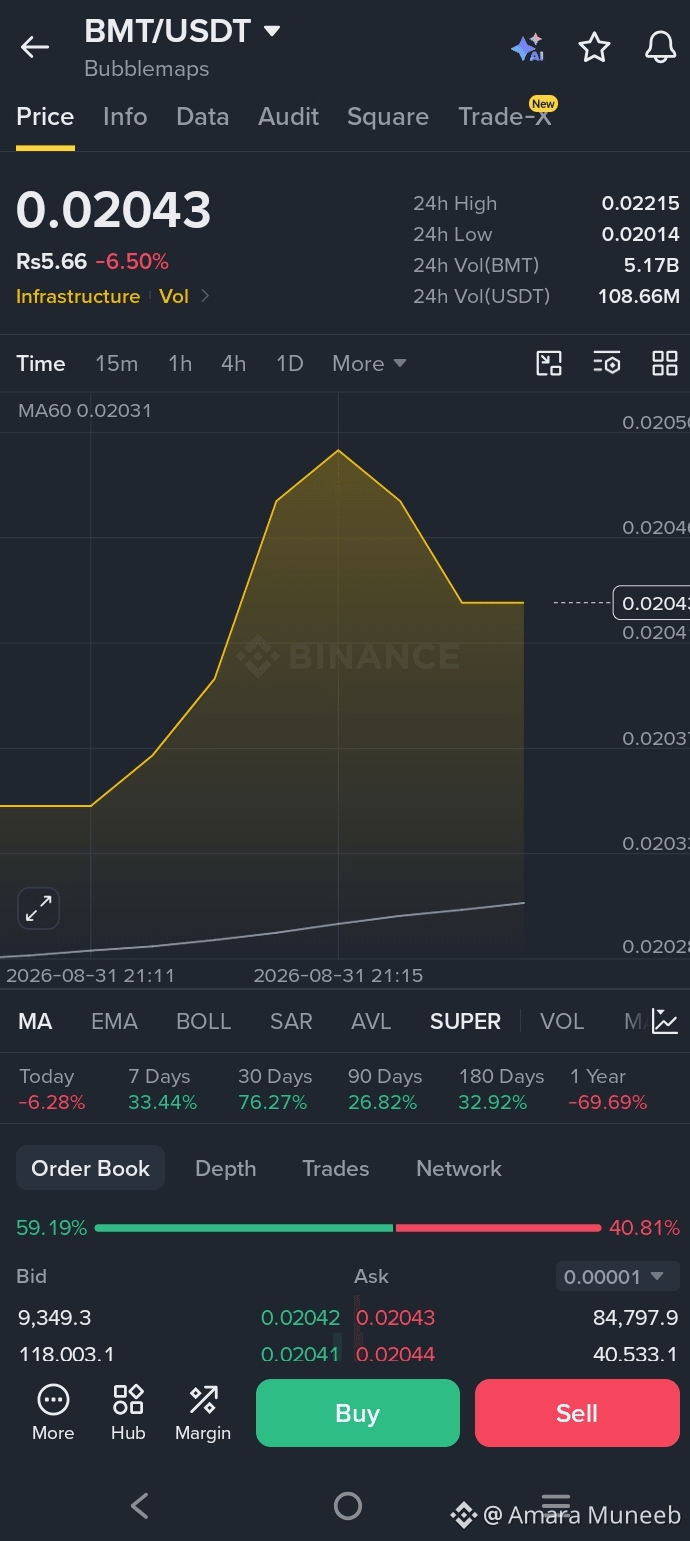
$BMT Network & Market Update: Price Action Breakdown 🚀✨
Pair: BMT/USDT 🪙
Asset Name: Bubblemaps 🌐
Current Price: 0.02043 (-6.50%) 🔴
24h High / Low: 0.02215 / 0.02014 📊
24h Volume: 5.17B BMT / 108.66M USDT 💰
Moving Average (MA60): 0.02031 📈
Network & Market Analysis 🔍
Bubblemaps (BMT/USDT) has experienced a temporary pull-back of 6.50% today, trading near $0.02043 📉. Despite short-term selling pressure, price action remains steady above its 60-period moving average (MA60 at 0.02031), showing signs of local support 🟢. Order book depth reflects strong buying interest, with Bid volume holding at 59.19% 🟢 dominating Ask volume at 40.81% 🔴. Medium to long-term performance remains robust, with a +76.27% gain over 30 days and +33.44% over the last week ⚡.
Question for the Community 💬
Will BMT hold the MA60 support and push back toward the $0.022 resistance level, or consolidate further in this zone 🤔? Share your market targets below! 👇
#BMT #Bubblemaps #Crypto #Trading #BinanceSquare #CryptoMarket
{future}(BMTUSDT)
$BMT Network & Market Update: Price Action Breakdown 🚀✨
Pair: BMT/USDT 🪙
Asset Name: Bubblemaps 🌐
Current Price: 0.02043 (-6.50%) 🔴
24h High / Low: 0.02215 / 0.02014 📊
24h Volume: 5.17B BMT / 108.66M USDT 💰
Moving Average (MA60): 0.02031 📈
Network & Market Analysis 🔍
Bubblemaps (BMT/USDT) has experienced a temporary pull-back of 6.50% today, trading near $0.02043 📉. Despite short-term selling pressure, price action remains steady above its 60-period moving average (MA60 at 0.02031), showing signs of local support 🟢. Order book depth reflects strong buying interest, with Bid volume holding at 59.19% 🟢 dominating Ask volume at 40.81% 🔴. Medium to long-term performance remains robust, with a +76.27% gain over 30 days and +33.44% over the last week ⚡.
Question for the Community 💬
Will BMT hold the MA60 support and push back toward the $0.022 resistance level, or consolidate further in this zone 🤔? Share your market targets below! 👇
#BMT #Bubblemaps #Crypto #Trading #BinanceSquare #CryptoMarket
Pair: BMT/USDT 🪙
Asset Name: Bubblemaps 🌐
Current Price: 0.02043 (-6.50%) 🔴
24h High / Low: 0.02215 / 0.02014 📊
24h Volume: 5.17B BMT / 108.66M USDT 💰
Moving Average (MA60): 0.02031 📈
Network & Market Analysis 🔍
Bubblemaps (BMT/USDT) has experienced a temporary pull-back of 6.50% today, trading near $0.02043 📉. Despite short-term selling pressure, price action remains steady above its 60-period moving average (MA60 at 0.02031), showing signs of local support 🟢. Order book depth reflects strong buying interest, with Bid volume holding at 59.19% 🟢 dominating Ask volume at 40.81% 🔴. Medium to long-term performance remains robust, with a +76.27% gain over 30 days and +33.44% over the last week ⚡.
Question for the Community 💬
Will BMT hold the MA60 support and push back toward the $0.022 resistance level, or consolidate further in this zone 🤔? Share your market targets below! 👇
#BMT #Bubblemaps #Crypto #Trading #BinanceSquare #CryptoMarket
118
·
--
BMT Contract Volume Jumps Over 55% in 24 Hours, Binance Trading Heat Rises Sharply
Friends who have been watching the charts closely lately should have noticed a move in the Bubblemaps token $BMT . In just 24 hours, its contract trading volume surged by more than 55%, quickly igniting bullish sentiment on the Binance platform.
There are several signals worth paying attention to behind this spike in volume:
First, the contract volume increase far outpaces spot trading, suggesting this round of action is mainly driven by the derivatives market. That also means the funding-versus-funding tug-of-war is stronger, and volatility is likely to be more intense.
Second, the move occurred on Binance, a major mainstream trading venue. With sufficient liquidity depth, a wider range of participants may be involved—retail traders and quantitative funds could be entering at the same time.
Third, considering Bubblemaps’ own positioning—an on-chain data visualization and token distribution tracking tool—changes in price and volume are often linked to rising community attention, new on-chain discoveries, or large holders rebalancing their positions. It’s worth monitoring on-chain data changes going forward.
A quick operational reminder: contract volume spikes are often accompanied by short-term surges, but the size of pullbacks can also exceed expectations. If you’re chasing, be sure to control your position size, set a stop-loss, and avoid blindly adding in a FOMO-driven mood.
Next, focus on two points: first, whether Binance perpetual funding rates rise in sync; and second, whether the on-chain distribution of holders for $BMT shows any new signs of large-holder concentration. These indicators can help us judge whether this rally is just a short-lived trade or the start of a longer-term move.
Explosions in on-chain “detective tool” tokens often aren’t random—stay locked on the data, and don’t let emotions lead you astray.
#BMT#Bubblemaps#altcoin
BMT Contract Volume Jumps Over 55% in 24 Hours, Binance Trading Heat Rises Sharply
Friends who have been watching the charts closely lately should have noticed a move in the Bubblemaps token $BMT . In just 24 hours, its contract trading volume surged by more than 55%, quickly igniting bullish sentiment on the Binance platform.
There are several signals worth paying attention to behind this spike in volume:
First, the contract volume increase far outpaces spot trading, suggesting this round of action is mainly driven by the derivatives market. That also means the funding-versus-funding tug-of-war is stronger, and volatility is likely to be more intense.
Second, the move occurred on Binance, a major mainstream trading venue. With sufficient liquidity depth, a wider range of participants may be involved—retail traders and quantitative funds could be entering at the same time.
Third, considering Bubblemaps’ own positioning—an on-chain data visualization and token distribution tracking tool—changes in price and volume are often linked to rising community attention, new on-chain discoveries, or large holders rebalancing their positions. It’s worth monitoring on-chain data changes going forward.
A quick operational reminder: contract volume spikes are often accompanied by short-term surges, but the size of pullbacks can also exceed expectations. If you’re chasing, be sure to control your position size, set a stop-loss, and avoid blindly adding in a FOMO-driven mood.
Next, focus on two points: first, whether Binance perpetual funding rates rise in sync; and second, whether the on-chain distribution of holders for $BMT shows any new signs of large-holder concentration. These indicators can help us judge whether this rally is just a short-lived trade or the start of a longer-term move.
Explosions in on-chain “detective tool” tokens often aren’t random—stay locked on the data, and don’t let emotions lead you astray.
#BMT#Bubblemaps#altcoin
Friends who have been watching the charts closely lately should have noticed a move in the Bubblemaps token $BMT . In just 24 hours, its contract trading volume surged by more than 55%, quickly igniting bullish sentiment on the Binance platform.
There are several signals worth paying attention to behind this spike in volume:
First, the contract volume increase far outpaces spot trading, suggesting this round of action is mainly driven by the derivatives market. That also means the funding-versus-funding tug-of-war is stronger, and volatility is likely to be more intense.
Second, the move occurred on Binance, a major mainstream trading venue. With sufficient liquidity depth, a wider range of participants may be involved—retail traders and quantitative funds could be entering at the same time.
Third, considering Bubblemaps’ own positioning—an on-chain data visualization and token distribution tracking tool—changes in price and volume are often linked to rising community attention, new on-chain discoveries, or large holders rebalancing their positions. It’s worth monitoring on-chain data changes going forward.
A quick operational reminder: contract volume spikes are often accompanied by short-term surges, but the size of pullbacks can also exceed expectations. If you’re chasing, be sure to control your position size, set a stop-loss, and avoid blindly adding in a FOMO-driven mood.
Next, focus on two points: first, whether Binance perpetual funding rates rise in sync; and second, whether the on-chain distribution of holders for $BMT shows any new signs of large-holder concentration. These indicators can help us judge whether this rally is just a short-lived trade or the start of a longer-term move.
Explosions in on-chain “detective tool” tokens often aren’t random—stay locked on the data, and don’t let emotions lead you astray.
#BMT#Bubblemaps#altcoin
12

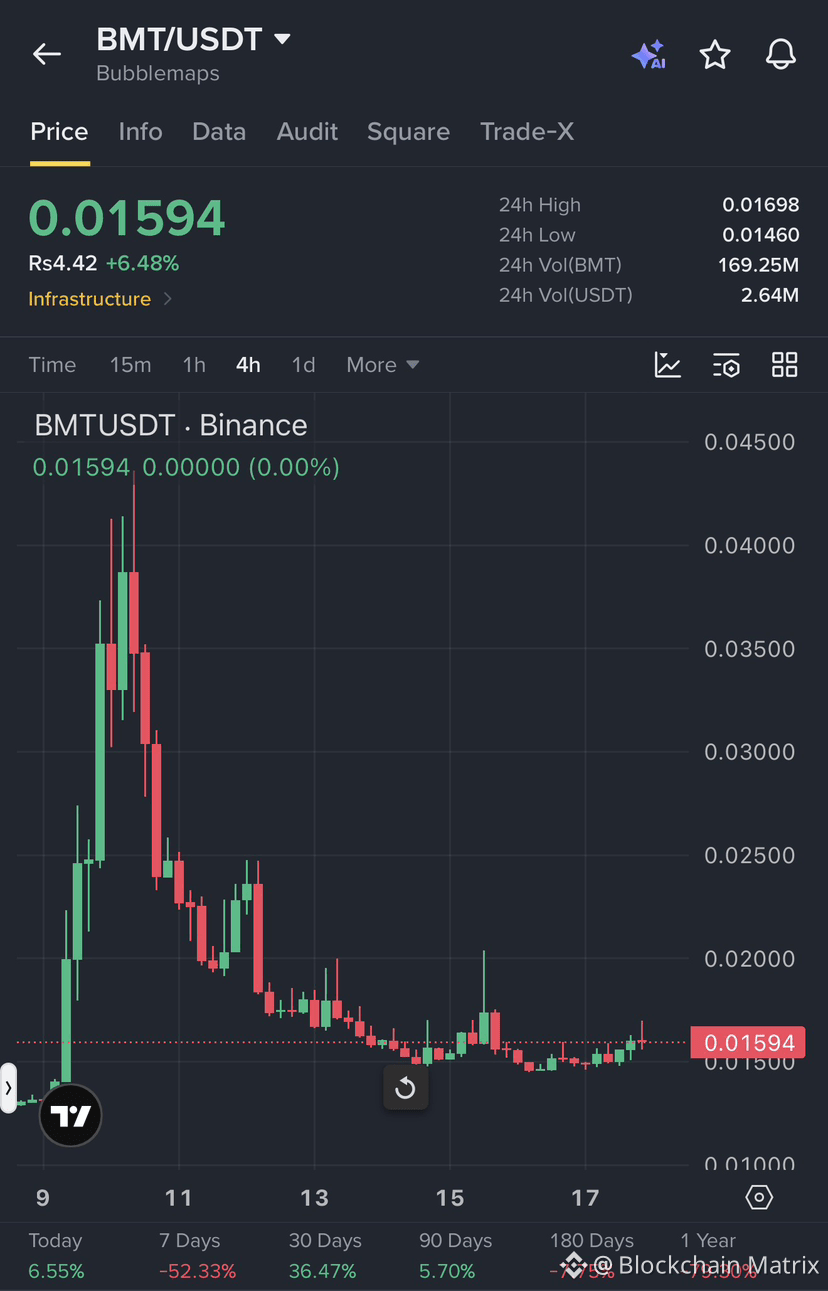
Bubblemaps: On-Chain Intelligence With a Bigger Purpose
$BMT powers Bubblemaps, an on-chain analytics platform designed to make blockchain activity easier to understand. Its visual wallet maps can reveal whale clusters, insider connections, token concentration and suspicious fund movements.
With products like Bubblemaps V2 and Intel Desk, the project is building a stronger layer of transparency for the crypto ecosystem.
At around $0.016, $BMT remains highly volatile, but its on-chain intelligence narrative makes it a project worth watching closely.
#BMT #Bubblemaps
Bubblemaps: On-Chain Intelligence With a Bigger Purpose
$BMT powers Bubblemaps, an on-chain analytics platform designed to make blockchain activity easier to understand. Its visual wallet maps can reveal whale clusters, insider connections, token concentration and suspicious fund movements.
With products like Bubblemaps V2 and Intel Desk, the project is building a stronger layer of transparency for the crypto ecosystem.
At around $0.016, $BMT remains highly volatile, but its on-chain intelligence narrative makes it a project worth watching closely.
#BMT #Bubblemaps
$BMT powers Bubblemaps, an on-chain analytics platform designed to make blockchain activity easier to understand. Its visual wallet maps can reveal whale clusters, insider connections, token concentration and suspicious fund movements.
With products like Bubblemaps V2 and Intel Desk, the project is building a stronger layer of transparency for the crypto ecosystem.
At around $0.016, $BMT remains highly volatile, but its on-chain intelligence narrative makes it a project worth watching closely.
#BMT #Bubblemaps
154

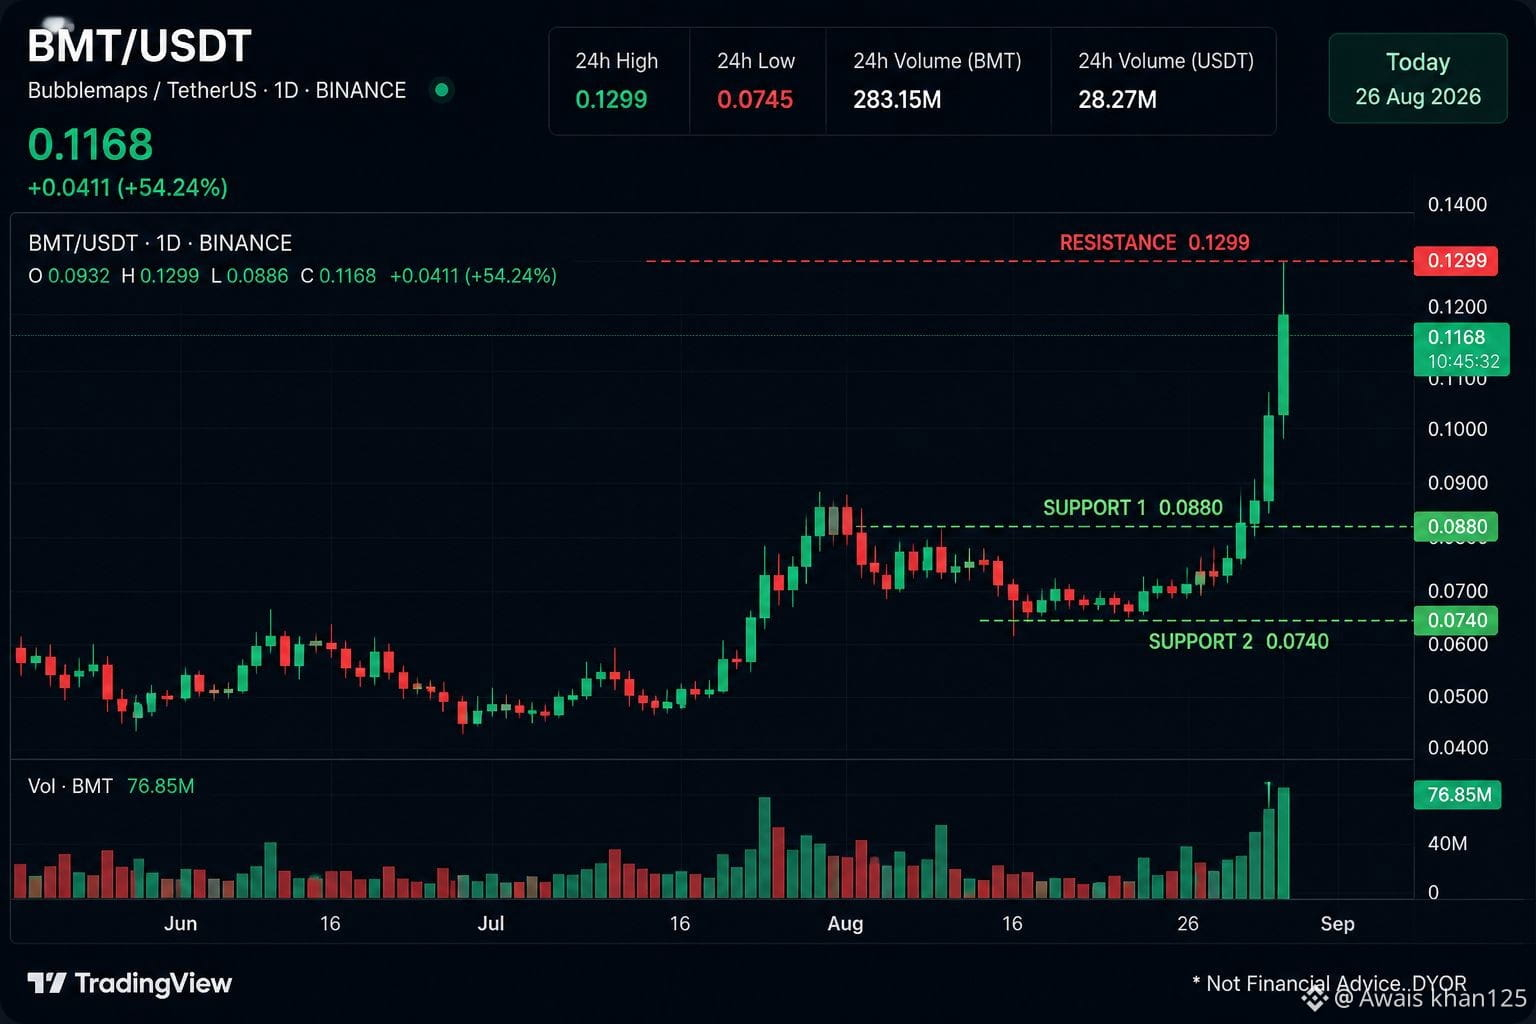
🚀 BMT/USDT Today — Strong Move! 🔥
BMT (Bubblemaps) is showing strong momentum today. 📈
The token has seen a major price move along with a huge increase in trading volume.
📊 Today’s Focus:
• Strong bullish momentum
• Heavy trading volume
• Volatility is very high
• Watch the support/resistance levels carefully
After such a sharp move, price can move quickly in either direction, so risk management is important.
DYOR — Not financial advice.
#BMT #BMTUSDT #Bubblemaps #Crypto #BinanceSquare #dyor $BMT
{future}(BMTUSDT)
🚀 BMT/USDT Today — Strong Move! 🔥
BMT (Bubblemaps) is showing strong momentum today. 📈
The token has seen a major price move along with a huge increase in trading volume.
📊 Today’s Focus:
• Strong bullish momentum
• Heavy trading volume
• Volatility is very high
• Watch the support/resistance levels carefully
After such a sharp move, price can move quickly in either direction, so risk management is important.
DYOR — Not financial advice.
#BMT #BMTUSDT #Bubblemaps #Crypto #BinanceSquare #dyor $BMT
BMT (Bubblemaps) is showing strong momentum today. 📈
The token has seen a major price move along with a huge increase in trading volume.
📊 Today’s Focus:
• Strong bullish momentum
• Heavy trading volume
• Volatility is very high
• Watch the support/resistance levels carefully
After such a sharp move, price can move quickly in either direction, so risk management is important.
DYOR — Not financial advice.
#BMT #BMTUSDT #Bubblemaps #Crypto #BinanceSquare #dyor $BMT
247

·
--
Bullish
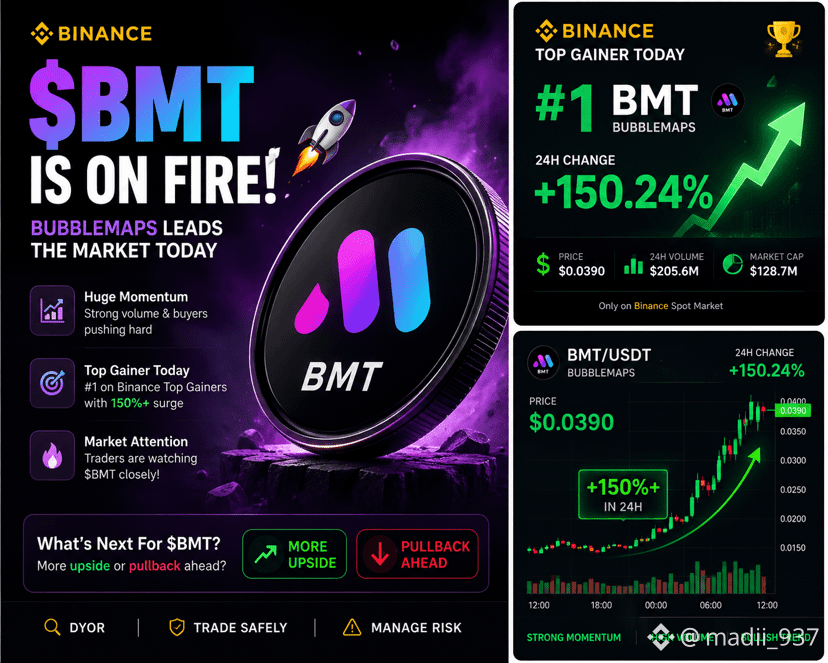
🚨 $BMT IS ON FIRE TODAY! 🔥
Bubblemaps ($BMT ) is currently leading Binance’s top gainers, with a massive ~150%#+ move in the last 24H. 📈
The interesting part? Volume and momentum are clearly picking up as traders rush toward the move.
But after such a huge pump, the big question is:
👉 Can $BMT hold these gains, or are we about to see a sharp pullback?
I’m watching:
• Volume 📊
• Support after the breakout
• Whether buyers can maintain momentum
• Any signs of profit-taking
What do you think? 👀
🚀 More upside or 🔻 correction?
#BMT #crypto #Bubblemaps #BİNANCE
🚨 $BMT IS ON FIRE TODAY! 🔥
Bubblemaps ($BMT ) is currently leading Binance’s top gainers, with a massive ~150%#+ move in the last 24H. 📈
The interesting part? Volume and momentum are clearly picking up as traders rush toward the move.
But after such a huge pump, the big question is:
👉 Can $BMT hold these gains, or are we about to see a sharp pullback?
I’m watching:
• Volume 📊
• Support after the breakout
• Whether buyers can maintain momentum
• Any signs of profit-taking
What do you think? 👀
🚀 More upside or 🔻 correction?
#BMT #crypto #Bubblemaps #BİNANCE
Bubblemaps ($BMT ) is currently leading Binance’s top gainers, with a massive ~150%#+ move in the last 24H. 📈
The interesting part? Volume and momentum are clearly picking up as traders rush toward the move.
But after such a huge pump, the big question is:
👉 Can $BMT hold these gains, or are we about to see a sharp pullback?
I’m watching:
• Volume 📊
• Support after the breakout
• Whether buyers can maintain momentum
• Any signs of profit-taking
What do you think? 👀
🚀 More upside or 🔻 correction?
#BMT #crypto #Bubblemaps #BİNANCE
104

·
--
$BMT 📊 growth analysis!
What is BMT? Bubblemaps is a platform for on-chain analytics that visualizes token holder data and their connections. BMT is a token for staking and for managing the platform.
Current situation: price $0.01910** (+24.67%), has held above all EMAs (21=0.0172, 50=0.0175, 200=0.0147) — **bullish trend**. RSI 55.5 — room for further growth. Resistance **$0.02038, support $0.0172. Volume is increasing — interest is showing up.
Conclusion: go long on a breakout above $0.02038 with a short stop-loss. Seed token — high risk.
👉 Follow for analysis!
#Bubblemaps #Trade 👇
{future}(BMTUSDT)
$BMT 📊 growth analysis!
What is BMT? Bubblemaps is a platform for on-chain analytics that visualizes token holder data and their connections. BMT is a token for staking and for managing the platform.
Current situation: price $0.01910** (+24.67%), has held above all EMAs (21=0.0172, 50=0.0175, 200=0.0147) — **bullish trend**. RSI 55.5 — room for further growth. Resistance **$0.02038, support $0.0172. Volume is increasing — interest is showing up.
Conclusion: go long on a breakout above $0.02038 with a short stop-loss. Seed token — high risk.
👉 Follow for analysis!
#Bubblemaps #Trade 👇
What is BMT? Bubblemaps is a platform for on-chain analytics that visualizes token holder data and their connections. BMT is a token for staking and for managing the platform.
Current situation: price $0.01910** (+24.67%), has held above all EMAs (21=0.0172, 50=0.0175, 200=0.0147) — **bullish trend**. RSI 55.5 — room for further growth. Resistance **$0.02038, support $0.0172. Volume is increasing — interest is showing up.
Conclusion: go long on a breakout above $0.02038 with a short stop-loss. Seed token — high risk.
👉 Follow for analysis!
#Bubblemaps #Trade 👇
1
215

·
--
#BMT contract trading volume surges more than 55% in 24 hours, triggering unusual price moves on Binance 🚀
On-chain data on Bubblemaps once again sends a clear signal. As an increasingly important on-chain visualization tool, Bubblemaps has recently continued to become a key reference for altcoin players to track the movements of major wallets and money flows.
This sudden surge in contract trading volume of $BMT , combined with a 24-hour increase of over 55%, points us to two things:
1️⃣ Leveraged funds in the derivatives market are rapidly flowing in, and the long-versus-short battle is intensifying
2️⃣ The spot market often follows with correlated effects afterward; in the short term, volatility is likely to rise further
Real-time insights from on-chain tools, together with anomalies in contract data, are often the most worth-watching "forewarning signals" before an altcoin kicks off. Before FOMO takes over, first get a clear view of the order/position structure.
⚠️ Reminder: Contract volume expansion does not equal a confirmed direction. Manage position sizing and leverage, and respond rationally to volatility.
#altcoin #Bubblemaps
#BMT contract trading volume surges more than 55% in 24 hours, triggering unusual price moves on Binance 🚀
On-chain data on Bubblemaps once again sends a clear signal. As an increasingly important on-chain visualization tool, Bubblemaps has recently continued to become a key reference for altcoin players to track the movements of major wallets and money flows.
This sudden surge in contract trading volume of $BMT , combined with a 24-hour increase of over 55%, points us to two things:
1️⃣ Leveraged funds in the derivatives market are rapidly flowing in, and the long-versus-short battle is intensifying
2️⃣ The spot market often follows with correlated effects afterward; in the short term, volatility is likely to rise further
Real-time insights from on-chain tools, together with anomalies in contract data, are often the most worth-watching "forewarning signals" before an altcoin kicks off. Before FOMO takes over, first get a clear view of the order/position structure.
⚠️ Reminder: Contract volume expansion does not equal a confirmed direction. Manage position sizing and leverage, and respond rationally to volatility.
#altcoin #Bubblemaps
On-chain data on Bubblemaps once again sends a clear signal. As an increasingly important on-chain visualization tool, Bubblemaps has recently continued to become a key reference for altcoin players to track the movements of major wallets and money flows.
This sudden surge in contract trading volume of $BMT , combined with a 24-hour increase of over 55%, points us to two things:
1️⃣ Leveraged funds in the derivatives market are rapidly flowing in, and the long-versus-short battle is intensifying
2️⃣ The spot market often follows with correlated effects afterward; in the short term, volatility is likely to rise further
Real-time insights from on-chain tools, together with anomalies in contract data, are often the most worth-watching "forewarning signals" before an altcoin kicks off. Before FOMO takes over, first get a clear view of the order/position structure.
⚠️ Reminder: Contract volume expansion does not equal a confirmed direction. Manage position sizing and leverage, and respond rationally to volatility.
#altcoin #Bubblemaps
161
·
--

Article
Bubblemaps Explodes 54%—Is This a Hidden Gem or Just Another Pump?While the broader market is catching its breath, one token is quietly stealing the show. $BMT, the native token of Bubblemaps, just pulled off a massive 54% rally in a single day, surging from a low of $0.015 to a high of $0.0275 . Currently trading around $0.0245, this DeFi analytics project is suddenly on everyone's radar. 👀
But as always, the question remains: is this a genuine breakout, or just another pump-and-dump in disguise? Let's dive in. 👇
What's Fueling the Fire? 🔥
Massive Volume Spike: The 24-hour trading volume for BMT has exploded, indicating genuine buyer interest rather than just low-liquidity manipulation . When volume confirms a price move, it's usually a sign of strength.Oversold Rebound: Before this rally, BMT had been on a brutal downtrend, dropping over 90% from its all-time high of $0.321 . When an asset gets that oversold, even a small amount of buying pressure can trigger a massive short-term bounce. The 54% gain is a classic "dead cat bounce" or the start of something bigger.Potential Catalysts: Bubblemaps is a unique DeFi analytics tool that visualizes on-chain data in an intuitive way. The project could be gaining traction as investors look for better ways to track whale movements and token distributions. There might also be upcoming exchange listings or partnerships that haven't been officially announced yet.
The Charts Are Looking Bullish 📊
Looking at the 4-hour and 15-minute charts, the technicals are turning positive:
EMA(8) on 4-Hour: The 8-period Exponential Moving Average is at $0.02182, which is well below the current price . This indicates that short-term momentum is strongly bullish.VWAP (Volume-Weighted Average Price): Currently at $0.02394, price is trading above this level . This confirms that buyers have been in control during the session.Key Resistance: The $0.0275 high is the immediate resistance to watch. If BMT can break through that with strong volume, the next stop could be $0.030 or even $0.035 .
The Fundamentals: Is There Substance? 🔍
Bubblemaps is a fascinating project that provides visual analytics for DeFi tokens. It allows users to see token distributions, identify whale wallets, and track on-chain movements in an intuitive, bubble-based interface. In a world where transparency is key, tools like Bubblemaps could become essential for both retail and institutional investors. The project has a circulating supply of 727.7 million tokens, which gives it a modest market cap that could allow for significant upside if adoption increases.
Final Takeaway 💎
A 54% rally is always exciting, but it's important to stay grounded. The key levels to watch are $0.0275 (resistance) and $0.0239 (VWAP). If BMT can break through resistance with strong volume, we could see a continuation toward $0.030. However, a pullback to test VWAP would be perfectly normal and healthy.
Are you riding this BMT pump, or waiting for a pullback? Drop your $BMT strategy below! 👇
#Bubblemaps
$BMT — Retesting Support 🚀
Bias: Bullish Preferred Entry: M15 pullback toward VWAP (0.02424) or EMA8 (0.02450) Trigger: Bullish reclaim / higher low Targets: 0.02547 / 0.02600 Invalidation: M15 close below 0.02424 (VWAP)
Why:
H4 structure is bullish with price holding above VWAP (0.02394) and well above EMA8 (0.02182).M15 is currently retesting EMA8 as support after a strong move; a clean hold here would offer a solid entry.A higher low near dynamic support would confirm buyers are stepping in.
Confirmation: Wait for a bullish M15 candle close near EMA8/VWAP to confirm the pullback is holding.
Not financial advice. DYOR and manage your risk.
Retest or rejection? 👇
#Write2Earn #BMT #TechnicalAnalysis
Bubblemaps Explodes 54%—Is This a Hidden Gem or Just Another Pump?
While the broader market is catching its breath, one token is quietly stealing the show. $BMT , the native token of Bubblemaps, just pulled off a massive 54% rally in a single day, surging from a low of $0.015 to a high of $0.0275 . Currently trading around $0.0245, this DeFi analytics project is suddenly on everyone's radar. 👀
But as always, the question remains: is this a genuine breakout, or just another pump-and-dump in disguise? Let's dive in. 👇
What's Fueling the Fire? 🔥
Massive Volume Spike: The 24-hour trading volume for BMT has exploded, indicating genuine buyer interest rather than just low-liquidity manipulation . When volume confirms a price move, it's usually a sign of strength.Oversold Rebound: Before this rally, BMT had been on a brutal downtrend, dropping over 90% from its all-time high of $0.321 . When an asset gets that oversold, even a small amount of buying pressure can trigger a massive short-term bounce. The 54% gain is a classic "dead cat bounce" or the start of something bigger.Potential Catalysts: Bubblemaps is a unique DeFi analytics tool that visualizes on-chain data in an intuitive way. The project could be gaining traction as investors look for better ways to track whale movements and token distributions. There might also be upcoming exchange listings or partnerships that haven't been officially announced yet.
The Charts Are Looking Bullish 📊
Looking at the 4-hour and 15-minute charts, the technicals are turning positive:
EMA(8) on 4-Hour: The 8-period Exponential Moving Average is at $0.02182, which is well below the current price . This indicates that short-term momentum is strongly bullish.VWAP (Volume-Weighted Average Price): Currently at $0.02394, price is trading above this level . This confirms that buyers have been in control during the session.Key Resistance: The $0.0275 high is the immediate resistance to watch. If BMT can break through that with strong volume, the next stop could be $0.030 or even $0.035 .
The Fundamentals: Is There Substance? 🔍
Bubblemaps is a fascinating project that provides visual analytics for DeFi tokens. It allows users to see token distributions, identify whale wallets, and track on-chain movements in an intuitive, bubble-based interface. In a world where transparency is key, tools like Bubblemaps could become essential for both retail and institutional investors. The project has a circulating supply of 727.7 million tokens, which gives it a modest market cap that could allow for significant upside if adoption increases.
Final Takeaway 💎
A 54% rally is always exciting, but it's important to stay grounded. The key levels to watch are $0.0275 (resistance) and $0.0239 (VWAP). If BMT can break through resistance with strong volume, we could see a continuation toward $0.030. However, a pullback to test VWAP would be perfectly normal and healthy.
Are you riding this BMT pump, or waiting for a pullback? Drop your $BMT strategy below! 👇
#Bubblemaps
$BMT — Retesting Support 🚀
Bias: Bullish Preferred Entry: M15 pullback toward VWAP (0.02424) or EMA8 (0.02450) Trigger: Bullish reclaim / higher low Targets: 0.02547 / 0.02600 Invalidation: M15 close below 0.02424 (VWAP)
Why:
H4 structure is bullish with price holding above VWAP (0.02394) and well above EMA8 (0.02182).M15 is currently retesting EMA8 as support after a strong move; a clean hold here would offer a solid entry.A higher low near dynamic support would confirm buyers are stepping in.
Confirmation: Wait for a bullish M15 candle close near EMA8/VWAP to confirm the pullback is holding.
Not financial advice. DYOR and manage your risk.
Retest or rejection? 👇
#Write2Earn #BMT #TechnicalAnalysis
But as always, the question remains: is this a genuine breakout, or just another pump-and-dump in disguise? Let's dive in. 👇
What's Fueling the Fire? 🔥
Massive Volume Spike: The 24-hour trading volume for BMT has exploded, indicating genuine buyer interest rather than just low-liquidity manipulation . When volume confirms a price move, it's usually a sign of strength.Oversold Rebound: Before this rally, BMT had been on a brutal downtrend, dropping over 90% from its all-time high of $0.321 . When an asset gets that oversold, even a small amount of buying pressure can trigger a massive short-term bounce. The 54% gain is a classic "dead cat bounce" or the start of something bigger.Potential Catalysts: Bubblemaps is a unique DeFi analytics tool that visualizes on-chain data in an intuitive way. The project could be gaining traction as investors look for better ways to track whale movements and token distributions. There might also be upcoming exchange listings or partnerships that haven't been officially announced yet.
The Charts Are Looking Bullish 📊
Looking at the 4-hour and 15-minute charts, the technicals are turning positive:
EMA(8) on 4-Hour: The 8-period Exponential Moving Average is at $0.02182, which is well below the current price . This indicates that short-term momentum is strongly bullish.VWAP (Volume-Weighted Average Price): Currently at $0.02394, price is trading above this level . This confirms that buyers have been in control during the session.Key Resistance: The $0.0275 high is the immediate resistance to watch. If BMT can break through that with strong volume, the next stop could be $0.030 or even $0.035 .
The Fundamentals: Is There Substance? 🔍
Bubblemaps is a fascinating project that provides visual analytics for DeFi tokens. It allows users to see token distributions, identify whale wallets, and track on-chain movements in an intuitive, bubble-based interface. In a world where transparency is key, tools like Bubblemaps could become essential for both retail and institutional investors. The project has a circulating supply of 727.7 million tokens, which gives it a modest market cap that could allow for significant upside if adoption increases.
Final Takeaway 💎
A 54% rally is always exciting, but it's important to stay grounded. The key levels to watch are $0.0275 (resistance) and $0.0239 (VWAP). If BMT can break through resistance with strong volume, we could see a continuation toward $0.030. However, a pullback to test VWAP would be perfectly normal and healthy.
Are you riding this BMT pump, or waiting for a pullback? Drop your $BMT strategy below! 👇
#Bubblemaps
$BMT — Retesting Support 🚀
Bias: Bullish Preferred Entry: M15 pullback toward VWAP (0.02424) or EMA8 (0.02450) Trigger: Bullish reclaim / higher low Targets: 0.02547 / 0.02600 Invalidation: M15 close below 0.02424 (VWAP)
Why:
H4 structure is bullish with price holding above VWAP (0.02394) and well above EMA8 (0.02182).M15 is currently retesting EMA8 as support after a strong move; a clean hold here would offer a solid entry.A higher low near dynamic support would confirm buyers are stepping in.
Confirmation: Wait for a bullish M15 candle close near EMA8/VWAP to confirm the pullback is holding.
Not financial advice. DYOR and manage your risk.
Retest or rejection? 👇
#Write2Earn #BMT #TechnicalAnalysis
34

·
--
Bullish
🚨 LOW-CAP GEM TO WATCH: $BMT
Bubblemaps started as a blockchain analytics platform focused on exposing wallet connections, token concentration and suspicious on-chain activity. It has since expanded into a community-driven investigation ecosystem through its Intel Desk, while also integrating with Binance Wallet.
What caught my attention is the valuation: BMT is still sitting around the $10M–$13M market-cap range, with millions in daily volume. For a project already listed on Binance, that’s interesting.
$BMT is officially on my watchlist — and I’m adding it to my bag. 👀🔥
Not financial advice. Do your own research.
{spot}(BMTUSDT)
#BMT #Bubblemaps
🚨 LOW-CAP GEM TO WATCH: $BMT
Bubblemaps started as a blockchain analytics platform focused on exposing wallet connections, token concentration and suspicious on-chain activity. It has since expanded into a community-driven investigation ecosystem through its Intel Desk, while also integrating with Binance Wallet.
What caught my attention is the valuation: BMT is still sitting around the $10M–$13M market-cap range, with millions in daily volume. For a project already listed on Binance, that’s interesting.
$BMT is officially on my watchlist — and I’m adding it to my bag. 👀🔥
Not financial advice. Do your own research.
#BMT #Bubblemaps
Bubblemaps started as a blockchain analytics platform focused on exposing wallet connections, token concentration and suspicious on-chain activity. It has since expanded into a community-driven investigation ecosystem through its Intel Desk, while also integrating with Binance Wallet.
What caught my attention is the valuation: BMT is still sitting around the $10M–$13M market-cap range, with millions in daily volume. For a project already listed on Binance, that’s interesting.
$BMT is officially on my watchlist — and I’m adding it to my bag. 👀🔥
Not financial advice. Do your own research.
#BMT #Bubblemaps
1
89

·
--
Bubblemaps ($BMT) Surges 11.44%: Here’s Why
Bubblemaps ($BMT) is making waves with an 11.44% gain over 24 hours. The surge is fueled by its innovative mapping and data visualization tools, attracting attention from tech enthusiasts and investors alike. With a massive 24-hour volume of $639.58M, $BMT is showing strong momentum. The community is buzzing, and new partnerships could be on the horizon. Traders should keep an eye on this emerging player in the decentralized tech space. 🚀🔥
Follow for more crypto setups.
#DeGenYuv #Bubblemaps
Bubblemaps ($BMT ) Surges 11.44%: Here’s Why
Bubblemaps ($BMT ) is making waves with an 11.44% gain over 24 hours. The surge is fueled by its innovative mapping and data visualization tools, attracting attention from tech enthusiasts and investors alike. With a massive 24-hour volume of $639.58M, $BMT is showing strong momentum. The community is buzzing, and new partnerships could be on the horizon. Traders should keep an eye on this emerging player in the decentralized tech space. 🚀🔥
Follow for more crypto setups.
#DeGenYuv #Bubblemaps
Bubblemaps ($BMT ) is making waves with an 11.44% gain over 24 hours. The surge is fueled by its innovative mapping and data visualization tools, attracting attention from tech enthusiasts and investors alike. With a massive 24-hour volume of $639.58M, $BMT is showing strong momentum. The community is buzzing, and new partnerships could be on the horizon. Traders should keep an eye on this emerging player in the decentralized tech space. 🚀🔥
Follow for more crypto setups.
#DeGenYuv #Bubblemaps

1
22

Bubblemaps ($BMT) has recently shown strong momentum, with its price up as much as 160.5% within 24 hours, drawing widespread market attention. There are three main driving factors behind this:
First, Binance futures open interest has expanded significantly, and increased capital participation has boosted short-term sentiment; second, an ecosystem partner has made large deposits, which the market interprets as rising expectations for a new round of collaboration or product deployment; third, the combination of a low-market-cap asset and crowded short positions has triggered a concentrated short-squeeze, pushing the price up rapidly.
As of now, the quotation is around $0.01484 at $BMT , with 24-hour trading volume near $8.97 million and a market cap of about $10.7 million. Overall, it is still in a small-cap, high-volatility stage. The short-term capital battle is clearly evident—chasing higher prices requires caution regarding pullback risks, and it’s best to view the volume surge rationally.
#Bubblemaps#BMT#On-chain data
Bubblemaps ($BMT ) has recently shown strong momentum, with its price up as much as 160.5% within 24 hours, drawing widespread market attention. There are three main driving factors behind this:
First, Binance futures open interest has expanded significantly, and increased capital participation has boosted short-term sentiment; second, an ecosystem partner has made large deposits, which the market interprets as rising expectations for a new round of collaboration or product deployment; third, the combination of a low-market-cap asset and crowded short positions has triggered a concentrated short-squeeze, pushing the price up rapidly.
As of now, the quotation is around $0.01484 at $BMT , with 24-hour trading volume near $8.97 million and a market cap of about $10.7 million. Overall, it is still in a small-cap, high-volatility stage. The short-term capital battle is clearly evident—chasing higher prices requires caution regarding pullback risks, and it’s best to view the volume surge rationally.
#Bubblemaps#BMT#On-chain data
First, Binance futures open interest has expanded significantly, and increased capital participation has boosted short-term sentiment; second, an ecosystem partner has made large deposits, which the market interprets as rising expectations for a new round of collaboration or product deployment; third, the combination of a low-market-cap asset and crowded short positions has triggered a concentrated short-squeeze, pushing the price up rapidly.
As of now, the quotation is around $0.01484 at $BMT , with 24-hour trading volume near $8.97 million and a market cap of about $10.7 million. Overall, it is still in a small-cap, high-volatility stage. The short-term capital battle is clearly evident—chasing higher prices requires caution regarding pullback risks, and it’s best to view the volume surge rationally.
#Bubblemaps#BMT#On-chain data
75
$BMT 24 hours sees a 160.5% surge! Short-drama market action for a small-cap pick—played out to the fullest.
Low market cap + large on-chain top-ups + contract capital flowing in: three forces working at the same time directly pushed Bubblemaps to the front ranks of the gainers. Trading volume in the past 24 hours reached $55.61 million, with a market cap of about $13.57 million. With a size like this, such violent fluctuations are not unexpected.
From a trading perspective, this looks more like a classic short-term breakout driven by concentrated capital inflows. The on-chain data and derivatives data resonate together, and within an extremely short time the market is amplified by capital choosing it. Whether the momentum can be sustained afterward still depends on the follow-on capital’s intentions.
Note: Crypto assets are highly volatile, and there is a higher risk during sudden spike rallies. Don’t chase the price up; make sure to control your position size.
#Bubblemaps #BMT #On-chain data
$BMT 24 hours sees a 160.5% surge! Short-drama market action for a small-cap pick—played out to the fullest.
Low market cap + large on-chain top-ups + contract capital flowing in: three forces working at the same time directly pushed Bubblemaps to the front ranks of the gainers. Trading volume in the past 24 hours reached $55.61 million, with a market cap of about $13.57 million. With a size like this, such violent fluctuations are not unexpected.
From a trading perspective, this looks more like a classic short-term breakout driven by concentrated capital inflows. The on-chain data and derivatives data resonate together, and within an extremely short time the market is amplified by capital choosing it. Whether the momentum can be sustained afterward still depends on the follow-on capital’s intentions.
Note: Crypto assets are highly volatile, and there is a higher risk during sudden spike rallies. Don’t chase the price up; make sure to control your position size.
#Bubblemaps #BMT #On-chain data
Low market cap + large on-chain top-ups + contract capital flowing in: three forces working at the same time directly pushed Bubblemaps to the front ranks of the gainers. Trading volume in the past 24 hours reached $55.61 million, with a market cap of about $13.57 million. With a size like this, such violent fluctuations are not unexpected.
From a trading perspective, this looks more like a classic short-term breakout driven by concentrated capital inflows. The on-chain data and derivatives data resonate together, and within an extremely short time the market is amplified by capital choosing it. Whether the momentum can be sustained afterward still depends on the follow-on capital’s intentions.
Note: Crypto assets are highly volatile, and there is a higher risk during sudden spike rallies. Don’t chase the price up; make sure to control your position size.
#Bubblemaps #BMT #On-chain data
92

$BMT Holds +72% Gain! Retest Consolidation Setting Up For $0.02789 Breakout?
Maintaining huge top-gainer strength with a solid +72.30% gain, $BMT (Bubblemaps) is forming a classic high-volume continuation pattern! Massive trading activity has pushed 24h volume to 1.41B BMT ($31.79M USDT) on Binance. After tapping a high of 0.02789, price action retested the 0.02061 floor and is now cleanly consolidating around 0.02619.
Trade Bias: Bullish Continuation
Entry Zone: 0.02480 – 0.02580 (Accumulate long positions as price holds the dynamic 15m support floor)
Targets: 0.02789 ➡️ 0.03100 ➡️ 0.03500
Stop Loss: Below 0.02380
Technically, the pullbacks are getting heavily absorbed by buyers. Parabolic SAR trailing dots at 0.02449 confirm strong upward trend support under candles, while RSI (6) has cooled to a healthy 62.50, providing ample room for the next leg up. A clean break above 0.02789 will unlock explosive upside expansion.
Are you accumulating at this retest consolidation... or waiting for a confirmed breakout above 0.02789?
Trade Now $BMT
{spot}(BMTUSDT)
#BMT #Bubblemaps #cryptosignals
$BMT Holds +72% Gain! Retest Consolidation Setting Up For $0.02789 Breakout?
Maintaining huge top-gainer strength with a solid +72.30% gain, $BMT (Bubblemaps) is forming a classic high-volume continuation pattern! Massive trading activity has pushed 24h volume to 1.41B BMT ($31.79M USDT) on Binance. After tapping a high of 0.02789, price action retested the 0.02061 floor and is now cleanly consolidating around 0.02619.
Trade Bias: Bullish Continuation
Entry Zone: 0.02480 – 0.02580 (Accumulate long positions as price holds the dynamic 15m support floor)
Targets: 0.02789 ➡️ 0.03100 ➡️ 0.03500
Stop Loss: Below 0.02380
Technically, the pullbacks are getting heavily absorbed by buyers. Parabolic SAR trailing dots at 0.02449 confirm strong upward trend support under candles, while RSI (6) has cooled to a healthy 62.50, providing ample room for the next leg up. A clean break above 0.02789 will unlock explosive upside expansion.
Are you accumulating at this retest consolidation... or waiting for a confirmed breakout above 0.02789?
Trade Now $BMT
#BMT #Bubblemaps #cryptosignals
Maintaining huge top-gainer strength with a solid +72.30% gain, $BMT (Bubblemaps) is forming a classic high-volume continuation pattern! Massive trading activity has pushed 24h volume to 1.41B BMT ($31.79M USDT) on Binance. After tapping a high of 0.02789, price action retested the 0.02061 floor and is now cleanly consolidating around 0.02619.
Trade Bias: Bullish Continuation
Entry Zone: 0.02480 – 0.02580 (Accumulate long positions as price holds the dynamic 15m support floor)
Targets: 0.02789 ➡️ 0.03100 ➡️ 0.03500
Stop Loss: Below 0.02380
Technically, the pullbacks are getting heavily absorbed by buyers. Parabolic SAR trailing dots at 0.02449 confirm strong upward trend support under candles, while RSI (6) has cooled to a healthy 62.50, providing ample room for the next leg up. A clean break above 0.02789 will unlock explosive upside expansion.
Are you accumulating at this retest consolidation... or waiting for a confirmed breakout above 0.02789?
Trade Now $BMT
#BMT #Bubblemaps #cryptosignals
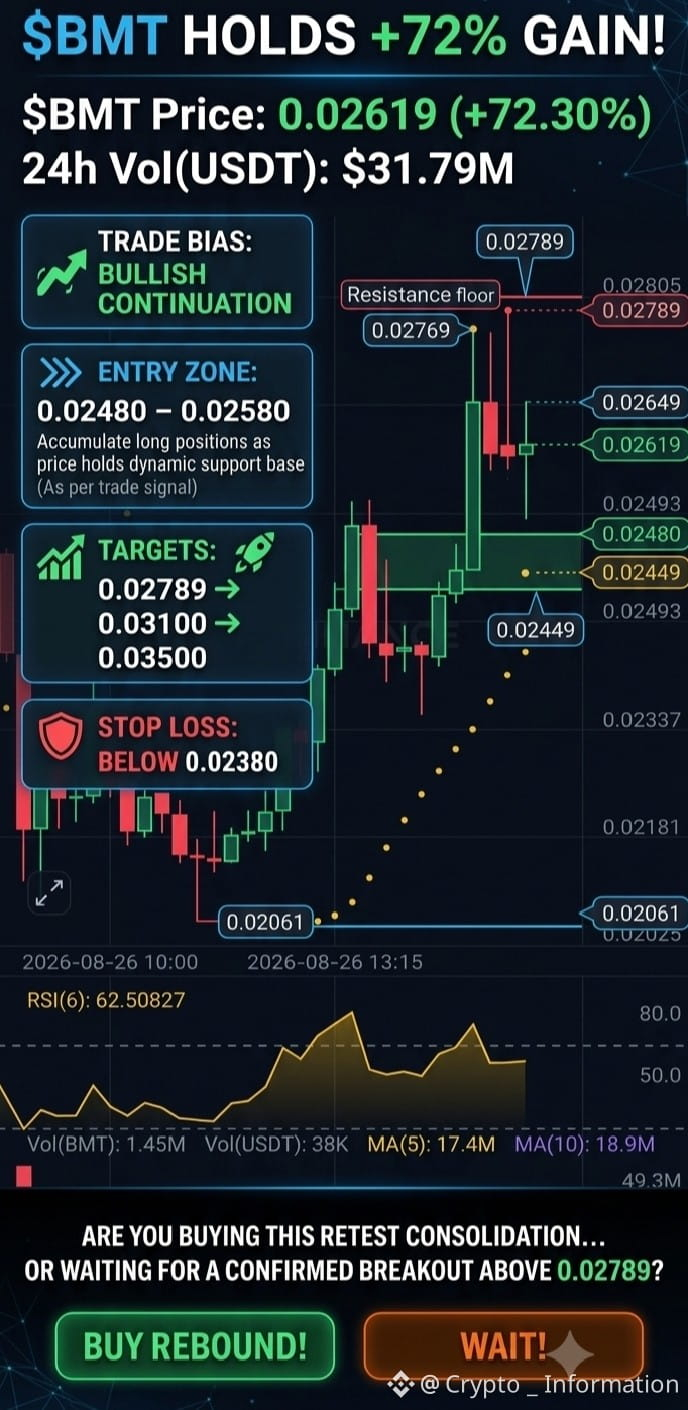
1
93

$BMT (Bubblemaps) Analysis
Bubblemaps is an on-chain analytics platform that turns complex wallet relationships and token flows into simple, interactive bubble visualizations. It helps spot insider clusters, whale moves, and potential risks across multiple chains (Solana, BNB Chain, Ethereum, and others).
Currently as of Aug 26, 2026:
Price hovering around $0.024–0.027
Strong 24h move: +50–80% on massive volume spike
30-day performance: roughly +100%+
Still ~92% below its March 2025 ATH near $0.32
Market cap in the low-to-mid teens of millions, with very high volume/MCap turnover
Why the attention?
Recent catalysts include the Upbit listing (boosting liquidity and Korean retail interest) plus ongoing product use. The platform has real utility: limited free daily checks, paid advanced queries and APIs in BMT, community bounties via Intel Desk, and institutional risk-screening services. Part of usage fees flows back to stakers, and some revenue supports buybacks/burns.
Bullish angles
Actual product usage (not pure narrative) Cross-chain expansion and integrations High relative volume showing speculative + genuine interest
Risks to watch
High concentration in top wallets Ongoing unlocks/vesting can create sell pressure Extreme short-term volatility (typical for low-cap high-turnover names) Needs sustained volume and product adoption to hold gains
Bottom line
$BMT is a pure utility play in the on-chain intelligence niche. The recent pump is momentum-driven, but the underlying tool solves a real problem for traders and researchers. Treat it as high-risk/high-reward — size accordingly and watch key supports near previous lows if momentum fades.
Not financial advice. Do Your Own Research.
#BMTArmy #Bubblemaps #CryptoAnalysis
{spot}(BMTUSDT)
$BMT (Bubblemaps) Analysis
Bubblemaps is an on-chain analytics platform that turns complex wallet relationships and token flows into simple, interactive bubble visualizations. It helps spot insider clusters, whale moves, and potential risks across multiple chains (Solana, BNB Chain, Ethereum, and others).
Currently as of Aug 26, 2026:
Price hovering around $0.024–0.027
Strong 24h move: +50–80% on massive volume spike
30-day performance: roughly +100%+
Still ~92% below its March 2025 ATH near $0.32
Market cap in the low-to-mid teens of millions, with very high volume/MCap turnover
Why the attention?
Recent catalysts include the Upbit listing (boosting liquidity and Korean retail interest) plus ongoing product use. The platform has real utility: limited free daily checks, paid advanced queries and APIs in BMT, community bounties via Intel Desk, and institutional risk-screening services. Part of usage fees flows back to stakers, and some revenue supports buybacks/burns.
Bullish angles
Actual product usage (not pure narrative) Cross-chain expansion and integrations High relative volume showing speculative + genuine interest
Risks to watch
High concentration in top wallets Ongoing unlocks/vesting can create sell pressure Extreme short-term volatility (typical for low-cap high-turnover names) Needs sustained volume and product adoption to hold gains
Bottom line
$BMT is a pure utility play in the on-chain intelligence niche. The recent pump is momentum-driven, but the underlying tool solves a real problem for traders and researchers. Treat it as high-risk/high-reward — size accordingly and watch key supports near previous lows if momentum fades.
Not financial advice. Do Your Own Research.
#BMTArmy #Bubblemaps #CryptoAnalysis
Bubblemaps is an on-chain analytics platform that turns complex wallet relationships and token flows into simple, interactive bubble visualizations. It helps spot insider clusters, whale moves, and potential risks across multiple chains (Solana, BNB Chain, Ethereum, and others).
Currently as of Aug 26, 2026:
Price hovering around $0.024–0.027
Strong 24h move: +50–80% on massive volume spike
30-day performance: roughly +100%+
Still ~92% below its March 2025 ATH near $0.32
Market cap in the low-to-mid teens of millions, with very high volume/MCap turnover
Why the attention?
Recent catalysts include the Upbit listing (boosting liquidity and Korean retail interest) plus ongoing product use. The platform has real utility: limited free daily checks, paid advanced queries and APIs in BMT, community bounties via Intel Desk, and institutional risk-screening services. Part of usage fees flows back to stakers, and some revenue supports buybacks/burns.
Bullish angles
Actual product usage (not pure narrative) Cross-chain expansion and integrations High relative volume showing speculative + genuine interest
Risks to watch
High concentration in top wallets Ongoing unlocks/vesting can create sell pressure Extreme short-term volatility (typical for low-cap high-turnover names) Needs sustained volume and product adoption to hold gains
Bottom line
$BMT is a pure utility play in the on-chain intelligence niche. The recent pump is momentum-driven, but the underlying tool solves a real problem for traders and researchers. Treat it as high-risk/high-reward — size accordingly and watch key supports near previous lows if momentum fades.
Not financial advice. Do Your Own Research.
#BMTArmy #Bubblemaps #CryptoAnalysis
84

·
--
$BMT (Bubblemaps) has grown noticeably today.
The price is currently around $0.024–0.027, and the token has added more than 50–60% over the past day. Volumes have also surged sharply.
Bubblemaps is a tool that visualizes on-chain data. It shows holder “bubbles,” wallet clusters, and helps you quickly understand how the token or NFT’s supply is distributed. In general, it’s a handy thing for people who like digging into charts and wallets.
Right now, the move looks more speculative—strong volume inflows and increased interest on social media. Whether it will hold will become clear from the volumes over the next few days.
#BMT #Bubblemaps
$BMT (Bubblemaps) has grown noticeably today.
The price is currently around $0.024–0.027, and the token has added more than 50–60% over the past day. Volumes have also surged sharply.
Bubblemaps is a tool that visualizes on-chain data. It shows holder “bubbles,” wallet clusters, and helps you quickly understand how the token or NFT’s supply is distributed. In general, it’s a handy thing for people who like digging into charts and wallets.
Right now, the move looks more speculative—strong volume inflows and increased interest on social media. Whether it will hold will become clear from the volumes over the next few days.
#BMT #Bubblemaps
The price is currently around $0.024–0.027, and the token has added more than 50–60% over the past day. Volumes have also surged sharply.
Bubblemaps is a tool that visualizes on-chain data. It shows holder “bubbles,” wallet clusters, and helps you quickly understand how the token or NFT’s supply is distributed. In general, it’s a handy thing for people who like digging into charts and wallets.
Right now, the move looks more speculative—strong volume inflows and increased interest on social media. Whether it will hold will become clear from the volumes over the next few days.
#BMT #Bubblemaps
535
Log in to explore more content
Join global crypto users on Binance Square
⚡️ Get latest and useful information about crypto.
💬 Trusted by the world’s largest crypto exchange.
👍 Discover real insights from verified creators.
Email / Phone number
Trending Topics
1
#BitcoinClears$85200
396 views
64 Discussing
2
#AltcoinSeasonIndexHoldsAbove60For5Days
5,374 views
391 Discussing
3
#USADPAdds90000JobsInSeptember
1,073 views
184 Discussing
4
#USCorePCEEasesTo3%InAugust
1,066 views
162 Discussing
5
#KospiPostsWorstQuarterSince2020
2,002 views
217 Discussing
6
#SECToClarifyOnChainFundraisingRules
7,712 views
385 Discussing
7
#UKFCAOpensCryptoFirmAuthorization
11,255 views
360 Discussing
8
#JapanMOFStudyGroupOnTokenizedGovtBonds
9,727 views
305 Discussing
9
#QNTRises287%
49,296 views
695 Discussing
10
#TrumpRejectsAIRulesForVoluntaryAudits
32,958 views
615 Discussing