
Sadaf shahbaz
2.7k Posts

Sadaf shahbaz
Report
Block User
Crypto Trader & Market Analyst | Daily market insights, price action & smart money concepts | Education over hype
Open Trade

XRP Holder
Occasional Trader
2.1 Years
25 Following
406 Followers
2.6K+ Liked
Posts
Portfolio
All
Quotes
·
--
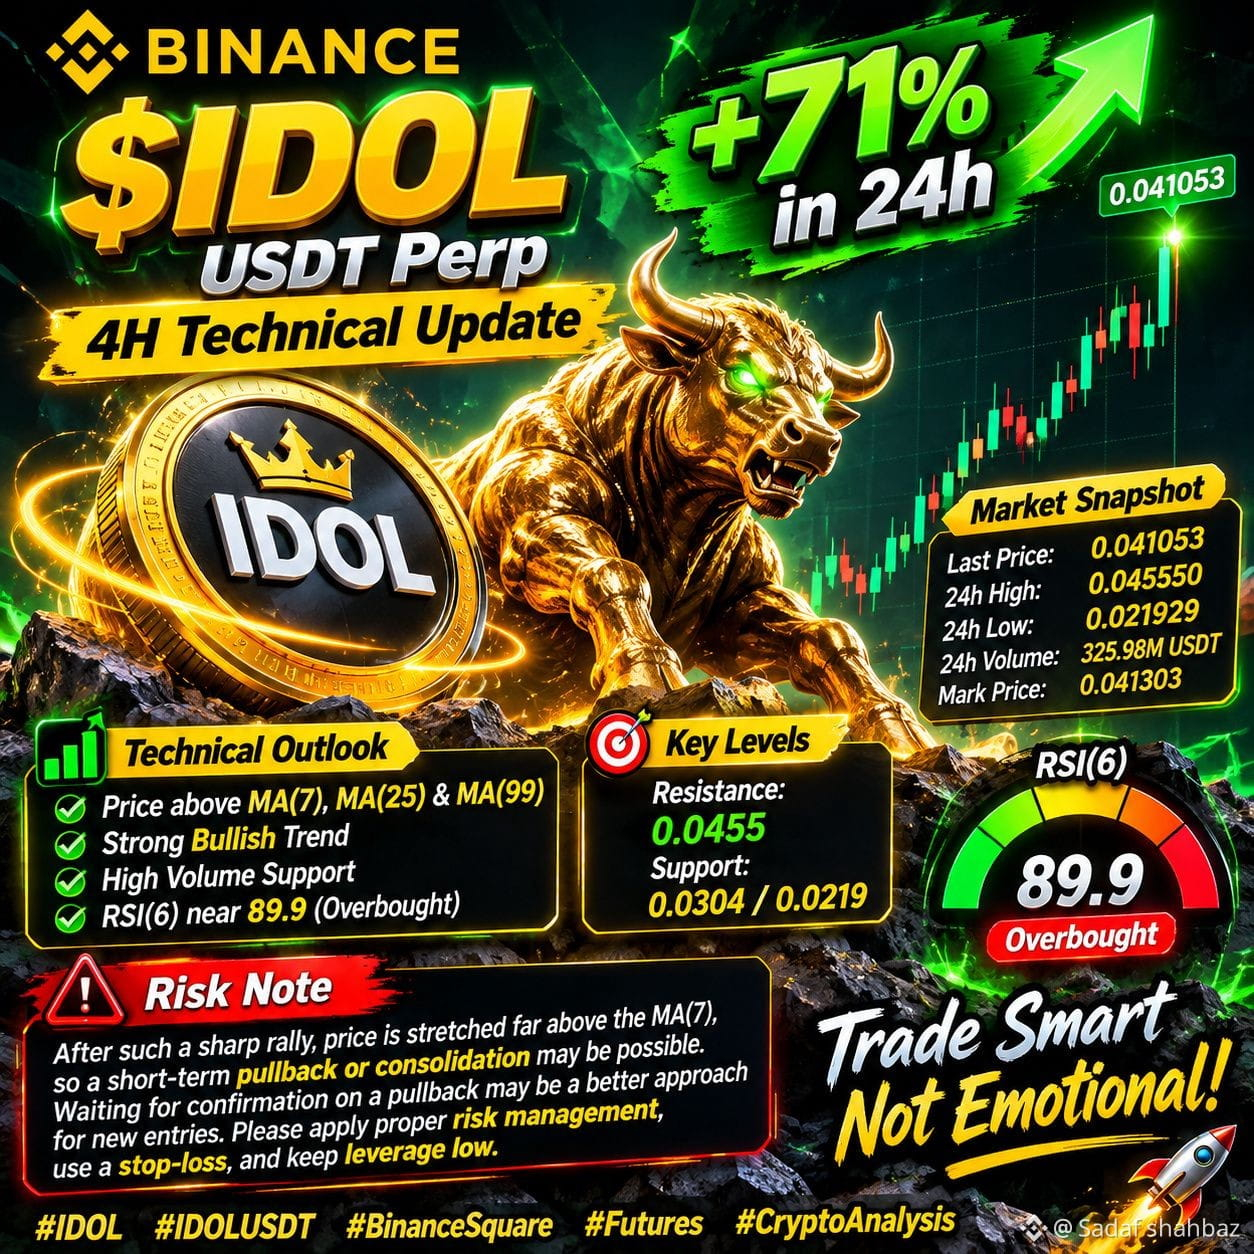
$IDOL USDT Perp | 4H Technical Update
IDOL has delivered a strong breakout after a prolonged consolidation phase. Price is trading at 0.0410, up roughly 71% in the last 24 hours.
Market Snapshot
• Last Price: 0.041053
• 24h High / Low: 0.045550 / 0.021929
• 24h Volume: 325.98M USDT
• Mark Price: 0.041303
Technical Outlook
• Price is trading above the MA(7), MA(25) and MA(99), signaling a strong bullish trend
• A notable surge in volume supports the breakout
• RSI(6) is near 89.9, placing the market firmly in overbought territory
Key Levels
• Resistance: 0.0455
• Support: 0.0304 / 0.0219
Risk Note
After such a sharp rally, price is stretched far above the MA(7), so a short-term pullback or consolidation is possible. Waiting for confirmation on a pullback may be a better approach for new entries. Please apply proper risk management, use a stop-loss, and keep leverage low.
#IDOL #IDOLUSDT #BinanceSquare #Futures #CryptoAnalysis
$IDOL USDT Perp | 4H Technical Update
IDOL has delivered a strong breakout after a prolonged consolidation phase. Price is trading at 0.0410, up roughly 71% in the last 24 hours.
Market Snapshot
• Last Price: 0.041053
• 24h High / Low: 0.045550 / 0.021929
• 24h Volume: 325.98M USDT
• Mark Price: 0.041303
Technical Outlook
• Price is trading above the MA(7), MA(25) and MA(99), signaling a strong bullish trend
• A notable surge in volume supports the breakout
• RSI(6) is near 89.9, placing the market firmly in overbought territory
Key Levels
• Resistance: 0.0455
• Support: 0.0304 / 0.0219
Risk Note
After such a sharp rally, price is stretched far above the MA(7), so a short-term pullback or consolidation is possible. Waiting for confirmation on a pullback may be a better approach for new entries. Please apply proper risk management, use a stop-loss, and keep leverage low.
#IDOL #IDOLUSDT #BinanceSquare #Futures #CryptoAnalysis
IDOL has delivered a strong breakout after a prolonged consolidation phase. Price is trading at 0.0410, up roughly 71% in the last 24 hours.
Market Snapshot
• Last Price: 0.041053
• 24h High / Low: 0.045550 / 0.021929
• 24h Volume: 325.98M USDT
• Mark Price: 0.041303
Technical Outlook
• Price is trading above the MA(7), MA(25) and MA(99), signaling a strong bullish trend
• A notable surge in volume supports the breakout
• RSI(6) is near 89.9, placing the market firmly in overbought territory
Key Levels
• Resistance: 0.0455
• Support: 0.0304 / 0.0219
Risk Note
After such a sharp rally, price is stretched far above the MA(7), so a short-term pullback or consolidation is possible. Waiting for confirmation on a pullback may be a better approach for new entries. Please apply proper risk management, use a stop-loss, and keep leverage low.
#IDOL #IDOLUSDT #BinanceSquare #Futures #CryptoAnalysis
347
·
--
📊 Trading Strategy | Two Potential Long Setups
I'm watching two possible entry opportunities based on the current chart structure. The key levels are clear, but confirmation is important before entering.
🟢 SETUP A – Pullback Entry (Preferred)
Wait for price to retest the MA99 support zone.
- Entry: $0.00780 – $0.00800
- Stop Loss: $0.00695
- TP1: $0.00854
- TP2: $0.00950
- TP3: $0.01010
🎯 SETUP B – Breakout Entry
A confirmed 4H candle close above $0.00854 with strong volume could signal another bullish continuation.
- Entry: $0.00860 – $0.00870
- Stop Loss: $0.00790
- TP1: $0.00950
- TP2: $0.01010
📌 My Strategy: I prefer Setup A for a better entry near support. However, if buyers confirm a strong breakout, Setup B could offer another opportunity.
Trade smart. Protect your capital. 💚
$MITO
#CryptoTrading #TradingSetup #TechnicalAnalysis #longsignal #dyor
📊 Trading Strategy | Two Potential Long Setups
I'm watching two possible entry opportunities based on the current chart structure. The key levels are clear, but confirmation is important before entering.
🟢 SETUP A – Pullback Entry (Preferred)
Wait for price to retest the MA99 support zone.
- Entry: $0.00780 – $0.00800
- Stop Loss: $0.00695
- TP1: $0.00854
- TP2: $0.00950
- TP3: $0.01010
🎯 SETUP B – Breakout Entry
A confirmed 4H candle close above $0.00854 with strong volume could signal another bullish continuation.
- Entry: $0.00860 – $0.00870
- Stop Loss: $0.00790
- TP1: $0.00950
- TP2: $0.01010
📌 My Strategy: I prefer Setup A for a better entry near support. However, if buyers confirm a strong breakout, Setup B could offer another opportunity.
Trade smart. Protect your capital. 💚
$MITO
#CryptoTrading #TradingSetup #TechnicalAnalysis #longsignal #dyor
I'm watching two possible entry opportunities based on the current chart structure. The key levels are clear, but confirmation is important before entering.
🟢 SETUP A – Pullback Entry (Preferred)
Wait for price to retest the MA99 support zone.
- Entry: $0.00780 – $0.00800
- Stop Loss: $0.00695
- TP1: $0.00854
- TP2: $0.00950
- TP3: $0.01010
🎯 SETUP B – Breakout Entry
A confirmed 4H candle close above $0.00854 with strong volume could signal another bullish continuation.
- Entry: $0.00860 – $0.00870
- Stop Loss: $0.00790
- TP1: $0.00950
- TP2: $0.01010
📌 My Strategy: I prefer Setup A for a better entry near support. However, if buyers confirm a strong breakout, Setup B could offer another opportunity.
Trade smart. Protect your capital. 💚
$MITO
#CryptoTrading #TradingSetup #TechnicalAnalysis #longsignal #dyor
175
·
--
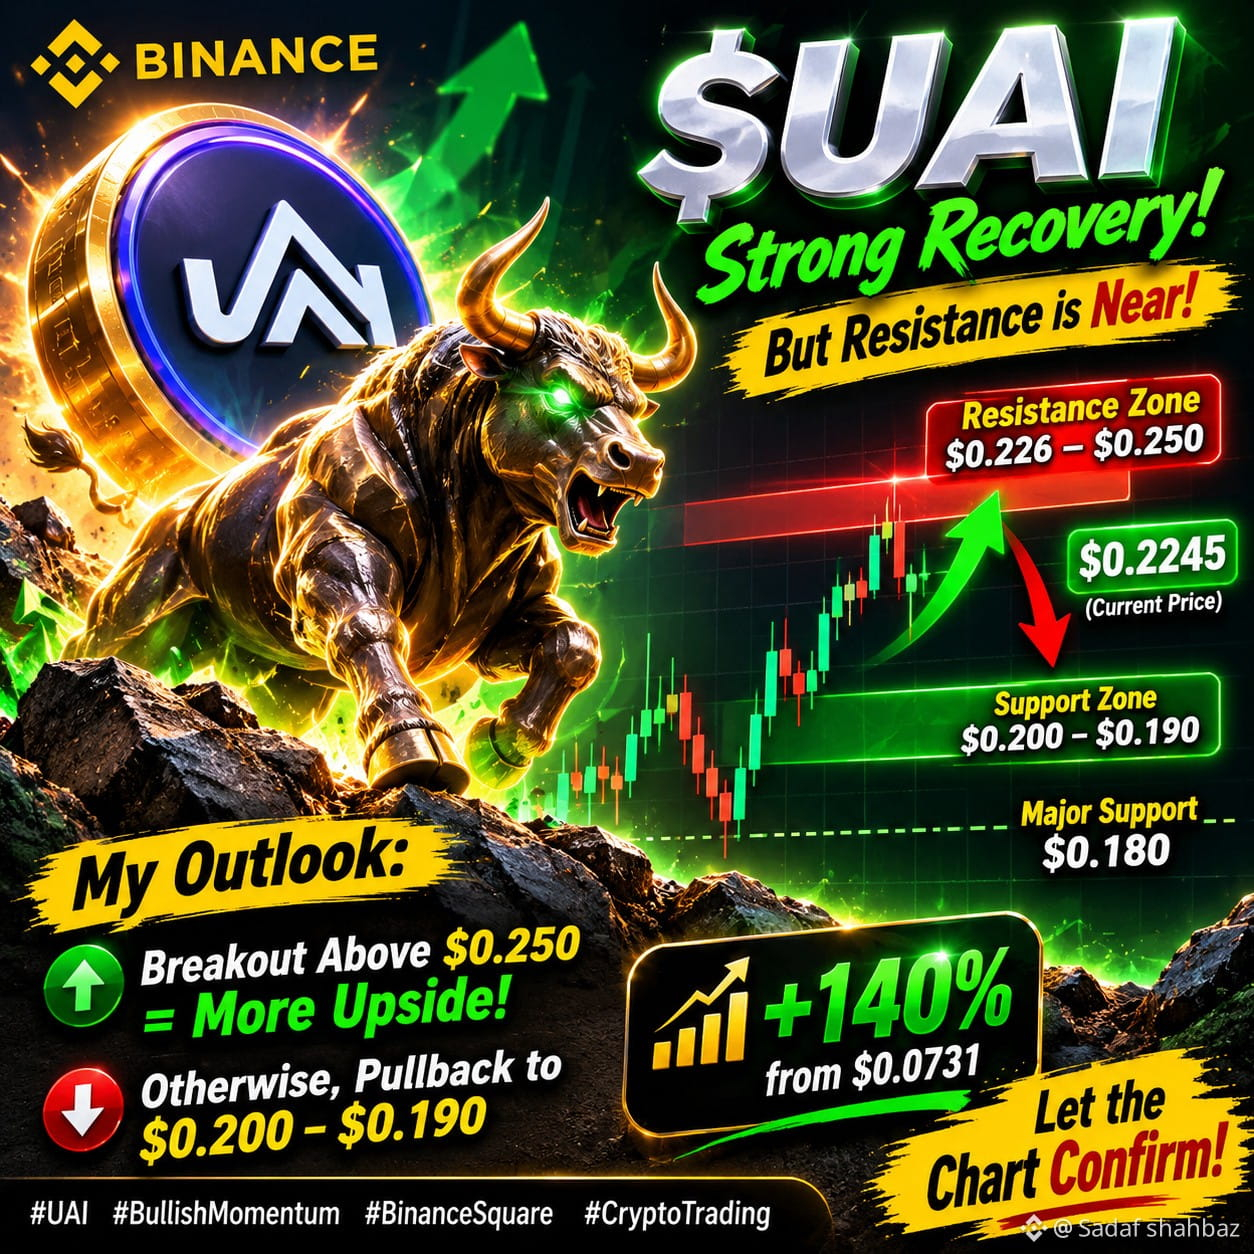
🚀 $UAI – Strong Recovery, But Resistance Is Near!
$UAI has delivered an impressive recovery from its recent low of $0.0731, surging over 140% and now trading around $0.2245.
Bullish momentum is strong, with a massive volume spike. However, price is approaching the critical $0.226–$0.250 resistance zone, while RSI(6) is already above 85, indicating overbought conditions.
🎯 My Outlook:
- Resistance: $0.226–$0.250
- Support: $0.200–$0.190
- Major Support: $0.180
I’m watching for a clean breakout above $0.250 for further upside. Otherwise, a short-term pullback toward support wouldn't be surprising.
The trend is bullish, but chasing an extended pump carries risk. Let the chart confirm the next move! 🔥
#UAI #BullishMomentum #cryptotrading #BinanceSquare
🚀 $UAI – Strong Recovery, But Resistance Is Near!
$UAI has delivered an impressive recovery from its recent low of $0.0731, surging over 140% and now trading around $0.2245.
Bullish momentum is strong, with a massive volume spike. However, price is approaching the critical $0.226–$0.250 resistance zone, while RSI(6) is already above 85, indicating overbought conditions.
🎯 My Outlook:
- Resistance: $0.226–$0.250
- Support: $0.200–$0.190
- Major Support: $0.180
I’m watching for a clean breakout above $0.250 for further upside. Otherwise, a short-term pullback toward support wouldn't be surprising.
The trend is bullish, but chasing an extended pump carries risk. Let the chart confirm the next move! 🔥
#UAI #BullishMomentum #cryptotrading #BinanceSquare
$UAI has delivered an impressive recovery from its recent low of $0.0731, surging over 140% and now trading around $0.2245.
Bullish momentum is strong, with a massive volume spike. However, price is approaching the critical $0.226–$0.250 resistance zone, while RSI(6) is already above 85, indicating overbought conditions.
🎯 My Outlook:
- Resistance: $0.226–$0.250
- Support: $0.200–$0.190
- Major Support: $0.180
I’m watching for a clean breakout above $0.250 for further upside. Otherwise, a short-term pullback toward support wouldn't be surprising.
The trend is bullish, but chasing an extended pump carries risk. Let the chart confirm the next move! 🔥
#UAI #BullishMomentum #cryptotrading #BinanceSquare
154
·
--
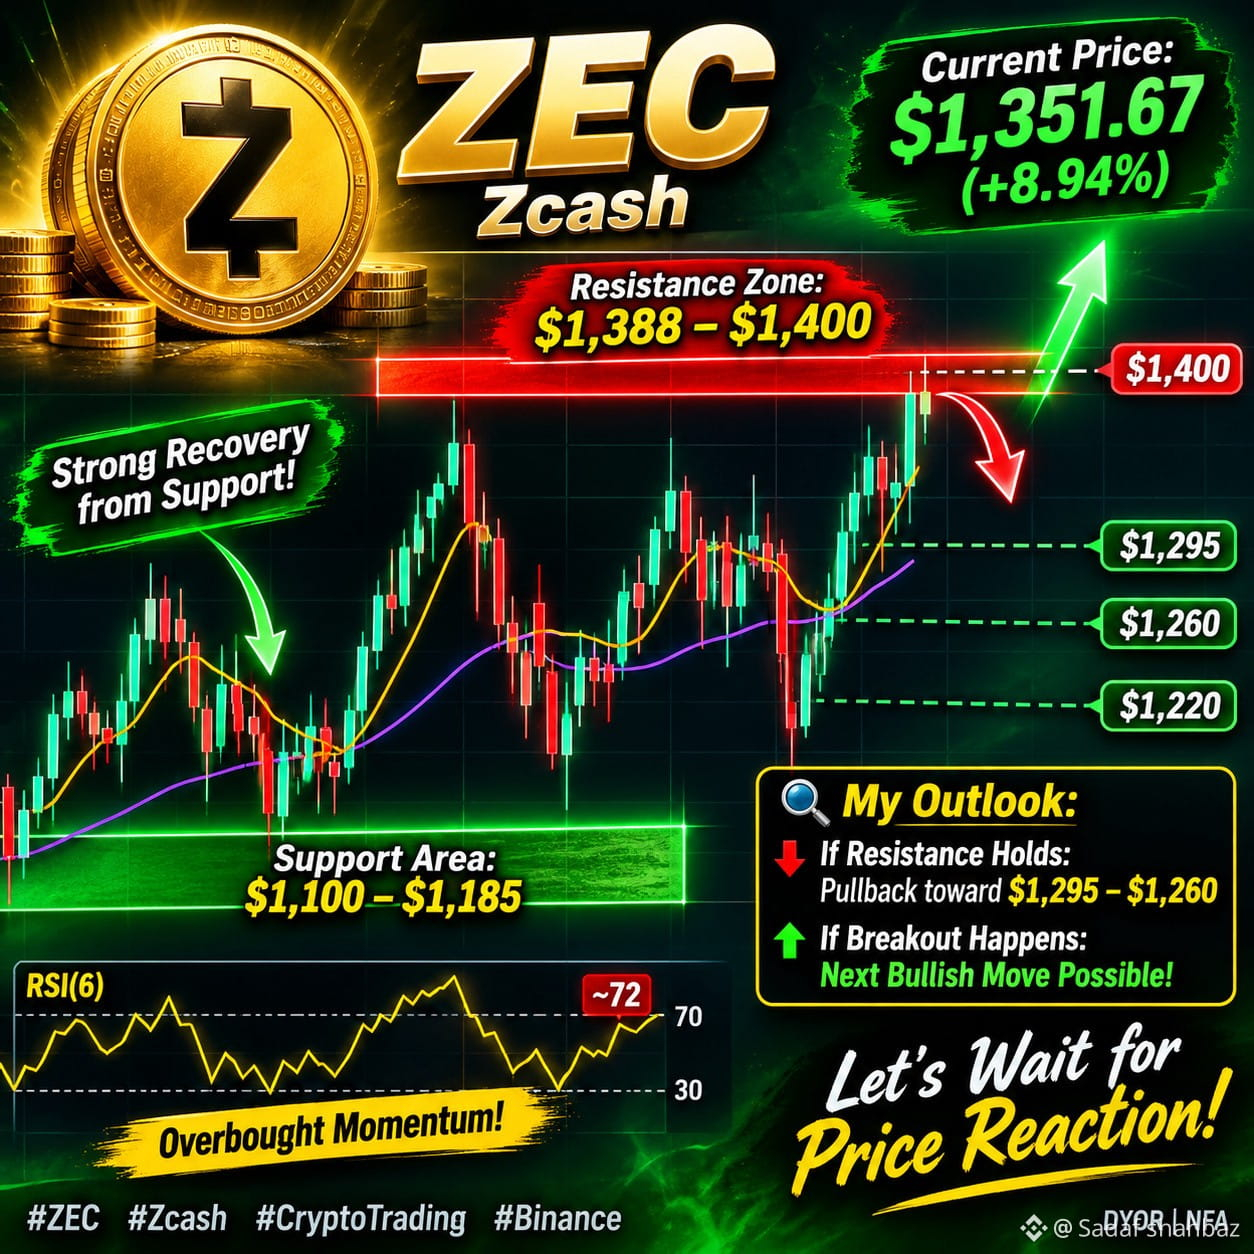
📊 $ZEC – Key Resistance Zone Ahead! ⚠️
$ZEC is showing impressive bullish recovery, currently trading around $1,351.67 (+8.94%) on the 4H chart.
Price has bounced strongly from the $1,100–$1,185 support area and is now approaching a major resistance zone at $1,388–$1,400, where sellers could step in again.
🔴 My Trading Outlook:
I'm watching for a possible rejection from this resistance, with a potential pullback toward:
🎯 First Support: $1,295
🎯 Second Support: $1,260
🎯 Major Support: $1,220
RSI(6) is around 72, indicating overbought short-term momentum, so a correction wouldn't be surprising.
However, a strong 4H breakout and sustained close above $1,400 could invalidate the bearish setup and open the door for another bullish move.
Let's watch the reaction at resistance before taking a position. No chasing candles! 🔥
#ZEC #CryptoTrading #TechnicalAnalysis #Binance
📊 $ZEC – Key Resistance Zone Ahead! ⚠️
$ZEC is showing impressive bullish recovery, currently trading around $1,351.67 (+8.94%) on the 4H chart.
Price has bounced strongly from the $1,100–$1,185 support area and is now approaching a major resistance zone at $1,388–$1,400, where sellers could step in again.
🔴 My Trading Outlook:
I'm watching for a possible rejection from this resistance, with a potential pullback toward:
🎯 First Support: $1,295
🎯 Second Support: $1,260
🎯 Major Support: $1,220
RSI(6) is around 72, indicating overbought short-term momentum, so a correction wouldn't be surprising.
However, a strong 4H breakout and sustained close above $1,400 could invalidate the bearish setup and open the door for another bullish move.
Let's watch the reaction at resistance before taking a position. No chasing candles! 🔥
#ZEC #CryptoTrading #TechnicalAnalysis #Binance
$ZEC is showing impressive bullish recovery, currently trading around $1,351.67 (+8.94%) on the 4H chart.
Price has bounced strongly from the $1,100–$1,185 support area and is now approaching a major resistance zone at $1,388–$1,400, where sellers could step in again.
🔴 My Trading Outlook:
I'm watching for a possible rejection from this resistance, with a potential pullback toward:
🎯 First Support: $1,295
🎯 Second Support: $1,260
🎯 Major Support: $1,220
RSI(6) is around 72, indicating overbought short-term momentum, so a correction wouldn't be surprising.
However, a strong 4H breakout and sustained close above $1,400 could invalidate the bearish setup and open the door for another bullish move.
Let's watch the reaction at resistance before taking a position. No chasing candles! 🔥
#ZEC #CryptoTrading #TechnicalAnalysis #Binance
9
·
--
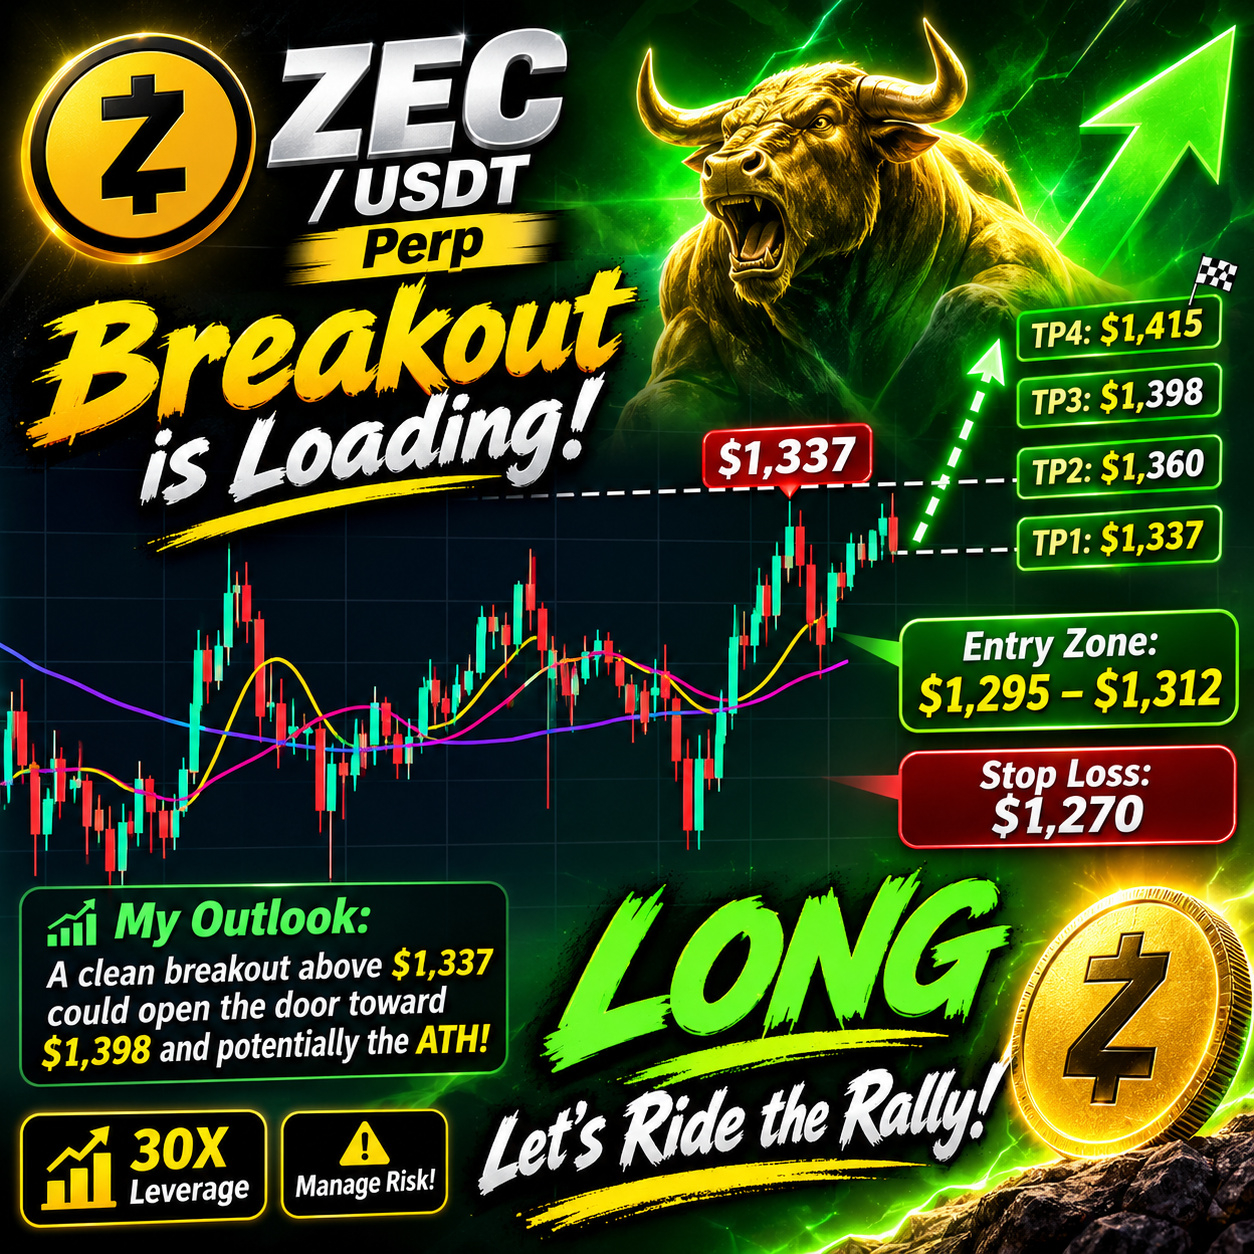
🚀 $ZEC – BULLISH BREAKOUT SETUP | LONG
$ZEC is showing strong bullish momentum on the 4H chart! 🔥
Currently trading at $1,310.67 (+0.9%), price is holding above MA7, MA25 and MA99. RSI(6) is around 63.67, indicating positive momentum without being extremely overbought.
I'm watching for another bullish move toward major resistance levels.
🟢 LONG TRADE SETUP
Entry Zone: $1,295 – $1,312
Stop Loss: $1,270
🎯 TP1: $1,337
🎯 TP2: $1,360
🎯 TP3: $1,398
🎯 Final Target: $1,415
My Outlook: A clean breakout above $1,337 could open the door toward $1,398 and potentially higher.
Are we going to see $ZEC reclaim $1,400? 👀🔥
#ZEC #Zcash #cryptotrading #longsignal
🚀 $ZEC – BULLISH BREAKOUT SETUP | LONG
$ZEC is showing strong bullish momentum on the 4H chart! 🔥
Currently trading at $1,310.67 (+0.9%), price is holding above MA7, MA25 and MA99. RSI(6) is around 63.67, indicating positive momentum without being extremely overbought.
I'm watching for another bullish move toward major resistance levels.
🟢 LONG TRADE SETUP
Entry Zone: $1,295 – $1,312
Stop Loss: $1,270
🎯 TP1: $1,337
🎯 TP2: $1,360
🎯 TP3: $1,398
🎯 Final Target: $1,415
My Outlook: A clean breakout above $1,337 could open the door toward $1,398 and potentially higher.
Are we going to see $ZEC reclaim $1,400? 👀🔥
#ZEC #Zcash #cryptotrading #longsignal
$ZEC is showing strong bullish momentum on the 4H chart! 🔥
Currently trading at $1,310.67 (+0.9%), price is holding above MA7, MA25 and MA99. RSI(6) is around 63.67, indicating positive momentum without being extremely overbought.
I'm watching for another bullish move toward major resistance levels.
🟢 LONG TRADE SETUP
Entry Zone: $1,295 – $1,312
Stop Loss: $1,270
🎯 TP1: $1,337
🎯 TP2: $1,360
🎯 TP3: $1,398
🎯 Final Target: $1,415
My Outlook: A clean breakout above $1,337 could open the door toward $1,398 and potentially higher.
Are we going to see $ZEC reclaim $1,400? 👀🔥
#ZEC #Zcash #cryptotrading #longsignal
310
·
--
🚀 $PEPE – Bullish Momentum Building! 🐸🔥
PEPE is showing positive momentum on the 4H chart, currently trading around $0.00000506 (+2.02%).
Buyers are holding above MA(7), MA(25), and MA(99), while RSI(6) is around 65, indicating strengthening bullish momentum.
If buyers maintain control, we could see another move toward the next resistance zones.
🟢 BUY SETUP – PEPE/USDT
Entry: $0.00000495 – $0.00000508
Stop Loss: $0.00000462
TP1: $0.00000515
TP2: $0.00000536
TP3: $0.00000560
🔥 Key Levels to Watch: Support: $0.00000488 – $0.00000474
Resistance: $0.00000515 – $0.00000536
My view: As long as $PEPE holds above its moving averages, another bullish push remains possible. A breakout above $0.00000515 could attract more buyers.
Are we preparing for another $PEPE rally? 🐸🚀
#PEPEUSDT #CryptoTrading
🚀 $PEPE – Bullish Momentum Building! 🐸🔥
PEPE is showing positive momentum on the 4H chart, currently trading around $0.00000506 (+2.02%).
Buyers are holding above MA(7), MA(25), and MA(99), while RSI(6) is around 65, indicating strengthening bullish momentum.
If buyers maintain control, we could see another move toward the next resistance zones.
🟢 BUY SETUP – PEPE/USDT
Entry: $0.00000495 – $0.00000508
Stop Loss: $0.00000462
TP1: $0.00000515
TP2: $0.00000536
TP3: $0.00000560
🔥 Key Levels to Watch: Support: $0.00000488 – $0.00000474
Resistance: $0.00000515 – $0.00000536
My view: As long as $PEPE holds above its moving averages, another bullish push remains possible. A breakout above $0.00000515 could attract more buyers.
Are we preparing for another $PEPE rally? 🐸🚀
#PEPEUSDT #CryptoTrading
PEPE is showing positive momentum on the 4H chart, currently trading around $0.00000506 (+2.02%).
Buyers are holding above MA(7), MA(25), and MA(99), while RSI(6) is around 65, indicating strengthening bullish momentum.
If buyers maintain control, we could see another move toward the next resistance zones.
🟢 BUY SETUP – PEPE/USDT
Entry: $0.00000495 – $0.00000508
Stop Loss: $0.00000462
TP1: $0.00000515
TP2: $0.00000536
TP3: $0.00000560
🔥 Key Levels to Watch: Support: $0.00000488 – $0.00000474
Resistance: $0.00000515 – $0.00000536
My view: As long as $PEPE holds above its moving averages, another bullish push remains possible. A breakout above $0.00000515 could attract more buyers.
Are we preparing for another $PEPE rally? 🐸🚀
#PEPEUSDT #CryptoTrading

90
·
--
Article
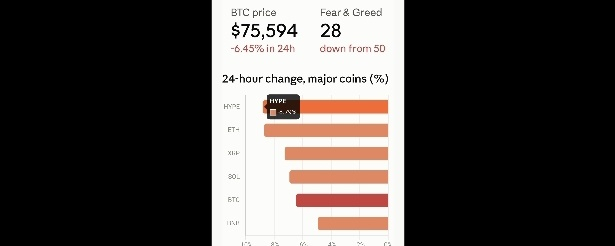
🚨 Crypto Bloodbath! Nasdaq Crash Drags BTC Down to $75K, Is $70K Next? 📉The crypto market is awash in red today. 🔴 $BTC is trading near $75,500, down more than 6% in the last 24 hours. $ETH has dropped about 8.7%, while $SOL and $XRP are both down around 7%.
Why is the market falling?
1️⃣ Stock market shock: After the US midterm elections, valuations in the AI and chip sectors came under fresh scrutiny, and the Nasdaq fell more than 5% in a single day. Crypto is now closely tied to Wall Street, so it fell along with it.
2️⃣ Liquidations: Roughly $1.09 billion in positions were liquidated over 24 hours, mostly longs. Forced selling from leveraged traders accelerated the drop.
3️⃣ Failed rebound: Bitcoin slid from around $81K back to $75K, wiping out the previous day's recovery.
4️⃣ Jobs report ahead: US nonfarm payrolls are due today. The numbers could shift interest rate expectations, so traders are staying cautious.
5️⃣ Sentiment: The Fear & Greed Index plunged from 50 to 28, showing fear is taking over.
Key levels to watch:
📌 $75,000 is the most important support right now. A close below it could open the door to $70,000. On the upside, $80,000 is strong resistance.
A word of caution for traders:
In a market this volatile, using leverage without a plan is dangerous. Always set a stop-loss and define your risk limit in advance.
💬 What's your take?
Will the $75K support hold, or are we heading to $70K?
👇 Drop your prediction in the comments: "75K Holds" or "70K Down"? And tell us: are you buying the dip, selling, or waiting on the sidelines?
#Bitcoin #BTC #CryptoCrash $#BinanceSquare #Nasdaq
🚨 Crypto Bloodbath! Nasdaq Crash Drags BTC Down to $75K, Is $70K Next? 📉
The crypto market is awash in red today. 🔴 $BTC is trading near $75,500, down more than 6% in the last 24 hours. $ETH has dropped about 8.7%, while $SOL and $XRP are both down around 7%.
Why is the market falling?
1️⃣ Stock market shock: After the US midterm elections, valuations in the AI and chip sectors came under fresh scrutiny, and the Nasdaq fell more than 5% in a single day. Crypto is now closely tied to Wall Street, so it fell along with it.
2️⃣ Liquidations: Roughly $1.09 billion in positions were liquidated over 24 hours, mostly longs. Forced selling from leveraged traders accelerated the drop.
3️⃣ Failed rebound: Bitcoin slid from around $81K back to $75K, wiping out the previous day's recovery.
4️⃣ Jobs report ahead: US nonfarm payrolls are due today. The numbers could shift interest rate expectations, so traders are staying cautious.
5️⃣ Sentiment: The Fear & Greed Index plunged from 50 to 28, showing fear is taking over.
Key levels to watch:
📌 $75,000 is the most important support right now. A close below it could open the door to $70,000. On the upside, $80,000 is strong resistance.
A word of caution for traders:
In a market this volatile, using leverage without a plan is dangerous. Always set a stop-loss and define your risk limit in advance.
💬 What's your take?
Will the $75K support hold, or are we heading to $70K?
👇 Drop your prediction in the comments: "75K Holds" or "70K Down"? And tell us: are you buying the dip, selling, or waiting on the sidelines?
#Bitcoin #BTC #CryptoCrash $#BinanceSquare #Nasdaq
Why is the market falling?
1️⃣ Stock market shock: After the US midterm elections, valuations in the AI and chip sectors came under fresh scrutiny, and the Nasdaq fell more than 5% in a single day. Crypto is now closely tied to Wall Street, so it fell along with it.
2️⃣ Liquidations: Roughly $1.09 billion in positions were liquidated over 24 hours, mostly longs. Forced selling from leveraged traders accelerated the drop.
3️⃣ Failed rebound: Bitcoin slid from around $81K back to $75K, wiping out the previous day's recovery.
4️⃣ Jobs report ahead: US nonfarm payrolls are due today. The numbers could shift interest rate expectations, so traders are staying cautious.
5️⃣ Sentiment: The Fear & Greed Index plunged from 50 to 28, showing fear is taking over.
Key levels to watch:
📌 $75,000 is the most important support right now. A close below it could open the door to $70,000. On the upside, $80,000 is strong resistance.
A word of caution for traders:
In a market this volatile, using leverage without a plan is dangerous. Always set a stop-loss and define your risk limit in advance.
💬 What's your take?
Will the $75K support hold, or are we heading to $70K?
👇 Drop your prediction in the comments: "75K Holds" or "70K Down"? And tell us: are you buying the dip, selling, or waiting on the sidelines?
#Bitcoin #BTC #CryptoCrash $#BinanceSquare #Nasdaq
103
·
--
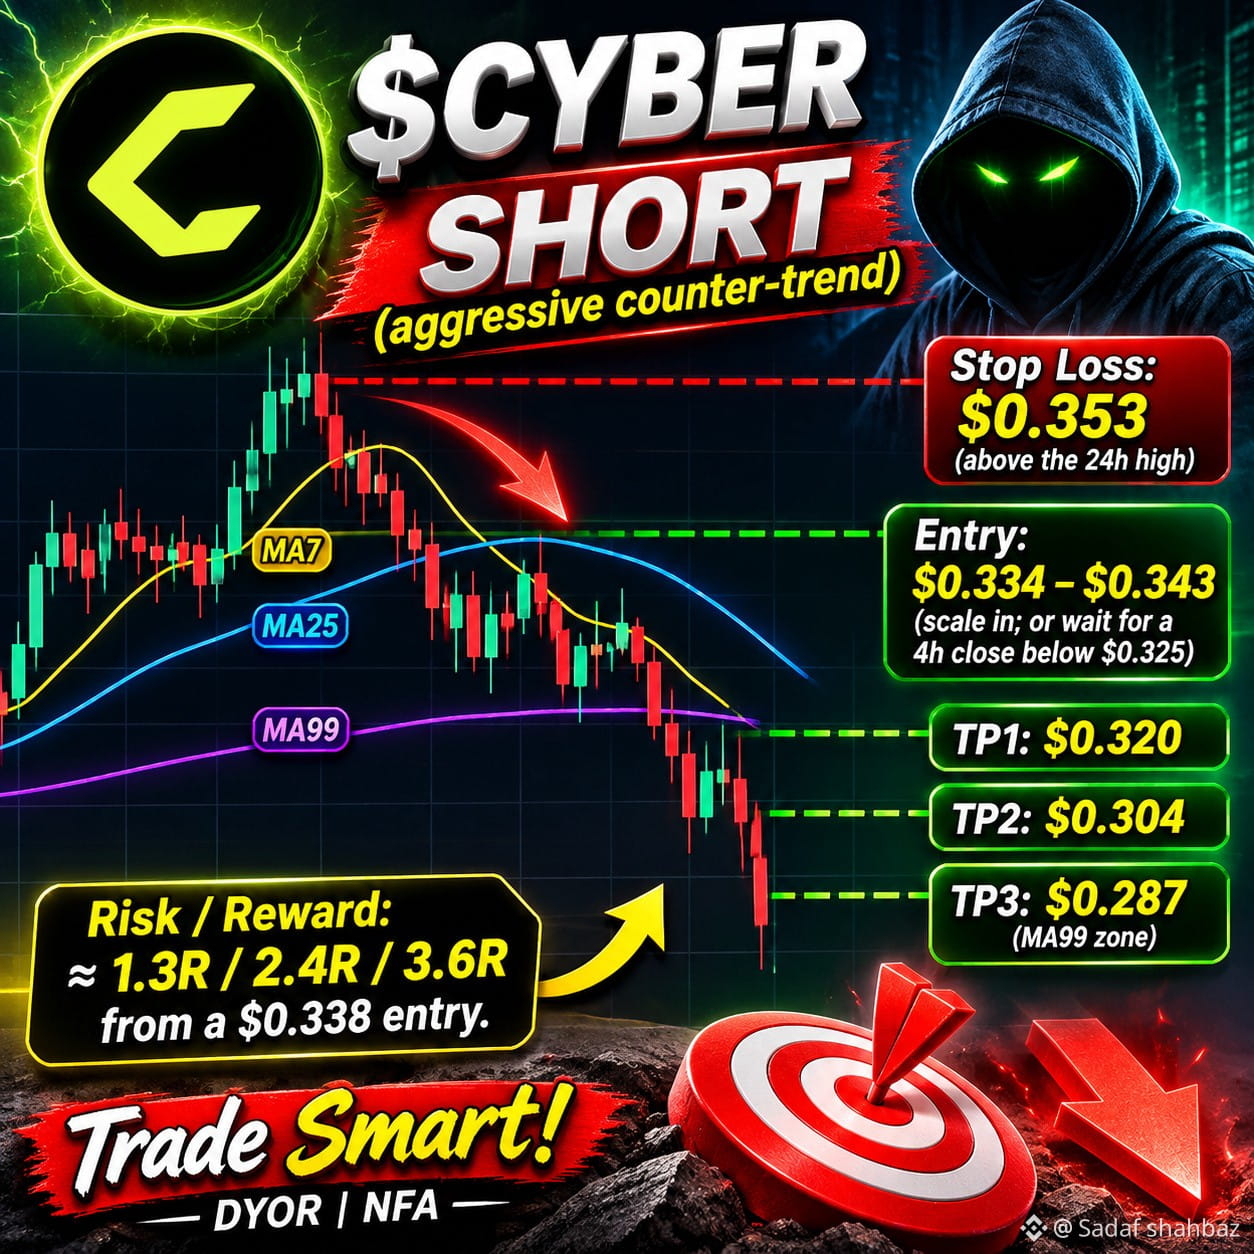
📉 $CYBER : SHORT (aggressive counter-trend)
Entry: $0.334 – $0.343 (scale in; or wait for a 4h close below $0.325)
Stop Loss: $0.353 (above the 24h high)
Take Profit Targets
TP1: $0.320
TP2: $0.304
TP3: $0.287 (MA99 zone)
Risk/reward is roughly 1.3R / 2.4R / 3.6R from a $0.338 entry.
📉 $CYBER : SHORT (aggressive counter-trend)
Entry: $0.334 – $0.343 (scale in; or wait for a 4h close below $0.325)
Stop Loss: $0.353 (above the 24h high)
Take Profit Targets
TP1: $0.320
TP2: $0.304
TP3: $0.287 (MA99 zone)
Risk/reward is roughly 1.3R / 2.4R / 3.6R from a $0.338 entry.
Entry: $0.334 – $0.343 (scale in; or wait for a 4h close below $0.325)
Stop Loss: $0.353 (above the 24h high)
Take Profit Targets
TP1: $0.320
TP2: $0.304
TP3: $0.287 (MA99 zone)
Risk/reward is roughly 1.3R / 2.4R / 3.6R from a $0.338 entry.
142
·
--
🚀 $JCT – BUY NOW | LONG SETUP
$JCT is showing strong bullish momentum, currently trading at $0.005897 (+42.88%).
The 4H chart shows a bullish recovery above key moving averages, supported by increasing volume. Buyers are stepping in, but RSI is around 78, so manage risk carefully.
🟢 Trade Setup:
- Entry: $0.00585 – $0.00590
- Stop Loss: $0.00520
- TP1: $0.00625
- TP2: $0.00680
- TP3: $0.00725
🔥 Momentum is strong, and another upward move is possible if buyers maintain control.
Don't chase blindly. Manage your risk and trade smart!
What do you think? Can $JCT break $0.007?
#JCT #Crypto #Binance #Altcoins #LONG
🚀 $JCT – BUY NOW | LONG SETUP
$JCT is showing strong bullish momentum, currently trading at $0.005897 (+42.88%).
The 4H chart shows a bullish recovery above key moving averages, supported by increasing volume. Buyers are stepping in, but RSI is around 78, so manage risk carefully.
🟢 Trade Setup:
- Entry: $0.00585 – $0.00590
- Stop Loss: $0.00520
- TP1: $0.00625
- TP2: $0.00680
- TP3: $0.00725
🔥 Momentum is strong, and another upward move is possible if buyers maintain control.
Don't chase blindly. Manage your risk and trade smart!
What do you think? Can $JCT break $0.007?
#JCT #Crypto #Binance #Altcoins #LONG
$JCT is showing strong bullish momentum, currently trading at $0.005897 (+42.88%).
The 4H chart shows a bullish recovery above key moving averages, supported by increasing volume. Buyers are stepping in, but RSI is around 78, so manage risk carefully.
🟢 Trade Setup:
- Entry: $0.00585 – $0.00590
- Stop Loss: $0.00520
- TP1: $0.00625
- TP2: $0.00680
- TP3: $0.00725
🔥 Momentum is strong, and another upward move is possible if buyers maintain control.
Don't chase blindly. Manage your risk and trade smart!
What do you think? Can $JCT break $0.007?
#JCT #Crypto #Binance #Altcoins #LONG
406
·
--
Small scalp, big smile! 😜🔥
$JCT is showing strong bullish momentum! 💚 Another clean move, and $556 profit successfully booked! 💰💪
JCTUSDT is now trading at $0.005938 (+70.98%), approaching its 24H high of $0.005971.
Buyers are still showing strength, but after this massive pump, stay smart and manage your risk.
More opportunities ahead! 🚀
#JCT #Junction #CryptoTrading #Binance #ProfitBooked
Small scalp, big smile! 😜🔥
$JCT is showing strong bullish momentum! 💚 Another clean move, and $556 profit successfully booked! 💰💪
JCTUSDT is now trading at $0.005938 (+70.98%), approaching its 24H high of $0.005971.
Buyers are still showing strength, but after this massive pump, stay smart and manage your risk.
More opportunities ahead! 🚀
#JCT #Junction #CryptoTrading #Binance #ProfitBooked
$JCT is showing strong bullish momentum! 💚 Another clean move, and $556 profit successfully booked! 💰💪
JCTUSDT is now trading at $0.005938 (+70.98%), approaching its 24H high of $0.005971.
Buyers are still showing strength, but after this massive pump, stay smart and manage your risk.
More opportunities ahead! 🚀
#JCT #Junction #CryptoTrading #Binance #ProfitBooked

1
295
·
--
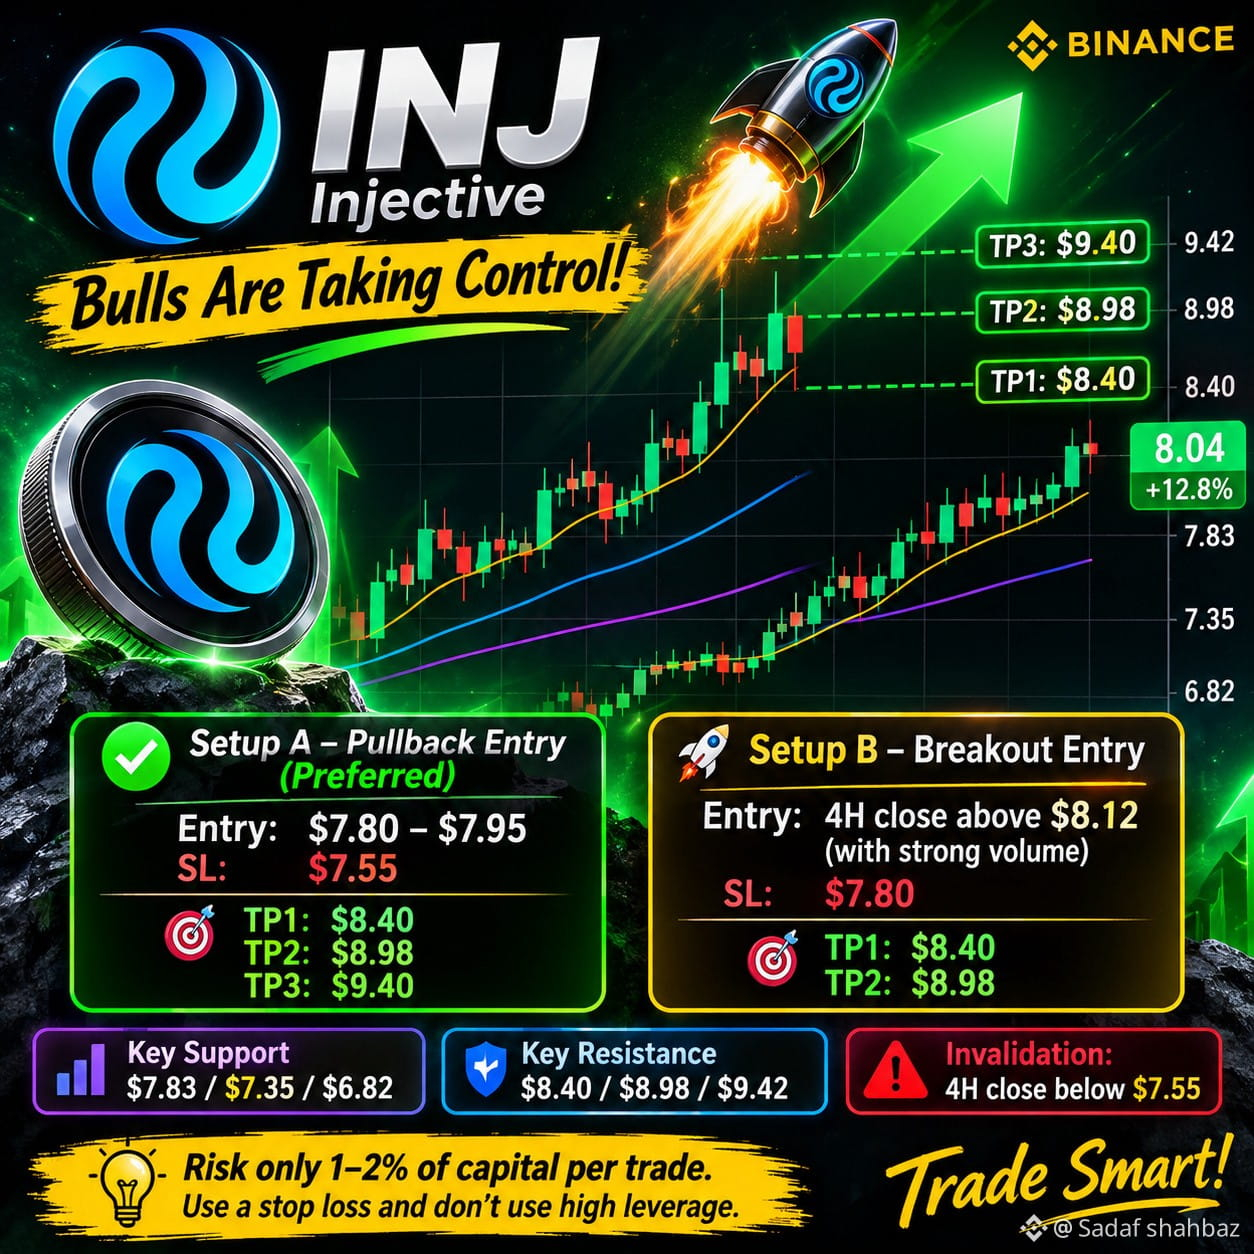
🚀 $INJ – Bulls Are Taking Control!
INJ is showing strong bullish momentum, trading above all major moving averages. However, RSI(6) near 85 signals overbought conditions, so a pullback entry looks safer than chasing the pump.
🟢 LONG SETUP
Entry: $7.80 – $7.95
Stop Loss: $7.55
🎯 Take Profit Targets:
- TP1: $8.40
- TP2: $8.98
- TP3: $9.40
🚀 Breakout Entry: 4H candle close above $8.12 with strong volume.
Key Support: $7.83 / $7.35
Resistance: $8.40 / $8.98 / $9.42
What's your target for $INJ ? 👀
#İNJ #Injective #CryptoTrading #TradingSignals
🚀 $INJ – Bulls Are Taking Control!
INJ is showing strong bullish momentum, trading above all major moving averages. However, RSI(6) near 85 signals overbought conditions, so a pullback entry looks safer than chasing the pump.
🟢 LONG SETUP
Entry: $7.80 – $7.95
Stop Loss: $7.55
🎯 Take Profit Targets:
- TP1: $8.40
- TP2: $8.98
- TP3: $9.40
🚀 Breakout Entry: 4H candle close above $8.12 with strong volume.
Key Support: $7.83 / $7.35
Resistance: $8.40 / $8.98 / $9.42
What's your target for $INJ ? 👀
#İNJ #Injective #CryptoTrading #TradingSignals
INJ is showing strong bullish momentum, trading above all major moving averages. However, RSI(6) near 85 signals overbought conditions, so a pullback entry looks safer than chasing the pump.
🟢 LONG SETUP
Entry: $7.80 – $7.95
Stop Loss: $7.55
🎯 Take Profit Targets:
- TP1: $8.40
- TP2: $8.98
- TP3: $9.40
🚀 Breakout Entry: 4H candle close above $8.12 with strong volume.
Key Support: $7.83 / $7.35
Resistance: $8.40 / $8.98 / $9.42
What's your target for $INJ ? 👀
#İNJ #Injective #CryptoTrading #TradingSignals
266
·
--
🚀 $JCT – Bullish Momentum Is Back! 🔥
Congratulations, guys! All our previous targets have been hit successfully. 💰✅
$JCT is showing strong bullish momentum again, currently trading at $0.005764 (+48.25%).
Looking at the 4H chart, price has reclaimed all major moving averages, while buying volume is increasing. Bulls are pushing toward the next resistance levels.
📈 New LONG Targets:
🎯 TP1: $0.00600
🎯 TP2: $0.00625 – $0.00650
🚀 Final Target: $0.00700 – $0.00790
Key Support: $0.00530 – $0.00500
The momentum looks promising, but RSI is already elevated, so avoid chasing the pump. Watch for a healthy pullback before entering.
🔥 Another bullish move could be coming!
Follow for more
#BullishMomentum #cryptotrading
🚀 $JCT – Bullish Momentum Is Back! 🔥
Congratulations, guys! All our previous targets have been hit successfully. 💰✅
$JCT is showing strong bullish momentum again, currently trading at $0.005764 (+48.25%).
Looking at the 4H chart, price has reclaimed all major moving averages, while buying volume is increasing. Bulls are pushing toward the next resistance levels.
📈 New LONG Targets:
🎯 TP1: $0.00600
🎯 TP2: $0.00625 – $0.00650
🚀 Final Target: $0.00700 – $0.00790
Key Support: $0.00530 – $0.00500
The momentum looks promising, but RSI is already elevated, so avoid chasing the pump. Watch for a healthy pullback before entering.
🔥 Another bullish move could be coming!
Follow for more
#BullishMomentum #cryptotrading
Congratulations, guys! All our previous targets have been hit successfully. 💰✅
$JCT is showing strong bullish momentum again, currently trading at $0.005764 (+48.25%).
Looking at the 4H chart, price has reclaimed all major moving averages, while buying volume is increasing. Bulls are pushing toward the next resistance levels.
📈 New LONG Targets:
🎯 TP1: $0.00600
🎯 TP2: $0.00625 – $0.00650
🚀 Final Target: $0.00700 – $0.00790
Key Support: $0.00530 – $0.00500
The momentum looks promising, but RSI is already elevated, so avoid chasing the pump. Watch for a healthy pullback before entering.
🔥 Another bullish move could be coming!
Follow for more
#BullishMomentum #cryptotrading

185
·
--
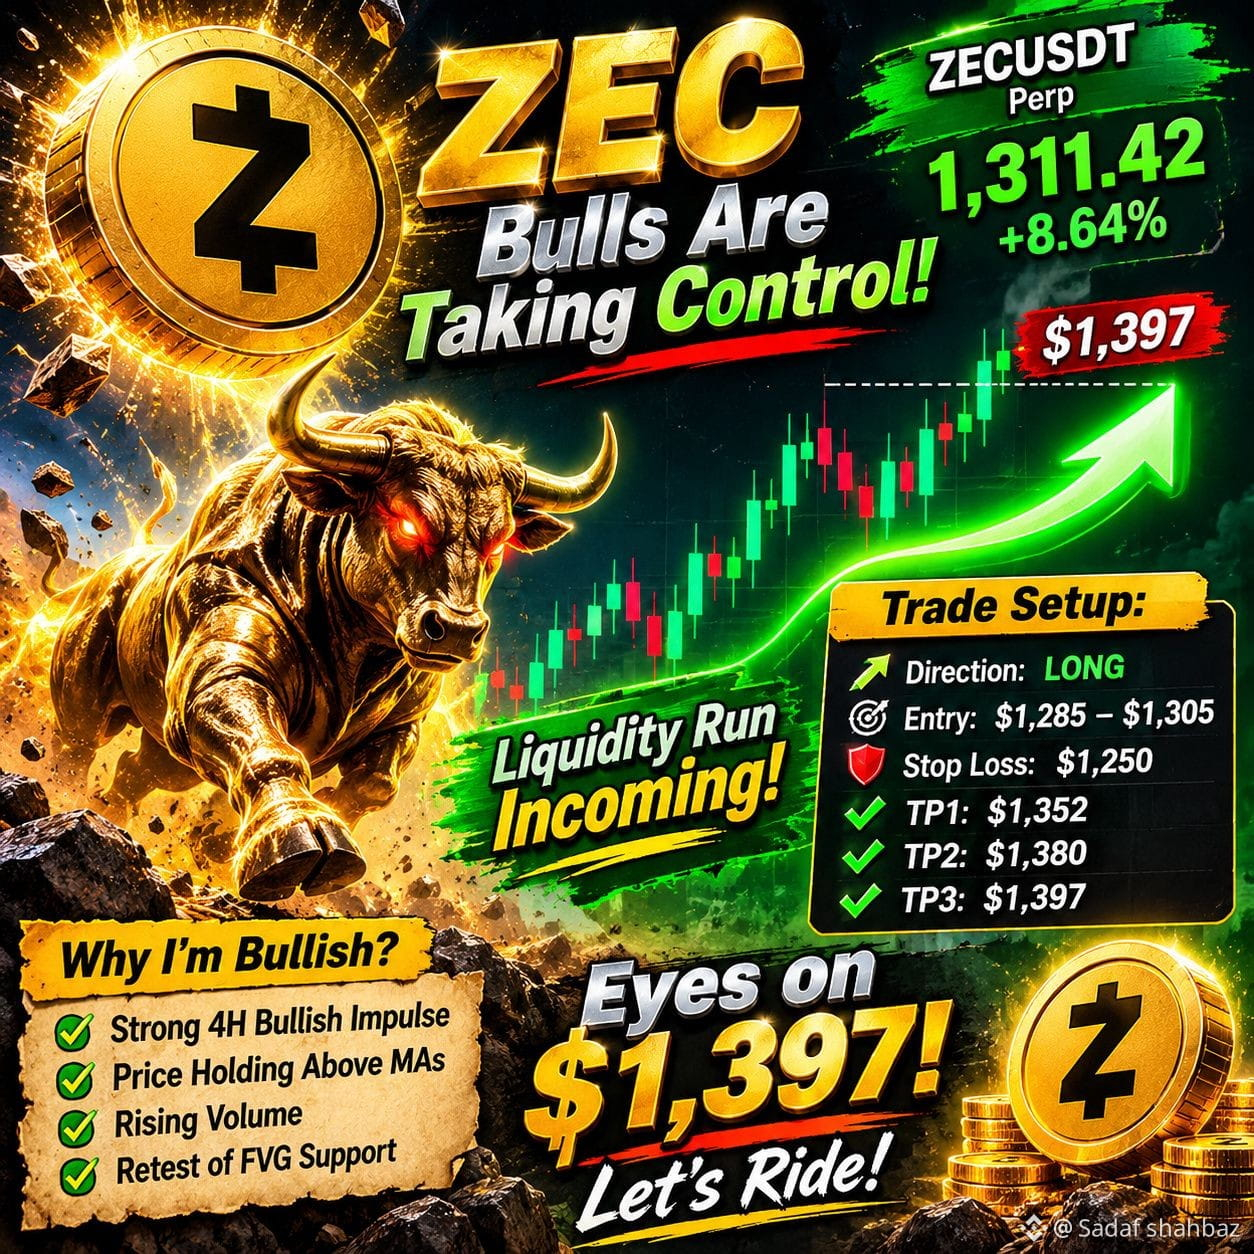
🚀 $ZEC – Bulls Are Taking Control!
$ZEC is showing a strong bullish impulse on the 4H chart, with buyers pushing price above all three major moving averages.
The bullish structure remains intact, and I'm watching the previous resistance zone for a potential liquidity sweep toward the weak high at $1,397.
Trade Setup:
- Pair: ZECUSDT Perp
- Direction: LONG 🟢
- Current Price: $1,311.42
- Entry Zone: $1,285 – $1,305
- Stop Loss: $1,250
- Take Profit 1: $1,352
- Take Profit 2: $1,380
- Take Profit 3: $1,397
Why I'm Bullish:
Buyers have delivered a strong 4H impulse, volume is increasing, and price is holding above the MA7, MA25 and MA99.
RSI is already elevated, so I don't want to chase the pump. A healthy pullback into the entry zone could offer a better opportunity.
🎯 Eyes on $1,397! Let's see if bulls can take that liquidity.
What's your target for $ZEC ?
#ZEC #Zcash #TradingSetup
🚀 $ZEC – Bulls Are Taking Control!
$ZEC is showing a strong bullish impulse on the 4H chart, with buyers pushing price above all three major moving averages.
The bullish structure remains intact, and I'm watching the previous resistance zone for a potential liquidity sweep toward the weak high at $1,397.
Trade Setup:
- Pair: ZECUSDT Perp
- Direction: LONG 🟢
- Current Price: $1,311.42
- Entry Zone: $1,285 – $1,305
- Stop Loss: $1,250
- Take Profit 1: $1,352
- Take Profit 2: $1,380
- Take Profit 3: $1,397
Why I'm Bullish:
Buyers have delivered a strong 4H impulse, volume is increasing, and price is holding above the MA7, MA25 and MA99.
RSI is already elevated, so I don't want to chase the pump. A healthy pullback into the entry zone could offer a better opportunity.
🎯 Eyes on $1,397! Let's see if bulls can take that liquidity.
What's your target for $ZEC ?
#ZEC #Zcash #TradingSetup
$ZEC is showing a strong bullish impulse on the 4H chart, with buyers pushing price above all three major moving averages.
The bullish structure remains intact, and I'm watching the previous resistance zone for a potential liquidity sweep toward the weak high at $1,397.
Trade Setup:
- Pair: ZECUSDT Perp
- Direction: LONG 🟢
- Current Price: $1,311.42
- Entry Zone: $1,285 – $1,305
- Stop Loss: $1,250
- Take Profit 1: $1,352
- Take Profit 2: $1,380
- Take Profit 3: $1,397
Why I'm Bullish:
Buyers have delivered a strong 4H impulse, volume is increasing, and price is holding above the MA7, MA25 and MA99.
RSI is already elevated, so I don't want to chase the pump. A healthy pullback into the entry zone could offer a better opportunity.
🎯 Eyes on $1,397! Let's see if bulls can take that liquidity.
What's your target for $ZEC ?
#ZEC #Zcash #TradingSetup
225
·
--
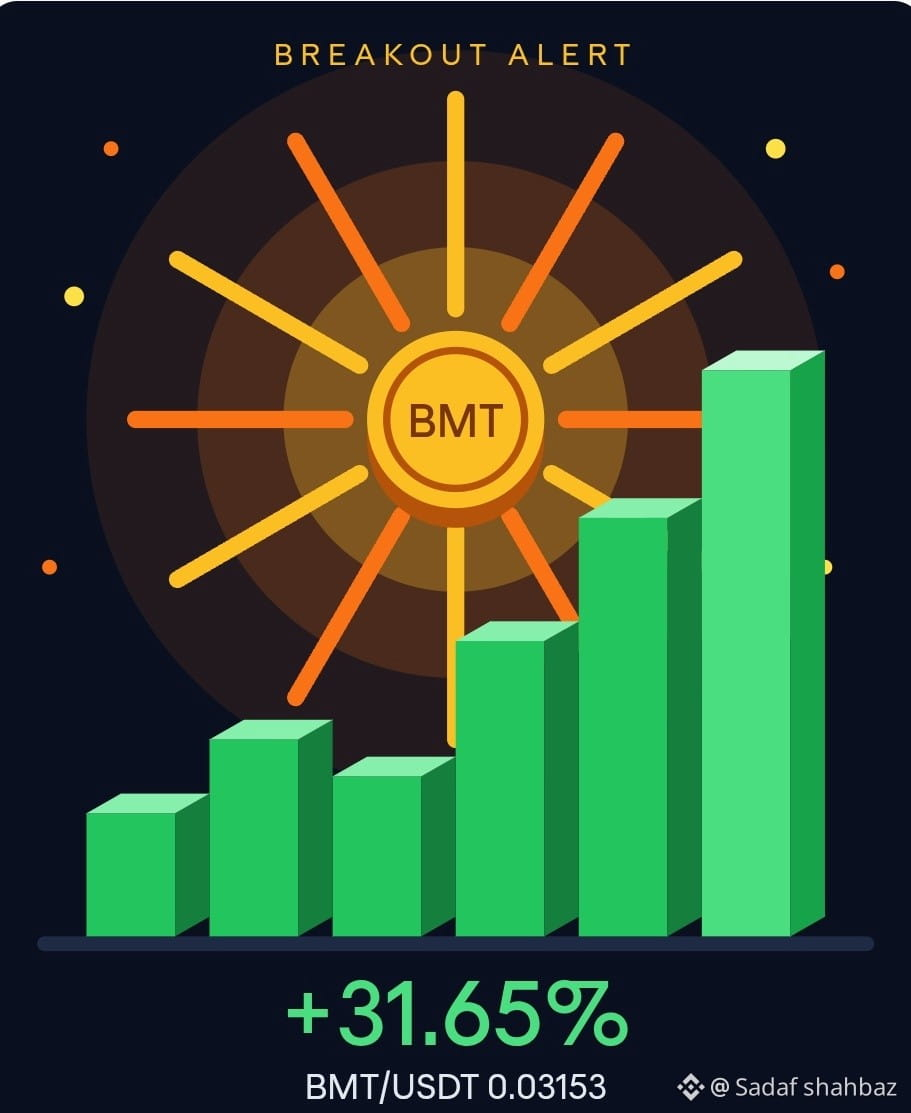
🚀 $BMT /USDT Breakout Alert!
Bubblemaps ($BMT ) is surging +31.65% to 0.03153, leading the Infrastructure Gainers with 18.49M USDT in 24h volume.
📊 4H Chart Highlights
Strong rebound from the 0.02 base
Price reclaimed MA(7), volume rising
Resistance: 0.03288, then 0.03748
Support: 0.02863
⚠️ RSI at 92 means overbought. A dip to 0.0286–0.0300 could offer a smarter entry than chasing the top.
Bulls are in control. Manage your risk! 💪
#BMT #Bubblemaps #Binance
🚀 $BMT /USDT Breakout Alert!
Bubblemaps ($BMT ) is surging +31.65% to 0.03153, leading the Infrastructure Gainers with 18.49M USDT in 24h volume.
📊 4H Chart Highlights
Strong rebound from the 0.02 base
Price reclaimed MA(7), volume rising
Resistance: 0.03288, then 0.03748
Support: 0.02863
⚠️ RSI at 92 means overbought. A dip to 0.0286–0.0300 could offer a smarter entry than chasing the top.
Bulls are in control. Manage your risk! 💪
#BMT #Bubblemaps #Binance
Bubblemaps ($BMT ) is surging +31.65% to 0.03153, leading the Infrastructure Gainers with 18.49M USDT in 24h volume.
📊 4H Chart Highlights
Strong rebound from the 0.02 base
Price reclaimed MA(7), volume rising
Resistance: 0.03288, then 0.03748
Support: 0.02863
⚠️ RSI at 92 means overbought. A dip to 0.0286–0.0300 could offer a smarter entry than chasing the top.
Bulls are in control. Manage your risk! 💪
#BMT #Bubblemaps #Binance
91
·
--
🚨 $BMT – Don't Rush Into a SHORT! A Short Squeeze Could Be Brewing! 🔥
$BMT is currently trading around $0.03162 (+35.01%), and I'm watching this setup closely.
I'm leaning BIG LONG here! 📈
🎯 Take Profit: $0.038
🛑 Stop Loss: $0.025
Here's what caught my attention: A significant amount of short liquidity is sitting above the current price, while funding rates have turned heavily negative. This suggests shorts may be getting overcrowded.
If buying pressure kicks in and price starts moving toward those liquidation zones, we could see a powerful short squeeze.
A potential 40–50% move is on the radar, although nothing is guaranteed.
I'm not chasing blindly, but this is definitely a setup worth watching. 👀
Can $BMT catch the shorts off guard? What's your move – LONG or SHORT?
#BMT #ShortSqueeze
🚨 $BMT – Don't Rush Into a SHORT! A Short Squeeze Could Be Brewing! 🔥
$BMT is currently trading around $0.03162 (+35.01%), and I'm watching this setup closely.
I'm leaning BIG LONG here! 📈
🎯 Take Profit: $0.038
🛑 Stop Loss: $0.025
Here's what caught my attention: A significant amount of short liquidity is sitting above the current price, while funding rates have turned heavily negative. This suggests shorts may be getting overcrowded.
If buying pressure kicks in and price starts moving toward those liquidation zones, we could see a powerful short squeeze.
A potential 40–50% move is on the radar, although nothing is guaranteed.
I'm not chasing blindly, but this is definitely a setup worth watching. 👀
Can $BMT catch the shorts off guard? What's your move – LONG or SHORT?
#BMT #ShortSqueeze
$BMT is currently trading around $0.03162 (+35.01%), and I'm watching this setup closely.
I'm leaning BIG LONG here! 📈
🎯 Take Profit: $0.038
🛑 Stop Loss: $0.025
Here's what caught my attention: A significant amount of short liquidity is sitting above the current price, while funding rates have turned heavily negative. This suggests shorts may be getting overcrowded.
If buying pressure kicks in and price starts moving toward those liquidation zones, we could see a powerful short squeeze.
A potential 40–50% move is on the radar, although nothing is guaranteed.
I'm not chasing blindly, but this is definitely a setup worth watching. 👀
Can $BMT catch the shorts off guard? What's your move – LONG or SHORT?
#BMT #ShortSqueeze
126
·
--
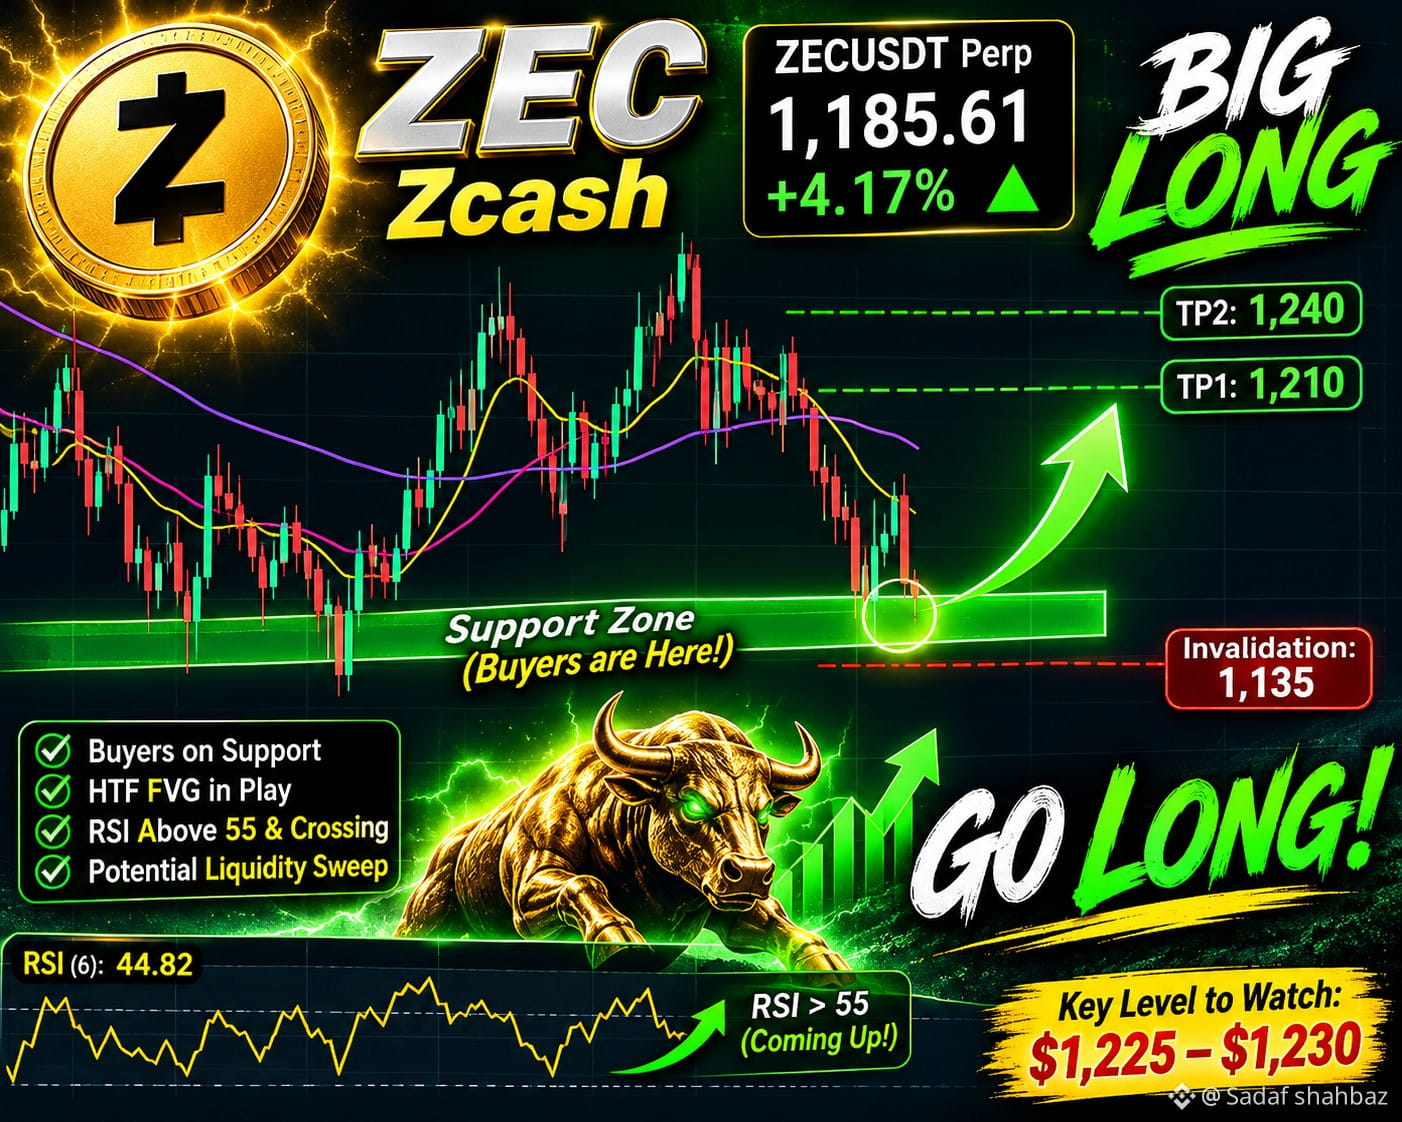
🚀 $ZEC BIG LONG SETUP – BUYERS ARE DEFENDING SUPPORT! 🔥
$ZEC is showing a potential bounce from an important support zone, and I'm watching this move closely.
Current Price: $1,185.61 (+4.17%)
Trade Direction: LONG 📈
🎯 Take Profit: $1,210 – $1,240
🛑 Invalidation: $1,135
Here's what I'm watching:
Buyers are stepping in around the $1,120–$1,150 support area, creating a possible recovery opportunity.
Volume still shows some selling pressure, while RSI is around 44.82, so confirmation is important.
The key level is $1,225–$1,230. A strong reclaim of this resistance zone could open the door toward $1,240.
I'm looking for a continuation of the bounce, not blindly calling a major trend reversal.
If support holds, ZEC could deliver another upside move! 👀🔥
What's your bias on $ZEC here — LONG or SHORT?
#zec #Zcash #cryptotrading #Binance
🚀 $ZEC BIG LONG SETUP – BUYERS ARE DEFENDING SUPPORT! 🔥
$ZEC is showing a potential bounce from an important support zone, and I'm watching this move closely.
Current Price: $1,185.61 (+4.17%)
Trade Direction: LONG 📈
🎯 Take Profit: $1,210 – $1,240
🛑 Invalidation: $1,135
Here's what I'm watching:
Buyers are stepping in around the $1,120–$1,150 support area, creating a possible recovery opportunity.
Volume still shows some selling pressure, while RSI is around 44.82, so confirmation is important.
The key level is $1,225–$1,230. A strong reclaim of this resistance zone could open the door toward $1,240.
I'm looking for a continuation of the bounce, not blindly calling a major trend reversal.
If support holds, ZEC could deliver another upside move! 👀🔥
What's your bias on $ZEC here — LONG or SHORT?
#zec #Zcash #cryptotrading #Binance
$ZEC is showing a potential bounce from an important support zone, and I'm watching this move closely.
Current Price: $1,185.61 (+4.17%)
Trade Direction: LONG 📈
🎯 Take Profit: $1,210 – $1,240
🛑 Invalidation: $1,135
Here's what I'm watching:
Buyers are stepping in around the $1,120–$1,150 support area, creating a possible recovery opportunity.
Volume still shows some selling pressure, while RSI is around 44.82, so confirmation is important.
The key level is $1,225–$1,230. A strong reclaim of this resistance zone could open the door toward $1,240.
I'm looking for a continuation of the bounce, not blindly calling a major trend reversal.
If support holds, ZEC could deliver another upside move! 👀🔥
What's your bias on $ZEC here — LONG or SHORT?
#zec #Zcash #cryptotrading #Binance
230
·
--
🚀 $CLANKER – BIG MOVE IN PROGRESS! 🔥
Guys, $CLANKER is making a powerful breakout! 👀
Currently trading around $15.53 (+38.53%), with a massive volume spike and strong bullish momentum.
📊 Key Chart Signals:
- Strong 4H breakout above moving averages.
- Volume explosion confirms increased market activity.
- Next resistance: $16.00 – $16.77.
- RSI(6): 94.67 – extremely overbought, so a pullback is possible.
👀 Eyes on $CLANKER! A healthy retest could create another opportunity.
Are you ready for the next move? 🚀💰
Don't FOMO. Watch the confirmation!
#CLANKER #Binance #BullishMomentum #trading
🚀 $CLANKER – BIG MOVE IN PROGRESS! 🔥
Guys, $CLANKER is making a powerful breakout! 👀
Currently trading around $15.53 (+38.53%), with a massive volume spike and strong bullish momentum.
📊 Key Chart Signals:
- Strong 4H breakout above moving averages.
- Volume explosion confirms increased market activity.
- Next resistance: $16.00 – $16.77.
- RSI(6): 94.67 – extremely overbought, so a pullback is possible.
👀 Eyes on $CLANKER ! A healthy retest could create another opportunity.
Are you ready for the next move? 🚀💰
Don't FOMO. Watch the confirmation!
#CLANKER #Binance #BullishMomentum #trading
Guys, $CLANKER is making a powerful breakout! 👀
Currently trading around $15.53 (+38.53%), with a massive volume spike and strong bullish momentum.
📊 Key Chart Signals:
- Strong 4H breakout above moving averages.
- Volume explosion confirms increased market activity.
- Next resistance: $16.00 – $16.77.
- RSI(6): 94.67 – extremely overbought, so a pullback is possible.
👀 Eyes on $CLANKER ! A healthy retest could create another opportunity.
Are you ready for the next move? 🚀💰
Don't FOMO. Watch the confirmation!
#CLANKER #Binance #BullishMomentum #trading

183
·
--
🚨 FTX COLLAPSE vs BINANCE HACK: Is $BTC Ready for Another Comeback?
Crypto history teaches us one important lesson: A market crash doesn't always mean the end of the opportunity.
Back in 2022, the FTX collapse pushed Bitcoin from around $20,000 to nearly $15,000, a drop of approximately 25%.
But what happened next?
Bitcoin eventually climbed from $15,000 to nearly $126,000 in 2025 — an impressive gain of around 740%.
Now, in November 2026, Binance has faced a major security incident involving approximately $6.3 billion in affected assets. Around $3 billion were reportedly frozen, and Binance committed to protecting user funds.
Unlike FTX, this was a security incident, not an exchange collapse.
Bitcoin also corrected from around $81,000 to $77,000.
📈 What Comes Next?
If BTC regains $82,500, the next potential upside targets could be:
- $84,000
- $87,000
- $90,000
Bitcoin's biggest long-term strength remains its limited supply of 21 million BTC.
💎 My Message
Don't let short-term fear control your long-term decisions.
Crypto rewards patience, discipline and proper research — not emotional trading.
I remain optimistic about Bitcoin's long-term potential, although nothing is guaranteed.
🔥 Do you believe $BTC can recover and move toward $100K again?
Share your thoughts below!
#Bitcoin #BTC #Binance #FTX #BullRun
🚨 FTX COLLAPSE vs BINANCE HACK: Is $BTC Ready for Another Comeback?
Crypto history teaches us one important lesson: A market crash doesn't always mean the end of the opportunity.
Back in 2022, the FTX collapse pushed Bitcoin from around $20,000 to nearly $15,000, a drop of approximately 25%.
But what happened next?
Bitcoin eventually climbed from $15,000 to nearly $126,000 in 2025 — an impressive gain of around 740%.
Now, in November 2026, Binance has faced a major security incident involving approximately $6.3 billion in affected assets. Around $3 billion were reportedly frozen, and Binance committed to protecting user funds.
Unlike FTX, this was a security incident, not an exchange collapse.
Bitcoin also corrected from around $81,000 to $77,000.
📈 What Comes Next?
If BTC regains $82,500, the next potential upside targets could be:
- $84,000
- $87,000
- $90,000
Bitcoin's biggest long-term strength remains its limited supply of 21 million BTC.
💎 My Message
Don't let short-term fear control your long-term decisions.
Crypto rewards patience, discipline and proper research — not emotional trading.
I remain optimistic about Bitcoin's long-term potential, although nothing is guaranteed.
🔥 Do you believe $BTC can recover and move toward $100K again?
Share your thoughts below!
#Bitcoin #BTC #Binance #FTX #BullRun
Crypto history teaches us one important lesson: A market crash doesn't always mean the end of the opportunity.
Back in 2022, the FTX collapse pushed Bitcoin from around $20,000 to nearly $15,000, a drop of approximately 25%.
But what happened next?
Bitcoin eventually climbed from $15,000 to nearly $126,000 in 2025 — an impressive gain of around 740%.
Now, in November 2026, Binance has faced a major security incident involving approximately $6.3 billion in affected assets. Around $3 billion were reportedly frozen, and Binance committed to protecting user funds.
Unlike FTX, this was a security incident, not an exchange collapse.
Bitcoin also corrected from around $81,000 to $77,000.
📈 What Comes Next?
If BTC regains $82,500, the next potential upside targets could be:
- $84,000
- $87,000
- $90,000
Bitcoin's biggest long-term strength remains its limited supply of 21 million BTC.
💎 My Message
Don't let short-term fear control your long-term decisions.
Crypto rewards patience, discipline and proper research — not emotional trading.
I remain optimistic about Bitcoin's long-term potential, although nothing is guaranteed.
🔥 Do you believe $BTC can recover and move toward $100K again?
Share your thoughts below!
#Bitcoin #BTC #Binance #FTX #BullRun

63
·
--

Article
🚨FTX COLLAPSE vs BINANCE HACK: Is Bitcoin Preparing for Another Major Comeback?History teaches us one important lesson: Every major crisis in crypto doesn't necessarily mean the end of the market. Sometimes, it creates opportunities for long-term investors.
Let's compare the 2022 FTX collapse with the 2026 Binance hack.
📉 1. FTX Collapse – 2022
Before the FTX collapse, Bitcoin was trading around $20,000. Following the crisis, BTC dropped to nearly $15,000, representing approximately a 25% decline.
But what happened next?
$BTC recovered from $15,000 and eventually reached around $126,000 in 2025.
That's an impressive gain of approximately 740% from the bottom!
The market experienced fear, uncertainty and panic, but Bitcoin eventually made a remarkable comeback.
🚨 2. Binance Hack – 2026
Now look at the current situation.
Binance experienced a major security incident involving approximately $6.3 billion in affected digital assets.
However, there are important differences:
Around $3 billion in affected assets were reportedly frozen.Binance stated that user funds remained protected.The company committed resources to covering the affected losses.Unlike FTX, this was a security incident, not an exchange collapse.Following the news, Bitcoin dropped from approximately $81,000 to $77,000, a decline of roughly 5%.
📊 3. What Could Happen Next?
Here's the question worth thinking about:
If Bitcoin managed to recover from the FTX disaster and eventually reached $126,000, could it also recover from the Binance incident?
In my opinion, a recovery remains possible.
If BTC reclaims the $81,000–$82,500 resistance zone, we could potentially see the next targets around:
$84,000
$87,000
$90,000
Of course, these are potential bullish targets, not guaranteed outcomes. Further corrections remain possible.
💎 4. Never Ignore Bitcoin's Long-Term Potential
One of Bitcoin's strongest fundamentals is its limited supply.
Maximum Supply: 21 Million $BTC .
Unlike traditional currencies, Bitcoin has a predetermined supply limit. Its scarcity, decentralization and growing global adoption make it an important long-term digital asset.
As demand grows while supply remains limited, Bitcoin could become increasingly valuable over time.
🔥My Final Thoughts
I believe many investors make the mistake of judging the entire crypto market based on short-term fear.
Remember:
Crypto markets often transfer wealth from impatient participants to disciplined, patient investors over the long run.
That doesn't mean buying blindly or ignoring risk. It means understanding market history, doing proper research and making decisions based on facts rather than emotions.
Bitcoin's long-term story is far from over.
💬 What do you think? Can $BTC recover from the Binance incident and make another run toward $100,000 and beyond?
Share your thoughts below!
#Bitcoin #BTC #Binance #FTX #Bullrun
🚨FTX COLLAPSE vs BINANCE HACK: Is Bitcoin Preparing for Another Major Comeback?
History teaches us one important lesson: Every major crisis in crypto doesn't necessarily mean the end of the market. Sometimes, it creates opportunities for long-term investors.
Let's compare the 2022 FTX collapse with the 2026 Binance hack.
📉 1. FTX Collapse – 2022
Before the FTX collapse, Bitcoin was trading around $20,000. Following the crisis, BTC dropped to nearly $15,000, representing approximately a 25% decline.
But what happened next?
$BTC recovered from $15,000 and eventually reached around $126,000 in 2025.
That's an impressive gain of approximately 740% from the bottom!
The market experienced fear, uncertainty and panic, but Bitcoin eventually made a remarkable comeback.
🚨 2. Binance Hack – 2026
Now look at the current situation.
Binance experienced a major security incident involving approximately $6.3 billion in affected digital assets.
However, there are important differences:
Around $3 billion in affected assets were reportedly frozen.Binance stated that user funds remained protected.The company committed resources to covering the affected losses.Unlike FTX, this was a security incident, not an exchange collapse.Following the news, Bitcoin dropped from approximately $81,000 to $77,000, a decline of roughly 5%.
📊 3. What Could Happen Next?
Here's the question worth thinking about:
If Bitcoin managed to recover from the FTX disaster and eventually reached $126,000, could it also recover from the Binance incident?
In my opinion, a recovery remains possible.
If BTC reclaims the $81,000–$82,500 resistance zone, we could potentially see the next targets around:
$84,000
$87,000
$90,000
Of course, these are potential bullish targets, not guaranteed outcomes. Further corrections remain possible.
💎 4. Never Ignore Bitcoin's Long-Term Potential
One of Bitcoin's strongest fundamentals is its limited supply.
Maximum Supply: 21 Million $BTC .
Unlike traditional currencies, Bitcoin has a predetermined supply limit. Its scarcity, decentralization and growing global adoption make it an important long-term digital asset.
As demand grows while supply remains limited, Bitcoin could become increasingly valuable over time.
🔥My Final Thoughts
I believe many investors make the mistake of judging the entire crypto market based on short-term fear.
Remember:
Crypto markets often transfer wealth from impatient participants to disciplined, patient investors over the long run.
That doesn't mean buying blindly or ignoring risk. It means understanding market history, doing proper research and making decisions based on facts rather than emotions.
Bitcoin's long-term story is far from over.
💬 What do you think? Can $BTC recover from the Binance incident and make another run toward $100,000 and beyond?
Share your thoughts below!
#Bitcoin #BTC #Binance #FTX #Bullrun
Let's compare the 2022 FTX collapse with the 2026 Binance hack.
📉 1. FTX Collapse – 2022
Before the FTX collapse, Bitcoin was trading around $20,000. Following the crisis, BTC dropped to nearly $15,000, representing approximately a 25% decline.
But what happened next?
$BTC recovered from $15,000 and eventually reached around $126,000 in 2025.
That's an impressive gain of approximately 740% from the bottom!
The market experienced fear, uncertainty and panic, but Bitcoin eventually made a remarkable comeback.
🚨 2. Binance Hack – 2026
Now look at the current situation.
Binance experienced a major security incident involving approximately $6.3 billion in affected digital assets.
However, there are important differences:
Around $3 billion in affected assets were reportedly frozen.Binance stated that user funds remained protected.The company committed resources to covering the affected losses.Unlike FTX, this was a security incident, not an exchange collapse.Following the news, Bitcoin dropped from approximately $81,000 to $77,000, a decline of roughly 5%.
📊 3. What Could Happen Next?
Here's the question worth thinking about:
If Bitcoin managed to recover from the FTX disaster and eventually reached $126,000, could it also recover from the Binance incident?
In my opinion, a recovery remains possible.
If BTC reclaims the $81,000–$82,500 resistance zone, we could potentially see the next targets around:
$84,000
$87,000
$90,000
Of course, these are potential bullish targets, not guaranteed outcomes. Further corrections remain possible.
💎 4. Never Ignore Bitcoin's Long-Term Potential
One of Bitcoin's strongest fundamentals is its limited supply.
Maximum Supply: 21 Million $BTC .
Unlike traditional currencies, Bitcoin has a predetermined supply limit. Its scarcity, decentralization and growing global adoption make it an important long-term digital asset.
As demand grows while supply remains limited, Bitcoin could become increasingly valuable over time.
🔥My Final Thoughts
I believe many investors make the mistake of judging the entire crypto market based on short-term fear.
Remember:
Crypto markets often transfer wealth from impatient participants to disciplined, patient investors over the long run.
That doesn't mean buying blindly or ignoring risk. It means understanding market history, doing proper research and making decisions based on facts rather than emotions.
Bitcoin's long-term story is far from over.
💬 What do you think? Can $BTC recover from the Binance incident and make another run toward $100,000 and beyond?
Share your thoughts below!
#Bitcoin #BTC #Binance #FTX #Bullrun
2
990
Log in to explore more content
Join global crypto users on Binance Square
⚡️ Get latest and useful information about crypto.
💬 Trusted by the world’s largest crypto exchange.
👍 Discover real insights from verified creators.
Email / Phone number
Trending Topics
JobsReportRaisesHikeOdds
428,505 views
3,013 Discussing
TradFi News | US Adds 165,000 Jobs in October, More Than Double the 65,000 Forecast, as Unemployment Falls to 4.1%
Binance News
·41 Likes
·23.9k views
CPITestsDecemberRateOutlook
104,947 views
925 Discussing
BitcoinRebounds$75KAsChipsLead
37,058 views
305 Discussing