
#altcoinmarket
altcoinmarket
142,322 views
782 Discussing
Hot
Latest

⚡ SOLANA SHORTS ARE FEELING THE PRESSURE — $91.1K LIQUIDATED!
Solana is showing an interesting shift in trading pressure! Around $91,100 in short positions were liquidated at $91.12, suggesting bearish traders were caught as price moved against them.
This could be an early sign of bullish momentum building. If buyers maintain control, forced short covering may provide additional fuel for an upside move.
🐂 SOL Market Pulse
Here are the price zones worth monitoring:
- Short Liquidation Reference: $91.12
- Immediate Support: $90.50–$90.80
- Major Support: $89.50–$90.00
- First Resistance: $92.00–$92.60
- Breakout Zone: $93.50–$94.00
🔥 My SOL Price Outlook
My short-term bias leans bullish as long as SOL holds above $90.50.
🟢 Upside Scenario: A clean break above $92.60 could attract additional momentum, opening a possible move toward $93.50 and $94.00.
🔴 Downside Risk: If SOL slips below $90.50, bullish momentum could fade, bringing $90.00 and $89.50 into focus.
🎯 Trading Strategy
I would watch the $92.60 resistance for a confirmed breakout rather than entering prematurely.
- Above $92.60: Bullish continuation opportunity.
- Below $90.50: Reassess the bullish setup.
- Between these levels: Wait for a decisive move.
My Verdict: The $91.1K short liquidation gives SOL bulls an encouraging signal, but the real test is whether buyers can sustain momentum above $92.60. Another short squeeze could follow if resistance gives way.
⚠️ Trade with a defined stop-loss and avoid excessive leverage. These are illustrative technical scenarios, not verified live price levels or guaranteed predictions.
#SOL #Solana #CryptoTrading #SolanaSignals #ShortSqueeze #LiquidationAlert #AltcoinMarket
#JobsReportRaisesHikeOdds #CPITestsDecemberRateOutlook #WillAnthropicListOnTime #HKSFCPlansToRestrictCryptoAndExchangeTerms
{spot}(SOLUSDT)
⚡ SOLANA SHORTS ARE FEELING THE PRESSURE — $91.1K LIQUIDATED!
Solana is showing an interesting shift in trading pressure! Around $91,100 in short positions were liquidated at $91.12, suggesting bearish traders were caught as price moved against them.
This could be an early sign of bullish momentum building. If buyers maintain control, forced short covering may provide additional fuel for an upside move.
🐂 SOL Market Pulse
Here are the price zones worth monitoring:
- Short Liquidation Reference: $91.12
- Immediate Support: $90.50–$90.80
- Major Support: $89.50–$90.00
- First Resistance: $92.00–$92.60
- Breakout Zone: $93.50–$94.00
🔥 My SOL Price Outlook
My short-term bias leans bullish as long as SOL holds above $90.50.
🟢 Upside Scenario: A clean break above $92.60 could attract additional momentum, opening a possible move toward $93.50 and $94.00.
🔴 Downside Risk: If SOL slips below $90.50, bullish momentum could fade, bringing $90.00 and $89.50 into focus.
🎯 Trading Strategy
I would watch the $92.60 resistance for a confirmed breakout rather than entering prematurely.
- Above $92.60: Bullish continuation opportunity.
- Below $90.50: Reassess the bullish setup.
- Between these levels: Wait for a decisive move.
My Verdict: The $91.1K short liquidation gives SOL bulls an encouraging signal, but the real test is whether buyers can sustain momentum above $92.60. Another short squeeze could follow if resistance gives way.
⚠️ Trade with a defined stop-loss and avoid excessive leverage. These are illustrative technical scenarios, not verified live price levels or guaranteed predictions.
#SOL #Solana #CryptoTrading #SolanaSignals #ShortSqueeze #LiquidationAlert #AltcoinMarket
#JobsReportRaisesHikeOdds #CPITestsDecemberRateOutlook #WillAnthropicListOnTime #HKSFCPlansToRestrictCryptoAndExchangeTerms
Solana is showing an interesting shift in trading pressure! Around $91,100 in short positions were liquidated at $91.12, suggesting bearish traders were caught as price moved against them.
This could be an early sign of bullish momentum building. If buyers maintain control, forced short covering may provide additional fuel for an upside move.
🐂 SOL Market Pulse
Here are the price zones worth monitoring:
- Short Liquidation Reference: $91.12
- Immediate Support: $90.50–$90.80
- Major Support: $89.50–$90.00
- First Resistance: $92.00–$92.60
- Breakout Zone: $93.50–$94.00
🔥 My SOL Price Outlook
My short-term bias leans bullish as long as SOL holds above $90.50.
🟢 Upside Scenario: A clean break above $92.60 could attract additional momentum, opening a possible move toward $93.50 and $94.00.
🔴 Downside Risk: If SOL slips below $90.50, bullish momentum could fade, bringing $90.00 and $89.50 into focus.
🎯 Trading Strategy
I would watch the $92.60 resistance for a confirmed breakout rather than entering prematurely.
- Above $92.60: Bullish continuation opportunity.
- Below $90.50: Reassess the bullish setup.
- Between these levels: Wait for a decisive move.
My Verdict: The $91.1K short liquidation gives SOL bulls an encouraging signal, but the real test is whether buyers can sustain momentum above $92.60. Another short squeeze could follow if resistance gives way.
⚠️ Trade with a defined stop-loss and avoid excessive leverage. These are illustrative technical scenarios, not verified live price levels or guaranteed predictions.
#SOL #Solana #CryptoTrading #SolanaSignals #ShortSqueeze #LiquidationAlert #AltcoinMarket
#JobsReportRaisesHikeOdds #CPITestsDecemberRateOutlook #WillAnthropicListOnTime #HKSFCPlansToRestrictCryptoAndExchangeTerms
2

With Bitcoin dominance remaining elevated, altcoin traders need to be selective. Watch whether capital starts rotating into smaller market sectors.
$YFI : Yearn Finance is worth monitoring for changes in liquidity and market momentum.
$TWT : Trust Wallet Token could attract attention if buying pressure improves.
$OGN : Watch its price structure for a possible recovery signal.
#YFI #TWT #OGN #AltcoinMarket #tradingIdeas
With Bitcoin dominance remaining elevated, altcoin traders need to be selective. Watch whether capital starts rotating into smaller market sectors.
$YFI : Yearn Finance is worth monitoring for changes in liquidity and market momentum.
$TWT : Trust Wallet Token could attract attention if buying pressure improves.
$OGN : Watch its price structure for a possible recovery signal.
#YFI #TWT #OGN #AltcoinMarket #tradingIdeas
$YFI : Yearn Finance is worth monitoring for changes in liquidity and market momentum.
$TWT : Trust Wallet Token could attract attention if buying pressure improves.
$OGN : Watch its price structure for a possible recovery signal.
#YFI #TWT #OGN #AltcoinMarket #tradingIdeas
13
Layer 2 tokens are also exposed to changing market sentiment. Traders should look for signs of accumulation instead of assuming every dip will recover.
$ARB : Arbitrum needs stronger momentum to regain important resistance levels.
$OP : Optimism remains worth monitoring for a potential breakout after consolidation.
$NEAR : NEAR traders should watch volume and support reactions for an early recovery signal.
#ARB #OP #NEAR #Layer2 #AltcoinMarket
Layer 2 tokens are also exposed to changing market sentiment. Traders should look for signs of accumulation instead of assuming every dip will recover.
$ARB : Arbitrum needs stronger momentum to regain important resistance levels.
$OP : Optimism remains worth monitoring for a potential breakout after consolidation.
$NEAR : NEAR traders should watch volume and support reactions for an early recovery signal.
#ARB #OP #NEAR #Layer2 #AltcoinMarket
$ARB : Arbitrum needs stronger momentum to regain important resistance levels.
$OP : Optimism remains worth monitoring for a potential breakout after consolidation.
$NEAR : NEAR traders should watch volume and support reactions for an early recovery signal.
#ARB #OP #NEAR #Layer2 #AltcoinMarket
10

LSK Records a Strong Daily Move!
LSK is showing positive momentum with a 12.32% gain over the past 24 hours.
Market participants are keeping an eye on its trading volume and price stability to see whether this move can continue.
Will bullish momentum stay strong?
#LSK #CryptoGainers #AltcoinMarket #BinanceSquare
LSK Records a Strong Daily Move!
LSK is showing positive momentum with a 12.32% gain over the past 24 hours.
Market participants are keeping an eye on its trading volume and price stability to see whether this move can continue.
Will bullish momentum stay strong?
#LSK #CryptoGainers #AltcoinMarket #BinanceSquare
LSK is showing positive momentum with a 12.32% gain over the past 24 hours.
Market participants are keeping an eye on its trading volume and price stability to see whether this move can continue.
Will bullish momentum stay strong?
#LSK #CryptoGainers #AltcoinMarket #BinanceSquare
1
201

·
--
🚨 ALTCOIN MARKET WATCH: Is This Pullback Creating a New Opportunity for Stronger Altcoin Narratives?
The altcoin market is facing renewed selling pressure as investors remain cautious following recent security concerns and broader market uncertainty.
However, not every project is moving for the same reason. Let's look at three altcoins worth monitoring.
🔍 3 Altcoins Under the Spotlight
🔹 $HBAR (Hedera) – HBAR recently declined around 3% amid broader altcoin weakness. Its ability to stabilize could be an important signal for market sentiment.
🔹 $XLM (Stellar) – XLM has also experienced selling pressure, with recent reports showing a decline of approximately 3.39%. Traders are watching whether demand returns.
🔹 $PYTH (Pyth Network) – PYTH recorded a sharper decline of around 5.64% in recent market updates. Its next recovery attempt deserves attention.
📊 What Matters Next?
Can buyers regain control of the altcoin market?
Will infrastructure tokens show relative strength?
Is the current weakness temporary or part of a deeper correction?
💬 Community Question:
Which of these three projects do you think could demonstrate the strongest recovery in November: HBAR, XLM, or PYTH?
Share your analysis in the comments!
#AltcoinMarket #CryptoAnalysis #BlockchainNews #MarketOutlook #BinanceSquare
{future}(HBARUSDT)
{future}(XLMUSDT)
{future}(PYTHUSDT)
🚨 ALTCOIN MARKET WATCH: Is This Pullback Creating a New Opportunity for Stronger Altcoin Narratives?
The altcoin market is facing renewed selling pressure as investors remain cautious following recent security concerns and broader market uncertainty.
However, not every project is moving for the same reason. Let's look at three altcoins worth monitoring.
🔍 3 Altcoins Under the Spotlight
🔹 $HBAR (Hedera) – HBAR recently declined around 3% amid broader altcoin weakness. Its ability to stabilize could be an important signal for market sentiment.
🔹 $XLM (Stellar) – XLM has also experienced selling pressure, with recent reports showing a decline of approximately 3.39%. Traders are watching whether demand returns.
🔹 $PYTH (Pyth Network) – PYTH recorded a sharper decline of around 5.64% in recent market updates. Its next recovery attempt deserves attention.
📊 What Matters Next?
Can buyers regain control of the altcoin market?
Will infrastructure tokens show relative strength?
Is the current weakness temporary or part of a deeper correction?
💬 Community Question:
Which of these three projects do you think could demonstrate the strongest recovery in November: HBAR, XLM, or PYTH?
Share your analysis in the comments!
#AltcoinMarket #CryptoAnalysis #BlockchainNews #MarketOutlook #BinanceSquare
The altcoin market is facing renewed selling pressure as investors remain cautious following recent security concerns and broader market uncertainty.
However, not every project is moving for the same reason. Let's look at three altcoins worth monitoring.
🔍 3 Altcoins Under the Spotlight
🔹 $HBAR (Hedera) – HBAR recently declined around 3% amid broader altcoin weakness. Its ability to stabilize could be an important signal for market sentiment.
🔹 $XLM (Stellar) – XLM has also experienced selling pressure, with recent reports showing a decline of approximately 3.39%. Traders are watching whether demand returns.
🔹 $PYTH (Pyth Network) – PYTH recorded a sharper decline of around 5.64% in recent market updates. Its next recovery attempt deserves attention.
📊 What Matters Next?
Can buyers regain control of the altcoin market?
Will infrastructure tokens show relative strength?
Is the current weakness temporary or part of a deeper correction?
💬 Community Question:
Which of these three projects do you think could demonstrate the strongest recovery in November: HBAR, XLM, or PYTH?
Share your analysis in the comments!
#AltcoinMarket #CryptoAnalysis #BlockchainNews #MarketOutlook #BinanceSquare

2
508

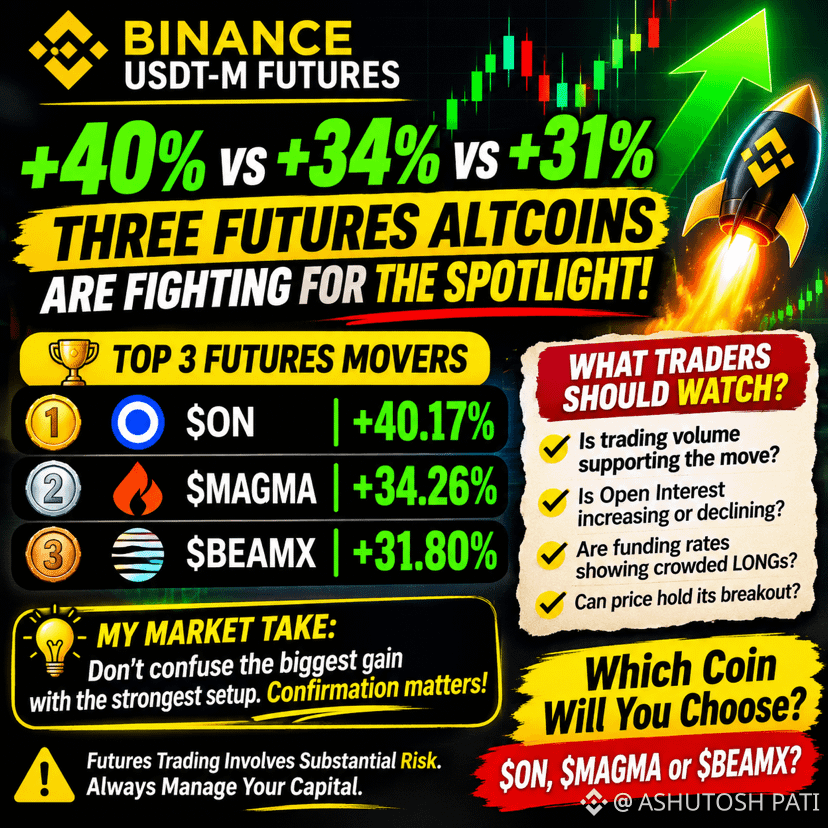
🚨 +40% vs +34% vs +31% — THREE FUTURES ALTCOINS ARE FIGHTING FOR THE SPOTLIGHT!
The biggest question isn’t which coin pumped the hardest. It’s which one can actually HOLD its gains. 👀
📈 TOP 3 BINANCE USDⓈ-M FUTURES MOVERS
🥇 $ON — +40.17%
🥈 $MAGMA — +34.26%
🥉 $BEAMX — +31.80%
🔥 WHAT TRADERS SHOULD WATCH:
A sharp rally can attract momentum traders, but it can also bring aggressive profit-taking.
Before entering, check:
• Is trading volume supporting the move?
• Is Open Interest increasing or declining?
• Are funding rates showing crowded LONG positions?
• Can price hold its breakout instead of quickly reversing?
🎯 MY MARKET TAKE:
Don’t confuse the biggest percentage gain with the strongest trading setup. Confirmation matters more than excitement.
💬 Which of these three would you put on your watchlist — $ON, $MAGMA or $BEAMX?
⚠️ Futures trading involves substantial risk. Always manage position size and protect your capital.
#BinanceFutures #AltcoinMarket #CryptoTrading
🚨 +40% vs +34% vs +31% — THREE FUTURES ALTCOINS ARE FIGHTING FOR THE SPOTLIGHT!
The biggest question isn’t which coin pumped the hardest. It’s which one can actually HOLD its gains. 👀
📈 TOP 3 BINANCE USDⓈ-M FUTURES MOVERS
🥇 $ON — +40.17%
🥈 $MAGMA — +34.26%
🥉 $BEAMX — +31.80%
🔥 WHAT TRADERS SHOULD WATCH:
A sharp rally can attract momentum traders, but it can also bring aggressive profit-taking.
Before entering, check:
• Is trading volume supporting the move?
• Is Open Interest increasing or declining?
• Are funding rates showing crowded LONG positions?
• Can price hold its breakout instead of quickly reversing?
🎯 MY MARKET TAKE:
Don’t confuse the biggest percentage gain with the strongest trading setup. Confirmation matters more than excitement.
💬 Which of these three would you put on your watchlist — $ON, $MAGMA or $BEAMX?
⚠️ Futures trading involves substantial risk. Always manage position size and protect your capital.
#BinanceFutures #AltcoinMarket #CryptoTrading
The biggest question isn’t which coin pumped the hardest. It’s which one can actually HOLD its gains. 👀
📈 TOP 3 BINANCE USDⓈ-M FUTURES MOVERS
🥇 $ON — +40.17%
🥈 $MAGMA — +34.26%
🥉 $BEAMX — +31.80%
🔥 WHAT TRADERS SHOULD WATCH:
A sharp rally can attract momentum traders, but it can also bring aggressive profit-taking.
Before entering, check:
• Is trading volume supporting the move?
• Is Open Interest increasing or declining?
• Are funding rates showing crowded LONG positions?
• Can price hold its breakout instead of quickly reversing?
🎯 MY MARKET TAKE:
Don’t confuse the biggest percentage gain with the strongest trading setup. Confirmation matters more than excitement.
💬 Which of these three would you put on your watchlist — $ON, $MAGMA or $BEAMX?
⚠️ Futures trading involves substantial risk. Always manage position size and protect your capital.
#BinanceFutures #AltcoinMarket #CryptoTrading
4
1.1k

·
--
$SENT IS ON THE GAINERS LIST!
$SENT is showing a 5.26% gain, but its current price was not included in the snapshot. Exact trading levels need price confirmation.
• Current Price: Not provided
• Entry Point: Awaiting confirmation
• EP: Pending
• TP1: Pending
• TP2: Pending
• TP3: Pending
• SL: Pending
#SENT #CryptoWatch #AltcoinMarket #Trading
$SENT IS ON THE GAINERS LIST!
$SENT is showing a 5.26% gain, but its current price was not included in the snapshot. Exact trading levels need price confirmation.
• Current Price: Not provided
• Entry Point: Awaiting confirmation
• EP: Pending
• TP1: Pending
• TP2: Pending
• TP3: Pending
• SL: Pending
#SENT #CryptoWatch #AltcoinMarket #Trading
$SENT is showing a 5.26% gain, but its current price was not included in the snapshot. Exact trading levels need price confirmation.
• Current Price: Not provided
• Entry Point: Awaiting confirmation
• EP: Pending
• TP1: Pending
• TP2: Pending
• TP3: Pending
• SL: Pending
#SENT #CryptoWatch #AltcoinMarket #Trading
2
94

·
--
AI altcoins could face steep drops, warns analyst.
Ali Martinez mapped bearish chart setups for Venice Token (VVV), OriginTrail (TRAC) and AI Rig Complex (ARC), calling the sector “in big trouble.”
• Venice Token shows a head‑and‑shoulders pattern.
Neckline near $21; a four‑hour close below would confirm reversal and could send VVV to $13 or $11.
CoinGecko lists VVV around $24, about 16% above the neckline, after a 30‑day decline of over 18% and sitting 29% below its September 21 all‑time high of $35, while still up roughly 1,500% from a year ago.
• OriginTrail trades inside a descending triangle with a floor near $0.38.
A four‑hour close under that floor could trigger a move to $0.26.
TRAC is currently around $0.36, daily volume $6.5 million, and down 9.5% in the past week.
• AI Rig Complex bounced from the bottom of its channel near $0.030 to the mid‑range around $0.060.
Rejection there could push ARC back to $0.014 or $0.0075.
ARC sits near $0.06, posted a 44.5% weekly gain, yet is down 14.5% over the past month.
Bitcoin hovered near $81,000 and the total crypto market cap slipped below $2.7 trillion.
Do you think these technical levels will hold, or could the AI altcoin sector stabilize soon?
#Crypto #AIAltcoins #TechnicalAnalysis #AltcoinMarket
AI altcoins could face steep drops, warns analyst.
Ali Martinez mapped bearish chart setups for Venice Token (VVV), OriginTrail (TRAC) and AI Rig Complex (ARC), calling the sector “in big trouble.”
• Venice Token shows a head‑and‑shoulders pattern.
Neckline near $21; a four‑hour close below would confirm reversal and could send VVV to $13 or $11.
CoinGecko lists VVV around $24, about 16% above the neckline, after a 30‑day decline of over 18% and sitting 29% below its September 21 all‑time high of $35, while still up roughly 1,500% from a year ago.
• OriginTrail trades inside a descending triangle with a floor near $0.38.
A four‑hour close under that floor could trigger a move to $0.26.
TRAC is currently around $0.36, daily volume $6.5 million, and down 9.5% in the past week.
• AI Rig Complex bounced from the bottom of its channel near $0.030 to the mid‑range around $0.060.
Rejection there could push ARC back to $0.014 or $0.0075.
ARC sits near $0.06, posted a 44.5% weekly gain, yet is down 14.5% over the past month.
Bitcoin hovered near $81,000 and the total crypto market cap slipped below $2.7 trillion.
Do you think these technical levels will hold, or could the AI altcoin sector stabilize soon?
#Crypto #AIAltcoins #TechnicalAnalysis #AltcoinMarket
Ali Martinez mapped bearish chart setups for Venice Token (VVV), OriginTrail (TRAC) and AI Rig Complex (ARC), calling the sector “in big trouble.”
• Venice Token shows a head‑and‑shoulders pattern.
Neckline near $21; a four‑hour close below would confirm reversal and could send VVV to $13 or $11.
CoinGecko lists VVV around $24, about 16% above the neckline, after a 30‑day decline of over 18% and sitting 29% below its September 21 all‑time high of $35, while still up roughly 1,500% from a year ago.
• OriginTrail trades inside a descending triangle with a floor near $0.38.
A four‑hour close under that floor could trigger a move to $0.26.
TRAC is currently around $0.36, daily volume $6.5 million, and down 9.5% in the past week.
• AI Rig Complex bounced from the bottom of its channel near $0.030 to the mid‑range around $0.060.
Rejection there could push ARC back to $0.014 or $0.0075.
ARC sits near $0.06, posted a 44.5% weekly gain, yet is down 14.5% over the past month.
Bitcoin hovered near $81,000 and the total crypto market cap slipped below $2.7 trillion.
Do you think these technical levels will hold, or could the AI altcoin sector stabilize soon?
#Crypto #AIAltcoins #TechnicalAnalysis #AltcoinMarket

49

·
--
Bullish
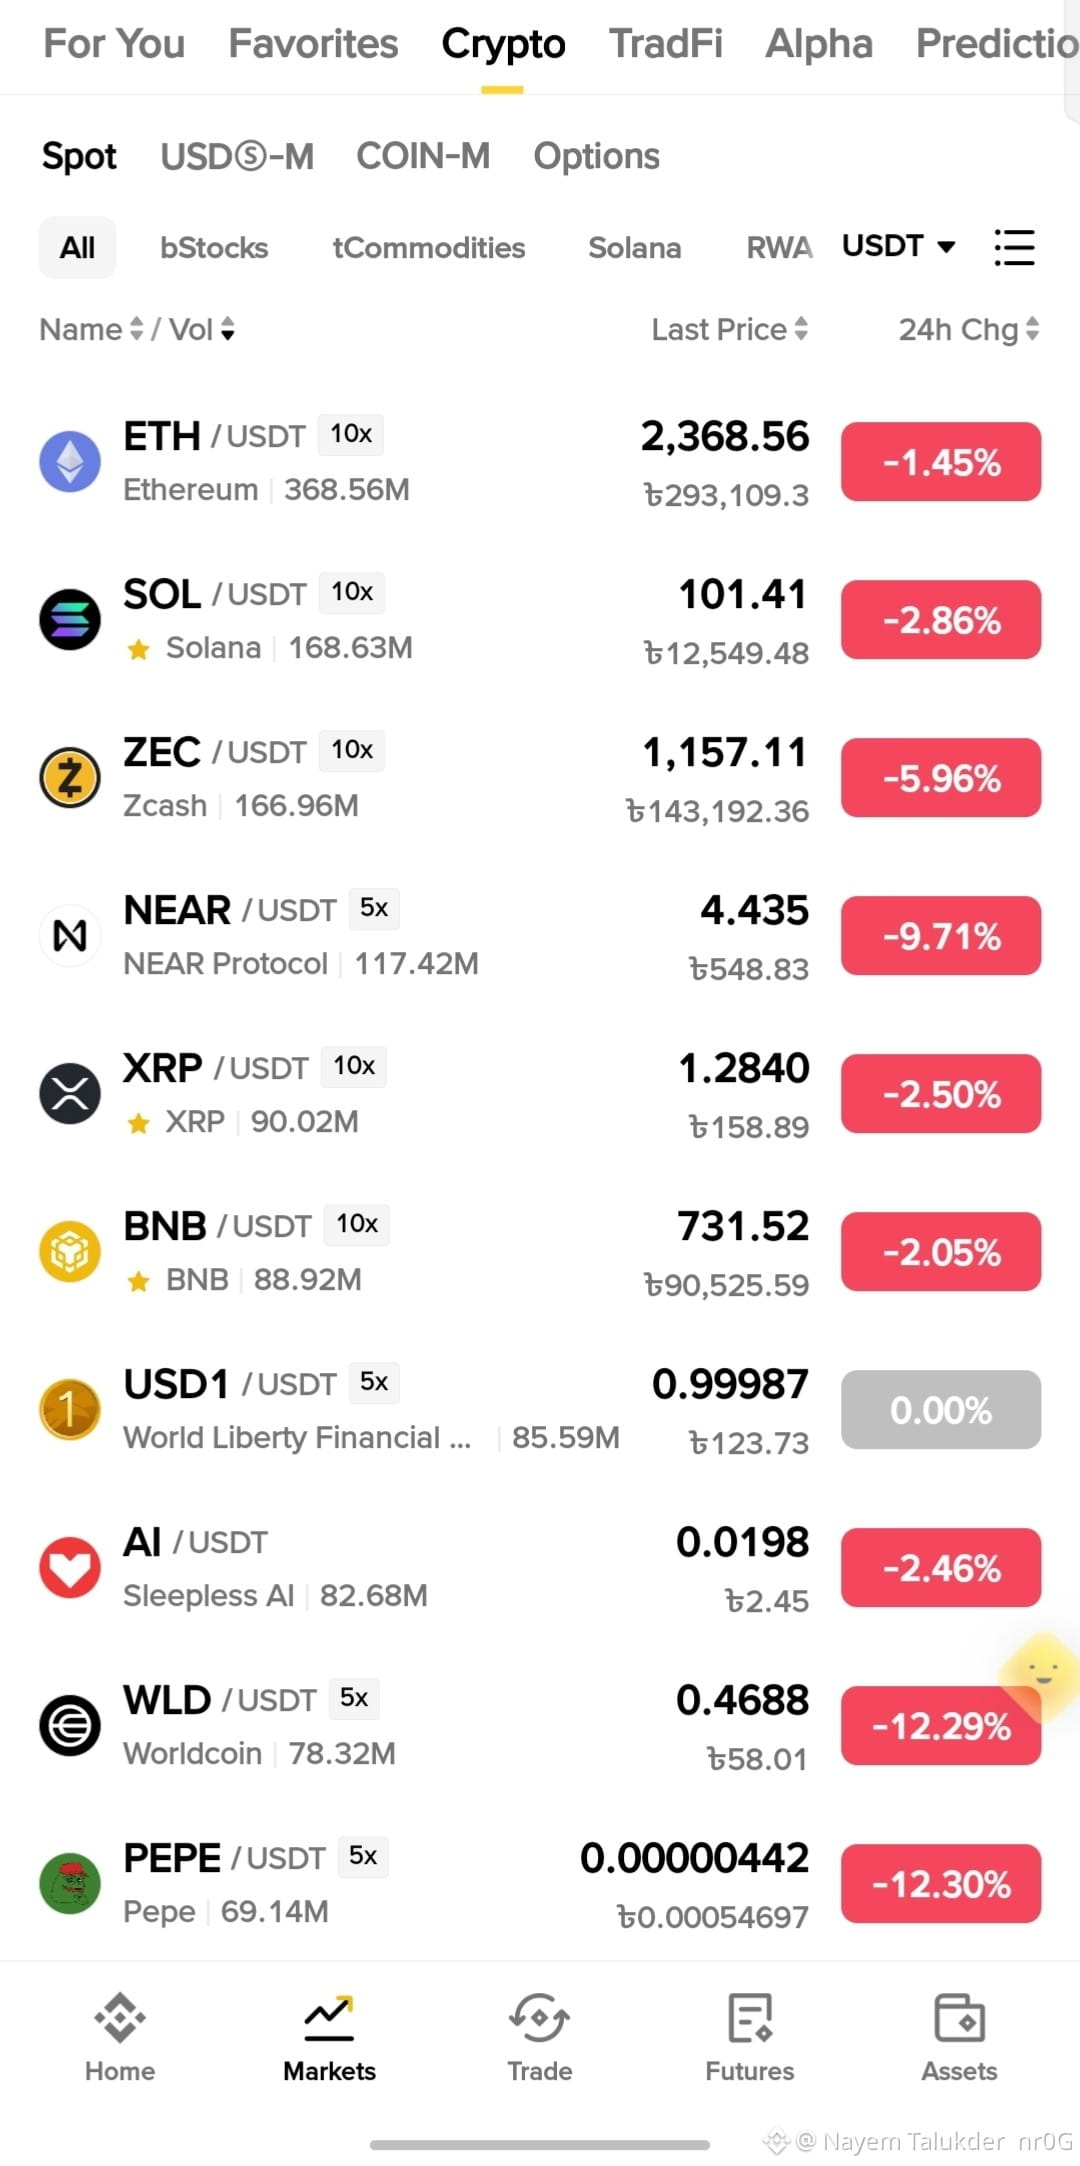
🔴 Red Market Alert: Altcoins Bleeding Today! 📉
The crypto market is taking a hit today, with major altcoins witnessing a significant pull-back.
💥 Top Movers Snapshot:
• $ETH: $2,368.56 (-1.45%)
• $SOL: $101.41 (-2.86%)
• $NEAR: $4.435 (-9.71%)
• $WLD: $0.4688 (-12.29%)
• $PEPE: $0.00000442 (-12.30%)
🧠 Strategy for Today:
• Avoid panic selling if you are holding in Spot.
• Look for strong support confirmation before scaling in (DCA).
• Strict Stop-Loss for Leverage/Futures Traders!
Are you Buying the Dip or waiting for lower targets? Let us know below! 👇
#CryptoNews #BinanceSquare #ETH #SOL #AltcoinMarket #CryptoNewss #Binance
{spot}(SOLUSDT)
{spot}(PEPEUSDT)
{spot}(WLDUSDT)
🔴 Red Market Alert: Altcoins Bleeding Today! 📉
The crypto market is taking a hit today, with major altcoins witnessing a significant pull-back.
💥 Top Movers Snapshot:
• $ETH: $2,368.56 (-1.45%)
• $SOL: $101.41 (-2.86%)
• $NEAR: $4.435 (-9.71%)
• $WLD: $0.4688 (-12.29%)
• $PEPE: $0.00000442 (-12.30%)
🧠 Strategy for Today:
• Avoid panic selling if you are holding in Spot.
• Look for strong support confirmation before scaling in (DCA).
• Strict Stop-Loss for Leverage/Futures Traders!
Are you Buying the Dip or waiting for lower targets? Let us know below! 👇
#CryptoNews #BinanceSquare #ETH #SOL #AltcoinMarket #CryptoNewss #Binance
The crypto market is taking a hit today, with major altcoins witnessing a significant pull-back.
💥 Top Movers Snapshot:
• $ETH: $2,368.56 (-1.45%)
• $SOL: $101.41 (-2.86%)
• $NEAR: $4.435 (-9.71%)
• $WLD: $0.4688 (-12.29%)
• $PEPE: $0.00000442 (-12.30%)
🧠 Strategy for Today:
• Avoid panic selling if you are holding in Spot.
• Look for strong support confirmation before scaling in (DCA).
• Strict Stop-Loss for Leverage/Futures Traders!
Are you Buying the Dip or waiting for lower targets? Let us know below! 👇
#CryptoNews #BinanceSquare #ETH #SOL #AltcoinMarket #CryptoNewss #Binance
2
2
263

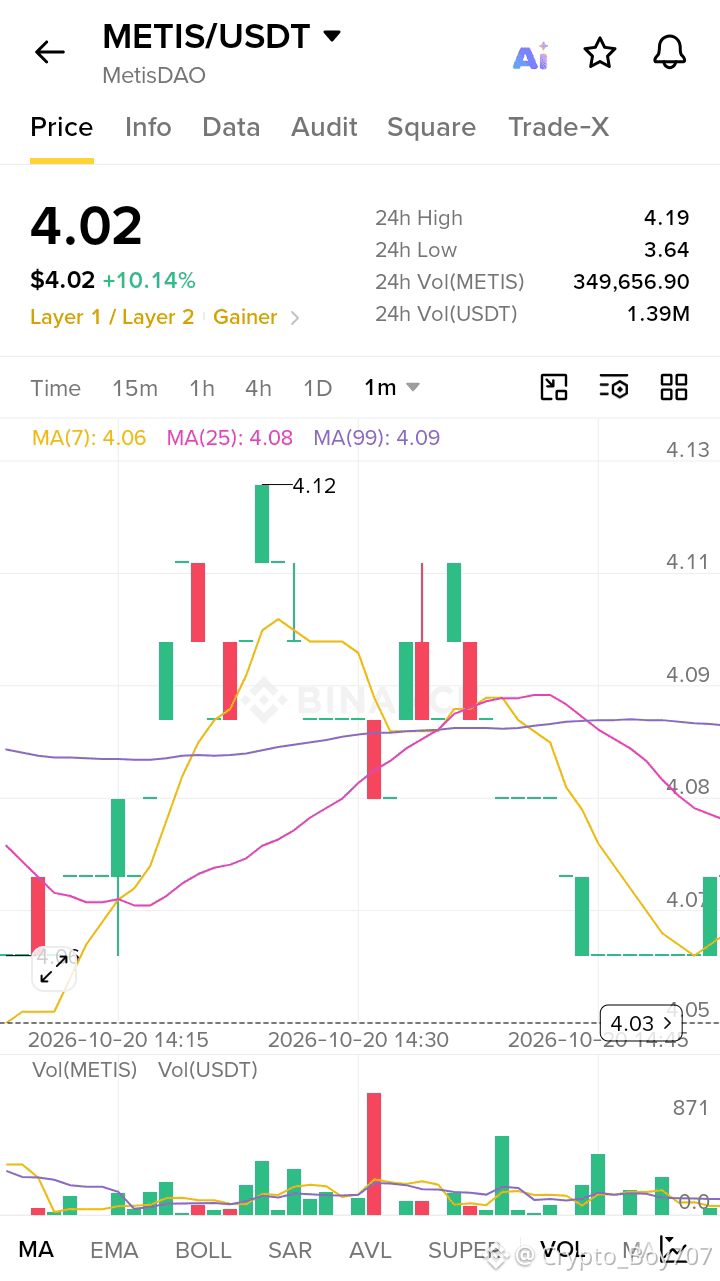
$METIS has gained 10.35%, bringing its price to $4.05. This positive movement puts MetisDAO among the coins attracting attention today. Traders may watch for continued buying pressure and key resistance levels while remembering that crypto prices can change quickly.
$METIS
{spot}(METISUSDT)
#writetoearn #METIS #MetisDAO #AltcoinMarket
$METIS has gained 10.35%, bringing its price to $4.05. This positive movement puts MetisDAO among the coins attracting attention today. Traders may watch for continued buying pressure and key resistance levels while remembering that crypto prices can change quickly.
$METIS
#writetoearn #METIS #MetisDAO #AltcoinMarket
$METIS
#writetoearn #METIS #MetisDAO #AltcoinMarket
1
125

·
--
Bearish
$AGT Drops 29.29%: Extreme Volatility Alert
$AGT is trading at $0.06302, down 29.29%, with a displayed market cap of $79.60M.
This is the sharpest decline among the coins shown. Traders should avoid assuming an immediate rebound. Watch for price stabilization, trading volume, and signs that selling pressure is easing.
Capital protection comes first.
#AGT #CryptoRisk #AltcoinMarket #TradingAnalysis $AGT
{alpha}(560x5dbde81fce337ff4bcaaee4ca3466c00aecae274)
$AGT Drops 29.29%: Extreme Volatility Alert
$AGT is trading at $0.06302, down 29.29%, with a displayed market cap of $79.60M.
This is the sharpest decline among the coins shown. Traders should avoid assuming an immediate rebound. Watch for price stabilization, trading volume, and signs that selling pressure is easing.
Capital protection comes first.
#AGT #CryptoRisk #AltcoinMarket #TradingAnalysis $AGT
$AGT is trading at $0.06302, down 29.29%, with a displayed market cap of $79.60M.
This is the sharpest decline among the coins shown. Traders should avoid assuming an immediate rebound. Watch for price stabilization, trading volume, and signs that selling pressure is easing.
Capital protection comes first.
#AGT #CryptoRisk #AltcoinMarket #TradingAnalysis $AGT
366
·
--
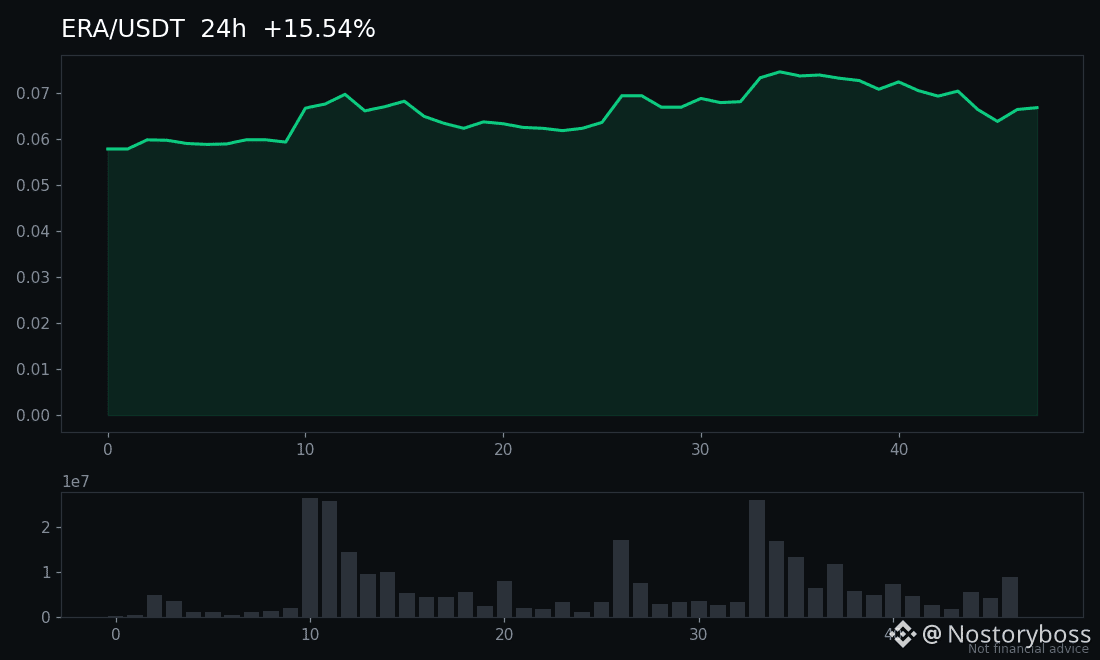
$ERA is up 6.4% over 24 hours, trading near $0.0669 on about $12.1M in volume. The notable part is that the move came with heavy turnover rather than a thin-book spike, which suggests broader participation, though volume alone doesn't confirm direction. Traders are now watching whether $ERA can hold its recent intraday base and whether volume keeps pace if price tests the next resistance zone. A fade on declining volume would be the first warning sign, while steady buying on a clean hold could keep momentum traders engaged. Set your levels before you chase. #Crypto #BinanceSquare #AltcoinMarket
Not financial advice.
$ERA is up 6.4% over 24 hours, trading near $0.0669 on about $12.1M in volume. The notable part is that the move came with heavy turnover rather than a thin-book spike, which suggests broader participation, though volume alone doesn't confirm direction. Traders are now watching whether $ERA can hold its recent intraday base and whether volume keeps pace if price tests the next resistance zone. A fade on declining volume would be the first warning sign, while steady buying on a clean hold could keep momentum traders engaged. Set your levels before you chase. #Crypto #BinanceSquare #AltcoinMarket
Not financial advice.
Not financial advice.
3

·
--
Bullish
Verified
#celestiarises16%to2026high
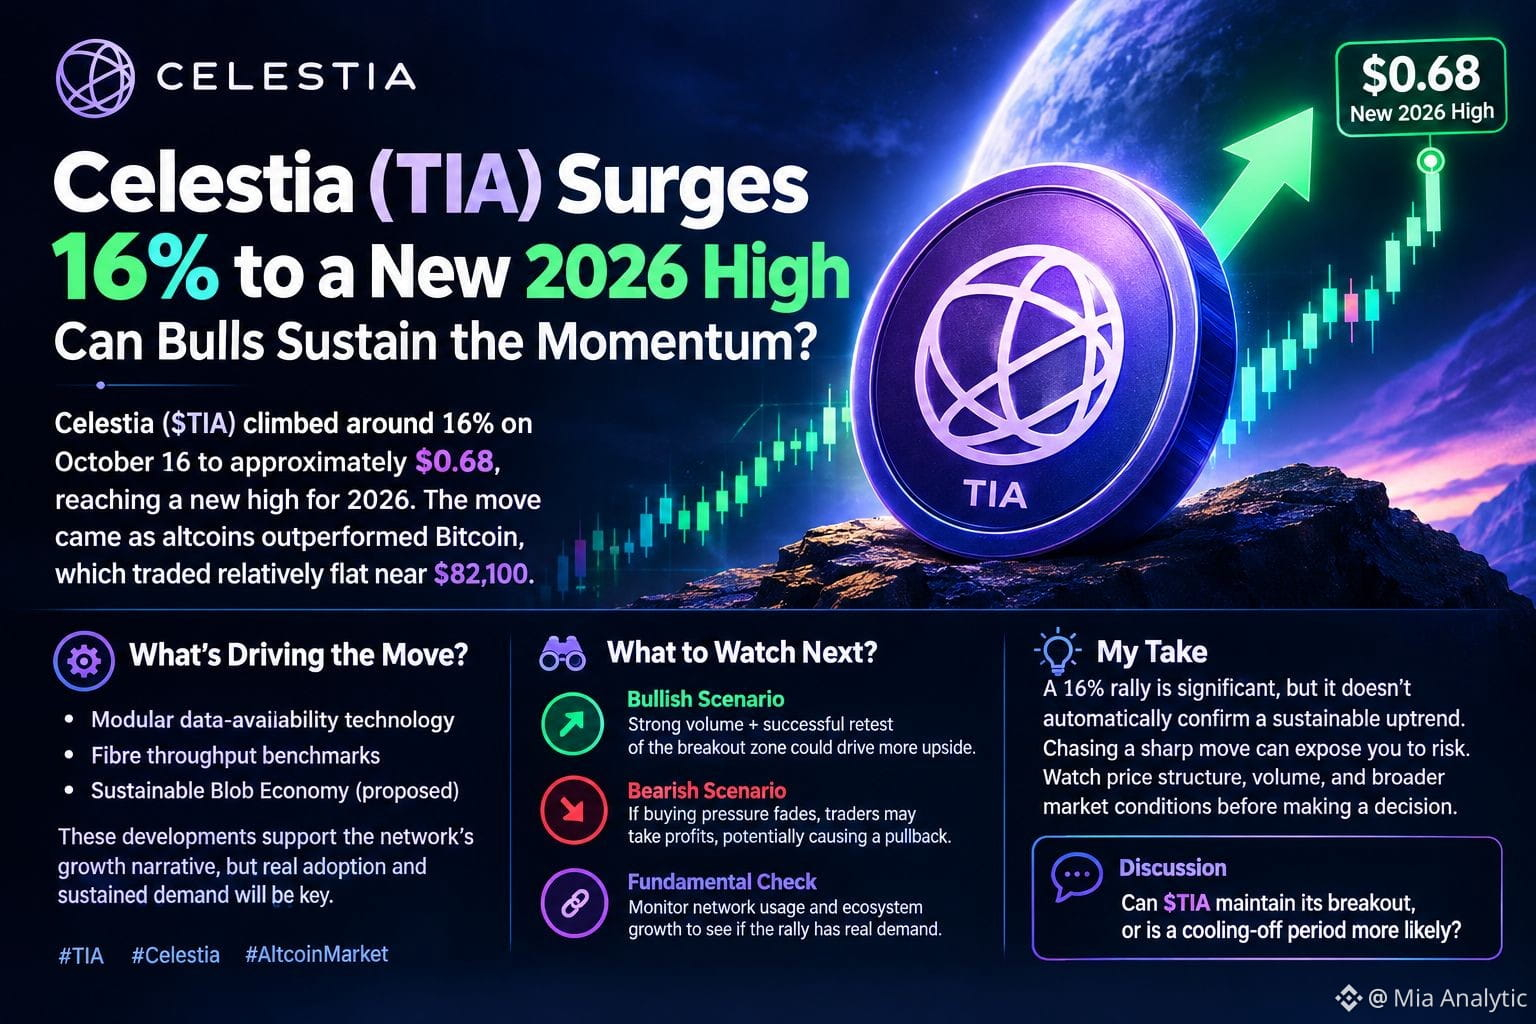
🚀 Celestia (TIA) Rallies 16% — Can Bulls Keep the Breakout Alive?
📈 Celestia is gaining serious market attention.
On October 16, $TIA surged approximately 16% to around $0.68, reaching a new 2026 high at the time. The rally came as altcoins outperformed Bitcoin, which remained relatively flat near $82,100.
But the key question is whether this move signals sustained demand or a short-term burst of speculative buying.
🔍 What’s Behind the Rally?
Celestia’s modular data-availability technology remains central to its long-term growth story. Developments surrounding Fibre throughput benchmarks and the proposed Sustainable Blob Economy are also attracting attention.
However, technological progress alone does not guarantee price appreciation. Real network adoption, ecosystem expansion, and sustained demand will be crucial to validating the bullish narrative.
📊 Three Signals Traders Should Watch
🟢 Bullish Scenario: Strong volume and a successful retest of the breakout zone could support further upside if buyers remain in control.
🔴 Bearish Scenario: Weakening momentum could trigger profit-taking, potentially pushing TIA back toward its previous trading range.
⚡ Fundamental Confirmation: Rising network activity and ecosystem growth would provide stronger evidence that the rally has support beyond speculation.
🎯 My Trading Perspective
A 16% rally is significant, but it is not automatic confirmation of a lasting uptrend. After a sharp move, chasing price can expose traders to sudden reversals.
The smarter approach is to monitor volume, price structure, breakout confirmation, and broader altcoin sentiment before considering an entry. Protecting capital matters just as much as identifying opportunities.
💬 Your Take: Can $TIA extend its rally, or should traders expect a correction before the next move?
#tia #celestia #AltcoinMarket
$AGT $EPIC $ICNT
{future}(AGTUSDT)
{future}(EPICUSDT)
{future}(ICNTUSDT)
#celestiarises16%to2026high
🚀 Celestia (TIA) Rallies 16% — Can Bulls Keep the Breakout Alive?
📈 Celestia is gaining serious market attention.
On October 16, $TIA surged approximately 16% to around $0.68, reaching a new 2026 high at the time. The rally came as altcoins outperformed Bitcoin, which remained relatively flat near $82,100.
But the key question is whether this move signals sustained demand or a short-term burst of speculative buying.
🔍 What’s Behind the Rally?
Celestia’s modular data-availability technology remains central to its long-term growth story. Developments surrounding Fibre throughput benchmarks and the proposed Sustainable Blob Economy are also attracting attention.
However, technological progress alone does not guarantee price appreciation. Real network adoption, ecosystem expansion, and sustained demand will be crucial to validating the bullish narrative.
📊 Three Signals Traders Should Watch
🟢 Bullish Scenario: Strong volume and a successful retest of the breakout zone could support further upside if buyers remain in control.
🔴 Bearish Scenario: Weakening momentum could trigger profit-taking, potentially pushing TIA back toward its previous trading range.
⚡ Fundamental Confirmation: Rising network activity and ecosystem growth would provide stronger evidence that the rally has support beyond speculation.
🎯 My Trading Perspective
A 16% rally is significant, but it is not automatic confirmation of a lasting uptrend. After a sharp move, chasing price can expose traders to sudden reversals.
The smarter approach is to monitor volume, price structure, breakout confirmation, and broader altcoin sentiment before considering an entry. Protecting capital matters just as much as identifying opportunities.
💬 Your Take: Can $TIA extend its rally, or should traders expect a correction before the next move?
#tia #celestia #AltcoinMarket
$AGT $EPIC $ICNT
🚀 Celestia (TIA) Rallies 16% — Can Bulls Keep the Breakout Alive?
📈 Celestia is gaining serious market attention.
On October 16, $TIA surged approximately 16% to around $0.68, reaching a new 2026 high at the time. The rally came as altcoins outperformed Bitcoin, which remained relatively flat near $82,100.
But the key question is whether this move signals sustained demand or a short-term burst of speculative buying.
🔍 What’s Behind the Rally?
Celestia’s modular data-availability technology remains central to its long-term growth story. Developments surrounding Fibre throughput benchmarks and the proposed Sustainable Blob Economy are also attracting attention.
However, technological progress alone does not guarantee price appreciation. Real network adoption, ecosystem expansion, and sustained demand will be crucial to validating the bullish narrative.
📊 Three Signals Traders Should Watch
🟢 Bullish Scenario: Strong volume and a successful retest of the breakout zone could support further upside if buyers remain in control.
🔴 Bearish Scenario: Weakening momentum could trigger profit-taking, potentially pushing TIA back toward its previous trading range.
⚡ Fundamental Confirmation: Rising network activity and ecosystem growth would provide stronger evidence that the rally has support beyond speculation.
🎯 My Trading Perspective
A 16% rally is significant, but it is not automatic confirmation of a lasting uptrend. After a sharp move, chasing price can expose traders to sudden reversals.
The smarter approach is to monitor volume, price structure, breakout confirmation, and broader altcoin sentiment before considering an entry. Protecting capital matters just as much as identifying opportunities.
💬 Your Take: Can $TIA extend its rally, or should traders expect a correction before the next move?
#tia #celestia #AltcoinMarket
$AGT $EPIC $ICNT
728

Daily Volume for $SHELL rose sharply during the 16/10 session.
Reference point: the 16/10/2026 daily candle on Binance USDⓈ-M Futures, using the UTC trading day.
The 16/10 daily candle recorded a volume of approximately 162.76 million SHELL, significantly higher than the approximately 62.69 million SHELL recorded by the 15/10 daily candle in the same Futures data.
The 16/10 daily candle closed at 0.02288 USDT, above its opening price of 0.02179 USDT. The rise in volume coincided with a positive-closing candle, but is not enough to confirm a longer-term uptrend.
The following candles should be monitored to assess how sustained trading activity is.
#DailyVolume #VolumeAnalysis #AltcoinMarket
Daily Volume for $SHELL rose sharply during the 16/10 session.
Reference point: the 16/10/2026 daily candle on Binance USDⓈ-M Futures, using the UTC trading day.
The 16/10 daily candle recorded a volume of approximately 162.76 million SHELL, significantly higher than the approximately 62.69 million SHELL recorded by the 15/10 daily candle in the same Futures data.
The 16/10 daily candle closed at 0.02288 USDT, above its opening price of 0.02179 USDT. The rise in volume coincided with a positive-closing candle, but is not enough to confirm a longer-term uptrend.
The following candles should be monitored to assess how sustained trading activity is.
#DailyVolume #VolumeAnalysis #AltcoinMarket
Reference point: the 16/10/2026 daily candle on Binance USDⓈ-M Futures, using the UTC trading day.
The 16/10 daily candle recorded a volume of approximately 162.76 million SHELL, significantly higher than the approximately 62.69 million SHELL recorded by the 15/10 daily candle in the same Futures data.
The 16/10 daily candle closed at 0.02288 USDT, above its opening price of 0.02179 USDT. The rise in volume coincided with a positive-closing candle, but is not enough to confirm a longer-term uptrend.
The following candles should be monitored to assess how sustained trading activity is.
#DailyVolume #VolumeAnalysis #AltcoinMarket
18

$ZEC has climbed to market cap rank 10, trading at 1228.78 USDT with a robust 24h momentum of 12.19 percent. Price action moved within a 24h range between 1077.27 USDT and 1251.93 USDT, backed by heavy market activity and a 24h trading volume of 1297378797 USDT alongside a total market cap of 20874763692 USDT.
Analysing the current structure, support is forming near the lower boundary of the daily range, while resistance is tested close to the high. Volume confirmation remains essential to determine if buyers can sustain acceptance above 1200 USDT. Risk management parameters should account for potential volatility near resistance boundaries, where rejection could trigger a retest of lower liquidity zones.
#Zcash #ZECAnalysis #PrivacyCoins #AltcoinMarket
$ZEC has climbed to market cap rank 10, trading at 1228.78 USDT with a robust 24h momentum of 12.19 percent. Price action moved within a 24h range between 1077.27 USDT and 1251.93 USDT, backed by heavy market activity and a 24h trading volume of 1297378797 USDT alongside a total market cap of 20874763692 USDT.
Analysing the current structure, support is forming near the lower boundary of the daily range, while resistance is tested close to the high. Volume confirmation remains essential to determine if buyers can sustain acceptance above 1200 USDT. Risk management parameters should account for potential volatility near resistance boundaries, where rejection could trigger a retest of lower liquidity zones.
#Zcash #ZECAnalysis #PrivacyCoins #AltcoinMarket
Analysing the current structure, support is forming near the lower boundary of the daily range, while resistance is tested close to the high. Volume confirmation remains essential to determine if buyers can sustain acceptance above 1200 USDT. Risk management parameters should account for potential volatility near resistance boundaries, where rejection could trigger a retest of lower liquidity zones.
#Zcash #ZECAnalysis #PrivacyCoins #AltcoinMarket
141

·
--
Today's market is split down the middle with extreme divergence at both ends. 📊
BLUR crashed -36.81% to $0.01157 on $11.0M volume, leading losers alongside W (-30.28%) and RSR (-17.61%). Meanwhile, BAT climbed +19.65% to $0.1796 on $12.2M volume, with S (+18.03%) and OSMO (+11.96%) rounding out the gainers. Bitcoin holds steady at $83,280 (+0.37%) with $1.26B volume, while Ethereum dipped -1.52% to $2,503 on $755M volume.
Which scenario best explains today's extreme divergence: BLUR -37% while BAT surges +20%?
1. NFT sector rotation out into utility tokens
2. Isolated project-specific news on BLUR
3. Broader risk-off move hitting speculative plays
4. Market maker activity & low liquidity swings
Drop your take in the comments and join the discussion in the Cyclo Telegram community! 🗳️
#CryptoPolls #BLUR #AltcoinMarket #MarketDivergence
Today's market is split down the middle with extreme divergence at both ends. 📊
BLUR crashed -36.81% to $0.01157 on $11.0M volume, leading losers alongside W (-30.28%) and RSR (-17.61%). Meanwhile, BAT climbed +19.65% to $0.1796 on $12.2M volume, with S (+18.03%) and OSMO (+11.96%) rounding out the gainers. Bitcoin holds steady at $83,280 (+0.37%) with $1.26B volume, while Ethereum dipped -1.52% to $2,503 on $755M volume.
Which scenario best explains today's extreme divergence: BLUR -37% while BAT surges +20%?
1. NFT sector rotation out into utility tokens
2. Isolated project-specific news on BLUR
3. Broader risk-off move hitting speculative plays
4. Market maker activity & low liquidity swings
Drop your take in the comments and join the discussion in the Cyclo Telegram community! 🗳️
#CryptoPolls #BLUR #AltcoinMarket #MarketDivergence
BLUR crashed -36.81% to $0.01157 on $11.0M volume, leading losers alongside W (-30.28%) and RSR (-17.61%). Meanwhile, BAT climbed +19.65% to $0.1796 on $12.2M volume, with S (+18.03%) and OSMO (+11.96%) rounding out the gainers. Bitcoin holds steady at $83,280 (+0.37%) with $1.26B volume, while Ethereum dipped -1.52% to $2,503 on $755M volume.
Which scenario best explains today's extreme divergence: BLUR -37% while BAT surges +20%?
1. NFT sector rotation out into utility tokens
2. Isolated project-specific news on BLUR
3. Broader risk-off move hitting speculative plays
4. Market maker activity & low liquidity swings
Drop your take in the comments and join the discussion in the Cyclo Telegram community! 🗳️
#CryptoPolls #BLUR #AltcoinMarket #MarketDivergence
9

·
--
Noticed a peculiar calm on the $NEAR chart, where it's been trading within a relatively narrow consolidation range. One twist that caught my attention is that it's currently sitting near the higher end of this range. With its 24-hour change being a notable aspect, it's essential to recognize that this position within the range could be a crucial indicator of what's to come. What are you watching on $NEAR right now?
Current read: $NEAR, spot tape.
#near
#cryptomarketanalysis
#tradinginsights
#altcoinmarket
Noticed a peculiar calm on the $NEAR chart, where it's been trading within a relatively narrow consolidation range. One twist that caught my attention is that it's currently sitting near the higher end of this range. With its 24-hour change being a notable aspect, it's essential to recognize that this position within the range could be a crucial indicator of what's to come. What are you watching on $NEAR right now?
Current read: $NEAR , spot tape.
#near
#cryptomarketanalysis
#tradinginsights
#altcoinmarket
Current read: $NEAR , spot tape.
#near
#cryptomarketanalysis
#tradinginsights
#altcoinmarket
47

·
--
$AGT momentum is gaining traction
Entry: 1.23 🔥
Target: 1.56 🚀
Stop Loss: 1.05 ⚠️
The current market environment is characterized by strong capital rotation into low and mid-cap tokens, with momentum-driven rallies dominating intraday action.
Not financial advice. Manage your risk.
#AGT #LongSetup #AltcoinMarket
💎
$AGT momentum is gaining traction
Entry: 1.23 🔥
Target: 1.56 🚀
Stop Loss: 1.05 ⚠️
The current market environment is characterized by strong capital rotation into low and mid-cap tokens, with momentum-driven rallies dominating intraday action.
Not financial advice. Manage your risk.
#AGT #LongSetup #AltcoinMarket
💎
Entry: 1.23 🔥
Target: 1.56 🚀
Stop Loss: 1.05 ⚠️
The current market environment is characterized by strong capital rotation into low and mid-cap tokens, with momentum-driven rallies dominating intraday action.
Not financial advice. Manage your risk.
#AGT #LongSetup #AltcoinMarket
💎
257

·
--
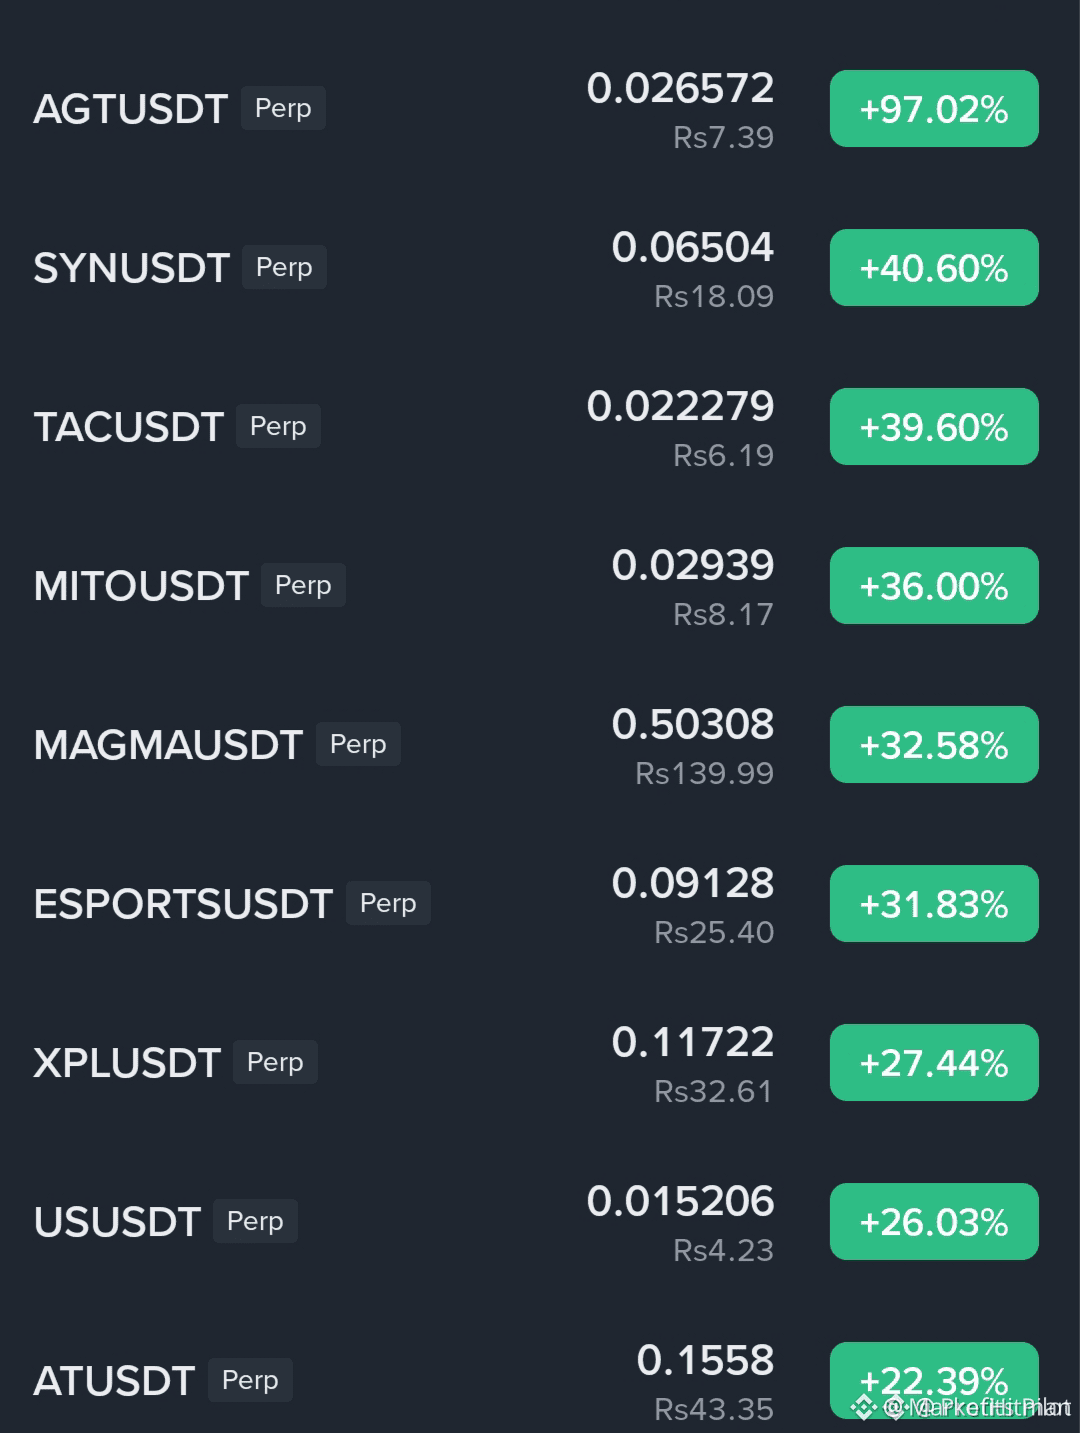
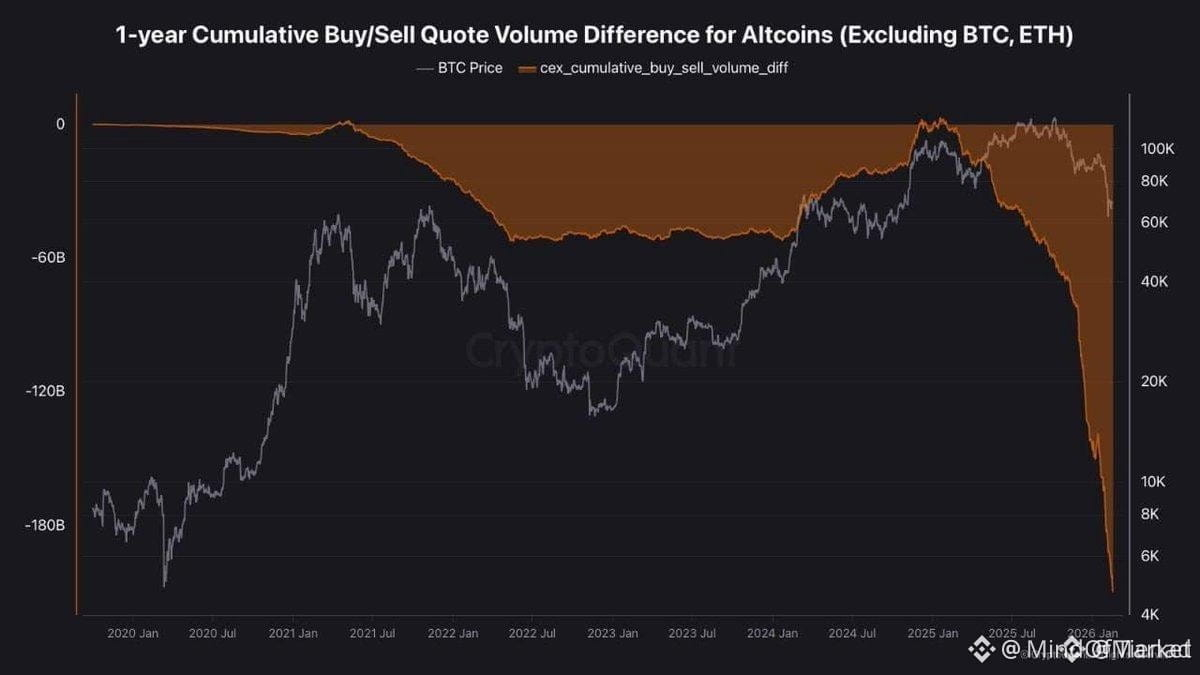
Altcoin selling pressure reaches 5-year high with $209 billion in net selling on top-tier exchanges, sparking debate about a potential market crash, with $XPL , $MITO , and $AGT in focus ⚡
Entry: 0.065 🔻
Target: 0.085 🚀
Stop Loss: 0.055 ⚠️
The market is clearly divided on the implications of this prolonged selling pressure, with some seeing it as a sign of further decline and others as a buying opportunity. This divergence in opinion reflects the complexity of the current market environment.
Not financial advice. Manage your risk.
#AltcoinMarket #XPL #LongSetup
🔥
Altcoin selling pressure reaches 5-year high with $209 billion in net selling on top-tier exchanges, sparking debate about a potential market crash, with $XPL , $MITO , and $AGT in focus ⚡
Entry: 0.065 🔻
Target: 0.085 🚀
Stop Loss: 0.055 ⚠️
The market is clearly divided on the implications of this prolonged selling pressure, with some seeing it as a sign of further decline and others as a buying opportunity. This divergence in opinion reflects the complexity of the current market environment.
Not financial advice. Manage your risk.
#AltcoinMarket #XPL #LongSetup
🔥
Entry: 0.065 🔻
Target: 0.085 🚀
Stop Loss: 0.055 ⚠️
The market is clearly divided on the implications of this prolonged selling pressure, with some seeing it as a sign of further decline and others as a buying opportunity. This divergence in opinion reflects the complexity of the current market environment.
Not financial advice. Manage your risk.
#AltcoinMarket #XPL #LongSetup
🔥
180

The fact that $NEAR is hovering near a crucial level within its current range is sparking intrigue among traders, as this position often precedes significant price movements. With its 24-hour change and volume metrics indicating a period of consolidation, the spotlight is on whether $NEAR will break out of this range or continue to oscillate within it. A key aspect to consider is the current position within the 24-hour range, which suggests a potential buildup of momentum or a pause before the next move.
Traders should be monitoring the levels that $NEAR is currently interacting with, as a successful breakout or a rejection from these levels could significantly influence the short-term trajectory. The interplay between the current range and the 24-hour metrics is crucial, as it may hint at underlying strength or weakness. What are you watching on $NEAR right now?
Watching $NEAR vs this range.
Price alerts on NEAR/USDT beat guessing the tape.
#near
#cryptotrading
#blockchainanalysis
#altcoinmarket
The fact that $NEAR is hovering near a crucial level within its current range is sparking intrigue among traders, as this position often precedes significant price movements. With its 24-hour change and volume metrics indicating a period of consolidation, the spotlight is on whether $NEAR will break out of this range or continue to oscillate within it. A key aspect to consider is the current position within the 24-hour range, which suggests a potential buildup of momentum or a pause before the next move.
Traders should be monitoring the levels that $NEAR is currently interacting with, as a successful breakout or a rejection from these levels could significantly influence the short-term trajectory. The interplay between the current range and the 24-hour metrics is crucial, as it may hint at underlying strength or weakness. What are you watching on $NEAR right now?
Watching $NEAR vs this range.
Price alerts on NEAR/USDT beat guessing the tape.
#near
#cryptotrading
#blockchainanalysis
#altcoinmarket
Traders should be monitoring the levels that $NEAR is currently interacting with, as a successful breakout or a rejection from these levels could significantly influence the short-term trajectory. The interplay between the current range and the 24-hour metrics is crucial, as it may hint at underlying strength or weakness. What are you watching on $NEAR right now?
Watching $NEAR vs this range.
Price alerts on NEAR/USDT beat guessing the tape.
#near
#cryptotrading
#blockchainanalysis
#altcoinmarket
20
Log in to explore more content
Join global crypto users on Binance Square
⚡️ Get latest and useful information about crypto.
💬 Trusted by the world’s largest crypto exchange.
👍 Discover real insights from verified creators.
Email / Phone number
Trending Topics
1
#KeplrAdvisesSocialLoginUsersToTransferAssets
1,381 views
75 Discussing
2
#TetherPlans€28.8MForJuventusCapitalIncrease
1,262 views
67 Discussing
3
#JobsReportRaisesHikeOdds
637,308 views
3,922 Discussing
4
#CPITestsDecemberRateOutlook
218,007 views
1,518 Discussing
5
#US Data Center Rules May Constrain AI Expansion
90,264 views
247 Discussing
6
#ARKPlans14ThematicETFsCoveringAIAndTokenizedMarkets
5,673 views
81 Discussing
7
#WillAnthropicListOnTime
203,111 views
1,659 Discussing
8
#WillUS-IranTensionsBoostSafe-HavenDemand?
106,760 views
724 Discussing
9
#BitcoinETFsSee$412MNetOutflows
19,680 views
85 Discussing
10
#HKSFCPlansToRestrictCryptoAndExchangeTerms
84,950 views
695 Discussing